capital structure and taxes: what happens when you (also
TRANSCRIPT

Capital Structure and Taxes:
What Happens When You (Also) Subsidize Equity?
Frédéric Panier, Francisco Pérez-González, and Pablo Villanueva*
December 2015
Abstract. This paper shows that capital structure significantly responds to changing tax incentives. To identify the effect of taxes, we exploit the introduction of a novel tax provision (the notional interest deduction, or NID) as an arguably exogenous source of variation to the cost of using equity financing. The NID, introduced in Belgium in 2006, drastically reduces the tax-driven distortions that favor the use of debt financing by allowing firms to deduct from their taxable income a notional interest charge that is a function of equity. Our main findings are four. First, the NID led to a significant increase in the share of equity in the capital structure. Second, both incumbent and new firms increase their equity ratios after the introduction of the NID. Third, the largest responses to these changing tax incentives are found among large and new firms. Fourth, the increase in equity ratios is explained by higher equity levels and not by a reduction in other liabilities. The results are robust to using data from neighboring countries as a control group, as well as relying on a battery of tests aimed at isolating the effect of other potential confounding variables. Overall, the evidence demonstrates that tax policies designed to encourage the use of equity financing are likely to lead to more capitalized firms.
JEL classification: G30, G32, H20, H25
Keywords: capital structure, corporate income taxes, notional interest deduction, debt policy, leverage, tax policy and corporate finance
* Corresponding author: Pérez-González ([email protected]). Panier (McKinsey & Co); Pérez-González (Instituto Tecnológico Autónomo de México, ITAM, México); Villanueva (TPG Opportunities Partners). We thank Gennaro Bernile, Peter DeMarzo, Mike Devereux, Florian Heider, Caroline Hoxby, Dirk Jenter, Gustavo Manso, Josh Rauh, Florian Scheuer, Jose Tessada, Margarita Tsoutsoura, Daniel Wolfenzon, Jeff Zweibel, and participants at Banco de México, Berkeley, Columbia, Duke-UNC, ITAM, LSE, NBER (corporate), Oxford, Rice, Stanford (economics Ph.D. and GSB finance workshops), and Universidad Católica for comments. We thank the Central Bank of Belgium for providing us with data. All errors are our own.

1
Do changing tax rates affect capital structure decisions? In the absence of the traditional
tax rules that favor debt financing, what would be the observed leverage ratios of firms? If firms
respond to time-varying tax incentives, which firms and financial policies would be most sensitive
to these changes? While the answers to these questions are central to corporate finance research,
to this date, we know surprisingly little about them.
Following Modigliani and Miller (1958, 1963), optimal financing decisions maximize the
after-tax value of the firms’ total cash-flows. While there is near-universal agreement that taxes
must be relevant for corporate financing decisions, to this date, the empirical evidence linking
changes in corporate income tax rates and capital structure has been weak at best.1 This issue is
not new. In 1984, Myers wrote: “I know of no study clearly demonstrating that a firm’s tax status
has predictable, material effects on its debt policy.” Moreover, the empirical relevance of taxes for
financing decisions has been the subject of a renewed and heated debate in light of the recent
financial crisis and the high levels of leverage used by many firms. Yet, to this date, “there is no
known study that documents tax-related time series effects in debt usage” (Graham, 2008).
To investigate the effect of taxes on capital structure, we exploit the introduction of the
notional interest deduction (NID) in Belgium as an arguably exogenous source of variation to the
cost of using equity financing. The NID is an explicit equity deduction introduced in 2006 with
the objective of reducing the tax-driven distortions that favor the use of debt financing. The NID
allows firms to deduct from their taxable income a notional charge equal to the product of the book
value of equity times a benchmark interest rate based on historical long-term government bonds.
As a result, and in sharp contrast to traditional tax incentives, firms’ marginal financing decisions
are provided with a significant tax deduction regardless of their source of financing.
Using data from the National Bank of Belgium (NBB), we show that the introduction of
the NID was correlated with a significant increase in the share of equity used by Belgian firms.
We document that the aggregate value of equity, relative to the total value of non-equity liabilities
increased, and that both the mean and median share of equity to assets at the firm level increased
after the introduction of the notional interest deduction.
1 For a mainstream exposition of the effect of corporate income taxes on capital structure, see Berk and DeMarzo (2010). See Graham (2008) for an excellent survey on the impact of taxes on corporate finance.

2
To further identify the effect of the NID on capital structure, we use firm-level data from
Belgium’s neighboring countries as a credible counterfactual. Firms in France, Germany,
Luxembourg, and the Netherlands are geographically close, economically integrated, and share
the same currency as Belgian firms. As such, they are likely to be exposed to common industry
and aggregate shocks. Yet, these countries did not introduce equity deductions, such as the NID,
or major tax reforms right around 2006. We obtain firm data from these control countries from
Bureau Van Dijk (BvD)’s AMADEUS database and verify that during the sample period,
aggregate trends in gross domestic product and in total sales for the sample firms, are remarkably
comparable between Belgian and control firms.
Using this empirical strategy, our main findings are five:
First, the introduction of an equity-based interest deduction led to higher capitalization
rates in Belgium. We document large increases in equity ratios within two years after the reform
was enacted. Moreover, we rule out the effect of other confounding variables using a battery of
tests. Controlling for firm, industry, and country characteristics does not affect the findings.
Similarly, explicit controls for other tax reforms during the sample period, as well as time-varying
industry effects, do not affect the results. We show that limiting the analysis to control firms
located within 100 kilometers of the Belgian border, or to those sharing a common language, leaves
the results unchanged. Also, using a subsample of matched firms based on pre-reform observable
characteristics (Heckman, Ichimura and Todd, 1997), we replicate the results. We also show that
using data from all firms in AMADEUS as an alternative control group or performing aggregate
analysis at the industry level, does not affect the findings. To bolster the causal interpretation of
the results, we show that Belgian and control firms exhibit comparable leverage ratios before the
reform. Yet, after the NID was approved, the Belgian equity ratios are substantially larger, which
cast doubt on the idea that the NID effects are likely to be spurious. Lastly, we show that the results
are robust to clustering the standard errors at the country level, the key source of variation in the
analysis (Bertrand, Duflo, and Mullainathan, 2003).
Second, both incumbent and new Belgian firms significantly increased their equity ratios
after the reform. Using fixed effects specifications, we show that incumbent firms rebalance their
capital structure as the cost of equity financing declines after 2006. Similarly, we show that new
firms entering Belgium after 2006 rely more heavily on equity relative to firms incorporated prior
to the introduction of the NID, or to new firms in the control countries.

3
Third, the largest responses to these changing tax incentives are found among large and
new firms. This evidence is consistent with the idea that small firms may face significant
refinancing costs, or that they may not rebalance their capital structure until they deviate
substantially from their long-term target (Leary and Roberts, 2005; Strebulaev, 2007). In fact, in
several specifications, the post-2006 leverage behavior of small firms is indistinguishable from the
capital structure decisions of the control firms.
Fourth, the increase in equity ratios of Belgian firms is explained by an economically large
and statistically significant increase in the levels of equity, and is not driven by a reduction in the
value of non-equity liabilities. Moreover, we show that the higher values of equity cannot be
exclusively explained by higher profits that resulted from the NID or by increased retention.
Higher equity ratios are partially explained by active equity issuance decisions.
Lastly, we show that the effects of the NID on capital structure are important for large
standalone firms and not only for subsidiaries of multinationals (MNCs). To document these
effects, we rely on both direct and indirect measures of MNCs or group affiliation and confirm our
results on the subsample of standalone firms; we also show the robustness of the results to
restricting the analysis to firms with negligible financial income, a key potential tool to minimize
taxes inside business groups. In other words, while group firms are uniquely situated to benefit
from the NID, and are indeed shown to benefit from it, they do not solely explain our findings.
Overall, the evidence demonstrates that tax policies designed to encourage the use of equity
financing are likely to lead to more capitalized firms. Relative to the existing literature, our analysis
is unique for at least four reasons:
First, it reflects the consequences of introducing a novel tax tool explicitly aimed at
reducing the debt bias of corporate taxation. Most existing evidence relies on changes in corporate
tax rates whose effects on the relative tax treatment of debt and equity are arguably less salient for
economic agents, relative to a direct equity deduction. As a result, an important contribution of the
paper is to provide striking evidence that a direct equity subsidy, analogous to the widespread debt
subsidy in traditional tax systems, significantly affects leverage decisions. Such evidence is
potentially informative for prospective tax reforms that consider alternative policies to achieve tax
neutrality towards debt and equity.2
2 The President’s Framework for Business Tax Reform (U.S. Department of the Treasury 2012) includes as one of its stated goals “reducing the bias toward debt financing.” (p. 10). Available at: http://www.treasury.gov/resource-center/tax-policy/Documents/The-Presidents-Framework-for-Business-Tax-Reform-02-22-2012.pdf.

4
Second, the NID tax reform alleviates concerns that changing macroeconomic or fiscal
conditions affect the estimates of the impact of taxes on capital structure. The introduction of the
NID followed an independent ruling by the European Union directed to ending an advantageous
tax regime favoring the treasury centers of multinational corporations in Belgium;3 it was not
enacted to address changing macroeconomic conditions or a domestic fiscal challenge, a common
feature of the majority of tax reforms. By examining the impact of a tax reform whose timing was
triggered by non-domestic fiscal forces, we present arguably cleaner variation on the effect of taxes
on capital structure.
Third, the magnitude in the time-series variation in the tax treatment of equity relative to
debt is significantly larger, and arguably cleaner from the tax perspective, than previously analyzed
tax reforms. An important empirical challenge is finding settings where the relative tax advantage
of debt changes substantially while other tax margins are left unaffected. Unfortunately, most
significant tax reforms also affect the corporate tax base, introducing biases in the estimated
coefficients (Kawano and Slemrod, 2012). Alternatively, relatively minor tax reforms may not
trigger large financing responses, even when these effects are important in practice. Given that the
NID drastically changes the tax financing incentives, and its introduction did not coincide with
significant variation in other tax provisions, the tax reform that we analyze overcomes these
challenges.
Fourth, we provide the first estimates to date of the impact of a major tax reform on the
financing decisions of a sample of firms that is representative of an entire economy. Previous
studies have mostly concentrated in analyzing the effect of taxes on the financing decisions of
publicly traded firms. To the extent that taxes have heterogeneous effects on firms, as we show in
this paper, extending the analysis to the broader set of firms, allows us to sharpen our
understanding of the impact of taxes on capital structure decisions.
The rest of the paper is organized as follows. Section I describes the NID program and
places both the reform and the paper in the context of the existing literature. Sections II and III
introduce the empirical strategy and describe the data, respectively. Section IV presents the results
linking the NID to higher capitalization ratios. Section V concludes.
3 European Commission ruling on the special tax schemes in Belgium, the Netherlands, and Ireland, February 18, 2003.

5
I. The Notional Interest Deduction Reform
A. What Triggered the Introduction of the NID?
In 1982, Belgium introduced an advantageous tax legislation designed to attract the
investment of multinationals. The so-called “coordination centers” (CCs) regime sought to attract
subsidiaries whose purpose was to provide financial, accounting, and administrative services to
their parent companies. The taxable income of these CCs was based on a fixed percent (4% to
10%) of expenses less financial and salary costs; it was not based on profits. As such, profitable
treasury centers with minor cost structures faced low effective tax rates. CCs also received
preferential dividend and interest income taxation. Not surprisingly, CCs became popular tax
destinations for a significant number of multinational firms (Meyers and Verhaeghe, 1991).
In 2003, however, the European Commission (EC) ruled that coordination centers were
contrary to the European Union’s rules on state aid. CCs provided favorable tax advantages to
multinationals that were not available to all Belgian firms. As a direct consequence of this ruling,
no new CCs were permitted and existing CCs were progressively phased out.4 The end of this
advantageous tax regime implied the potential loss of these treasury centers, creating the political
space for a potential tax reform.
Facing this potential threat, the tax authorities and the business community, designed a
notional interest deduction plan aimed at eliminating financing distortions.
B. The Notional Interest Deduction in Practice
The NID allows firms to deduct from their taxable profit, a notional charge equal to the
product of the firms’ equity times the average rate on 10-year government bonds.5 Hence, the
reform implies that firms whose rate of return on equity is below or equal to the NID rate face a
zero corporate tax rate, while those with higher rates of return are taxed only on the excess return
relative to the NID rate.
All firms incorporated in Belgium other than previously recognized coordination centers
are eligible to use this notional deduction.6
4 Following several legal disputes, coordination centers were allowed to continue their activity until 2010. 5 For example, if the 10-year government bond was 4%, a firm with €100,000 in equity would receive a €4,000 reduction in taxable income. See http://www.presscenter.org/fr/pressrelease/20041223/conseil-des-ministres-du-23-d%C3%A9cembre-2004-0, for the press release of the NID reform, and http://minfin.fgov.be for a current description of the program. 6 Multinational firms, however, are not prohibited from creating new subsidiaries to benefit from the NID program.

6
The NID became effective in 2006. Since then, its basic features have remained in place,
with limited changes in two recent tax reforms in 2010 and 2012.
Some important features of the NID include:
a. Adjustments. The equity qualifying for the NID deduction is composed of statutory
equity and retained earnings, adjusted to limit tax abuses. Participation in companies other than
portfolio investments, holdings of shares of investments firms, own shares held on the balance
sheet, as well as the value of foreign establishments and real estate are excluded from the NID
base.7 Tax-exempt unrealized reevaluation gains and explicit government subsidies in the form of
equity investments are also excluded from qualifying equity.
b. Within year changes in equity. Reductions or increases in equity result in a NID
deduction that is proportional to the time that the relevant equity base was in place. In contrast,
profits incorporated into equity at the end of the year are not eligible in the concurrent tax year.
c. Investment or reserve requirements. There are no investment or minimum reserve
requirements that a firm needs to meet in order to be eligible to claim the NID.
d. Carry-forwards. If the NID exceeds the value of taxable profits, the surplus does not
generate a refundable credit. However, firms were able to carry this surplus for up to 7 years.8
Starting in 2012, this carry-forward provision has been abolished.
e. Rates. The notional interest rate was 3.4% for the 2006 accounting year, and 3.8%,
4.3%, 4.5%, 3.8%, and 3.5 %, respectively, for years 2007 to 2011.9 Starting in 2012, the interest
rate deduction was capped at 3%, and in 2013 the limit was further revised to 2.7%.
The introduction of the NID coincided with the elimination of a 0.5% tax on new equity
issuance. The abolition of this one-time charge made equity even more attractive after 2006. Yet,
the importance of this latter change is minor relative to the recurrent tax benefits from the NID.
7 In 2012, the European Commission requested Belgium to repeal the exclusion of foreign establishments and real estate holdings from the NID formula. See: http://europa.eu/rapid/press-release_IP-12-61_en.htm. 8 The deferred tax benefit from carry-forward provisions is not recorded on the firm’s balance sheet. Hence, the existence of deferred NID balances does not mechanically affect the composition of the firms’ capital structure. 9 Faced with the budgetary consequences of the financial crisis, the Belgian government capped the NID rate at 3.8% for both 2010 and 2011. If the initial NID formula had been applied, the 2011 NID rate would have been 4.1%.

7
C. Special Measures Affecting Small Firms and Compensating Tax Measures
The NID included a number of provisions that treat small firms differentially. For example,
it provides an additional 0.5% interest deduction for small firms.10 Yet, despite having a higher
statutory rate available for deduction, the net effect of the reform on small firms’ financing
incentives is relatively more intricate than for other firms.
A number of concurrent compensating measures aimed at offsetting the estimated
budgetary costs of the NID program made increasing equity less attractive for small firms. These
measures included: (a) the elimination of a tax incentive that favored the use of equity financing
before the NID was introduced, and (b) the requirement that NID users could no longer rely on the
preexisting “untaxed investment reserve” (UIR) program.
The former measure granted a one-time tax credit to firms that increased their equity base
beyond the highest level in the preceding three years. The credit was 7.5% of the equity increase,
capped at €19,850. This nominal limit made equity prior to 2006 more attractive for smaller firms,
making the incremental effect of the NID arguably less relevant for them.
The UIR program allowed firms to deduct from taxable income a share of their investments
whenever they were funded with retained earnings. The maximum yearly deduction was €18,750.
Hence, firms with large equity bases benefited by adopting the NID. In contrast, small firms under
the UIR program with little or no tax obligations faced weaker incentives, if any, to tilt their capital
structure towards equity financing after 2006.
Taken together, these measures indicate that the NID provided stronger incentives to use
equity financing for larger corporations, an issue we will explore in the empirical tests.11
D. Previous Empirical Evidence
The NID constitutes the broadest implementation to date of an “allowance for corporate
equity” (ACE) system (Boadway and Bruce, 1984; Bond and Devereux, 1995). Tax advocacy
groups, such as the Institute for Fiscal Studies (IFS, 1991 and 2011) have long stressed the benefits
of ACE systems as means to achieve tax neutrality in financing decisions. More recently, Mirrlees
10 Small firms are defined as organizations with fewer than 100 employees that do not exceed more than one of the following thresholds: (a) revenue of €7.3 million, (b) total assets of €3.65 million, or (c) 50 employees. 11 The combined limit of these two deductions was €38,600. Assuming a 3% notional interest rate, firms with equity values of €1.3 million (€3.9 million in assets using the sample mean equity ratio) or more would gain by increasing their equity ratios under the NID. In the analysis, we use a size threshold of €5 million to capture firms that benefit from using the NID. Using alternative size thresholds to identify large firms does not affect the results.

8
et al. (2012) describe a broad set of proposals for fundamental tax reform, which include an ACE
provision to align the tax treatment of debt and equity.
Before Belgium, Austria, Brazil, Croatia, and Italy introduced tax reforms that included
features of an ACE. Analyzing the impact of these reforms has, however, been difficult due to
several challenges.12 All countries, except Brazil, abandoned their ACE a short period after it was
enacted. The benefit of the ACE was very restricted (Italy), limited to new equity (Austria), or
conditioned on payouts to shareholders (Brazil). Additionally, the evaluation of these reforms
suffered from the lack of large datasets, frequent and concurrent changes in other taxes (e.g., Italy),
and the absence of credible control groups to establish the effect of taxes on leverage.
The evidence to date using the introduction of the Belgian NID points to mixed results.
Using a sample of 614 small firms, Van Campenhout and Van Caneghem (2013) show that the
NID did not have significant effects on financing decisions. Conversely, Kestens, et al. (2012)
using a non-random sample of 13,130 firms and cross-sectional tests, show that the NID
significantly affected the leverage ratios of small firms. The mixed evidence on the effects of the
NID on small firms is hardly surprising given the previously discussed tax incentives. In
concurrent and independent work, Princen (2012) uses a subset of Belgian firms, and argues
empirically that the NID led Belgian firms to reduce their leverage ratios, relative to firms in
France. An important concern, however, is that the NID effects reported in her analysis are driven
by a combination of: (a) an unusual increase in leverage of French firms of nearly 4 percentage
points in 2006 alone, and (b) a secular trend towards lower leverage of Belgian firms that started
before the NID was introduced and that is not shared by France; both of which are difficult to
rationalize if French and Belgian firms in her sample were comparable.13 In contrast, Auclert and
Struyven (2012) argue empirically that the NID had an insignificant effect on capital structure due
to a secular reduction in leverage experienced by Belgian firms since 2001.
In subsequent sections, we assess whether the NID effects, if any, can be explained by
secular trends in leverage, or whether the evidence highlighted above can alternatively be
explained by differential sample selection criteria and firm characteristics across studies.
12 See Klemm (2006) for a review of these experiences and the related literature. 13 See Figure 1, p. 8 in Princen (2012).

9
Besides the important controversy on whether the NID led to a causal effect on financing,
none of the preceding studies examines the heterogeneity in the response of firms’ capital structure
policies to the introduction of the NID. To this date, there are no formal tests on whether the
potential NID effects are driven by tax avoidance strategies of multinationals,14 by changing
leverage ratios of incumbent or new firms, by changes in equity and/or liabilities, or whether the
changing leverage ratios are simply the result of differential industry trends.
Beyond the Belgian setting, there is a large literature examining the effect of taxes on
financing decisions (Graham 2008). Despite the prominence of tax incentives, establishing the
effect of taxes on financing decisions has been difficult for at least two reasons:
First, the majority of preexisting studies employ purely cross-sectional (and non-statutory)
variation in tax rates, or cross-country tax rates, to estimate the effect of taxes.15 A common
shortcoming of such empirical tests is that omitted variables that are difficult to control for at the
firm or country level, and not taxes, may explain the results in those papers.
Second, studies that rely on changing tax rates typically face two challenges: (a) finding
tax reforms that generate large variation in tax incentives, and (b) controlling for time trends.16
Most empirical tests to date exploiting tax reforms have found insignificant effects on
capital structure. For example, Graham (1999) finds no evidence that changing tax rates affects
firms’ financing decisions. More recently, Faccio and Xu (2012) find that changing tax rates affect
leverage ratios but only for firms located in OECD countries with low rates of tax evasion.
In concurrent work, Heider and Ljungqvist (2012) seek to overcome these challenges by
exploiting changes in corporate tax rates across U.S. states. They find that state-level tax increases
(decreases) lead to higher (unchanged) leverage ratios. Similarly, Doidge and Dyck (2012) show
that introducing corporate income taxes to income trusts (entities that were not subject to such
taxes) in Canada, led to higher leverage ratios. An (2012) also documents that increasing corporate
14 Several tax avoidance schemes by multinationals have been documented by the media. See, for example: http://www.lalibre.be/actu/belgique/article/760015/bernard-arnault-beneficie-des-largesses-fiscales-belges-depuis-4-ans.html 15 For example, Mackie-Mason (1990) finds significant tax effects when focusing on firms’ incremental financing decisions as a function of non-interest tax shields. Graham (1996) shows a positive correlation between cross-sectional tax rates and changes in debt ratios. Rajan and Zingales (1995) and Desai, et al. (2004), find that cross-country variation in tax rates has predictive power in explaining financing decisions, among many others. 16 For example, the Tax Reform Act (TRA) of 1986 coincided with the leverage buyout (LBO) wave of the 1980s. While the TRA led to optimally lower leverage ratios from the tax perspective, it is plausible that the LBO wave led to higher target leverage ratios, making the net effect undetermined. More generally, tax reforms are typically triggered by changing macroeconomic conditions, complicating inference.

10
income tax rates for a subset of foreign investment firms in China led to higher reliance on debt
financing. Such results are consistent with the idea that capital structure responds to tax incentives.
In sum, the introduction of the NID allows us to build on and extend the literature on the
effect of taxes on capital structure in several unique dimensions.
First, by examining the impact of a tax reform that was triggered by non-domestic fiscal
conditions (i.e. the European Commission’s ruling) we present arguably cleaner variation in tax
incentives.
Second, by focusing on a tax reform that generated stark changes in the tax treatment of
equity, we can assess whether the previously shown insignificant results are explained by noisy
tax incentives or demonstrate that taxes are indeed irrelevant for financing decisions. Moreover,
by exploiting a novel subsidy that is targeted to equity, we can investigate to what extent capital
structure would change if firms faced similar tax incentives for debt and equity financing
independently of changes in the corporate tax rate. This margin is thus far unexplored in the
empirical literature.
Third, by relying on a number of clear and economically compelling control groups, we
can greatly overcome the concern that aggregate trends affect our tax estimates.
Fourth, our empirical setting allows us to disentangle the tax responses that result from
international tax avoidance strategies by multinationals from the direct capital structure responses
of standalone firms.
Fifth, we provide the first estimates to date of the impact of changing tax incentives on the
financing decisions of the universe of firms of an entire economy. Previous studies have
concentrated in analyzing the effect of taxes on the financing decisions of publicly traded firms.
Lastly, we can also relax the assumption that firm-level observations are independent
within tax jurisdiction. A major concern with tax-based “natural experiment” studies is that the
standard errors are understated because the source of variation used is at the tax country level, not
at the firm level, as it is implicitly assumed in most papers in the literature. In the next section, we
describe our empirical strategy.

11
II. Empirical Strategy
In this section, we describe the empirical strategy designed to address four related
questions. First, did the capital structure of Belgian firms respond to the tax incentives that resulted
from the NID? Second, did taxes or other confounding effects explain the changes in leverage
around 2006, if any? Third, was the response to the tax reform homogenous across firms, or did
different firms respond differentially? Fourth, if leverage changed, what financing policies explain
the incremental reliance on equity?
We exploit plausibly exogenous time-series variation in the relative cost of equity
financing resulting from the NID. If tax provisions meaningfully affect financing decisions, we
would expect an increase in the share of equity in the capital structure after 2005. Formally:
y α γNID ψ X ε . (1)
If captures the new tax provision favoring equity financing, we expect γ to be positive
(negative) and significant if is the equity (leverage) ratio of firm i at time t. X captures a series
of firm or industry variables that shape financing decisions. Given the tax incentives discussed in
Section I, we expect γ to be economically and statistically significant.17
An important challenge to the previously described empirical strategy is that while the NID
reform is plausibly exogenous, other concurrent aggregate events can potentially complicate
inference. To the extent that aggregate characteristics or investment opportunities vary around the
introduction of the NID, γ in (1) would be biased. We address the concern that non-tax factors
could explain the changes in leverage in at least seven alternative ways:
First, we examine the capital structure of Belgian firms relative to those firms located in
Belgium’s neighboring countries. Using these geographically close and economically integrated
firms as controls is attractive because they are exposed to industry and aggregate shocks similar to
those experienced by the Belgian firms.18 Formally, we estimate the effect of the NID using a
differences-in-differences (DiD) methodology, using the following specification:
17 Given the complexities of the tax incentives for smaller firms, we expect γ to be economically and statistically significant for large firms. In our tests, we use small Belgian firms as a within country control group for the effect of the NID on capital structure. This test is attractive because it allows us to difference out the effect of domestic time trends. The disadvantage is that it is difficult to argue that the investment opportunities of large and small firms are similar. We address this concern by using firms from Belgium’s neighboring countries as alternative controls. 18 As part of the European Union, Belgium abolished all trade tariffs and border controls with its neighboring countries. In 2009, the top three destinations of Belgian exports were Germany (20%), France (18%), and the Netherlands (12%).
ity

12
y α θNID d d ψ X ε (2)
where i indexes firms, k indexes countries, and t indexes time. Country categorical variables ( )
allow us to control for fixed differences across countries, and time dummies ( ) control for
aggregate trends. is an indicator variable equal to one for Belgian firms starting in 2006,
zero otherwise. We expect to be positive (negative) and significant if is the equity (leverage)
ratio.
Second, to assess whether specific industries exhibit differential time trends that would
otherwise be captured by the DiD estimates, we expand (2) above to include separate year effects
for each industry.19 These tests are important because the firms in Belgium and the control
countries do not necessarily specialize in the same industries. Hence, these added controls allow
us to examine the robustness of the results to differential industry specific shocks.
Third, to control for the confounding effects of concurrent tax reforms in Belgium and its
neighboring countries, we directly control for the prevalent statutory tax rates on corporate income,
interest income, dividends and capital gains.
Fourth, we provide a tighter test of (2), above, by limiting the analysis to firms located
within 100, 250 and 500 kilometers of the Belgian border.20 Intuitively, the closer the firms are to
the Belgian border, the more likely that the Belgian and control firms are comparable.
Alternatively, to address the concern that the results may capture the effect of an economic or
policy shock in one of the control countries, we examine whether the results change whenever we
remove from the control group firms from one of the neighboring countries at a time.
Fifth, we solely compare the capital structure decisions of Belgian firms with those that
share a common cultural heritage (Guiso, et al. 2009). Belgium is multilingual and is located in
the intersection of German and Latin cultures. Hence, we assess the effects of the NID using
separate specifications for firms located in French and non-French speaking regions.
Sixth, to address the concern that Belgian and control firms may not be identical in terms
of observable characteristics, and that these differences can explain different trends over time, we
Despite its small size, Luxembourg ranked among Belgium’s top 10 trading partners. Source: Belgian Agency for Foreign Trade (www.abh-ace.be). 19 Two-digit Standard Industrial Classification (SIC) codes. The results are robust to using the European NACE industry classification system, as well as, allowing for more disaggregated levels of industry-year controls. 20 We use the firms’ business addresses to approximate their locations, and rely on Vincenty (1975) for computing geodesic distances to the Belgian border.

13
implement a matching DiD strategy (Heckman, et al., 1997). To this end, we replicate the DiD
tests on a subsample of matched firms based on pre-NID characteristics.21
Seventh, to address the concern that the standard errors in tax reform studies are
understated, in some specifications we cluster them at the country level. This correction allows us
to relax the assumption that firm observations are independent within each country. Given that
clustered standard errors only converge to the true standard errors as the number of clusters
increase, we also show DiD specifications using data from all firms in Amadeus (38 countries),
and report standard errors clustered at the country and industry level (240 clusters).
Beyond the direct tests assessing the effect of the NID on capital structure, we also
investigate the heterogeneity of the responses at the firm level. A potential concern with the capital
structure responses estimated in (2) is that they only capture the effect of multinationals or other
business group affiliates, and are arguably uninformative of the responses of standalone firms. To
test whether the NID effects are widespread, we use direct and indirect proxies for multinational
or group firm status, and provide separate specifications that assess whether those firms that are
likely to engage in tax avoidance transactions explain the differential capital structure behavior of
Belgian firms after 2006.
We also investigate whether the variation in leverage ratios reflects active capital structure
changes, entry and exit variation, or both. To this end, we assess whether incumbent firms actively
rebalance their capital structure using fixed effects specifications. An added advantage of
introducing firm fixed-effects is that they allow us to rule out the confounding effect of time-
invariant firm traits. In addition, we test whether new firms rely more heavily on equity after 2006.
Across specifications, we also assess the magnitude of the NID effects for firms of different size
thresholds.
Lastly, to disentangle which financial policies significantly change after 2006, we present
separate DiD specifications that test for the differential effect of the NID on equity, liabilities (non-
equity), and total assets. Moreover, we also assess whether higher equity ratios can be explained
by increased retentions or active equity issuance decisions.
21 See Appendix A1 for a detailed description of the matching procedure.

14
III. Data Description
A. Firm Level Data
We obtain yearly financial data for the universe of limited liability firms in Belgium from
2002 to 2009 from the Central Balance Sheet Office at the National Bank of Belgium (NBB). All
firms, public and privately-owned, are required to file annual financial information to the NBB.22
Due to the existing reporting requirements and associated regulations, the quality of the
Belgian data is likely to be high.23 In terms of disclosure, large firms are required to file detailed
financial statements, while small firms only report selected financial data.24 All firms report the
value of total assets, equity, and non-equity liabilities, as well as operating and net income.
Beyond basic financial data, the NBB also reports a number of variables that are designed
to track the transactions of those firms that are directly controlled, or linked through shareholdings
or investments with a given reporting firm. These variables allow us to identify group firm
affiliation, and permit us to assess the effect of the NID on the capital structure of standalone or
unaffiliated firms.
We obtain firm-level information for firms in France, Germany, Luxembourg, and the
Netherlands, from Bureau Van Dijk (BvD)’s AMADEUS database. AMADEUS provides selected
balance sheet and income statement information for over 19 million European firms.25 We extract
the financial accounts available for these countries from 2002 to 2009. Given that AMADEUS
eliminates from its files firms that cease to operate for three or more years, we rely on historical
disks to generate a sample free from survivorship biases.
The coverage and consistency of AMADEUS depends on each country’s financial
reporting requirements, and on the date at which BvD started assembling its local database. For
example, the coverage of the French data is high, as all firms file standardized financials to the
22 The majority of firms are private. The number of Belgian non-financial, non-utility firms in the NYSE Euronext Brussels market is small (98 firms). Source: https://europeanequities.nyx.com/, consulted 5/15/2013. 23 Failing to file and misreporting financial statements results in significant fines levied by the NBB, as well as potential penalties under civil law. Moreover, failure to report as well as misreporting is a criminal offense. In addition, the vast majority of filing is done electronically, and the NBB performs automatic checks aimed at assuring the integrity and quality of the data. Lastly, large firms are required to appoint a statutory auditor and submit audited financial statements to the NBB. See www.nbb.be/pub/home.htm for a description of the data and of Belgian legal requirements. The financial reports are freely available at the NBB website. 24 See http://www.nbb.be/DOC/BA/Models/ENT/2011_C_20111215.pdf for the questionnaire applicable to large firms and http://www.nbb.be/DOC/BA/Models/ENT/2011_A_20111215.pdf for the small firms’ format. 25 AMADEUS also provides data for Belgian firms. However, we rely on the NBB data for two reasons. First, the NBB data is the primary source of the Belgian AMADEUS data. As a result, the two sources are unsurprisingly overwhelmingly consistent. Second, the NBB dataset includes variables that are not available through AMADEUS.

15
authorities, and BvD’s coverage is comprehensive even in the early years of the sample. As a
result, France has the largest number of firm-years from the four control countries. In contrast,
Germany, Luxembourg, and the Netherlands do not have standardized filing forms or systematic
disclosure requirements for all private firms. Hence, the coverage of German firms, for example,
is less comprehensive, and the number of firms changes drastically during the sample period.
Beyond financial data, we use AMADEUS to construct measures of firms’ independence,
so that we can classify firms as subsidiaries or as standalone firms. Lastly, we use the firms’ postal
codes to approximate the distance between each firm’s location and the closest Belgian border,
using geodesic distances (Vincenty, 1975).
B. Sample Selection
We focus on the capital structure decisions of limited liability corporations.26 To facilitate
the comparison of financial information across years and countries, and to minimize sample
selection problems, we focus on the post-2001 period. AMADEUS’s coverage prior to 2002 is
limited relative to subsequent years. To further avoid problems caused by increased coverage over
time, only newly incorporated firms are added to the sample after 2002.27 Additionally, we omit
firms in heavily regulated industries such as agriculture, finance and utilities.28 We also exclude
firms with missing assets, equity, or profit data.
A concern when analyzing European data is that many firms are extremely small. To
address this concern, we require that the sample firms have at least one year of data with total
assets of €1 million or more. In addition, to ensure that the results are not driven by outliers, all
ratios are winsorized at the most extreme 1% in either tail of the distribution.
After applying these selection criteria, we arrive at a sample of 1,467,766 firm-year
observations from 235,788 unique firms. On average, we have over six observations per firm.
26 We omit from the analysis partnerships, one person corporations, and non-for profit entities. 27 That is, firms that first appear in the AMADEUS database after 2002, but whose first financial statement does not correspond to the firms’ year of incorporation or the subsequent year are omitted. 28 Two-digit SIC codes 1 to 9, 60 to 69 and 40 to 49. These industry filters are introduced to prevent changes in local regulations from affecting the estimates. None of the sample selection criteria affect the main results of this paper.

16
C. Industry Level Data
To assess the impact of the NID using an alternative database that does not rely on
AMADEUS for financial information, we use industry level capital structure information from the
European Bank for the Accounts of Companies Harmonised (BACH) project. 29 The BACH
database compiles annual time series information of non-financial companies from the European
Union. We obtain equity-to-total assets ratios from a balanced panel of manufacturing, wholesale
and retail industries with available financial data for every year in the 2002 to 2009 period. We
rely on annual financial information from 23 industries from Belgium, France, Germany and the
Netherlands (data from Luxembourg is not available) for the 2002 to 2009 sample period.
D. Summary Statistics
Table I presents summary statistics for all firms (Columns I to V), and for those with total
assets of €5m or more for at least one year during the sample period (Columns VI to X), broken
by country: Belgium (Columns I and VI), France (Column II and VII), Germany (Columns III and
VIII), Luxembourg (Columns IV and IX), and the Netherlands (Column V and X).
The average value of assets for Belgian firms is €5.6 million and €6.4, €27.7, €22.6 and
€19.3 million, respectively, for firms in France, Germany, Luxembourg, and the Netherlands. Such
size differences highlight the differential data coverage across countries. While we identify
396,840 and 965,257 observations in Belgium and France, respectively, we only obtain 69,039,
2,329, and 34,301 observations from Germany, Luxembourg, and the Netherlands, respectively.
Focusing on firms with €5m or more in assets, we observe that the relative size differences across
Belgian and control firms narrows but remains important: mean asset values are €23 million for
Belgian firms, and €25, €58, €47 and €34 million for the control countries.
Table I shows that mean equity (net leverage) is 33% (52%) for Belgian firms and 33%
(49%), 29% (59%), 32% (53%), and 29% (57%), respectively, for firms in France, Germany,
Luxembourg, and the Netherlands. These ratios indicate that Belgian firms are less levered than
firms in Germany, Luxembourg, and the Netherlands, while slightly more levered than firms in
France. Table I also shows that, other than firms from Luxembourg, Belgian firms pay less in taxes
29 http://www.bachesd.banque-france.fr. The data is reported at the NACE, Rev. 2 two-digit level.

17
as a fraction of income than their neighboring firms. In the sections below, we will investigate
whether a fraction of these differences are attributable to the introduction of the NID.
Table I stresses the proximity between firms in the control countries and the Belgian
border. The average distance to Belgium is 359, 304, 20 and 77 kilometers for firms in France,
Germany, Luxembourg, and the Netherlands, respectively. As a benchmark for comparison, the
driving distance between Boston and New York City (215 miles) is comparable to the average
distance between firms in France and the Belgian border (223 miles). Such short distances,
combined with the common currency and economic policies within the European Union, make a
compelling case for the tight economic integration between the sample firms.
In Table I, we also report the share of firms that are classified as new, subsidiaries or group
firms. New firms are those whose first financial statements correspond to the firms’ year of
incorporation or the subsequent year. New firms are relatively less common in Belgium than in
the other countries. Subsidiaries are firms that are reported as such by businesses with at least $1
billion USD in revenue in BvD’s OSIRIS 2007 or 2010 disks. The highest subsidiary ratios are
reported in Luxembourg (19%), and Germany (16%) and the lowest in Belgium (4%) and France
(5%). We also report group firm, a dummy variable equal to one for firms that report transactions
with related companies, or indicate that they are part of a group for consolidation purposes. This
measure is only available for Belgium and 41% of firms are reported as such.
The summary statistics reported in Table I point to several significant cross-sectional
differences between Belgian (treated) and non-Belgian (control) firms. These differences motivate
the long list of robustness tests described in the empirical strategy section.
For our DiD strategy to be valid, however, we only require that, apart from the effect of
the NID, treatment and control firms are subject to common trends around the introduction of the
NID. In Figure 1, we provide striking suggestive evidence that Belgian and control firms are
subject to similar economic shocks. Figure 1, Panel A plots the growth in gross domestic product
(GDP) for the 2002 to 2009 period for the sample countries. Consistent with the idea that these
economies are tightly linked, the correlation of GDP growth between Belgium and the control
countries is 0.94 for France, 0.90 for Germany, 0.94 for Luxembourg, and 0.91 for the Netherlands.
Similarly, Figure 1, Panel B shows the growth in aggregate revenue for a balanced panel of firms
between 2001 and 2009. The correlation between revenue growth in Belgium and revenue growth
in France, Germany, Luxembourg, and the Netherlands is 0.98, 0.98, 0.85, and 0.83, respectively.

18
These correlations make a compelling case for the use of the neighboring countries as credible
controls for time varying business opportunities affecting Belgian firms.
E. Corporate and Personal Tax Information
Table II displays annual top statutory tax rates on corporate income, dividends, capital
gains, and interest income per country. We also report Miller’s (1977) measure of the relative tax
advantage of debt relative to equity using, alternatively, the dividend income (Column V) and the
capital gains (Column VI) tax rates as proxies for the relevant tax on equity. Table II highlights
three issues. First, during the sample period, all countries used corporate income taxes, with rates
ranging between 26% and 40%. Second, the tax differences in the incentive to use leverage across
countries are largely determined by personal taxation. Third, while no country experienced a
drastic overhaul of its tax system, there is a non-negligible amount of variation in corporate and
personal tax rates between 2002 and 2009. In our tests, we include controls for these variables and
assess whether they affect the impact of the NID on financing decisions.
IV. Equity Subsidies and Capital Structure
A. Aggregate Leverage, Differences of Means, and Differences-in-Differences Tests
As an initial test of the impact of the NID, in Figure 2, we plot the ratio of the aggregate
value of equity to the aggregate value of assets. This figure stresses two points. First, equity-to-
total assets ratios fluctuated between 32.3% and 33.1% between 2002 and 2004. Second, equity
ratios suddenly and drastically increased around the introduction of the NID. Comparing equity
ratios between 2002 and 2004 (32.8% on average) to the same ratios after the NID as approved
(38.2% on average between 2006 and 2008), yields an increase in equity ratios of 17%. In words,
the introduction of the NID coincided with a drastic decline in leverage ratios for Belgian firms.
In Table III we investigate whether these patterns can be attributable to confounding time-
varying shocks by comparing the capital structure of Belgian and control firms. We perform
separate mean equity-to-total assets ratio (in percent) analysis for: (a) medium and large (Columns
I to V), and (b) small (Columns VI to X) firms. As discussed in the preceding sections, Belgian
firms with total assets of €5m or more (herein medium and large) are likely to benefit from
increasing their equity ratios with the introduction of the NID, while smaller firms faced weaker,
if any, incentives to tilt their capital structure towards equity after 2006.

19
Table III, Panel A, shows annual equity-to-total assets ratios for medium and large Belgian
(Column I) and control (Column III) firms. Before 2006, the equity ratios of Belgian firms did not
exceed 32.6%. After the reform, these ratios increased sharply: by 1.5 percentage points in 2006
alone, reaching 35.5%, 36.4%, and 37.6% in 2007, 2008, and 2009, respectively. In contrast, the
equity ratios of the control firms hardly moved between 2005 and 2006. The last three years of
data, however, show that control firms exhibit a milder increase in equity ratios. This increase is
sharper between 2008 and 2009, but it is likely to be driven by attrition, as the number of firms in
the control countries dropped by 7.3% but only by 1.8% in Belgium.
More striking, the differences of means tests shown in Table III, Column V, highlight two
results. First, the equity ratios of control and treatment firms were indistinguishable from zero at
conventional levels before the NID was introduced. Second, the annual equity ratios of Belgian
firms were significantly larger than those of the control firms for every year after 2005.
To provide a sharper test for the impact of the NID, Table III, Panel B, shows biennial
average equity ratios starting in 2002, and Panel C, reports average difference (Columns I and III)
and DiD estimates (Column V) for alternative subsamples of medium and large firms. The mean
analysis shows that: (1) prior to 2006 both control and treatment firms increased their equity ratios
but that the difference across groups was insignificant, and (2) the increases in equity ratios
reported in Belgium are large and significant relative to both the leverage ratios in 2004-2005 or
any year prior, or the concurrent equity ratios of the control firms. These results reinforce the idea
that the NID led to higher equity ratios for Belgian firms, and cast doubt on the idea that changing
product or capital market conditions explain these higher equity ratios.
Table III, Panel A, Columns VI and VIII shows annual equity-to-total assets ratios for small
Belgian (Column I) and control (Column III) firms. Small firms provide an alternative and relevant
comparison group because at the margin they received weaker incentives to rely on equity
financing after 2006. Consistent with the idea that the NID explains the increase in equity ratios
for medium and large firms, we fail to find evidence that the equity ratios of small Belgian firms
systematically changed after 2006 relative to the control firms (Column X). Interestingly, for most
groupings in Panels B and C, the secular decline in leverage reported by Princen (2012) and
Auclert and Struyven (2012) for small Belgian firms, is indistinguishable from the capital structure
decisions of the control firms. In other words, there is no robust evidence that small firms in the
control and treatment countries systematically differed.

20
Taken together, the results from Figure 2 and Table III provide compelling evidence that
capital structure responds to changing tax incentives. At the aggregate level, the country-level
equity ratio increased sharply; at the firm level, average equity ratios also increased but only for
the firms that received sharp incentives to rely on equity after the NID was implemented.
One concern with the analysis thus far presented is that the differential coverage of
AMADEUS across countries might explain the results of this paper. To address this potential
concern, we rely on industry level information from the BACH database.
The results are presented in Table IV. Panel A and B show annual and biennial equity-to-
total assets ratios for industries in Belgium and the control countries starting in 2002. Panel C
shows difference and DiD analyses for alternative subsamples in the spirit of the tests presented in
Table III. The evidence from Table IV confirms the firm-level results: (1) the difference in equity
ratios between industries in Belgium and those in the control countries is insignificant for every
year prior to 2006, (2) after the NID was introduced the Belgian industry average equity ratios
significantly increase relative to the control countries. Despite the relatively small number of
industry-level observations, the post-2006 DiD tests are robustly significant.
Figure 3, Panels A and B, provide a graphical illustration of our empirical strategy. Panel
A and B plot, respectively, the annual average difference in equity ratios across Belgian and control
firms (Table III, Column V) and industries (Table IV, Column V). These figures stress the two
main results in the preceding tables. First, the difference in the equity ratios of treatment and
control firms and industries is insignificant before 2006. Second, the difference in equity ratios
experiences a sharp increase, and becomes significant only after the NID was introduced.
That Belgian firm and industry equity ratios track those in the control countries in each
year prior to the introduction of the NID bolsters the credibility of the key identifying assumption
behind our empirical tests. Namely, that absent the NID, the equity ratios in Belgium would
continue to evolve as those in the control countries. Lastly, in terms of magnitudes, and using the
more conservative firm-level estimates, these tests suggest that by 2008 average equity ratios
increased by at least 3 percentage points (10%) relative to the pre-reform levels.

21
B. Pooled Multivariate Specifications
Table V presents pooled multivariate results. In Columns I to III we start by focusing on
Belgian firms only, introducing controls at the industry level. The results show that Belgian firms
displayed higher and increasing equity ratios after 2005. We also separately report specifications
for medium and large (Column II) and small (Column III) firms. As before, while we document
an across-the-board increase in equity ratios, we show higher equity gains for larger firms: the
estimated equity increases of large firms are roughly twice those of smaller businesses.
In Table V, Column IV, we introduce data from the control countries, which permit us to
include country and year dummies. To allow small firms to respond differentially to the NID, we
estimate separate interaction effects for small firms, small-year effects, small Belgian firms, and
for small firms in Belgium for each year after 2005. Hence, the interaction of the post-2006 and
Belgium dummy variables captures the key estimates of interest, i.e. the response of medium and
large firms to the NID. In contrast, the interaction between the post-2006, Belgium and small
dummies captures the differential response of small firms compared to larger companies. The
results show that after 2006, large Belgian firms significantly increased their equity ratios. In
contrast, the equity shares of smaller Belgian firms did not systematically increase.30
In Table V, we also assess the importance of clustering the standard errors at the country
level, the key source of variation in this setting. A common concern with tax reform studies is that
they understate the standard errors by assuming independence across firms within each tax
jurisdiction (Bertrand, et al. 2003). The results from Column V confirm this concern: clustering at
the country level leads to standard errors that are 1.7 to 2.4 times larger than those reported in
Column IV. Yet, the impact of the NID on equity ratios is robust to this correction.
Table V, Columns VI to X, shows that controlling for the prevailing corporate, dividend or
interest income tax rates, industry-year dummies, firm size, profitability and tangibility, as well as
aggregate country or regional trends does not affect the coefficients of interest. As in other studies
in the literature, the impact of corporate taxes is insignificant. The results also show that higher
dividend tax rates correlate with lower equity ratios. Yet, such correlation only holds if data for
30 For each year between 2006 and 2008, the point estimates for small firms are strikingly similar, in absolute value, to the estimated coefficients for large firms, implying a near-zero treatment effect. Indeed, the average treatment effect for those three years is -0.003 with a 0.141 standard error. As noted earlier, the larger (in absolute value) estimated coefficient for 2009 is likely to reflect the effect of other forces, such as selective attrition in control countries after 2009, which is particularly severe for small firms (see Table 3, Columns VII and IX).

22
2009 is included (Columns VI to IX), which may capture the response of firms or banks to the
recent financial crisis, among other factors. The impact of interest income tax rates is also not
robust across specifications. In terms of other controls, profitability is robustly associated to lower
leverage; size and tangibility are only marginally linked to higher equity ratios; aggregate
(regional) GDP growth is correlated with higher (lower) equity usage.
The evidence from Table V shows that by 2008, the equity ratios of medium and large
Belgian firms increased by 2.5 to 3.0 percentage points, or 7.6% to 9.2%, relative to pre-reform
capital structure levels. Given that the decline in corporate income tax rates that results from the
NID is proportional to the ratio of the NID rate to the expected return on equity, and assuming
reasonable estimates for the average firm, the results of Table V correspond to an elasticity of
equity ratios to corporate income tax rates of 0.19 to 0.23.31
In Table VI, we investigate the effects of the NID using two alternative outcome variables:
(a) net leverage ratios (total non-equity liabilities minus cash and equivalents over assets), and (b)
income tax liabilities to earnings ratios. The focus on net leverage is justified because, from a tax
perspective, cash has the opposite effect to leverage: it generates interest income that increases
firms’ tax obligations. Hence, net leverage captures the net financial gain from the tax perspective.
The focus on income tax liabilities is also intuitive: to the extent that the NID materially affected
firms, we expect tax liabilities to decline after 2006. If, in contrast, other confounding effects have
bolstered the equity ratios, such as higher profits, we would expect Belgian firms to report
unchanged or even increased tax liabilities.
The evidence from Table VI demonstrates that the net leverage of Belgian firms declined
after the NID was introduced. Table VI, Column I reports lower and decreasing leverage ratios
starting in 2006 for medium and large firms. Consistent with prior DiD estimates, Columns II to
V show that large firms significantly decreased their leverage ratios by 2.3 to 4 percentage points
relative to the control firms. The DiD coefficients for 2008, which are in the 3.5 to 4.0 range,
evaluated at the mean, translate to lower net leverage of around 7.3 to 8.3%. Table VI, Columns
III to V show that the inclusion of industry-year, firm, tax or aggregate controls does not affect the
NID estimates. In contrast, small firms do not change their leverage in a robust manner.
31 Assuming that the risk-free and NID rates are identical at 4%, and that the market risk premium is 6%, then the NID deduction is equivalent to a reduction in the average corporate income tax rates of 40% for a firm with beta equity of one.

23
Table VI, Columns VI to X, reports income tax payment results using specifications
analogous to those described for net leverage. The results demonstrate that the NID led to lower
effective tax rates paid by medium and large Belgian firms relative to small firms in Belgium or
similarly sized firms in the control countries. The estimated coefficients indicate lower tax to
earnings ratios in the 1.8 to 6.0 percentage points range across DiD specifications, with estimates
of at least 4 percentage points for the last two years in the sample. This last estimate implies a
decline in the order of 20% in the average tax to earnings ratios.
In sum, the evidence from Tables V and VI demonstrate that the capital structure of Belgian
firms systematically shifted towards equity after 2006.
C. Robustness Tests
Having shown that capital structure responds to tax incentives, we now provide in Table
VII a battery of robustness tests using different controls, subsamples, and specifications. The
analysis focuses on the net leverage ratios of firms with assets of €5 million or more in at least one
year between 2002 and 2009. To facilitate the exposition, we only report one coefficient per
specification: the interaction of the Belgium and post-2006 period indicator variables, which
corresponds to the average treatment effect for medium and large firms between 2006 and 2009.
Table VII, Panel A, shows results for: (i) a benchmark model, (ii) a specification with
country-industry (2-digit SIC code) clustered (240 clusters) standard errors, (iii) a specification
that includes size-year dummies for each percentile of the distribution of total assets, (iv) a test
that also controls for the capital gains tax rate, (v) a test that includes a Miller ratio control that
assumes that the relevant personal income tax for equity is the dividend income tax rate, and (vi)
a specification that includes an alternative Miller ratio that assumes that the relevant personal
income tax for equity is the capital gains tax rate. In all cases, the impact of the NID on net leverage
is comparable to the preceding estimates.
In Table VII, Panel B, we show results for: (i) the sample of firms incorporated in Belgium
and in the control countries whenever they are located within 250 km from the Belgian border, (ii)
Belgian firms and those in the control countries that are within 100 km from the Belgian border,
(iii) a specification that only focuses on firms with assets of €25 million or more but less than €100
million, (iv) a specification that only captures the responses of firms with €100 million or more in
assets, (v) a specification that includes all firms included in AMADEUS, even those outside the
treatment and control countries, and (vi) a specification that includes all publicly traded firms

24
reported in Bureau Van Dyck’s OSIRIS database. In all cases, the impact of the NID on capital
structure is robustly significant. Interestingly, the preceding estimates show that the effect of the
NID is monotonically increasing in absolute value with firm size.
In Table VII, Panel C, we examine the robustness of the results to omitting firm-level
observations from different subsamples, one at a time, from the control group. In particular, we
show results from specifications excluding observations from: (i) France, (ii) Germany, (iii)
Luxembourg, (iv) the Netherlands, (v) Germanic (Dutch and German) speaking regions of
Belgium and the control countries, and (vi) French speaking regions of Belgium and the control
countries. In all cases, the estimated coefficients continue to be significant at conventional levels.
In Table VII, Panel D, we also examine the robustness of the results to alternative
specifications. We show results from: (i) a quantile (median) regression, (ii) a specification that
winsorizes net debt to be smaller in absolute values than total assets, (iii) a specification that
winsorizes net leverage at the 5th and 95th percentile values, (iv) a specification that includes a
country specific trend control, (v) a matching DiD estimator (Heckman, et al., 1997) that compares
each Belgian firm to a single control firm based on industry, assets, profitability and tangibility as
explained in Appendix A1, and (vi) a matching DiD estimator restricted to the 50% subsample of
firms for which the closest matches were found. These alternative tests confirm that the
introduction of the NID led Belgian firms to tilt their capital structure towards equity.
Overall, the evidence shows that the NID led to economically and statistically significant
decreases in leverage ratios.
D. Are the NID effects entirely explained by the Tax Avoidance activities of Multinationals?
To investigate whether the changes in capital structure due to the NID are limited to
multinational companies, in Table VIII, we separately investigate the effects of the NID on the
standalone or non-subsidiaries (Column I) and subsidiary (Column II) subsamples. In Table VIII,
we only report the effect of the NID on medium and large Belgian firms. Panel A (B) shows results
for equity-to-total assets (net leverage) ratios. The results show that large Belgian firms,
irrespective of their ultimate ownership, reduced their leverage ratios after 2006. The estimated
coefficients, however, do indicate that subsidiaries responded more aggressively to the NID: the
magnitude of the effect for non-subsidiaries is 26% to 42% of the subsidiaries’ estimates.

25
In a similar spirit, in Table VIII, Columns III and IV, we investigate whether an alternative
classification of standalone and group firms, which is only available for Belgian firms (group firm
variable), affects the results. The evidence confirms the idea that with the NID, large firms
increased their equity ratios irrespective of ownership characteristics.
We further test for the importance of tax avoidance by focusing on firms with a small ratio
of financial to total income. The intuition behind this test is that tax avoidance strategies frequently
involve two components: (a) a transfer of funds from a controlling entity to a Belgian firm in the
form of an increase in equity used, and (b) a financial asset (usually a loan to another related firm)
that is financed with (a). In such transactions, the financial asset generates a flow of income that
is untaxed due to the increased NID deduction. Hence, firms engaging in such tax avoidance
schemes will display higher financial income relative to others.
To assess the robustness of the results to excluding these tax avoiding entities, we show
results for those firms for which financial income is a negligible share of total income, namely less
than 5% and 1% respectively. The results in Table VIII, Columns V and VI, show that the effects
of the NID on capital structure are robust and significant in these alternative subsamples.
Moreover, Table VIII, Columns VII and VIII show that restricting the analysis to non-subsidiary
firms with low financial to total revenue shares does not affect the results. Lastly, consistent with
the results shown in Table VII, restricting the analysis to firms with assets of €25m or more
(Column VIII) yields larger estimated NID effects on firms’ financing decisions.
In a nutshell, the evidence from Table VII shows that large standalone firms, irrespective
of their ownership characteristics, reduced their leverage ratios after the NID was introduced.
E. Disentangling the Capital Structure Responses: Within-firm and New Firm Analysis
We now examine whether the NID effects on capital structure thus far presented are driven
by changes in existing firms’ equity ratios or are alternatively explained by changes in the
composition of the sample firms.
In Table IX, Columns I to V, we focus on the capital structure decisions of incumbent
firms. We rely on firm fixed effects specifications to isolate the within-firm variation in leverage.
These specifications are also attractive because they allow us to rule out the confounding effect of
time-invariant firm characteristics, and also overcome the concern that the results shown are driven
by differential entry rates across treatment and control firms. To facilitate the comparison with the

26
preceding tables, we report results for specifications identical to those shown across Tables V and
VI, except for the addition of firm fixed effects.
The within-firm analysis stresses three main results. First, medium and large Belgian firms
report large and significant increases in equity after 2006. Second, the DiD estimates reported in
Columns II to V are virtually identical to those reported in Table V. Third, industry and time
specific dummies, or country and firm level controls, do not affect the results. In other words,
incumbent firms responded to the NID by reducing their leverage ratios.
In Table IX, Columns VI to X, we analyze the capital structure decisions of new firms. 32
The evidence stresses two results. First, the share of equity used by new Belgian firms increased
significantly after 2006. Second, the responses to the NID are economically larger for new firms
than for incumbent organizations. The DiD estimated increase in the equity-to-total assets ratio is
at least 10 percentage points across specifications for each of the 2006 to 2008 year interactions,
which correspond to increases in the equity share of at least 30%. More generally, these large
estimated effects are consistent with the idea that tax effects are more easily identifiable on the
subset of firms where active financing decisions are made (Mackie-Mason, 1990).
F. Explaining the Increase in Equity Ratios
In Table X we investigate the source of the decrease in leverage by separately investigating
each of the financial variables that can potentially affect capital structure. 33
Table X, Panel A presents results for the natural logarithm of equity (Columns I and II),
non-equity liabilities (Columns III and IV) and total assets (V and VI). To facilitate inference,
Columns I, III, and V present specifications that do not control for firm characteristics, while
Columns II, IV and VI do. All specifications include industry-year dummies, controls for small
firms, small-year effects, small Belgian firms, and for small firms in Belgium for each year after
2005, as well as corporate, interest and dividend tax controls. Columns II, IV, and VIII also include
controls for profitability, tangibility and GDP growth controls. In the interest of space, we only
report the estimated treatment effect for medium and large firms.
32 Due to the smaller sample size for new firms, we control for time-varying industry effects using yearly dummies for each of the 1-digit SIC code industries. 33 The number of observations across columns and specifications fluctuates whenever the relevant dependent variables are not defined or are not available.

27
The results in Table X, Panel A, Column I show that large Belgian firms exhibit equity
levels that exceed control firms by 10% in 2006, 13% in 2007, 17% in 2008, and 19% in 2009, all
significant at the 1% level. The estimated coefficients allow us to rule out the possibility that the
equity gains are entirely driven by the mechanical effect of the NID on profits. Namely, if the NID
deduction in 2006 was 3.4% of equity, and firms proceeded to fully retain this additional windfall,
we would expect an increase in equity levels of 3.4% and not the 10% increase reported in 2006.
Moreover, Column II shows that firm controls do not affect the estimated coefficients. In Table X,
Panel A, Columns III and IV, we examine the impact of the NID on total non-equity liabilities.
The estimated coefficients show, economically small and statistically weak decreases in other
liabilities after 2006. In other words, a reduction in non-equity liabilities represents only a small
share of the increase in equity ratios shown in the preceding tables. In Table X, Panel A, Columns
V and VI, we document an increase in the value of total assets held by large Belgian firms after
2006. The estimated coefficients indicate increases in the 5% to 9% range for 2007 to 2008. All in
all, these results show that the higher equity ratios are mostly explained by an increase in the level
of equity, not by a reduction in non-equity liabilities.
To further rule out the possibility that higher equity ratios are explained by the incremental
profits generated by the NID, in Table X, Panel B, Columns I and II, we present results using an
alternative equity value that is free from the mechanical effect of the NID on equity. Specifically,
for each of the years in the post-2006 period, we compute an adjusted equity value by subtracting
the value of net income of the concurrent and any preceding year in the post-2006 period. For
example, to compute this modified equity value for 2008, we take the reported value of equity at
the end of 2008 and subtract the net income values in 2006, 2007 and 2008. We compute this
adjusted equity variable for both treatment and control firms. The results confirm that large Belgian
firms increased their equity ratios after 2006. The magnitude of the effects is in the 15% to 21%
range, allowing us to rule out that the NID effects are hardwired.
Table X, Panel B, Columns III and IV present an alternative test of the same hypothesis by
assessing the effect of the NID on a variable that captures the yearly changes in equity net of annual
profits. Specifically:
, , ,
, (3)

28
where the numerator is a measure of the year over year increase in equity minus after-tax profits
for the year. To report annual percentage increases in equity relative to the pre-NID period, we
scale this variable by the level of equity in 2004 for both treatment and control firms. This measure
provides a lower bound on the post-reform increase in equity, net of the mechanical effects of the
NID on profits. As in the preceding tests, the results show that the decrease in leverage after 2006
is, at least partially, the result of active changes in firms’ financial policies.
The increase in equity ratios, however, may be explained by either an increase in retentions
(lower dividends) or by active equity issues. While the data does not allow us to identify new stock
issues, we can reject the null that firms did not issue any new equity after 2006. In particular, we
investigate whether retentions alone can explain the equity gains of Belgian firms. To this end, in
Table X, Panel B, Columns V and VI, we present a DiD test using the following dependent
variable:
, , , ,
, (4)
where the numerator is a measure of the increase in equity that cannot be explained by higher
retention rates. As such, it reflects active new issuance volumes. To report annual percentage
increases in equity relative to the pre-NID period, we again scale this variable by the level of equity
in 2004 for both treatment and control firms. Columns V and VI show that there was a significant
increase in new equity issues after 2006.
In sum, Table X highlights five results. First, the introduction of the NID is correlated with
significant increases in equity. Second, non-equity liabilities experience a minor decrease that
represents, at best, a small fraction of the increase in equity ratios. Third, leverage ratios declined
as both equity and total assets increased. Fourth, the equity increases exceeded the mechanical
windfall that resulted from the notional interest deduction. Fifth, the post-2006 increase in equity
was at least partially the result of active equity issuance decisions, and was not entirely explained
by higher retention ratios.

29
F. Interpretation
The evidence presented stresses the role that tax policy plays in shaping firms’ capital
structure decisions. The sharp and significant tax effects we report are at odds with the bulk of the
existing empirical studies, which fail to document significant consequences from changing tax
incentives on firms’ financing decisions (Myers, 1984; Graham, 2008).
In terms of inference, the Belgian NID is unique in that it drastically affected the tax rules
governing capital structure without introducing a long range of other confounding reforms that
commonly preclude identification. Furthermore, the fact that the reform was triggered by a ruling
by the European Commission, and was not initiated by challenging macroeconomic or fiscal
conditions in Belgium, bolsters the case for the plausibility of the NID as an exogenous source of
variation, and alleviates concerns that other concurrent trends may explain the findings.
An additional feature of the NID reform that may explain why we report both fast-
appearing and substantial financing effects is its simplicity. The tax incentives to rely on equity
financing imbedded in the NID are arguably clearer and more salient to owners and managers
alike. Intuitively, the higher the equity base, the lower the tax bill.
Lastly, the evidence demonstrates that reducing the tax-driven distortions that favor the use
of debt financing leads to more capitalized firms. Advocates of tax neutrality frequently make the
case for eliminating the tax deductibility of interest payments as the only viable alternative to
eliminate the debt bias in the existing tax systems. Yet, getting rid of this deduction is likely to
face substantial opposition by interest groups. Moreover, such proposal is challenging because
competing tax jurisdictions offer similar deductions, which reduces the relative attractiveness of
those countries or states that eliminate them. The evidence in this paper suggests that a notional
interest deduction may be an alternative plan to address these challenges.
30
V. Concluding Remarks
A central idea in corporate finance is that optimal capital structure should be strategically
arranged with the objective of maximizing the after-tax value of cash flows. Despite that widely-
held notion, there is scant evidence linking time series variation in tax provisions with changing
financing decisions (Myers, 1984; Graham, 2008).
In this paper, we exploit the introduction of the Notional Interest Deduction (NID) in
Belgium to identify the effect of taxes on financing decisions. Traditional tax systems allow firms
to deduct the value of interest payments but do not permit a similar charge for equity distributions.
The objective of the NID reform was to level the financing playing field faced by firms. Since
2006, the NID has allowed Belgian firms to also deduct an interest charge for equity. As a result,
and in sharp contrast to traditional tax incentives, firms’ marginal financing decisions are provided
with a significant tax deduction regardless of their source of financing.
Using the plausibly exogenous variation in the tax treatment of equity relative to debt that
results from the NID, and firm level data from Belgium and Belgium’s neighboring countries, we
demonstrate that capital structure responds drastically to changing tax incentives. We show that
both incumbent and new firms increase their equity ratios, and that large existing and new firms
are particularly aggressive in responding to the NID. Lastly, we show that these increases in equity
are explained by higher equity levels and not by a reduction in non-equity liabilities.
More broadly, the evidence highlights the potential role of fiscal policy in changing the
allocation of risk between different firms’ stakeholders. By inducing firms to use equity financing,
government policies can affect the likelihood that bondholders are repaid in bad states of the
economy. To the extent that firm default is associated with significant financial distress or social
costs, there is a potential role for fiscal policy to change private incentives at the firm level.
Conversely, government interventions that distort financing policies away from debt financing
may entail substantial efficiency costs. The recent financial crisis has emphasized the need to
understand the importance of these economic forces. Our paper contributes to the debate in the
literature by demonstrating that tax policy can substantially affect firms’ capital structure choices,
an issue that to this date has been subject to substantial debate.

31
References
An, Zhiyong. 2012. “Taxation and Capital Structure: Empirical Evidence from a Quasi-experiment in
China.” Journal of Corporate Finance, Vol. 18, pp: 683-689.
Auclert, Adrien and Daan Struyven. 2012. “ACE Hit: Does the Corporate Tax Bias Impact Leverage?” Working paper, Massachusetts Institute of Technology.
Berk, Jonathan, and Peter DeMarzo. 2010. Corporate Finance. Second Edition. Boston: Prentice Hall.
Bertrand, Marianne, Esther Duflo, and Sendhil Mullainathan. 2004. “How Much Should We Trust Differences-in-Differences Estimates?” The Quarterly Journal of Economics, Vol. 119, pp. 249-275.
van Binsbergen, Jules, John R. Graham, and Jie Yang. 2010. “The Cost of Debt.” The Journal of Finance, Vol. 65, pp. 2089-2136.
van Campenhout, Geert, and Tom Van Caneghem. 2013. “How Did the Notional Interest Deduction affect Belgian SMEs’ Capital Structure?” Small Business Economics, Vol. 40, 351-373.
Doidge, Craig and Alexander Dyck. 2012. “Taxes and Corporate Policies: Evidence from the Canadian Income Trust Market.” Working Paper, University of Toronto.
Boadway, Robin, and Neil Bruce. 1984. “A General Proposition on the Design of a Neutral Business Tax.” Journal of Public Economics, Vol. 24, pp. 231–39.
Bond, Stephen R., and Michael Devereux. 1995. “On the Design of a Neutral Business Tax Under Uncertainty.” Journal of Public Economics, Vol. 58, pp. 57–71.
Brealey, Richard, Stewart Myers, and Franklin Allen. 2010. Principles of Corporate Finance. 10th Edition. McGraw-Hill/Irwin.
Fama, Eugene F. 2011. “My Life in Finance.” Annual Review of Financial Economics, Vol. 3, pp. 1-5.
Faccio, Mara, and Jin Xu. 2011. “Taxes and Capital Structure.” Working Paper, Purdue University.
Givoly, D., C. Hahn, A. Ofer and O. H. Sarig. 1992. “Taxes and Capital Structure: Evidence from Firms’ Response to the Tax Reform Act of 1986.” Review of Financial Studies, Vol. 5, pp. 331–355.
Gordon, Roger H., and Jeffrey Mackie-Mason. 1991. “Effects of the Tax Reform Act of 1986 on Corporate Financial Policy and Organizational Form.” In Slemrod, Joel, ed.: Do Taxes Matter? The Impact of the Tax Reform Act of 1986, Cambridge, MA: MIT Press.
Graham, John R.. 1996a. “Debt and the Marginal Tax Rate.” Journal of Financial Economics, Vol. 41, pp. 41-73.
Graham, John R. 1996b. “Proxies for the Corporate Marginal Tax Rate.” Journal of Financial Economics, Vol. 42, pp. 187-221.
Graham, John R., Michael L. Lemmon, and James S. Schallheim. 1998. “Debt, Leases, Taxes, and the Endogeneity of Corporate Tax Status.” The Journal of Finance, Vol. 53, pp. 131-162.
Graham, John R. 1999. “Do Personal Taxes Affect Corporate Financing Decisions?” Journal of Public Economics, Vol. 73, pp. 147-185.
Graham, John R. 2000. “How Big are the Tax Benefits of Debt?” The Journal of Finance, Vol. 55, pp. 1901-1941.
Graham, John R. 2008. “Taxation Taxes and Corporate Finance.” in B. Espen Eckbo, ed.: Handbook of Corporate Finance: Empirical Corporate Finance, Amsterdam: North Holland.
Guiso, Luigi, Paolo Sapienza and Luigi Zingales. 2009. “Cultural Biases in Economic Exchange?” Quarterly Journal of Economics, Vol. 124, pp. 1095-1131.

32
Heckman, James J., Ichimura Hidehiko and Petra E. Todd. 1997. “Matching as an Econometric Evaluation Estimator: Evidence from Evaluating a Job Training Programme.” The Review of Economic Studies, Vol. 64, pp. 605-654.
Heider, Florian and Alexander Ljungqvist. 2012. “As Certain as Debt and Taxes: Estimating the Tax Sensitivity of Leverage from Exogenous State Tax Changes.” Working Paper, European Central Bank and New York University.
Institute For Fiscal Studies (IFS). 1991. “Equity for Companies: A Corporation Tax for the 1990s.” Commentary 26, London: Institute for Fiscal Studies.
Institute For Fiscal Studies (IFS). 2011. Tax by Design: The Mirrlees Review, New-York: Oxford University Press.
Jensen, Michael C., and William H. Meckling. 1976. “Theory of the Firm: Managerial Behavior, Agency Costs, and Ownership Structure.” Journal of Financial Economics, Vol. 3, pp. 305-360.
Kawano, L. and J. Slemrod. 2012. “The Effect of Tax Rates and Tax Bases on Corporate Tax Revenues: Estimates with New Measures of the Corporate Tax Base.” NBER Working Paper.
Kestens, Katrien, Philippe Van Cauwenberge, and Johan Christiaens. 2012. “An Investigation of the Effect of the Notional Interest Deduction on the Capital Structure of Belgian SMEs.” Unpublished Working Paper.
Klem, Alexander. 2006. “Allowances for Corporate Equity in Practice.” IMF Working Paper.
Leary, Mark T. and Roberts, Michael. R. 2005. “Do Firms Rebalance Their Capital Structures?” The Journal of Finance, Vol. 60, pp. 2575–2619.
Mackie-Mason, Jeffrey K. 1990. “Do Taxes Affect Corporate Financing Decisions?” The Journal of Finance, Vol. 45, pp. 1471-1493.
Miller, H. Merton. 1977. “Debt and Taxes.” The Journal of Finance, Vol. 32, pp. 261-275.
Mirrlees, James, Stuart Adam, Tim Besley, Richard Blundell, Stephen Bond, Robert Chote, Malcolm Gammie, Paul Johnson, Gareth Myles, and James Poterba. 2012. “The Mirrlees Review: a Proposal for Systematic Tax Reform.” National Tax Journal, Vol. 65, pp. 655-83.
Modigliani, Franco, and Merton H. Miller. 1958. “The Cost of Capital, Corporation Finance and the Theory of Investment.” American Economic Review, Vol. 48, pp. 261–297.
Modigliani, Franco, and Merton H. Miller. 1963. “Corporate Income Taxes and the Cost of Capital: A Correction.” American Economic Review, Vol. 53, pp. 433-443.
Myers, Stewart. 1984. “Capital Structure Puzzle.” The Journal of Finance, Vol. 39, pp. 574–592.
Princen, Savina. 2012. “Taxes of Affect Financing Decisions: The Case of Belgian ACE.” CESIFO Working Paper.
Rajan, Raghuram, and Luigi Zingales. 1995. “What Do We Know about Capital Structure? Some Evidence from International Data.” The Journal of Finance, Vol. 50, pp. 1421-1460.
Strebulaev, Ilya A. 2007. “Do Tests of Capital Structure Theory Mean What They Say?” The Journal of Finance, Vol. 62, pp. 1747–1787.
U.S. Department of Treasury. 2012. The President's Framework for Business Tax Reform. Washington, D.C.
Vincenty, Thaddeus. 1975. “Direct and Inverse Solutions of Geodesics on the Ellipsoid with Application of Nested Equations.” Survey Review, Vol. 23, pp. 88–93.

33
FIGURE 1. COMMON TRENDS: BELGIUM, FRANCE, GERMANY, LUXEMBOURG, AND THE NETHERLANDS These figures stress the tight economic links between Belgium and its four neighboring countries: France, Germany, Luxembourg, and the Netherlands. Panel A shows the rate of growth in gross domestic product (GDP) for the five countries. Data are from the European Commission’s EUROSTAT database (http://ec.europa.eu/eurostat). Between 2002 and 2009, the correlation coefficient between GDP growth in Belgium and in France, Germany, Luxembourg, and the Netherlands is 0.94, 0.90, 0.94, and 0.91, respectively. Panel B plots the rate of growth in revenue aggregated at the country level from a balanced panel of firms with non-missing revenue information for each year between 2001 and 2009. Source: author’s calculations based on data from the National Bank of Belgium and Bureau van Dijk’s AMADEUS database. Between 2002 and 2009, the correlation coefficient between revenue growth in Belgium and in France, Germany, Luxembourg, and the Netherlands is 0.98, 0.98, 0.85, and 0.83, respectively. PANEL A. GDP GROWTH
PANEL B. REVENUE GROWTH
‐6.00%
‐4.00%
‐2.00%
0.00%
2.00%
4.00%
6.00%
2002 2003 2004 2005 2006 2007 2008 2009
Belgium France Germany Luxembourg Netherlands
‐40.0%
‐30.0%
‐20.0%
‐10.0%
0.0%
10.0%
20.0%
2002 2003 2004 2005 2006 2007 2008 2009
Belgium France Germany Luxembourg Netherlands

34
FIGURE 2. AGGREGATE EQUITY-TO-TOTAL ASSETS RATIO IN BELGIUM This figure plots the annual aggregate equity-to-total assets ratio (in percent) for non-financial, non-utility Belgian firms with at least one million euros in total assets for one year between 2002 and 2009. Data are from the National Bank of Belgium’s Central Balance Sheet Office’s database, which reports financial information for all limited liability firms in Belgium. The equity-to-total assets ratio is defined as the ratio (in percent) of the yearly sum of the book value of shareholders’ equity (capitaux propres, code 10/15) to the annual sum of the book value of total assets (total de l'actif, code 20/58).

35
FIGURE 3. IDENTIFICATION STRATEGY These figures plot the evolution of the equity-to-total assets ratio at the firm (Panel A) and industry (Panel B) levels in Belgium relative to its neighboring countries. Data from Belgium’s neighboring countries are used as a control group to evaluate the impact of the NID on equity ratios. The bold line plots the estimated coefficient of the average difference in equity ratios between Belgium and the control countries for each year between 2002 and 2009. The 95% upper and lower standard error bands are plotted using dotted lines. Panel A presents results using firm level data from the National Bank of Belgium’s Central Balance Sheet Office’s database (Belgium) and Bureau van Dijk’s (BvD) AMADEUS database (France, Germany, Luxembourg, and the Netherlands); the analysis focuses on non-financial, non-utility firms with total assets of at least €5 million for at least one year during the 2002 to 2009 period (68,017 firms); standard errors are clustered at the country level. Panel B shows results using industry level data from the European Committee on Central Balance-Sheet Data Offices’ Bank for the Accounts of Companies Harmonised (BACH) database (http://www.bachesd.banque-france.fr); the analysis focuses on every two-digit (NACE, Rev. 2) manufacturing, wholesale and retail industry with available financial data for every year in the 2002 to 2009 period (23 industries and 92 annual observations) from Belgium, France, Germany, and the Netherlands (data from Luxembourg is not available); standard errors are clustered at the country-industry level. PANEL A. FIRM LEVEL ANALYSIS
PANEL B. INDUSTRY LEVEL ANALYSIS
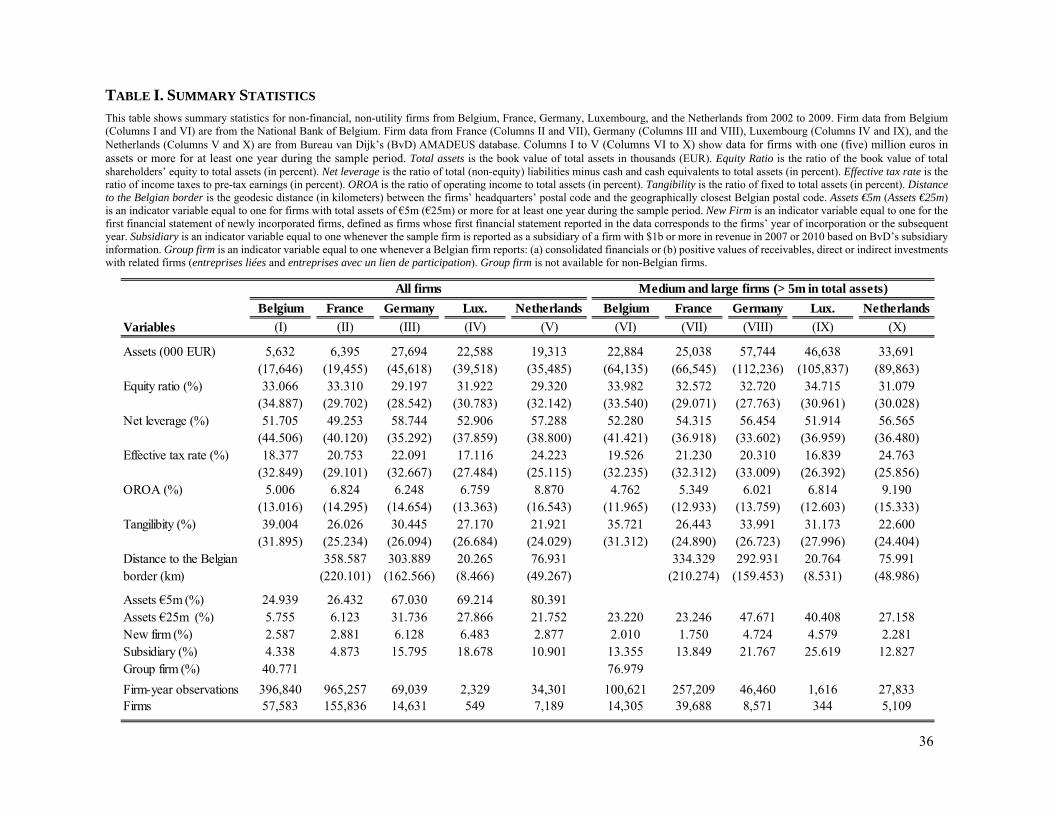
36
TABLE I. SUMMARY STATISTICS
This table shows summary statistics for non-financial, non-utility firms from Belgium, France, Germany, Luxembourg, and the Netherlands from 2002 to 2009. Firm data from Belgium (Columns I and VI) are from the National Bank of Belgium. Firm data from France (Columns II and VII), Germany (Columns III and VIII), Luxembourg (Columns IV and IX), and the Netherlands (Columns V and X) are from Bureau van Dijk’s (BvD) AMADEUS database. Columns I to V (Columns VI to X) show data for firms with one (five) million euros in assets or more for at least one year during the sample period. Total assets is the book value of total assets in thousands (EUR). Equity Ratio is the ratio of the book value of total shareholders’ equity to total assets (in percent). Net leverage is the ratio of total (non-equity) liabilities minus cash and cash equivalents to total assets (in percent). Effective tax rate is the ratio of income taxes to pre-tax earnings (in percent). OROA is the ratio of operating income to total assets (in percent). Tangibility is the ratio of fixed to total assets (in percent). Distance to the Belgian border is the geodesic distance (in kilometers) between the firms’ headquarters’ postal code and the geographically closest Belgian postal code. Assets €5m (Assets €25m) is an indicator variable equal to one for firms with total assets of €5m (€25m) or more for at least one year during the sample period. New Firm is an indicator variable equal to one for the first financial statement of newly incorporated firms, defined as firms whose first financial statement reported in the data corresponds to the firms’ year of incorporation or the subsequent year. Subsidiary is an indicator variable equal to one whenever the sample firm is reported as a subsidiary of a firm with $1b or more in revenue in 2007 or 2010 based on BvD’s subsidiary information. Group firm is an indicator variable equal to one whenever a Belgian firm reports: (a) consolidated financials or (b) positive values of receivables, direct or indirect investments with related firms (entreprises liées and entreprises avec un lien de participation). Group firm is not available for non-Belgian firms.
Belgium France Germany Lux. Netherlands Belgium France Germany Lux. Netherlands
Variables (I) (II) (III) (IV) (V) (VI) (VII) (VIII) (IX) (X)
Assets (000 EUR) 5,632 6,395 27,694 22,588 19,313 22,884 25,038 57,744 46,638 33,691(17,646) (19,455) (45,618) (39,518) (35,485) (64,135) (66,545) (112,236) (105,837) (89,863)
Equity ratio (%) 33.066 33.310 29.197 31.922 29.320 33.982 32.572 32.720 34.715 31.079(34.887) (29.702) (28.542) (30.783) (32.142) (33.540) (29.071) (27.763) (30.961) (30.028)
Net leverage (%) 51.705 49.253 58.744 52.906 57.288 52.280 54.315 56.454 51.914 56.565(44.506) (40.120) (35.292) (37.859) (38.800) (41.421) (36.918) (33.602) (36.959) (36.480)
Effective tax rate (%) 18.377 20.753 22.091 17.116 24.223 19.526 21.230 20.310 16.839 24.763(32.849) (29.101) (32.667) (27.484) (25.115) (32.235) (32.312) (33.009) (26.392) (25.856)
OROA (%) 5.006 6.824 6.248 6.759 8.870 4.762 5.349 6.021 6.814 9.190(13.016) (14.295) (14.654) (13.363) (16.543) (11.965) (12.933) (13.759) (12.603) (15.333)
Tangilibity (%) 39.004 26.026 30.445 27.170 21.921 35.721 26.443 33.991 31.173 22.600(31.895) (25.234) (26.094) (26.684) (24.029) (31.312) (24.890) (26.723) (27.996) (24.404)
Distance to the Belgian 358.587 303.889 20.265 76.931 334.329 292.931 20.764 75.991border (km) (220.101) (162.566) (8.466) (49.267) (210.274) (159.453) (8.531) (48.986)
Assets €5m (%) 24.939 26.432 67.030 69.214 80.391Assets €25m (%) 5.755 6.123 31.736 27.866 21.752 23.220 23.246 47.671 40.408 27.158New firm (%) 2.587 2.881 6.128 6.483 2.877 2.010 1.750 4.724 4.579 2.281Subsidiary (%) 4.338 4.873 15.795 18.678 10.901 13.355 13.849 21.767 25.619 12.827Group firm (%) 40.771 76.979
Firm-year observations 396,840 965,257 69,039 2,329 34,301 100,621 257,209 46,460 1,616 27,833Firms 57,583 155,836 14,631 549 7,189 14,305 39,688 8,571 344 5,109
All firms Medium and large firms (> 5m in total assets)

37
TABLE II. CORPORATE AND PERSONAL INCOME TAX RATES This table shows the maximum statutory corporate and personal income tax rates in Belgium (Panel A), France (B), Germany (C), Luxembourg (D), and the Netherlands (E) between 2002 and 2009. Corporate income tax (CIT) rates are shown in Column I. We report the maximum statutory tax rates on dividend income (Column II), interest income (Column III), and capital gains (Column IV). Whenever relevant, we show the highest marginal tax rate applicable to substantial shareholdings. In Columns V and VI we report two ratios that
seek to capture the Miller (1977) gain from leverage expression: 1 , where , , and are the corporate income
tax and personal income tax rates applicable to income from common stock and bonds, respectively. Miller’s ratio 1 (2) assumes that is the top dividend income (capital gains) tax rate. Data are from the OECD (http://oecd.org/ctp/taxdatabase) and from the tax authorities of the individual countries.
Country Year CIT Dividend Interest Capital Gains M. Ratio 1 M. Ratio 2
(I) (II) (III) (IV) (V) (VI)
A. Belgium 2002 40.2% 15.0% 15.0% 0.0% 40.2% 29.6%2003 34.0% 15.0% 15.0% 0.0% 34.0% 22.3%2004 34.0% 15.0% 15.0% 0.0% 34.0% 22.3%2005 34.0% 15.0% 15.0% 0.0% 34.0% 22.3%2006 34.0% 15.0% 15.0% 0.0% 34.0% 22.3%2007 34.0% 15.0% 15.0% 0.0% 34.0% 22.3%2008 34.0% 15.0% 15.0% 0.0% 34.0% 22.3%2009 34.0% 15.0% 15.0% 0.0% 34.0% 22.3%
B. France 2002 35.4% 35.6% 25.0% 25.0% 44.5% 35.4%2003 35.4% 33.5% 25.0% 25.0% 42.7% 35.4%2004 35.4% 33.9% 26.5% 26.5% 41.9% 35.4%2005 34.9% 32.3% 27.0% 27.0% 39.6% 34.9%2006 34.4% 32.7% 27.0% 27.0% 39.5% 34.4%2007 34.4% 32.7% 27.0% 27.0% 39.5% 34.4%2008 34.4% 32.7% 29.0% 29.0% 37.8% 34.4%2009 34.4% 32.7% 30.7% 30.7% 36.3% 34.4%
C. Germany 2002 38.9% 25.6% 51.2% 25.6% 6.8% 6.8%2003 40.2% 25.6% 51.2% 25.6% 8.8% 8.8%2004 38.9% 23.7% 47.5% 23.7% 11.2% 11.2%2005 38.9% 22.2% 44.3% 22.2% 14.7% 14.7%2006 38.9% 22.2% 44.3% 22.2% 14.7% 14.7%2007 38.9% 23.7% 47.5% 23.7% 11.2% 11.2%2008 30.2% 26.4% 47.5% 23.7% 2.1% -1.5%2009 30.2% 26.4% 26.4% 26.4% 30.2% 30.2%
D. Luxembourg 2002 30.4% 19.5% 39.6% 19.8% 7.2% 7.6%2003 30.4% 19.5% 39.6% 19.8% 7.2% 7.6%2004 30.4% 19.5% 39.0% 19.5% 8.2% 8.2%2005 30.4% 19.5% 39.0% 19.5% 8.2% 8.2%2006 30.4% 19.5% 10.0% 19.5% 37.7% 37.7%2007 30.4% 19.5% 10.0% 19.5% 37.7% 37.7%2008 30.4% 19.5% 10.0% 19.5% 37.7% 37.7%2009 28.6% 19.5% 10.0% 19.5% 36.1% 36.1%
E. Netherlands 2002 34.5% 25.0% 30.0% 25.0% 29.8% 29.8%2003 34.5% 25.0% 30.0% 25.0% 29.8% 29.8%2004 34.5% 25.0% 30.0% 25.0% 29.8% 29.8%2005 31.5% 25.0% 30.0% 25.0% 26.6% 26.6%2006 29.6% 25.0% 30.0% 25.0% 24.6% 24.6%2007 25.5% 22.0% 30.0% 25.0% 17.0% 20.2%2008 25.5% 25.0% 30.0% 25.0% 20.2% 20.2%2009 25.5% 25.0% 30.0% 25.0% 20.2% 20.2%

38
TABLE III. EQUITY SUBSIDIES AND CAPITAL STRUCTURE: FIRM LEVEL ANALYSIS
This table examines the impact of the notional interest deduction (NID) tax provision on the capital structure decisions of: (a) medium and large, and (b) small firms in Belgium, using a difference-in-differences (DiD) methodology. The NID became effective in 2006. Firms in France, Germany, Luxembourg, and the Netherlands are used as a control group for Belgian firms. Capital structure ratios are computed using the book equity-to-total assets ratio (in percent). Medium and large firms (Columns I to V) are those with total assets of €5m or more for at least one year during the sample period, small (Columns VI to X) otherwise. Columns I and VI (Columns III and VIII) report equity-to-total assets ratios for firms in Belgium (control countries). Columns V and X show the average difference in equity-to-total assets ratios between Belgian and control firms. Columns II, IV, VII and IX report the number of observations in squared brackets. Panel A (B) shows yearly (biennial) average equity-to-total assets ratios (in percent). Panel C reports average difference (Columns I, III, VI and VIII) and DiD estimates (Columns V and X) for alternative subsamples. Standard errors clustered at the firm (country) level are shown in parentheses in Columns I, III, VI and VIII (Columns V and X). ***, **, and * denote significance at the 1%, 5%, and 10% level, respectively.
2002 30.615 30.945 -0.330 31.428 31.219 0.209(0.286) (0.135) (0.776) (0.176) (0.093) (1.029)
2003 31.432 31.656 -0.224 31.753 31.855 -0.102(0.294) (0.139) (0.404) (0.180) (0.096) (0.842)
2004 32.067 31.929 0.137 32.040 32.575 -0.535(0.297) (0.142) (0.306) (0.181) (0.096) (0.640)
2005 32.560 32.147 0.413 32.392 32.812 -0.421(0.302) (0.143) (0.260) (0.181) (0.097) (0.577)
2006 34.098 32.263 1.835 *** 32.959 32.975 -0.016(0.306) (0.143) (0.186) (0.181) (0.098) (0.481)
2007 35.490 32.616 2.874 *** 33.507 33.686 -0.179(0.306) (0.145) (0.093) (0.182) (0.098) (0.436)
2008 36.394 33.071 3.323 *** 33.819 34.353 -0.533(0.315) (0.149) (0.219) (0.185) (0.100) (0.487)
2009 37.589 34.673 2.916 *** 34.427 36.021 -1.594 **
(0.326) (0.161) (0.431) (0.192) (0.108) (0.419)
2002-2003 31.025 31.297 -0.272 31.591 31.535 0.056(0.277) (0.129) (0.593) (0.171) (0.089) (0.937)
2004-2005 32.314 32.039 0.276 32.217 32.695 -0.477(0.287) (0.134) (0.281) (0.173) (0.091) (0.608)
2006-2007 34.796 32.438 2.358 *** 33.235 33.331 -0.095(0.292) (0.135) (0.120) (0.174) (0.092) (0.460)
2008-2009 36.986 33.841 3.144 *** 34.122 35.158 -1.035 *
(0.308) (0.145) (0.320) (0.181) (0.098) (0.457)
Panel C. Differences and difference-in-differences by groups of years
2004-2005 vs 2002-2003 1.289 *** 0.742 *** 0.547 0.626 *** 1.159 *** -0.533(0.189) (0.094) (0.445) (0.109) (0.064) (0.329)
2006-2007 vs 2002-2003 3.771 *** 1.142 *** 2.630 ** 1.644 *** 1.795 *** -0.151(0.258) (0.123) (0.637) (0.150) (0.084) (0.480)
2006-2007 vs 2004-2005 2.482 *** 0.400 *** 2.082 *** 1.018 *** 0.636 *** 0.382 *
(0.196) (0.098) (0.246) (0.111) (0.065) (0.153)2006-2009 vs 2002-2005 4.211 *** 1.451 *** 2.760 *** 1.772 *** 2.107 *** -0.335
(0.221) (0.105) (0.567) (0.128) (0.070) (0.322)
Panel B. Means by groups of years
[12,302]
[12,425]
[12,500]
[12,610]
[12,719]
[12,808]
[12,744]
[12,513]
(I) (II) (III) (IV)
Panel A. Yearly averages
Medium and large firms Small firms
Belgium Controls Difference Belgium Controls Difference
[24,727]
[25,110]
[25,527]
[25,257]
[49,837]
[50,254]
[50,637]
[100,621]
[43,658]
[42,808]
[41,935]
[42,358]
[42,371]
[41,833]
[40,561]
[37,594]
[86,466]
[84,293]
[84,204]
[78,155]
[170,759]
[170,670]
[168,497]
[333,118]
[35,294]
[35,831]
[36,380]
[36,918]
[37,505]
[38,043]
[38,260]
[37,988]
[71,125]
[73,298]
[75,548]
[76,248]
[86,115]
[185,983]
[186,158]
[187,211]
[372,141]
[92,544]
[93,614]
[93,682]
[93,529]
[92,341]
(V) (X)
[373,194]
[373,369]
[737,808]
[178,456]
(VI) (VII) (VIII) (IX)
[144,423]
[146,673]
[148,846]
[296,219]
[93,453]
[92,530]

39
TABLE IV. EQUITY SUBSIDIES AND CAPITAL STRUCTURE: INDUSTRY LEVEL ANALYSIS
This table examines the impact of the notional interest deduction tax provision on equity-to-total assets ratios (in percent) at the industry level in Belgium (treatment), relative to France, Germany, and the Netherlands (control group). The analysis focuses on a balanced panel of two-digit (NACE, Rev. 2) manufacturing, wholesale and retail industries with available financial data for every year in the 2002 to 2009 period (23 industries per country) in the European BACH database (data from Luxembourg is not available). Columns I and III show, respectively, equity-to-total assets ratios for Belgium and control industries. Column V reports the average difference between Belgian and control industries. Columns II and IV report the number of observations in squared brackets. Panel A (B) shows yearly (biennial) average equity-to-total assets ratios (in percent). Panel C reports average difference (Columns I and III) and DiD estimates (Column V) for alternative subsamples. Standard errors clustered at the country-industry level are shown in parentheses. ***, **, and * denote significance at the 1%, 5%, and 10% level, respectively.
Difference
(I) (II) (III) (IV) (V)
2002 34.347 33.882 0.465
(1.435) [23] (1.077) [69] (1.784)
2003 36.214 35.060 1.154
(1.832) [23] (1.047) [69] (2.094)
2004 36.540 35.476 1.064
(1.786) [23] (1.041) [69] (2.052)
2005 37.341 35.702 1.638
(1.771) [23] (1.203) [69] (2.127)
2006 41.190 37.001 4.189 *
(1.925) [23] (1.381) [69] (2.354)
2007 44.624 37.657 6.968 ***
(2.193) [23] (1.361) [69] (2.563)
2008 43.826 36.638 7.188 **
(2.558) [23] (1.261) [69] (2.829)
2009 45.716 38.408 7.308 ***
(2.012) [23] (1.339) [69] (2.401)
2002-2003 35.281 34.471 0.810
(1.562) [46] (1.048) [138] (1.864)
2004-2005 36.941 35.589 1.351
(1.745) [46] (1.089) [138] (2.037)
2006-2007 42.907 37.329 5.578 **
(1.999) [46] (1.292) [138] (2.357)
2008-2009 44.771 37.523 7.248 ***
(2.153) [46] (1.223) [138] (2.451)
Panel C. Differences and difference-in-differences by groups of years
2004-2005 vs 2002-2003 1.660 ** 1.118 *** 0.542
(0.767) [92] (0.408) [276] (0.857)
2006-2007 vs 2002-2003 7.626 *** 2.858 *** 4.769 ***
(1.431) [92] (0.827) [276] (1.630)
2006-2007 vs 2004-2005 5.967 *** 1.740 ** 4.227 **
(1.460) [92] (0.752) [276] (1.619)
2006-2009 vs 2002-2005 7.728 *** 2.396 *** 5.333 ***
(1.548) [184] (0.764) [552] (1.702)
Panel A. Yearly averages
Panel B. Means by groups of years
Control countriesBelgium
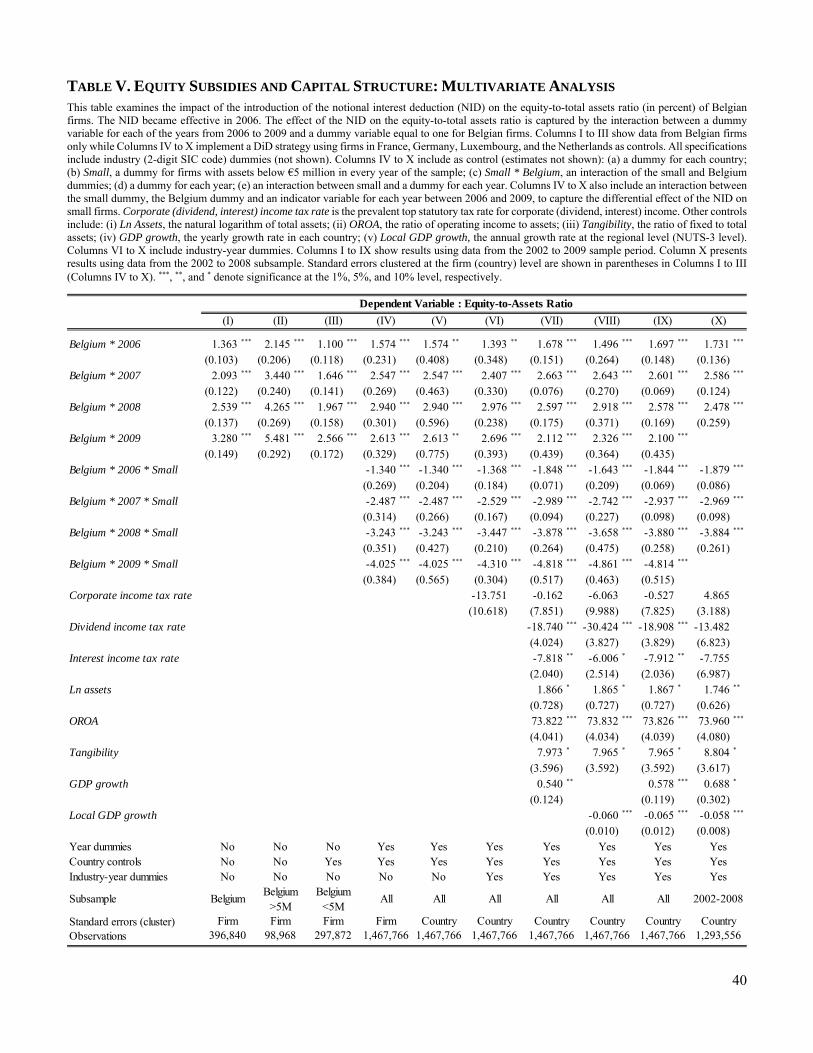
40
TABLE V. EQUITY SUBSIDIES AND CAPITAL STRUCTURE: MULTIVARIATE ANALYSIS
This table examines the impact of the introduction of the notional interest deduction (NID) on the equity-to-total assets ratio (in percent) of Belgian firms. The NID became effective in 2006. The effect of the NID on the equity-to-total assets ratio is captured by the interaction between a dummy variable for each of the years from 2006 to 2009 and a dummy variable equal to one for Belgian firms. Columns I to III show data from Belgian firms only while Columns IV to X implement a DiD strategy using firms in France, Germany, Luxembourg, and the Netherlands as controls. All specifications include industry (2-digit SIC code) dummies (not shown). Columns IV to X include as control (estimates not shown): (a) a dummy for each country; (b) Small, a dummy for firms with assets below €5 million in every year of the sample; (c) Small * Belgium, an interaction of the small and Belgium dummies; (d) a dummy for each year; (e) an interaction between small and a dummy for each year. Columns IV to X also include an interaction between the small dummy, the Belgium dummy and an indicator variable for each year between 2006 and 2009, to capture the differential effect of the NID on small firms. Corporate (dividend, interest) income tax rate is the prevalent top statutory tax rate for corporate (dividend, interest) income. Other controls include: (i) Ln Assets, the natural logarithm of total assets; (ii) OROA, the ratio of operating income to assets; (iii) Tangibility, the ratio of fixed to total assets; (iv) GDP growth, the yearly growth rate in each country; (v) Local GDP growth, the annual growth rate at the regional level (NUTS-3 level). Columns VI to X include industry-year dummies. Columns I to IX show results using data from the 2002 to 2009 sample period. Column X presents results using data from the 2002 to 2008 subsample. Standard errors clustered at the firm (country) level are shown in parentheses in Columns I to III (Columns IV to X). ***, **, and * denote significance at the 1%, 5%, and 10% level, respectively.
Belgium * 2006 1.363 *** 2.145 *** 1.100 *** 1.574 *** 1.574 ** 1.393 ** 1.678 *** 1.496 *** 1.697 *** 1.731 ***
(0.103) (0.206) (0.118) (0.231) (0.408) (0.348) (0.151) (0.264) (0.148) (0.136)Belgium * 2007 2.093 *** 3.440 *** 1.646 *** 2.547 *** 2.547 *** 2.407 *** 2.663 *** 2.643 *** 2.601 *** 2.586 ***
(0.122) (0.240) (0.141) (0.269) (0.463) (0.330) (0.076) (0.270) (0.069) (0.124)Belgium * 2008 2.539 *** 4.265 *** 1.967 *** 2.940 *** 2.940 *** 2.976 *** 2.597 *** 2.918 *** 2.578 *** 2.478 ***
(0.137) (0.269) (0.158) (0.301) (0.596) (0.238) (0.175) (0.371) (0.169) (0.259)Belgium * 2009 3.280 *** 5.481 *** 2.566 *** 2.613 *** 2.613 ** 2.696 *** 2.112 *** 2.326 *** 2.100 ***
(0.149) (0.292) (0.172) (0.329) (0.775) (0.393) (0.439) (0.364) (0.435)Belgium * 2006 * Small -1.340 *** -1.340 *** -1.368 *** -1.848 *** -1.643 *** -1.844 *** -1.879 ***
(0.269) (0.204) (0.184) (0.071) (0.209) (0.069) (0.086)Belgium * 2007 * Small -2.487 *** -2.487 *** -2.529 *** -2.989 *** -2.742 *** -2.937 *** -2.969 ***
(0.314) (0.266) (0.167) (0.094) (0.227) (0.098) (0.098)Belgium * 2008 * Small -3.243 *** -3.243 *** -3.447 *** -3.878 *** -3.658 *** -3.880 *** -3.884 ***
(0.351) (0.427) (0.210) (0.264) (0.475) (0.258) (0.261)Belgium * 2009 * Small -4.025 *** -4.025 *** -4.310 *** -4.818 *** -4.861 *** -4.814 ***
(0.384) (0.565) (0.304) (0.517) (0.463) (0.515)Corporate income tax rate -13.751 -0.162 -6.063 -0.527 4.865
(10.618) (7.851) (9.988) (7.825) (3.188)Dividend income tax rate -18.740 *** -30.424 *** -18.908 *** -13.482
(4.024) (3.827) (3.829) (6.823)Interest income tax rate -7.818 ** -6.006 * -7.912 ** -7.755
(2.040) (2.514) (2.036) (6.987)Ln assets 1.866 * 1.865 * 1.867 * 1.746 **
(0.728) (0.727) (0.727) (0.626)OROA 73.822 *** 73.832 *** 73.826 *** 73.960 ***
(4.041) (4.034) (4.039) (4.080)Tangibility 7.973 * 7.965 * 7.965 * 8.804 *
(3.596) (3.592) (3.592) (3.617)GDP growth 0.540 ** 0.578 *** 0.688 *
(0.124) (0.119) (0.302)Local GDP growth -0.060 *** -0.065 *** -0.058 ***
(0.010) (0.012) (0.008)Year dummiesCountry controls Industry-year dummies
Standard errors (cluster)Observations
Subsample
Dependent Variable : Equity-to-Assets Ratio
(X)
YesYesYes
2002-2008All<5M
BelgiumBelgium
>5MBelgium
All All All
Country1,293,5561,467,766 1,467,766
(IX)
YesYesYes
All
Country Country
Yes
Yes
(VIII)
Country1,467,766396,840 98,968 297,872 1,467,766 1,467,766 1,467,766
Firm Firm Firm Firm Country Country
All
YesNo No No No No Yes YesNo No Yes Yes Yes Yes Yes
Yes YesNo No No Yes Yes
(VI) (VII)(I) (II) (III) (IV) (V)

41
TABLE VI. NET LEVERAGE AND TAX LIABILITIES
This table examines the impact of the introduction of the NID on net leverage and effective tax rate of Belgian firms. The dependent variables are: (1) net leverage, the value of total (non-equity) liabilities minus cash and cash equivalents over total assets (Columns I to V), and (2) effective tax rate: the ratio of income taxes to pre-tax earnings (Columns VI to X). The effect of the NID is captured by the interaction between a dummy variable for each of the years from 2006 to 2009 and a dummy variable equal to one for Belgian firms. Columns I and VI show data from Belgian firms only while Columns II to V and VII to X implement a DiD strategy using firms in France, Germany, Luxembourg, and the Netherlands as controls. All specifications include industry (2-digit SIC code) dummies and Small, a dummy for firms with assets below €5 million in every year of the sample (not shown). Columns II to V and VII to X include as control (estimates not shown): (a) a dummy for each country; (b) Small * Belgium, an interaction of the small and Belgium dummies; (d) a dummy for each year; (e) an interaction between the small dummy and an indicator variable for each year. An interaction between the small dummy, the Belgium dummy and an indicator variable for each year between 2006 and 2009 captures the differential effect of the NID on small firms. Corporate (dividend, interest) income tax rate is the prevalent top statutory tax rate for corporate (dividend, interest) income. Other controls include: (i) Ln Assets, the natural logarithm of total assets; (ii) OROA, the ratio of operating income to assets; (iii) Tangibility, the ratio of fixed to total assets; (iv) GDP growth, the yearly growth rate in each country; (v) Local GDP growth, the annual growth rate at the regional level (NUTS-3 level). Columns III to V and VIII to X include industry-year dummies. Columns I to IV and VI to IX show results using data from the 2002 to 2009 sample period. Columns V and X present results using data from the 2002 to 2008 subsample. Standard errors clustered at the firm (country) level are shown in parentheses in Columns I and VI (Columns II to V and VI to X). ***, **, and * denote significance at the 1%, 5%, and 10% level, respectively.
Belgium * 2006 -2.932 *** -2.252 *** -2.151 *** -2.200 *** -2.195 *** -2.712 *** -1.798 ** -1.791 ** -2.068 *** -2.103 ***
(0.252) (0.454) (0.394) (0.185) (0.194) (0.192) (0.399) (0.452) (0.145) (0.166)Belgium * 2007 -4.677 *** -3.721 *** -3.649 *** -3.801 *** -3.752 *** -4.524 *** -3.449 *** -3.384 *** -3.471 *** -3.478 ***
(0.297) (0.423) (0.330) (0.141) (0.150) (0.195) (0.473) (0.527) (0.258) (0.311)Belgium * 2008 -5.161 *** -4.014 *** -3.894 *** -3.656 *** -3.538 *** -6.166 *** -4.119 *** -3.969 ** -4.346 *** -4.344 ***
(0.328) (0.696) (0.538) (0.168) (0.288) (0.208) (0.838) (0.895) (0.487) (0.526)Belgium * 2009 -7.209 *** -3.411 ** -3.377 *** -2.846 *** -8.407 *** -5.279 *** -5.185 *** -5.954 ***
(0.352) (0.911) (0.715) (0.278) (0.209) (0.660) (0.670) (0.265)Belg. * 2006 * Small 0.897 *** 1.564 *** 1.601 *** 2.121 *** 2.154 *** 0.081 -0.116 -0.145 0.046 0.051
(0.294) (0.243) (0.228) (0.082) (0.108) (0.224) (0.330) (0.344) (0.079) (0.076)Belg. * 2007 * Small 1.973 *** 3.223 *** 3.234 *** 3.651 *** 3.657 *** 1.313 *** 0.609 0.600 0.991 *** 0.999 ***
(0.347) (0.222) (0.211) (0.115) (0.113) (0.230) (0.394) (0.382) (0.166) (0.188)Belg. * 2008 * Small 2.348 *** 3.854 *** 3.871 *** 4.415 *** 4.431 *** 2.083 *** 1.136 1.146 1.986 ** 1.982 ***
(0.383) (0.528) (0.493) (0.344) (0.335) (0.243) (0.612) (0.612) (0.440) (0.430)Belg. * 2009 * Small 3.375 *** 4.928 *** 5.092 *** 5.855 *** 2.549 *** 1.477 ** 1.483 ** 1.943 ***
(0.411) (0.720) (0.638) (0.471) (0.246) (0.466) (0.457) (0.294)Corporate income tax rate -4.393 -7.802 ** 46.743 *** 45.120 ***
(5.196) (2.482) (6.297) (4.971)Dividend income tax rate 8.912 ** 12.373 1.925 -0.294
(2.313) (11.270) (1.909) (4.717)Interest income tax rate 15.345 * 11.602 -5.579 -7.174
(6.879) (6.405) (17.888) (18.666)Ln Assets 0.222 0.364 1.598 ** 1.602 **
(1.102) (1.003) (0.381) (0.392)OROA -96.656 *** -96.713 *** 42.478 *** 42.718 ***
(6.830) (6.920) (2.333) (2.146)Tangibility 15.862 *** 14.704 *** -7.425 *** -7.588 ***
(2.779) (2.857) (0.414) (0.598)GDP growth -0.432 *** -0.453 ** -0.622 *** -0.698 ***
(0.089) (0.161) (0.088) (0.025)Local GDP growth 0.057 *** 0.068 *** -0.031 *** -0.028 ***
(0.006) (0.011) (0.004) (0.003)Year dummiesCountry controls Industry-year dummiesSub-sampleStandard errors (cluster)Observations
(IX)
YesYesYes
(X)
YesYesYes
Country1,467,766
2002-2008Country
1,293,556
AllCountry
1,467,7661,467,766Firm Country Country
1,293,556Country
All
YesYesYesAll
YesYesYes
2002-2008Yes
Belgium All All
No Yes YesNo
No
396,840 1,467,766 1,467,766 396,840 1,467,766Firm Country Country
No NoBelgium All
Yes YesNo Yes Yes
Effective Tax RateNet Leverage
No No YesYes Yes
(I) (II) (III) (VI) (VII) (VIII)(V)(IV)

42
TABLE VII. CAPITAL STRUCTURE AND TAX INCENTIVES: ROBUSTNESS TESTS This table examines the robustness of the decline in leverage that followed the introduction of the NID tax provision in Belgium in 2006 to alternative specifications and subsamples. The analysis focuses on firms with assets of €5 million or more in at least one year between 2002 and 2009. The dependent variable is net leverage: the ratio of total (non-equity) liabilities minus cash and cash equivalents over total assets (in percent). The effect of the NID is captured by a dummy variable equal to one for all firms in Belgium after 2006, zero otherwise. All specifications include country and industry-year dummies as well as controls for the prevalent top statutory tax rates on corporate, dividend and interest income (not shown) except for Panel B (v) that does not include the interest and dividend income tax rates as controls, Panel B (vi) that does not include any tax control and Panel D (v, vi) that are the result of a different estimation method as explained in Appendix A1. Panel A reports results from the following specifications: (i) a benchmark model, (ii) a specification with country-industry (2-digit SIC code) clustered (240 clusters) standard errors, (iii) a specification that includes size-year dummies for each percentile of the distribution of total assets, (iv) a test that also controls for the capital gains tax rate, (v) a test that includes a Miller ratio control (Miller ratio 1), which assumes that the relevant tax for equity is the dividend income tax rate, and (vi) a specification that includes a Miller ratio control (Miller ratio 2) that assumes that the relevant tax for equity is the capital gains tax rate. Panel B presents results for: (i) the sample of firms incorporated in Belgium and those in the control countries that are within 250 km from the Belgian borders, (ii) the sample of firms incorporated in Belgium and those in the control countries that are within 100 km from the Belgian borders, (iii) a specification that only focuses on firms with assets of €25 million or more for at least one year but less than €100 million in every year of the sample, (iv) a specification with firms with assets of €100 million or more in at least one year of the sample, (v) a specification that includes all firms located in any country included in Bureau Van Dyck’s AMADEUS database, and (vi) a specification that includes all publicly traded firms reported in Bureau Van Dyck’s OSIRIS database. Panel C shows results from specifications excluding observations from: (i) France, (ii) Germany, (iii) Luxembourg, (iv) the Netherlands, (v) Germanic (Dutch and German) speaking regions of Belgium and the control countries, and (vi) French speaking regions of Belgium and the control countries. Panel D shows results from: (i) a quantile (median) regression, (ii) a specification that winsorizes net debt to be smaller in absolute values than total assets, (iii) a specification that winsorizes net leverage at the 5th and 95th percentile values, (iv) a specification that includes a country specific trend control, (v) a matching DiD estimator that compares each Belgian firm to a single control firm based on industry, assets, profitability and tangibility as explained in Appendix A1, and (vi) a matching DiD estimator restricted to the 50% subsample of firms for which the closest matches were found. Each estimated coefficient represents a separate regression. Standard errors (shown in parenthesis) are clustered at the country level, except for Panel D (i) which shows bootstrapped standard errors at the firm level, and Panel D (v and vi) which report clustered standard errors at the firm level. ***, **, and * denote significance at the 1%, 5%, and 10% level, respectively.
Panel A. Alternative standard errors and controls Panel B. Alternative samples
(i) Benchmark -3.591 *** (i) Distance < 250 km to the Belgian -3.451 ***
(0.140) border (0.222)(ii) Clustering: country-SIC2 level -3.591 *** (ii) Distance < 100 km to the Belgian -3.140 ***
(0.435) border (0.485)(iii) Assets percentile-year dummies -4.030 *** (iii) Size: 25m < assets < 100m -4.370 ***
(0.184) (0.151)(iv) Capital gains tax rates -2.619 *** (iv) Size: assets > 100m -8.879 ***
(0.046) (0.564)(v) Miller ratio 1 -3.358 *** (v) Firms from all countries in the Amadeus -4.571 ***
(0.361) database (0.548)(vi) Miller ratio 2 -3.446 *** (vi) Publicly traded firms from all countries in -4.292 ***
(0.427) the Osiris database (0.633)
Panel C. Omitting one subsample at a time Panel D. Alternative specifications(i) France -2.227 *** (i) Median (quantile) regression -3.175 ***
(0.345) (0.433)(ii) Germany -3.361 *** (ii) Alternative winsorizing: | net debt | < assets -3.694 ***
(0.253) (0.154)(iii) Luxembourg -3.541 *** (iii) Alternative winsorizing: at the 5%, 95% -2.934 ***
(0.151) levels (0.117)(iv) Netherlands -3.505 *** (iv) Country specific trends -2.447 ***
(0.162) (0.451)(v) Germanic regions -2.127 *** (v) Matching DiD: all matches -2.557 ***
(0.106) (0.403)(vi) French regions -2.763 *** (vi) Matching DiD: close matches only -2.233 ***
(0.304) (0.486)
Robustness testEstimated coefficient
Robustness testEstimated coefficient
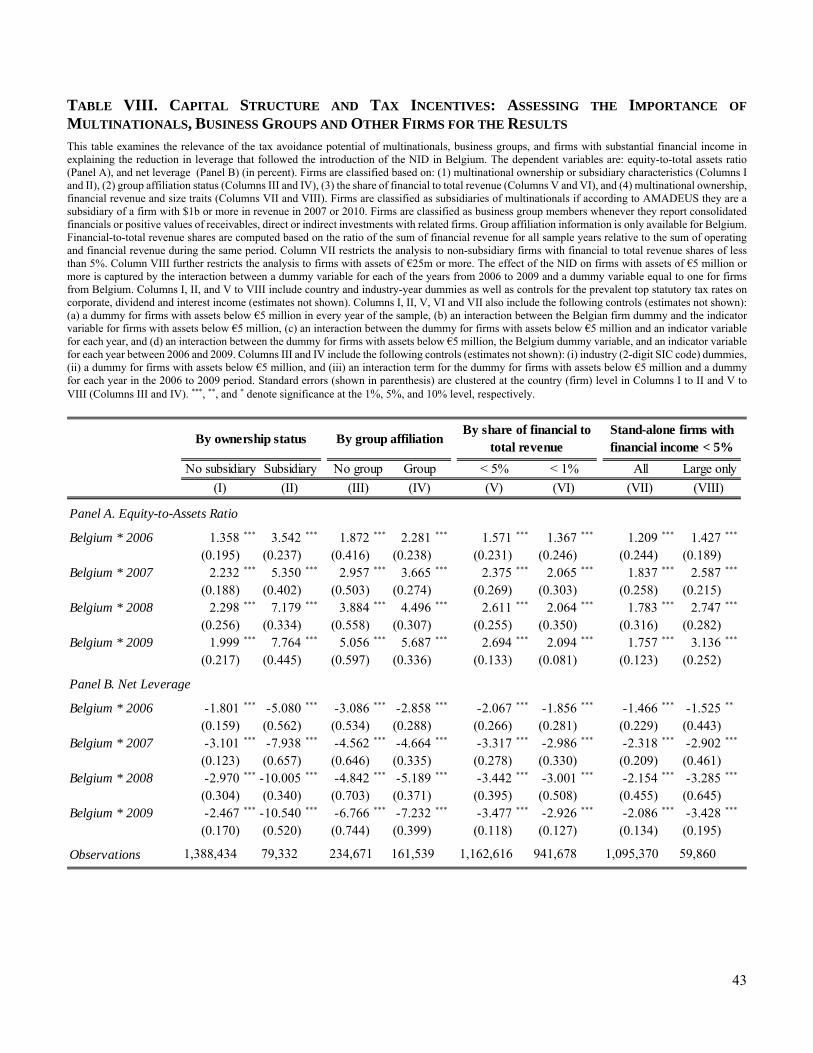
43
TABLE VIII. CAPITAL STRUCTURE AND TAX INCENTIVES: ASSESSING THE IMPORTANCE OF
MULTINATIONALS, BUSINESS GROUPS AND OTHER FIRMS FOR THE RESULTS
This table examines the relevance of the tax avoidance potential of multinationals, business groups, and firms with substantial financial income in explaining the reduction in leverage that followed the introduction of the NID in Belgium. The dependent variables are: equity-to-total assets ratio (Panel A), and net leverage (Panel B) (in percent). Firms are classified based on: (1) multinational ownership or subsidiary characteristics (Columns I and II), (2) group affiliation status (Columns III and IV), (3) the share of financial to total revenue (Columns V and VI), and (4) multinational ownership, financial revenue and size traits (Columns VII and VIII). Firms are classified as subsidiaries of multinationals if according to AMADEUS they are a subsidiary of a firm with $1b or more in revenue in 2007 or 2010. Firms are classified as business group members whenever they report consolidated financials or positive values of receivables, direct or indirect investments with related firms. Group affiliation information is only available for Belgium. Financial-to-total revenue shares are computed based on the ratio of the sum of financial revenue for all sample years relative to the sum of operating and financial revenue during the same period. Column VII restricts the analysis to non-subsidiary firms with financial to total revenue shares of less than 5%. Column VIII further restricts the analysis to firms with assets of €25m or more. The effect of the NID on firms with assets of €5 million or more is captured by the interaction between a dummy variable for each of the years from 2006 to 2009 and a dummy variable equal to one for firms from Belgium. Columns I, II, and V to VIII include country and industry-year dummies as well as controls for the prevalent top statutory tax rates on corporate, dividend and interest income (estimates not shown). Columns I, II, V, VI and VII also include the following controls (estimates not shown): (a) a dummy for firms with assets below €5 million in every year of the sample, (b) an interaction between the Belgian firm dummy and the indicator variable for firms with assets below €5 million, (c) an interaction between the dummy for firms with assets below €5 million and an indicator variable for each year, and (d) an interaction between the dummy for firms with assets below €5 million, the Belgium dummy variable, and an indicator variable for each year between 2006 and 2009. Columns III and IV include the following controls (estimates not shown): (i) industry (2-digit SIC code) dummies, (ii) a dummy for firms with assets below €5 million, and (iii) an interaction term for the dummy for firms with assets below €5 million and a dummy for each year in the 2006 to 2009 period. Standard errors (shown in parenthesis) are clustered at the country (firm) level in Columns I to II and V to VIII (Columns III and IV). ***, **, and * denote significance at the 1%, 5%, and 10% level, respectively.
Panel A. Equity-to-Assets Ratio
Belgium * 2006 1.358 *** 3.542 *** 1.872 *** 2.281 *** 1.571 *** 1.367 *** 1.209 *** 1.427 ***
(0.195) (0.237) (0.416) (0.238) (0.231) (0.246) (0.244) (0.189)Belgium * 2007 2.232 *** 5.350 *** 2.957 *** 3.665 *** 2.375 *** 2.065 *** 1.837 *** 2.587 ***
(0.188) (0.402) (0.503) (0.274) (0.269) (0.303) (0.258) (0.215)Belgium * 2008 2.298 *** 7.179 *** 3.884 *** 4.496 *** 2.611 *** 2.064 *** 1.783 *** 2.747 ***
(0.256) (0.334) (0.558) (0.307) (0.255) (0.350) (0.316) (0.282)Belgium * 2009 1.999 *** 7.764 *** 5.056 *** 5.687 *** 2.694 *** 2.094 *** 1.757 *** 3.136 ***
(0.217) (0.445) (0.597) (0.336) (0.133) (0.081) (0.123) (0.252)
Panel B. Net Leverage
Belgium * 2006 -1.801 *** -5.080 *** -3.086 *** -2.858 *** -2.067 *** -1.856 *** -1.466 *** -1.525 **
(0.159) (0.562) (0.534) (0.288) (0.266) (0.281) (0.229) (0.443)Belgium * 2007 -3.101 *** -7.938 *** -4.562 *** -4.664 *** -3.317 *** -2.986 *** -2.318 *** -2.902 ***
(0.123) (0.657) (0.646) (0.335) (0.278) (0.330) (0.209) (0.461)Belgium * 2008 -2.970 *** -10.005 *** -4.842 *** -5.189 *** -3.442 *** -3.001 *** -2.154 *** -3.285 ***
(0.304) (0.340) (0.703) (0.371) (0.395) (0.508) (0.455) (0.645)Belgium * 2009 -2.467 *** -10.540 *** -6.766 *** -7.232 *** -3.477 *** -2.926 *** -2.086 *** -3.428 ***
(0.170) (0.520) (0.744) (0.399) (0.118) (0.127) (0.134) (0.195)
Observations 941,678 1,095,370 59,8601,388,434 79,332 234,671 161,539 1,162,616
(VII)
AllGroup
(IV)
< 5% < 1%
(VI)(V)
By ownership status By group affiliationBy share of financial to
total revenueStand-alone firms with financial income < 5%
No subsidiary
(I)
Subsidiary
(II)
No group
(III)
Large only
(VIII)

44
TABLE IX. CAPITAL STRUCTURE AND TAX INCENTIVES: INCUMBENT AND NEW FIRMS
This table examines the impact of the introduction of the notional interest deduction (NID) tax provision on the equity-to-total assets ratio (in percent) of incumbent (Columns I to V) and new firms (Columns VI to X) in Belgium. The effect of the NID is captured by the interaction between a dummy variable for each of the years from 2006 to 2009 and a dummy variable equal to one for Belgian firms. Incumbent firms are those that report financial information every year between 2004 and 2009. The analysis of incumbent firms focuses on within firm (fixed effect) specifications. New firm specifications focus on the first financial report of newly incorporated firms between 2002 and 2009. Columns I and VI show results for Belgian firms only; Columns II to V and VI to X implement a DiD strategy using firms in France, Germany, Luxembourg, and the Netherlands as controls; Columns V and X restrict the analysis to firms with assets of €25m or more. Columns I to IV and VI to IX include as control Small, a dummy for firms with assets below €5 million in every year of the sample (not shown). Columns II to V and VII to X also include as control (estimates not shown): (a) a dummy for each country; (b) Small * Belgium, an interaction of the small and Belgium dummies; (d) a dummy for each year; (e) an interaction between small and a dummy for each year. Columns I to IV and V to IX also include an interaction between the small dummy, the Belgium dummy and an indicator variable for each year between 2006 and 2009, to capture the differential effect of the NID on small firms. Corporate (dividend, interest) income tax rate is the prevalent top statutory tax rate for corporate (dividend, interest) income. Other controls include: (i) Ln Assets, the natural logarithm of total assets; (ii) OROA, the ratio of operating income to assets; (iii) Tangibility, the ratio of fixed to total assets; (iv) GDP growth, the yearly growth rate in each country; (v) Local GDP growth, the annual growth rate at the regional level (NUTS-3 level). Columns III to V and VIII to X include industry-year dummies. Columns VI to X include 1-digit SIC code industry dummies (not shown). Standard errors clustered at the country (firm) level are shown in parentheses in Columns II to V and VI to X (Columns I and V). ***, **, and * denote significance at the 1%, 5%, and 10% level, respectively.
Belgium * 2006 2.573 *** 1.619 *** 1.786 *** 1.788 *** 3.190 *** 9.535 *** 11.061 *** 10.991 *** 10.035 *** 7.775 *
(0.189) (0.321) (0.229) (0.085) (0.162) (3.194) (0.808) (1.121) (1.254) (2.987)Belgium * 2007 4.070 *** 2.705 *** 2.873 *** 2.814 *** 4.667 *** 14.757 *** 17.924 *** 17.543 *** 16.642 *** 16.027 ***
(0.224) (0.390) (0.275) (0.134) (0.291) (2.753) (1.505) (1.674) (1.597) (2.281)Belgium * 2008 4.897 *** 3.177 *** 3.135 *** 2.945 *** 5.949 *** 10.203 *** 13.818 *** 13.414 *** 12.243 ** 14.671 ***
(0.253) (0.505) (0.284) (0.248) (0.353) (3.112) (2.726) (2.810) (2.765) (2.277)Belgium * 2009 5.990 *** 3.057 *** 3.085 *** 2.779 *** 6.292 *** 10.281 *** 9.149 ** 10.013 ** 9.741 *** 25.914 ***
(0.282) (0.656) (0.262) (0.381) (0.586) (3.687) (2.518) (2.300) (1.928) (4.686)Belg. * 2006 * Small -0.711 *** -1.901 *** -1.987 *** -2.290 *** -6.271 * -5.509 *** -5.544 ** -5.287 ***
(0.216) (0.289) (0.207) (0.079) (3.443) (1.141) (1.364) (1.093)Belg. * 2007 * Small -1.305 *** -3.127 *** -3.199 *** -3.444 *** -11.461 *** -12.845 *** -12.729 *** -12.485 ***
(0.258) (0.347) (0.241) (0.086) (3.025) (1.095) (0.895) (0.948)Belg. * 2008 * Small -1.464 *** -3.911 *** -3.966 *** -4.285 *** -9.156 *** -11.633 ** -11.575 ** -11.339 **
(0.293) (0.462) (0.314) (0.193) (3.321) (3.069) (2.986) (2.525)Belg. * 2009 * Small -2.004 *** -4.515 *** -4.759 *** -5.047 *** -6.046 -4.462 -4.878 -5.492 *
(0.326) (0.605) (0.324) (0.395) (3.930) (2.297) (2.489) (2.266)Corporate income tax rate -12.433 -2.101 -15.321 -31.954 -20.306 -43.759
(7.553) (4.282) (12.021) (22.801) (20.050) (71.226)Dividend income tax rate -7.910 *** -7.485 *** -2.020 2.137 3.126 -15.812
(1.416) (0.717) (2.742) (6.536) (4.225) (21.055)Interest income tax rate -30.079 *** -22.799 ** -9.895 -83.826 * -41.356 -205.018
(5.457) (6.480) (15.655) (33.888) (31.219) (141.337)Ln Assets -2.434 *** -1.505 3.336 *** 2.164 *
(0.301) (0.989) (0.264) (0.975)OROA 41.438 *** 50.561 *** 19.141 15.804
(2.116) (9.840) (14.395) (11.838)Tangibility -6.062 * 4.223 5.601 *** 26.895 ***
(2.574) (6.937) (1.027) (2.093)GDP growth 0.362 * 0.300 ** 0.329 -1.116
(0.147) (0.076) (0.341) (0.766)Local GDP growth -0.016 ** -0.028 0.047 * 0.100
(0.006) (0.041) (0.021) (0.158)Firm fixed-effectYear dummiesCountry controls Industry-year dummiesSubsampleStandard errors (cluster)Observations
No No No No NoYes Yes Yes Yes Yes
Belgium All All AllNo No Yes Yes
YesNo Yes Yes Yes
Belgium All All AllNo Yes YesNoYes Yes Yes
NoNo
Yes Yes Yes
(I) (II) (III) (IV) (VI)
334,271 1,024,227 5,818 26,2201,024,2271,024,227 80,018Firm Country Country Country
New firmsIncumbent firms
YesYesYes
All > 25mCountry
(VII) (VIII) (IX)(V)
Country Country1,679
(X)
YesYesYes
All > 25mFirm
26,220 26,220Country Country
No Yes Yes

45
TABLE X. EXPLAINING THE INCREASE IN EQUITY RATIOS
This table examines the determinants of the increase in equity-to-total assets ratios of medium and large Belgian firms after 2006. Panel A examines the separate contribution of equity (Columns I and II), total non-equity liabilities (Columns III and IV), and total assets (Columns V and VI). Equity, liabilities and total assets are in natural logarithmic values. Panel B explores the contribution of internal and external equity sources: (a) Adjusted Equity (Column I and II), which excludes the effect of net income after 2006 on the total value of equity, also shown in natural logarithmic values, (b) Profit-adjusted year over year change in equity (Column III and IV), which is equal to the year over year change in equity minus net income, divided by pre-2006 equity levels; (c) Outside equity (Column V and VI), or the maximum of: (i) zero and (ii) the year over year change in equity minus net income, divided by the pre-2006 levels of equity. Outside equity provides a lower bound on the level of new equity issuance relative to pre-2006 equity levels. The effect of the NID on firms with assets of €5 million or more is captured by the interaction between a dummy variable for each of the years from 2006 to 2009 and a dummy variable equal to one for Belgian firms. All specifications include (estimates not shown): (a) country and industry-year dummies, (b) controls for the prevalent top statutory corporate, dividend and interest income tax rates, (c) a dummy for firms with assets below €5 million in every year of the sample, (d) an interaction between the Belgian firm dummy and the indicator variable for firms with assets below €5 million, (e) an interaction between the dummy for firms with assets below €5 million and an indicator variable for each year, and (f) an interaction between the dummy for firms with assets below €5 million, the Belgium dummy variable, and a dummy for each year between 2006 and 2009. Columns II, IV and VI also include the following controls (estimates not shown): OROA, Tangibility, GDP growth, and Local GDP growth. Standard errors clustered at the country level are shown in parentheses. ***, **, and * denote significance at the 1%, 5%, and 10% level, respectively.
(I) (II) (III) (IV) (V) (VI)
Belgium * 2006 0.104 *** 0.102 *** -0.018 -0.028 *** 0.041 0.032 ***
(0.0173) (0.0116) (0.0237) (0.0039) (0.0216) (0.0051)Belgium * 2007 0.132 *** 0.137 *** -0.046 * -0.041 *** 0.053 * 0.058 ***
(0.0205) (0.0176) (0.0209) (0.0046) (0.0203) (0.0063)Belgium * 2008 0.173 *** 0.183 *** -0.062 * -0.040 ** 0.070 ** 0.090 ***
(0.0266) (0.0297) (0.0248) (0.0094) (0.0241) (0.0107)Belgium * 2009 0.191 *** 0.194 *** -0.047 ** -0.029 0.095 *** 0.107 ***
(0.0202) (0.0230) (0.0136) (0.0167) (0.0143) (0.0147)Firm level controls No Yes No Yes No Yes
Observations
Belgium * 2006 0.152 *** 0.162 *** 0.010 *** 0.011 *** 0.008 *** 0.008 ***
(0.0082) (0.0207) (0.0006) (0.0005) (0.0008) (0.0003)Belgium * 2007 0.162 *** 0.165 *** 0.007 *** 0.007 *** 0.004 *** 0.005 ***
(0.0148) (0.0065) (0.0005) (0.0010) (0.0005) (0.0002)Belgium * 2008 0.196 *** 0.185 *** 0.011 *** 0.013 *** 0.003 *** 0.004 ***
(0.0080) (0.0149) (0.0009) (0.0013) (0.0004) (0.0002)Belgium * 2009 0.214 *** 0.211 *** 0.011 *** 0.013 *** 0.004 *** 0.005 ***
(0.0263) (0.0224) (0.0010) (0.0012) (0.0004) (0.0003)Firm level controls No Yes No Yes No YesObservations 1,285,825 1,285,825 1,268,940 1,268,940 1,268,940 1,268,940
Panel A. Equity, non-equity liabilities and total assets
Panel B. Equity: internal and external sources
Outside equity (%)
Equity Liabilities Total assets
Adjusted equityProfit-adjusted year over year change in equity (%)
1,366,128 1,366,128 1,467,766 1,467,766 1,467,766 1,467,766

46
APPENDIX A1. DESCRIPTION OF THE MATCHING ESTIMATOR (TABLE VII, PANEL D, V AND VI) This appendix describes the matching difference-in-differences procedure used in the robustness tests reported in Table VII, Panel D (Rows v and vi). Following Heckman, Ichimura and Todd (1997), we identify firms in the control countries (France, Germany, Luxembourg and the Netherlands) that are comparable to those in Belgium and that are likely to be exposed to comparable investment opportunities. We proceed in three steps.
First, to assure that both treatment and control firms are exposed to similar economic shocks, we search for valid matching firms within each firms’ industry (two-digit SIC codes) group. To minimize potential concerns resulting from differential coverage across treatment and control firms over time, we focus on the sample of firms reporting financial information every year between 2002 and 2007.
Second, to identify comparable firms based on observable characteristics, we rely on three control variables that have been shown to affect financing decisions, and that are used as controls throughout the paper. Namely, (i) the natural logarithm of total assets, which proxies for firm size, (ii) OROA, the ratio of operating income to assets, that proxies for firm profitability, and (iii) tangibility, the ratio of fixed to total assets, which proxies for the ease at which assets can be repossessed and redeployed to other uses outside the relevant firm.
To make these variables comparable, and to avoid scaling challenges, we normalize each variable to be mean zero and unit variance before matching.
We implement a “nearest-neighbor matching” procedure by matching each Belgian firm i in our sample with the control firm j in the same industry that minimizes the following distance metric:
ln ln
3
where |∙| is the absolute value operator and ln , and are respectively the 2002-2004 normalized average value of the natural logarithm of total assets, the ratio of operating revenue to total assets and the ratio of fixed assets to total assets for firm . In order to improve the quality of the matching, we allow firms in the control countries to be matched with more than one Belgian firm (i.e. we match with replacement).
Beyond its simplicity, an attractive feature of this metric is that it is equal to the average distance between the matched firms, expressed in units of the standard deviation of the variables. Hence, it provides an easily interpretable measure of match quality across treatment and control firms. For the sample of 10,716 matched Belgian firms with €5 million in assets or more for at least one year during the sample period, the average (median) distance metric is equal to .087 (.063) standard deviations. For the 50% subsample with the closest matches (i.e. those with a distance metric lower than .063), the average (median) distance metric is .036 (.037) standard deviations.
Third, the average treatment effect is computed by comparing each Belgian firm with and only with its matched firm . Specifically, we first estimate the treatment effect θ , for each Belgian firm i at time t by using the following DiD estimator:
θ , , ,2004 , ,2004 .
where , is the leverage ratio of Belgian firm in year and , is the leverage ratio in year of the control firm j that was matched with firm .

47
A consistent estimator of the average treatment effect at time t is obtained by taking the sample mean of
the individually estimated effects for all Belgian companies: θ ∑ θi,t. Since each firm in the control
countries can be matched with more than one Belgian firm, we cluster the standard errors at the control firm level.
The results are robust to modifying the matching procedure by increasing the set of matching covariates (e.g. including firm’s age as a control for the firm’s life-cycle), varying the matching period (e.g. by only relying on one or multiple years of data in the pre-2006 period), using alternative distance metrics (e.g. squared rather than absolute distances) or matching procedures (i.e. without replacement) to identify the matching firms, using different industry or more disaggregated classification systems (NACE, three digit SIC, etc.). Rather than compare each Belgian firm with and only with its matched control, we have also performed multivariate OLS specifications similar to those used in the rest of the paper, on the restricted set of matched companies. The results were unaffected in those alternative specifications.