capital structure and the changing role of off - balance ... · capital structure and the changing...
TRANSCRIPT
Capital Structure and the Changing Role of Off-
Balance-Sheet Lease Financing
LAUREL A. FRANZEN, KIMBERLY J. RODGERS,
and TIMOTHY T. SIMIN*
ABSTRACT
First Draft: April 2008 This Draft: August 2009
Using trend regression analysis, we demonstrate the remarkable increase in off-balance-sheet (OBS) lease financing and simultaneous decrease in capital (on-balance-sheet) leases over the last 27 years. This trend is consistent with the contentions of regulators and popular press that firms intentionally structure leases to qualify for OBS accounting treatment. Moreover, we find that firms rely heavily on this OBS financing in addition to, not merely in lieu of, conventional debt. We include a proxy for the benefits of the OBS accounting treatment as an additional explanatory variable in a traditional capital structure model and find a significantly negative relationship: as abnormal OBS lease activity increases, conventional debt ratios fall. Our results suggest common financial risk metrics underestimate the risk of such firms as the lower debt ratios may be associated with higher OBS debt financing. Our results should be of interest to a host of market participants as the US considers changes in accounting treatment of lease financing. JEL classification: G32, M41, M48 Keywords: Capital structure, Operating leases, Off-Balance-Sheet financing
*Franzen ([email protected]) is at Loyola Marymount University, Rodgers ([email protected]) is at American University, and Simin ([email protected]) is at the Pennsylvania State University. The authors are grateful to John Graham for estimated marginal tax rates, to Jerry Martin for insight and practical experience from a lessor’s perspective, and for comments and suggestions from Jess Cornaggia and seminar participants at the University of Texas.
1
In this study we document that from 1980–2007, Off-Balance-Sheet lease financing as a
percentage of total debt has increased a remarkable 745%. Since leases are non-
cancellable, fixed-term, fixed-income claims with bankruptcy priority, they are
essentially debt.1
Financial leasing theory and prior empirical evidence suggests that leasing
activity is explained by expected costs of bankruptcy, costs of contracting, tax status and
asset specificity.
If leased assets were brought onto the balance sheet over our 27 year
sample period, average debt-to-capital ratios would increase by 50-75%. It appears there
is significant benefit for managers to move these non-cancelable obligations off the
balance sheet.
2
The similarity to debt and ease of moving leases off the balance sheet under
current Generally Accepted Accounting Principles (GAAP) has caught the attention of
regulators and financial press. A 2007 Forbes article states, “…companies have been
working the system [lease accounting] to lower the amount of debt they show investors.”
We show that the benefits of Off-Balance-Sheet (hearater OBS)
accounting treatment of leases are themselves a determinant of leasing activity. Our
results suggest that lower conventional leverage ratios, common risk metrics such as
Adjusted O- and Z-Scores (both of which ignore OBS lease financing), and conventional
levered equity betas understate the financial risk of such firms.
3
1 Capital leases are included as debt in traditional leverage measurements as these leases essentially reflect secured debt. However, operating leases are expensed rather than treated as debt, even when the obligation is non-cancelable and long term. Qualification for OBS treatment is detailed in section II below. 2See McConnell and Schallheim (1983), Smith and Wakeman (1985), Krishnan and Moyer (1994), Sharpe and Nguyen (1995), and Graham, Lemmon and Schallheim (1998). 3 “Debt Hazards Ahead”, June 16, 2007, Forbes Magazine. See also “Hidden in Plain Sight”, August 2005, CFO Magazine.
Regulators have also expressed concern that the financial reporting may not reflect the
2
underlying economics of the transaction [See SEC (2005)]. As early as 2003, former SEC
chairman Arthur Levitt Jr asked:
“Should companies still be allowed to leave billions of off-balance sheet debt, such as lease financing, out of a company’s reported liabilities? Off-balance sheet debt persists, distorting the financial picture investors have been given in companies in many sectors. Markets will discipline themselves and their participants but only if they have accurate information.”4
Concerns of regulators notwithstanding, we note that in an efficient market the
OBS accounting treatment should have no economic impact. Non-cancellable future lease
payments under operating leases are not recognized on the balance sheet, but they do
appear in the disclosure notes to the financial statements. With effort, financial statement
users should be able to adjust for accounting differences across operating leases and
capital leases.
5
Prior leasing theory does not include potential benefits of keeping debt off the
balance sheet as a determinant of the lease versus buy decision. We employ an otherwise-
well-specified, state-of-the-literature model of lease financing to generate a proxy for the
Because this information may not be fully reflected in credit ratings or
other conventional risk metrics, it is an important empirical question as to whether these
trends are significant and if so, whether the benefits of OBS financing influence observed
corporate capital structures. We find they are and they do.
To further investigate the extent to which this trend reflects a substitution effect,
we first consider the types of firms increasing their OBS lease financing. We cannot
attribute the growth in OBS lease financing to financially distressed firms. Nor can we
attribute this trend to retail and transportation firms with general assets. Our trend
regression analysis suggests this phenomenon is pervasive across industries.
4 “The SEC’s Repair Job”, February 10, 2003, Wall Street Journal. 5 We discuss the different treatment of these obligations by Moody’s and S&P below.
3
unexplained benefits of OBS treatment. We refer to this proxy as abnormal or excess
OBS leasing and include it as an additional explanatory variable in a state-of-the
literature model of conventional capital structure. We find that as the benefits of OBS
debt increase, the conventional debt ratio falls.
We explore a host of non-competing explanations for the observed preference for
OBS lease financing. We find some evidence that firms less subject to scrutiny by
institutional investors, analysts and credit ratings rely more heavily on OBS financing.
These results hold after controlling for firm age and size. Because so few of our firms are
subject to this scrutiny, we cannot assume their existence deters firms in general.6
6 Our median firm has zero stock held by Qualified Institutional Investors and zero analyst coverage. Only 15.5% of our sample has a credit rating from S&P.
Finally, we model the ratio of OBS lease obligations to balance sheet debt. Our
results suggest that firms with higher growth options rely more heavily on OBS leasing.
This is consistent with a risk containment strategy. The leased asset has an inherent put
option and higher growth (higher risk) firms pay a premium for this option even if they
have access to conventional debt.
We expect that our findings will be of interest to regulators, information
intermediaries, academics, and practitioners as the Financial Accounting Standards Board
(FASB) and the International Accounting Standards Board (IASB) consider bringing all
material, long-term lease obligations onto the balance sheet.
The following section of the paper (II) details background information on the
financial reporting of leases. In Section III, we discuss prior literature, state our research
questions and formulate testable hypothesis. In Section IV, we describe our data and
methodology. We present empirical results in Section V and Section VI concludes.
4
II. Financial Reporting of Leases by the Lessee
Under current Generally Accepted Accounting Principles (GAAP), the lessee should
classify lease obligations as a capital (ON-balance-sheet) lease if the lease meets at least
one of the four criteria identified in Accounting for Leases, Financial Accounting
Standard No. 13.7
The exact specifications of FAS 13 create an accounting loophole that allows a
lease to be purposefully structured to achieve operating lease accounting and remain
OBS. For example, given the specific thresholds specified in the above classification
criteria (75% and 90%) lease arrangements that are 74% of the asset life or 89% of the
These criteria are as follows:
(1) the agreement specifies that ownership of the asset transfers to the lessee
(2) the agreement contains a bargain purchase option
(3) the lease term is equal to 75% or more of the expected economic life of the asset
(4) the present value of the minimum lease payments is equal to or greater than 90%
of the fair value of the asset.
At inception of a capital lease, a lease liability and a leased asset are recognized
on the balance sheet. The leased asset is depreciated over its useful life and periodic
interest accrual over time decreases the lease liability. The capital lease is a financing
vehicle for the purchase of an operational asset and is essentially secured debt. However,
if a lease arrangement does not meet any of the four criteria of a capital lease, it is
accounted for as an operating lease. Operating leases have no effect on the balance sheet;
periodic rent expense is recorded on the income statement.
7 FAS 13 is effective for lease transactions entered into on or after January 1, 1977.
5
fair value of the leased asset can qualify for operating lease treatment under GAAP.8
There is a large empirical literature examining the theoretical determinants of the
lease versus buy decision.
Similarly, “lease payments” can be minimized to circumvent criteria #4 by requiring
excessive maintenance payments. Anecdotal evidence suggests that opportunistic
structuring of leases has become a thriving industry since the passage of FAS 13.
Numerous websites advertise services and techniques for structuring operating leases.
Miller and Bahnson (2008) suggest that reputable accounting firms help clients
intentionally structure lease arrangements specifically to remain OBS. To the extent that
market frictions exist, firms have incentive to exploit these accounting rules to keep debt
off the balance sheet.
III. Literature Review and Hypothesis Development
A. The lease versus buy decision
9
Leasing theory predicts that financially distressed firms obtain more favorable
financing terms from lessors than from traditional creditors. This predicted relation
stems from the priority of lessors’ claims in bankruptcy proceedings and is likely to be
strongest for leases classified as operating leases that ostensibly never intend to transfer
However, given recent regulatory concern of increasing and
potentially dubious reliance on OBS lease financing, we investigate whether the
theoretical determinants continue to explain lease activity.
8 Under International Accounting Standards, IAS 17, whether a lease is a capital lease or an operating lease depends on the substance of the transaction rather than the legal form of the contract. That is, the criteria for capital lease treatment under IAS 17 differs from FAS 13 in not specifying specific cutoffs. 9 See McConnell and Schallheim (1983), Smith and Wakeman (1985), Krishnan and Moyer (1994), Sharpe and Nguyen (1995), and Graham, Lemmon and Schallheim (1998).
6
ownership. Weiss & Wruck (1998) document the court-sponsored asset stripping of
Eastern Airlines where the court allowed the debtor to sell secured creditors’ collateral
(including capital leases) to fund operating losses.10,11
The lease versus buy decision should be influenced by the nature of the asset.
Fixed assets of general usage (such as real estate, aircraft, trucks and automobiles,
electronics and computer equipment) are readily transferable and as a result have greater
availability on the leasing market. With few alternative uses, the economics of
The Eastern case may be a legal
anomaly, but it demonstrates rational incentive for creditors to maintain ownership of
their collateral going forward. Under an operating (OBS) lease, the lessor maintains
ownership of assets where capital leases indicate intended transfer of ownership just as in
a traditional purchase financed by conventional debt.
Krishnan and Moyer (1994) empirically investigate the relation between capital
(on-balance-sheet) leases and the costs of bankruptcy and find that capital leasing activity
is positively related to the costs of bankruptcy. Graham, Lemmon and Schallheim (1998)
find that this positive relationship extends to operating (OBS) leases.
Leasing theory also predicts that firms with higher costs of external funds reduce
investment costs by leasing assets. Finance theory and empirical evidence further suggest
that the cost of external funds is higher when information asymmetry, agency problems,
and underinvestment problems are more severe (Myers and Majluf (1984), Sharpe and
Nguyen (1995), Graham et. al (1998)).
10 Eastern Airlines filed Chapter 11 on March 9, 1989. After $1.4 billion in operating losses, Eastern ceased operations and auctioned remaining aircraft. The final reorganization plan was confirmed by the bankruptcy court on December 22, 1994. 11 In addition to the aircraft sold to fund losses, many recovered aircraft were recovered in poor condition. Weiss and Wruck note that because Eastern failed to maintain planes as dictated by the terms of its capital leases, lessors had to make major repairs on many recovered planes to return them to flying condition.
7
specialized assets suggest conventional debt (or equity) financing. Consistent with these
predictions, Graham et. al (1998) and Sharpe and Nguyen (1995) report a negative
relation between leasing and proxies for asset specificity.
Finally, because the operating lease transfers tax shields, leasing theory predicts
that the potential borrower (lessee) marginal tax rate is negatively related to the
propensity to lease assets. A profitable lessor can take advantage of the tax benefits of
interest payments and depreciation and pass savings along (at least in part) to the lessee
unable to fully utilize the tax benefits of ownership.12
Though the lease versus buy decision is well studied, there is relatively little focus
specifically on the role of OBS leases. This is surprising given the 2005 SEC report that
non-cancellable future payments required under OBS leases were an estimated $1.25
trillion. Prior literature provides mixed evidence on whether market participants
appropriately adjust for OBS lease obligations.
Graham et. al (1998) find operating
leases are indeed negatively related to the pre-financing marginal tax rate.
B. Off Balance Sheet Leases
13 Explanations for why they may not
include (1) limited attention and other potential systematic biases, (2) costly information
processing and (3) differences in the perceived reliability of information that is
recognized versus disclosed.14
12 To transfer tax shields, the lease must qualify as a “true lease” under IRS tax rules. For legal and tax purposes, when the lessor retains ownership of the leased asset, the lease is a “true lease” for the lessee, however this tax classification is not publicly available. Tax rules for leasing are similar on most dimensions to financial reporting rules. Graham et. al (1998) provide a detailed comparison of tax and financial accounting rules. 13 See Altamuro, et al. (2008), Ely (1995), Imhoff, Lipe and Wright (1993), Beattie, Edwards and Goodacre (1998) and Ge, Imhoff and Lee (2008). 14 See Ahmed, et. al (2009), Aboody (1996) Davis-Friday, et. al (1999), Hirshleifer and Teoh (2003), Barth et. al (2003) and Libby, et. al. (2005).
All of these explanations suggest that structuring leases
8
such that they are relegated to lengthy disclosure notes rather than prominently
recognized in the financial statements can lead to more favorable firm valuations.15
Traditional theories and models of corporate capital structure focus on the demand for
debt versus equity capital, either as a tradeoff of cost and benefit of debt or market
timing.
C. Research questions and testable hypotheses
Our first research question is motivated partially by the concerns of regulators that
firms increasingly (dubiously) structure leases to qualify for OBS accounting treatment.
As noted above, leases are contained in the disclosure notes of audited financial
statements filed with the SEC. In an efficient market, regulators, investors, and other
market participants should be able to adjust assessments of financial risk to account for
these obligations.
Q1: Has the role of OBS leases in corporate financing changed through time?
H1a: The mix of On- and Off-balance sheet lease financing appears stable over time.
H1b: OBS lease financing as a percentage of conventional debt is stable over time.
16
15 In financial reporting, the term “recognition” refers to incorporating an item into the primary financial statements. In contrast, the term “disclosure” refers to providing information about an item in the notes to the primary financial statements.
16 Demand-driven theory of optimal capital structure begins with Modigliani and Miller (1963). Extensions include DeAngelo and Masulis (1980), Kim (1982), Modigliani (1982), Myers (1984) and Bradley, Jarrell, and Kim (1984). Empirical tests of these models include Titman and Wessels (1988), MacKie-Mason (1990), Berger, Ofek, and Yermack (1997), Shyam-Sunder and Myers (1999), Hovakimian, Opler, and Titman (2001), Fama and French (2002), Mehrotra, Mikkelson, and Partch (2003), Dittmar (2004), Hovakimian, Hovakimian, and Tehranian (2004), and Frank and Goyal (2009). Baker and Wurgler (2002) propose a theory which suggests that a firm’s capital structure is the cumulative result of managerial attempts to time the equity market. Similarly, Graham and Harvey (2001) and Barry, Mann, Mihov, and Rodriguez (2008) note the importance of debt timing with respect to interest rates.
But the supply of capital is also determined by potential lender risk profiles.
9
Firms facing financial distress may find better terms from lessors who maintain
ownership of the asset.
Q2: Is the increase in OBS lease financing attributable to firms facing higher
probability of financial distress?
H2: Reliance on (and the increase in) OBS lease financing should be greatest among
firms with higher Z-scores (and adjusted O-scores).
A related consideration is the differential tax status of the lessee vis-à-vis the creditor or
lessor. If the potential lessee faces a lower marginal tax rate, this firm may prefer to
transfer the tax benefit of ownership to the lessor by structuring the lease as an operating
lease in order to lower the cost of lease financing.
Q3: Is the increase in OBS lease financing attributable to firms that cannot take full
advantage of debt tax shield?
H3: Reliance on (and the increase in) OBS lease financing should be greatest (least)
among firms with lowest (highest) marginal tax rates.
Financial theory suggests that liquid fixed assets of general usage are more appropriate
for lease financing. If there is a change in the industrial composition of firms using lease
financing, we can infer the role of the lease has changed. Specifically, evidence of
increased OBS lease financing among industrial firms would indicate greater propensity
to lease less liquid (firm-specific) assets that are less valuable to the lessor than to the
lessee. For firms without access to debt markets, specialized assets could be financed
with capital (rent to own) leases, but are unlikely structured as operating leases unless the
motivation is keeping debt off the balance sheet.
10
Q4a: Is there a change in the industrial composition of firms using lease financing? Is
there an increase in OBS lease financing among industrial firms?
Q4b: Is there an increase in OBS lease financing among firms with relatively high
investment in Research & Development?
H4a: Reliance on (and the increase in) OBS lease financing is attributable to firms
with general assets found in Retail and Transportation industries.
H4b: Reliance on (and the increase in) OBS lease financing is attributable to firms
with low R&D intensity.
To the extent that market frictions exist, the OBS treatment of operating leases may be an
overlooked benefit to be considered in the lease versus buy decision. Market participants
may not fully consider OBS leases and thus make inaccurate risk assessments. We
investigate whether benefits of OBS financing influence observed corporate capital
structures expecting that as the benefits of OBS debt increase, observed, on-balance-sheet
debt levels decrease.
Q5: Do benefits from OBS treatment of operating leases influence corporate capital
structures?
H5: Excess OBS lease financing is negatively related to conventional debt ratios.
Finally, we investigate whether the economics of the firm can explain the observed mix
of On- and Off-balance sheet debt. Given the latitude in accounting standards for
classifying leases and the concern of regulators that firms utilizing OBS financing are
“hiding debt”, this is an important empirical question. Empirical scrutiny of the
appropriateness of these financial reporting lease classifications is sparse and out of date
11
with the results of our study.17
Our initial sample contains all firms in the merged CRSP-Compustat database
from 1980 through 2007. We include only firms with common stock and exclude
regulated financial firms (SIC codes 6000-6799) and utilities (SIC codes 4800-4999).
Before matching Compustat and CRSP data we adjust for the Compustat convention that
companies with fiscal years ending between June of year t and May of year t+1 are coded
as year t. We assign firms with fiscal years ending in the first quarter of year t+1 to year
t+1 and assume a 6-month lag between the end of a firm's fiscal year end and when
If leases are funds of last resort for firms without access
to debt markets, we should expect to see firms utilizing capital leases (renting to own).
However, if the trend in lease financing is a reflection of a preference for OBS financing
to appear more conservatively financed, we expect to see firms utilizing operating leases
in lieu of capital leases. Moreover, if firms are indeed able to “hide debt” as regulators
suggest, they may utilize more total fixed-cost (debt) financing. That is, the increase in
OBS lease financing may well be in addition to, not merely in lieu of, balance sheet debt.
Q6: Do firms use operating leases to expand debt capacity? That is, do firms finance
assets with operating (OBS) leases in lieu of on-balance-sheet debt financing
(conventional debt or capital lease), or are OBS leases in addition to on-balance-
sheet debt?
H6: Capitalizing leased assets has no effect on debt-to-capital ratios.
IV. Data and Methodology
A. Sample Selection
17 Krishnan and Moyer (1994) investigate whether capital leases may be misclassified as operating leases for their sample in the years 1984-1986. They concluded that in these three years, very few firms had non-cancelable lease arrangements that were not reported as capital leases on the balance sheet.
12
financial statement information is publicly available. Firms with a less than $1 million in
total assets, negative sales, and no debt are then removed from the sample. After forming
the needed variables detailed in Appendix A, we winsorize each variable, except the
marginal tax rate data, at the upper and lower 0.05 percentiles.18
18 The simulated marginal tax rate data we use was kindly provided by John Graham and we also acknowledge the use of the 38 industry designations which come from Ken French’s web page.
We use the maximum amount of data available in each of our tests below. The
number of firm years for each series ranges from a maximum of 103582 with simulated
marginal tax rates (MTR) and expected cost of financial distress (ecost) having the fewest
observations, 70549 and 32735 respectively. Theses series look similar to previous
samples. Most of the series are fat tailed with cash flow volatility (CFvol), ecost and
negative owners equity (oeneg) having a considerable amount of positive skew. We
report summary statistics in Table 1.
B. Unobserved Benefits of Off-Balance Sheet Leasing
In addition to testing for trends in univariate settings, we also test whether
‘abnormal’ operating lease levels (operating leases not explained by proxies for
theoretical determinants) help explain conventional debt ratios. To create a proxy for
‘abnormal’ operating lease levels we estimate the state-of-the-literature model of
theoretical determinants of lease financing by Graham Lemmon Schallheim (1998),
hereafter, GLS. In particular, we estimate the specification in equation (1) using a panel
regressions with fixed year effects.
OPlease/TVit = α1 + β1Mtr + β2Ecost + β3Zmod + β4Oeneg + β5Mtb + β6Coll (1) + β7Size + β8d2000 + β9d3000 + β10d4000 + β11d86 + β12d8792 + εit
13
We report traditional t-statistics and t-statistics based on an extension of cluster-
robust standard errors that allows for clustering along more than one dimension proposed
by Cameron et al. (2006) and Thompson (2006).19
We then estimate the state-of-the-literature conventional leverage model of
Lemmon Roberts Zender (2008), hereafter LRZ, both with and without AbOplease. This
allows us to test whether AbOplease is significantly related to the Conventional Leverage
dependant variable. Specifically, we estimate the following specification both with and
without AbOplease.
Since operating (OBS) leases as a
percentage of firm value is the dependent variable in this model, we use the error terms
from this estimation as the proxy for the abnormal operating lease levels (AbOplease).
20
Figure 1a clearly demonstrates the magnitude of operating (OBS) lease liabilities
to total debt (Oplease/TD) has increased over time while the magnitude of capital (on-
balance-sheet) lease liabilities to total debt (Caplease/TD) has decreased.
BLit = α1 + β1Intlev + β2LnSale + β3Mtb + β4Profit + β5Tang + β6Indmedlev + (2) β7CFvol + β8SDivpay + β9 AbOplease + εit
V. Empirical Results
A. Leasing across time: univariate analysis
21
19 Two-way clustering corrects for both time-series and cross-sectional dependence. In our application we cluster by firm and year to capture time series dependence within firms and cross-sectional dependence within year. 20 Definitions of variables employed in the GLS and LRZ models are provided in Appendix A. 21 The trends occur while the number of firms in each annual cross-section first increase then falls to a third of the number in 1980, making it doubtful that the trends are due to some type of firm effect.
The mean
ratio of Caplease/TD was 0.118 in 1980 and by 2007 the ratio has declined to 0.059. On
14
average, capital leases make up a smaller portion of debt across time. In contrast, mean
Oplease/TD is large in magnitude and increasing across time. Specifically, mean
Oplease/TD is 0.84 in 1980 and by 2007 has risen to 7.116; a 745% increase in 27 years.
Clearly, OBS lease financing is an increasingly important source of corporate funding.22
In Table 2, we test whether these observed trends in Figure 1a are statistically
significant. We regress Oplease/TD on a time trend and Caplease/TD on a time trend.
Our sample spans the period 1980-2007, so our time trend variable represents values
from 1 to 28 where 1 corresponds to the year 1980 and 28 corresponds to the year 2007.
These results confirm that the observed time trends are statistically significant. When
Oplease/TD is the dependent variable, the coefficient on time trend is positive and
significant.
Figure 1b demonstrates no obvious trend in conventional long term debt-to-capital
ratios over the same time period. This suggests that the remarkable increase in OBS
obligations are in addition to, not merely in lieu of conventional debt financing. Figure
1b also plots the average debt-to-capital ratio that exists if the leased assets are brought
onto the balance sheet. The trend in Figure 1a is not obvious here because Oplease is
added to the numerator (debt) and denominator (assets). What is remarkable is the effect
on the debt-to-capital ratio. Conventional accounting results in a much more conservative
picture (approximately 20%) than the reality (30-35%).
23
22 This trend exists when we plot unscaled operating and capital leases or if we scale these variables by total financial claims including on-balance sheet debt and our estimate of OBS lease liabilities. The trend also exists in a constant sample of firms across time. 23 The trend is significant based t-statistics formed using Newey-West standard errors or based on the Vogelsang 90% PS confidence intervals.
In contrast, when Caplease/TD is the dependent variable, the coefficient on
time trend is negative and significant. We ensure that these results are not driven by the
15
small sample size via a bootstrapping procedure that resamples the original data 10,000
times. Our results are qualitatively similar under the bootstrapping procedure.
We find no statistical evidence of any trend in LTD/TA indicated by the OLS t-
statistics, Newey-West t-statistics, or the Vogelsang confidence intervals. While the
regression t-statistics for (TD+Oplease)/(TA+Oplease) seem to indicate a downward
trend, the Vogelsang confidence intervals do not support any trend.
We take this evidence from Figure 1 and Table 2 as a rejection of both H1a and
H1b. The magnitude of OBS leases is massive relative to capital leases, so we cannot
conclude that the increase merely reflects a shift from capital to operating leases.
Further, the increase in OBS leasing is not diminishing conventional debt. We reject H6.
We next investigate whether the trends in lease financing are explained by factors
previously demonstrated to influence the lease versus buy decision. We focus our
attention on operating (OBS) leases going forward given the much smaller magnitude of
the capital lease story.
In Figure 2, we classify firms by year into five portfolios based on the likelihood
of bankruptcy, using the adjusted O-score of Franzen et al (2007) and Altman’s Z-score
in Panels A and B, respectively. Both scores increase in distress, thus portfolio 1 (5)
contains the least (most) distressed firms. For each portfolio, we plot the mean level of
Oplease/TD.24 These plots indicate that the mean level of OBS leases to total debt is
highest for firms with the lowest bankruptcy risk (p1) and increasingly so.25
24 Our data are winsorized at the upper and lower 0.05 percentiles; the means should not reflect outliers. 25 In untabulated analysis, we confirm that the upward trend in the mean level of Oplease/TD across time in the top and bottom O- and Z-score portfolios is statistically significant using the Vogelsang confidence intervals.
These
results run counter to the argument that lease financing is a source of last resort for
16
financially distressed firms and do not support H2. This result is at least partly
attributable to the fact that these distress risk proxies overlook the OBS obligations.
Adjusted O-score is purely a function of balance sheet and income statement ratios, i.e. it
does not incorporate OBS obligations. The Z-score contains a market data component,
but only reflects OBS obligations to the extent that market participants account for them
properly. Even the results employing the more market-based Z-Score reject H2.
It is important to note that this surprising result is not simply an issue of imperfect
proxies for financial distress.26
In Figure 3, we investigate the relation between tax status and OBS leasing
activity across time. Leasing theory predicts a negative relation between tax status and
leasing activity. We sort firms into quintiles based on the estimated before interest
marginal tax rate (MTR) and plot the mean Oplease/TD across time for each. We infer at
best weak support for H3.
The plots in Figure 2 are themselves an important
empirical result: commonly employed risk metrics overlook this increasingly important
source of debt financing. These imperfections notwithstanding, quintiles of Adjusted-O
and Z-scores continue to properly sort firms by bankruptcy incidence (See Franzen et al,
2007) and we thus cannot conclude that the increase in OBS lease financing is
attributable to those most likely to go bankrupt. To the contrary, the increase appears
attributable to firms not facing bankruptcy.
27
26 A host of empirical studies support Z-score as a reliable indicator of bankruptcy. Likewise, Frazen et al (2007) demonstrate the efficacy of the adjusted O-score.. 27 Similarly, untabulated trend regressions also fail to support H3.
While the lowest MTR portfolio has higher lease financing
on average, there are periods (including the 2005-2006 period) where highest MTR
portfolio overtakes the lowest MRT portfolio. Moreover, the upward trend is evident in
17
each quintile, not primarily p1. MTR may be a determinant of the lease versus buy
decision, but alone it cannot explain the trends documented in Figure 1a and Table 2.28
In Figure 4, we investigate the relation between OBS leasing activity and asset
specificity. We use R&D expense (scaled by total sales) as our measure of asset
specificity as R&D intensive firms are more likely to have specialized assets.
29
In Figure 5, we sort firms into quintiles based on market-to-book (defined as per
GLS in Appendix B) and then plot Oplease/TD across time for each. Drawing on the
underinvestment problem associated with fixed cost financing (see Myers, (1977)) GLS
suggest that firms with more growth options in their investment opportunity sets should
have a lower proportion of fixed claims in their capital structure. To the contrary, Figure
5 actually suggests that, in a univariate setting, firms with highest market-to-book ratios
We sort
firms by year into three R&D portfolios. Because the median level of R&D as a
percentage of assets is zero, the bottom portfolio (pl) contains firms without R&D
expenses. The highest portfolio (p3) contains firms with non-zero R&D and the middle
portfolio contains both zero and non-zero R&D firms. From 1996 to 2007, mean
operating lease activity decreases monotonically across R&D portfolios. This suggests
that asset specificity remains an important determinant of leasing activity across time but
provides little support for H4b. Untabulated trend coefficients are significantly positive
for all three operating lease portfolios.
28 During our sample period, there were two major changes in tax law that affected the tax depreciation of assets. The Economic Recovery Act of 1981 introduced the Accelerated Cost Recovery System (ACRS) for assets placed in service after 1980. Then, in 1986, the Tax Reform Act of 1986, introduced the Modified Accelerated Cost Recovery System (MACRS) for assets placed in service after 1986. To the extent that the determination of tax depreciation of assets has not changed significantly since 1986, tax considerations are unlikely to be an increasingly important determinant of OBS lease activity across time. 29 We find qualitatively identical patterns whether we define firm total value as book value, market value or as the implied market value described in the appendix.
18
employ OBS leases to a far greater extent than firms with lower market-to-book ratios.
We revisit this inconsistency in multivariate regressions later in the paper.
In Table 3, we estimate the trend regressions for equally weighted industry
portfolios. Financial theory suggests that liquid fixed assets of general usage are
appropriate for lease financing indicating that OBS lease financing should be found
primarily in industries such as retail and transportation. In Panel A we find that 14 of the
29 industries exhibit significant positive trends in operating lease as a percentage of total
debt. There is some evidence that Oil and Gas Extraction and Food and Kindred Products
had a significant decrease over this period. In Panel B all but two of the industries
portfolios had a significant negative trend in capital leases as a percentage of total debt
with fourteen of the trends falling within the 90% Vogelsang confidence intervals. This
evidence indicates that leases are structured off-balance sheet for more than liquid
general usage assets. Table 3 results lead us to reject H4a; the increase in OBS lease
financing is not driven by retail and transportation firms.
B. Leasing across time: multivariate analysis
We next investigate whether these expected relationships between operating lease
activity and theoretical determinants of leasing hold in a multivariate leasing model. In
Table 4 Panel A, we specify the leasing model following Graham, Lemmon and
Schallheim (1998). As measured in GLS and defined in our Appendix A, independent
variables are before interest marginal tax rate, expected cost of distress, modified Z-
score, a dummy variable for whether owners’ equity is negative, market to book,
collateral, and firm size. We include industry dummy variables and time period indicators
19
as in GLS. With the exception of collateral, all of the signs on the coefficients on our
explanatory variables are significant in the expected direction. Specifically, we find that
marginal tax rate is negatively related and proxies for distress (expected costs of
bankruptcy, modified Z-score, negative owners’ equity) are positively related to
operating lease activity. We find an insignificant coefficient on collateral, but the
coefficients on market to book and size are significantly negative as expected. Overall,
we find that the GLS leasing model performs as well in our more recent sample period
(1980-2007) as it did in theirs (1981-1992). The explanatory power of the model across
our sample period is 26% compared to 25% in GLS.
Given that this leasing model remains well-specified, we use the error term from
the leasing regression as a proxy for the unspecified benefits from OBS financing not
explained by theoretical leasing determinants. We expect that these benefits are an
important determinant of observed debt levels. Specifically, we expect that observed on-
balance sheet debt ratios should decrease as the benefits from OBS financing increase.
We refer to this error term as ‘abnormal leasing’ (AbOplease) and employ it as an
additional explanatory variable in the capital structure model specified in Lemmon,
Roberts and Zender (2009) in Panel B.30
30 AbOplease remains significant in alternative models of capital structure, including models without the Initial Leverage variable.
We find support for our prediction. We find a
significant negative relation between conventional (book value) debt ratios and
AbOplease, our proxy for benefits from off-balance sheet financing. Consistent with H5,
increased unexplained leasing activity results in lower conventional debt levels.
C. Exploration of potential explanations
20
Given the significant trend in OBS lease financing, which is not confined to retail
and transportation firms and is not explained by financial distress or marginal tax rates,
an obvious question remains: Why are firms doing this? In particular, why should the
upward trend be greatest among firms least financially distressed? We searched for
potential explanations in popular financial press and posed these questions informally to
colleagues and to a handful of practitioners.31
Higher debt ratios are ubiquitously viewed as an indication of higher financial
risk. Simple levered beta calculations clearly suggest that firms with higher debt-to-
equity ratios face higher costs of capital. The first explanation we consider is that firms
intentionally structure leases to qualify for OBS treatment in order to appear more
conservatively financed. This supposes that many investors, resting on the work of
auditors, rely heavily on balance sheets and income statements as reported. Under
current GAAP, non-cancellable operating leases are not recognized in the financial
statements as a liability, however they must be reported in disclosure notes.
A host of potential (non-mutually-
exclusive) explanations strike us as plausible, though none appears sufficiently
compelling on its own. In this section, we consider these explanations for the excess
lease financing (that not explained by theoretical determinants) and attempt to provide
supportive evidence where possible.
(1) Hiding debt (risk) off the balance sheet?
32
31 We spoke informally an off the record to a bond trader, credit ratings analysts, and a Managing Director in private wealth management at a Bulge Bracket investment bank. 32 SFAS No. 13 requires disclosure of future minimum rental payments that are required as of the date of the latest balance sheet presented, in the aggregate and for each of the five succeeding fiscal years. This disclosure is required for all operating leases having noncancelable terms in excess of one year.
The
efficient markets hypothesis suggests that the manner in which information is
21
disseminated should have no effect on the valuation of the firm. However, empirical
research finds that information relegated to disclosure notes (such as OBS leases) is
weighted significantly less heavily than information recognized on balance sheets and
income statements.33
In order to demonstrate the potential impact of non-cancelable OBS lease
obligations on a ubiquitous measure of risk, we estimate levered equity betas that reflect
the full extent of non-cancellable OBS lease commitments and compare them to betas
that reflect only conventional accounting D/E ratios. We estimate (unlevered) asset betas
following the approach specified by Damodaran (2002).
This evidence suggests that the ability to structure leases and keep
disclosure off the balance sheet can lead to more favorable firm valuations.
To demonstrate the potential magnitude of the OBS financing, we offer the
example of Walgreen Company in Appendix B. Walgreen’s reported conventional (on-
balance-sheet) long term debt of $38.5 million in 2007 with $19,313 million in total
assets; the firm appears very conservatively financed. However, the firm’s OBS lease
commitments are considerable. We estimate that bringing this debt onto their balance
sheet results in 18,750% increase in their LTD / TA ratio. Before dismissing this as
merely a real estate phenomenon, we refer back to Table 3; this trend in financing assets
off the books is across industries, not confined to retail firms.
34
33 See Ahmed, et. al (2009), Aboody (1996) and Davis-Friday, et. al (1999), Hirshleifer and Teoh (2003), Barth et. al (2003) and Libby, et. al. (2005).. 34 Damodaran (2002) details the process of building forward-looking betas by levering asset betas in “Investment Valuation” second edition, Chapter 8. The process of levering asset betas as opposed to employing regression betas is to overcome the problems of high standard errors and the backward looking aspect (given that firms alter not only their debt ratios but also their asset mixes over time).
Specifically, for firms with
adequate data, we regress monthly stock returns on market returns to attain betas that
22
reflect the equity risk of each firm in the prior five year period.35
This exercise is not purely academic as FASB and IASB consider bringing all
material, long-term lease obligations onto the balance sheet. Figure 6 plots the difference
between these levered equity betas.
We then unlever each
beta according to its capital structure as follows:
βasset = βequity / (1+(D/E))
Next, we group firms into industries (as per table 2) and employ the average unlevered
beta as an estimate of asset risk typical of the industry. With this estimate of asset risk,
we lever beta for each firm, by industry, in two different ways. First, in accordance with
conventional accounting:
βequity = βasset (1+(D/E))
Thus far, we have estimated asset betas and levered them in accordance with
standard practice, as per Damodaran (2002). We also lever the asset betas using leverage
ratios attained by capitalizing the OBS lease obligations:
βequity = βasset {1+[(D+Oplease)/E]}
36
35 Requiring 60 months of CRSP stock returns reduces our sample size to 11,571 firms. We lose 3.4% of that sample by requiring a positive value of book equity in order to compute meaningful D/E ratios. 36 To the extent that these levered betas differ, and they clearly do, the argument can be made that the asset betas were estimated inaccurately. But our purpose here is not to offer an alternative methodology for computing a more precise forward-looking beta. Rather, our purpose is to demonstrate the impact of capitalizing OBS leases on the D/E ratio in a commonly used application.
The impact of OBS leases on the financial leverage
clearly results in a higher estimate of equity risk. Moreover, this impact increases over
time as the reliance on OBS leases increases (see Figures 6 and 1a). In 1980, the average
levered beta reflecting OBS lease obligations is 0.184 greater than the average levered
23
beta reflecting only conventional balance sheet debt. This difference grows to 0.333 in
2003 and 0.238 by 2007.37
It has been suggested that Qualified Institutional Investors (QIBs) should be more
sophisticated and better able to understand, value and adjust for these obligations.
38,39
In Table 5, we regress the abnormal OBS lease financing (the error term from the
GLS-based specifications found in Table 4 Panel A) on institutional holdings, an
indicator for credit rating (or, separately, an investment grade rating) and a measure of
analyst coverage. We control for firm size (log of firm value) and, separately, firm age.
One might also expect that credit ratings agencies and analysts covering these firms
should properly adjust for the risk of these off-balance-sheet obligations. However, the
conflicts of interest inherent in credit ratings agencies paid by issuers (and the analysts
employed by issuers’ underwriters) have been well documented.
It is important to note that only 15.5% of our sample has a credit rating from
S&P; (see Table 1). Moreover, while the average firm has 15.8% of its stock held by
QIBs, the median firm has none. Similarly, while the average firm has 1.9 annual analyst
recommendations, the median firm has none. With data on institutional investor holdings,
analyst coverage, and credit ratings, we can examine the extent to which these potential
monitors curtail the practice. But with low representation in our sample, we cannot
conclude that the existence of analysts, credit ratings, and QIBs deter firms in general.
37 Differences in medians are 0.121 in 1980, peaking at 0.207 in 2003 and landing at 0.162 by 2007. 38 SEC Rule 144a establishes the QIBs which are viewed as sufficiently savvy to be exempt from certain SEC protection. For instance, in the “144a market” QIBs are exempt from the two-year holding requirement for privately-placed debt faced by the investing public. Entities investing $100 million or more in unaffiliated issuers qualify. 39 It is worth noting that this expectation was not universal among those we surveyed. A counter argument was made that a typical analyst may be responsible many firms and thus may take balance sheet at face value. It was further suggested that to the extent analysts incorporate the footnote disclosures of these obligations they may at best employ ad hoc adjustments (such as 8x rent expense).
24
These results suggest firms with less institutional ownership and less analyst coverage
use OBS lease financing to a greater extent. Furthermore, though the relationship is less
significant, it appears that the presence of credit ratings is also inversely related to the
extent of OBS lease financing. Because we have controlled for the size and age of the
firm, this result should not merely reflect a sample selection issue.
It is important to note that we cannot bifurcate the sample and claim that firms
with higher levels of institutional ownership do not intentionally structure leases to keep
the debt off the balance sheet, only that they do so to a lesser extent. This leads to our
second potential explanation, which is that institutional investors are not fooled, but
rather are complicit in this practice.
(2) Yield chasing by fund managers?
Many institutional investors (pension fund managers, insurance companies) are
subject to regulatory risk guidelines, yet compensated based on return.40,41 Yield chasing
on the part of regulated fund managers is thought to have contributed to the over-
exposure of such funds to structured finance products (RMBS and CDOs) backed by
subprime mortgages.42
40 Risk guidelines for pension funds are set by the Employee Retirement Income Savings Act (ERISA) and insurance companies face similar guidelines set by state regulators. 41 Mutual funds not subject to the regulatory constraints faced by pension funds and insurance companies are to a lesser extent bound by the risk parameters established by the fund. For example, Fidelity offers a Taxable Bond Fund reported to “invest primarily in higher quality debt securities from government, corporate, and mortgage-backed issuers” and a High Yield Bond Fund reported to “invest in securities from corporations with non-investment-grade credit ratings”. The Taxable Bond Fund manager is presumably not indifferent to returns. 42 See Coval, Jurek, and Stafford (2009) and Kleit and Rodgers (2009).
Without inflated credit ratings, these structured markets are
greatly inhibited given the constraints of regulated bond investors [see Kleit and Rodgers
(2009)]. To the extent that credit ratings agencies do not accurately adjust for the risk
25
inherent in the off balance sheet obligations, similar yield chasing may be at play in the
market for corporate bonds. Fund managers bound by regulation or fund guidelines to
buy only those bonds rated (and perhaps at some arbitrary level) by a Nationally
Recognized Statistical Rating Organization (NRSRO)43 seek to invest in firms with less
obvious risk in order to generate higher returns. Without the credit ratings at or above
some threshold, these regulated institutional investors could not have purchased or held
risky securities.44
43 NRSROs are credit rating agencies whose opinions are relevant for meeting regulatory requirements. Over our sample period Moody’s and S&P were the 800 lb gorillas in this market. 44 According to Michael Lewis, heavily regulated institutional investors were not the only ones relying heavily on the opinions of the NRSROs. The following quote is taken from Liar’s Poker (1989): “Money managers relied on the debt-rating agencies to tell them what was safe (or, rather, to sanction their investments so they did not appear imprudent.) But the rating services, like the commercial banks, relied almost exclusively on the past – corporate balance sheets and track records – in rendering their opinions. The outcome of the analysis as determined by the procedure rather than by the analyst. This was a poor way to evaluate any enterprise, be it new and small, or old, large and shaky.”
It is important, therefore to examine the treatment of operating leases
by the credit rating agencies.
We consider here the approaches employed by Moody’s Investors Service and by
Standard & Poors. Rather than discount actual non-cancellable lease commitments,
Moody’s advocates multiples of operating lease (rent) expense to estimate the value of
operating leases [Moody’s (1999)]. One problem with this approach is that only existing
signed commitments are non-cancellable and thus analogous to debt. The use of
multiples assumes leases are perpetually renewed. This may be the case in general, but
until obligations are signed, firms have the option should they face unexpected changes in
market conditions. Moody’s methodology, though easy to understand, simple to compute,
and likely accurate on average, is also likely to over-estimate the obligations of firms that
ultimately face distress.
26
Standard & Poor’s, on the other hand, does take care to value actual non-
cancellable lease commitments. However, S&P discounts future commitments at firm-
specific rates intended to reflect firm-specific cost of on-balance-sheet debt.45
Specifically, S&P compute a firm-specific discount rate as Interest Expense divided by
Average Conventional Debt, using data from the most recent annual report. Thus, firms
with high conventional debt ratios are perversely given the benefit of higher discount
rates. This approach systematically under-states the extent of off-balance-sheet leasing
for firms with higher conventional debt relative to firms with lower conventional debt.46
There may be an income statement motivation beyond any balance sheet
motivation. Firms generating income with assets they do not technically own may
improve asset utilization measures.
This disproportionately under-penalizes firms with both on-balance-sheet and off-balance
debt. In a cross-sectional regression, this induces a spurious negative relationship
between conventional debt and the propensity to lease (via the operating lease structure).
(3) Asset utilization?
47 Firms may not just be removing debt from the
balance sheet, but removing assets in order to improve their income as a percentage of
assets.48
45 Standard & Poor’s (2006). 46 Consider, for example, two firms with the same assets – both on and off the books. Assume Firm A employs 50% debt and 50% equity financing for their on-balance sheet assets while Firm B uses 100% equity financing. S&P will employ a much higher discount rate (leading to a lower valuation) when valuing the OBS debt in Firm A relative to Firm B which has signed the same lease contracts for the same OBS assets. 47 Operations management defines and measures asset utilization in terms of production output and total capacity; Ellis (1998). However, financial managers and analysts are likely more concerned with generating revenues and maximizing profitability than with fully utilizing capacity.
As the case of Walgreens (detailed in Appendix B) demonstrates, the affect on
27
ROC when assets are removed from the balance sheet can be material. Assuming straight
line depreciation over the term of the lease, Walgreens’ ROC would have fallen 7.6% in
fiscal 2007 if the leased assets had been capitalized.49
In Figure 7, we estimate the impact on ROC for our entire sample of firms and
demonstrate the impact separately for firms with positive and firms with negative
earnings in order to show a leverage effect. Specifically, we first divide the sample into
quintiles based on relative reliance on OBS leases. For each Oplease/assets quintile, we
compute the difference between Return on Capital (ROC) under conventional accounting
and ROC estimates after bringing OBS leases onto the balance sheet, then scale the
difference by total assets.
50 As demonstrated in the Walgreens anecdote, capitalizing
OBS leases impacts the income statement as well as the balance sheet. We follow the
EBIT and ROC estimation detailed in Appendix B.51
The estimated ROC improvement from moving assets off the balance sheet is
found among profitable firms. This evidence is interesting given earlier (Figure 2)
evidence that the upward trend in OBS leasing is not attributable to an upward trend in
48 While the effect OBS leasing on debt ratios is always the same directionally, the affect on income is somewhat ambiguous There are competing effects of operating leases on income: rent expense lowers income, but income is raised due to forgone interest payments and asset depreciation. While the net effect on income varies by depreciation schedule and such, ROC is likely increased as the denominator shrinks when assets are OBS. In fact, Ross, Westerfield, Jaffe, 1993, state on page 694 “We indicated that a firm desiring to project a strong balance sheet might select an operating lease. In addition, the firm’s ROA is generally higher with an operating lease than with either a capitalized lease or a purchase.”
49 It is important to note that this trend in OBS leasing is not confined to retail firms such as Walgreens leasing real estate or to transportation firms leasing trucking fleets or aircraft. Table 3 indicates that this trend is significant across industries. 50 Plots of unscaled differences in ROC appear the same but on a different scale.
51 Some caveats regarding these figures. First, we rely on the marginal tax rates (obtained from John Graham) that estimate taxes under conventional accounting. The evidence in GLS suggests a relationship between leasing and taxes that may result in higher marginal tax rates if OBS leases were capitalized. Second, our estimated straight line depreciation imperfectly reflects the Modified Accelerated Cost Recover System (MACRS) depreciation of these (unobservable) assets. If these OBS assets were on the balance sheet, depreciation would likely be higher in earlier years and decline over time. However, higher depreciation in early years would depress ROC even more than our estimate suggests.
28
financial distress, but rather is found among firms least likely to be bankrupt. Firms with
highest Oplease relative to on-balance-sheet assets appear to perform especially well in
terms of ROC when earnings are positive, but appear to perform poorly if earnings go
negative. It appears that moving assets off the balance sheet is a leverage tradeoff for this
common measure of asset utilization. By moving debt off the balance sheet, ROC is
higher in good times but this strategy is risky since in bad times this behavior inflates the
negative ROC.
While ROC measures how effectively management utilizes its assets to create
income, analysts interested in ‘asset utilization’ also measure the percentage of sales
needed to cover wear and tear of assets (Depreciation / Sales). For each Oplease/assets
quintile in Figure 8, we plot the difference between our estimate of Depreciation / Sales
after capitalizing OBS leases and Depreciation / Sales under conventional accounting.
Clearly this ratio increases by moving assets off the balance sheet. The average change
in this ratio is 9% for the entire sample, but average difference among the quintile of
firms with greatest relative OBS leases is over 20%.
(4) Risk management?
Consider the risk management arguments for the use of project finance. Project
finance is often preferable to corporate finance in cases such as the B.P. Amoco
investment in the Azerbaijan oil fields.52
52 Esty and Kane (2003a and 2003b) explain this case in greater detail.
Faced with the risk of expropriation by host
governments, entrepreneurial host country criminals, financial distress by foreign
partners (Lokoil), and uncertainty regarding pipelines, firms such as B.P. are willing to
pay higher interest rates to borrow money from host country banks whose only recourse
29
is the assets in the host country.53
Heretofore, we have discussed the lease versus buy decision (and the choice to
structure leases to qualify for OBS financing) as a choice made by borrowing firms.
However, the driving motivation may belong instead to the suppliers of capital. Lenders
may prefer to retain ownership of the asset for multiple reasons including the tax benefit
of depreciation and less risk of loss in the case of bankruptcy. In this case, lenders
(lessors) may offer more attractive operating lease terms than capital lease terms (or
traditional debt financing). We include in our regression models the marginal tax rate of
the borrowing firm, but the (unobservable) marginal tax rate of the lender (lessor) is also
important. Moreover, while the case of Eastern Airlines may not signal a regime shift in
Title 11 interpretation, it clearly demonstrates an incentive for creditors to retain control
of their collateral.
This risk containment rationale may extend to
investments in markets (product or geographic) that are unknown to a particular firm.
Should such investment underperform expectations, leased assets have an embedded put
option that can be exercised without risking the balance sheet assets. Because the lessor
can only repossess the leased asset in the case of default, one motivation for lease
financing may be akin to project finance motives: risk isolation.
(5) A supply story, not a demand story?
54
53 The quasi-governmental lenders such as IFC and World Bank also play an important role in such international investments. But the risk containment to the project may be compelling even in high risk domestic investments. 54 See Weiss and Wruck (1998).
To the extent that maintaining ownership of the asset (through
operating leases) mitigates this risk, the preference for keeping assets off the borrowing
firms’ balance sheets may stem from the financier.

30
Finally, with respect to suppliers of capital, we note that Wall Street was seeking
new sources of marginal financing over this period. Consider, for example, the explosion
in structured finance markets that maps well to our latter sample period market by the
increase in OBS leasing. Our trend in lease financing may be supply-side innovation
more than concern by borrowers about their balance sheets. This is consistent with our
results suggesting that the increase in operating leases is in addition to (not merely in lieu
of) on-balance-sheet debt financing.
The following quote explains the OBS innovation in response to a regulatory
constraint faced by a particular sector.
The Mortgage trading desk evolved from corner shop to supermarket. By increasing the number of products, they increased the number of shoppers. The biggest shoppers, the thrifts, often had a very particular need. They wanted to grow beyond the limits imposed by the Federal Home Loan Bank Board in Washington. It was a constant struggle to stay one step ahead of thrift regulators in Washington. Many “new products” invented by Salomon Brothers were outside the rules of the regulatory game; they were not required to be listed on thrift balance sheets and therefore offered a way for thrifts to grow. In some cases, the sole virtue of a new product was in its classification as “off-balance sheet”.55
Leases financing has long been offered by commercial banks and equipment
manufacturers interested in increasing revenues from marginal customers who may
This motivation cannot cleanly be extrapolated to industrials, but demonstrates the
industry- and perhaps firm-specific benefits to OBS lease financing captured in the error
term in Table 4 Panel A.
D. Who are the lessors?
55 Quote taken form “Liar’s Poker” by Michael Lewis (1989), page 138-9.
31
otherwise lack the requisite capital for a traditional (debt- or equity-financed) purchase.
It appears that much of the increase in OBS leasing is attributable to growth in third-party
lessors. Firms like AerCap Holding N.V. (AER) and Aircastle Ltd (AYR) both of which
lease (but do not manufacture) aircraft to U.S airlines have seen remarkable growth over
the latter part of our sample period.56,57
In order to demonstrate growth in the leasing industry from the lessor perspective,
we report in Table 6 lessors by SIC along with their total assets at three points in time:
fiscal years 1980, 1995, 2007.
Indeed, the largest aircraft lessor, International
Lease Finance Corp (ILFC), is a third-party lessor rather than a manufacturer.
58
This is the first of two caveats regarding these data. Because the largest lessors
are either subsidiaries of larger firms in broader industries (including GE Capital
Tejon Ranch Compnay (NYSE: TRC), which leases
farmland and oil fields, is represented in SIC 6519 in all three years reported. Total
assets for Tejon are $29,826,000 in 1980, $45,203,000 in 1995 and $175,503,000 in
2007. Cumulative (average) total assets in SIC 7359, which contains AerCap Holding
(AER) and Aircastle Ltd (AYR) mentioned above, increased from $2,369,101,000
($139,358,900) in 1980 to $81,381,100,000 ($3,538,309,000) in 2007. Growth in SIC
7377 appears to have peaked in the 1990s and waned since. However, negative growth in
SIC 7377 (computer rentals and leasing) may be misleading as this SIC does not include
the largest computer lessors, such as IBM.
56 AerCap Holding fleet includes models from Airbus, Boeing, and McDonnell-Douglas. Aircastle's aircraft portfolio consists of 130 passenger and freighter aircraft leased to 58 lessees located in 32 countries. 57 Market capitalization (from CRSP) for AER increased from $15,415,000 to $255,961,000 over the period January 1980 through December 2008. AYR was not listed on CRSP until late 2006 with December 2008 market cap $375,813,200. 58 Additional SIC codes pertaining to leasing are found at OSHA.gov. Those tabulated are those containing firms covered by Compustat. We discarded SIC 6794 “Patent Owners and Lessors” which are firms leasing franchises such as Choice Hotels and Dunkin Donuts.
32
Aviation Services, Textron, Deere, IBM, etc.) or are not publicly traded (International
Lease Finance Corp) the data reported in Table 6 severely underestimate the magnitude
of the leasing industry. Additionally, some firms represented in these data are likely
leasing on a smaller scale to consumers rather than corporations.59
The models of GLS examine the lease versus buy decision with separate models
of operating leases, capital leases, and conventional debt, each scaled by total firm value.
Here, we are especially interested in the mix of off- and on-balance sheet debt and thus
construct models of OBS leases scaled by balance sheet debt. These regression models
are reported in Table 7. Independent variables include lessee marginal tax rate, an
estimate of collateral value (of on-balance-sheet assets), Z-Score, market-to-book (proxy
for growth opportunities), investment in R&D (proxies for intangible assets and growth),
firm size (or firm age), indicator variables for retail and transportation firms, and a
dummy variable for the period 1996-2007 (motivated by Figure1a). As expected, lessee
marginal tax rate is negatively related to the propensity to lease assets. Lessees unable to
Thus, we cannot
make strong claims based on these data, but the growth seen here is consistent with
growth in third-party leasing companies such as AER, AYR and ILFC.
E. Modeling the mix of On- and Off-balance sheet debt
Figure 1 and Table 2 suggest that OBS lease financing appears not only to replace
capital leases (as firms intentionally structure contracts to meet GAAP requirements) but
also reflects a significant increase in debt. In this subsection, we consider the choice to
finance assets off the balance sheet.
59 For example, SIC code 7359 contains Rent-A-Center as well as AT&T Capital, AER and AYR.
33
fully utilize interest and depreciation tax shields transfer them to lessors facing higher
marginal tax rates, who can in turn offer a lower cost of financing.
Fixed assets of general usage lend themselves better to lease financing than more
specialized assets with fewer alternative uses. For firms without access to capital markets,
specialized assets may be financed with capital (rent to own) leases on the balance sheet,
but unlikely structured as operating leases since the assets have less marketable value to
the lessor (unless the motivation is keeping debt off the balance sheet). So, the negative
relationship between our estimate of collateral value (of on-balance-sheet assets) and the
use of OBS leases is unexpected. Our measure of asset tangibility (employed in two
models) is also significantly negative. We note that the observed collateral value
(tangibility) of ON-balance-sheet assets at best imperfectly indicates the (unobserved)
collateral value of OBS assets. However, we cannot conclude that OBS lease financing is
contained to firms marked by more general assets. Firms with more specialized assets are
clearly using OBS leases. This interpretation is supported further by the significant
positive coefficient on R&D (intangible off-balance-sheet assets).
Theory predicts a positive relationship between financial distress and OBS leasing
activity. The “lender of last resort” argument stems from the priority of lessors’ claims in
bankruptcy proceedings and this relation is thus likely to be strongest for leases classified
as operating leases that ostensibly never intend to transfer ownership. This is consistent
with the positive relationship between OBS lease financing and Z-Score.
Drawing on the underinvestment problem associated with fixed-cost financing
(see Myers, (1977)) GLS suggest that firms with more growth options in their investment
opportunity sets should have a lower proportion of fixed claims in their capital structure.
34
Consistent with this, GLS report significantly negative coefficients on MTB in
regressions of debt-to-value, capital leases-to-value, and operating leases-to-value.
However, Stulz and Johnson (1985) suggest that the ability to finance new investment
with higher priority claims (including leases) can alleviate this underinvestment problem.
That is, while OBS leases are indeed fixed claims, their higher priority claim changes
their impact on investment.
Motivated in part by Stulz and Johnson and in part by the “risk management”
rationale advanced in the section above, we posit that leasing assets off the balance sheet
offers an attractive compromise between conventional debt and equity for firms with
higher growth options. Growth options are riskier than assets in place. The ability to
contain risk by leasing assets may allow funding marginal projects. So, while GLS
document negative relationships between growth options and the lease-to-value ratio
(which reflects a fixed costs as a percentage of firm value) we expect to find a positive
relation between growth options and the ratio of OBS leases to on-balance sheet debt
(which reflects fixed costs off- and on- balance sheet). In Table 7 we document a
significantly positive relationship between OBS financing and conventional proxies for
growth opportunities, R&D (scaled by total sales) and the Market-to-Book ratio (defined
as per GLS in Appendix A). These results are consistent with those reported in Figure 5.
Our control for firm size is negatively related to the proportion of debt moved off
the balance sheet (significant in most models). This may be mechanical: observable firm
size is greater when assets are kept on the balance sheet.60
60 This negative relationship holds when firm size is gauged with market values as well as book values. The extent to which the market incorporates these assets is unclear; see sections V.C.1 and V.C.2 above.
However, models employing
35
firm age rather than firm size also find that more mature firms have a smaller proportion
of debt off their balance sheets.
Finally, we obtain the positive coefficients expected in two indicator variables.
Retail firms have a significantly higher proportion of debt kept off the balance sheet
(reflecting the lease financing of their real estate). However, transportation firms (which
also have highly generalized assets) are not significantly different. As the results in
Figure 1a and Table 2 suggest, the dummy variable for the period 1996-2007 indicates a
significantly greater propensity to lease OBS in this latter part of the sample.
VI. Conclusion
Given the imperfect and inconsistent treatment of operating (OBS) lease financing
by credit rating agencies, perhaps it is not surprising that regulators and popular financial
press contend that firms intentionally structure leases to qualify for OBS accounting
treatment in order to hide non-cancellable commitments.
We document remarkable trends: mean OBS leases (as a percentage of total debt)
increases 745% from 1980 to 2007, while capital leases to total debt decreases 49.8%.
We also find that the benefit of the OBS accounting treatment of lease financing is a
significant determinant of corporate capital structure: as excess OBS leasing increases,
conventional debt ratios fall. This substitution notwithstanding, we find that the increase
in OBS leases is largely in addition to, not in lieu of, on-balance-sheet debt. This
marginal source of financing has increased financial risk across time. If leased assets
were brought onto the balance sheet average debt-to-capital ratios would move from 20%
ballpark to 30-35% over our 1980-2007 sample.
36
This evidence from our trend analysis is time series. However, our potential
explanations are largely cross-sectional. We cannot identify any one fully explanatory
catalyst to this change in corporate behavior, but the fact remains that the trend is
material and consequential. Because OBS leases are long-term, non-cancelable
obligations (i.e., debt), risk metrics such as conventional debt and coverage ratios,
conventional levered equity betas, and Adjusted O- and Z-Scores (which ignore OBS
obligations) no longer fully capture financial risk.
Our results should be of interest to a host of market participants as the US
considers changes in the OBS accounting treatment of lease financing. Our results
suggest that benefits from the OBS treatment influence corporate decision-making and
provides some support for these proposed changes. However, to the extent that theoretical
determinants of leasing maintain explanatory power, a rule that requires capitalizing all
operating leases may not be appropriate. We offer a similar caution to information
intermediaries that apply “one-size-fits-all” adjustments for operating leases.
37
References
Aboody, D., 1996, Recognition versus disclosure in the oil and gas industry. Journal of Accounting Research 34 (supplement) 21-32.
Ahmed, Anwer S., Emre Kilic and Gerald J. Lobo, 2009, Does recognition versus
disclosure matter? Evidence from value-relevance of banks’ recognized and disclosed derivative financial instruments, The Accounting Review (forthcoming)
Altamuro, Jennifer, Rick Johnston, Shail Pandit, and Haiwen Zhang. 2008. Operating
leases and credit assessments. The Ohio State University, working paper. Baker, M., and J. Wurgler, 2002, Market timing and capital structure, Journal of Finance
57, 1-32. Barry, C.B., S.C. Mann, V.T Mihov, and M. Rodriguez, “Corporate Debt Issuance and
the Historical Level of Interest Rates” Financial Management 37, 413-430. Barth, Mary, G. J. Clinch, and T. Shibano. 2003. Market effects of recognition and
disclosure. Journal of Accounting Research 41 (September) 581-609. Beattie, V., K. Edwards, A. Goodacre. 1998. The impact of constructive operating lease
capitalization on key accounting ratios. Accounting and Business Research (Autumn): 233-254.
Berger, P. G., E. Ofek, and D. L. Yermack, 1997, Managerial entrenchment and capital
structure decisions, Journal of Finance 52, 1411-1438. Bradley, M., G. A. Jarrell, and E. H. Kim, 1984, On the existence of an optimal capital
structure: Theory and evidence, Journal of Finance 39, 857-878. Cao, Charles, Timothy Simin, Jing Zhao, 2008, Do Growth Options Explain the Trend in
Firm Specific Risk?, Review of Financial Studies, 2008, 21(6), pp. 2599-2634. Davis-Friday P.Y., L.B. Folami, C. Liu, and H.F. Mittelstaedt, 1999, The value
relevance of financial statement recognition vs. disclosure: Evidence from SFAS No. 106. The Accounting Review 74 403-423.
DeAngelo, H. and R. Masulis, 1980, Optimal capital structure under corporate and
personal taxation, Journal of Financial Economics 8, 3-29. Dittmar, A., 2004, Capital structure in corporate spin-offs, Journal of Business 77, 9-43. Ellis, Richard, 1998, Asset Utilization: A Metric for Focusing Reliability Efforts.
Ely, Kirsten M. 1995. Operating lease accounting and the market’s assessment of equity risk. Journal of Accounting Research 33, 397-415.
38
Esty, Benjamin and Michael Kane, 2003 (a), BP Amoco: Policy Statement on the Use of Project Finance, HBS case no 9-201-054.
Esty, Benjamin and Michael Kane, 2003 (b), BP Amoco: Financing Development of the Caspian Oil Fields, HBS case no 9-201-067.
Fama, E.F., and K.R. French, 2002, Testing trade-off and pecking order predictions about
dividends and debt, Review of Financial Studies 15, 1-33. Frank, M.Z., and V.K. Goyal, 2009, “Capital Structure Decisions: Which Factors Are
Reliably Important?”, Financial Management 38, 1-37. Franzen, Laurel A., Kimberly J. Rodgers, and Timothy T. Simin. Measuring distress
risk: The effect of R&D intensity. Journal of Finance 6, 2931-2967. Ge, Weili. 2006. OBS activities, earnings persistence and stock prices: Evidence from
operating leases. University of Washington, working paper. Ge, Weili, Gene Imhoff, Lian Fen Lee. 2008. Investment decisions and off-balance
sheet leases: Do we really need further rule change? University of Michigan, working paper.
Graham, John R. and C. Harvey, 2001, “The Theory and Practice of Corporate Finance:
Evidence from the Field” Journal of Financial Economics 60, 187-243. Graham, John R., Michael L. Lemmon, and James.S. Schallheim, 1998, Debt, leases,
taxes, and the endogeneity of corporate tax status, Journal of Finance 53, 131-162.
Hirshleifer, David A, and S. H. Teoh, 2003, Limited attention, information disclosure,
and financial reporting. Journal of Accounting and Economics 36, 337-387. Hovakimian, A., G. Hovakimian, and H. Tehranian, 2004, Determinants of target capital
structure: The case of dual debt and equity issues, Journal of Financial Economics 71, 517-540.
Hovakimian, A., T. Opler, and S. Titman, 2001, The debt-equity choice, Journal of
Financial and Quantitative Analysis 36, 1-24. Imhoff, E., R.C. Lipe, and D.W. Wright. 1993. The effects of recognition versus
disclosure on shareholder risk and executive compensation. Journal of Accounting, Auditing and Finance 8, 335-368.
Jovanovic and Rousseau (2001), "Why Wait? A Century of Life Before IPO", AEA
Papers and Proceedings 91:3, pp. 336-41.
39
Kim, E.H., 1982, Miller’s equilibrium, shareholder leverage clienteles, and optimal capital structure, Journal of Finance 37, 301-318.
Kleit, Andrew and Kimberly Rodgers, 2009, Competition and Market Failure in the
Market for Credit Ratings, Penn State University working paper. Krishnan, V. Sivarama and R. Charles Moyer. 1994. Bankruptcy costs and the financial
leasing decision. Financial Management 23, 31-42. Lemmon, Michael L., Michael R. Roberts, and Jaime F. Zender, 2008, Back to the
beginning: Persistence and the cross-section of corporate capital structure, Journal of Finance (Forthcoming)
Levitt, Arthur Jr. 2003, The SEC’s repair job, Wall Street Journal, February 10, A14. Libby, Roberth, Mark W. Nelson and James E. Hunton, 2005, Recognition versus
disclosure and auditor misstatement correction: The cases of stock compensation and leases, Cornell University working paper.
Lim, S., S. Mann, and V. Mihov, 2003, Market evaluation of off-balance sheet financing:
You can run, but you can’t hide, Texas Christian University working paper. MacDonald, Elizabeth, 2007, Debt hazards ahead, Forbes, June 18. MacKie-Mason, J. K., 1990, Do taxes affect corporate financial decisions?, Journal of
Finance 45, 1471-1493. McConnell, J.J., and J.S. Schallheim, 1983, Valuation of Asset Leasing Contract, Journal
of Financial Economics 12, pp.237-261. Mehrotra, V., W. Mikkelson, and M. Partch, 2003, The design of financial policies in
corporate spinoffs, Review of Financial Studies 16, 1359-1388. Miller, Paul B.W. and Paul R. Bahnson. 2008. The Spirit of Accounting: Clearing the
air: OBS financing is dysfunctional. Accounting Today 22, 15. Modigliani, F. and M. Miller, 1963, Corporation Income Taxes and the Cost of Capital:
A Correction, American Economic Review 53, 433-443. Modigliani, F., 1982, Debt, dividend policy, taxes, inflation, and market valuation,
Journal of Finance 37, 255-273. Moody’s Investors Service, 1999, Off-Balance Sheet Leases: Capitalization and Ratings
Implications; Out of Sight But Not Out of Mind. Myers, S. C., 1984, The capital structure puzzle, Journal of Finance 39, 575-592.
40
Myers, S. C., and N. Majluf, 1984, Corporate financing and investment decisions when firms have information investors do not have, Journal of Financial Economics 13, 187-221.
Reason, Tim. 2005. Hidden in plain sight. CFO Magazine, August 1, 2005. Ross, Westerfield, Jaffe, 1993, Corporate Finance 3rd edition. Securities and Exchange Commission (SEC), 2005, Report and recommendations
pursuant to Section 401(c) of the Sarbanes-Oxley Act of 2002 on arrangements with off-balance sheet implications, special purpose entities, and transparency of filings by issuers. Washington, D.C.
Sharpe, Steven A. and Hien H. Nguyen. 1995. Capital market imperfections and the
incentive to lease. Journal of Financial Economics 39, 271-294. Shyam-Sunder, L. and S. C. Myers, 1999, Testing static trade-off against pecking order
models of capital structure, Journal of Financial Economics 51, 219-244. Smith, C.W. and L. M. Wakeman, 1985, Determinants of Corporate Leasing Policy,
Journal of Finance 40, pp. 895-908. Standard and Poor’s, 2006, Corporate Ratings Criteria. Stulz, R, and H. Johnson, 1985, An analysis of secured debt, Journal of Financial
Economics 14, 501-521. Titman, S., and R. Wessels, 1988, The determinants of capital structure choice, Journal
of Finance 43, 1-19. Vogelsang, Timothy J., 1998, Trend Function Hypothesis Testing in the Presence of
Serial Correlation, Econometrica, 66(1), 123-148. Weiss, Lawrence A. and Karen H. Wruck, 1998, Information problems, conflicts of
interest, and asset stripping: Chapter 11’s failure in the case of Eastern Airlines, Journal of Financial Economics 48, 55-97.
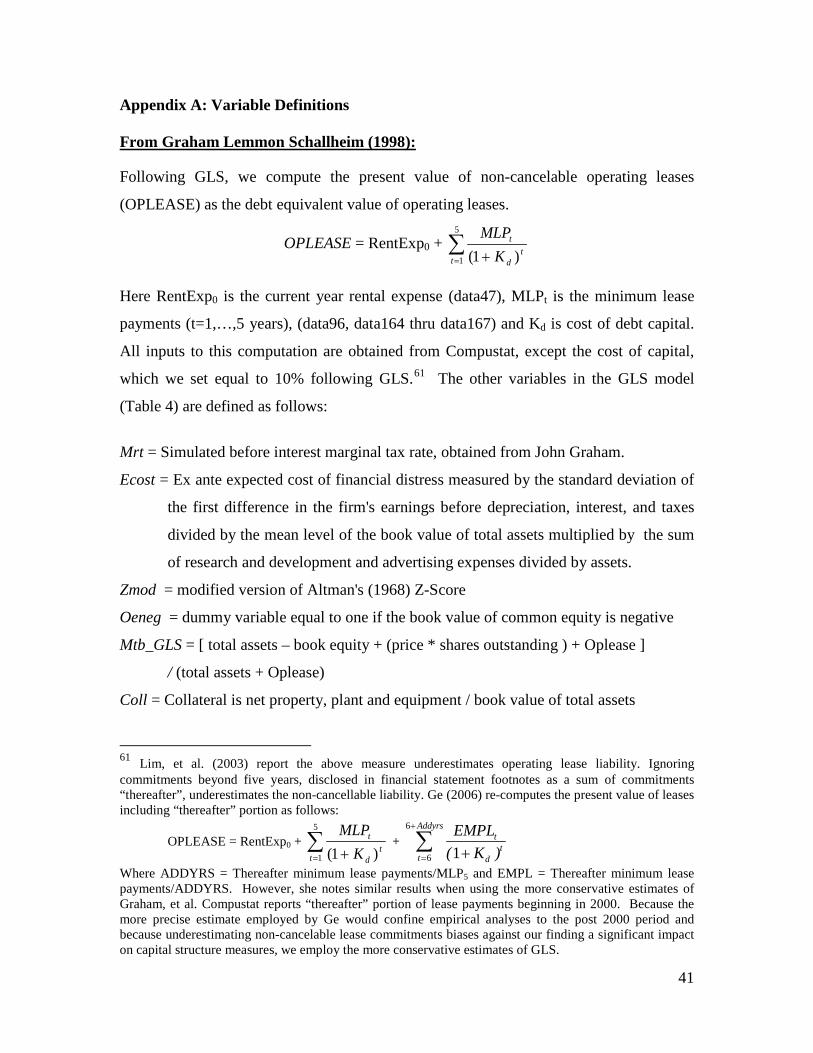
41
Appendix A: Variable Definitions From Graham Lemmon Schallheim (1998):
Following GLS, we compute the present value of non-cancelable operating leases
(OPLEASE) as the debt equivalent value of operating leases.
OPLEASE = RentExp0 + ∑= +
5
1 )1(tt
d
t
KMLP
Here RentExp0 is the current year rental expense (data47), MLPt is the minimum lease
payments (t=1,…,5 years), (data96, data164 thru data167) and Kd is cost of debt capital.
All inputs to this computation are obtained from Compustat, except the cost of capital,
which we set equal to 10% following GLS.61
61 Lim, et al. (2003) report the above measure underestimates operating lease liability. Ignoring commitments beyond five years, disclosed in financial statement footnotes as a sum of commitments “thereafter”, underestimates the non-cancellable liability. Ge (2006) re-computes the present value of leases including “thereafter” portion as follows:
OPLEASE = RentExp0 +
The other variables in the GLS model
(Table 4) are defined as follows:
Mrt = Simulated before interest marginal tax rate, obtained from John Graham.
Ecost = Ex ante expected cost of financial distress measured by the standard deviation of
the first difference in the firm's earnings before depreciation, interest, and taxes
divided by the mean level of the book value of total assets multiplied by the sum
of research and development and advertising expenses divided by assets.
Zmod = modified version of Altman's (1968) Z-Score
Oeneg = dummy variable equal to one if the book value of common equity is negative
Mtb_GLS = [ total assets – book equity + (price * shares outstanding ) + Oplease ]
/ (total assets + Oplease)
Coll = Collateral is net property, plant and equipment / book value of total assets
∑= +
5
1 )1(tt
d
t
KMLP
+ 6
6 1
Addyrst
tt d
EMPL( K )
+
= +∑
Where ADDYRS = Thereafter minimum lease payments/MLP5 and EMPL = Thereafter minimum lease payments/ADDYRS. However, she notes similar results when using the more conservative estimates of Graham, et al. Compustat reports “thereafter” portion of lease payments beginning in 2000. Because the more precise estimate employed by Ge would confine empirical analyses to the post 2000 period and because underestimating non-cancelable lease commitments biases against our finding a significant impact on capital structure measures, we employ the more conservative estimates of GLS.
42
Size = log (book assets), where assets are deflated by the GDP-deflator.
d2000 = Dummy for SIC codes 2000-2999
d3000 = Dummy for SIC codes 3000-3999
d4000 = Dummy for SIC codes 4000-4999
d86 = Dummy for 1986
d8792 = Dummy for 1987-1992
From Lemmon, Roberts & Zender (2008):
Variables employed in the LRZ model of Table 4 are as computed as follows: Book Leverage = total debt / book assets (6).
Total Debt = short term debt (34) + long term debt (9).
Intlev = Initial leverage is the first non-missing value for leverage
LnSale = Log (sales) = log (data12)
Market-to-Book = (market equity + total debt + preferred stock liquidating value (10) –
deferred taxes and investment tax credits (35)) / book assets.
Profitability = operating income before depreciation (13) / book assets.
Tangibility = net PPE / book assets.
Indmedlev = Industry median leverage defined using Fama French 38 industries.
Cash Flow Volatility = the standard deviation of historical operating income requiring at
least three years of data.
DivPay = Dividend payer 1 if pays dividends (if data21>0), 0 otherwise
Additional variables:
In addition to the variables employed in the GLS and LRZ models of Table 4, we also
employ the following in subsequent analyses:
Research and Development = R&D intensity is defined as annual R&D expense (data 46) scaled by total sales (data 12).
Average Annual Analyst Recommendations = the average number of analysts each year for a given firm as listed in I/B/E/S
Percentage stock held by QIBs = the shares held by institutional investors over the year as a fraction of the total number of shares outstanding found in the Spectrum database.
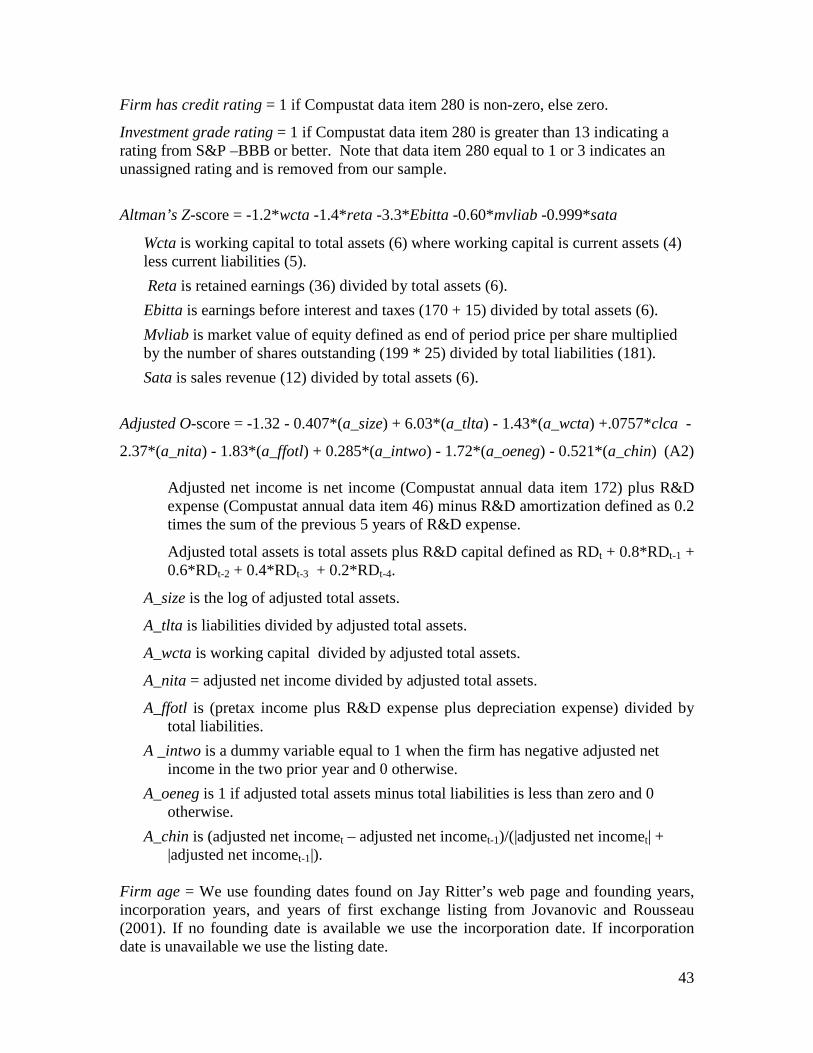
43
Firm has credit rating = 1 if Compustat data item 280 is non-zero, else zero.
Investment grade rating = 1 if Compustat data item 280 is greater than 13 indicating a rating from S&P –BBB or better. Note that data item 280 equal to 1 or 3 indicates an unassigned rating and is removed from our sample.
Altman’s Z-score = -1.2*wcta -1.4*reta -3.3*Ebitta -0.60*mvliab -0.999*sata
Wcta is working capital to total assets (6) where working capital is current assets (4) less current liabilities (5).
Reta is retained earnings (36) divided by total assets (6).
Ebitta is earnings before interest and taxes (170 + 15) divided by total assets (6).
Mvliab is market value of equity defined as end of period price per share multiplied by the number of shares outstanding (199 * 25) divided by total liabilities (181).
Sata is sales revenue (12) divided by total assets (6).
Adjusted O-score = -1.32 - 0.407*(a_size) + 6.03*(a_tlta) - 1.43*(a_wcta) +.0757*clca -
2.37*(a_nita) - 1.83*(a_ffotl) + 0.285*(a_intwo) - 1.72*(a_oeneg) - 0.521*(a_chin) (A2)
Adjusted net income is net income (Compustat annual data item 172) plus R&D expense (Compustat annual data item 46) minus R&D amortization defined as 0.2 times the sum of the previous 5 years of R&D expense.
Adjusted total assets is total assets plus R&D capital defined as RDt + 0.8*RDt-1 + 0.6*RDt-2 + 0.4*RDt-3 + 0.2*RDt-4.
A_size is the log of adjusted total assets.
A_tlta is liabilities divided by adjusted total assets.
A_wcta is working capital divided by adjusted total assets.
A_nita = adjusted net income divided by adjusted total assets.
A_ffotl is (pretax income plus R&D expense plus depreciation expense) divided by total liabilities.
A _intwo is a dummy variable equal to 1 when the firm has negative adjusted net income in the two prior year and 0 otherwise.
A_oeneg is 1 if adjusted total assets minus total liabilities is less than zero and 0 otherwise.
A_chin is (adjusted net incomet – adjusted net incomet-1)/(|adjusted net incomet| + |adjusted net incomet-1|).
Firm age = We use founding dates found on Jay Ritter’s web page and founding years, incorporation years, and years of first exchange listing from Jovanovic and Rousseau (2001). If no founding date is available we use the incorporation date. If incorporation date is unavailable we use the listing date.
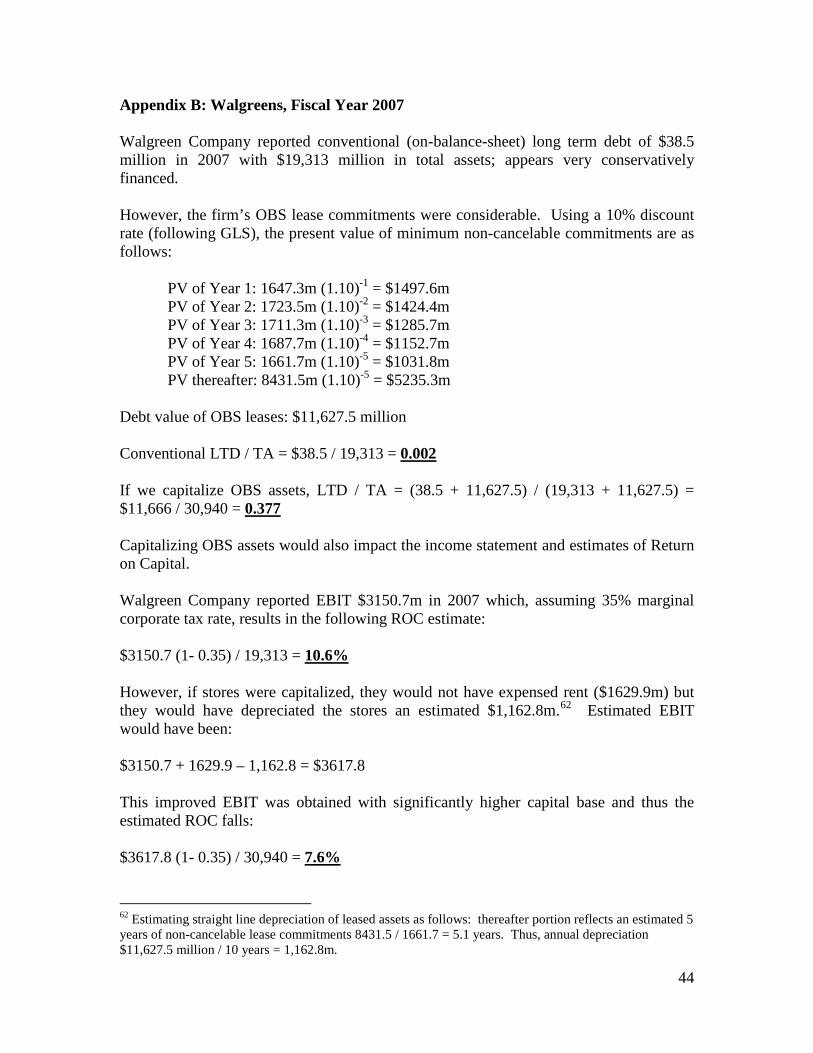
44
Appendix B: Walgreens, Fiscal Year 2007 Walgreen Company reported conventional (on-balance-sheet) long term debt of $38.5 million in 2007 with $19,313 million in total assets; appears very conservatively financed. However, the firm’s OBS lease commitments were considerable. Using a 10% discount rate (following GLS), the present value of minimum non-cancelable commitments are as follows:
PV of Year 1: 1647.3m (1.10)-1 = $1497.6m PV of Year 2: 1723.5m (1.10)-2 = $1424.4m PV of Year 3: 1711.3m (1.10)-3 = $1285.7m PV of Year 4: 1687.7m (1.10)-4 = $1152.7m PV of Year 5: 1661.7m (1.10)-5 = $1031.8m PV thereafter: 8431.5m (1.10)-5 = $5235.3m
Debt value of OBS leases: $11,627.5 million Conventional LTD / TA = $38.5 / 19,313 = 0.002 If we capitalize OBS assets, LTD / TA = (38.5 + 11,627.5) / (19,313 + 11,627.5) = $11,666 / 30,940 = 0.377 Capitalizing OBS assets would also impact the income statement and estimates of Return on Capital. Walgreen Company reported EBIT $3150.7m in 2007 which, assuming 35% marginal corporate tax rate, results in the following ROC estimate: $3150.7 (1- 0.35) / 19,313 = 10.6% However, if stores were capitalized, they would not have expensed rent ($1629.9m) but they would have depreciated the stores an estimated $1,162.8m.62
62 Estimating straight line depreciation of leased assets as follows: thereafter portion reflects an estimated 5 years of non-cancelable lease commitments 8431.5 / 1661.7 = 5.1 years. Thus, annual depreciation $11,627.5 million / 10 years = 1,162.8m.
Estimated EBIT would have been: $3150.7 + 1629.9 – 1,162.8 = $3617.8 This improved EBIT was obtained with significantly higher capital base and thus the estimated ROC falls: $3617.8 (1- 0.35) / 30,940 = 7.6%
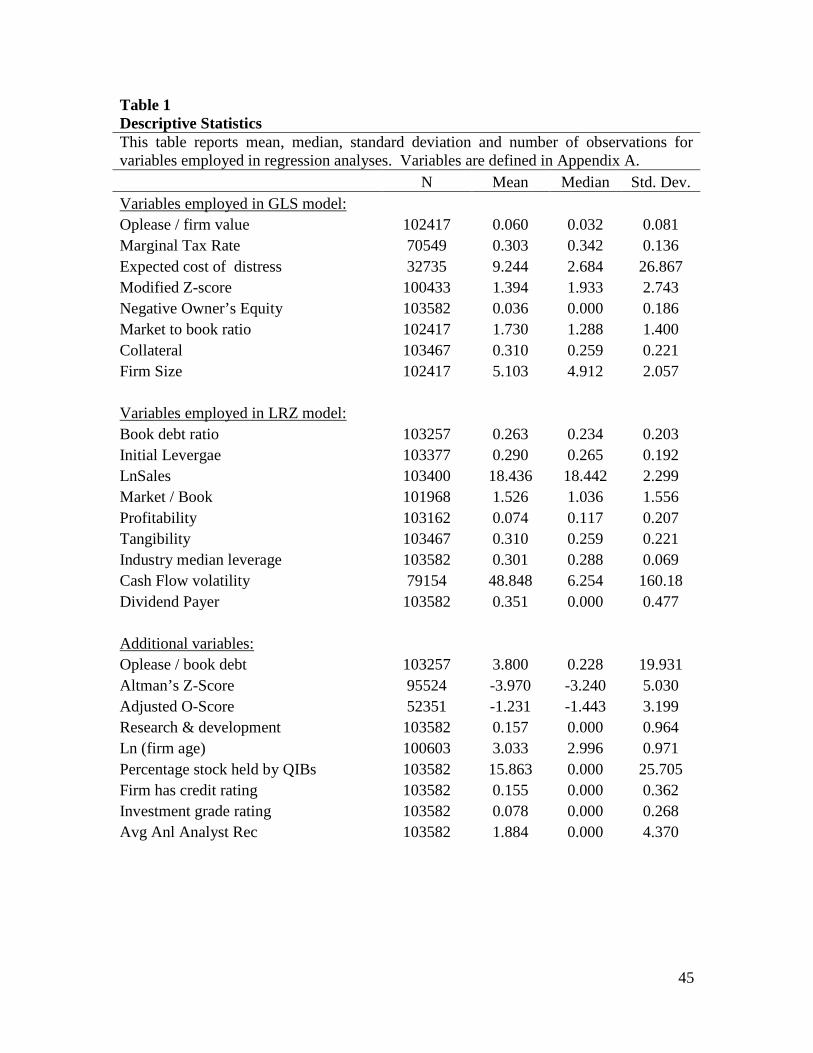
45
Table 1 Descriptive Statistics This table reports mean, median, standard deviation and number of observations for variables employed in regression analyses. Variables are defined in Appendix A. N Mean Median Std. Dev. Variables employed in GLS model: Oplease / firm value 102417 0.060 0.032 0.081 Marginal Tax Rate 70549 0.303 0.342 0.136 Expected cost of distress 32735 9.244 2.684 26.867 Modified Z-score 100433 1.394 1.933 2.743 Negative Owner’s Equity 103582 0.036 0.000 0.186 Market to book ratio 102417 1.730 1.288 1.400 Collateral 103467 0.310 0.259 0.221 Firm Size 102417 5.103 4.912 2.057 Variables employed in LRZ model: Book debt ratio 103257 0.263 0.234 0.203 Initial Levergae 103377 0.290 0.265 0.192 LnSales 103400 18.436 18.442 2.299 Market / Book 101968 1.526 1.036 1.556 Profitability 103162 0.074 0.117 0.207 Tangibility 103467 0.310 0.259 0.221 Industry median leverage 103582 0.301 0.288 0.069 Cash Flow volatility 79154 48.848 6.254 160.18 Dividend Payer 103582 0.351 0.000 0.477 Additional variables: Oplease / book debt 103257 3.800 0.228 19.931 Altman’s Z-Score 95524 -3.970 -3.240 5.030 Adjusted O-Score 52351 -1.231 -1.443 3.199 Research & development 103582 0.157 0.000 0.964 Ln (firm age) 100603 3.033 2.996 0.971 Percentage stock held by QIBs 103582 15.863 0.000 25.705 Firm has credit rating 103582 0.155 0.000 0.362 Investment grade rating 103582 0.078 0.000 0.268 Avg Anl Analyst Rec 103582 1.884 0.000 4.370
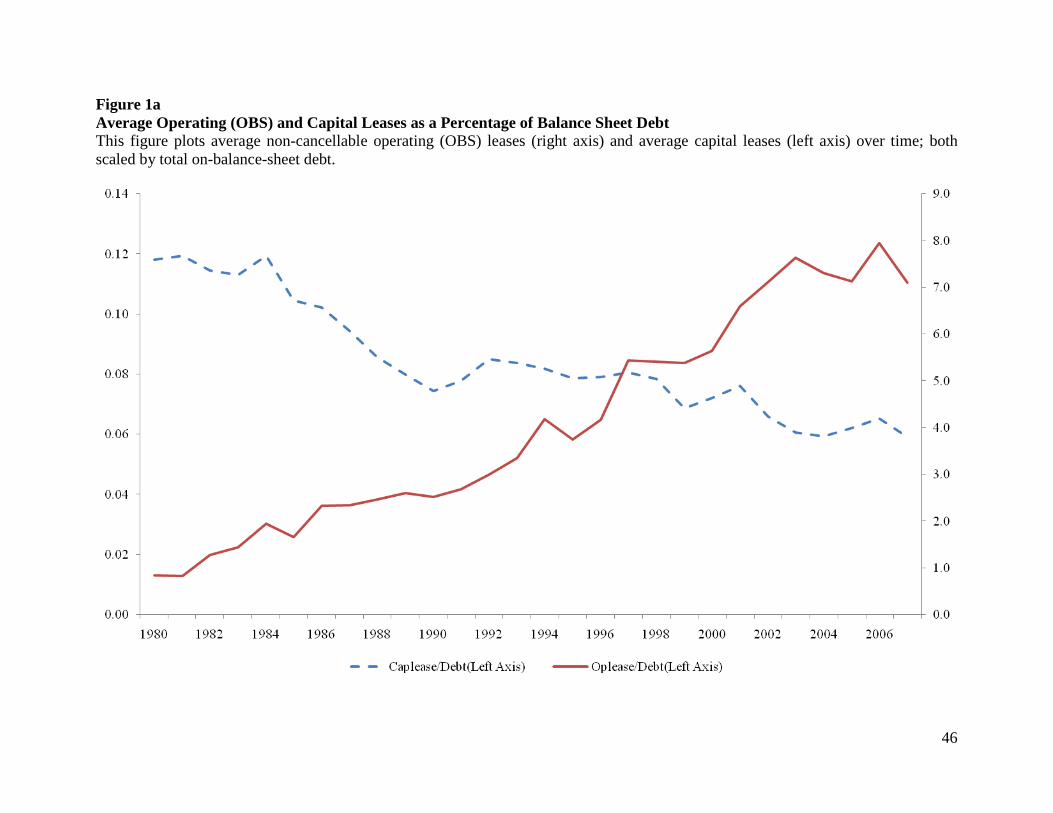
46
Figure 1a Average Operating (OBS) and Capital Leases as a Percentage of Balance Sheet Debt This figure plots average non-cancellable operating (OBS) leases (right axis) and average capital leases (left axis) over time; both scaled by total on-balance-sheet debt.
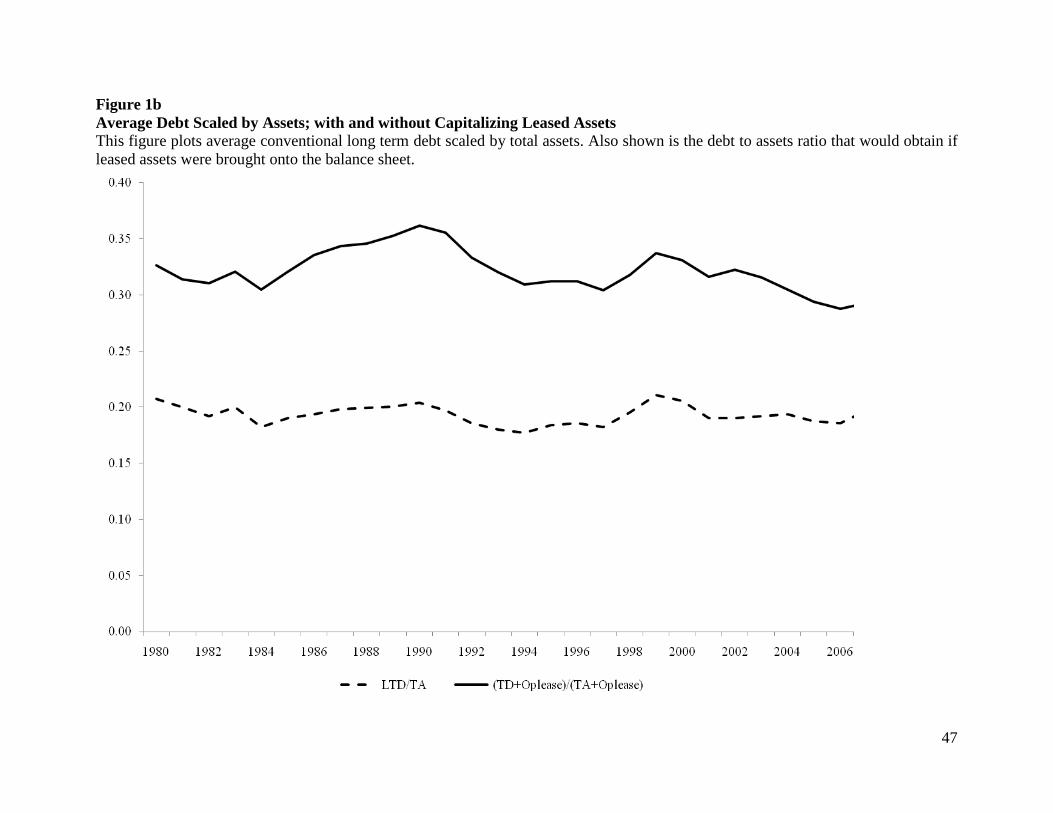
47
Figure 1b Average Debt Scaled by Assets; with and without Capitalizing Leased Assets This figure plots average conventional long term debt scaled by total assets. Also shown is the debt to assets ratio that would obtain if leased assets were brought onto the balance sheet.
48
Table 2 Trend Regressions Dependent variables are ratios: Present value of non-cancellable operating (OBS) leases scaled by total balance sheet debt; Capital leases scaled by total balance sheet debt; Long-term debt scaled by total assets; and the sum of total debt and OBS leases scaled by the sum of total assets and OBS assets. The independent variable is a time trend. Trend regressions employ data obtained from Compustat over the years 1980-2008. The Bootstrapping results are presented below each regression. Newey-West t-statistics are formed using 2 lags. A star indicates significance based on the Vogelsang 90% PS confidence intervals.
Oplease / TD Coefficient OLS t-stat NW t-stat R2 / Rbar Intercept 0.10 0.52 0.41 0.96 Trend 0.27* 24.3 20.18 0.96 Bootstrap Intercept 0.08 0.56 1.05 0.96 Trend 0.27 25.12 33.24 0.96
Caplease / TD Coefficient OLS t-stat NW t-stat R2 / Rbar Intercept 0.12 41.15 25.92 0.86 Trend 0.00* -12.74 -9.66 0.86 Bootstrap Intercept 0.12 43.40 50.22 0.86 Trend 0.00 -13.34 -18.50 0.85
LTD / TA Coefficient OLS t-stat NW t-stat R2 / Rbar Intercept 0.20 49.60 96.68 0.04 Trend 0.00 -2.41 -1.70 0.00 Bootstrap Intercept 0.20 61.27 92.24 0.07 Trend 0.00 -1.11 -1.70 0.03
(TD+Oplease) / (TA+Oplease) Coefficient OLS t-stat NW t-stat R2 / Rbar Intercept 0.34 49.60 34.87 0.18 Trend 0.00 -2.41 -1.86 0.15 Bootstrap Intercept 0.34 51.63 62.25 0.20 Trend 0.00 -2.50 -3.24 0.17
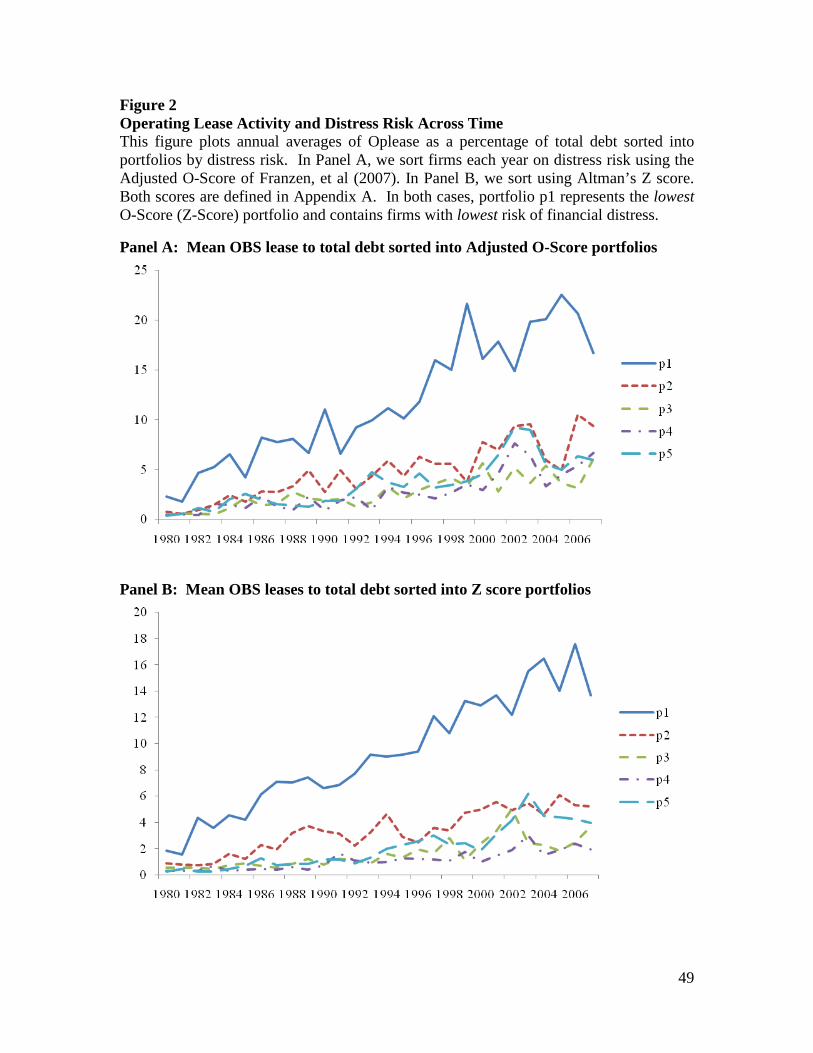
49
Figure 2 Operating Lease Activity and Distress Risk Across Time This figure plots annual averages of Oplease as a percentage of total debt sorted into portfolios by distress risk. In Panel A, we sort firms each year on distress risk using the Adjusted O-Score of Franzen, et al (2007). In Panel B, we sort using Altman’s Z score. Both scores are defined in Appendix A. In both cases, portfolio p1 represents the lowest O-Score (Z-Score) portfolio and contains firms with lowest risk of financial distress. Panel A: Mean OBS lease to total debt sorted into Adjusted O-Score portfolios
Panel B: Mean OBS leases to total debt sorted into Z score portfolios
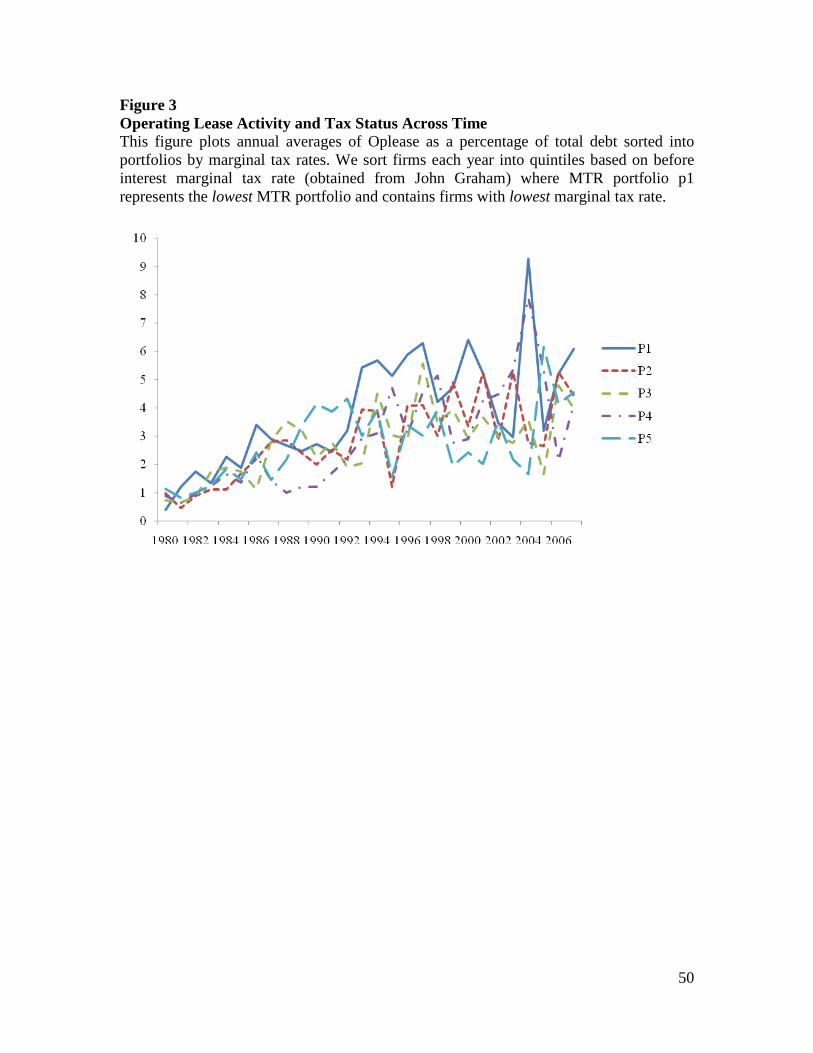
50
Figure 3 Operating Lease Activity and Tax Status Across Time This figure plots annual averages of Oplease as a percentage of total debt sorted into portfolios by marginal tax rates. We sort firms each year into quintiles based on before interest marginal tax rate (obtained from John Graham) where MTR portfolio p1 represents the lowest MTR portfolio and contains firms with lowest marginal tax rate.
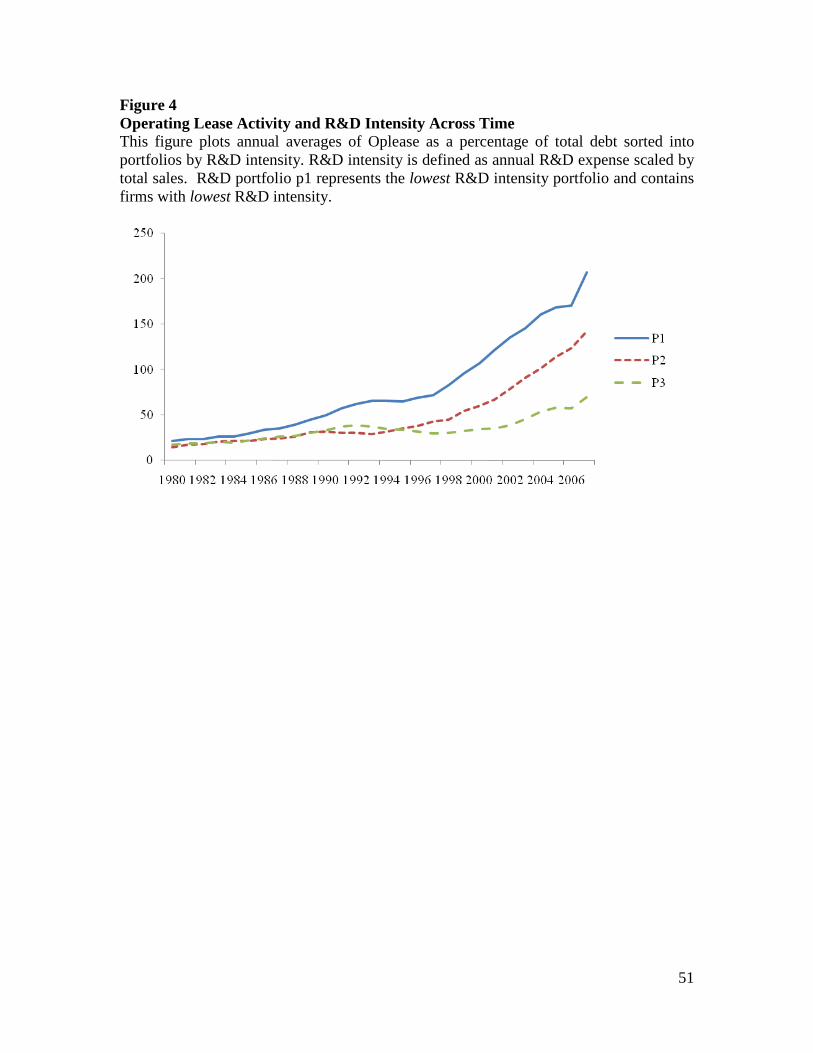
51
Figure 4 Operating Lease Activity and R&D Intensity Across Time This figure plots annual averages of Oplease as a percentage of total debt sorted into portfolios by R&D intensity. R&D intensity is defined as annual R&D expense scaled by total sales. R&D portfolio p1 represents the lowest R&D intensity portfolio and contains firms with lowest R&D intensity.
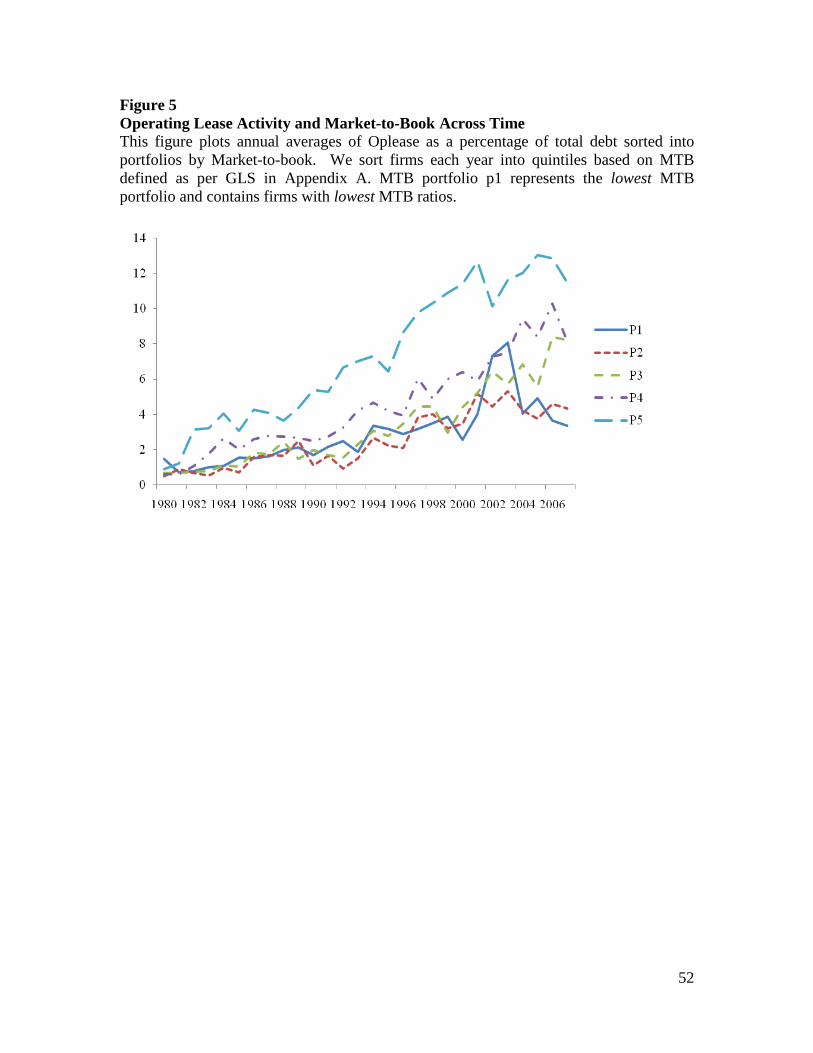
52
Figure 5 Operating Lease Activity and Market-to-Book Across Time This figure plots annual averages of Oplease as a percentage of total debt sorted into portfolios by Market-to-book. We sort firms each year into quintiles based on MTB defined as per GLS in Appendix A. MTB portfolio p1 represents the lowest MTB portfolio and contains firms with lowest MTB ratios.
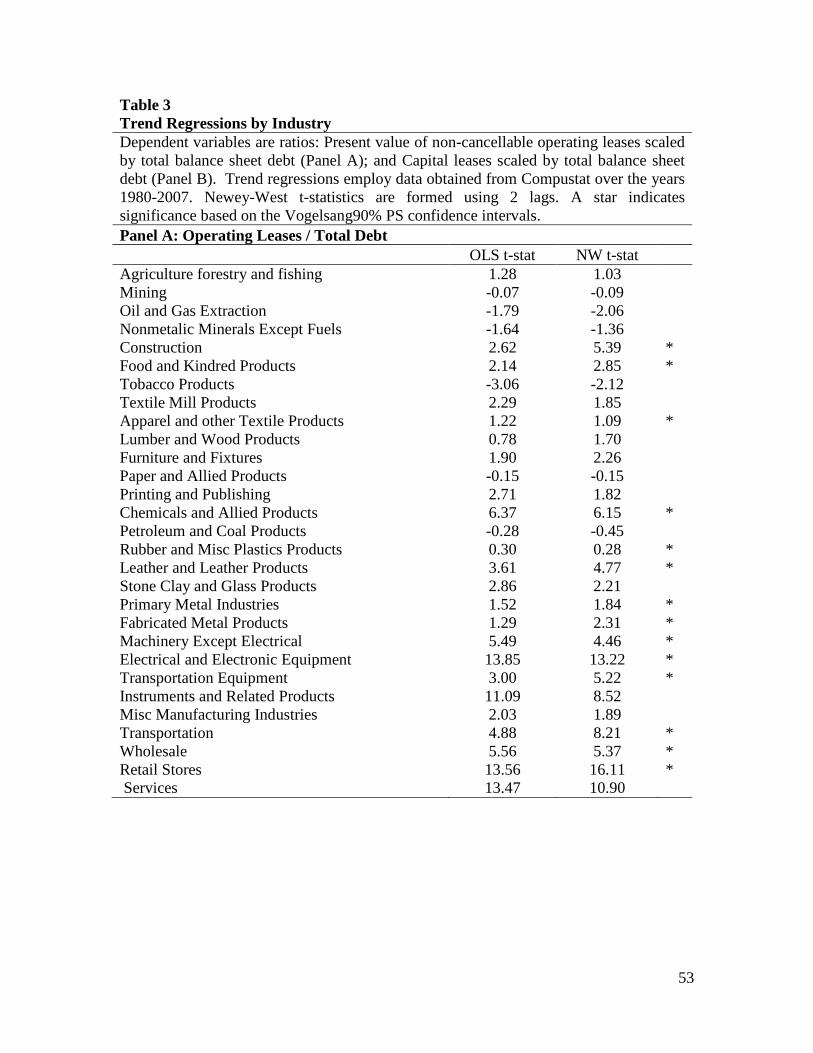
53
Table 3 Trend Regressions by Industry Dependent variables are ratios: Present value of non-cancellable operating leases scaled by total balance sheet debt (Panel A); and Capital leases scaled by total balance sheet debt (Panel B). Trend regressions employ data obtained from Compustat over the years 1980-2007. Newey-West t-statistics are formed using 2 lags. A star indicates significance based on the Vogelsang90% PS confidence intervals. Panel A: Operating Leases / Total Debt
OLS t-stat NW t-stat Agriculture forestry and fishing 1.28 1.03 Mining -0.07 -0.09 Oil and Gas Extraction -1.79 -2.06 Nonmetalic Minerals Except Fuels -1.64 -1.36 Construction 2.62 5.39 * Food and Kindred Products 2.14 2.85 * Tobacco Products -3.06 -2.12 Textile Mill Products 2.29 1.85 Apparel and other Textile Products 1.22 1.09 * Lumber and Wood Products 0.78 1.70 Furniture and Fixtures 1.90 2.26 Paper and Allied Products -0.15 -0.15 Printing and Publishing 2.71 1.82 Chemicals and Allied Products 6.37 6.15 * Petroleum and Coal Products -0.28 -0.45 Rubber and Misc Plastics Products 0.30 0.28 * Leather and Leather Products 3.61 4.77 * Stone Clay and Glass Products 2.86 2.21 Primary Metal Industries 1.52 1.84 * Fabricated Metal Products 1.29 2.31 * Machinery Except Electrical 5.49 4.46 * Electrical and Electronic Equipment 13.85 13.22 * Transportation Equipment 3.00 5.22 * Instruments and Related Products 11.09 8.52 Misc Manufacturing Industries 2.03 1.89 Transportation 4.88 8.21 * Wholesale 5.56 5.37 * Retail Stores 13.56 16.11 * Services 13.47 10.90
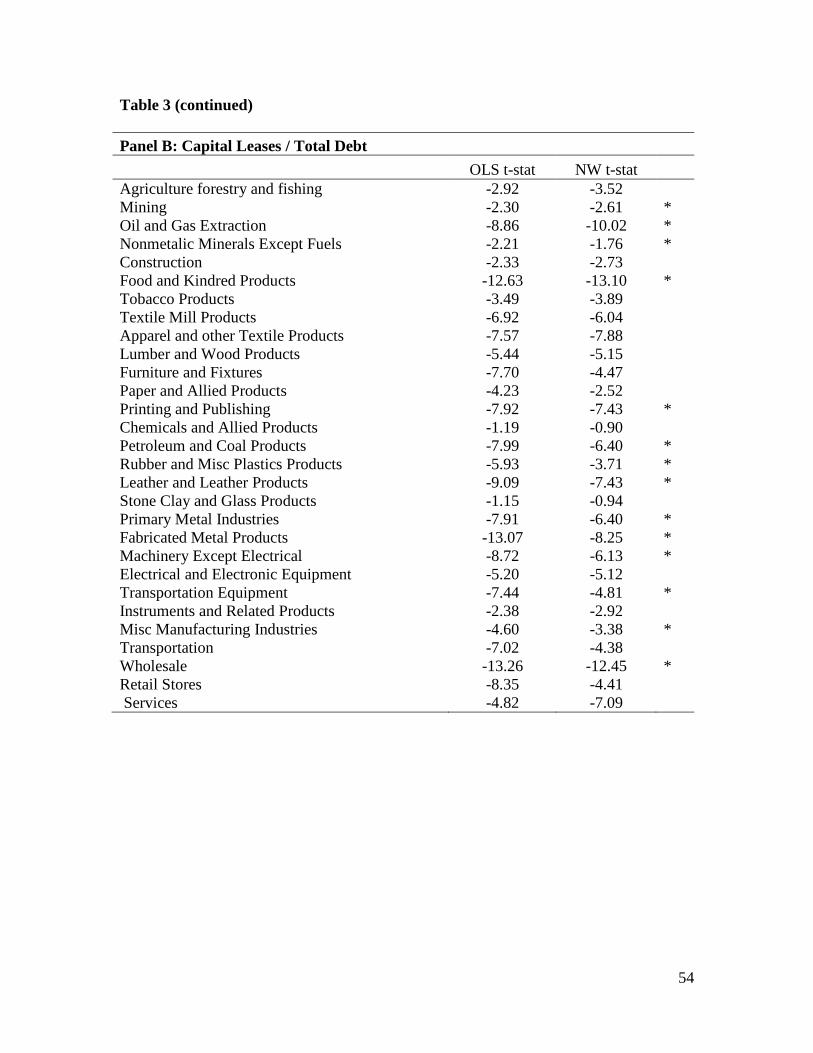
54
Table 3 (continued) Panel B: Capital Leases / Total Debt
OLS t-stat NW t-stat Agriculture forestry and fishing -2.92 -3.52 Mining -2.30 -2.61 * Oil and Gas Extraction -8.86 -10.02 * Nonmetalic Minerals Except Fuels -2.21 -1.76 * Construction -2.33 -2.73 Food and Kindred Products -12.63 -13.10 * Tobacco Products -3.49 -3.89 Textile Mill Products -6.92 -6.04 Apparel and other Textile Products -7.57 -7.88 Lumber and Wood Products -5.44 -5.15 Furniture and Fixtures -7.70 -4.47 Paper and Allied Products -4.23 -2.52 Printing and Publishing -7.92 -7.43 * Chemicals and Allied Products -1.19 -0.90 Petroleum and Coal Products -7.99 -6.40 * Rubber and Misc Plastics Products -5.93 -3.71 * Leather and Leather Products -9.09 -7.43 * Stone Clay and Glass Products -1.15 -0.94 Primary Metal Industries -7.91 -6.40 * Fabricated Metal Products -13.07 -8.25 * Machinery Except Electrical -8.72 -6.13 * Electrical and Electronic Equipment -5.20 -5.12 Transportation Equipment -7.44 -4.81 * Instruments and Related Products -2.38 -2.92 Misc Manufacturing Industries -4.60 -3.38 * Transportation -7.02 -4.38 Wholesale -13.26 -12.45 * Retail Stores -8.35 -4.41 Services -4.82 -7.09
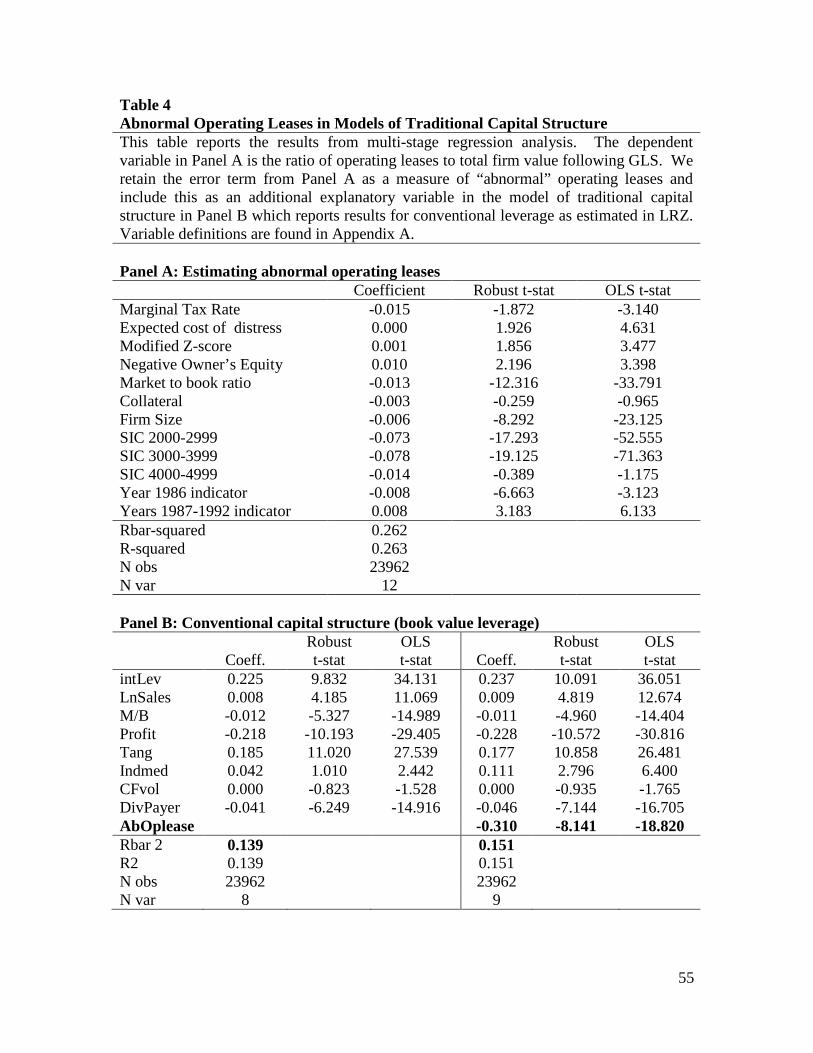
55
Table 4 Abnormal Operating Leases in Models of Traditional Capital Structure This table reports the results from multi-stage regression analysis. The dependent variable in Panel A is the ratio of operating leases to total firm value following GLS. We retain the error term from Panel A as a measure of “abnormal” operating leases and include this as an additional explanatory variable in the model of traditional capital structure in Panel B which reports results for conventional leverage as estimated in LRZ. Variable definitions are found in Appendix A. Panel A: Estimating abnormal operating leases Coefficient Robust t-stat OLS t-stat Marginal Tax Rate -0.015 -1.872 -3.140 Expected cost of distress 0.000 1.926 4.631 Modified Z-score 0.001 1.856 3.477 Negative Owner’s Equity 0.010 2.196 3.398 Market to book ratio -0.013 -12.316 -33.791 Collateral -0.003 -0.259 -0.965 Firm Size -0.006 -8.292 -23.125 SIC 2000-2999 -0.073 -17.293 -52.555 SIC 3000-3999 -0.078 -19.125 -71.363 SIC 4000-4999 -0.014 -0.389 -1.175 Year 1986 indicator -0.008 -6.663 -3.123 Years 1987-1992 indicator 0.008 3.183 6.133 Rbar-squared 0.262 R-squared 0.263 N obs 23962 N var 12 Panel B: Conventional capital structure (book value leverage)
Coeff. Robust t-stat
OLS t-stat Coeff.
Robust t-stat
OLS t-stat
intLev 0.225 9.832 34.131 0.237 10.091 36.051 LnSales 0.008 4.185 11.069 0.009 4.819 12.674 M/B -0.012 -5.327 -14.989 -0.011 -4.960 -14.404 Profit -0.218 -10.193 -29.405 -0.228 -10.572 -30.816 Tang 0.185 11.020 27.539 0.177 10.858 26.481 Indmed 0.042 1.010 2.442 0.111 2.796 6.400 CFvol 0.000 -0.823 -1.528 0.000 -0.935 -1.765 DivPayer -0.041 -6.249 -14.916 -0.046 -7.144 -16.705 AbOplease -0.310 -8.141 -18.820 Rbar 2 0.139 0.151 R2 0.139 0.151 N obs 23962 23962 N var 8 9
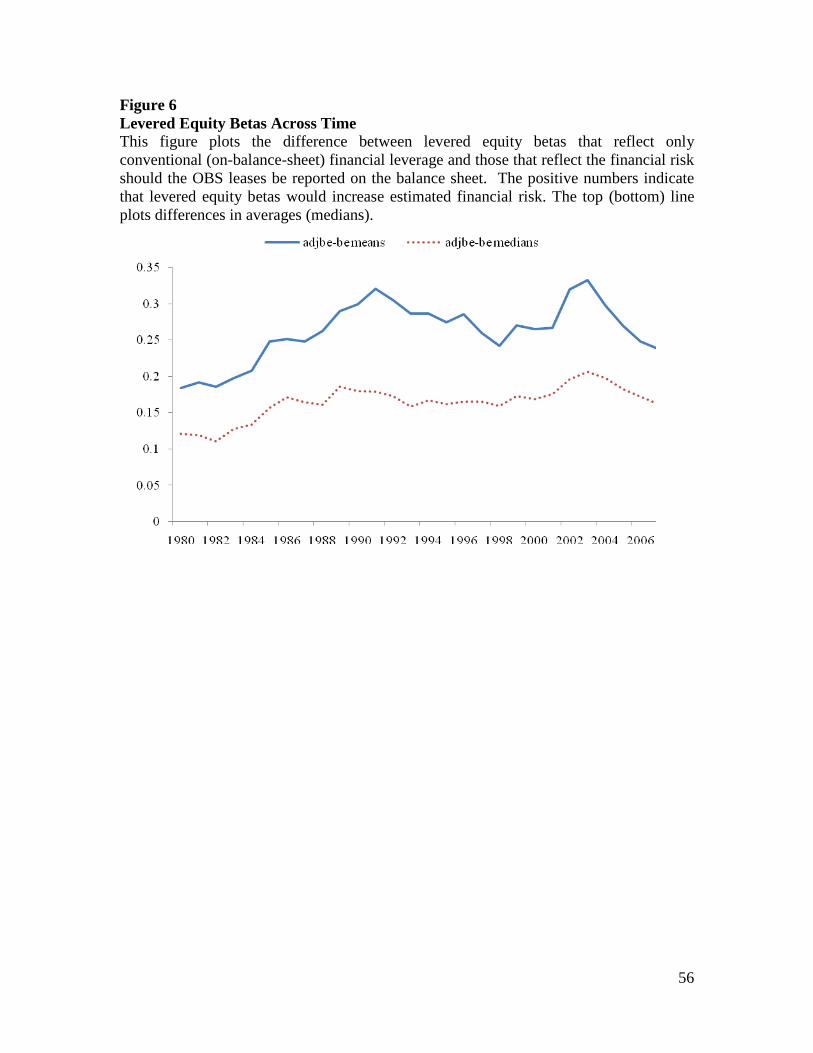
56
Figure 6 Levered Equity Betas Across Time This figure plots the difference between levered equity betas that reflect only conventional (on-balance-sheet) financial leverage and those that reflect the financial risk should the OBS leases be reported on the balance sheet. The positive numbers indicate that levered equity betas would increase estimated financial risk. The top (bottom) line plots differences in averages (medians).
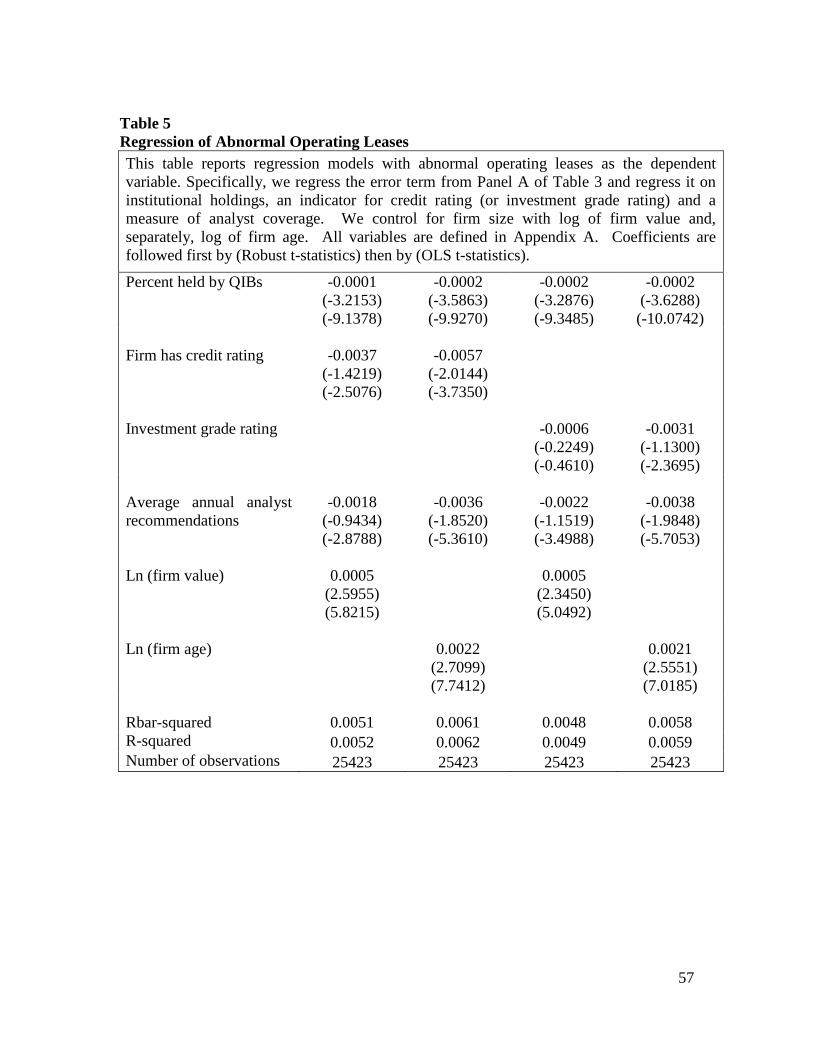
57
Table 5 Regression of Abnormal Operating Leases
This table reports regression models with abnormal operating leases as the dependent variable. Specifically, we regress the error term from Panel A of Table 3 and regress it on institutional holdings, an indicator for credit rating (or investment grade rating) and a measure of analyst coverage. We control for firm size with log of firm value and, separately, log of firm age. All variables are defined in Appendix A. Coefficients are followed first by (Robust t-statistics) then by (OLS t-statistics).
Percent held by QIBs -0.0001 (-3.2153) (-9.1378)
-0.0002 (-3.5863) (-9.9270)
-0.0002 (-3.2876) (-9.3485)
-0.0002 (-3.6288) (-10.0742)
Firm has credit rating
-0.0037
(-1.4219) (-2.5076)
-0.0057
(-2.0144) (-3.7350)
Investment grade rating
-0.0006
(-0.2249) (-0.4610)
-0.0031
(-1.1300) (-2.3695)
Average annual analyst recommendations
-0.0018
(-0.9434) (-2.8788)
-0.0036
(-1.8520) (-5.3610)
-0.0022
(-1.1519) (-3.4988)
-0.0038
(-1.9848) (-5.7053)
Ln (firm value)
0.0005
(2.5955) (5.8215)
0.0005
(2.3450) (5.0492)
Ln (firm age)
0.0022
(2.7099) (7.7412)
0.0021
(2.5551) (7.0185)
Rbar-squared 0.0051 0.0061 0.0048 0.0058 R-squared 0.0052 0.0062 0.0049 0.0059 Number of observations 25423 25423 25423 25423
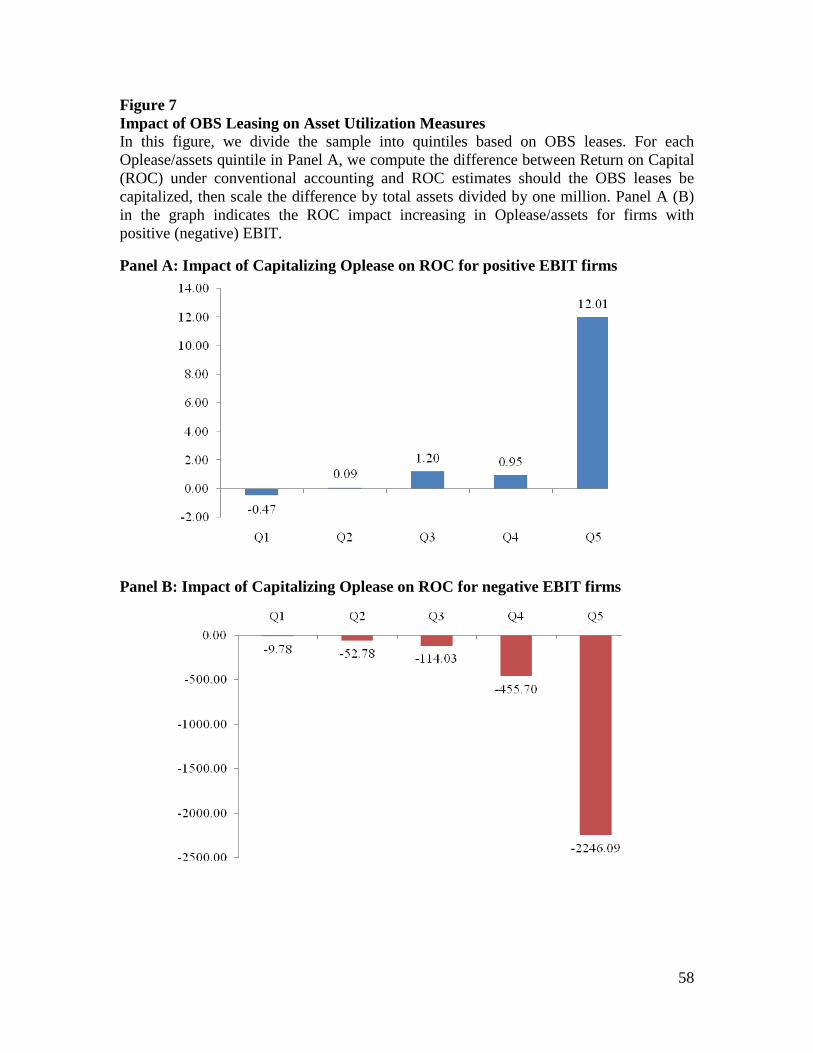
58
Figure 7 Impact of OBS Leasing on Asset Utilization Measures In this figure, we divide the sample into quintiles based on OBS leases. For each Oplease/assets quintile in Panel A, we compute the difference between Return on Capital (ROC) under conventional accounting and ROC estimates should the OBS leases be capitalized, then scale the difference by total assets divided by one million. Panel A (B) in the graph indicates the ROC impact increasing in Oplease/assets for firms with positive (negative) EBIT. Panel A: Impact of Capitalizing Oplease on ROC for positive EBIT firms
Panel B: Impact of Capitalizing Oplease on ROC for negative EBIT firms
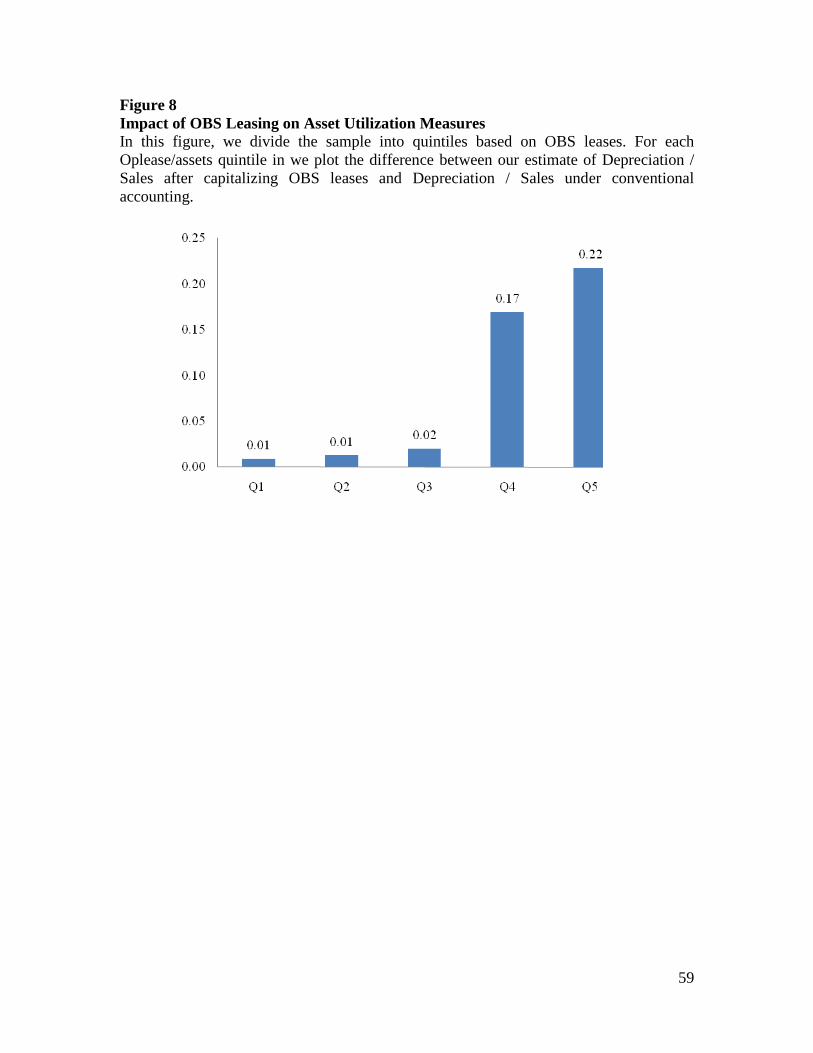
59
Figure 8 Impact of OBS Leasing on Asset Utilization Measures In this figure, we divide the sample into quintiles based on OBS leases. For each Oplease/assets quintile in we plot the difference between our estimate of Depreciation / Sales after capitalizing OBS leases and Depreciation / Sales under conventional accounting.
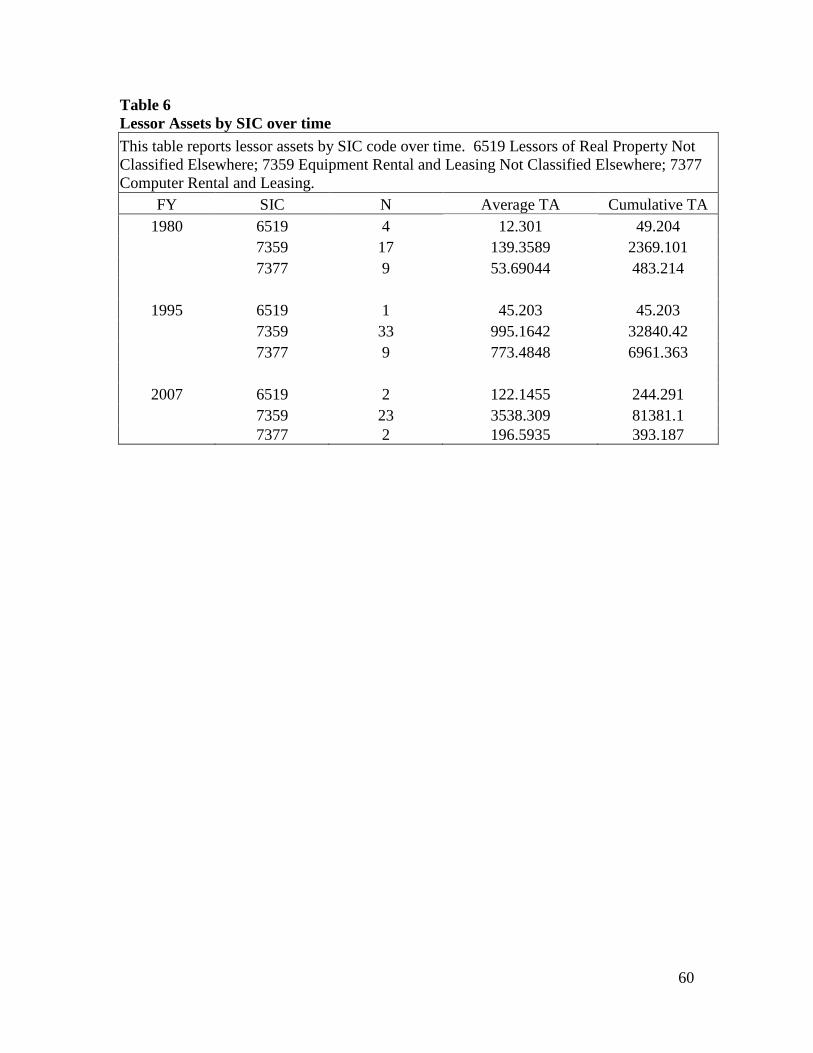
60
Table 6 Lessor Assets by SIC over time
This table reports lessor assets by SIC code over time. 6519 Lessors of Real Property Not Classified Elsewhere; 7359 Equipment Rental and Leasing Not Classified Elsewhere; 7377 Computer Rental and Leasing.
FY SIC N Average TA Cumulative TA 1980 6519 4 12.301 49.204
7359 17 139.3589 2369.101 7377 9 53.69044 483.214
1995 6519 1 45.203 45.203 7359 33 995.1642 32840.42 7377 9 773.4848 6961.363
2007 6519 2 122.1455 244.291 7359 23 3538.309 81381.1 7377 2 196.5935 393.187

61
Table 7 Ratio of Off-Balance-Sheet Leases to On-Balance-Sheet Debt
This table reports regressions of the ratio of off-balance-sheet leases to on-balance-sheet debt. We control for firm size with log of firm value and, separately, log of firm age. We employ the GLS definition of MTB; this and all other variables are defined in Appendix A. Coefficients are followed first by (Robust t-statistics) then by (OLS t-statistics).
Marginal Tax Rate -5.9895 -6.1889 -4.1385 -5.2147 -3.7085 -(5.3913) -(5.7128) -(3.8772) -(4.6081) -(3.3707) -(6.3413) -(6.6271) -(4.3579) -(5.3977) -(3.8285) Collateral -0.001 -0.0012 -0.0011 -0.0009 -0.0011 -(3.6348) -(5.0215) -(3.9845) -(3.4182) -(3.8413) -(3.2691) -(4.743) -(3.7377) -(3.1044) -(3.6302) Z-score 0.4764 0.4674 0.3605 0.484 0.3669 (6.0358) (5.8587) (4.3912) (6.0611) (4.4414) (9.1142) (9.0161) (6.8438) (9.2539) (6.9544) Market-to-Book 1.0411 0.9366 0.9067 1.0552 0.9173 (8.5614) (7.5834) (8.1246) (8.7066) (8.2429) (13.9063) (12.7626) (12.0629) (14.0803) (12.1799) Research & Dev. 0.4031 0.3803 0.3029 0.4252 0.3176 (2.7857) (2.6647) (2.0507) (2.9599) (2.1643) (3.9848) (3.7615) (2.997) (4.197) (3.1359) Retail Dummy 4.9185 4.8356 6.2552 4.8892 6.2166 (5.4101) (5.2856) (6.5579) (5.3568) (6.4842) (14.2392) (13.9787) (17.5842) (14.1534) (17.4562) Transportation -0.9831 -1.2814 0.6537 -0.9167 0.6671 -(0.7917) -(1.0448) (0.4849) -(0.7743) (0.5057) -(0.3813) -(0.4969) (0.2541) -(0.3556) (0.2593) Firm Size -0.2381 -0.1149 -0.3308 -0.1718 -(2.8524) -(1.3498) -(3.6307) -(1.8703) -(3.7662) -(1.8077) -(4.8832) -(2.5118) Ln (age) -0.6197 -(3.443) -(4.9195) Asset Tangibility -9.3023 -9.1544 -(10.0742) -(9.8448) -(14.9698) -(14.6506) 1996-2007 0.9831 0.5829 (2.8112) (1.7664) (3.8008) (2.2478) Rbar-squared 0.014 0.0142 0.0201 0.0143 0.0202 R-squared 0.0141 0.0144 0.0903 0.0146 0.0205 Nobs 35505 35505 35505 35505 35505