capital works programcapital works program · capital works programcapital works program ......
TRANSCRIPT

CAPITAL WORKS PROGRAMCAPITAL WORKS PROGRAMCAPITAL WORKS PROGRAMCAPITAL WORKS PROGRAM
2008200820082008 –––– 2017201720172017
Prepared byPrepared byPrepared byPrepared by

SOUTH EAST KELOWNA IRRIGATION DISTRICTSOUTH EAST KELOWNA IRRIGATION DISTRICTSOUTH EAST KELOWNA IRRIGATION DISTRICTSOUTH EAST KELOWNA IRRIGATION DISTRICT
CAPITAL WORKS PROGRAMCAPITAL WORKS PROGRAMCAPITAL WORKS PROGRAMCAPITAL WORKS PROGRAM
2008200820082008 –––– 2017201720172017
Prepared by:Prepared by:Prepared by:Prepared by:
Mould EngineeringMould EngineeringMould EngineeringMould Engineering #206 #206 #206 #206 –––– 437 Glenmore Road 437 Glenmore Road 437 Glenmore Road 437 Glenmore Road Kelowna, BC V1V 1Y5Kelowna, BC V1V 1Y5Kelowna, BC V1V 1Y5Kelowna, BC V1V 1Y5 Phone: 2Phone: 2Phone: 2Phone: 250505050----868868868868----2072207220722072 Fax: 250Fax: 250Fax: 250Fax: 250----868868868868----2078207820782078
EEEE----mail: [email protected]: [email protected]: [email protected]: [email protected]
DecemberDecemberDecemberDecember 2007 2007 2007 2007

SOUTH EAST KELOWNA IRRIGATION DISTRICTSOUTH EAST KELOWNA IRRIGATION DISTRICTSOUTH EAST KELOWNA IRRIGATION DISTRICTSOUTH EAST KELOWNA IRRIGATION DISTRICT CAPITAL WORKS PROGRAM CAPITAL WORKS PROGRAM CAPITAL WORKS PROGRAM CAPITAL WORKS PROGRAM 2008200820082008 –––– 2017201720172017
CONTENTSCONTENTSCONTENTSCONTENTS
Page 1. Introduction ...................................................................................................... 1 2. Watershed Hydrology and Storage ...................................................................... 2 3. Growth and Water Demand Projections .............................................................. 5 4. Distribution System ............................................................................................ 8
4.1 System Analysis 4.2 Modeling Summary
5. System Improvements ...................................................................................... 10 5.1 Water Supply Facilities 5.2 Distribution System
6. Cost Summary and Program Schedule .............................................................. 13 7. Capital Expenditure Charges ............................................................................ 14 8. Financial Implications ...................................................................................... 15 9. Future Water Supply Options ........................................................................... 16 10. Water Conservation ........................................................................................ 17 11. Recommendations and Conclusions ................................................................. 19
TABLESTABLESTABLESTABLES 1. Sub-Basin Physiographic and Flow Data .............................................................. 2 2. Storage in the Hydraulic and KLO Creek Watersheds ........................................... 3 3. Historic Growth Patterns in SEKID ....................................................................... 5 4. Predicted Demand by Year 2017 ....................................................................... 7 5. Design Criteria ................................................................................................. 8 6. Program Schedule and Cost Estimates ................................................. opposite 13 7. Capital Expenditure Charge Rates ....................................................... opposite 14 8. Potential CEC Revenues over 10-Year Plan ........................................... opposite 14 9. Cash Flow Projections ........................................................................ opposite 15
FIGURESFIGURESFIGURESFIGURES Key Map ............................................................................................. opposite 1 1. Watershed Plan ................................................................................... opposite 2 2. Storage vs Annual Useable Yield ........................................................... opposite 3 3. Historic Water Use ............................................................................... opposite 4 4. Proposed System Improvements ........................................................... opposite 11 ANNEXESANNEXESANNEXESANNEXES 1. Cost Estimates ............................................................................................ green 2. Distribution System Analysis
.1 Peak Day Demand – Existing System .................................................... blue
.2 Distribution System Schematic ........................................................... white

Mould Engineering 1
SSSSOUTH OUTH OUTH OUTH EEEEAST AST AST AST KKKKELOWNA ELOWNA ELOWNA ELOWNA IIIIRRIGATION RRIGATION RRIGATION RRIGATION DDDDISTRICTISTRICTISTRICTISTRICT
CAPITAL WORKS PROGRACAPITAL WORKS PROGRACAPITAL WORKS PROGRACAPITAL WORKS PROGRAMMMM 2008200820082008----2017201720172017
1.1.1.1. IIIINTRODUCTIONNTRODUCTIONNTRODUCTIONNTRODUCTION
This report is an updated, ten-year Capital Works Plan for supplying water to new
residential and agricultural users within the South East Kelowna Irrigation District (SEKID).
The plan was last revised in 2006, and covered the period of 2006-2016. Capital Works
Plans are normally updated every two to three years in order to reflect the actual growth
that has occurred, adjust growth projections, ensure the conceptual plan meets these new
projections, and update the cost estimates for proposed works. This also provides the
District with a review of Capital Expenditure Charge (CEC) rates. The capital expenditure
and cash flow projection tables in this report have been updated to reflect the current
situation.
Important considerations in this plan are rapidly escalating construction costs, lower
growth rates, and newer types of residential development. Construction costs are
escalating at a rate higher than inflation due to a very robust real estate market in the
Okanagan. The major project currently under construction is the Turtle Lake Reservoir,
and the total cost will exceed the estimate contained in the 2006 CWP by a significant
amount. The rate of growth in the District is expected to slow considerably since the
major residential development in the District, Gallagher’s Canyon Resorts, has nearly
reached the full build-out stage.
A further consideration in this report is the need to amend the Capital Expenditure Charge
Rate Schedule in order to include other types of residential development. At present, only
single-family residential, bare land strata and mobile home parks are included in the rate
schedule. Recently, the District has received a number of applications for secondary
accommodation such as basement suites, carriage houses, farm labour housing, and
recreational vehicle parks. Also, it is anticipated that some multi-family housing
applications may be forthcoming, and therefore a rate for this type of accommodation
should be included in the new Schedule of Rates.

SEKID – Capital Works Plan 2008-17 Watershed Hydrology and Storage
Mould Engineering 2
2.2.2.2. WWWWATERSHED ATERSHED ATERSHED ATERSHED HHHHYDROLOGYYDROLOGYYDROLOGYYDROLOGY AND AND AND AND SSSSTORAGETORAGETORAGETORAGE
Calculations of available annual runoff and yield from the Hydraulic/KLO/Stirling Creek
Watersheds are based on a report prepared by the Ministry of Environment in 1979, and
revised in 1984. The gross average annual runoff from SEKID’s watershed is just over
20,170 Mega Litres (ML or Million Litres) per year.
SEKID has implemented a stream flow monitoring program, providing data for a more in-
depth review of the hydrology of the watersheds. About five years of data is needed to
make a reliable evaluation, and until that work is completed, the estimates for reliable,
long-term yield will continue to be based on the Ministry of Environment calculations. It is
here where future water supply changes, such as climate change, will impact the system.
It should be noted that the data collected to-date from the monitoring program shows
considerable discrepancies from the Ministry of Environment’s 1984 estimates. It is
imperative that this new data be carefully reviewed as soon as possible. A summary of the
Ministry estimates follows:
Table 1Table 1Table 1Table 1 SEKID WSEKID WSEKID WSEKID WATERSHEDATERSHEDATERSHEDATERSHED
SubSubSubSub----Basin Physiographic and Basin Physiographic and Basin Physiographic and Basin Physiographic and FFFFlow Datalow Datalow Datalow Data
CatchmentCatchmentCatchmentCatchment Sub BasinSub BasinSub BasinSub Basin DrainageDrainageDrainageDrainage MedianMedianMedianMedian
IDIDIDID NameNameNameName Area ( sq mi)Area ( sq mi)Area ( sq mi)Area ( sq mi) E lev. ( ft)E lev. ( ft)E lev. ( ft)E lev. ( ft) ac- ftac- ftac- ftac- ft Mega LitresMega LitresMega LitresMega Litres
11111111 Canyon Creek 2.16 5,180 1,100 1,360
31313131 Affleck Creek 1.10 5,400 540 670
14141414 Canyon Lakes 0.91 5,880 670 830
15151515 Upper Stirling Diversion 1.42 5,470 850 1,050
16161616 Lower Stirling Diversion 2.54 4,740 840 1,040
17171717 Myra Ditch Local 0.42 4,850 170 210
18181818 Pooley Ditch Local 3.56 4,990 1,520 1,870
19191919 McCulloch Reservoir Local 11.22 4,300 2,210 2,720
21212121 Fish, Browne, Long Meadow Lakes 1.51 4,320 380 470
10101010 Pooley Creek 7.04 5,670 5,680 7,000
9999 Mid Hydraulic Creek 18.30 4,070 2,390 2,950
22222222 Hardy Creek 1.50 4,500 300 370
Annual Runoff EstimateAnnual Runoff EstimateAnnual Runoff EstimateAnnual Runoff Estimate
SEKID – Capital Works Plan 2008-17 Watershed Hydrology and Storage
Mould Engineering 3
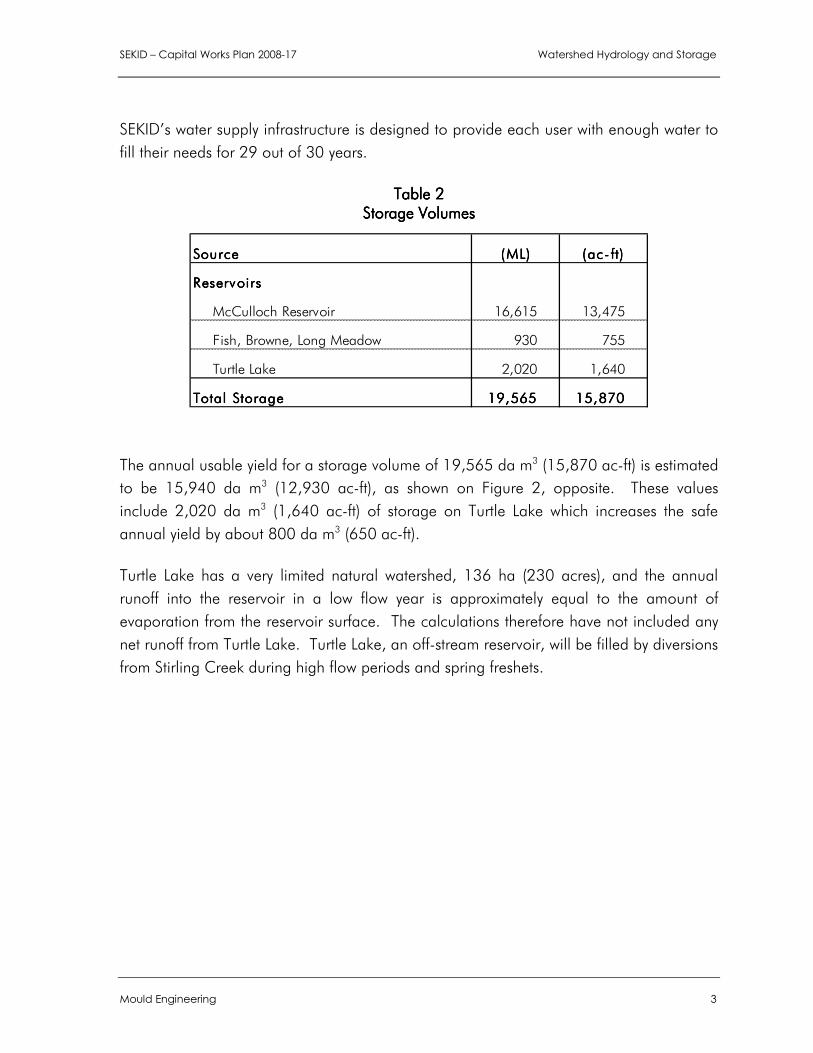
SEKID’s water supply infrastructure is designed to provide each user with enough water to
fill their needs for 29 out of 30 years.
Table Table Table Table 2222 Storage VolumesStorage VolumesStorage VolumesStorage Volumes
The annual usable yield for a storage volume of 19,565 da m3 (15,870 ac-ft) is estimated
to be 15,940 da m3 (12,930 ac-ft), as shown on Figure 2, opposite. These values
include 2,020 da m3 (1,640 ac-ft) of storage on Turtle Lake which increases the safe
annual yield by about 800 da m3 (650 ac-ft).
Turtle Lake has a very limited natural watershed, 136 ha (230 acres), and the annual
runoff into the reservoir in a low flow year is approximately equal to the amount of
evaporation from the reservoir surface. The calculations therefore have not included any
net runoff from Turtle Lake. Turtle Lake, an off-stream reservoir, will be filled by diversions
from Stirling Creek during high flow periods and spring freshets.
SourceSourceSourceSource (ML)(ML)(ML)(ML) (ac- ft)(ac- ft)(ac- ft)(ac- ft)
ReservoirsReservoirsReservoirsReservoirs
McCulloch Reservoir 16,615 13,475
Fish, Browne, Long Meadow 930 755
Turtle Lake 2,020 1,640
Total StorageTotal StorageTotal StorageTotal Storage 19,56519,56519,56519,565 15,87015,87015,87015,870
SEKID – Capital Works Plan 2008-17 Watershed Hydrology and Storage
Mould Engineering 4
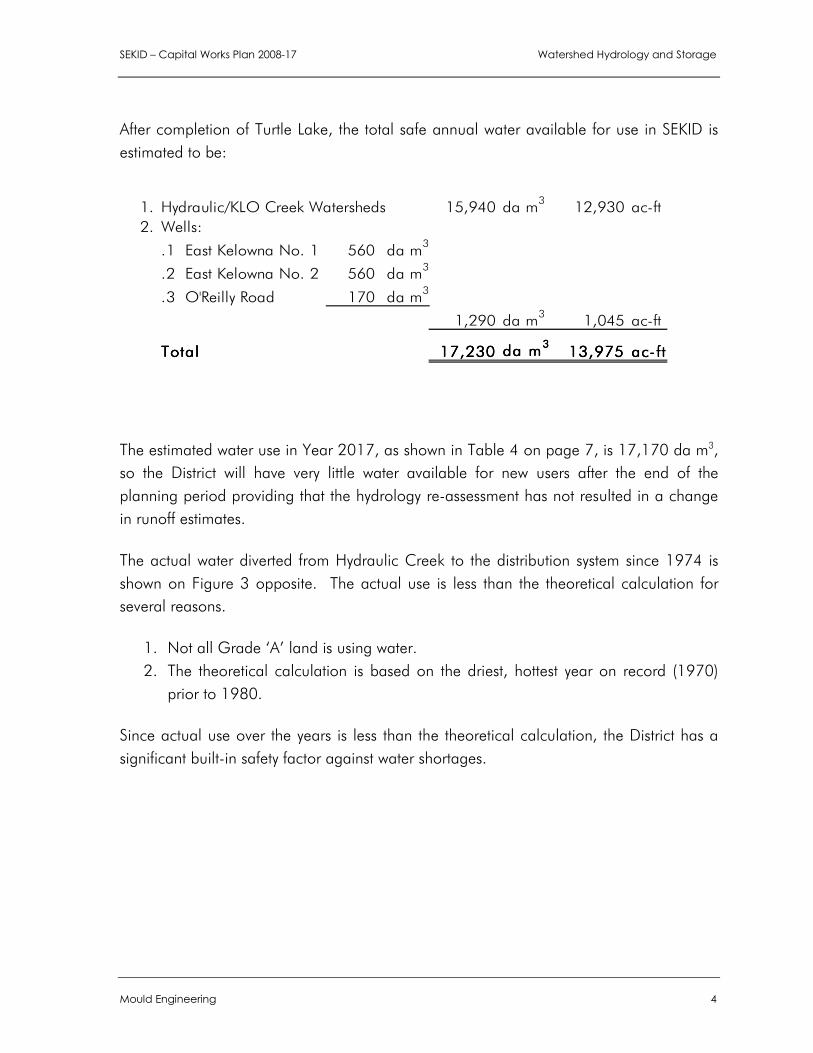
After completion of Turtle Lake, the total safe annual water available for use in SEKID is
estimated to be:
The estimated water use in Year 2017, as shown in Table 4 on page 7, is 17,170 da m3,
so the District will have very little water available for new users after the end of the
planning period providing that the hydrology re-assessment has not resulted in a change
in runoff estimates.
The actual water diverted from Hydraulic Creek to the distribution system since 1974 is
shown on Figure 3 opposite. The actual use is less than the theoretical calculation for
several reasons.
1. Not all Grade ‘A’ land is using water.
2. The theoretical calculation is based on the driest, hottest year on record (1970)
prior to 1980.
Since actual use over the years is less than the theoretical calculation, the District has a
significant built-in safety factor against water shortages.
1. Hydraulic/KLO Creek Watersheds 15,940 da m3
12,930 ac-ft
2. Wells:
.1 East Kelowna No. 1 560 da m3
.2 East Kelowna No. 2 560 da m3
.3 O'Reilly Road 170 da m3
1,290 da m3
1,045 ac-ft
TotalTotalTotalTotal 17,23017,23017,23017,230 da mda mda mda m3333
13,97513,97513,97513,975 ac-ftac-ftac-ftac-ft

SEKID – Capital Works Plan 2008-17 Growth and Water Demand Projections
Mould Engineering 5
3.3.3.3. GGGGROWTH AND ROWTH AND ROWTH AND ROWTH AND WWWWATER ATER ATER ATER DDDDEMAND EMAND EMAND EMAND PPPPROJECTIONSROJECTIONSROJECTIONSROJECTIONS
GrowthGrowthGrowthGrowth
Predicting growth rates in a rural area like SEKID is difficult, since growth is highly
dependent on economic conditions and land use policies. In the Kelowna region, growth
rates have been high with little indication of slowing down. Reviewing historic growth
patterns is a useful guide to make future predictions. The area of irrigated land and the
number of serviced lots since 1974 are tabulated below in Table 3 below. To assist in
estimating the average annual increase in irrigated land, we have also examined rates
that exclude Gallagher’s Canyon Golf Resort, which is a one-time increase. Gallagher’s
is approaching full build-out, so growth rates are expected to drop dramatically.
Table Table Table Table 3333 Historic Growth PatternsHistoric Growth PatternsHistoric Growth PatternsHistoric Growth Patterns in SEKID in SEKID in SEKID in SEKID
Grade ‘A’ Serviced Land
Time Period Years
Average Increase in Grade ‘A’ Land
Average increase in Service to
Residential Units Year
(ha) (ac)
Number of Residential
Units
(yr) (ha/yr) (ac/yr) Units/yr
1974 1,755 4,337 657
1995 2,156 5,327 1,340 21 19.1 47.2 33
1997 2,155 5,325 1,447 2 0.0 0.0 53
1999 2,238 5,530 1,575 2 41.5 102.5 64
2002 2,275 5,622 1,763 3 12.3 30.4 63
2003 2,278 5,629 1,911 1 3.0 7.4 148
2004 2,293 5,665 1,936 1 15.0 37.1 25
2005 2,349 5,803 1,973 1 56.0 138.4 37
2006 2,371 5,371 2,060 1 22 54 87
Average annual growth since 1995 19.5 48 65
Growth rate excluding Gallagher’s Canyon 5 12 9

SEKID – Capital Works Plan 2008-17 Growth and Water Demand Projections
Mould Engineering 6
Interesting trends in this table include:
� Average annual growth in irrigated land over the last 11 years in SEKID is
19.5 ha/year. Over the last two years, this average has increased to
39 ha/year. The bulk of the increase comes from Gallagher’s.
� If Gallagher’s Canyon development is not included, growth over 11 years is
5 ha/yr.
� New domestic services average 65 per year over the 11 years of record. If
Gallagher’s is excluded, the number drops to 9 per year.
There is one new development, Canyon Ventures Ltd., which is expected to develop 110
residential lots within the next ten years. This development will add an average of 11 lots
to the expected 9 lots per year in the rest of the District for a total anticipated increase of
20 lots per year. The Canyon Ventures Property is classed as Grade ‘A’ land, so no
increase in Grade ‘A’ will result from this development. Growth is also expected in the
form of recreation vehicle (RV) parks on ALRA land, which is estimated at 5 pads per
year.
Is there enough water to support new irrigated land and residential connections in the
near future?
� Since the City of Kelowna 2004 Official Community Plan (OCP) does not
indicate any additional large developments, we expect the growth in irrigated
area to only increase by 5 ha/year. There is enough water supply from SEKID
to support long term a growth rate of 5 ha/yr.
� However, development beyond 5 ha/yr, SEKID is at risk of a water deficit
within this ten year plan.
� A sanitary sewer collection system is currently under consideration for the Hall
Road area. Sewer service, if approved, will permit subdivision of large lots
into smaller ones. The 2004 City of Kelowna OCP Servicing Plan lists the
Hall Road area as Priority 4, which will extend the time of construction. Since
the Hall Road area is supplied by an independent water system, expansion in
this area will not be included in any calculations until the provisions of sewers
is more definite. The City has made an application for grant funding for the
sewer system, and the District has begun preliminary planning for the water
system.

SEKID – Capital Works Plan 2008-17 Growth and Water Demand Projections
Mould Engineering 7
� The increase in residential users is expected to be about 20 per year, which is
about a 1% growth rate, well below the historic rate in Kelowna.
Water Demand ProjectionsWater Demand ProjectionsWater Demand ProjectionsWater Demand Projections
The projected water demand in 2017 is calculated as follows:
Table Table Table Table 4444 Predicted Demand by Year Predicted Demand by Year Predicted Demand by Year Predicted Demand by Year 2017201720172017
VolumeVolumeVolumeVolume
DemandDemandDemandDemand MLMLMLML AAAAcccc----ftftftft
Year 2006 Grade ‘A’ Demand
2,453 ha @ 6.86 ML/ha 16,827 13,647
New Grade “A”
5 ha x 10 years x 6.86 da m3/ha 343 278
Residential on Grade “A” Land
20 units x 10 years x 0 0 0
Residential on Grade “A” Land
Secondary Suites – 5 x 10 years x 0 0 0
Estimated Demand in Year 2017 17,170 13,925
Water Availability – from Table 2 17,230 13,975
SURPLUSSURPLUSSURPLUSSURPLUS (DEFICIT) (DEFICIT) (DEFICIT) (DEFICIT) 66660000 50505050
For comparison purposes, a graph showing the actual annual water diverted from
Hydraulic Creek is shown in Figure 3, opposite page 4.

SEKID – Capital Works Plan 2008-17 Distribution System
Mould Engineering 8
4.4.4.4. DDDDISTRIBUTION ISTRIBUTION ISTRIBUTION ISTRIBUTION SSSSYSTEMYSTEMYSTEMYSTEM
4.1.4.1.4.1.4.1. SSSSYSTEM YSTEM YSTEM YSTEM AAAANALYNALYNALYNALYSISSISSISSIS
The distribution system has been modeled using the ‘Waterworks” computer
program. This model has proven very dependable and accurate over the years.
The design criteria used in the analysis of the distribution system include both
standard design values and values obtained from experience with other
Improvement Districts. These criteria are shown in the table below.
Table Table Table Table 5555 Design CriteriaDesign CriteriaDesign CriteriaDesign Criteria
MetricMetricMetricMetric EnglishEnglishEnglishEnglish
1. Peak Day Demand a. Irrigation b. Single-Family Domestic:
Fee Simple Lots Bare land Strata
c. Multi-Family Domestic Low Density High Density
From 0.78 to 1.01 lps/ha
0.12 lps/conn 0.06 lps/conn
0.04 lps/unit 0.03 lps/unit
5.0 to 6.5 USgpm/acre
2.0 USgpm/conn 1.0 USgpm/conn
0.6 USgpm/unit 0.5 USgpm/unit
2. Peak Hour Demand a. Irrigation b. Single-Family Domestic
Fee Simple Lots <1/3 ac Bare land Strata
c. Multi Family Domestic Low Density High Density
0.78 tp 1.01 lps/ha
0.18 lps/lot 0.12/lot
0.06 lps/unit 0.04 lps/unit
5.0 to 6.5 USgpm/ac
3.0 USgpm/lot 1.9 USgpm/lot
1.0 USgpm/unit 0.6 USgpm/unit
3. Annual Water Use a. Grade ‘A; Land
6.86 ML/ha
2.25 af/ac
4. Maximum Velocities a. Mainlines b. Distribution System c. Pressure Reducing Valves
2.44 m/s 2.0 m/s 7.0 m/s
8.0 ft/s 6.5 ft/s 23.0 ft/s
5. Pipeline Friction Factors a. Asbestos-Cement, Concrete Pipe b. PVC or Steel-Epoxy Lined c. Steel – Unlined
C = 130 C = 140 C = 110
C = 130 C = 140 C = 110
6. Minimum Pressure a. Irrigation @ Highest elevation on lot b. Residential Main Floor Level c. Fire Flows @ Hydrant
310 kPa 275 kPa 140 kPa
45 psi 40 psi 20 psi
7. Maximum Pressures 830 kPa 120 psi
8. Fire Flows a. Rural Residential b. Urban Residential
30 lps 60 lps
475 USgpm 950 USgpm

SEKID – Capital Works Plan 2008-17 Distribution System
Mould Engineering 9
The model was updated in 2005 with all works constructed up to December 2005,
including new developments in Balldock, Gallagher’s Canyon and Luxmoore
Road. The most significant new demand on the system in the last two years was
900 USgpm for the Gallagher’s Canyon Golf Course, whose delivery is directly off
the mainline at PRV 4M. The total demand, using the above parameters, is
36,650 USgpm; 97% of which is supplied through the Hydraulic Creek mainline.
Flow records from 2003, the hottest year on record, indicate a maximum day
demand of 26,150 USgpm, which is only 75% of the theoretical peak.
The pipeline distribution system is designed and modeled using 85% of the peak
demand. This assumption is based on the following:
The use of the irrigation application rates recommended by the Ministry of
Agriculture for each particular soil type creates an unrealistically high
demand in the model. The application rates were based on irrigation
technology used in the 1960’s. More modern irrigation equipment and
agricultural metering has improved irrigation efficiency and lowered peak
demand values. New values should be applied to each lot and soil type at
some time; however, in the interim, the theoretical peak demands will be
multiplied by 85% for this analysis. This will create a model that is still
slightly conservative, yet more meaningful and useful than using theoretical
values. A copy of the existing system analysis is included in Annex 2.
4.2.4.2.4.2.4.2. MMMMODELING ODELING ODELING ODELING SSSSUMMARYUMMARYUMMARYUMMARY
The analysis revealed no major system deficiencies under the current peak demand
conditions. The addition of the golf course demand has had a negligible effect on
pressures in the distribution system. There is no need for additional pipeline
upgrades at this time to increase pressures in the system. A new pipeline loop at
Saucier Road, however, will help reduce pipe velocities in that area. Any
adjustments to pressure zones can be made at the pressure reducing valves, and at
this point, no PRV adjustments are necessary.
There is still need for system improvements to address localized service problems in
certain developments. These improvements are described in Section 5.

SEKID – Capital Works Plan 2008-17 System Improvements
Mould Engineering 10
5.5.5.5. SSSSYSTEM YSTEM YSTEM YSTEM IIIIMPROVEMENTSMPROVEMENTSMPROVEMENTSMPROVEMENTS
5.1.5.1.5.1.5.1. WWWWATER ATER ATER ATER SSSSUPPLY UPPLY UPPLY UPPLY FFFFACILITIESACILITIESACILITIESACILITIES
Cost estimates for new water supply projects have been updated to account
for the increased construction costs within the Okanagan. These figures
have been reviewed, and past cost estimates revised to more realistic costs
for 2008 Construction.
5.1.1.5.1.1.5.1.1.5.1.1. Turtle Lake ReservoirTurtle Lake ReservoirTurtle Lake ReservoirTurtle Lake Reservoir
The Turtle Lake Reservoir is currently being constructed. The project which
was started in 2005 will be completed in Year 2008. Significant unexpected
foundation problems coupled with construction costs escalating at a rate
higher than inflation have pushed the estimated cost of the project from $1.8
million to $2.66 million. A grant has been received from the Canada–BC
Water Supply Expansion Program (CBC WESP) which will reduce the
District’s share to $2.295 million. The District has spent $1.55 million to
date on this project.
Estimated CostEstimated CostEstimated CostEstimated Cost to Complete to Complete to Complete to Complete $$$$1,1101,1101,1101,110,000,000,000,000
SEKID – Capital Works Plan 2008-17 System Improvements
Mould Engineering 11
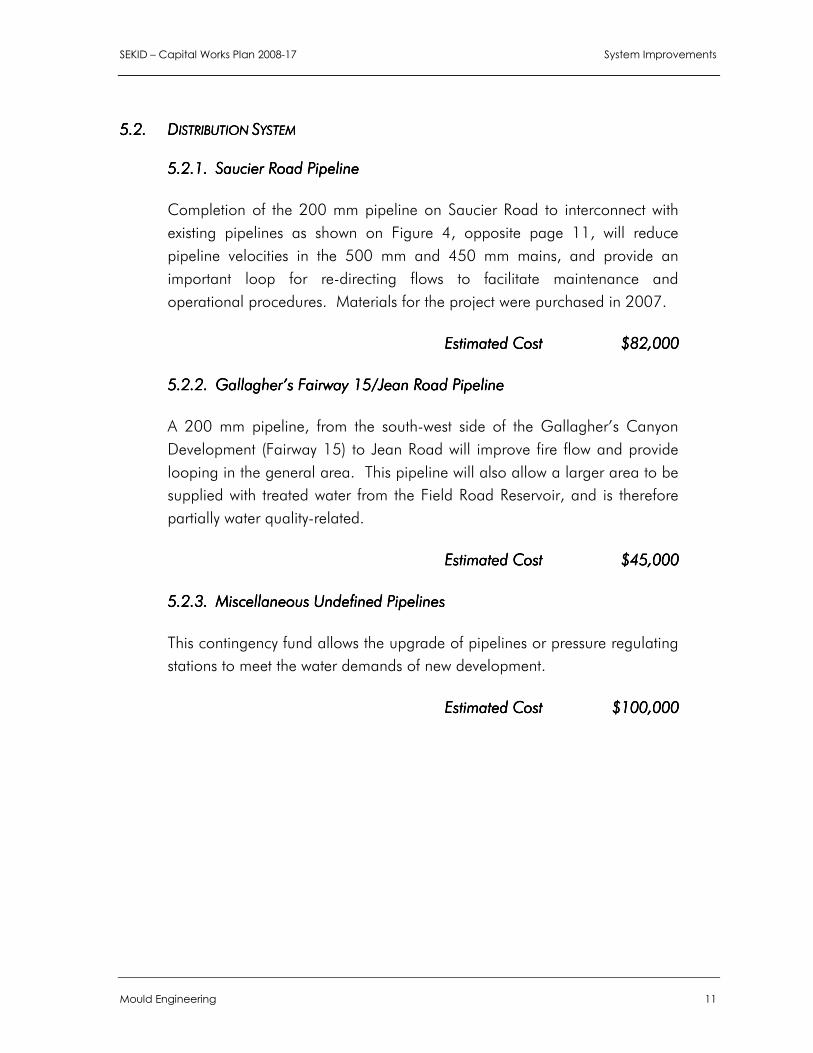
5.2.5.2.5.2.5.2. DDDDISTRIBUTION ISTRIBUTION ISTRIBUTION ISTRIBUTION SSSSYSTEMYSTEMYSTEMYSTEM
5.2.1.5.2.1.5.2.1.5.2.1. Saucier Road PipelineSaucier Road PipelineSaucier Road PipelineSaucier Road Pipeline
Completion of the 200 mm pipeline on Saucier Road to interconnect with
existing pipelines as shown on Figure 4, opposite page 11, will reduce
pipeline velocities in the 500 mm and 450 mm mains, and provide an
important loop for re-directing flows to facilitate maintenance and
operational procedures. Materials for the project were purchased in 2007.
Estimated CostEstimated CostEstimated CostEstimated Cost $$$$82828282,000,000,000,000
5.2.2.5.2.2.5.2.2.5.2.2. Gallagher’s Fairway Gallagher’s Fairway Gallagher’s Fairway Gallagher’s Fairway 15151515////Jean RoadJean RoadJean RoadJean Road Pipeline Pipeline Pipeline Pipeline
A 200 mm pipeline, from the south-west side of the Gallagher’s Canyon
Development (Fairway 15) to Jean Road will improve fire flow and provide
looping in the general area. This pipeline will also allow a larger area to be
supplied with treated water from the Field Road Reservoir, and is therefore
partially water quality-related.
Estimated CostEstimated CostEstimated CostEstimated Cost $$$$44445555,,,,000000000000
5.2.3.5.2.3.5.2.3.5.2.3. Miscellaneous Undefined PipelinesMiscellaneous Undefined PipelinesMiscellaneous Undefined PipelinesMiscellaneous Undefined Pipelines
This contingency fund allows the upgrade of pipelines or pressure regulating
stations to meet the water demands of new development.
Estimated CostEstimated CostEstimated CostEstimated Cost $$$$111100000,0000,0000,0000,000

SEKID – Capital Works Plan 2008-17 System Improvements
Mould Engineering 12
5.2.4.5.2.4.5.2.4.5.2.4. Pressure Reducing Station NoPressure Reducing Station NoPressure Reducing Station NoPressure Reducing Station No. . . . 32M Upgrading32M Upgrading32M Upgrading32M Upgrading
A Pressure Reducing Station is needed on Carter Road to connect the
residential areas along McCulloch Road to the Field Road Reservoir system,
which improves the water quality in this area and reduces the demand on
the mainline by the peaking factor. The Field Road source will be the main
supply to the residential area west of Carter Road to Lupin Court with PR
10K serving as a backup for fire flows or emergencies. The majority of this
project is water quality-related with approximately 20% related to growth
Estimated CostEstimated CostEstimated CostEstimated Cost $$$$20202020,000,000,000,000
5.2.5.5.2.5.5.2.5.5.2.5. Land Acquisition for new Land Acquisition for new Land Acquisition for new Land Acquisition for new Well andWell andWell andWell and/or/or/or/or Pump Station Pump Station Pump Station Pump Station
Land or right-of-way is required either for a new well or a pumped diversion
off Mission Creek. Improved water quality versus additional water quantity
will likely be the principal reason to develop new water sources; therefore,
considerable funds have not been included in this plan for additional
quantity. Further costs can be determined at a later stage.
Estimated Cost Estimated Cost Estimated Cost Estimated Cost $$$$20202020,000,000,000,000

2006200620062006 2007200720072007 2008200820082008 2009200920092009 2010201020102010 2011201120112011 2012201220122012 2013201320132013 2014201420142014 2015201520152015 2016201620162016 2017201720172017 TOTALTOTALTOTALTOTAL
1. WATER SUPPLY PROJECTS:1. WATER SUPPLY PROJECTS:1. WATER SUPPLY PROJECTS:1. WATER SUPPLY PROJECTS:
1.1 Turtle Lake Reservoir
.1 Re-design Drawings & Dam Manuals 61,400 115,000 20,000 20,00020,00020,00020,000$ $ $ $
.2 Engineering & Project Management 100,000 100,000 100,000100,000100,000100,000$ $ $ $
.3 Reservoir Access Roads & Burning 50,100 139,600 15,000 15,00015,00015,00015,000$ $ $ $
.4 Borrow Pit Reshaping & Seeding 240,000 13,000 13,00013,00013,00013,000$ $ $ $
.5 Dam Construction 782,200 849,000 849,000849,000849,000849,000$ $ $ $
.6 Stirling Creek Diversion, & Misc. 113,000 113,000113,000113,000113,000$ $ $ $
2. DISTRIBUTION SYSTEM IMPROVEMENTS2. DISTRIBUTION SYSTEM IMPROVEMENTS2. DISTRIBUTION SYSTEM IMPROVEMENTS2. DISTRIBUTION SYSTEM IMPROVEMENTS
2.1 Pipelines
.1 Saucier Road 18,000 82,000 82,00082,00082,00082,000$ $ $ $
.2 Gallaghers / Jean 49,500 45,000 45,00045,00045,00045,000$ $ $ $
.3 Miscellaneous Pipelines 100,000 100,000100,000100,000100,000$ $ $ $
2.2 PR Station No 32M 20,000 20,00020,00020,00020,000$ $ $ $
3. LAND ACQUISITION3. LAND ACQUISITION3. LAND ACQUISITION3. LAND ACQUISITION 20,000 20,00020,00020,00020,000$ $ $ $
4. PLANNING AND ENGINEERING4. PLANNING AND ENGINEERING4. PLANNING AND ENGINEERING4. PLANNING AND ENGINEERING 23,094 20,000 10,000 15,000 10,000 15,000 10,000 15,000 10,000 15,000 10,000 10,000 120,000120,000120,000120,000$ $ $ $
TOTAL ESTIMATED CONSTRUCTION COSTSTOTAL ESTIMATED CONSTRUCTION COSTSTOTAL ESTIMATED CONSTRUCTION COSTSTOTAL ESTIMATED CONSTRUCTION COSTS 202,094$ 1,396,800$ 1,120,000$ 97,000$ 10,000$ 60,000$ 10,000$ 35,000$ 10,000$ 15,000$ 10,000$ 130,000$ 1,497,0001,497,0001,497,0001,497,000$ $ $ $
REVENUE: CEC FUNDSREVENUE: CEC FUNDSREVENUE: CEC FUNDSREVENUE: CEC FUNDS 320,194$ 103,600$ 170,000$ 170,000$ 170,000$ 170,000$ 170,000$ 170,000$ 170,000$ 170,000$ 170,000$ 170,000$ 1,700,0001,700,0001,700,0001,700,000$ $ $ $
CBC WSEP GRANT CBC WSEP GRANT CBC WSEP GRANT CBC WSEP GRANT 365,000$ ----$ $ $ $
Balance Balance Balance Balance $985,945 $57,800 ($892,200) ($864,200) ($747,200) ($674,200) ($548,200) ($440,200) ($302,200) ($162,200) ($10,200) $28,800Bank Interest (5%) $0 $0 ($45,000) ($43,000) ($37,000) ($34,000) ($27,000) ($22,000) ($15,000) ($8,000) ($1,000) $0
Balance after Interest $986,000 $57,800 ($937,200) ($907,200) ($784,200) ($708,200) ($575,200) ($462,200) ($317,200) ($170,200) ($11,200) $28,800 $28,800
Table 6Table 6Table 6Table 6
Capital Works Program - Schedule & Cost EstimatesCapital Works Program - Schedule & Cost EstimatesCapital Works Program - Schedule & Cost EstimatesCapital Works Program - Schedule & Cost Estimates
Year 2008-2017Year 2008-2017Year 2008-2017Year 2008-2017
HistoricHistoricHistoricHistoric
12b SEKID CWP 2008-17 November 2007
SEKID – Capital Works Plan 2008-17 Cost Summary and Program Schedule
Mould Engineering 13
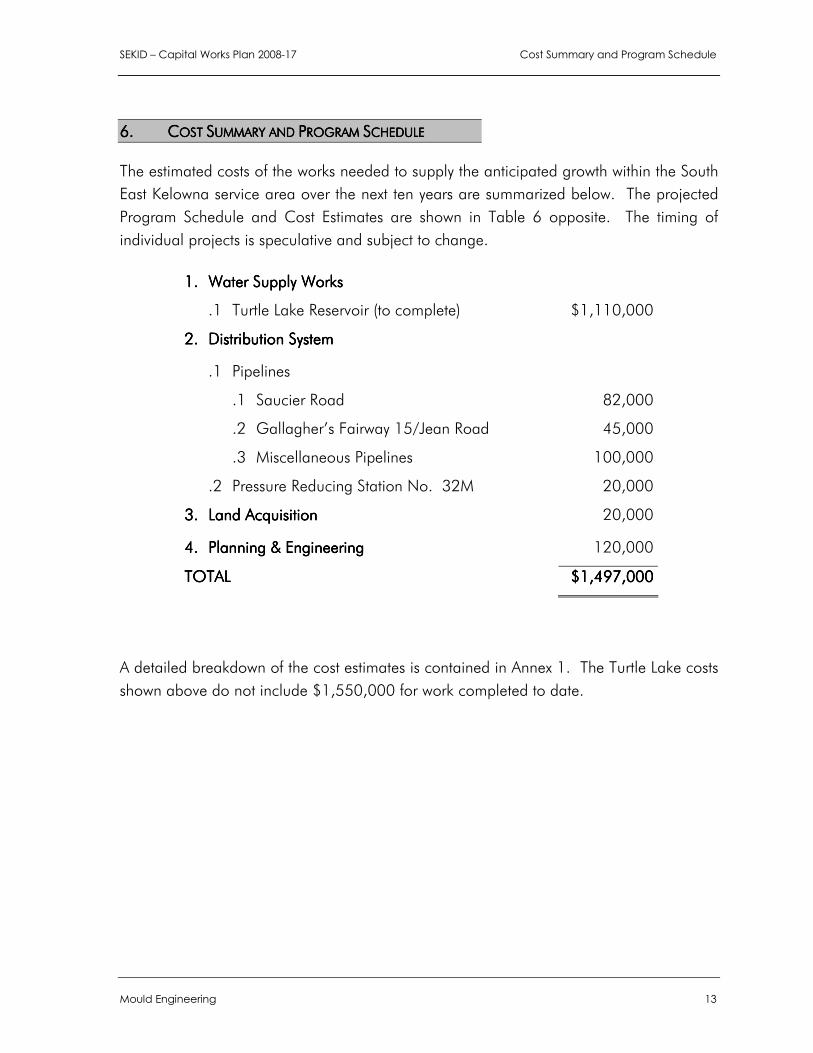
6.6.6.6. CCCCOST OST OST OST SSSSUMMARY AND UMMARY AND UMMARY AND UMMARY AND PPPPROGRAM ROGRAM ROGRAM ROGRAM SSSSCHEDULECHEDULECHEDULECHEDULE
The estimated costs of the works needed to supply the anticipated growth within the South
East Kelowna service area over the next ten years are summarized below. The projected
Program Schedule and Cost Estimates are shown in Table 6 opposite. The timing of
individual projects is speculative and subject to change.
1.1.1.1. Water Supply Works Water Supply Works Water Supply Works Water Supply Works
.1 Turtle Lake Reservoir (to complete) $1,110,000
2.2.2.2. Distribution SystemDistribution SystemDistribution SystemDistribution System
.1 Pipelines
.1 Saucier Road
.2 Gallagher’s Fairway 15/Jean Road
.3 Miscellaneous Pipelines
82,000
45,000
100,000
.2 Pressure Reducing Station No. 32M 20,000
3.3.3.3. Land AcquisitionLand AcquisitionLand AcquisitionLand Acquisition 20,000
4444.... Planning & EngineeringPlanning & EngineeringPlanning & EngineeringPlanning & Engineering 120,000
TOTALTOTALTOTALTOTAL $$$$1111,,,,444497979797,,,,000000000000
A detailed breakdown of the cost estimates is contained in Annex 1. The Turtle Lake costs
shown above do not include $1,550,000 for work completed to date.
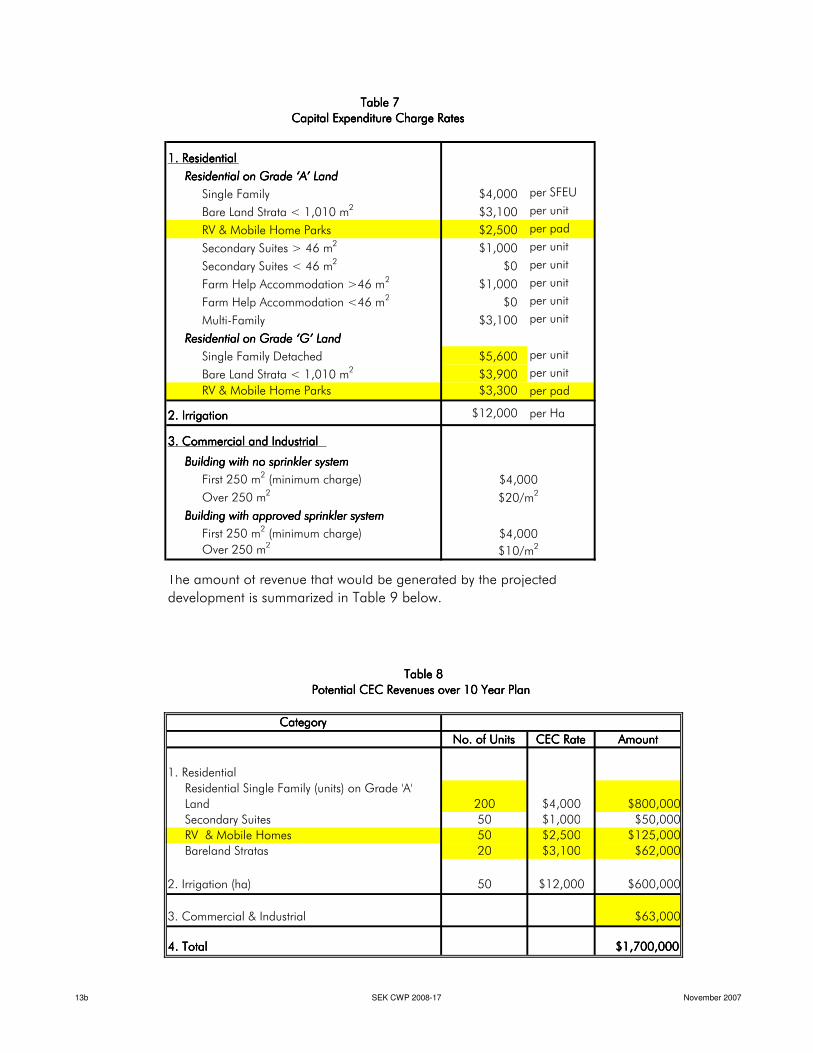
1. Residential1. Residential1. Residential1. Residential
Residential on Grade ‘A’ LandResidential on Grade ‘A’ LandResidential on Grade ‘A’ LandResidential on Grade ‘A’ Land
Single Family $4,000 per SFEU
Bare Land Strata < 1,010 m2
$3,100 per unit
RV & Mobile Home Parks $2,500 per pad
Secondary Suites > 46 m2
$1,000 per unit
Secondary Suites < 46 m2
$0 per unit
Farm Help Accommodation >46 m2
$1,000 per unit
Farm Help Accommodation <46 m2
$0 per unit
Multi-Family $3,100 per unit
Residential on Grade ‘G’ LandResidential on Grade ‘G’ LandResidential on Grade ‘G’ LandResidential on Grade ‘G’ Land
Single Family Detached $5,600 per unit
Bare Land Strata < 1,010 m2
$3,900 per unit
RV & Mobile Home Parks $3,300 per pad
2. Irrigation2. Irrigation2. Irrigation2. Irrigation $12,000 per Ha
3. Commercial and Industrial 3. Commercial and Industrial 3. Commercial and Industrial 3. Commercial and Industrial
Building with no sprinkler systemBuilding with no sprinkler systemBuilding with no sprinkler systemBuilding with no sprinkler system
First 250 m2 (minimum charge)
Over 250 m2
Building with approved sprinkler systemBuilding with approved sprinkler systemBuilding with approved sprinkler systemBuilding with approved sprinkler system
First 250 m2 (minimum charge)
Over 250 m2
CategoryCategoryCategoryCategory
No. of UnitsNo. of UnitsNo. of UnitsNo. of Units CEC RateCEC RateCEC RateCEC Rate AmountAmountAmountAmount
1. Residential
Residential Single Family (units) on Grade 'A'
Land 200 $4,000 $800,000
Secondary Suites 50 $1,000 $50,000
RV & Mobile Homes 50 $2,500 $125,000
Bareland Stratas 20 $3,100 $62,000
2. Irrigation (ha) 50 $12,000 $600,000
3. Commercial & Industrial $63,000
4. Total4. Total4. Total4. Total $1,700,000$1,700,000$1,700,000$1,700,000
Potential CEC Revenues over 10 Year PlanPotential CEC Revenues over 10 Year PlanPotential CEC Revenues over 10 Year PlanPotential CEC Revenues over 10 Year Plan
Table 7Table 7Table 7Table 7
Capital Expenditure Charge RatesCapital Expenditure Charge RatesCapital Expenditure Charge RatesCapital Expenditure Charge Rates
$4,000
$20/m2
$4,000
$10/m2
The amount of revenue that would be generated by the projected
development is summarized in Table 9 below.
Table 8Table 8Table 8Table 8
13b SEK CWP 2008-17 November 2007

SEKID – Capital Works Plan 2008-17 Capital Expenditure Charges
Mould Engineering 14
7.7.7.7. CCCCAPITAL APITAL APITAL APITAL EEEEXPENDITURE XPENDITURE XPENDITURE XPENDITURE CCCCHARGESHARGESHARGESHARGES
Development Charges (CEC’s) are levied on applicants for new service. Different types of
development place different demands on the water system, and estimates were made to
separate the costs attributable to each class. Commercial developments, for instance, are
usually low water users, but require system capacity for high fire flows. Fire flows have a
major impact on pipeline and reservoir sizes, and consequently costs. Residential users
have fairly high water requirements with high peak demands, while irrigation demands are
relatively constant in summer, with no requirement for fire flows or winter supply. CEC’s
have been re-calculated and are shown in Tables 7 and 8 opposite.

YearYearYearYear RevenuesRevenuesRevenuesRevenues Const. CostsConst. CostsConst. CostsConst. Costs InterestInterestInterestInterest BalanceBalanceBalanceBalance
Balance at Year-End 2007 57,800
2008 170,000 1,120,000 45,000 (937,200)
2009 170,000 97,000 43,000 (907,200)
2010 170,000 10,000 37,000 (784,200)
2011 170,000 60,000 34,000 (708,200)
2012 170,000 10,000 27,000 (575,200)
2013 170,000 35,000 22,000 (462,200)
2014 170,000 10,000 15,000 (317,200)
2015 170,000 15,000 8,000 (170,200)
2016 170,000 10,000 1,000 (11,200)
2017 170,000 130,000 - 28,800
TOTALTOTALTOTALTOTAL $1,700,000$1,700,000$1,700,000$1,700,000 $1,497,000$1,497,000$1,497,000$1,497,000 $232,000$232,000$232,000$232,000 $28,800$28,800$28,800$28,800
Table 9Table 9Table 9Table 9
Cash Flow ProjectionsCash Flow ProjectionsCash Flow ProjectionsCash Flow Projections
Year 2008 - 2017Year 2008 - 2017Year 2008 - 2017Year 2008 - 2017
14b SEK CWP 2008-17 November 2007

SEKID – Capital Works Plan 2008-17 Financial Implications
Mould Engineering 15
8.8.8.8. FFFFINANCIAL INANCIAL INANCIAL INANCIAL IIIIMPLICATIONSMPLICATIONSMPLICATIONSMPLICATIONS
The cash flow implications of the ten-year plan are summarized in Table 9, opposite. In
order for revenues to balance anticipated costs over the next ten years, it will be necessary
to increase CEC rates. The reason for this increase is the significant rise in construction
costs in the Okanagan since 2006. Unit costs for urban pipeline installation have also
increased due primarily to a shortage of contractors in the region, as well as increased
fuel and labour market shortages which have increased salaries.
A deficit occurs in the bank balance for the planning period, so borrowing is required to
complete construction on the time line indicated. The Turtle Lake Reservoir project is
partially completed, and construction is expected to be completed by fall 2008, and be
fully operational by 2009.
Also note that this Capital Works Plan does not account for escalation of costs as required
by Development Cost Charge standard practices. A review of this document is
recommended every two or three years to monitor growth rates and construction costs,
and ensure that revenues and expenditures are being maintained. It is likely that periodic
increases in the CEC rates will be required.

SEKID – Capital Works Plan 2008-17 Future Water Supply Options
Mould Engineering 16
9.9.9.9. FFFFUTURE UTURE UTURE UTURE WWWWATER ATER ATER ATER SSSSUPPLY UPPLY UPPLY UPPLY OOOOPTIONSPTIONSPTIONSPTIONS
Beyond the ten-year time frame of this Capital Works Plan, additional water sources will
be required to meet future growth. We have identified some options below. To date, the
most viable water source seems to be from groundwater.
9.1.9.1.9.1.9.1. EEEEAST AST AST AST KKKKELOWNA ELOWNA ELOWNA ELOWNA WWWWELLELLELLELLSSSS NNNNOOOO.... 3333 &&&& 4444
A report prepared by Golder Associates in 2007 estimated that the annual
recharge to the aquifer that underlies the East Kelowna Bench is
8,300 dam3. Current withdrawals by existing wells are less than 1,000 dam3
per year, so the aquifer should be able to support at least two more high
capacity wells.
Other possible projects include:
9.2.9.2.9.2.9.2. RRRRAISING AISING AISING AISING MMMMCCCCCCCCULLOCH ULLOCH ULLOCH ULLOCH RRRRESESESESERVOIRERVOIRERVOIRERVOIR
McCulloch Reservoir could be raised to increase storage capacity. There
are some significant problems to overcome, however, to implement the
project.
� There is limited extra water to capture from this watershed.
� The reservoir will not fill every year, so storage has to be carried
through a series of low runoff years. The amount of storage needed
will be about four times the annual usable volume, resulting in
considerable storage costs to service more land. The cost includes:
o Six dams to rebuild, o A new outlet structure at the North Dam, o A new spillway, o Extensive reservoir clearing. o A number of recreational leases, a commercial lease, and the
KVR railway R/W will be impacted, and expensive to relocate.
9.3.9.3.9.3.9.3. MMMMISSION ISSION ISSION ISSION CCCCREEKREEKREEKREEK
Mission Creek is a possible future water source for the District, provided that
upland storage is developed. There are some undeveloped, but expensive,
potential reservoir sites in the Mission Creek watershed.
SEKID – Capital Works Plan 2008-17 Future Water Supply Options
Mould Engineering 17
An interesting alternative may be a joint works development of the Gopher
Flats site with Black Mountain Irrigation District (BMID). This project was
investigated in some detail in the ‘80s, but was never constructed for
economic reasons. The BMID is actively pursuing approvals and funding for
the project.
9.4.9.4.9.4.9.4. WWWWILKINSON ILKINSON ILKINSON ILKINSON CCCCREEK REEK REEK REEK DDDDIVERSIONIVERSIONIVERSIONIVERSION
A portion of Wilkinson Creek could be diverted into the Stirling Creek
Watershed to augment runoff to McCulloch Reservoir. A previous attempt
by the District to obtain a water license authorizing the diversion was
abandoned following objections from water licensees and environmental
interests on Kettle River. Obtaining a water license may be possible
provided that the diversion only occurs during spring freshet.
SEKID – Capital Works Plan 2008-17 Water Conservation
Mould Engineering 18
10.10.10.10. WWWWATER ATER ATER ATER CCCCONSERVATIONONSERVATIONONSERVATIONONSERVATION
If existing users were more efficient, water could be freed up for new users. The District
implemented an agricultural metering program in 1998 which resulted in a considerable
reduction in irrigation water use. Since 1998, all new residential services have had
meters installed. The metering program has been very effective in reducing water use and
it may be possible to further reduce water consumption. The Provincial Ministry of
Agriculture is working on an Agricultural Demand Model which may provide some
information on theoretical water demands for a variety of soil and crop types.
When the model is available for public use and the results have been carefully reviewed
the District can then consider whether there is an opportunity to further reduce water
demands. It is considered unlikely that a substantial reduction can be realized in the short
term.

SEKID – Capital Works Plan 2008-17 Recommendations and Conclusions
Mould Engineering 19
11.11.11.11. RRRRECOMMENDATIONS AND ECOMMENDATIONS AND ECOMMENDATIONS AND ECOMMENDATIONS AND CCCCONCLUSIONSONCLUSIONSONCLUSIONSONCLUSIONS
In order to meet the water supply requirements of existing users and also supply the
growth projected for the next ten years, it is recommended that the Trustees:
1. Adopt a new Capital Charge Bylaw in 2008 authorizing the collection of
charges on new developments as outlined in this report.
2. Contact the City of Kelowna to determine whether the transfer of lands in
the area of Dehart/Swamp Roads is still in the City’s plans, and if so,
determine the time frame for implementation.
3. Adopt a borrowing bylaw to raise $950,000 to fund the CEC account
shortfall.
4. Continue the stream flow monitoring program and update the watershed
data. Runoff conditions may have changed since the 1984 Ministry of
Environment calculations, and the amount of reliable long-term yield from
the watershed may be reduced, a critical factor for long-term planning, if
correct.

Annex 1Annex 1Annex 1Annex 1
Cost EstimatesCost EstimatesCost EstimatesCost Estimates
1. Turtle Lake Reservoir1. Turtle Lake Reservoir1. Turtle Lake Reservoir1. Turtle Lake Reservoir
2. Distribution System2. Distribution System2. Distribution System2. Distribution System
.1 Saucier Road Pipeline.1 Saucier Road Pipeline.1 Saucier Road Pipeline.1 Saucier Road Pipeline
.2 Gallagher's Fairway S/Jean Road.2 Gallagher's Fairway S/Jean Road.2 Gallagher's Fairway S/Jean Road.2 Gallagher's Fairway S/Jean Road
.3 Miscellaneous Undefined Pipelines.3 Miscellaneous Undefined Pipelines.3 Miscellaneous Undefined Pipelines.3 Miscellaneous Undefined Pipelines
.4 PR Station No. 32 M.4 PR Station No. 32 M.4 PR Station No. 32 M.4 PR Station No. 32 M
.5 Land Acquisition.5 Land Acquisition.5 Land Acquisition.5 Land Acquisition

January 2008January 2008January 2008January 2008
1.1.1.1. Cut-off Dam (South Dam)Cut-off Dam (South Dam)Cut-off Dam (South Dam)Cut-off Dam (South Dam)
1.1 Access Road 5,000$
1.2 Stripping Dam Site, Borrow Pits, & Cutoff Trench -
1.3 Outlet Gate, Sluice & Energy Dissipator 55,000
1.4 Semi Pervious Fill 217,000
1.5 Impervious Fill 52,000
1.6 Rock Riprap 12,000
1.7 Piezometers & Surface Reference Points 6,000
1.8 Toe Drain 3,000
Sub TotalSub TotalSub TotalSub Total 350,000350,000350,000350,000$ $ $ $
2.2.2.2. Outlet Dam (North Dam)Outlet Dam (North Dam)Outlet Dam (North Dam)Outlet Dam (North Dam)
2.1 Dewatering, Outlet Channel Backfill, & site prep 8,000$
2.2 Outlet Gate, Discharge Pipe, Energy Dissipator, & Measuring Weir 113,000
2.3 Impervious Fill 55,000
2.4 Semi Pervious Fill 252,000
2.5 Pervious Fill 13,000
2.6 Rock Rip Rap 12,000
2.7 Outlet Channel Brushing & Excavation 5,000
2.8 Toe Drain 5,000
2.9 Spillway, Road Culverts, I Riprapped Channel 14,000
2.10 Piezometers Surface Reference Points 13,000
Sub TotalSub TotalSub TotalSub Total 490,000490,000490,000490,000$ $ $ $
3.3.3.3. Saddle Dams (North and South)Saddle Dams (North and South)Saddle Dams (North and South)Saddle Dams (North and South)
3.1 Access Road 2,000$
3.2 Stripping Dam Site 2,000
3.3 Pervious Fill 4,500
3.4 Impervious Fill -
3.5 Rock Rip Rap 2,000
3.6 Surface Reference Points -
3.7 Moose Habitat 5,500
Sub TotalSub TotalSub TotalSub Total 16,00016,00016,00016,000$ $ $ $
4.4.4.4. Stirling Creek DiversionStirling Creek DiversionStirling Creek DiversionStirling Creek Diversion
3.1 Diversion Structure & Rock Riffles 33,000$
3.2 Clearing R/W -
3.3 Pipeline - 600 mm 30,000
63,00063,00063,00063,000$ $ $ $
5.5.5.5. Reservoir Clearing& Borrow Pit RestorationReservoir Clearing& Borrow Pit RestorationReservoir Clearing& Borrow Pit RestorationReservoir Clearing& Borrow Pit Restoration
4.1 Clearing, Burning, ac 8,000$
4.2 Reshape and Seed Borrow Pits 13,000
21,00021,00021,00021,000$ $ $ $
6.6.6.6. Contingencies (5%)Contingencies (5%)Contingencies (5%)Contingencies (5%) 30,00030,00030,00030,000$ $ $ $
7.7.7.7. Engineering & Project ManagementEngineering & Project ManagementEngineering & Project ManagementEngineering & Project Management 120,000120,000120,000120,000$ $ $ $
8.8.8.8. District Administration (5%)District Administration (5%)District Administration (5%)District Administration (5%) 20,00020,00020,00020,000$ $ $ $
PROJECT TOTAL TO COMPLETEPROJECT TOTAL TO COMPLETEPROJECT TOTAL TO COMPLETEPROJECT TOTAL TO COMPLETE 1,110,0001,110,0001,110,0001,110,000$ $ $ $
CAPITAL WORKS PROGRAMCAPITAL WORKS PROGRAMCAPITAL WORKS PROGRAMCAPITAL WORKS PROGRAM
TURTLE LAKE RESERVOIRTURTLE LAKE RESERVOIRTURTLE LAKE RESERVOIRTURTLE LAKE RESERVOIR
COST ESTIMATE TO COMPLETECOST ESTIMATE TO COMPLETECOST ESTIMATE TO COMPLETECOST ESTIMATE TO COMPLETE

January 2008January 2008January 2008January 2008
1.1.1.1. Saucier Road PipelineSaucier Road PipelineSaucier Road PipelineSaucier Road Pipeline
.1 200 mm PVC Pipe, 360 m @ $108 Installation only 39,000$
.2 Valves & Fittings, Installation only 3,000
.3 Pipe & Fittings Purchase 22,000
.4 Pavement, 100 m2 @ $20 2,000
.5 Engineering & Contingencies @ 25% 11,000
.6 District Administration @ 10% 5,000
Sub TotalSub TotalSub TotalSub Total 82,00082,00082,00082,000$ $ $ $
2.2.2.2. Gallagher's Fairway S/Jean RoadGallagher's Fairway S/Jean RoadGallagher's Fairway S/Jean RoadGallagher's Fairway S/Jean Road
.1 200 mm PVC Pipe, 420 m @ $180 76,000
.2 Valves and Fittings 15,000
.3 Engineering & Contingencies @ 25% 23,000
.4 District Administration @ 10% 11,000
Sub TotalSub TotalSub TotalSub Total 125,000125,000125,000125,000$ $ $ $
x 35% of Projectx 35% of Projectx 35% of Projectx 35% of Project 45,00045,00045,00045,000$ $ $ $
3.3.3.3. Miscellaneous Undefined PipelinesMiscellaneous Undefined PipelinesMiscellaneous Undefined PipelinesMiscellaneous Undefined Pipelines 100,000100,000100,000100,000$ $ $ $
4.4.4.4. PR Station No. 32 MPR Station No. 32 MPR Station No. 32 MPR Station No. 32 M
.1 Excavation and Backfill 5,000$
.2 Vault 20,000
.3 Mechanical 30,000
.4 Electrical 13,000
.5 Power Supply 5,000
.6 Engineering & Contingencies @ 25% 18,000
.7 District Administration @ 10% 9,000
Sub TotalSub TotalSub TotalSub Total 100,000100,000100,000100,000$ $ $ $
x 20% of Projectx 20% of Projectx 20% of Projectx 20% of Project 20,00020,00020,00020,000$ $ $ $
5.5.5.5. Land AcquisitionLand AcquisitionLand AcquisitionLand Acquisition 20,00020,00020,00020,000$ $ $ $
6.6.6.6. TOTALTOTALTOTALTOTAL 267,000267,000267,000267,000$ $ $ $
CAPITAL WORKS PROGRAMCAPITAL WORKS PROGRAMCAPITAL WORKS PROGRAMCAPITAL WORKS PROGRAM
DISTRIBUTION SYSTEMDISTRIBUTION SYSTEMDISTRIBUTION SYSTEMDISTRIBUTION SYSTEM
Cost EstimatesCost EstimatesCost EstimatesCost Estimates