capturing the electromagnetic counterparts of binary
TRANSCRIPT

MNRAS 459, 121–139 (2016) doi:10.1093/mnras/stw576Advance Access publication 2016 March 11
Capturing the electromagnetic counterparts of binary neutron starmergers through low-latency gravitational wave triggers
Q. Chu,1‹ E. J. Howell,1‹ A. Rowlinson,2,3,4 H. Gao,5 B. Zhang,6 S. J. Tingay,7,8
M. Boer9 and L. Wen1‹1School of Physics, University of Western Australia, Crawley, WA 6009, Australia2CSIRO Astronomy and Space Science, Sydney, NSW 1710, Australia3Anton Pannekoek Institute, University of Amsterdam, Postbus 94249, NL-1090 GE Amsterdam, the Netherlands4The Netherlands Institute for Radio Astronomy (ASTRON), PO Box 2, NL-7990 AA Dwingeloo, the Netherlands5Department of Astronomy, Beijing Normal University, Beijing 100875, China6Department of Physics and Astronomy, University of Nevada, Las Vegas, NV 89154, USA7International Centre for Radio Astronomy Research, Curtin University, Perth, WA 6845, Australia8ARC Centre of Excellence for All-sky Astrophysics (CAASTRO), Australia9CNRS – ARTEMIS, Boulevard de l’Observatoire, CS 34229, F-06304 Nice Cedex 04, France
Accepted 2016 March 8. Received 2016 March 4; in original form 2015 September 21
ABSTRACTWe investigate the prospects for joint low-latency gravitational wave (GW) detection andprompt electromagnetic (EM) follow-up observations of coalescing binary neutron stars(BNSs). For BNS mergers associated with short duration gamma-ray bursts (SGRBs), wefor the first time evaluate the feasibility of rapid EM follow-ups to capture the prompt emis-sion, early engine activity, or reveal any potential by-products such as magnetars or fast radiobursts. To achieve our goal, we first simulate a population of coalescing BNSs using realisticdistributions of source parameters and estimate the detectability and localization efficiencyat different times before merger. We then use a selection of facilities with GW follow-upagreements in place, from low-frequency radio to high-energy γ -ray to assess the prospectsof prompt follow-up. We quantify our assessment using observational SGRB flux data ex-trapolated to be within the horizon distances of the advanced GW interferometric detectorsLIGO and Virgo and to the prompt phase immediately following the binary merger. Our re-sults illustrate that while challenging, breakthrough multimessenger science is possible withEM follow-up facilities with fast responses and wide fields-of-view. We demonstrate that theopportunity to catch the prompt stage (<5 s) of SGRBs can be enhanced by speeding up thedetection pipelines of both GW observatories and EM follow-up facilities. We further showthat the addition of an Australian instrument to the optimal detector network could possiblyimprove the angular resolution by a factor of 2 and thereby contribute significantly to GW–EMmultimessenger astronomy.
Key words: gravitational waves – methods: observational – binaries: close – gamma-rayburst: general – stars: neutron.
1 IN T RO D U C T I O N
The Laser Interferometer Gravitational-Wave Observatory (LIGO)detection of GW 150914 from the inspiral and merger of a pairof black holes has ignited a new era of astronomy (Abbott et al.2016a). To fully exploit this new frontier it has been expected thattriggered follow-ups by facilities operating outside the gravitationalwave (GW) spectrum will become common place. During this new
�E-mail: [email protected] (QC); [email protected] (EJH);[email protected] (LW)
multimessenger era, prompt electromagnetic (EM) follow-ups fromlow-latency GW triggers can provide a pan-spectral pathway ofunderstanding into the inner engines and underlying mechanismsbehind a multitude of GW sources.
The Advanced LIGO (aLIGO; Aasi et al. 2015) detector launchedits first science operations at sensitivities that would allow the de-tection of coalescing systems of binary neutron stars (BNSs) inthe range of 40–80 Mpc;1 aLIGO will be followed by Advanced
1 This range refers to the detectable range averaged over all sky locationsand source orientations for BNS systems with individual masses of 1.4 M�.
C© 2016 The AuthorsPublished by Oxford University Press on behalf of the Royal Astronomical Society
at Curtin U
niversity Library on A
ugust 24, 2016http://m
nras.oxfordjournals.org/D
ownloaded from

122 Q. Chu et al.
Figure 1. A cartoon illustrating some of the possible multimessenger pathways and end products of coalescing systems of NSs and BHs in different energybands. We also show the approximate time-scales from GW merger. SGRBs are strongly linked with the merger of compact objects (Paczynski 1986; Eichleret al. 1989; Narayan, Paczynski & Piran 1992; Berger et al. 2005; Gehrels et al. 2005; Bloom et al. 2006; Rezzolla et al. 2011) and could be accompanied byan optical flash or a FRB (Totani 2013). If a stable or supramassive magnetar is formed, the long lived X-ray plateaus observed in many SGRBs could be thesignature of direct dissipation of magnetar wind energy (Rowlinson et al. 2010b, 2013; Zhang 2013); the collapse of a merger product to a black hole couldalso produce an FRB (Falcke & Rezzolla 2014; Zhang 2014). At later times predictions for an optical/IR kilonova (Li & Paczynski 1998; Metzger et al. 2010;Barnes & Kasen 2013) have gained support though recent observations (Berger, Fong & Chornock 2013; Tanvir et al. 2013). For a relatively small opacity, akilonova precursor may appear early enough which would benefit from the low-latency observations (Metzger et al. 2015).
Virgo (AdV; Acernese et al. 2015) later this year (2016). By 2019aLIGO is expected to reach design sensitivity, with a BNS detectionrange of 200 Mpc. AdV is expected to reach this milestone by 2018with BNS observations out to a distance of 130 Mpc (Acernese et al.2015). Other second-generation detectors are also planned or under-going construction. KAGRA, a Japanese instrument, is envisionedto begin operation in 2017 (Aso et al. 2013) and fulfil its baselinedesign around 2018–2019 (Somiya 2012). LIGO-India (Aasi et al.2013) has obtained approval and is expected to be operational from2020, reaching a design sensitivity at the same level as aLIGO noearlier than 2022 (Aasi et al. 2013).
Coalescing systems of BNSs are promising sources of GWs dueto the fact that the inspiral phase is well modelled by the post-Newtonian (PN) approximation. The relatively low masses of BNSsystems mean that these events will span most of the frequencyband of aLIGO detectors. At design sensitivity, aLIGO is predictedto make 0.4–400 BNS detections per year according to current ratepredictions (Abadie et al. 2010; Coward et al. 2012). The coales-cence rate of binary systems comprising neutron stars and blackholes (NS/BH) and binary black holes (BBH) are less confidentlypredicted due to a sparsity of observational data. Studies have pre-dicted yearly detection rates of order 0.2–300 detections for NS/BHevents and 0.4–1000 for BBH events (Abadie et al. 2010). For sys-
It is approximately 1/2.26 of the horizon distance – the range for optimallyoriented and located sources.
tems including at least one BH the detection of GW 150914 isimportant as it proved that BH birth kicks do not always break upthe evolutionary formation channels for these sources (Abbott et al.2016b).
Multimessenger astronomy is one of the highly prioritized re-search areas in the GW community (Howell et al. 2015). Comple-mentary observations from EM, neutrino or high-energy particlefacilities would not only improve the confidence of a GW detec-tion, but also maximize the science return by providing a wealthof additional astrophysical information. A number of plausible EMemission mechanisms and end products that could be produced dur-ing the inspiral and merger phase of coalescing compact objectshave been proposed. We summarize some of the popular scenar-ios in Fig. 1; predictions are highly uncertain as illustrated by thevarious pathways and end products and could involve combina-tions of BHs and/or magnetar formation or fast radio bursts (FRBs).The anticipated onset time, duration, and observable wavelengthsshown suggest that transient EM emission could possibly occurwithin a few seconds after the binary merger (Centrella, Nissanke& Williams 2012; Metzger & Berger 2012). To catch these events,generating GW event triggers without delay (thus low-latency) andobtaining prompt EM follow-ups are crucial. Achieving joint GW–EM observations of these events could reveal the major processesand interactions at play during the binary merger process (see de-tailed discussion in Section 5).
A significant effort from both GW and EM astronomy com-munity has been undertaken to achieve prompt GW-triggered EM
MNRAS 459, 121–139 (2016)
at Curtin U
niversity Library on A
ugust 24, 2016http://m
nras.oxfordjournals.org/D
ownloaded from
EM follow-up prospects from low-latency GW 123
follow-up observations (Abadie et al. 2012; Shawhan 2012), thoughas yet, no joint GW–EM detections have been made. Recent devel-opments in the areas of astronomical and computing technologiesin the following three fronts will further improve the chance ofcatching EM transients during the binary coalescence.
(i) Advances in low-latency GW search pipelines that are capableof generating event triggers within minutes upon the arrival of adetectable signal.
(ii) Localizations are likely to improve as more GW detectors areconstructed.
(iii) Development of wide-field EM telescopes capable of rapidresponse within tens of seconds and with fields of view (FoV)comparable to the error area of GW source sky direction (typicallytens of square degrees for the aLIGO/AdV network).
The first point has been studied since the initial LIGO era anda number of low-latency GW trigger-generation pipelines havebeen proposed and tested (Buskulic et al. 2010; Abadie et al.2012; Cannon et al. 2012; Hooper et al. 2012; Luan et al. 2012);the prospects of rapid alerts from GW events are discussed inShawhan (2012).
The benefits of a larger network given in the second point haveprompted studies of source localization by advanced networks by anumber of authors (see the studies of Fairhurst 2011; Schutz 2011;Vitale & Zanolin 2011; Chu, Wen & Blair 2012; Aasi et al. 2013;Nissanke, Kasliwal & Georgieva 2013). Wen, Fan & Chen (2008),Fairhurst (2009), Wen & Chen (2010), Zanolin, Vitale & Makris(2010), Abadie et al. (2010), Nissanke et al. (2011), Klimenkoet al. (2011) have investigated key aspects of source localizationand estimation of localization accuracy. For low-latency detections,studies of the early localization of BNS sources when their GWs aredetected tens of seconds before the merger can be found in Manzotti& Dietz (2012) and Cannon et al. (2012).
A recent study of the sky localization (Singer et al. 2014) for theearly detector network expected in 2016–2017 indicate that the errorin GW localization will be of order 200 deg2. Methods of identifyingGW sources from a large sky error regions will therefore have greatimportance and have been proposed by Nissanke et al. (2013), Fan,Messenger & Heng (2014), and Cowperthwaite & Berger (2015).
To combat the large error regions the range of wide-field EMinstruments that are in operation or are being developed across theentire range of the EM spectrum will be important. Additionally,the possibility of capturing the early EM emissions can be providedthrough low-latency alerts; this will require fast response EM in-struments. A range of such instruments from high to low energywill be fully discussed in Section 4.
This paper will investigate the types of breakthrough science thatwill be possible through the low-latency detection and localizationof BNS GW events, in particular, how these will enable promptGW–EM observations of BNS coalescence in the era of advanceddetectors. While the science of GW–EM astronomy has been widelyinvestigated previously for longer time-scale EM emissions (e.g.Metzger & Berger 2012; Howell et al. 2015) the feasibility to captureprompt and early EM emissions from binary mergers has not beenstudied before. To examine the possible EM responses, we use acomprehensive simulation that extends on previous investigations ofthe early detection and localization of compact binary coalescence(CBC) sources by extensively sampling a range of parameters of theNS waveform and sky localization. We produce statistics showingthe expected number of detections and their sky localization errorregions at different times before merger. Based on these results,we for the first time extrapolate the temporally complete EM data
currently available for short duration gamma-ray bursts (SGRBs)to investigate the capacity of EM instruments for short time-scaleEM follow-up observations through the γ -ray, X-ray, optical, andradio. We consider a range of possible emission mechanisms forBNS mergers; some of the possible pathways and end products areillustrated in Fig. 1. Furthermore, our investigation uses the fullcomplement of GW detector network configurations that will beavailable through the advanced detector era by including KAGRA,LIGO-India, and a proposed Southern hemisphere detector AIGO.
The paper is organized as follows. In Section 2 we describe theframework we use to simulate the GW detection and localizationand provide these results in Section 3. In Section 4 we discussthe potential of EM telescopes for rapid follow up observationsand in Section 5 provide a review of some of the possible EMemissions that could be captured by prompt observations. Then inSection 6 we use our simulated detection and localization statisticswith observational data to determine the astrophysical implicationsof low-latency GW detection and prompt EM follow up. We thensummarize our findings in Section 7.
2 M E T H O D O L O G Y
2.1 GW detection
The response of a laser inteferometric GW detector to a GW signalat a given time t is given by
h(t) = F+(t)h+(t) + F×(t)h×(t), (1)
where F+ and F× are the antenna pattern functions of two indepen-dent plus and cross GW polarizations denoted as h+ and h×. Weadopt the convention of the antenna responses given in Jaranowski,Krolak & Schutz (1998). The antenna patterns are expressed asfunctions of the source sky location – the right ascension α, thedeclination δ, and the polarization angle ψ . In our simulation, wecalculate the waveform h+(t), h×(t) using the second-order PN ex-pansion. It is a function of 11 parameters: the luminosity distanceof the source r, the orbital inclination angle ι, the coalescence phaseφc, masses and spins (three parameters for each spin) of thesetwo inspiral bodies. In this paper we only consider non-spinningBNS coalescence.
Matched templates are constructed from the CBC parameterspace to perform filtering on the detector data to search for andextract GW signals (Finn 1992). The output of matched filtering isthe signal-to-noise ratio (SNR), from which a selection criterion isapplied to yield credible GW triggers. Throughout this paper weassume that our detections yield an optimal SNR for each source;that is we assume the template matches the source exactly.
For a network of detectors, two strategies can be consideredto select GW candidate triggers. The coincident selection criteria(which we refer to as the triggering criteria in the later part ofthe paper) require at least two detectors to detect signals above apredefined SNR threshold. A coherent selection criterion assumesthat data from different detectors form coherent responses fromthe source; thus a single statistic is produced and applied against athreshold for trigger generation.
2.2 Latency of GW event triggers
The latency of a GW detection pipeline is defined as the time elapsedfrom when the source has sufficient SNR for detection to the time
MNRAS 459, 121–139 (2016)
at Curtin U
niversity Library on A
ugust 24, 2016http://m
nras.oxfordjournals.org/D
ownloaded from

124 Q. Chu et al.
Table 1. The workflow of a low-latency CBC detection pipeline showing the latencies achieved in science and engineering runs as well as a projected optimisticlatency. The LIGO S6–Virgo VSR2/VSR3 joint observing run was performed during 2009–2010; ER5 and ER6 were engineering runs used to streamline dataanalysis pipelines by simulating the environment of a real science run.
Process Latency in S6–VSR2/VSR3 joint run ER5/ER6 latency Optimistic latency
GW data acquisition, calibration and distribution 1 min ∼10 s O(1) sGW trigger generation 2–7 min ∼40 s O(1) sFollow-up preparation 2–3 min ∼60 s O(1) sHuman vetting 20–30 min N/A 0 sa
aThis assumes that vetting can be eliminated through automatic processing.
it is registered in the GW event data base.2 Table 1 outlines theworkflow of a typical low-latency CBC pipeline showing the laten-cies achieved in the LIGO S6–Virgo VSR2/VSR3 joint observingrun, the ER5 and ER6 engineering runs, and a projected optimisticpipeline.
The workflow was first practiced in the latest joint LIGO/Virgoscience run (Abadie et al. 2012) and the latency is shown in thesecond column of Table 1. In this process detector data were ac-quired, conditioned, and distributed. Candidate triggers includingCBC triggers were generated by different low-latency GW searchpipelines and submitted to the data base. Significant events werethen selected and validated manually to form alerts to participatingEM observatories. The total time lag was of order 30 min of which20 min consisted of human validation. The third column of Ta-ble 1 shows the results of a recent engineering run with low-latencypipelines specific to search for CBC signals and the final columnshows estimated optimistic latencies possible in the future.
GW detector data are first acquired onsite and calibrated and dis-tributed to the computing node where search pipelines are running.From the latest engineering runs, this process takes of order 10 s.In principle, there is no intrinsic obstacle preventing this procedureto achieve minimal latency. Therefore, we assume in the most opti-mistic scenario that data can be packed, calibrated and distributedwithin O(1) s.
At the time of writing, three low-latency GW search pipelineshave been implemented for the LIGO–Virgo collaboration to searchfor CBC signals (Buskulic et al. 2010; Abadie et al. 2012; Cannonet al. 2012; Hooper et al. 2012; Luan et al. 2012). These three searchpipelines have all achieved an average of around 40 s latency fromthe time of data acquisition to trigger registration. This latencyis mainly due to the processes of data whitening, filtering, andcoincident analysis. By employing high-performance computinghardware such as graphic processing units (GPUs) (Chung et al.2010; Liu et al. 2012) and new high-performance algorithms, thislatency could be further reduced. We assume in the future O(1) slatency for filtering and trigger generation from multiple detectorscan be achieved in the most optimistic case.
The third row of Table 1 shows the latencies introduced throughfollow-up preparation, which includes the gathering of event pa-rameters, e.g. sky localization and calculating telescope tilings.The main latency of this part comes from event localization. Alow-latency localization pipeline BAYSTAR3 has been developed andtested (Singer & Price, in preparation) and has achieved latenciesin localization of seconds; the run time of this method is shown tobe almost perfectly proportional to the number of CPU cores. Thusthis latency could be largely reduced and in the optimistic scenariowe assume O(1) s latency for this procedure.
2 GRACEDB: the Gravitational Wave Candidate Event Database.3 BAYESian TriAngulation and Rapid localization.
Human vetting introduces the highest latency as the first detec-tions need to be validated carefully. It is natural that once enoughdetections have been recorded, the knowledge gained will allow thispart of the routine to be eliminated by vetoing candidates automat-ically. We therefore estimate O(1) s for the optimistic case.
In summary, we consider several latency scenarios that includeboth GW detection and localization for GW triggering: an idealzero latency and latencies of [1, 10, 40 s] which takes into accountthe range of extreme to plausible latencies to send out a GW trig-ger. In Section 5, our discussion is focused on a latency of 40 swhich is achievable in the coming science runs and an optimisticlatency of 1 s.
2.3 Sky localization accuracy
To determine the localization accuracy of the detected GW events,we utilize the formalism of Wen & Chen (2010) who used theFisher information matrix to derive a geometrical expression forsky localization accuracy. According to the Cramer–Rao bound(Cramer 1946), the lower bound of the variance of any unbiasedestimator is determined by the inverse of the Fisher matrix �. Usingthis property, one can calculate the lower bound on the localizationerror area. This estimation is applicable to any unbiased estimatorsand to all GW waveforms. This method is also used in Schutz (2011)for a sky localization comparison of different detector networks.
Wen & Chen (2010) presented angular resolution formulae fortwo different detection scenarios: a best case scenario assumed thatthe waveform was known but the arrival time was unknown; a worstcase scenario assumed that both these quantities were unknown.The calculations include both phase and amplitude information ofthe signal. The angular resolutions derived from the best case sce-narios were shown to be around half the areas of those determinedassuming the worst case scenario (Chu et al. 2012). In this paper,we assume the best case scenario to calculate angular resolution foreach detection. This is given as
= 4√
2πc2
√(∑
i ξi)2∑J,K,L,M ξJξKξLξM|(rKJ × rML) · n|2 , (2)
with n the direction of the source which is a function of right ascen-sion α and declination δ and rKJ the distance vector from detectorK to detector J; the quantity ξi = ∫ ∞
−∞ f 2|z|2df can be interpretedas noise-weighted energy flux received by the ith detector and z isthe SNR (as discussed in Section 2.1).
2.4 Monte Carlo simulation
To produce a sample of detection statistics we simulate a popula-tion of 20 000 BNS sources. Our Monte Carlo code extends otherstudies by considering a full complement of parameters for the BNSwaveform and the sky location. The values of right ascension α and
MNRAS 459, 121–139 (2016)
at Curtin U
niversity Library on A
ugust 24, 2016http://m
nras.oxfordjournals.org/D
ownloaded from
EM follow-up prospects from low-latency GW 125
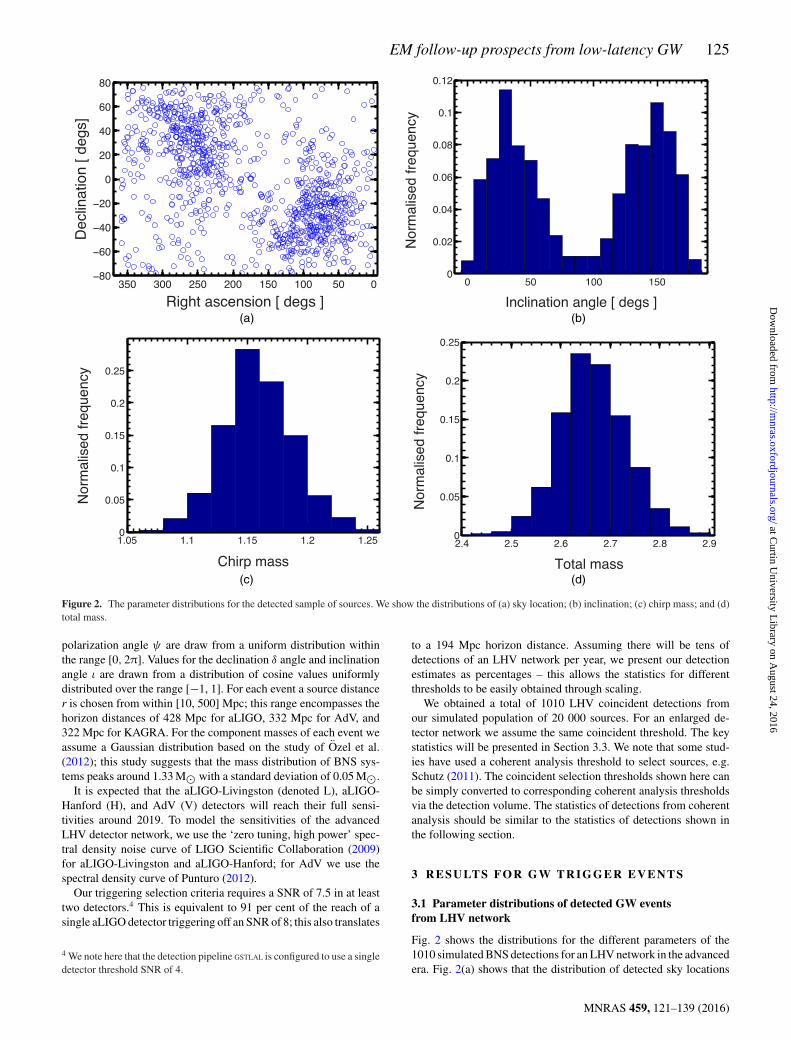
Figure 2. The parameter distributions for the detected sample of sources. We show the distributions of (a) sky location; (b) inclination; (c) chirp mass; and (d)total mass.
polarization angle ψ are draw from a uniform distribution withinthe range [0, 2π]. Values for the declination δ angle and inclinationangle ι are drawn from a distribution of cosine values uniformlydistributed over the range [−1, 1]. For each event a source distancer is chosen from within [10, 500] Mpc; this range encompasses thehorizon distances of 428 Mpc for aLIGO, 332 Mpc for AdV, and322 Mpc for KAGRA. For the component masses of each event weassume a Gaussian distribution based on the study of Ozel et al.(2012); this study suggests that the mass distribution of BNS sys-tems peaks around 1.33 M� with a standard deviation of 0.05 M�.
It is expected that the aLIGO-Livingston (denoted L), aLIGO-Hanford (H), and AdV (V) detectors will reach their full sensi-tivities around 2019. To model the sensitivities of the advancedLHV detector network, we use the ‘zero tuning, high power’ spec-tral density noise curve of LIGO Scientific Collaboration (2009)for aLIGO-Livingston and aLIGO-Hanford; for AdV we use thespectral density curve of Punturo (2012).
Our triggering selection criteria requires a SNR of 7.5 in at leasttwo detectors.4 This is equivalent to 91 per cent of the reach of asingle aLIGO detector triggering off an SNR of 8; this also translates
4 We note here that the detection pipeline GSTLAL is configured to use a singledetector threshold SNR of 4.
to a 194 Mpc horizon distance. Assuming there will be tens ofdetections of an LHV network per year, we present our detectionestimates as percentages – this allows the statistics for differentthresholds to be easily obtained through scaling.
We obtained a total of 1010 LHV coincident detections fromour simulated population of 20 000 sources. For an enlarged de-tector network we assume the same coincident threshold. The keystatistics will be presented in Section 3.3. We note that some stud-ies have used a coherent analysis threshold to select sources, e.g.Schutz (2011). The coincident selection thresholds shown here canbe simply converted to corresponding coherent analysis thresholdsvia the detection volume. The statistics of detections from coherentanalysis should be similar to the statistics of detections shown inthe following section.
3 R E S U LT S F O R G W T R I G G E R E V E N T S
3.1 Parameter distributions of detected GW eventsfrom LHV network
Fig. 2 shows the distributions for the different parameters of the1010 simulated BNS detections for an LHV network in the advancedera. Fig. 2(a) shows that the distribution of detected sky locations
MNRAS 459, 121–139 (2016)
at Curtin U
niversity Library on A
ugust 24, 2016http://m
nras.oxfordjournals.org/D
ownloaded from

126 Q. Chu et al.
is bimodal. The locations of maxima and minima are consistentwith the landscape of the antenna power pattern of a LHV detectornetwork (e.g. fig. 2 in Nissanke et al. 2010). As shown in severalstudies (Nissanke et al. 2010; Schutz 2011; Manzotti & Dietz 2012)adding more detectors to GW search will significantly improve skycoverage.
The distribution of detected inclinations shown in Fig. 2(b) isbimodal and shows a detection preference towards low inclinationangles. We note however that the fraction of detected inclinationsbelow 25◦ is less than one quarter (see also Schutz 2011). Thedistributions of the chirp mass and total mass of sources are shownin Figs 2(c) and (d).
3.2 The localization of BNS detections
In this section we present the localization evolution statistics for theLHV detections and for an extended detector network that covers theentire parameter space of possible BNS sources. There is a crucialinterplay between sending out a prompt alert to an EM facility andsurveying the GW error region before the EM source fades. An earlytrigger can allow a telescope to get on source, but at the expense ofa larger GW error region. The situation will vary significantly fordifferent types of telescope and is also dependent of the type of EMemission. In preparation for the later analysis of EM follow-up inSection 6 we have calculated the percentage of sources detectiblewithin different sized error regions at different times before merger.We note that previous studies have calculated the evolution of thelocalization property with time using a qualitative analysis (e.g.Cannon et al. 2012) rather than the quantitative approach adoptedin this paper.
Fig. 3 displays the percentile charts for the evolution of networkSNR (Fig. 3a) and localization error area (Fig. 3b) for the 1010LHV detections as they approach merger (t = 0). The networkSNR is calculated as root-sum-square of individual SNRs. The plotshows that the median network SNR (thick solid line) is less than5 at 100 s before coalescence. This SNR increases by 1 every 10 sduring −100 to −10 s and by 0.5 every second during −10 to −1 sbefore reaching a SNR of 16 at merger. We find that 10 per centof the detections will yield a SNR greater than 27 at merger timewhich corresponds to a localization area of around 5 deg2.
Fig. 3(b) shows the percentile range of localization error areas at90 per cent confidence level as a function of time before merger.On average, the angular resolution is about 30 000 deg2 at −100 s.As the network SNR increases, this improves to <5000 deg2 at−40 s, <500 deg2 before −10 s and less than a hundred squaredegrees at −1 s. These results support the early localization resultsof a number of recent studies: see for example Cannon et al. (2012),Manzotti & Dietz (2012) and chap. 3, fig 3.3 of Singer (2015).
3.3 Improved early warning events with a largerdetector network
In this section we investigate the benefits of an enlarged GW net-work in terms of early detection and localization; the scenarios con-sidered are applicable to the advanced detector era beyond 2019.We consider a number of additions to the LHV network: these areKAGRA (labelled as J), the proposed Indian detector: LIGO-India(labelled as I), and AIGO (labelled as A). Though AIGO is notapproved financially at the moment, it is considered here for com-parison. As in Section 2.4 we use the aLIGO spectral density forLIGO-India and AIGO, and the spectral density from Aso et al.
Figure 3. Percentile curves of (a) network SNR and (b) (error box at90 per cent confidential level) as a function of time before merger for thesimulated BNS triggers obtained by an LHV network.
(2013) for KAGRA. The main results are given in Table 2 andFig. 4.
The second column of Table 2 shows the detection capability ofdifferent detector networks in terms of the number of detectionsnormalized to that obtained from a LHV network (the reference de-tection capability of LHV is given here as 1.00). For larger networkconfigurations, we find that the detection capability is improvedconsiderably. Using the same coincident triggering threshold fordifferent detector networks, we obtain 1133 detections for LHVJ,1291 detections for LHVI, 1366 detections for LHVJI, 1280 detec-tions for LHVA, and 1584 detections for LHVJIA. The detectioncapability of a larger detector network depends on the sensitivitiesof the additional detectors. We find that adding a single detectorwith the same detection capability as aLIGO to the LHV networkwill increase the detection rate by about 30 per cent while addingKAGRA to the LHV network will improve the detection rate by12 per cent as the sensitivity of KAGRA is 0.75 of that of aLIGO.The detection percentage for each network at different times ofthe final merger phase is shown in the first row for each networkconfiguration.
Table 2 also shows localization achievable at exact times beforemerger for different GW network configurations. We illustrate thisby showing the sizes of the error regions required to contain 10, 50,and 90 per cent of the detections. All the error region numbers areestimated at the 90 per cent confidential level. We find that addinga KAGRA or LIGO-India instrument to the LHV network can
MNRAS 459, 121–139 (2016)
at Curtin U
niversity Library on A
ugust 24, 2016http://m
nras.oxfordjournals.org/D
ownloaded from

EM follow-up prospects from low-latency GW 127
Table 2. The detection statistics obtained for different advanced detector networks shown in the first column. The second column shows the relative detectioncapability of each network in comparison to LHV. Columns 4–7 provide two sets of statistics at different times before merger for each detector network: inthe first row we provide the percentage of detections achieved pre-merger; the second row gives the sizes of the error regions required to contain 10, 50, and90 per cent of the detections at exact times before merger.
Network Detection Time before mergercapability 40 s 10 s 1 s 0 s
LHV 1.00 Percentage detected 9 per cent 35 per cent 76 per cent 100 per cent(10/50/90 per cent) error regions (deg2) 300/1000/2200 70/270/780 20/80/240 5/20/50
LHVJ 1.12a Percentage detected 8 per cent 32 per cent 76 per cent 100 per cent(10/50/90 per cent) error regions (deg2) 240/820/1600 50/200/470 10/40/120 3/10/30
LHVI 1.28 Percentage detected 9 per cent 33 per cent 75 per cent 100 per cent(10/50/90 per cent) error regions (deg2) 120/380/910 40/130/350 10/40/100 3/9/20
LHVA 1.27 Percentage detected 9 per cent 35 per cent 76 per cent 100 per cent(10/50/90 per cent) error regions (deg2) 80/310/850 30/90/250 9/30/80 2/6/20
LHVJI 1.35 Percentage detected 8 per cent 32 per cent 75 per cent 100 per cent(10/50/90 per cent) error regions (deg2) 100/340/830 30/110/300 9/30/80 2/7/20
LHVJIA 1.57 Percentage detected 9 per cent 33 per cent 75 per cent 100 per cent(10/50/90 per cent) error regions (deg2) 60/180/400 20/60/140 6/20/40 1/4/10
aThis number is lower than that of LHVI/LHVA network as the sensitivity we adopted for detector J is 0.75 of that of detector I/A.
Figure 4. Median localization error areas of detections at exact times priorto merger for different detector networks. The fluctuations seen at earlytimes are due to the smaller number of detections in that regime.
improve the localization by a factor of 2. Increasing the networkto five detectors can lead to a factor of 3 improvements. AddingAIGO on its own results in an improvement that is equivalent toadding both KAGRA and LIGO-India due to the longer baselineand optimal location. Adding AIGO to the five-detector networkcan further improve the localization by a factor of around 2 – thisis a factor 5 improvement over the initial LHV network.
An important fact is that only a fraction of detections can bedetected at times prior to merger. We take this into considerationand show the localization error area for the detections at differenttimes prior to merger. Fluctuations of localization error area at earlytimes in Fig. 4 are due to small number of detections in that epoch.We note our estimated localization error areas determined nearmerger time are comparable, though slightly more optimistic thanFairhurst (2011) and Aasi et al. (2013). Whilst the aforementionedstudies used the Fisher matrix for the triangulation localization
method, our estimates are based on the Fisher matrix regardlessof the localization method, thus represent a lower limit of all non-biased estimations.
In practical terms, the latencies introduced in the GW–EM effortwill affect the timing of the EM follow-up observation and thereforeconstrain the phenomena we are able to observe. Using Table 2, onecan easily consider different GW–EM reaction latency scenariosand find the detection ratio and localization error area for follow-upobservations at merger or at post-merger time-scales. For example,assuming a 40 s total reaction latency – incorporating the whole GWtrigger generation and EM follow-up readiness latencies – can beachieved, those GW events that pass the GW triggering criteria 40 sbefore the merger can potentially be observed right at their mergertime by EM instruments with wide FoVs and rapid responses. Forthe LHV network, which is expected to be operational at early stageof advanced era, around 9 per cent of all detections can be observedat the merger time within 40 s. The median localization error areaof the detections at the merger time is over 1000 deg2. The medianlocalization error area can be brought down to about 400 deg2 by anLHVI detector network and 10 per cent detections of LHVI networkat the merger time could be localized within 120 deg2. With a five-detector network, 10 per cent of the detections could be discoveredand localized within 100 deg2 at the time of merger.
If a greater effort could reduce the total reaction latency to 10 s(this highly optimistic scenario would require an EM facility to beon source), the detection ratio at the merger time will be raised toaround 33 per cent for the six networks which is three times theobserved detections at 40 s latency. More importantly, the local-ization accuracy is also three times better than that achieved with40 s latency. For the LHV network, the median localization area isimproved fourfold to 270 deg2 and 10 per cent of detections couldbe localized within 70 deg2. Adding KAGRA or LIGO-India intothe LHV network will improve the localization to less than 50 deg2
for 10 per cent of their detections. The localization accuracy will befurther brought down to about 30 deg2 for a network of LHVA orLHVJI of 10 per cent of their detections. The best localization accu-racy comes at an operation of six detectors with around 90 per centof the detections localized to within 140 deg2. We consider furtherthe possibilities of existing EM facilities in the next section.
MNRAS 459, 121–139 (2016)
at Curtin U
niversity Library on A
ugust 24, 2016http://m
nras.oxfordjournals.org/D
ownloaded from

128 Q. Chu et al.
Table 3. The properties of some of the high-energy instruments planned to be operational during aLIGO.
Instrument Energy range FoV Sensitivity Exposure time Response time Ref(deg2) (erg s−1 cm−2)
Swift-BAT 15–300 keV 4600 1.2 × 10⁻⁸ – Coincident observation [1]Swift-XRTa 0.3–10 keV 0.15 6 × 10⁻¹² 10 1–2 h [1]Fermi-GBM 8 keV–40 MeV 30 000 4 × 10⁻⁸ – Coincident observation [2]Fermi-LATb 0.02–300 GeV 8000 1.4 × 10⁻⁷ 100 s 30 s post-GBM trigger [2]CTAc 0.03–100 TeV 6–8 6 × 10⁻⁹ at 25 GeV 1000 s 20–60 s [3]CTA (Survey mode)d 0.03–100 TeV ∼1000 6 × 10⁻⁸ at 25 GeV 1000 s 20–60 s [3]H.E.S.S.c 0.05–20 TeV 15 ∼6 × 10⁻⁸ at 25 GeV 1000 s 30 s [3]SVOM-ECLAIRS 4–250 keV 89 7.2 × 10⁻¹⁰ 1000 s ∼1–2 h [4]SVOM-MXT 0.2–10 keV 64 arcmin 5.6 × 10⁻¹¹ 10 s ∼1–2 h [4]
Notes. Ref: [1] Gehrels et al. (2004); [2] Meegan et al. (2009); [3] Bartos et al. (2014); [4] Gotz et al. (2014).aSensitivity approximated using Zhang (2013) equation (3) Fx, th = 6 × 10⁻¹²/Tobs erg s−1 cm−2 and assuming Tobs = 10 s.bSensitivity over 100 s estimated using fig. 2. of Atwood et al. (2009) and converted to erg s−1 cm−2 using a standard band function with α = −1, β = −2.25,and EP = 511 keV.cApproximated using Funk et al. (2013).dSensitivity in survey mode based on [3] in which exposure time includes an estimate of the required slewing times to tile a 1000 deg2 area using convergentpointing mode.
4 E M T E L E S C O P E S FO R P RO M P T G WF O L L OW-U P O B S E RVAT I O N S
In this section we will discuss some of the EM instruments in differ-ent EM wavelength bands that will be able to facilitate prompt GWfollow-up – we consider a selection from those that currently haveMoUs for aLIGO/AdV follow-ups in place. We focus first on thehigh energy which is traditionally low latency (usually employingtriggering instruments) but will not be fast enough unless there is anagreement for prompt Target of Opportunity (ToO) in place; we notethat high-energy observations of GRBs over the last two decadeshave produced significant science returns in this domain. We thendiscuss optical telescopes which are proven for low latency throughthe successful use of fast response instruments for GRB follow-up.Finally, we consider radio which though electronic steering and/orrapid slew-times can make rapid response follow-ups achievable.
4.1 X-ray and γ -ray follow-ups
Table 3 shows the various properties of some of the high-energyinstruments with LIGO/AdV MoUs in place.
Space-based γ -ray follow-ups will be led by Fermi and Swift.These instruments provide the capability for the discovery of si-multaneous EM counterparts; in this respect the large FoV of theFermi-Gamma-Ray Burst Monitor (GBM), which sees almost theentire unocculted sky can be advantageous. A typical follow-upprocedure will be to search through the data for a coincident signalfrom a location of the sky consistent with the LIGO error region.Assuming coincident [GW/Fermi on-board] triggers, the responsetime will be around a few minutes. If there are no on-board triggers,a sensitive search through the Fermi data set will require of order4–12 h. The Fermi-Large Area Telescope (LAT) can provide moreinformation of the high-energy afterglow. Typically the LAT au-tonomously re-points after a GBM trigger with a processing delayof around 30 s. If no on-board trigger is available, a ground-basedsearch of the data can be initiated; the latency will depend on thetime between the GW candidate and the data downlink5 and pro-cessing, of order one to a few hours.
5 The communication going from the satellite to the ground.
The Swift γ -ray instrument is a wide-field (1.4 sr) coded maskhard X-ray imager [Burst Alert Telescope (BAT)]. Although theSwift-BAT is more sensitive than the Fermi-GBM, it observes softerγ -rays; this last point is important for Fermi-GBM, follow-ups asSGRBs associated with BNS mergers have harder spectra than longduration gamma-ray bursts (LGRBs).
In terms of identifying transients, follow-ups in the X-ray havethe advantage of a less crowded sky than that of the optical. For X-ray follow-ups the Swift-X-Ray Telescope (XRT) rapid slew time isparticular advantageous; this has resulted in this instrument accumu-lating around 200 GRB redshifts though coordinated observationswith ground-based telescopes. The Swift-XRT is able to respondrapidly to a BAT detection of new transient, localizing to within1–3 arcmin and then distributing the position via the Gamma-rayCoordinates Network (GCN) within a 20-s window.
Swift demonstrated the feasibility of rapid high energy ToOfollow-ups by conducting the first multiwavelength follow-up ob-servation during the 2009–2010 LIGO/Virgo science run (Evanset al. 2012). Swift followed-up and observed the sky locations fortwo candidate GW events within 12 h, using a specially designedstrategy to target the most probable positions that the GW eventoriginated from. To improve ToO requests with large positional un-certainties, Swift implemented tiled XRT observations in late 2011.However for this instrument, at the present time, a response timeto ToO of order 1–2 h (Kanner et al. 2012) by the on-board XRTeffectively rules this instrument out in terms of low-latency follow-ups. If however, in the future, aLIGO could send triggered alertsdirectly to Swift without human intervention, a slew of order 10 s ofseconds would result in early follow-up observations of the X-raylight curve.
In addition to the Swift-XRT, Astrosat,6 an Indian multiwave-length satellite was successfully launched in 2015 September. As-trosat has instruments covering the UV (UVIT), optical, soft andhard X-ray [the Cadmium Zinc Telluride Imager (CZTI)]. Forfollow-up operations, once a counterpart is identified, re-pointingwill bring the target within the FoV of the other instruments forsimultaneous coverage from optical though to hard X-ray. For low-latency follow-ups, CZTI, the hard X-ray coded aperture mask in-strument with a 36 deg2 FoV will be the most useful instrument. As
6 http://astrosat.iucaa.in/
MNRAS 459, 121–139 (2016)
at Curtin U
niversity Library on A
ugust 24, 2016http://m
nras.oxfordjournals.org/D
ownloaded from

EM follow-up prospects from low-latency GW 129
contact with the spacecraft is designed to take place once in an or-bital period of 100 min, this is typically is the fastest time-scale overwhich a slew can be commanded; ToO decision making may alsobe added to this response time. However, one low-latency scenarioexists, in that if there was significant hard X-ray/γ -ray flux in the(100–1000) keV band, the CZTI would detect the flash without re-pointing. Over this energy range the CZTI acts like an open detectorwith a 2π FoV; we note however that there will be no localizationcapability at these energies.
Ground-based gamma-ray detectors can also contribute to theGW follow-up effort through the Cherenkov Telescope Array (CTA;Dubus et al. 2013). The CTA is a next generation ground-basedinstrument that will begin construction around 2016, with full op-eration expected by 2020. CTA will improve over previous ex-periments(H.E.S.S, VERITAS7 and MAGIC8) through increasedsensitivity, angular resolution (∼2 arcmin at TeV), wider energycoverage (∼30 GeV–300 TeV) and a larger field of view (6◦–8◦).This project will consist of two arrays: a southern hemispheric arrayfocusing on Galactic sources and a northern hemispheric array onextragalactic. Bartos et al. (2014) has recently highlighted some ofthe properties that make this instrument ideal for GW follow-up.These include the capability to observe in a pointed mode with arelatively small FoV and in survey mode covering a larger area largesky area (∼1000 deg2); fast repositioning is of the order of a fewseconds (Doro et al. 2013). For low-latency follow-ups the ability torespond to ToO requests and start monitoring the GW error ellipsewithin 30 s is significant (Dubus et al. 2013).
CTA is designed to have three types of telescopes with differ-ent mirror sizes to cover the full energy range – large-scale tele-scopes (24-m) covering <300 GeV, medium scale (10–12 m) cov-ering 100 GeV–TeV and small-scale (4–6 m) covering higher en-ergies >10 TeV. Typically, extragalactic background light (EBL),which is all the accumulated radiation in the Universe due to starformation processes, will attenuate very high energy photons com-ing from cosmological distances through pair production with EBLphotons. This produces the effect in that only the large-scale tele-scopes will be triggered. However, for the case of a GW sourcewithin 200 Mpc, TeV photons are not expected to be annihilated(Bartos et al. 2014); thus all three types of CTA telescopes CTAcould be triggered (O’Brien & Hinton, personal communication)providing a greater energy coverage.
H.E.S.S.,9 an array of five Cherenkov telescopes (with 4 × 12 mand one 28-m diameter mirrors) located in Namibia, has been op-erational since 2004. This telescope has a mean time to get onsource from a random observation position of about 30 s (Lennarzet al. 2013). The capability of H.E.S.S. for GW follow-ups has beenproven through prompt observations of GRB triggers. A follow-upobservation of GRB 070621 was achieved within 7 min (Aharonianet al. 2009) and GRB 100621A was observed within 10 min.
4.2 Optical follow-ups
Optical follow-ups have been hugely successfully in the last decadeto discover the afterglows and host galaxies of GRBs. For Swiftfollow-ups, this strategy has relied on the prompt localizations of theXRT and the rapid distribution of coordinates via the GCN network.Recently, robotic optical telescopes have been able to identify the
7 http://veritas.sao.arizona.edu/8 http://magic.mppmu.mpg.de/9 http://www.mpi-hd.mpg.de/hfm/HESS/
optical afterglows of Fermi-GBM triggers that have large positionaluncertainties (e.g. GRB 130702A; Singer et al. 2013, 2015). Asuccessful low-latency EM follow up to a GRB could potentiallycapture an optical flash or the earliest stages of a particularly brightrising afterglow.
Table 4 lists the capabilities of a number of optical instrumentsthat will be available during the era of advanced GW detectors.Capturing an EM counterpart with such a fast response will be de-pendent on a number of factors related to the telescope. The FoV ofthe instrument will determine how quickly the GW localisation areacan be surveyed (i.e. the number of tiles required); any subsequentdetection will then be dependent on the limiting magnitude or sensi-tivity of the instrument and on the required exposure time to obtainthe required sensitivity (for an in depth discussion see Coward et al.2014).
For prompt follow-up, the slew time of the instruments will behighly important; for telescopes with lower sensitivities a rapid slewtime can compensate through the ability to achieve pointing duringthe brightest part of the event. However, we note here that for opticalinstruments, a fast slew time is usually associated with a small FoV.
Fast response optical telescopes such as TAROT have the abilityto slew to a target position within 10 s. However, the FoV ∼3.5 deg2
and exposure time of around 60 s mean that time must be allowedto image the full error region. Assuming a 60 deg2 error box, cor-responding to that of a LHVJIA network at 50 per cent confidence,using the framework presented in Coward et al. (2014), we findthe imaging time will be of order 17 min. Larger FoV telescopeswould be able to minimize the required imaging time. For example,Pan-STARRS, a system of four automated 1.8-m optical telescopesbased in Hawaii has a FoV of ∼7 deg2 and an exposure time of30 s yielding a 4 min response for the same error box. The ZwickyTransient Facility (ZTF)10 will be an extension of the Palomar Tran-sient Factory (PTF; 7 deg2 FoV) with an increased 47 deg2 FoV andan order of magnitude improvement in survey speed. GOTO,11 adedicated optical follow-up instrument with a proposed initial con-figuration of 18 deg2 instantaneous FoV will require an exposuretime of around 5 min to reach 21 mag (Steeghs & Galloway, per-sonal communication); however, for this instrument a shallowerinventory of the large error ellipses may be possible. Additionally,BlackGEM,12 expected on-line from 2016, aims to cover 40 deg2
in a seeing-limited configuration with an exposure time of 5 min(Ghosh & Nelemans 2015).
Considering the FoVs given in Table 4, it is immediately apparentthat for fast response observations, unless a wide FoV instrument ison-source, one may require a larger network than LHV to decreasethe localization error (Manzotti & Dietz 2012) and thus, reduce thenumber of tiles required to image the full GW error box.
In addition to the facilities outlined in Table 4, a number of otherfacilities are in development for GW follow-up and could be op-erational during the later era of aLIGO/AdV. One such facility isRAMSES which will consists of a set of 16 × 40 cm telescopes andwill be equipped with rapid cameras capable of readout times from100 ms to several minutes; it will be able to reach magnitudes of 15in 1 s and magnitudes 20 within around 10 min. Each telescope hasa 2.5 deg2 FoV, resulting in a combined 100 deg2 FoV; this in com-bination with a slew time of around 5 s would enable instantaneouscoverage of a large proportion of a typical aLIGO/AdV error region.
10 http://www.ptf.caltech.edu/ztf11 http://goto-observatory.org/12 https://astro.ru.nl/blackgem/
MNRAS 459, 121–139 (2016)
at Curtin U
niversity Library on A
ugust 24, 2016http://m
nras.oxfordjournals.org/D
ownloaded from
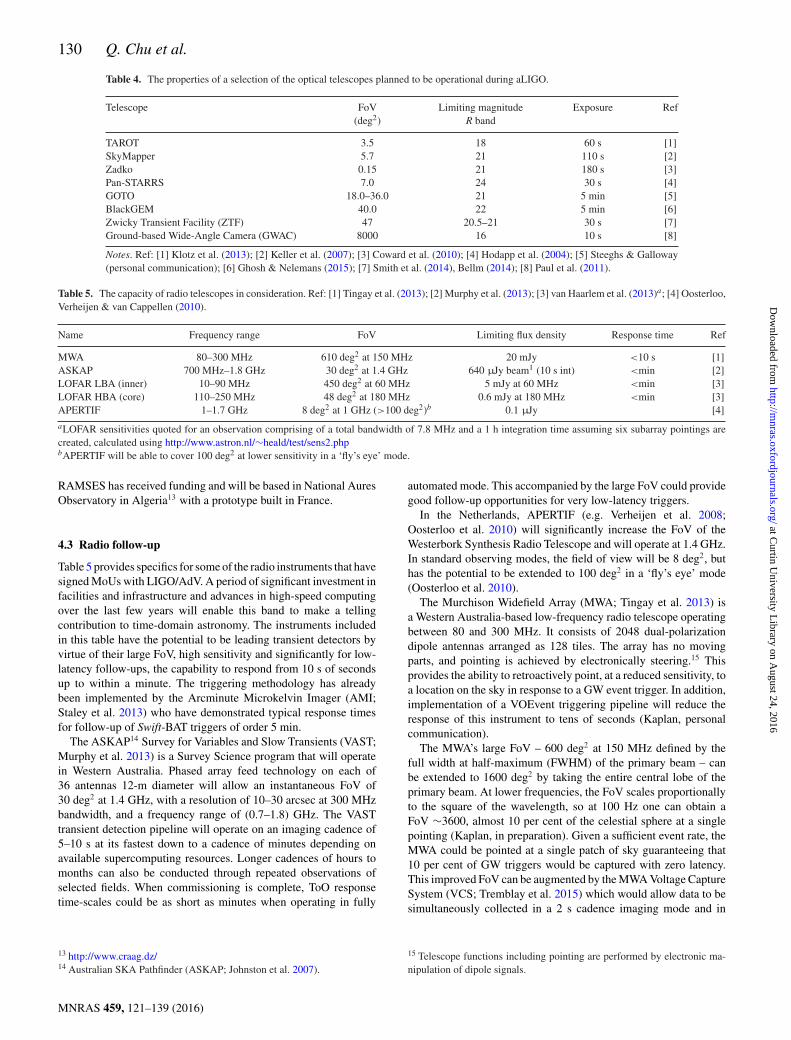
130 Q. Chu et al.
Table 4. The properties of a selection of the optical telescopes planned to be operational during aLIGO.
Telescope FoV Limiting magnitude Exposure Ref(deg2) R band
TAROT 3.5 18 60 s [1]SkyMapper 5.7 21 110 s [2]Zadko 0.15 21 180 s [3]Pan-STARRS 7.0 24 30 s [4]GOTO 18.0–36.0 21 5 min [5]BlackGEM 40.0 22 5 min [6]Zwicky Transient Facility (ZTF) 47 20.5–21 30 s [7]Ground-based Wide-Angle Camera (GWAC) 8000 16 10 s [8]
Notes. Ref: [1] Klotz et al. (2013); [2] Keller et al. (2007); [3] Coward et al. (2010); [4] Hodapp et al. (2004); [5] Steeghs & Galloway(personal communication); [6] Ghosh & Nelemans (2015); [7] Smith et al. (2014), Bellm (2014); [8] Paul et al. (2011).
Table 5. The capacity of radio telescopes in consideration. Ref: [1] Tingay et al. (2013); [2] Murphy et al. (2013); [3] van Haarlem et al. (2013)a; [4] Oosterloo,Verheijen & van Cappellen (2010).
Name Frequency range FoV Limiting flux density Response time Ref
MWA 80–300 MHz 610 deg2 at 150 MHz 20 mJy <10 s [1]ASKAP 700 MHz–1.8 GHz 30 deg2 at 1.4 GHz 640 µJy beam1 (10 s int) <min [2]LOFAR LBA (inner) 10–90 MHz 450 deg2 at 60 MHz 5 mJy at 60 MHz <min [3]LOFAR HBA (core) 110–250 MHz 48 deg2 at 180 MHz 0.6 mJy at 180 MHz <min [3]APERTIF 1–1.7 GHz 8 deg2 at 1 GHz (>100 deg2)b 0.1 µJy [4]
aLOFAR sensitivities quoted for an observation comprising of a total bandwidth of 7.8 MHz and a 1 h integration time assuming six subarray pointings arecreated, calculated using http://www.astron.nl/∼heald/test/sens2.phpbAPERTIF will be able to cover 100 deg2 at lower sensitivity in a ‘fly’s eye’ mode.
RAMSES has received funding and will be based in National AuresObservatory in Algeria13 with a prototype built in France.
4.3 Radio follow-up
Table 5 provides specifics for some of the radio instruments that havesigned MoUs with LIGO/AdV. A period of significant investment infacilities and infrastructure and advances in high-speed computingover the last few years will enable this band to make a tellingcontribution to time-domain astronomy. The instruments includedin this table have the potential to be leading transient detectors byvirtue of their large FoV, high sensitivity and significantly for low-latency follow-ups, the capability to respond from 10 s of secondsup to within a minute. The triggering methodology has alreadybeen implemented by the Arcminute Microkelvin Imager (AMI;Staley et al. 2013) who have demonstrated typical response timesfor follow-up of Swift-BAT triggers of order 5 min.
The ASKAP14 Survey for Variables and Slow Transients (VAST;Murphy et al. 2013) is a Survey Science program that will operatein Western Australia. Phased array feed technology on each of36 antennas 12-m diameter will allow an instantaneous FoV of30 deg2 at 1.4 GHz, with a resolution of 10–30 arcsec at 300 MHzbandwidth, and a frequency range of (0.7–1.8) GHz. The VASTtransient detection pipeline will operate on an imaging cadence of5–10 s at its fastest down to a cadence of minutes depending onavailable supercomputing resources. Longer cadences of hours tomonths can also be conducted through repeated observations ofselected fields. When commissioning is complete, ToO responsetime-scales could be as short as minutes when operating in fully
13 http://www.craag.dz/14 Australian SKA Pathfinder (ASKAP; Johnston et al. 2007).
automated mode. This accompanied by the large FoV could providegood follow-up opportunities for very low-latency triggers.
In the Netherlands, APERTIF (e.g. Verheijen et al. 2008;Oosterloo et al. 2010) will significantly increase the FoV of theWesterbork Synthesis Radio Telescope and will operate at 1.4 GHz.In standard observing modes, the field of view will be 8 deg2, buthas the potential to be extended to 100 deg2 in a ‘fly’s eye’ mode(Oosterloo et al. 2010).
The Murchison Widefield Array (MWA; Tingay et al. 2013) isa Western Australia-based low-frequency radio telescope operatingbetween 80 and 300 MHz. It consists of 2048 dual-polarizationdipole antennas arranged as 128 tiles. The array has no movingparts, and pointing is achieved by electronically steering.15 Thisprovides the ability to retroactively point, at a reduced sensitivity, toa location on the sky in response to a GW event trigger. In addition,implementation of a VOEvent triggering pipeline will reduce theresponse of this instrument to tens of seconds (Kaplan, personalcommunication).
The MWA’s large FoV – 600 deg2 at 150 MHz defined by thefull width at half-maximum (FWHM) of the primary beam – canbe extended to 1600 deg2 by taking the entire central lobe of theprimary beam. At lower frequencies, the FoV scales proportionallyto the square of the wavelength, so at 100 Hz one can obtain aFoV ∼3600, almost 10 per cent of the celestial sphere at a singlepointing (Kaplan, in preparation). Given a sufficient event rate, theMWA could be pointed at a single patch of sky guaranteeing that10 per cent of GW triggers would be captured with zero latency.This improved FoV can be augmented by the MWA Voltage CaptureSystem (VCS; Tremblay et al. 2015) which would allow data to besimultaneously collected in a 2 s cadence imaging mode and in
15 Telescope functions including pointing are performed by electronic ma-nipulation of dipole signals.
MNRAS 459, 121–139 (2016)
at Curtin U
niversity Library on A
ugust 24, 2016http://m
nras.oxfordjournals.org/D
ownloaded from

EM follow-up prospects from low-latency GW 131
continuous voltage data collection mode. The VCS can be used asa deep disc-based ring buffer with a 1 h duration. On receipt of aGW trigger, voltage data around the on-source window could besiphoned off for post-trigger analysis.
The Low Frequency Array (LOFAR; van Haarlem et al. 2013)is an interferometric array of dipole antenna stations distributedthroughout the Netherlands and several countries in Europe. LO-FAR uses two distinct antennas types: Low Band Antennae (LBA)operating between 10 and 90 MHz and High Band Antennae (HBA)operating between 110 and 250 MHz. The antennas are organized inaperture array stations, with initial beam forming conducted on thestation level. These stations have no moving parts and electronicbeam-forming techniques allow for rapid re-pointing of the tele-scope. Because of strategies required to manage the high data ratesfrom LOFAR, the FoV is constrained during the initial processingstages; it is highly dependent upon the station configurations chosenand the observing frequency. Larger FoVs can be attained by usingshorter baseline configurations but with a loss of sensitivity and res-olution. The maximum FoV (whole observable sky when operatingwith the LBA) will be monitored in a 24 × 7 commensal observingmode by (AARTFAAC)16 (the Amsterdam-ASTRON Radio Tran-sients Facility and Analysis Centre; Prasad et al. 2014). At the timeof writing, LOFAR still requires manual intervention for externaltriggers. However, the expectation is that VOEvent triggering willbe enabled in time for the first LIGO science runs, reduce the la-tency to less than a minute. In addition, LOFAR are also developingrapid response strategies based around transient buffer boards (vanHaarlem et al. 2013) which, similar to the VCS used by MWA, canstore small amount of the full observed data for later analysis.
In the longer term, the Square Kilometre Array17 (SKA) will beprovide large fields of view and increased sensitivity, with construc-tion scheduled to start in 2018. SKA phase 1 will compose of twoinstruments SKA-low, operating at 50–350 MHz, and SKA-mid,operating at 350 MHz–14 GHz.
5 A REVIEW OF EM EMISSIONSF RO M B N S M E R G E R S
A number of associated EM counterparts have been proposed forBNS mergers, many of which have already been presented in Fig. 2.We will begin this section by expanding on the multimessengerpathways and end products provided in Fig. 2 which could pro-duce observable EM counterparts for binary coalescences. We willdiscuss the various scientific breakthroughs that could be achievedin the advanced detector era through low-latency follow-ups anddiscuss the type of EM observational bands and facilities that couldbenefit the most from low-latency GW triggers.
Although the scope is wide, the relative brightness of the associ-ated EM signals is dependent on poorly understood merger physics,in particular that of the post-merger central remnant object. There-fore, the prospects of detecting many of these EM counterparts arequite speculative. To address some of this uncertainty, in the latterparts of this section we use the best available EM data to indicatethe possible flux of the possible EM counterparts. We do this in thecontext of EM telescopes already discussed in Section 4 which willbe available for follow-up observations during the aLIGO era.
16 AARTFAAC will have a FoV of 10 000 deg2 covering 25 per cent of thesky. See http://www.aartfaac.org/17 https://www.skatelescope.org/
Short GRBs have long been proposed to originate from mergers ofcompact object binaries (Paczynski 1986, 1991; Eichler et al. 1989;Narayan et al. 1992). Recent broad-band observations have shownmixed host galaxy types, non-detection of supernova associationsand offsets of GRB locations from their host galaxies (see Berger2014, for a review). These findings lend support to compact binarymergers as the progenitors for SGRBs.
Generally the merger of BNSs can produce a number of differentproducts; these can be divided into four categories.
(1) A black hole.(2) A hypermassive NS supported by differential rotation; this
is expected to collapse to a BH within 10–100 ms.(3) A stable NS that does not collapse.(4) A supramassive NS supported by rigid rotation; this is ex-
pected to collapse to a BH within 10–10000 s with a typical time-scale of hundreds of seconds.
If the merger product is of the first two categories: (1) a blackhole or (2) a temporal hypermassive neutron star, the EM signalscould include the SGRB and its afterglow emission (Eichler et al.1989; Barthelmy et al. 2005a; Gehrels et al. 2005; Berger 2011;Rosswog, Piran & Nakar 2013) and a long-lasting radio afterglowof the ejecta as it interacts with the ambient medium (Nakar & Piran2011; Metzger & Berger 2012; Piran, Nakar & Rosswog 2013).
During a NS–NS merger or NS–BH merger, a small fraction ofmaterials are tidally ripped and dynamically ejected. These ejectaare mostly composed of radioactive elements, which would heat theejecta via decay of r-process nuclei, powering an UV/optical/IRtransient (Li & Paczynski 1998; Kulkarni 2005; Metzger et al.2010; Barnes & Kasen 2013) that has been termed a kilonova.Recent optical and near-IR observations of a kilonova associatedwith GRB 130603B have provided support for this scenario andthus a compact object merger origin of SGRBs (Berger et al. 2013;Tanvir et al. 2013).
It is important to note that the SGRB and its afterglow are rel-ativistic and collimated (Burrows et al. 2006; De Pasquale et al.2010), so only detectable in preferred directions. Alternatively, thekilonova ejecta and its radio afterglow are essentially isotropic andalso non-relativistic (due to the heavy mass loading) and thereforecan be detected from any direction if the flux is high enough.
The latter two categories, (3) and (4) can both lead to a magnetaras the merger product; this could occur through a small enough to-tal NS mass in combination with a stiff equation of state of nuclearmatter. This could be a stable magnetar (for case 3) or a supra-massive millisecond magneter (case 4), which would very likely bestrongly magnetized and rapidly spinning (e.g. Dai & Lu 1998; Daiet al. 2006; Fan & Xu 2006; Gao & Fan 2006; Yu & Huang 2007;Giacomazzo & Perna 2013; Hotokezaka et al. 2013; Zhang 2013;Lasky et al. 2014; Ravi & Lasky 2014; Shibata et al. 2014).
Plateaus in the X-ray afterglow light curves of about 60 per centshort GRBs have been attributed to such millisecond magnetar cen-tral engines (Rowlinson et al. 2010a, 2013; Lu et al. 2015). Theplateau emission of these SGRBs is interpreted as internal dissi-pation of the magnetar wind due to the dipole spin-down of themagnetar (Zhang & Meszaros 2001; Troja et al. 2007; Metzgeret al. 2011). The magnetic spin-down of the NS remnant providesan additional source of sustained energy injection, which greatly en-riches the EM signals. A jet may be still launched via accretion froma disc to power the SGRB emission (Metzger, Quataert & Thomp-son 2008; Dessart et al. 2009; Lee, Ramirez-Ruiz & Lopez-Camara2009; Fernandez & Metzger 2013). In the SGRB afterglow phase,some observed features, including the extended prompt emission
MNRAS 459, 121–139 (2016)
at Curtin U
niversity Library on A
ugust 24, 2016http://m
nras.oxfordjournals.org/D
ownloaded from

132 Q. Chu et al.
(Norris & Bonnell 2006; Metzger et al. 2008), X-ray flares(Barthelmy et al. 2005b; Campana et al. 2006), and more impor-tantly, plateaus observed in the X-ray are consistent with beingpowered by a millisecond magnetar central engine.
Outside the solid angle extended by the SGRB jets, several po-tentially observable astrophysical processes have been predicted.First, self-dissipation of the magnetar wind could power a brightearly isotropic X-ray afterglow (Zhang 2013). Next, heating by themagnetar wind (expected to be more significant than the radioactivedecay) could significantly enhance the kilonova emission compo-nent (Yu, Zhang & Gao 2013; Metzger & Piro 2014). Finally, themagnetar wind could accelerate the ejecta to a mildly or even moder-ately relativistic speed, giving rise to a strong broad-band afterglowemission upon interaction with the ambient medium (Gao et al.2013).
Finally, a remarkable new class of extremely bright and short-duration (millisecond time-scale) transients called FRBs could be aproduct of BNS merger (Lorimer et al. 2013; Thornton et al. 2013).An FRB could be emitted through a BNS merger in two possibleways:
(1) during the BNS merger a coherent radio emission could beproduced through magnetic braking as the magnetic fields of theNSs are synchronized in binary rotation at the time of coalescence(Totani 2013);
(2) if a supramassive NS is the merger product, it would collapseinto a black hole after losing the centrifugal support and emit anFRB (Zhang 2014) due to the ejection of the magnetosphere as itimplodes into the black hole (Falcke & Rezzolla 2014).
The latter scenario is evidenced by an abrupt drop in the X-rayplateau emissions of some long and short GRBs. Within this latterscenario, an FRB along the jet direction is expected after a BNSmerger event that forms the supramassive NS.
In the remainder of this section, we will discuss each of the po-tential electromagnetic counterparts in more depth and compare theexpected emission to the capabilities of the instruments describedin Section 4. First, in Section 5.1, we outline the methods used toquantify the typical emission we might expect. Section 5.2 con-siders the on-axis emission expected from our understanding ofSGRBs and Section 5.3 discusses the isotropic kilonova counter-part. In Section 5.4 we describe the impact of changing the centralengine formed by the BNS merger from a black hole to a magnetaron the standard emission as discussed in Sections 5.2 and 5.3. Fi-nally, in Section 5.5, we consider the possibility of early-time FRBs
associated with a BNS merger and how low-latency triggers andexisting instrumentation can constrain these predictions.
6 A SSESSING PROMPT EM FOLLOW-UPSF RO M L OW L AT E N C Y G W T R I G G E R S
6.1 Extrapolation of fluxes for observed EM counterparts
In this section we explore the benefits of low-latency GW follow-up observations by extrapolating observed emissions from knownsources associated with BNS mergers to the observational range ofground-based GW detectors. SGRBs are the most likely observedpopulation to be associated with BNS. Therefore, we can estimatethe typical fluxes that could be expected at different energies byextrapolating from known SGRBs associated with BNS at a distanceof 200 Mpc. The results are shown in Table 6 however, due to thenature of the SGRB observations, these numbers focus on the on-axis emissions. These values are representative of the expected on-axis signals but we do not give the full range of expected fluxes; thisrequires detailed modelling, beyond the scope of this paper. Wherepossible, we utilize GRB 130603B as it is the only unambiguouslySGRB associated with a BNS merger with a spectroscopic redshiftfrom the optical afterglow (Barthelmy et al. 2013; de Ugarte Postigoet al. 2014; Fong et al. 2014). GRB 130603B does not exhibit the allof the emission combinations we consider and, in those cases, weuse other SGRBs with reasonable host galaxy redshift constraints.
The X-ray, γ -ray, and radio flux estimates are obtained by ex-trapolating to the required observation time from broken power lawfits to the light curves of the GRBs, which are converted into rest-frame luminosities using a k-correction and the observed spectralslope (Bloom, Frail & Sari 2001). The observed flux at a distanceof 200 Mpc is calculated by converting the rest-frame luminositiesusing an inverted k-correction for the new distance. The standardγ -ray emission is extrapolated from GRB 130603B (Barthelmyet al. 2013), while the long lasting VHE γ -ray emission is extrapo-lated from Fermi-LAT observations of GRB 090510 (De Pasqualeet al. 2010). In Sections 5.2.2 and 5.4, we consider three differentX-ray counterparts and use three SGRBs with reasonable redshiftconstraints to quantify the typical fluxes given in Table 6, namelyGRB 050509B for a SGRB without energy injection in the X-ray af-terglow (Gehrels et al. 2005; Tunnicliffe et al. 2014), GRB 130603Bfor a long lived afterglow showing a clear signature of energy in-jection associated with a stable magnetar central engine (Fan, Wu& Wei 2013; de Ugarte Postigo et al. 2014; Fong et al. 2014),and GRB 080905A for an X-ray light curve with the signature of
Table 6. The typical expected emission from an on-axis compact binary merger at a distance of 200 Mpc for given observing latencies (– = no emissionexpected, ? = possible emission, refer to text for more details). We provide different predictions for the X-ray emission representing the range of different lightcurves observed from SGRBs (interpreted as different energy injection signatures; Rowlinson et al. 2013) and separate the SGRBs with bright and faint opticalcounterparts.
Wavelength EM follow-up time0 s 2 min 10 min 1 h 9 h
VHE γ -ray (>100 MeV, photon cm−2 s−1) 1.1 × 101 1.2 × 10⁻² <1.7 × 10⁻³ – –γ -ray (15–150 keV, photon cm−2 s−1) 3.2 × 10² ? ? – –X-ray – no energy injection (0.3–10 keV, erg cm−2 s−1) – 7 × 10⁻¹² 4 × 10⁻¹² 2 × 10⁻¹² 9 × 10⁻¹³
X-ray – unstable magnetar (0.3–10 keV, erg cm−2 s−1) – 3 × 10⁻⁹ 6 × 10⁻¹¹ 5 × 10⁻¹³ 1 × 10⁻¹⁵
X-ray – stable magnetar (0.3–10 keV, erg cm−2 s−1) – 1 × 10⁻⁸ 6 × 10⁻⁹ 2 × 10⁻⁹ 8 × 10⁻¹¹
Optical – bright (R band, mag) ? 17.0 16.8 16.5 16.9Optical – faint (R band, mag) ? 17.9 19.0 20.2 21.8Radio (6.7 GHz, mJy) ? ? ? ? 11
MNRAS 459, 121–139 (2016)
at Curtin U
niversity Library on A
ugust 24, 2016http://m
nras.oxfordjournals.org/D
ownloaded from

EM follow-up prospects from low-latency GW 133
energy injection from a short-lived central engine, such as an un-stable magnetar central engine (Rowlinson et al. 2010a, 2013). Theradio fluxes given in Table 6 are extrapolated from GRB 130603B(Fong et al. 2014).
The optical magnitudes are determined at 200 Mpc using the stan-dard formalism.18 The optical afterglows are considered in Section5.2.2; we typically observe very faint and rapidly fading opticalafterglows to SGRBs and we represent these counterparts in Ta-ble 6 by extrapolating the optical counterpart to GRB 080905A(Rowlinson et al. 2010a). GRB 130603B had an unusually brightoptical counterpart and we use this GRB to represent the bright op-tical afterglow in Table 6. Additionally, in Section 5.3, we considerthe isotropic kilonova counterpart to GRB 130603B which wouldhave an observed magnitude of ∼21 in the J band, but undetectedin the R band to �23.7, at a distance of 200 Mpc.
In the following sections, by combining the results fromTables 3–6 we discuss some possible observational opportunitiesand implications provided through a low-latency window.
6.2 Short duration GRBs
6.2.1 Probing the progenitor models of short GRBs
Coincident EM/GW observations of SGRBs can prove withoutdoubt that BNS mergers are the progenitors behind these bursts.It is quite possible that one to two coincident events a year maybe accessible at full aLIGO/AdV sensitivity using GRB satel-lites (Metzger & Berger 2012; Siellez, Boer & Gendre 2014;Regimbau et al. 2015). Such a verification could be provided by awide FoV instrument such as Fermi. Low-latency follow-ups couldalso enable multiwavelength measurements of the prompt emissionallowing the underlying central engine and emission mechanism tobe probed (Elliott et al. 2014).
A particular obstacle faced by Swift-led observations of SGRBs isthat the observed γ -ray emissions typically have observed durationsshorter than 2 s. Therefore even a GW trigger with a latency as shortas 10 s would not be sufficient to allow optical telescopes to recoveremission during the prompt phase. However, a GW trigger sent outduring the inspiral phase would allow multiwavelength telescopesbe on target before the SGRB. Such a scenario could potentially pro-vide a breakthrough in our understanding SGRB prompt emissionphysics.
In fact a number of foreseeable opportunities to study SGRBphysics exist that could be plundered through low-latency follow-ups. Within the GRB theoretical framework, panchromatic emissionduring the prompt phase and early afterglow phase is predicted,including the emission from the prompt emission site through in-ternal shocks (e.g. Meszaros & Rees 1993). Indeed, for long dura-tion GRBs, panchromatic emission has been observed in a handfulof Swift GRBs (e.g. Page et al. 2007; Zheng et al. 2012) thanksto their long durations or the existence of a precursor that trig-gered the Swift BAT. In particular, prompt optical flashes have beenobserved in a handful of long GRBs: e.g. the Naked eye burstGRB 080319B (Racusin et al. 2008), GRB 990123 (Akerlof et al.1999), GRB 041219A (Vestrand et al. 2005), and GRB 130427B(Vestrand et al. 2014). However, so far no emission outside theγ -ray band has been detected during the prompt emission phase of
18 The standard formula is m − M = 5 log D − 5, with m the apparentmagnitude, M is the absolute magnitude, and D is the luminosity distancein parsecs.
SGRBs. Low-latency GW triggers 10s of seconds before mergercould make this possible for the first time. As noted in Section 4.2,such observations will become more feasible once the error regionis decreased through an expanded GW network in the latter partof the advanced GW detector era. For a particularly bright or closecounterpart, the wide FoV and fast response of an instrument suchas GWAC could prove to be highly valuable.
The high energy reach of Fermi has allowed access to photonswith energies in access of 10 GeV in both long and SGRBs. Thefact that Fermi-LAT discovered a photon of energy 31 GeV duringthe prompt phase of SGRB 090510 (Ackermann et al. 2010) isquite significant for low-latency follow-ups at VHE. In Table 6, weprovide the expected VHE (>100 GeV) γ -ray flux and γ -ray flux fora putative SGRB at 200 Mpc coincident with a GW source. A low-latency trigger GW trigger would alert VHE and γ -ray detectorsto search for prompt EM counterparts. In the γ -ray band the wideFoV of an instrument such as Fermi would be advantageous forsuch rapid follow-ups. At higher energies, instruments such as CTAcould provide follow-ups in wide-field mode (Bartos et al. 2014);such observations would be very rich in high-energy photons andcould provide valuable clues on the prompt emission mechanismsof SGRBs (Inoue et al. 2013; Bartos et al. 2014).
Additionally, we note that there are a small population of SGRBsthat exhibit extended γ -ray emission for hundreds of seconds fol-lowing the initial short burst (e.g. Norris & Bonnell 2006). This sub-population of SGRBs are also believed to originate from compactbinary mergers, and hence we might expect to observe this extendedemission in some of the triggers even if the bright short-hard emis-sion is missed by the γ -ray detectors due to the inadequate time forslew from the GW trigger. The possible response times providedfor CTA in Table 3 suggest that VHE follow ups of these emissionsare quite possible. Such observations could potentially unravel theexact nature of this extended activity (Inoue et al. 2013; Veres &Meszaros 2014).
6.2.2 Capturing the afterglow and late-time central engineactivity of SGRBs
By comparing the expected X-ray counterparts given in Table 6 tothe instruments described in Table 3, we show that existing X-rayinstruments such as Swift-XRT or Space-based multiband astro-nomical Variable Objects Monitor (SVOM)-Microchannel X-rayTelescope (MXT) could detect the early X-ray afterglow for theSGRBs even without energy injection. Unfortunately, if the X-rayobservations start with a latency longer than ∼10 min followingthe BNS merger, or they require a long time to tile out regions ofthe sky due to having a small FoV, we are likely to miss the X-raycounterparts for SGRBs without prolonged energy injection in theirlight curves (such as those described in Section 5.4).
We consider both bright and faint optical afterglows in Table 6and note all of the optical instruments would be capable of observ-ing the earliest onset (or the rise) of the optical afterglow assumingthe 17th mag extrapolation based on a burst like GRB 130603B.However, GRB 130603B was unusually bright at early times, witha likely optical plateau phase, so the optical emission may havebeen contaminated with energy injection from the central engine(de Ugarte Postigo et al. 2014). Hence, these values are opti-mistic limits. Most SGRBs typically have a fainter counterpart,such as GRB 080905A, so will require deeper optical observations.The short optical reach and short exposure times of Pan-STARRSand ZTF suggest these instruments could be valuable in such
MNRAS 459, 121–139 (2016)
at Curtin U
niversity Library on A
ugust 24, 2016http://m
nras.oxfordjournals.org/D
ownloaded from

134 Q. Chu et al.
endeavours. The larger FoV of ZTF would be more suited tosearching the error regions from earlier GW triggers and couldfacilitate a coordinated search strategy with an instrument such asPan-STARRS capable of deeper searches but more limited by FoV.
In the radio domain, there have been three detections of radioemission associated with SGRBs (GRB 050724, GRB 051221A,and GRB 130603B) as well as a forth case, GRB 120804A, due tohost galaxy emission. In Table 6, we provide fluxes based on theradio counterpart of GRB 130603B. All of these detections havebeen at late times (>7 h) in the high-frequency domain (>4.9 GHz)with fluxes around the mJy level. These fluxes could be observedby instruments such as ASKAP or APERTIF. The peak in the radioafterglow would be expected to occur on typical time-scales ofdays–years. At low radio frequencies, we may also expect to observethe afterglow on months–years time-scales using facilities such asMWA and LOFAR although this emission has not been observed todate for a SGRB.
During the early afterglow phase, a short-lived backward propa-gating reverse shock component can occur once the shocked matterencounters the interstellar medium. This may dominate the opticaland radio band under certain conditions, e.g. if the reverse shockregion is more magnetized than the forward shock region (Zhang,Kobayashi & Meszaros 2003).
On short time-scales, an early radio flash (<1 d) originating froma reverse shock may be expected. Reverse shocks have been ob-served for a number of long GRBs, peaking a few hours after theGRB (e.g. GRB 130427A; Anderson et al. 2014; Perley et al. 2014)and may already have been observed in some SGRB radio after-glows (e.g. a radio excess was potentially observed at early timesfor GRB 130603B; Gompertz et al. 2015). Early radio observations,within the first hours of the BNS merger, capturing the rise of thereverse shock at different radio frequencies would allow detailedmodelling of this mechanism and would be a valuable probe of thejet models, macrophysics within the jet and the surrounding envi-ronment of the GRB (as conducted for the long GRB 130427A bye.g. van der Horst et al. 2014). With its expected rapid triggeringcapabilities, ASKAP has the capability to detect an early reverseshock.
6.3 Kilonova
The peak frequency and brightness of a kilonova critically depend onthe amount of ejected materials, and more importantly, the opacityof the ejecta. Early calculations adopted a relatively small opacity(e.g. Li & Paczynski 1998; Metzger et al. 2010; Bauswein, Goriely& Janka 2013), and predicted an optical transient with a peak fluxabout 1000 times of nova luminosity (and hence, the term ‘kilonova’is coined) (Metzger et al. 2010). Barnes & Kasen (2013) pointed outthat the existence of heavy elements, especially lanthanides, greatlyincrease the opacity, so that the kilonova signature would peak at alater time and in a softer frequency, typically in IR (see also Tanaka& Hotokezaka 2013).
The properties of the kilonova depend on the properties of thepost-merger compact object. The calculations of Barnes & Kasen(2013) are relevant for the case of prompt formation of a black hole.If the merger product is a supramassive neutron star (sustained byrigid rotation for 100s of seconds or even longer, SMNS) or evena hypermassive neutron star (sustained by differential rotation for100s of milliseconds, HMNS), neutrinos from the NS would raisethe electron fraction and reduce the opacity, so that the kilonovasignature is bluer and earlier (Metzger et al. 2015).
As discussed earlier, an observational candidate for a kilonovawas claimed for SGRB 130603B (Berger et al. 2013; Tanvir et al.2013) with one Hubble Space Telescope (HST) excess data point inthe near-IR band 9 d after the SGRB. As shown in Section 5.1, thiskilonova is equivalent to a J-band magnitude of 21 at 200 Mpc andan R-band magnitude of �23.7. None of the optical telescopes givenin Table 4 has near-IR capabilities and is not expected to detect anR-band counterpart at this observation time. Detailed modelling willbe required to estimate the R-band fluxes and peak time-scales forthese instruments (see the work by Barnes & Kasen 2013; Tanaka &Hotokezaka 2013). Besides this one case, two other candidates havebeen reported. One is an excess around 13.6 d in the HST F814Wband following GRB 060614 (Yang et al. 2015); another is a signifi-cant optical rebrightening feature around 1 d following GRB 080503(Perley et al. 2009; Gao et al. 2015). More data are needed to revealthe diverse kilonova phenomenology. A low-latency trigger wouldfacilitate broad-band follow up observations to catch the kilonovasignals, especially the early ones due to the small opacity in theejecta. This will be a challenge due to the lack of sensitive instru-ments in the NIR band with FoVs large enough to survey the errorregions (Bartos, Huard & Marka 2016). As discussed in the nextsection, an associated X-ray emission could be possible; this wouldallow a wide field instrument such as ISS-Lobster to narrow downthe search area.
6.4 Magnetar formation
The X-ray plateaus attributed to a millisecond magnetar central en-gine are observed up to 100–10000 s after the bursts. The estimatesin Table 6 show that if a stable magnetar is produced, GW triggerswith a moderate latency could easily allow an X-ray instrumentsuch as Swift to detect the plateau emission. However, should anunstable magnetar be produced, a GW trigger with a 40 s latencywould be required enable an EM follow up within a few 100 s.Such observations of the plateau phase in combination with GWinformation could provide important clues of the NS equation ofstate (Lasky et al. 2014; Lu et al. 2015).
In addition to the X-ray plateaus, X-ray flares observed in thefirst few hundred seconds following short GRBs have also beeninterpreted as resulting from magnetic activity in a post-mergerdifferentially rotating supramassive NS (Dai et al. 2006). Promptfollow ups of the GW signals from NS mergers would providesignificant evidence for this formation channel of magnetars.
In the massive protomagnetar central engine model, the po-tentially wide-beamed magnetar wind is expected to produce abright broad-band afterglow (Gao et al. 2013; Zhang 2013). Thiscould result in an early afterglow in the optical (possibly asbright as 17th mag in R band) and X-ray bands (up to 10−8–10−7 erg s−1 cm−2) for a source at ∼300 Mpc (Zhang 2013).
The existence of a supramassive NS can also supply continuousheating to the ejecta which can, depending on the spin-down pa-rameters of the neutron star, greatly enhance the kilonova signal (Yuet al. 2013; Metzger & Piro 2014). The detectability also dependson the observational geometry. For an on-axis binary merger, thesignal may be fainter than the SGRB optical afterglow. However, foroff-axis mergers, this would be the main UV/optical/IR signal fromthe event. The radio emission is also expected to peak earlier andbrighter in this central engine model (e.g. Gao et al. 2013; Metzger& Bower 2014; Gompertz et al. 2015). These predicted optical andradio counterparts are potentially within the sensitivity and FoVcapabilities of many of the optical and radio telescopes describedin Tables 4 and 5.
MNRAS 459, 121–139 (2016)
at Curtin U
niversity Library on A
ugust 24, 2016http://m
nras.oxfordjournals.org/D
ownloaded from

EM follow-up prospects from low-latency GW 135
Additionally, recent suggestions that the observed prompt emis-sion does not necessarily signal the start of the X-ray emission couldhave important consequences for low-latency follow-ups. Rezzolla& Kumar (2015) and Ciolfi & Siegel (2015) have postulated thatthe X-ray emission could start before the observed short hard spikeemission of short GRBs. These models predict that X-ray emissionfrom a protomagnetar could occur 100–1000 s prior to the promptGRB.
It is clear that low-latency observations will play a major partin testing these models, but these will require more rapid trigger-ing pipelines than those achievable by facilities such as Swift andSVOM-MXT (see Table 3). The employment of a wide FoV X-ray instrument with rapid pointing capabilities such as ISS-Lobster(Camp et al. 2013) would be very timely for the advanced GWdetector era.
6.5 Fast radio bursts
The possibility of associations with FRBs and SGRBs and/or BNSmergers is still highly speculative.19 Thornton et al. (2013) havesuggested that the event rate of FRBs (∼103 gal−1 yr−1) is inconsis-tent with GRBs and compact star mergers, but could be in agreementwith soft gamma-ray repeaters or core-collapse supernovae. Totani(2013) argued that including the effects of cosmological time dila-tion and merger rate evolution would make the FRB event rate inagreement with the optimistic double NS merger event rate (Abadieet al. 2010). One caveat is that these models suggest an essentiallyisotropic emission of FRBs. However, due to the existence of ther-process ejecta launched before the coalescence, the FRB signalmay not be able to escape the merger environment in most of thesolid angles. Zhang (2014) acknowledged this and propose that theGRB- or merger-associated FRBs only account for a small fractionof the entire FRB population, and only those mergers whose jetdirection coincides the observer’s viewing direction (i.e. the shortGRB direction) would be associated with FRBs. The majority ofFRBs are attributed to those SMNSs whose delay time-scale tocollapse into a black hole is much longer, and therefore not asso-ciated with GRBs or supernovae (Falcke & Rezzolla 2014). Thisis certainly an area where investments in GW low-latency triggerand prompt radio follow-up observations could provide significantscientific insight.
As discussed earlier, a particular obstacle for short duration eventsof order a few seconds is that even a latency as short as 10 s wouldnot be sufficient to alert a γ -ray instrument in time to recoverthe prompt emission. This however can be circumvented in theradio band, by electronically steered radio arrays such as LOFAR,MWA, and, in the future, SKA-low. An instrument such as MWAcould cover the entire GW error region in less than a minute ofreceiving a trigger. Although LOFAR typically has a smaller fieldof view than MWA (this is dependent upon observing configurationand frequency), it is also capable of tiling out large regions ofthe GW error box using multiple simultaneous pointing directionsand can conduct commensal beam-formed observations to probehigher time resolutions. In addition, as MWA and LOFAR operateat low frequencies the signal will be delayed by propagation throughthe ionized intergalactic/interstellar media. Assuming a dispersionmeasure of 1000 pc cm3, the delay could be of order 3 min at
19 However, some models for coherent radio emission have been proposedthe late stages of a compact binary inspiral phase or during their coalescence(e.g. Usov & Katz 2000).
150 MHz – sufficient time to point the telescope at the error region.With the voltage capture system on MWA and the transient bufferboards on LOFAR, in combination with the low-latency triggersand signal delay time, it will be possible for data to be obtained thatcan constrain emission from seconds to minutes prior to the merger.SKA-low is expected to have many of the capabilities of LOFAR andMWA but with a much higher sensitivity, making it the ideal futureinstrument for these triggers. For higher frequency instruments suchas ASKAP and APERTIF, the delay would be significantly shorter –of order 8 s at 700 MHz – requiring much more rapid response times.Once on target, these radio telescopes would ideally continuouslymonitor the entire field for several hours as the different predictedFRB mechanisms cover a range of time-scales, both a few secondsprior to the merger and hours following it, and these observationswould also be able to constrain the occurrence of other types ofcoherent radio emission.
7 D I S C U S S I O N A N D C O N C L U S I O N S
The first GW observation has provided a pathway to the highest en-ergy density events in the Universe and transform our understandingof the behaviour of matter and space–time under the most extremeconditions. Coalescing systems of NSs are widely expected to bethe progenitors of short GRBs. Early multiwavelength follow-upobservations of these sources would allow one to probe and unravelthe mechanisms behind these events beyond the GW regime; thepotential for breakthrough science is without doubt.
In this study we have simulated the expected localization errorregions corresponding to different times before the merger of acoalescing system of NSs. To examine the most probable low-latency EM observations we have considered the benefit provided by(a) larger networks of GW detectors, corresponding with improvedlocalization; (b) improved GW triggering latencies for sending outGW triggers.
The tables shown in Figs 5 and 6 illustrate some of the multi-messenger observations that could be achieved through low-latencyGW triggers assuming a detection 40 s before merger. We note herethat these tables may well be riddled with caveats due to the differ-ent operating scenarios and evolution of the different wavelengthinstruments. Furthermore, it would require very detailed modellingto predict exact fluxes of the different EM emission mechanisms;well beyond the scope of this work. The goal of this study is tohighlight the type of breakthrough science that could be realizedthrough the low-latency domain and, using a wide selection of EMinstruments with agreements in place with aLIGO/AdV for follow-up observations, determine the most likely avenues for success.
Fig. 5 presents a conservative scenario; that of a LHV net-work corresponding with a 1000 deg2 error region (assuming the50 per cent case provided in Table 2) and a 40 s GW triggeringlatency to send out the alert. At low-frequency radio and both high-and low-energy γ -ray, the large FoV and fast response potentialshow that post-prompt (>5 s) breakthrough observations could berealized.
In the optical, even for Pan-STARRS and ZTF, both large FoVinstrument with fast responses, to cover the 1000 deg2 error regionwith an exposure times of 30 s would require >(4000; 600) s, re-spectively. For longer latency follow-ups, optical instruments avail-able in the latter stages of the aLIGO/AdV era include BlackGEMwhich has a 40 deg2 FoV and a depth of 22 mag and a possible futureconfiguration of GOTO, which could employ a 40–50 deg2 instan-taneous FoV and sensitivity to 20–21.5 mag (Steeghs & Galloway,personal communication).
MNRAS 459, 121–139 (2016)
at Curtin U
niversity Library on A
ugust 24, 2016http://m
nras.oxfordjournals.org/D
ownloaded from

136 Q. Chu et al.
Figure 5. Some of the multimessenger observations that could be achieved through low-latency GW triggers. All scenarios assume a detection 40 s beforemerger by an LHV network – corresponding with a 1000 deg2 error region – and a 40 s GW triggering latency to send out the GW trigger. The signals aregrouped by into jetted, isotropic, or unknown; the approximate emission time ranges around merger are also given. As shown by the legend, the ticks indicate theEM observations with observational support; the question marks indicate those that have been proposed through theoretical models. All possible observationsin the table are given a colour code; good news is given by dark shaded cells that indicate there are EM instruments available in the band with sufficiently fastresponses, exposure times and FoVs to cover or tile the GW error box within the emission time range; at the other extreme, light shaded cells indicate that EMfollow-up observations will be quite challenging. Between these two extremes there is scope for improvement; for example ToOs could potentially be speededup or wider FoV instruments could come on line.
Figure 6. As for Fig. 5 but assuming an expanded LHVJIA network – corresponding with an 182 deg2 error region, and a 1 s GW triggering latency to sendout the GW trigger. This figure shows what could be achieved by EM instruments given a ∼40 s head start to get on-source.
To catch the early prompt stage, assuming a 40 s GW trig-gering latency, even instruments with a large FoV will be chal-lenged; this scenario certainly provides motivation for speedingup the trigger pipelines of both the GW observatories as well asthe high-energy satellites. We note that for the low-frequency ra-dio, one bonus in regards to EM follow-ups is that the disper-
sion of coherent radio signals can introduce a significant delayof up to minutes (as discussed in Section 6.5); as the existenceof early time counterparts to coalescing BNSs in the radio bandare still highly speculative, we have taken a conservative approachand neglected this effect, assuming only the physical time in ourestimates.
MNRAS 459, 121–139 (2016)
at Curtin U
niversity Library on A
ugust 24, 2016http://m
nras.oxfordjournals.org/D
ownloaded from

EM follow-up prospects from low-latency GW 137
A more optimistic scenario is presented in Fig. 6 which showshow breakthrough science can be achieved with an almost instan-taneous 1 s GW triggering latency and a fully expanded advanceddetector network, LHVJIA. For the 182 deg2 error region the post-prompt (>5 s) situation is much more optimistic in the optical andhigh-frequency radio bands due to the FoVs of radio instrumentswith responses <min and wide FoV telescopes such as ZTF thatcould survey this error region in around 2 min. In the X-ray, smallFoV instruments such as Swift are hindered by the large GW errorregion. Although considerable efforts have been undertaken to rem-edy this situation through the use a requirement for reconstructedsky locations to overlap with nearby galaxies (Evans et al. 2012), thiscoupled with the slow response of high-energy satellites presents asignificant bottleneck in a band for which many of the post-mergerEM emissions are known to exist. It emphasizes the importance tohave a wide FoV X-ray instrument capable of rapid pointing; onepotential instrument that could remedy the situation is the NASAproposed 30 deg2 FoV soft X-ray instrument ISS-Lobster (Campet al. 2013).
For prompt (<5 s) observations the wide FoV of Fermi means thisinstrument could provide a coincident observation with a GW trig-ger – this scenario is considered in the low gamma-ray (<10 MeV)region of Figs 5 and 6. However, we note the slow response of othersatellites operating at the low γ will hinder prompt follow-ups. Ifsuch a low GW triggering latency could be achieved and instru-ments such as Swift/Fermi could employ fast triggering pipelines,and a wide FoV X-ray instrument could be employed, low-latencyEM follow-ups with a full GW global network would enjoy almostcomplete coverage for the models we have considered.
We note that the scenarios we have outlined in Figs 5 and 6 assumethe GW error regions 40 s before merger; this choice was to providethe EM facilities with the maximum time for response. However, asshown in Table 2, closer to the merger both the error regions contractand the percentage of detections sources increases. For sourcesdetected early in the inspiraling stage, subsequent alerts would mostlikely be sent out as the error box decreases in size; this suggests thata coordinated observational and alerting strategy involving both theGW network and both wide and narrower FoV instruments wouldbe optimal procedure for maximizing GW detections.
Our results support the argument that much breakthrough sciencecan be achieved through a fast response. This has been evidenced inthe post-Swift era with prompt follow-up of GRB triggers producingsuch unexpected phenomena as flares, plateaus, optical flashes, andreverse shocks. History therefore suggests that the lasting legacyfrom the era of prompt multiwavelength GW follow-ups will un-doubtedly be provided by the unexpected surprises we encounter.
AC K N OW L E D G E M E N T S
Much of the analysis and discussion in this paper would not havebeen possible without the valuable input from members of the var-ious EM facilities. In particularly we would like to thank DavidKaplan, Shami Chatterjee, and Lisa Harvey-Smith (ASKAP), Di-pankar Bhattacharya (Astrosat/CZTI), Imre Bartos (Columbia U),Paul O‘Brien, Jim Hinton, and Gavin Rowell (CTA), Peter Jonker(LOFAR), Julie McEnery and Valerie Connaughton (Fermi), Weim-ing Yuan, Chao Wu, and Jianyan Wei (NAOC), Fang Yuan (SkyMap-per), Duncan Galloway and Danny Steeghs (GOTO), and DavidCoward (Zadko). We are particularly grateful to Julie McEnery(NASA/GSFC) who contributed some valuable suggestions for Sec-tion 4.1 and to Paul Laskey (Monash University) who provided someuseful comments to improve the paper. We acknowledge support
from WA’s Pawsey Supercomputing Center. EJH acknowledges sup-port from a UWA Research Fellowship. LW is supported by the Aus-tralian Research Council. BZ acknowledges NASA NNX14AF85Gand NNX15AK85G for partial support. The authors gratefully thankLeo Singer, the assigned reviewer for the LIGO Scientific Collab-oration, for conducting a thorough review of the manuscript whichincluded a number of insightful suggestions. Finally, the authorsthank the anonymous referee whose valued comments have vastlyimproved the structure of the paper.
R E F E R E N C E S
Aasi J. et al., 2013, Prospects for Localization of Gravitational Wave Tran-sients by the Advanced LIGO and Advanced Virgo Observatories
Aasi J. et al., 2015, Classical Quantum Gravity, 32, 074001Abadie J. et al., 2010, Classical Quantum Gravity, 27, 173001Abadie J. et al., 2012, A&A, 539, A124Abadie J. et al., 2012, A&A, 541, A155Abbott B. P. et al., 2016a, Phys. Rev. Lett., 116, 061102Abbott B. P. et al., 2016b, ApJ, 818, L22Acernese F. et al., 2015, Classical Quantum Gravity, 32, 024001Ackermann M. et al., 2010, ApJ, 716, 1178Aharonian F. et al., 2009, A&A, 495, 505Akerlof C. et al., 1999, Nature, 398, 400Anderson G. E. et al., 2014, MNRAS, 440, 2059Aso Y. et al., 2013, Phys. Rev. D, 88, 043007Atwood W. B. et al., 2009, ApJ, 697, 1071Barnes J., Kasen D., 2013, ApJ, 775, 18Barthelmy S. D. et al., 2005a, Nature, 438, 994Barthelmy S. D. et al., 2005b, ApJ, 635, L133Barthelmy S. D. et al., 2013, GRB Coordinates Network, 14741, 1Bartos I. et al., 2014, MNRAS, 443, 738Bartos I., Huard T. L., Marka S., 2016, ApJ, 816, 61Bauswein A., Goriely S., Janka H.-T., 2013, ApJ, 773, 78Bellm E., 2014, in Wozniak P. R., Graham M. J., Mahabal A. A., Seaman
R., eds, The Third Hot-wiring the Transient Universe Workshop: TheZwicky Transient Facility, p. 27, preprint (arXiv:1410.8185)
Berger E., 2011, New. Astron. Rev., 55, 1Berger E., 2014, ARA&A, 52, 43Berger E. et al., 2005, Nature, 438, 988Berger E., Fong W., Chornock R., 2013, ApJ, 774, L23Bloom J. S., Frail D. A., Sari R., 2001, AJ, 121, 2879Bloom J. S. et al., 2006, ApJ, 638, 354Burrows D. N. et al., 2006, ApJ, 653, 468Buskulic D., Virgo Collaboration, LIGO Scientific Collaboration, 2010,
Classical Quantum Gravity, 27, 194013Camp J. et al., 2013, Exp. Astron., 36, 505Campana S. et al., 2006, Nature, 442, 1008Cannon K. et al., 2012, ApJ, 748, 136Centrella J., Nissanke S., Williams R., 2012, in Griffin E., Hanisch R.,
Seaman R., eds, Proc. IAU Symp. 285, New Horizons in Time-DomainAstronomy. Cambridge Univ. Press, Cambridge, p. 191
Chu Q., Wen L., Blair D., 2012, J. Phys.: Conf. Ser., 363, 012023Chung S. K., Wen L., Blair D., Cannon K., Datta A., 2010, Classical Quan-
tum Gravity, 27, 135009Ciolfi R., Siegel D. M., 2015, ApJ, 798, L36Coward D. M. et al., 2010, Publ. Astron. Soc. Aust., 27, 331Coward D. M. et al., 2012, MNRAS, 425, 2668Coward D. M., Branchesi M., Howell E. J., Lasky P. D., Boer M., 2014,
MNRAS, 445, 3575Cowperthwaite P. S., Berger E., 2015, ApJ, 814, 25Cramer H., 1946, Mathematical Methods of Statistics. Princeton Univ. Press,
Princeton, NJDai Z. G., Lu T., 1998, A&A, 333, L87Dai Z. G., Wang X. Y., Wu X. F., Zhang B., 2006, Science, 311, 1127De Pasquale M. et al., 2010, ApJ, 709, L146
MNRAS 459, 121–139 (2016)
at Curtin U
niversity Library on A
ugust 24, 2016http://m
nras.oxfordjournals.org/D
ownloaded from

138 Q. Chu et al.
Dessart L., Ott C. D., Burrows A., Rosswog S., Livne E., 2009, ApJ, 690,1681
de Ugarte Postigo A. et al., 2014, A&A, 563, A62Doro M. et al., 2013, Astropart. Phys., 43, 189Dubus G. et al., 2013, Astropart. Phys., 43, 317Eichler D., Livio M., Piran T., Schramm D. N., 1989, Nature, 340, 126Elliott J. et al., 2014, A&A, 562, A100Evans P. A. et al., 2012, ApJS, 203, 28Fairhurst S., 2009, New J. Phys., 11, 123006Fairhurst S., 2011, Classical Quantum Gravity, 28, 105021Falcke H., Rezzolla L., 2014, A&A, 562, A137Fan Y.-Z., Xu D., 2006, MNRAS, 372, L19Fan Y.-Z., Wu X.-F., Wei D.-M., 2013, Phys. Rev. D, 88, 067304Fan X., Messenger C., Heng I. S., 2014, A Bayesian approach to multi-
messenger astronomy: Identification of gravitational-wave host galaxiesFernandez R., Metzger B. D., 2013, MNRAS, 435, 502Finn L. S., 1992, Phys. Rev. D, 46, 5236Fong W. et al., 2014, ApJ, 780, 118Funk S., Hinton J. A., CTA Consortium, 2013, Astropart. Phys.,
43, 348Gao W.-H., Fan Y.-Z., 2006, Chin. J. Astron. Astrophys., 6, 513Gao H., Ding X., Wu X.-F., Zhang B., Dai Z.-G., 2013, ApJ, 771, 86Gao H., Ding X., Wu X.-F., Dai Z.-G., Zhang B., 2015, ApJ, 807, 163Gehrels N. et al., 2004, ApJ, 611, 1005Gehrels N. et al., 2005, Nature, 437, 851Ghosh S., Nelemans G., 2015, in Sopuerta C. F., ed., Astrophys. Space Sci.
Proc. Vol. 40, Gravitational Wave Astrophysics. Springer InternationalPublishing, Switzerland, p. 51
Giacomazzo B., Perna R., 2013, ApJ, 771, L26Gompertz B. P., van der Horst A. J., O’Brien P. T., Wynn G. A., Wiersema
K., 2015, MNRAS, 448, 629Gotz D. et al., 2014, Proc. SPIE, 9144, 914423Hodapp K. W., Siegmund W. A., Kaiser N., Chambers K. C., Laux U.,
Morgan J., Mannery E., 2004, Proc. SPIE, 5489, 667Hooper S., Chung S. K., Luan J., Blair D., Chen Y., Wen L., 2012, Phys.
Rev. D, 86, 024012Hotokezaka K., Kiuchi K., Kyutoku K., Muranushi T., Sekiguchi Y.-i.,
Shibata M., Taniguchi K., 2013, Phys. Rev. D, 88, 044026Howell E. J. et al., 2015, Publ. Astron. Soc. Aust., 32, e046Inoue S. et al., 2013, Astropart. Phys., 43, 252Jaranowski P., Krolak A., Schutz B. F., 1998, Phys. Rev. D, 58, 063001Johnston S. et al., 2007, Publ. Astron. Soc. Aust., 24, 174Kanner J., Camp J., Racusin J., Gehrels N., White D., 2012, ApJ, 759, 22Keller S. C. et al., 2007, Publ. Astron. Soc. Aust., 24, 1Klimenko S. et al., 2011, Phys. Rev. D, 83, 102001Klotz A., Boer M., Atteia J.-L., Gendre B., Le Borgne J.-F., Frappa E.,
Vachier F., Berthier J., 2013, Messenger, 151, 6Kulkarni S. R., 2005, preprint (arXiv:Astrophys. e-prints)Lasky P. D., Haskell B., Ravi V., Howell E. J., Coward D. M., 2014, Phys.
Rev. D, 89, 047302Lee W. H., Ramirez-Ruiz E., Lopez-Camara D., 2009, ApJ, 699, L93Lennarz D., Chadwick P. M., Domainko W., Parsons R. D., Rowell G.,
Tam P. H. T., for the H. E. S. S. Collaboration, 2013, preprint(arXiv:1307.6897)
Li L.-X., Paczynski B., 1998, ApJ, 507, L59LIGO Scientific Collaboration, 2009, Advanced LIGO Anticipated Sensi-
tivity Curves, LIGO Document T-0900288-v2Liu Y., Du Z., Chung S. K., Hooper S., Blair D., Wen L., 2012, Classical
Quantum Gravity, 29, 235018Lorimer D. R., Karastergiou A., McLaughlin M. A., Johnston S., 2013,
MNRAS, 436, L5Lu H.-J., Zhang B., Lei W.-H., Li Y., Lasky P. D., 2015, ApJ, 805, 89Luan J., Hooper S., Wen L., Chen Y., 2012, Phys. Rev. D, 85, 102002Manzotti A., Dietz A., 2012, preprint (arXiv:e-prints)Meegan C. et al., 2009, ApJ, 702, 791Meszaros P., Rees M. J., 1993, ApJ, 405, 278Metzger B. D., Berger E., 2012, ApJ, 746, 48Metzger B. D., Bower G. C., 2014, MNRAS, 437, 1821
Metzger B. D., Piro A. L., 2014, MNRAS, 439, 3916Metzger B. D., Quataert E., Thompson T. A., 2008, MNRAS, 385, 1455Metzger B. D. et al., 2010, MNRAS, 406, 2650Metzger B. D., Giannios D., Thompson T. A., Bucciantini N., Quataert E.,
2011, MNRAS, 413, 2031Metzger B. D., Bauswein A., Goriely S., Kasen D., 2015, MNRAS, 446,
1115Murphy T. et al., 2013, Publ. Astron. Soc. Aust., 30, 6Nakar E., Piran T., 2011, Nature, 478, 82Narayan R., Paczynski B., Piran T., 1992, ApJ, 395, L83Nissanke S., Holz D. E., Hughes S. A., Dalal N., Sievers J. L., 2010, ApJ,
725, 496Nissanke S., Sievers J., Dalal N., Holz D., 2011, ApJ, 739, 99Nissanke S., Kasliwal M., Georgieva A., 2013, ApJ, 767, 124Norris J. P., Bonnell J. T., 2006, ApJ, 643, 266Oosterloo T., Verheijen M., van Cappellen W., 2010, in ISKAF2010 Science
Meeting The Latest on Apertif. p. 43Ozel F., Psaltis D., Narayan R., Villarreal A. S., 2012, ApJ, 757, 55Paczynski B., 1986, ApJ, 308, L43Paczynski B., 1991, Acta Astron., 41, 257Page K. L. et al., 2007, ApJ, 663, 1125Paul J., Wei J., Basa S., Zhang S.-N., 2011, Comptes Rendus Phys., 12, 298Perley D. A. et al., 2009, AJ, 138, 1690Perley D. A. et al., 2014, ApJ, 781, 37Piran T., Nakar E., Rosswog S., 2013, MNRAS, 430, 2121Prasad P., Wijnholds S. J., Huizinga F., Wijers R. A. M. J., 2014, A&A, 568,
A48Punturo M., 2012, Note vir-0128a-12, Advanced Virgo Technical Design
Report. The Virgo CollaborationRacusin J. L. et al., 2008, Nature, 455, 183Ravi V., Lasky P. D., 2014, MNRAS, 441, 2433Regimbau T., Siellez K., Meacher D., Gendre B., Boer M., 2015, ApJ, 799,
69Rezzolla L., Kumar P., 2015, ApJ, 802, 95Rezzolla L., Giacomazzo B., Baiotti L., Granot J., Kouveliotou C., Aloy
M. A., 2011, ApJ, 732, L6Rosswog S., Piran T., Nakar E., 2013, MNRAS, 430, 2585Rowlinson A. et al., 2010a, MNRAS, 408, 383Rowlinson A. et al., 2010b, MNRAS, 409, 531Rowlinson A., O’Brien P. T., Metzger B. D., Tanvir N. R., Levan A. J., 2013,
MNRAS, 430, 1061Schutz B. F., 2011, Classical Quantum Gravity, 28, 125023Shawhan P. S., 2012, Proc. SPIE, 8448, 84480QShibata M., Taniguchi K., Okawa H., Buonanno A., 2014, Phys. Rev. D, 89,
084005Siellez K., Boer M., Gendre B., 2014, MNRAS, 437, 649Singer L. P., 2015, PhD thesis, California Institute of TechnologySinger L. P. et al., 2013, ApJ, 776, L34Singer L. P. et al., 2014, ApJ, 795, 105Singer L. P. et al., 2015, ApJ, 806, 52Smith R. M. et al., 2014, Proc. SPIE, 9147, 79Somiya K., 2012, Classical Quantum Gravity, 29, 124007Staley T. D. et al., 2013, MNRAS, 428, 3114Tanaka M., Hotokezaka K., 2013, ApJ, 775, 113Tanvir N. R., Levan A. J., Fruchter A. S., Hjorth J., Hounsell R. A., Wiersema
K., Tunnicliffe R. L., 2013, Nature, 500, 547Thornton D. et al., 2013, Science, 341, 53Tingay S. J. et al., 2013, Publ. Astron. Soc. Aust., 30, 7Totani T., 2013, PASJ, 65, L12Tremblay S. E. et al., 2015, Publ. Astron. Soc. Aust., 32, 5Troja E. et al., 2007, ApJ, 665, 599Tunnicliffe R. L. et al., 2014, MNRAS, 437, 1495Usov V. V., Katz J. I., 2000, A&A, 364, 655van der Horst A. J. et al., 2014, MNRAS, 444, 3151van Haarlem M. P. et al., 2013, A&A, 556, A2Veres P., Meszaros P., 2014, ApJ, 787, 168Verheijen M. A. W., Oosterloo T. A., van Cappellen W. A., Bakker L.,
Ivashina M. V., van der Hulst J. M., 2008, in Minchin R., Momjian E.,
MNRAS 459, 121–139 (2016)
at Curtin U
niversity Library on A
ugust 24, 2016http://m
nras.oxfordjournals.org/D
ownloaded from

EM follow-up prospects from low-latency GW 139
eds, AIP Conf. Proc. Vol. 1035, The Evolution of Galaxies Through theNeutral Hydrogen Window. Am. Inst. Phys., New York, p. 265
Vestrand W. T. et al., 2005, Nature, 435, 178Vestrand W. T. et al., 2014, Science, 343, 38Vitale S., Zanolin M., 2011, Phys. Rev. D, 84, 104020Wen L., Chen Y., 2010, Phys. Rev. D, 81, 082001Wen L., Fan X., Chen Y., 2008, J. Phys. Conf. Ser., 122, 012038Yang B. et al., 2015, Nat. Commun., 6, 7323Yu Y., Huang Y.-F., 2007, Chin. J. Astron. Astrophys., 7, 669Yu Y.-W., Zhang B., Gao H., 2013, ApJ, 776, L40
Zanolin M., Vitale S., Makris N., 2010, Phys. Rev. D, 81, 124048Zhang B., 2013, ApJ, 763, L22Zhang B., 2014, ApJ, 780, L21Zhang B., Meszaros P., 2001, ApJ, 552, L35Zhang B., Kobayashi S., Meszaros P., 2003, ApJ, 595, 950Zheng W. et al., 2012, ApJ, 751, 90
This paper has been typeset from a TEX/LATEX file prepared by the author.
MNRAS 459, 121–139 (2016)
at Curtin U
niversity Library on A
ugust 24, 2016http://m
nras.oxfordjournals.org/D
ownloaded from