carbon and certain alloy steel wire rod from brazil, indonesia
TRANSCRIPT

U.S. International Trade Commission
Publication 4472 June 2014
Washington, DC 20436
Carbon and Certain Alloy Steel Wire Rod from Brazil, Indonesia, Mexico, Moldova,
Trinidad & Tobago, and Ukraine
Investigation Nos. 701-TA-417 and 731-TA-953, 957-959, 961, and 962 (Second Review)

U.S. International Trade Commission
COMMISSIONERS
Irving A. Williamson, Chairman Dean A. Pinkert
David S. Johanson Meredith M. Broadbent
F. Scott Kieff Rhonda K. Schmidtlein
Robert B. Koopman
Staff assigned
Address all communications to Secretary to the Commission
United States International Trade Commission Washington, DC 20436
Director of Operations
Mary Messer, Investigator Karl Tsuji, Industry Analyst Aimee Larsen, Economist
David Boyland, Accountant Mara Alexander, Statistician
Carolyn Holmes, Statistical Assistant David Fishberg, Attorney
Douglas Corkran, Supervisory Investigator

U.S. International Trade Commission
Washington, DC 20436 www.usitc.gov
Publication 4472 June 2014
Carbon and Certain Alloy Steel Wire Rod from Brazil, Indonesia, Mexico, Moldova,
Trinidad & Tobago, and Ukraine
Investigation Nos. 701-TA-417 and 731-TA-953, 957-959, 961, and 962 (Second Review)

CONTENTS Page
i
Determinations ....................................................................................................................... 1 Views of the Commission ........................................................................................................ 3 Separate and dissenting views of Chairman Irving A. Williamson and Commissioner David S. Johanson regarding cumulation for Ukraine ................................. 51 Separate and dissenting views of Commissioner David S. Johanson ...................................... 55 Part I: Introduction and overview .......................................................................................... I‐1 Background ................................................................................................................................ I‐1 The original investigations ........................................................................................................ I‐3 The first five‐year review .......................................................................................................... I‐4 Summary data ........................................................................................................................... I‐5 Related investigations ............................................................................................................... I‐9 Title VII investigations ........................................................................................................... I‐9 Safeguard investigation ....................................................................................................... I‐12
Statutory criteria and organization of the report ................................................................... I‐12 Statutory criteria ................................................................................................................. I‐12 Organization of report ......................................................................................................... I‐14
Commerce’s reviews ............................................................................................................... I‐15 Administrative reviews ........................................................................................................ I‐15 Changed circumstances reviews ......................................................................................... I‐18 Scope inquiry reviews .......................................................................................................... I‐18 Anti‐circumvention Inquiry ................................................................................................. I‐18 Five‐year reviews ................................................................................................................. I‐19
The subject merchandise ........................................................................................................ I‐23 Commerce’s scope .............................................................................................................. I‐23 Tariff treatment ................................................................................................................... I‐25
The product ............................................................................................................................. I‐26 Description and applications ............................................................................................... I‐26 Manufacturing processes .................................................................................................... I‐30
Domestic like product issues ................................................................................................... I‐36 U.S. market participants .......................................................................................................... I‐37 U.S. producers ..................................................................................................................... I‐37 U.S. importers ...................................................................................................................... I‐39 U.S. purchasers .................................................................................................................... I‐40
Apparent U.S. consumption and U.S. market shares .............................................................. I‐41 Merchant market apparent U.S. consumption and U.S. market shares ................................. I‐41

CONTENTS Page
ii
Part II: Conditions of competition in the U.S. market ............................................................ II‐1 U.S. market characteristics ....................................................................................................... II‐1 Channels of distribution ........................................................................................................... II‐1 Geographic distribution ........................................................................................................... II‐2 Supply and demand considerations ......................................................................................... II‐3 U.S. supply ............................................................................................................................ II‐3 U.S. demand ....................................................................................................................... II‐11
Substitutability issues ............................................................................................................. II‐14 Lead times .......................................................................................................................... II‐15 Knowledge of country sources ........................................................................................... II‐15 Factors affecting purchasing decisions............................................................................... II‐16 Comparisons of domestic products, subject imports, and nonsubject imports ................ II‐19
Elasticity estimates ................................................................................................................. II‐26 U.S. supply elasticity ........................................................................................................... II‐26 U.S. demand elasticity ........................................................................................................ II‐26 Substitution elasticity ......................................................................................................... II‐26
Part III: Condition of the U.S. industry ................................................................................. III‐1 Overview ................................................................................................................................. III‐1 Background .............................................................................................................................. III‐1 Changes in existing operations ............................................................................................... III‐1 Anticipated Changes in existing operations ............................................................................ III‐3 U.S. production, capacity, and capacity utilization ................................................................. III‐3 Constraints on capacity ........................................................................................................... III‐4 Alternative products................................................................................................................ III‐5 U.S. producers’ U.S. shipments and exports ........................................................................... III‐5 U.S. producers’ U.S. shipments, by application ...................................................................... III‐8 U.S. producers’ inventories ..................................................................................................... III‐9 U.S. producers’ imports and purchases ................................................................................ III‐10 U.S. employment, wages, and productivity .......................................................................... III‐11 Financial experience of U.S. producers ................................................................................. III‐12 Background ........................................................................................................................ III‐12 Operations on wire rod ..................................................................................................... III‐13 Capital expenditures and research and development expenses ...................................... III‐20

CONTENTS Page
iii
Part IV: U.S. imports and the foreign industries ................................................................... IV‐1 U.S. imports ............................................................................................................................. IV‐1 Overview .............................................................................................................................. IV‐1 Imports from subject and nonsubject countries ................................................................. IV‐2
U.S. shipments of imports, by application .............................................................................. IV‐7 U.S. importers’ imports subsequent to December 31, 2013 .................................................. IV‐8 U.S. importers’ inventories ..................................................................................................... IV‐9 Cumulation considerations ..................................................................................................... IV‐9 Fungibility ............................................................................................................................ IV‐9 Presence in the market ..................................................................................................... IV‐10 Geographical markets ....................................................................................................... IV‐10
Subject country producers .................................................................................................... IV‐11 The industry in Brazil ............................................................................................................. IV‐13 Overview ............................................................................................................................ IV‐13 Operations on wire rod ..................................................................................................... IV‐15
The industry in Indonesia ...................................................................................................... IV‐19 Overview ............................................................................................................................ IV‐19 Operations on wire rod ..................................................................................................... IV‐21
The industry in Mexico .......................................................................................................... IV‐24 Overview ............................................................................................................................ IV‐24 Operations on wire rod ..................................................................................................... IV‐27
The industry in Moldova ....................................................................................................... IV‐33 Overview ............................................................................................................................ IV‐33 Operations on wire rod ..................................................................................................... IV‐34
The industry in Trinidad & Tobago ........................................................................................ IV‐37 Overview ............................................................................................................................ IV‐37 Operations on wire rod ..................................................................................................... IV‐37
The industry in Ukraine ......................................................................................................... IV‐41 Overview ............................................................................................................................ IV‐41 Operations on wire rod ..................................................................................................... IV‐43
Global market ........................................................................................................................ IV‐47 Production ............................................................................................................................. IV‐47 Consumption ......................................................................................................................... IV‐47 Prices ..................................................................................................................................... IV‐49 Additional global supply and demand factors ...................................................................... IV‐52

CONTENTS Page
iv
Part V: Pricing data ............................................................................................................... V‐1 Factors affecting prices ............................................................................................................ V‐1 Raw material costs ............................................................................................................... V‐1 Transportation costs to the U.S. market .............................................................................. V‐3 U.S. inland transportation costs ........................................................................................... V‐4
Pricing practices ....................................................................................................................... V‐4 Pricing methods .................................................................................................................... V‐4 Sales terms and discounts .................................................................................................... V‐5 Price leadership .................................................................................................................... V‐5
Price data .................................................................................................................................. V‐6 Price trends ......................................................................................................................... V‐11 Price comparisons .............................................................................................................. V‐12
Appendixes A. Federal Register notices ....................................................................................................... A‐1 B. List of hearing witnesses (reserved) ..................................................................................... B‐1 C. Summary data ....................................................................................................................... C‐1 D. Comments by U.S. producers, importers, purchasers, and foreign producers regarding the effects of the orders and the likely effects of revocation .............................. D‐1 E. Financial results on merchant market sales as reported in the most recently completed preliminary‐phase investigations ......................................................................................... E‐1 F. Smaller diameter wire rod from Deacero ............................................................................. F‐1
Note.—Information that would reveal confidential operations of individual concerns may not be published and therefore has been deleted from this report. Such deletions are indicated by asterisks.

UNITED STATES INTERNATIONAL TRADE COMMISSION
Investigation Nos. 701‐TA‐417 and 731‐TA‐953, 957‐959, 961, and 962 (Second Review)
CARBON AND CERTAIN ALLOY STEEL WIRE ROD FROM BRAZIL, INDONESIA, MEXICO, MOLDOVA, TRINIDAD AND TOBAGO, AND UKRAINE
DETERMINATIONS
On the basis of the record1 developed in the subject five‐year reviews, the United States International Trade Commission (“Commission”) determines, pursuant to section 751(c) of the Tariff Act of 1930 (19 U.S.C. § 1675(c)), that revocation of the countervailing duty order on carbon and certain alloy steel wire rod (“wire rod”) from Brazil and the antidumping duty orders on wire rod from Brazil, Indonesia, Mexico, Moldova, and Trinidad and Tobago would be likely to lead to continuation or recurrence of material injury to an industry in the United States within a reasonably foreseeable time. The Commission also determines, pursuant to section 751(c) of the Tariff Act of 1930 (19 U.S.C. § 1675(c)), that revocation of the antidumping duty order on wire rod from Ukraine would not be likely to lead to continuation or recurrence of material injury to an industry in the United States within a reasonably foreseeable time.2
BACKGROUND
The Commission instituted these reviews on June 3, 2013 (78 FR 33103) and determined on September 6, 2013 that it would conduct full reviews (78 FR 60316, October 1, 2013). Notice of the scheduling of the Commission’s reviews and of a public hearing to be held in connection therewith was given by posting copies of the notice in the Office of the Secretary, U.S. International Trade Commission, Washington, DC, and by publishing the notice in the Federal Register on December 18, 2013 (78 FR 76653). The hearing was held in Washington, DC, on April 22, 2014, and all persons who requested the opportunity were permitted to appear in person or by counsel.
1 The record is defined in sec. 207.2(f) of the Commission’s Rules of Practice and Procedure (19
CFR § 207.2(f)). 2 Chairman Irving A. Williamson and Commissioner David S. Johanson dissented with respect to
subject imports from Ukraine, finding that revocation of the antidumping duty order on wire rod from Ukraine would be likely to lead to continuation or recurrence of material injury to an industry in the United States within a reasonably foreseeable time. Commissioner David S. Johanson also dissented with respect to subject imports from Mexico, finding that revocation of the antidumping duty order on wire rod from Mexico would not be likely to lead to continuation or recurrence of material injury to an industry in the United States within a reasonably foreseeable time. Commissioner Rhonda K. Schmidtlein did not participate in these reviews.


3
VIEWS OF THE COMMISSION
Based on the record in these five‐year reviews, we determine under section 751(c) of the Tariff Act of 1930, as amended (“the Tariff Act”), that revocation of the countervailing duty order on carbon and certain alloy steel wire rod (“wire rod”) from Brazil and the antidumping duty orders on wire rod from Brazil, Indonesia, Mexico, Moldova, and Trinidad and Tobago would be likely to lead to continuation or recurrence of material injury to an industry in the United States within a reasonably foreseeable time.1 We determine that revocation of the antidumping duty order on wire rod from Ukraine would not be likely to lead to continuation or recurrence of material injury to an industry in the United States within a reasonably foreseeable time.2 3
Background I.
Original Investigations. In October 2002, the Commission found that an industry in the United States was materially injured by reason of subject imports of wire rod from Brazil, Canada, Indonesia, Mexico, Moldova, Trinidad and Tobago, and Ukraine.4 Commerce issued antidumping and countervailing duty orders covering the subject merchandise on October 29, 2002.5 6
1 Chairman Williamson determines that revocation of the countervailing duty order on wire rod from Brazil and the antidumping duty orders on wire rod from Brazil, Indonesia, Mexico, Moldova, Trinidad and Tobago, and Ukraine, would be likely to lead to continuation or recurrence of material injury to an industry in the United States within a reasonably foreseeable time. Except as otherwise noted, he joins all sections of these views except for section VIII.
2 Commissioner Johanson determines that revocation of the countervailing duty order on wire rod from Brazil and the antidumping duty orders on wire rod from Brazil, Indonesia, Moldova, Trinidad and Tobago, and Ukraine, would be likely to lead to continuation or recurrence of material injury to an industry in the United States within a reasonably foreseeable time. He determines that revocation of the antidumping duty order on wire rod from Mexico would not be likely to lead to continuation or recurrence of material injury to an industry in the United States within a reasonably foreseeable time. He joins sections I, II, III (A), (B), (C), IV, V, VI and VII, except as otherwise noted.
3 Commissioner Schmidtlein did not participate in these reviews. 4 Carbon and Certain Alloy Steel Wire Rod from Brazil, Canada, Germany, Indonesia, Mexico,
Moldova, Trinidad and Tobago, and Ukraine, Inv. Nos. 701‐TA‐417 and 731‐TA‐953, 954, 956‐959, 961, and 962 (Final), USITC Pub. 3546 (Oct. 2002) (“Original Determinations”).
5 67 Fed. Reg. 64871 (Oct. 29, 2002) (countervailing duty order on subject imports from Brazil), 67 Fed. Reg. 65944‐65947 (Oct. 29, 2002) (antidumping duty orders on subject imports from Brazil, Canada, Indonesia, Mexico, Moldova, Trinidad and Tobago, and Ukraine).
6 The only litigation regarding the Commission’s original determinations concerning the subject imports at issue in these reviews was an appeal of the affirmative determination on subject imports from Trinidad and Tobago. USITC Pub. 3546 at 36‐38. The U.S. Court of International Trade (“CIT”) affirmed this determination. Caribbean Ispat Ltd. v. United States, 366 F. Supp. 2d 1300 (Ct. Int’l Trade 2005). However, the United States Court of Appeals for the Federal Circuit (“Federal Circuit”) vacated (Continued…)

4
First Reviews. The Commission instituted its first five‐year review of the orders in September 2007 and conducted full reviews.7 The Commission determined that revocation of the countervailing duty order on subject imports from Brazil and the antidumping orders on subject imports from Brazil, Indonesia, Mexico, Moldova, Trinidad and Tobago, and Ukraine would be likely to lead to continuation or recurrence of material injury to an industry in the United States within a reasonably foreseeable time.8 Commerce issued a continuation of the antidumping and countervailing duty orders covering the merchandise from these subject countries on July 30, 2008.9
Current Reviews. The Commission instituted these five‐year reviews on June 3, 2013. The Commission received a consolidated response to the notice of institution from domestic producers Gerdau Ameristeel US Inc. (“Gerdau”), ArcelorMittal USA, LLC (“ArcelorMittal USA”), Keystone Consolidated Industries, Inc. (“Keystone”), Charter Steel (“Charter”), and Evraz Pueblo (“Evraz”) (collectively, “Gerdau Parties”) and Nucor Corp. (“Nucor”). It received a response from Deacero S.A.P.I. de C.V. , a producer and exporter of subject merchandise from Mexico, and Deacero USA Inc. (“Deacero USA”), a U.S. importer of subject merchandise from Mexico (collectively, “Deacero”), and a response from Ternium Mexico, S.A. de C.V. (“Ternium”), also a producer and exporter of subject merchandise from Mexico. On September 6, 2013, the Commission determined that the domestic interested party group response was adequate for all reviews and the respondent interested party group response was adequate for the review
(…Continued) and remanded so that the Commission could (1) ascertain whether imports from subject countries other than Trinidad and Tobago were an alternative cause of injury to the domestic industry and (2) conduct an analysis under the decision in Bratsk Aluminum Smelter v. United States, 444 F.3d 1369 (Fed. Cir. 2006). Caribbean Ispat Ltd. v. United States, 450 F.3d 1336 (Fed. Cir. 2006). On first remand, the Commission reached a negative determination applying the replacement/benefit test it perceived was mandated by the Bratsk. Carbon and Certain Alloy Steel Wire Rod from Trinidad and Tobago, Inv. No. 731‐TA‐961 (Final) (Remand), USITC Pub. 3903 (Jan. 2007). The CIT affirmed. Mittal Steel Point Lisas Ltd. v. United States, 495 F. Supp. 2d 1374 (Ct. Int’l Trade 2007). On appeal, the Federal Circuit again vacated and remanded. Mittal Steel Point Lisas Ltd. v. United States, 542 F.3d 867 (Fed. Cir. 2008). On second remand the Commission reached an affirmative determination.6 The CIT affirmed. Carbon and Certain Alloy Steel Wire Rod from Trinidad and Tobago, Inv. No. 731‐TA‐961 (Final) (Second Remand), USITC Pub. 4170 (June 2010).
7 72 Fed. Reg. 73880 (Dec. 28, 2007). 8 Carbon and Certain Alloy Steel Wire Rod from Brazil, Canada, Indonesia, Mexico, Moldova,
Trinidad and Tobago, and Ukraine, Inv. Nos. 701‐TA‐417 and 731‐TA‐953, 954, 956‐959, 961, and 962 (Final), USITC Pub. 4014 (June 2008) (“First Review Determinations”). The Commission found that revocation of the antidumping duty order on subject imports from Canada would not be likely to lead to continuation or recurrence of material injury to an industry in the United States within a reasonably foreseeable time. Id. Commerce subsequently revoked this order on July 30, 2008. 73 Fed. Reg. 44223 (July 30, 2008).
9 73 Fed. Reg. 44218 (July 30, 2008).

5
on the order on subject imports from Mexico and inadequate for all other reviews.10 The Commission determined to conduct full reviews of the orders on wire rod from Brazil, Indonesia, Moldova, Trinidad and Tobago, and Ukraine in order to promote administrative efficiency in light of the Commission’s determination to conduct a full review of the order on wire rod from Mexico.11
Parties to the Proceedings. The Commission received prehearing and posthearing briefs from each of Gerdau Parties and Nucor (collectively, “Domestic Producers”). Representatives of Gerdau Parties and Nucor, as well as a representative from USW Local 7898, a labor union representing U.S. wire rod production workers, appeared at the Commission hearing.
The Commission received several sets of briefs from parties that support revocation of the orders. Deacero filed prehearing and posthearing briefs. Public Joint Stock Company Iron and Steel Works (“Yenakiieve”), a producer of subject merchandise from Ukraine, filed prehearing and posthearing briefs. The American Wire Producers Ass’n (“AWPA”), an association of U.S. purchasers of wire rod, filed a prehearing brief. Representatives from Deacero and Yenakiieve, as well as representatives from the Embassy of Mexico and the Embassy of Ukraine, appeared at the Commission hearing.
Data Coverage. U.S. industry data are based on questionnaire responses from ten U.S. producers of wire rod that are believed to account for all known U.S. production of wire rod in 2013.12 The Commission received usable questionnaire data from 37 U.S. importers of wire rod, representing virtually all U.S. imports of wire rod from Mexico in 2013 and 84.8 percent of U.S. imports of wire rod from nonsubject countries.13 There were no reported subject imports from Brazil, Indonesia, Moldova, Trinidad and Tobago, or Ukraine in 2013.14 One U.S. importer of wire rod from Trinidad and Tobago provided a response to the Commission’s questionnaire accounting for *** percent of total U.S. imports of wire rod from Trinidad and Tobago in 2008 based on official Commerce statistics.15 U.S. import data are based on questionnaire responses for wire rod imported from Mexico and on official Commerce statistics for all other sources. The Commission also received foreign producers’ questionnaire responses from one producer in Brazil estimated to account for *** percent of that country’s total wire rod production in 2013, one producer in Indonesia estimated to account for *** percent of that country’s total wire rod production, three producers in Mexico that estimate that they account for *** of that country’s wire rod production, the sole producer of subject merchandise in Trinidad and Tobago, and two producers in Ukraine estimated to account for *** of that country’s wire rod
10 Carbon and Certain Alloy Steel Wire Rod from Brazil, Indonesia, Mexico, Moldova, Trinidad and Tobago, and Ukraine: Notice of Commission Determination to Conduct Full Five‐Year Reviews, 78 Fed. Reg. 60316 (Oct. 1, 2013).
11 Confidential Report (“CR”) at I‐1‐I‐2 n.4, Public Report (“PR”) at I‐1‐I‐2n.4. 12 CR at I‐48, PR at I‐37. 13 CR at I‐52, PR at I‐40. 14 CR at I‐52, PR at I‐40. 15 CR at IV‐1 n.5, PR at IV‐1 n.5.

6
production.16 The Commission received no questionnaire response from any foreign producer in Moldova.17
Domestic Like Product and Industry II.
A. Domestic Like Product
In making its determination under section 751(c) of the Tariff Act, the Commission defines the “domestic like product” and the “industry.”18 The Tariff Act defines “domestic like product” as “a product which is like, or in the absence of like, most similar in characteristics and uses with, the article subject to an investigation under this subtitle.”19 The Commission’s practice in five‐year reviews is to examine the domestic like product definition from the original investigation and consider whether the record indicates any reason to revisit the prior findings.20
Commerce has defined the imported merchandise within the scope of the orders under review as follows:
Certain hot‐rolled products of carbon steel and alloy steel, in coils, of approximately round cross section, 5.00 mm or more, but less than 19.00 mm, in solid cross‐sectional diameter.21
This definition is subject to several lengthy exclusions. Among the items excluded from the scope are rebar; articles made with stainless steel, tool steel, high nickel steel, ball bearing steel, and free machining steel;22 grade 1080 tire cord quality rod;23 and grade 1080 tire bead quality rod.24
16 CR at IV‐17, IV‐29, IV‐39, IV‐ 55, and IV‐66; PR at IV‐14, IV‐19, IV‐25, IV‐37, and IV‐42. 17 CR at I‐17, PR at I‐14. 18 19 U.S.C. § 1677(4)(A). 19 19 U.S.C. § 1677(10); see, e.g., Cleo Inc. v. United States, 501 F.3d 1291, 1299 (Fed. Cir. 2007);
NEC Corp. v. Department of Commerce, 36 F. Supp. 2d 380, 383 (Ct. Int’l Trade 1998); Nippon Steel Corp. v. United States, 19 CIT 450, 455 (1995); Timken Co. v. United States, 913 F. Supp. 580, 584 (Ct. Int’l Trade 1996); Torrington Co. v. United States, 747 F. Supp. 744, 748‐49 (Ct. Int’l Trade 1990), aff’d, 938 F.2d 1278 (Fed. Cir. 1991); see also S. Rep. No. 249, 96th Cong., 1st Sess. 90‐91 (1979).
20 See, e.g., Internal Combustion Industrial Forklift Trucks from Japan, Inv. No. 731‐TA‐377 (Second Review), USITC Pub. 3831 at 8‐9 (Dec. 2005); Crawfish Tail Meat from China, Inv. No. 731‐TA‐752 (Review), USITC Pub. 3614 at 4 (July 2003); Steel Concrete Reinforcing Bar from Turkey, Inv. No. 731‐TA‐745 (Review), USITC Pub. 3577 at 4 (Feb. 2003).
21 78 Fed. Reg. 63450‐51 (Oct. 24, 2013 (final results of Commerce sunset reviews). 22 As the scope definition states: Specifically excluded are steel products possessing the above‐noted physical characteristics and
meeting the Harmonized Tariff Schedule of the United States (“HTSUS”) definitions for (a) stainless steel; (b) tool steel; (c) high nickel steel; (d) ball bearing steel; and (e) concrete reinforcing bars and rods. Also excluded are (f) free machining steel products (i.e., products that contain by weight one or more of the (Continued…)

7
Anti‐Circumvention Inquiry. On June 8, 2011, at the request of the domestic industry, Commerce initiated an anti‐circumvention inquiry into whether Mexican wire rod producers Deacero and Ternium shipped wire rod to the United States with an actual diameter measuring 4.75 mm, which is less than the 5.00 mm minimum diameter specified in the scope definition, in a manner that constituted merchandise altered in form or appearance in such minor respects that it should be included within the scope of the order on wire rod from Mexico.25 On October 1, 2012, Commerce published its final determination of circumvention, finding that Ternium had not shipped this type of wire rod to the United States but that Deacero’s shipments of this type of wire rod constituted merchandise altered in form or appearance in such minor respects that it should be included within the scope of the order.26 Deacero appealed Commerce’s circumvention finding to the CIT, and on September 30, 2013, the CIT remanded the matter to
(…Continued) following elements: 0.03 percent or more of lead, 0.05 percent or more of bismuth, 0.08 percent or more of sulfur, more than 0.04 percent of phosphorus, more than 0.05 percent of selenium, or more than 0.01 percent of tellurium). CR at I‐29, PR at I‐23.
23 Grade 1080 tire cord quality wire rod is defined as follows: (i) wire rod measuring 5.0 mm or more but not more than 6.0 mm in cross‐sectional diameter;
(ii) with an average partial decarburization of no more than 70 microns in depth (maximum individual 200 microns); (iii) having no non‐deformable inclusions greater than 20 microns and no deformable inclusions greater than 35 microns; (iv) having a carbon segregation per heat average of 3.0 or better using European Method NFA 04‐114; (v) having a surface quality with no surface defects of a length greater than 0.15 mm; (vi) capable of being drawn to a diameter of 0.30 mm or less with 3 or fewer breaks per ton; and (vii) containing by weight the following elements in the proportions shown: (1) 0.78 percent or more of carbon, (2) less than 0.01 percent of aluminum, (3) 0.040 percent or less, in the aggregate, of phosphorus and sulfur, (4) 0.006 percent or less of nitrogen, and (5) not more than 0.15 percent, in the aggregate, of copper, nickel, and chromium. CR at I‐29, PR at I‐23.
24 Grade 1080 tire bead quality rod is defined as follows: (i) wire rod measuring 5.5 mm or more but not more than 7.0 mm in cross‐sectional diameter;
(ii) with an average partial decarburization of no more than 70 microns in depth (maximum individual 200 microns); (iii) having no non‐deformable inclusions greater than 20 microns and no deformable inclusions greater than 35 microns; (iv) having a carbon segregation per heat average of 3.0 or better using European Method NFA 04‐114; (v) having a surface quality with no surface defects of a length greater than 0.2 mm; (vi) capable of being drawn to a diameter of 0.78 mm or larger with 0.5 or fewer breaks per ton; and (vii) containing by weight the following elements in the proportions shown: (1) 0.78 percent or more of carbon, (2) less than 0.01 percent of soluble aluminum, (3) 0.040 percent or less, in the aggregate, of phosphorus and sulfur, (4) 0.008 percent or less of nitrogen, and (5) either not more than 0.15 percent, in the aggregate, of copper, nickel, and chromium (if chromium is not specified), or not more than 0.10 percent in the aggregate of copper and nickel and a chromium content of 0.24 to 0.30 percent (if chromium is specified). CR at I‐29‐I‐30, PR at I‐23‐I‐24.
25 Carbon and Certain Alloy Steel Wire Rod from Mexico: Initiation of Anti‐Circumvention Inquiry of Antidumping Duty Order, 76 Fed. Reg. 33218 (June 8, 2011).
26 Carbon and Certain Alloy Steel Wire Rod from Mexico: Affirmative Final Determination of Circumvention of the Antidumping Order, 77 Fed. Reg. 59892 (Oct. 1, 2012).

8
Commerce.27 Pursuant to the CIT’s order, on January 28, 2014, Commerce reversed its final determination “under respectful protest” and found that Deacero’s shipments of 4.75 mm wire rod to the United States are outside the scope of the order and thus such shipments do not constitute a circumventing minor alteration.28 The CIT ruling on Commerce’s final remand determination was pending at the time the record closed in these reviews.
The Original Determinations and First Five‐Year Reviews. In the original determinations, the Commission defined the domestic like product to include grade 1080 tire cord quality wire rod and grade 1080 tire bead quality wire rod, which Commerce had excluded from the scope. The Commission observed that Commerce had retained tire cord wire rod and tire bead wire rod of both higher and lower grades in the scope and that the record did not contain information indicating that the differences among grades of tire bead or tire cord wire rod was significant. Instead, it found that other domestic tire cord wire rod and tire bead wire rod articles that corresponded directly to products within the scope closely shared physical characteristics, uses, prices, channels of distribution, and production processes with the excluded grade 1080 articles.29
The Commission rejected arguments asserted by respondents that tire cord quality rod, cold heading quality (CHQ) wire rod meeting Industrial Fasteners Institute Specification IFI‐140, and clean steel precision bar in coils (CSPBIC) should each be defined as a distinct domestic like product. The Commission found that, although each of these products was a high‐end product that met exacting quality requirements, there was no clear dividing line between any one of these products and other wire rod products.30 Instead, the Commission concluded that “the wire rod industry is composed of so many different products, used in so many different applications, that the only clear dividing line is between wire rod and other steel products.”31 Accordingly, the Commission defined a single domestic like product consisting of both the wire rod within the scope definition and the grade 1080 tire cord and grade 1080 tire bead wire rod that Commerce had excluded from the scope.32
In the first five‐year reviews, the Commission found that there were no material changes in pertinent product characteristics from the original investigations or any other reason to revisit the like product definition.33 Consequently, the Commission continued to define the
27 Deacero S.A. de C.V. v. United States, 942 F. Supp. 2d 1321, 1331‐32 (CIT 2013). The Court directed Commerce to reconsider its finding that 4.75 mm wire rod is circumventing the order, or if Commerce were to again find that 4.75 mm wire rod is a circumventing minor alteration of subject merchandise, to thoroughly explain how the record and relevant law supports that determination in light of the fact that 4.75 mm wire rod was commercially available before the investigation and petitioners chose to limit the scope to certain steel products of 5.00 mm or more.
28 Final Results of Redetermination Pursuant to Court Remand, Ct. No. 12‐00345 (Dep’t Commerce Jan. 28, 2014).
29 Original Determinations, USITC Pub. 3546 at 7‐8. 30 See Original Determinations, USITC Pub. 3546 at 8‐12. 31 Original Determinations, USITC Pub. 3546 at 12. 32 Id. 33 First Review Determinations, UISTC Pub. 4014 at 8.
9
domestic like product to encompass all wire rod, including the grade 1080 tire cord and grade 1080 tire bead wire rod that Commerce had excluded from the scope.34
The Current Reviews. In these second five‐year reviews, the Commission solicited comments from interested parties regarding the appropriate definition of the domestic like product and domestic industry.35 Domestic interested parties agree with the Commission’s definitions of the domestic like product from the original investigations and first reviews.36 Both Mexican producer Deacero and Ukrainian producer Yenakiieve indicated that they do not disagree with the Commission’s definition of the domestic like product.37
We define the domestic like product in the same manner as in the original investigations and first reviews. The record contains no information suggesting that the characteristics and uses of domestically produced wire rod have changed since the prior proceedings or that the like product definition should be revisited.38 No party argued that the Commission should depart from the like product definitions it adopted in the original investigations, and no party requested that the Commission collect data concerning other possible domestic like products in the comments on the Commission’s draft questionnaires.39 Consequently, we define the domestic like product to encompass both wire rod within the scope definition and the grade 1080 tire cord and grade 1080 tire bead wire rod that Commerce has excluded from the scope.
B. Domestic Industry
Section 771(4)(A) of the Tariff Act defines the relevant industry as the domestic “producers as a whole of a domestic like product, or those producers whose collective output of a domestic like product constitutes a major proportion of the total domestic production of the product.”40 In defining the domestic industry, the Commission’s general practice has been to include in the industry producers of all domestic production of the like product, whether toll‐produced, captively consumed, or sold in the domestic merchant market.
We must determine whether any producer of the domestic like product should be excluded from the domestic industry pursuant to section 771(4)(B) of the Tariff Act. This provision allows the Commission, if appropriate circumstances exist, to exclude from the domestic industry producers that are related to an exporter or importer of subject merchandise
34 Id. 35 CR at I‐46, PR at I‐36; see 78 Fed. Reg. 33013 (June 3, 2013) (Commission’s notice of
institution). 36 Domestic Interested Parties’ Response to Notice of Institution at 31; Gerdau Parties’
Prehearing Brief at 5. 37 Deacero’s Response to Notice of Institution at 15; Yenakiieve’s Prehearing Brief at 5. 38 See generally CR at I‐32‐I‐47, PR at I‐26‐I‐36. 39 CR at I‐47, PR at I‐36. 40 19 U.S.C. § 1677(4)(A). The definitions in 19 U.S.C. § 1677 are applicable to the entire subtitle
containing the antidumping and countervailing duty laws, including 19 U.S.C. §§ 1675 and 1675a. See 19 U.S.C. § 1677.

10
or which are themselves importers.41 Exclusion of such a producer is within the Commission’s discretion based upon the facts presented in each investigation.42
In the original determinations, the Commission defined the domestic industry to encompass all domestic producers of wire rod. The Commission found that three domestic producers were potentially subject to exclusion pursuant to the related parties provision because they had imported subject merchandise during the period examined. However, it concluded that appropriate circumstances did not exist to exclude any of these producers from the domestic industry.43
In the first reviews, the Commission again defined the domestic industry to encompass all domestic producers of wire rod. The Commission found that two domestic producers, ArcelorMittal USA and Gerdau Ameristeel, were potentially subject to exclusion because they were affiliated with exporters or importers of subject merchandise and that one domestic producer, ***, was potentially subject to exclusion because it imported subject merchandise during the period of review.44 The Commission concluded, however, that appropriate circumstances did not exist to exclude any of these producers from the domestic industry.45
In the current reviews, domestic interested parties argue that no U.S. producer should be excluded from the domestic industry as a related party. They observe that U.S. producers Gerdau and ArcelorMittal USA are primarily interested in U.S. production, did not benefit from affiliations with subject producers of wire rod, did not import subject merchandise during the period, and do not support revocation of any orders.46 Yenakiieve also indicated that it did not
41 See Torrington Co v. United States, 790 F. Supp. 1161, 1168 (Ct. Int’l Trade 1992), aff’d without opinion, 991 F.2d 809 (Fed. Cir. 1993); Sandvik AB v. United States, 721 F. Supp. 1322, 1331‐32 (Ct. Int’l Trade 1989), aff’d mem., 904 F.2d 46 (Fed. Cir. 1990); Empire Plow Co. v. United States, 675 F. Supp. 1348, 1352 (Ct. Int’l Trade 1987).
42 The primary factors the Commission has examined in deciding whether appropriate circumstances exist to exclude a related party include the following:
(1) the percentage of domestic production attributable to the importing producer; (2) the reason the U.S. producer has decided to import the product subject to investigation, i.e.,
whether the firm benefits from the LTFV sales or subsidies or whether the firm must import in order to enable it to continue production and compete in the U.S. market; and
(3) the position of the related producer vis‐a‐vis the rest of the industry, i.e., whether inclusion or exclusion of the related party will skew the data for the rest of the industry. See, e.g., Torrington Co. v. United States, 790 F. Supp. at 1168.
43 Original Determinations, USITC Pub. 3546 at 14. The Commission further concluded that a fourth producer that purchased subject merchandise during the period examined was not a related party because its purchases were insufficient to constitute direct or indirect control of an importer. Id.
44 First Reviews, USITC Pub. 4014 at 9‐10. 45 Id. The Commission further concluded that a fourth producer that purchased subject
merchandise during the period examined was not a related party because its purchases were insufficient to constitute direct or indirect control of an importer. Id. at 8‐9 n.39.
46 See Gerdau Parties Prehearing Brief at 5‐6.

11
see a basis to exclude Gerdau or ArcelorMittal USA from the domestic industry.47 No other respondent addressed the issue.
We first identify which domestic producers are related parties. Domestic producer Gerdau reported that it is a wholly owned subsidiary of Gerdau SA, a wire rod producer in Brazil.48 There were no reported imports or exports of subject merchandise from Brazil to the United States during the period, and we therefore find that Gerdau is not a related party due to its affiliation with Gerdau SA.
Domestic producer Republic Steel (“Republic”) reported that it is owned by Mexican producers Pacific Steel, Industrias ICH, and Grupo Simec.49 Proprietary data from *** provide no indication that any of Republic’s affiliated firms in Mexico exported subject merchandise to the United States or that there were any imports of wire rod from these firms.50 We therefore find that Republic is not a related party due to its affiliation with the aforementioned Mexican producers.
Domestic producer ArcelorMittal USA reported that it is a wholly owned subsidiary of ArcelorMittal SA (Luxembourg), which has subsidiary wire rod producers in numerous countries, including subject countries Brazil, Mexico, Trinidad and Tobago, and Ukraine.51 ArcelorMittal USA is a related party because a subject producer also controlled by ArcelorMittal S.A., ArcelorMittal Point Lisas, exported subject merchandise from Trinidad and Tobago during the period of review.52 Additionally, ArcelorMittal USA is a related party because it has common ownership with ArcelorMittal entities *** that imported subject merchandise from Mexico during the period of review.53
We next consider whether appropriate circumstances exist for the exclusion of related party producer ArcelorMittal USA. During the period of review, ArcelorMittal USA was the *** largest domestic wire rod producer, accounting for *** percent of domestic production.54 ArcelorMittal USA supports continuation of all orders under review, except it takes no position on the continuation of the order on wire rod from Trinidad and Tobago.55 In every year of the period except for 2010, when ArcelorMittal temporarily closed down its main production facility, the ratio of subject imports from ArcelorMittal‐affiliated firms to ArcelorMittal USA’s
47 Yenakiieve’s Prehearing Brief at 5. 48 CR at III‐17, PR at III‐10. 49 CR/PR at Table I‐11. 50 CR at I‐50 and III‐17, PR at I‐39 and III‐10. 51 CR at III‐17, PR at III‐10. 52 CR/PR at Table IV‐24. 53 CR at III‐18, PR at III‐10; CR/PR at Table III‐9. ArcelorMittal‐affiliated firms did not import
subject merchandise from Trinidad and Tobago during the period of review. CR at III‐17 – III‐18, PR at III‐10.
54 CR/PR at Table I‐11. 55 CR/PR at Table I‐11. We also observe that ArcelorMittal Point Lisa’s 2008 exports to the
United States were *** percent of ArcelorMittal USA’s production that year. CR/PR at Tables III‐9 and IV‐24.

12
production was less than *** percent.56 ArcelorMittal USA’s operating margin was *** of the period of review.57 58
The record does not indicate that the activities of ArcelorMittal affiliates importing subject merchandise from Mexico or exporting subject merchandise from Trinidad and Tobago have benefitted ArcelorMittal USA. Except during 2010, ArcelorMittal USA had substantial domestic wire rod production operations, and ArcelorMittal principally supplied the U.S. market with domestic production, as opposed to subject imports, during the period of review. Moreover, no party argues for ArcelorMittal USA’s exclusion from the domestic industry. Accordingly, we conclude that there are not appropriate circumstances for its exclusion from the domestic industry.
Based on the foregoing and our like product definition, we define the domestic industry to include all U.S. producers of wire rod, including grade 1080 tire cord and grade 1080 tire bead wire rod.
Cumulation III.
A. Legal Standard
With respect to five‐year reviews, section 752(a) of the Tariff Act provides as follows: the Commission may cumulatively assess the volume and effect of imports of the subject merchandise from all countries with respect to which reviews under section 1675(b) or (c) of this title were initiated on the same day, if such imports would be likely to compete with each other and with domestic like products in the United States market. The Commission shall not cumulatively assess the volume and effects of imports of the subject merchandise in a case in which it determines that such imports are likely to have no discernible adverse impact on the domestic industry.59
Cumulation therefore is discretionary in five‐year reviews, unlike original investigations, which are governed by section 771(7)(G)(i) of the Tariff Act.60 The Commission may exercise its
56 CR/PR at Table III‐9. 57 CR/PR at Table III‐13. 58 Commissioner Pinkert does not rely upon financial performance to determine whether there
are appropriate circumstances to exclude ArcelorMittal USA from the domestic industry. In his view, the present record is not sufficient to link the company’s financial performance with respect to U.S. operations to any benefit it derives as a related party.
59 19 U.S.C. § 1675a(a)(7). 60 19 U.S.C. § 1677(7)(G)(i); see also, e.g., Nucor Corp. v. United States, 601 F.3d 1291, 1293 (Fed.
Cir. 2010) (Commission may reasonably consider likely differing conditions of competition in deciding whether to cumulate subject imports in five‐year reviews); Allegheny Ludlum Corp. v. United States, 475 F. Supp. 2d 1370, 1378 (Ct. Int’l Trade 2006) (recognizing the wide latitude the Commission has in selecting the types of factors it considers relevant in deciding whether to exercise discretion to cumulate (Continued…)

13
discretion to cumulate, however, only if the reviews are initiated on the same day, the Commission determines that the subject imports are likely to compete with each other and the domestic like product in the U.S. market, and imports from each such subject country are not likely to have no discernible adverse impact on the domestic industry in the event of revocation. Our focus in five‐year reviews is not only on present conditions of competition, but also on likely conditions of competition in the reasonably foreseeable future.
In the original determinations, for purposes of the determinations on subject imports from Brazil, Canada, Indonesia, Mexico, Moldova, and Ukraine, the Commission cumulated imports from these six subject countries and subject imports from Trinidad and Tobago.61 With respect to fungibility, it found that domestically produced wire rod and wire rod from each of the subject sources was generally interchangeable. It also found that there was a reasonable overlap in product types between the domestic like product and the subject imports and among subject imports from each of the subject countries. The Commission found sufficient geographic overlap, because the domestic like product and imports from all subject countries were generally marketed throughout the United States.62 The Commission also found an overlap of channels of distribution because both the domestic like product and the subject imports were sold to end users.63 The domestic like product and imports from all subject countries were present in the U.S. market throughout the period examined.
Imports from all seven subject countries were eligible for cumulation for all determinations in the first reviews because the CBERA exception to cumulation is only applicable in original investigations.64 Based on the record, the Commission did not find that subject imports from any of the subject countries were likely to have no discernible adverse impact on the domestic industry in the event of revocation of the orders covering those imports. The Commission found that, during the period of review, each of the countries’ industries had exported substantial quantities of subject merchandise, most of the industries in those countries had substantial excess capacity, and several of the industries had expanded their capacity.65
The Commission also found that there would likely be a reasonable overlap of competition among subject imports from each subject country and the domestic like product,
(…Continued) subject imports in five‐year reviews); Nucor Corp. v. United States, 569 F. Supp. 2d 1328, 1337‐38 (Ct. Int’l Trade 2008).
61 Original Determinations, USITC Pub. 3546 at 23. For purposes of the determination on subject imports from Trinidad and Tobago, the Commission did not cumulate subject imports from Trinidad and Tobago with any other subject imports. The statute precluded such cumulation in the original investigations because Trinidad and Tobago was a beneficiary country under the Caribbean Basin Economic Recovery Act (CBERA). Original Determinations, USITC Pub. 3546 at 18.
62 Original Determinations, USITC Pub. 3546 at 22. 63 Original Determinations, USITC Pub. 3546 at 22. 64 First Review Determinations, USITC Pub. 4014 at 12. 65 First Review Determinations, USITC Pub. 4014 at 14. Not all participating Commissioners
found it necessary to reach this issue with respect to every subject country. See id. at 12 n.64 (Commissioner Pearson), at 14 n.76 (Commissioner Okun and Commissioner Pearson).

14
as well as between subject imports from each country. With respect to fungibility, it found that domestically produced wire rod and wire rod from each of the subject sources was at least sometimes interchangeable. The Commission found sufficient geographic overlap and an overlap of channels of distribution because the domestic like product and imports from subject sources other than Trinidad and Tobago were predominantly sold directly to end users and sold throughout the United States.66 The Commission stated that the absence from the U.S. market of imports from several of the subject countries during the bulk of the period of review was influenced by the imposition of the orders and that upon revocation subject imports would likely be simultaneously present in the market as they were during the original investigations.67
The Commission also found that there were no significant differences in the likely conditions of competition among imports from all subject sources other than Canada.68 The Commission stated that record information indicated that the industry in each of these countries produces a product mix focusing heavily on low‐carbon and high‐carbon industrial grade products, that each of the subject countries had largely similar volume trends during the period, that the market penetration for five of the six countries increased during the original investigations and the remaining country’s market penetration was unchanged, and that each of the subject countries has significant quantities of unused capacity during portions of the period of review.69 Thus, it exercised its discretion to cumulate the subject imports from all of the subject countries, except for Canada.70
B. Likelihood of No Discernible Adverse Impact
The statute precludes cumulation if the Commission finds that subject imports from a country are likely to have no discernible adverse impact on the domestic industry.71 Neither the statute nor the Uruguay Round Agreements Act (“URAA”) Statement of Administrative Action (“SAA”) provides specific guidance on what factors the Commission is to consider in
66 First Review Determinations, USITC Pub. 4014 at 16. 67 First Review Determinations, USITC Pub. 4014 at 14. 68 Two Commissioners did not join this discussion and two joined it in part. First Review
Determinations, USITC Pub. 4014 at 17 n.100 (Commissioner Lane and Commissioner Pinkert). First Review Determinations, USITC Pub. 4014 at 19 n.111 (Commissioner Okun and Commissioner Pearson).
69 First Review Determinations, USITC Pub. 4014 at 19. 70 First Review Determinations, USITC Pub. 4014 at 19. The Commission determined that subject
imports from Canada were likely to compete in the U.S. market under sufficiently different conditions of competition than imports from the other subject countries and therefore declined to exercise its discretion to cumulate subject imports from Canada with any other subject imports. First Review Determinations, USITC Pub. 4014 at 18. The Commission concluded that subject imports from Canada had exhibited different volume trends since the imposition of the orders, different trends in capacity, different pricing patterns, and a different product mix tending toward more specialized products. First Review Determinations, USITC Pub. 4014 at 18‐19.
71 19 U.S.C. § 1675a(a)(7).

15
determining that imports “are likely to have no discernible adverse impact” on the domestic industry.72 With respect to this provision, the Commission generally considers the likely volume of subject imports and the likely impact of those imports on the domestic industry within a reasonably foreseeable time if the orders are revoked. Our analysis for each of the subject countries takes into account, among other things, the nature of the product and the behavior of subject imports in the original investigations.
Brazil. In the original investigations, the quantity of subject imports from Brazil increased from *** short tons in 1999 to *** short tons in 2001.73 In the first reviews, the only subject imports from Brazil were *** short tons in 2002.74 In the current reviews, there were no subject imports from Brazil.75
In these reviews, the Commission received one response to its foreign producer questionnaire from ArcelorMittal Brasil, which is estimated to account for *** percent of Brazilian wire rod production in 2013 and is affiliated with the ArcelorMittal group.76 According to ***, production capacity in Brazil increased from *** short tons in 2008 to *** short tons in 2009, and then remained constant until 2013.77 Capacity is projected to increase to *** short tons in 2014 and *** short tons in 2015 as three new mills are projected to come online in Brazil during 2014‐2015.78 *** reported production in Brazil of *** short tons in 2013, or *** percent of published capacity.79 The percentage of subject wire rod shipments exported by the reporting Brazilian producer ranged from *** percent in 2013 to *** percent in 2009.80 According to Global Trade Atlas data, the United States, Argentina, and Korea were the largest export markets for wire rod from Brazil in 2013.81
72 SAA, H.R. Rep. No. 103‐316, vol. I at 887 (1994). 73 CR/PR at Appendix C (reproduction of Table I‐1 of the Commission Report from the first
review determinations). 74 CR/PR at Appendix C (reproduction of Table I‐1 of the Commission Report from the first
review determinations). There were imports of grade 1080 tire cord/bead from Brazil. CR at IV‐17, PR at IV‐13‐IV‐14.
75 CR/PR at Table I‐1. 76 CR at IV‐17, PR at IV‐13‐IV‐14; CR/PR at Table I‐11. The following five firms were identified by
the parties as currently operating producers of wire rod in Brazil: ArcelorMittal Brasil, Votorantim Metals/Barra Mansa, Companhia Siderurgica Nacional, Gerdau Acos Brazil, and Villares Metals. CR at IV‐17, PR at IV‐13. Gerdau Acos Brasil and ArcelorMittal Brasil together are estimated to account for *** percent of total wire rod capacity in Brazil. CR at IV‐17, PR at IV‐13.
77 CR/PR at Table IV‐7. *** data for 2013 are estimates. Reported production capacity was *** short tons throughout the period of review. CR/PR at Table IV‐8. See below for discussion of the coverage of the *** data.
78 CR/PR at Table IV‐7. The three mills are GV do Brasil (2014), CSN (2014), and Siderurgica Latino‐Americana S/A (Silat) (2015).
79 CR/PR at Table IV‐7; CR at IV‐19, PR at IV‐15. Reported production was *** short tons in 2013, or *** percent of capacity. CR/PR at Table IV‐8.
80 CR/PR at Table IV‐8. 81 CR/PR at Table IV‐10. The *** and Global Trade Atlas data include grade 1080 tire cord and
tire bead wire rod and 4.75 mm wire rod, which are not subject merchandise, and therefore the (Continued…)

16
Based on the record, including information on the size of the wire rod industry in Brazil, its substantial unused capacity, its exports, and its additional capacity coming online in the reasonably foreseeable future, we do not find that subject imports from Brazil would likely have no discernible adverse impact on the domestic industry if the orders were revoked.
Indonesia. In the original investigations, the quantity of subject imports from Indonesia increased from 69,805 short tons in 1999 to 86,940 short tons in 2000, and then declined to 60,065 short tons in 2001.82 In the first reviews, subject imports from Indonesia declined to 40,863 short tons in 2002 and were present thereafter only in 2004, when they were 29,937 short tons.83 There were no subject imports from Indonesia during the current reviews.
The Commission received one response to its questionnaires from PT Ispat Indo, which is estimated to account for *** percent of Indonesian wire rod production in 2013.84 According to ***, production capacity in Indonesia was *** short tons throughout the period of review and is projected to remain constant through 2015.85 *** reported production of *** short tons in 2013, or *** percent of published capacity.86 The percentage of subject wire rod shipments exported by the reporting Indonesian producer ranged from *** percent in 2012 to *** percent in 2008.87 According to Global Trade Atlas data, Australia and Bangladesh were the largest export markets for wire rod from Indonesia in 2012.88
Based on the record, including information indicating substantial unused capacity, we do not find that subject imports from Indonesia would likely have no discernible adverse impact on the domestic industry if the order was revoked.
(…Continued) capacity, production, and export data they provide overstate the quantities of subject merchandise. Id. As discussed above, there were no subject imports of wire rod from the United States during the period of review and, therefore, all exports to the United States from Brazil consisted of nonsubject merchandise. Nevertheless, the fact that the United States was the largest export market for shipments of nonsubect wire rod from Brazil throughout the period of review demonstrates that Brazilian producers of wire rod remain interested in the U.S. market. CR/PR at Table IV‐10.
82Original Determinations, USITC Pub. 3546, USITC Report at Table I‐1. 83 First Review Determinations, USITC Pub. 4014, USITC Report at Table I‐1. 84 CR at IV‐29, PR at IV‐20. According to *** there are six firms in Indonesia that maintain wire
rod rolling capacity: Gunung Garuda (estimated *** short tons of capacity), PT Ispat Indo (estimated *** short tons of capacity), PT Krakatau Steel (estimated *** short tons of capacity), Growth Sumatra (estimated *** short tons of capacity), Hanil Jaya Metalworks (estimated *** short tons of capacity), and Budidharma Jakarta (estimated *** short tons of capacity). CR at IV‐28, PR at IV‐19.
85 CR/PR at Table IV‐12. *** data for 2013 are estimates. Master Steel reports an ongoing modernization and expansion project including a 500,000 metric ton wire rod and bar combi‐mill. CR at IV‐29 n.23, PR at IV‐20 n.23. As previously stated, *** and Global Trade Atlas data include some nonsubject wire rod and therefore may overstate capacity, production, and exports of subject merchandise. Reported production capacity was *** short tons throughout the period of review. CR/PR at Table IV‐13.
86 CR/PR at Table IV‐2; CR at IV‐30, PR at IV‐21. Reported production was *** short tons in 2013, or *** percent of capacity. CR/PR at Table IV‐13.
87 CR at Table IV‐13. 88 CR/PR at Table IV‐14. Global Trade Atlas data for Indonesia are not yet available for 2013.

17
Mexico. In the original investigations, the quantity of subject imports from Mexico increased from 122,038 short tons in 1999 to 266,925 short tons in 2001.89 In the first reviews, subject imports from Mexico declined to 123,380 short tons in 2002, declined further in 2003, rose to 68,498 short tons in 2004, and did not exceed 11,480 short tons from 2005 to 2007.90 In the current reviews, subject imports from Mexico increased from *** short tons in 2008 to *** short tons in 2010, declined to *** short tons in 2011, increased to *** short tons in 2012, and declined to *** short tons in 2013.91 During the period of review, the share of the quantity of apparent U.S. consumption represented by subject imports from Mexico was never greater than *** percent.92
The Commission received responses to its questionnaires from three producers that appear to have accounted for all or nearly all subject wire rod production in Mexico during 2013: Deacero, Ternium, and ArcelorMittal las Truchas.93 ArcelorMittal las Truchas is affiliated with the ArcelorMittal group.94 Reported capacity in Mexico increased irregularly from 2.4 million short tons in 2008 to 2.8 million short tons in 2013.95 The reported capacity utilization of the Mexican producers during the period of review ranged from *** percent in 2011 to *** percent in 2013.96 The percentage of subject wire rod shipments exported by the reporting Mexican producers ranged from *** percent in 2009 to *** percent in 2011.97 According to Global Trade Atlas data, Colombia and Canada were the largest export markets for wire rod from Mexico in 2013.98
89 Original Determinations, USITC Pub. 3546, USITC Report at Table I‐1. 90 First Review Determinations, USITC Pub. 4014, USITC Report at Table I‐1. 91 CR/PR at Table C‐1. Imports from Mexican producer Deacero of nonsubject 4.75 mm wire rod
increased from *** short tons in 2008 to *** short tons in 2010, declined to *** short tons in 2011, and then declined sharply to *** short tons in 2013. CR/PR at Table E‐1. Domestic interested parties argue that the Commission should treat Deacero’s shipments of 4.75 mm wire rod to the United States as subject imports. See, e.g., Gerdau Parties’ Prehearing Brief at 25‐26. We are under no obligation to treat Deacero’s 4.75 mm shipments of wire rod to the United States as subject imports because, as explained in section II of this opinion, 4.75 mm wire rod was not originally within the scope of these reviews and the latest Commerce decision does not include 4.75 mm wire rod within the scope. Notwithstanding that it is nonsubject merchandise, Deacero’s shipments to the United States of 4.75 mm wire rod, which it acknowledges is largely substitutable for subject merchandise, shows a continued interest in the U.S. market. Tr. at 19 (Campbell).
92 CR/PR at Table C‐1. 93 CR at IV‐39 – IV‐40, PR at IV‐25. The coverage ratio is a comparison of questionnaire data with
*** data. We note there is additional production of wire rod by Talleros y Aceros and by Simec. CR at IV‐39 nn.32 and 33, PR at IV‐25 nn.32 and 33.
94 CR/PR at Table I‐11. 95 CR/PR at Table IV‐17. 96 CR/PR at Table IV‐17. 97 CR/PR at Table IV‐17. 98 CR/PR at Table IV‐19. The Global Trade Atlas data include grade 1080 tire cord and tire bead
wire rod, as well as smaller diameter wire rod produced by Deacero, which are not subject merchandise, and therefore overstate quantities of subject merchandise from Mexico. Id.

18
Based on the record, including information indicating increasing capacity and continued interest in the U.S. market, we do not find that subject imports from Mexico would likely have no discernible adverse impact on the domestic industry if the order were revoked.
Moldova. In the original investigations, the quantity of subject imports from Moldova increased from 190,239 short tons in 1999 to 191,074 short tons in 2000, and then declined to 187,370 short tons in 2001.99 In the first reviews, subject imports from Moldova declined to 18,826 short tons in 2002 and were not present in the U.S. market thereafter.100 In the current reviews, there were no imports of wire rod from Moldova.
Moldova Steel Works (“MSW”), the only known producer of wire rod in Moldova, did not respond to the Commission’s questionnaire in these reviews. According to ***, MSW’s capacity was *** short tons throughout the period of review, and it is projected to remain constant through 2015.101 Domestic interested parties report that MSW exports approximately ***.102 According to Global Trade Atlas data, Romania and Poland were the largest export markets for wire rod from Moldova in 2013.103
Based on the record, including information concerning the industry’s significant export orientation, we do not find that subject imports from Moldova would likely have no discernible adverse impact on the domestic industry if the order was revoked.
Trinidad and Tobago. In the original investigations, the quantity of subject imports from Trinidad and Tobago increased from 341,815 short tons in 1999 to 355,089 short tons in 2001.104 During the first reviews, subject imports from Trinidad and Tobago declined irregularly from 386,419 short tons in 2002 to 95,325 short tons in 2007.105 In the current reviews, there were subject imports of wire rod from Trinidad and Tobago of 21,794 short tons in 2008, but no imports thereafter.106 In 2008, the share of the quantity of apparent U.S. consumption represented by subject imports from Trinidad and Tobago was *** percent.107
ArcelorMittal Point Lisas, the sole producer of wire rod in Trinidad and Tobago, responded to the Commission’s questionnaire.108 ArcelorMittal Point Lisas is affiliated with the ArcelorMittal group.109 Its production capacity was *** short tons throughout the period of review.110 ArcelorMittal Point Lisas’ reported capacity utilization during the period of review
99 Original Determinations, USITC Pub. 3546, USITC Report at Table I‐1. 100 First Review Determinations, USITC Pub. 4014, USITC Report at Table I‐1. 101 CR/PR at Table IV‐21. As previously stated, *** and Global Trade Atlas data include some
nonsubject wire rod and hence may overstate capacity, production, and exports of subject merchandise. 102 CR at IV‐52, PR at IV‐34. 103 CR/PR at Table IV‐22. 104 Original Determinations, USITC Pub. 3546, USITC Report at Table I‐1. 105 First Review Determinations, USITC Pub. 4014, USITC Report at Table I‐1. 106 CR/PR at Table C‐1. 107 CR/PR at Table C‐1. 108 CR at IV‐52, PR at IV‐34. 109 CR/PR at Table I‐11. 110 CR/PR at Table IV‐25.

19
ranged from *** percent in 2009 to *** percent in 2011, and was *** percent in 2013.111 During each year of the period of review, ArcelorMittal Point Lisas exported at least *** percent of its shipments.112 According to Global Trade Atlas data, El Salvador, Nicaragua, France, and Guatemala were the largest export markets for wire rod from Trinidad and Tobago in 2013.113
Based on the record, including information concerning the industry’s significant export orientation and substantial excess capacity, we do not find that subject imports from Trinidad and Tobago would likely have no discernible adverse impact on the domestic industry if the order were revoked.
Ukraine.114 In the original investigations, the quantity of subject imports from Ukraine increased from 193,003 short tons in 1999 to 367,712 short tons in 2000, and then declined to 258,526 short tons in 2001.115 In the first reviews, subject imports from Ukraine declined to 11,159 short tons in 2002 and there were no additional imports from Ukraine other than 738 short tons in 2005.116 During the current reviews, there have been no subject imports of wire rod from Ukraine.
The Commission received responses to its questionnaires from two wire rod producers in Ukraine: ArcelorMittal Kryvyi Rih (“ArcelorMittal KR”) and Yenakiieve.117 It is estimated that these two firms accounted for *** subject wire rod production in Ukraine during 2013.118
ArcelorMittal KR, the largest producer of wire rod in Ukraine during the period of review, is the successor firm to Krivorozhstal, which accounted for *** percent of Ukrainian production of wire rod during the original investigations and *** percent of subject exports to the United States.119 ArcelorMittal KR is affiliated with the ArcelorMittal group.120 In the first
111 CR/PR at Table IV‐24. 112 CR/PR at Table IV‐24. 113 CR/PR at Table IV‐19. The Global Trade Atlas data includes grade 1080 tire cord and tire bead
wire rod, which are not subject merchandise, and data may therefore be overstated. Id. 114 Chairman Williamson and Commissioner Johanson do not join this discussion. See Separate
and Dissenting Views of Chairman Irving A. Williamson and Commission David J. Johanson Regarding Cumulation for Ukraine.
115 Original Determinations, USITC Pub. 3546, USITC Report at Table I‐1. 116 First Review Determinations, USITC Pub. 4014, USITC Report at Table I‐1. 117 CR at IV‐66, PR at IV‐42. 118 CR at IV‐66‐67, PR at IV‐42. *** reported that capacity to produce wire rod in Ukraine was
expected to increase in 2014, but the additional capacity reported by *** is for firms that are not believed to be producers of wire rod in Ukraine (Euro Finance and Donestsk). CR at IV‐66 n.48, PR at IV‐42 n.48; Tr. at 160 (Dimitrova). Domestic producers also assert that Dneprovsky Dzerzhinsky Metallurgical Plant (“DMKD”) is currently completing reconstruction of its rolling mill, which it estimates will result in 181,881 short tons of annual wire rod capacity. See Gerdau Parties’ Posthearing Brief, Exh. 1, at 45‐46; Nucor’s Prehearing Brief, Exh. 14. We observe that *** has not included this capacity in its projections for wire rod capacity in Ukraine through 2015 and that the product mix, target markets, and ramp up time of such a project are uncertain.
119 CR at IV‐65, PR at IV‐41. 120 CR/PR at Table I‐11.

20
review, the Commission stated the following regarding the likelihood that ArcelorMittal would increase its exports from subject countries in a manner that would impair the operations of its domestic production affiliates:
By contrast, Arcelor Mittal does act as a single entity in the United States. ***. Even assuming arguendo that Arcelor Mittal’s corporate structure will serve to deter it from exporting large additional quantities of subject merchandise upon revocation in light of a desire to protect Arcelor Mittal USA, much of the unused and additional capacity in the subject countries is attributable to countries not controlled by Arcelor Mittal.121
During these reviews, ArcelorMittal acknowledged that the information on the record from the first reviews accurately reflected ArcelorMittal’s current policy and reported the following to the Commission:
ArcelorMittal employs a commercial coordination policy that ***.122
We find that ArcelorMittal’s commercial coordination policy favoring the *** make it unlikely that ArcelorMittal KR will export more than minimal volumes of wire rod to the U.S. market in the reasonably foreseeable future. At the outset, we observe that in 2013 ArcelorMittal USA had significant excess capacity *** short tons to increase its U.S. production to service any orders for ArcelorMittal‐supplied wire rod in the United States. 123 To the extent it supplements domestic supply with imports, ArcelorMittal owns several other mills from which wire rod can be exported to the United States that are more geographically proximate to the United States than ArcelorMittal KR, including facilities in Canada, Mexico, Brazil, and Trinidad and Tobago.124 In accordance with its local supply strategy, the *** of ArcelorMittal’s U.S. imports of wire rod during the period of review were from ***, which were not subject to
121First Review Determinations, EDIS Doc. No. 515654, at 50‐51. Vice Chairman Aranoff and Commissioner Pinkert found that ArcelorMittal would likely balance the interests of its various operations, including its U.S. operations, in deciding whether to export subject merchandise to the United States. Id.at 51 n.216.
122 TR. at 84‐85 (Cannon); CR at III‐19, PR at III‐10 (citing Gerdau Parties’ Posthearing Brief, Exh. 1 at 56‐57).
123 ArcelorMittal USA U.S. Producers’ Questionnaire Response at II‐6. ArcelorMittal USA’s
questionnaire response reported that it ***, which would appear to indicate that it would not need subject imports to supplement local production to supply certain types of wire rod that it did not
produce. ArcelorMittal USA U.S. Producers’ Questionnaire Response at II‐15a (***). ***. 124 CR/PR at Table I‐11 n.2.

21
an order, and to a lesser extent from ***.125 Even in 2010, as ArcelorMittal USA experienced the closure of its Georgetown facility and the idling of its Indiana Harbor facility, resulting in its domestic production plummeting to *** short tons, it was primarily imports from *** that filled the gap in its domestic production.126 Imports from ArcelorMittal affiliates in *** remained at low levels throughout the period of review.127 In addition, there is no evidence that imports from ArcelorMittal affiliates in *** entered the U.S. market during the period of review.128 Given ArcelorMittal’s commercial coordination policy favoring the ***, we find it likely that the large majority of any wire rod imports from ArcelorMittal in the foreseeable future would be from sources proximate to the United States and initiated by ArcelorMittal USA, not initiated by exporting ArcelorMittal entities.
Finally, ArcelorMittal has provided the Commission with an indication of which foreign affiliates in subject countries would consider importing wire rod into the United States should the orders be revoked. ArcelorMittal KR reported ***.129 This stands in sharp contrast to the responses of ***.130
Accordingly, for purposes of our no discernible adverse impact analysis, we find that the volume of any imports of wire rod from Ukrainian producer ArcelorMittal KR is not likely to be above minimal levels in the reasonably foreseeable future.
The only other significant current producer of wire rod in Ukraine, Yenakiieve, has never exported wire rod to the U.S. market.131 In fact, according to information on the record, Yenakiieve did not ship subject wire rod to the Western Hemisphere during the period of review.132 Rather, Yenakiieve has shipped a majority of its production of wire rod to ***.133
125 CR/PR at Table III‐9 (showing that well over *** percent of ArcelorMittal’s imports during the period were from *** and, to a lesser extent, from ***). ArcelorMittal USA has acknowledged that ***. Gerdau Parties’ Posthearing Brief, Exh. 1, at 57.
126 CR/PR at Table III‐9. We observe that ArcelorMittal USA has resumed production in all of its U.S. facilities and in 2013 was the *** largest domestic producer of wire rod at *** short tons.
127 Imports from ArcelorMittal affiliates in *** reached their highest levels for the period at *** short tons in ***. ***.
128 CR/PR at TableIII‐9; ***. 129 ***. 130 ***; ***; ***. 131 Yenakiieve’s Final Comments at 10. Yenakiieve is a member of the Metinvest Group of
Ukrainian steel companies, and Yenakiieve is the only Metinvest company that produces subject wire rod. CR at IV‐73, PR at IV‐44.
132 Yenakiieve’s Posthearing Brief at 3; ***. Yenakiieve reported that it ships wire rod exclusively to its home market and regional export markets, and it did not ***. Id.
133 ***. Yenakiieve has already committed approximately *** of its capacity to home market and European Union purchasers in 2014 and 2015. Yenakiieve’s Posthearing Brief at Exh. 1. The record also shows that exports of wire rod from China have not had a material impact on Yenakiieve’s shipments to its home market and most important regional markets. There have been no shipments of Chinese wire rod in Ukraine during the period of review, and exports of wire rod from China to the European Union have been almost nonexistent since 2009 due to the European Union’s antidumping duty order on wire rod from China. Although imports from China to the Middle East have increased, (Continued…)

22
Yenakiieve provided credible data indicating that these established home and regional export markets and an established customer base offer more attractive transportation and logistical costs than shipments to the United States.134
Yenakiieve’s production capacity has remained unchanged since 2011 at *** short tons.135 Since 2011, Yenakiieve’s capacity utilization has been at least *** percent and was *** percent in 2013.136 Theoretically, even if Yenakiieve were able to operate at 100 percent capacity utilization, its excess capacity of *** short tons equates to only *** percent of apparent U.S. consumption.137 A representative from Yenakiieve testified that if the order on Ukraine was revoked, at most the company would ship 3,000 to 5,000 tons of wire rod per quarter, or roughly 12,000 to 20,000 tons per year.138 In 2013, this amount equated to only *** percent of apparent U.S. consumption.139 Based on the record, we find that even the maximum likely volume of subject imports from Yenakiieve would likely have no discernible adverse impact on the domestic industry within a reasonably foreseeable time if the order is revoked.
Based on the record, including the largest Ukrainian producer’s affiliation with the ArcelorMittal group and the other significant Ukrainian producer’s limited excess capacity and lack of exports of subject merchandise to the Western Hemisphere during the period of review, we find that subject imports from Ukraine would likely have no discernible adverse impact on the domestic industry if the order was revoked.140
(…Continued) Yenakiieve has been able to retain its market share in the Middle East because China cannot satisfy its customers’ demands for shorter lead times. Gerdau Parties’ Prehearing Brief at Exh. 4, Tr. at 100 (Rosenthal); Tr. at 199 (Dimitrova).
134 Yenakiieve’s Posthearing Brief at 11‐12. Domestic producers argued that U.S. prices were $*** Ukrainian export AUVs in 2013, and therefore the United States represents an attractive market for Ukrainian producers of wire rod. See, e.g., Nucor’s Posthearing Brief at 13. Even if we were to assume that Yenakiieve’s lack of a history exporting subject wire rod to the United States and its consequent lack of customer relationships and familiarity with Ukrainian product in the United States would not serve as impediments to Ukrainian exports of wire rod to the United States, Yenakiieve provided a declaration documenting its likely costs of shipments to the United States totaling $*** per ton. Yenakiieve’s Posthearing Brief at Exh. 3 (Declaration of ***). Although domestic producers dispute these estimates establishing that transportation and logistical costs associated with shipments to the United States would negate any alleged price advantages for Ukrainian exports, we find the declarations and other supporting evidence placed on the record by Yenakiieve to be credible.
135 ***. 136 ***. 137 *** & CR/PR at Table C‐1. 138 Tr. at 192 (Dimitrova). 139 CR/PR at Table C‐1. 140 We have considered any combined impact of likely volumes from ArcelorMittal KR and
Yenakiieve and do not find that they rise to the level of having a likely discernible adverse impact on the domestic industry.

23
C. Likelihood of a Reasonable Overlap of Competition
The Commission generally has considered four factors intended to provide a framework for determining whether subject imports compete with each other and with the domestic like product.141 Only a “reasonable overlap” of competition is required.142 In five‐year reviews, the relevant inquiry is whether there likely would be competition even if none currently exists because the subject imports are absent from the U.S. market.143
Fungibility. Wire rod sold in the United States is categorized by quality according to end use, with 11 major types of wire rod identified by the Iron and Steel Society.144 The Commission requested market participants to classify their shipments into seven different categories. Industrial quality wire rod currently accounts for the majority of wire rod consumed in the United States.145
In their questionnaire responses, market participants generally reported that wire rod from different sources was interchangeable. A majority of U.S. producers said wire rod from different sources was always interchangeable in every comparison between the domestic like product and subject imports and between subject imports from different sources.146 A majority of importers reported that wire rod was at least frequently interchangeable in all comparisons between the domestic like product and the subject imports and among subject imports from different sources.147 A majority of purchasers said that wire rod was at least frequently
141 The four factors generally considered by the Commission in assessing whether imports compete with each other and with the domestic like product are as follows: (1) the degree of fungibility between subject imports from different countries and between subject imports and the domestic like product, including consideration of specific customer requirements and other quality‐related questions; (2) the presence of sales or offers to sell in the same geographical markets of imports from different countries and the domestic like product; (3) the existence of common or similar channels of distribution for subject imports from different countries and the domestic like product; and (4) whether subject imports are simultaneously present in the market with one another and the domestic like product. See, e.g., Wieland Werke, AG v. United States, 718 F. Supp. 50 (Ct. Int’l Trade 1989).
142 See Mukand Ltd. v. United States, 937 F. Supp. 910, 916 (Ct. Int’l Trade 1996); Wieland Werke, 718 F. Supp. at 52 (“Completely overlapping markets are not required.”); United States Steel Group v. United States, 873 F. Supp. 673, 685 (Ct. Int’l Trade 1994), aff’d, 96 F.3d 1352 (Fed. Cir. 1996). We note, however, that there have been investigations where the Commission has found an insufficient overlap in competition and has declined to cumulate subject imports. See, e.g., Live Cattle from Canada and Mexico, Inv. Nos. 701‐TA‐386 and 731‐TA‐812‐13 (Preliminary), USITC Pub. 3155 at 15 (Feb. 1999), aff’d sub nom, Ranchers‐Cattlemen Action Legal Foundation v. United States, 74 F. Supp. 2d 1353 (Ct. Int’l Trade 1999); Static Random Access Memory Semiconductors from the Republic of Korea and Taiwan, Inv. Nos. 731‐TA‐761‐62 (Final), USITC Pub. 3098 at 13‐15 (Apr. 1998).
143 See generally, Chefline Corp. v. United States, 219 F. Supp. 2d 1313, 1314 (Ct. Int’l Trade 2002).
144 CR at I‐33, PR at I‐26; CR/PR at Table I‐10. 145 CR at I‐33, PR at I‐26. 146 CR/PR at Table II‐9. 147 CR/PR at Table II‐9.

24
interchangeable in all but one comparison between the domestic like product and the subject imports.148 A majority of purchasers stated that wire rod was at least sometimes interchangeable in comparisons between subject imports from different sources.149
Purchasers were also asked to compare products from different sources with respect to a number of factors. In comparisons between the domestic like product and imports from the subject countries, the majority of purchasers found the domestic like product to be either superior or comparable.150 There were limited purchaser comparisons concerning product factors between subject imports from different sources, but purchasers generally considered the products to be comparable in most aspects.151
The Commission also sought product mix data from the domestic and subject industries, requesting breakouts of shipments in seven different product categories. The domestic industry shipped products in each of the categories, with the two largest being low and medium‐low carbon industrial and standard quality (49.1 percent of 2013 shipments) and high and medium‐high carbon industrial and standard quality (27.9 percent of 2013 shipments).152 For each subject country that reported data, the vast majority of imports or shipments during the period of review were in these two categories.153
Geographic Overlap. Five of ten responding U.S. producers and one of four responding importers from Mexico reported selling nationwide.154 The sole responding importer from Trinidad and Tobago reported that it only sold to U.S. markets *** states.155 All geographic markets in the contiguous 48 states are served by domestic producers and importers of subject merchandise from Mexico.156
Channels of Distribution. The overwhelming majority of domestically produced wire rod is sold directly to end users.157 All wire rod imported from Trinidad and Tobago during the
148 CR/PR at Table II‐9. In one exception, two purchasers reported that the domestic like product and subject imports from Moldova were “always” interchangeable and three purchasers reported that they were “sometimes” interchangeable. Id.
149 CR/PR at Table II‐9. 150 CR/PR at Table II‐8. Pluralities of majorities of purchasers found that domestic like product
was superior to subject imports from Brazil in delivery terms, delivery time, and U.S. transportation costs, superior to subject imports from Indonesia in all factors, superior to subject imports from Mexico in delivery time, superior to subject imports from Moldova in availability, delivery time, extension of credit, and quality exceeds industry standards, and superior to subject imports from Trinidad and Tobago in delivery time, minimum quantity requirements, and technical support/service.
151 CR/PR at Table II‐8 152 CR/PR at Table III‐7. 153 CR/PR at Tables IV‐3, IV‐11, IV‐15, IV‐20, IV‐27, and IV‐32. For each of these countries, the
majority of shipments were in the low carbon industrial category. 154 CR at II‐3, PR at II‐2. 155 CR at II‐3, PR at II‐2. 156 CR/PR at Table II‐2. 157 CR/PR at Table II‐1.

25
period of review was also sold directly to end users.158 Wire rod from Mexico was sold exclusively to end users in 2008 and 2009, was sold mainly to distributors in 2010 and 2011, and was split almost evenly between the two channels in 2012 and 2013.159
Simultaneous Presence in Market. There were no U.S. imports of subject wire rod from Brazil, Indonesia, Moldova, or Ukraine during the period of review. According to official import statistics, subject wire rod was imported from Trinidad and Tobago during four months of 2008 and from Mexico during nine months of that year.160 Subject imports from Mexico entered the U.S. market during at least nine months of every year from 2009 to 2013.161
Analysis. Market participants overwhelmingly find wire rod from different sources to be at least sometimes interchangeable. The large majority of shipments of the domestic like product and imports from subject sources are in industrial quality grades. Both these factors support a finding of fungibility.
The domestic like product and subject imports from Mexico were both predominantly sold directly to end users and sold throughout the United States during the period of review. While imports from several of the subject countries were absent from the U.S. market during the bulk of the period of review, this was likely due to the imposition of the orders. We find that upon revocation, subject imports would likely be simultaneously present in the market as they were during the original investigations and the first year of the first reviews and would likely be sold in overlapping channels of distribution and geographic markets.
No party argued that a reasonable overlap of competition is not likely. In view of this and the foregoing considerations, we conclude that there would likely be a reasonable overlap of competition between the domestic like product and subject imports from all five countries, and among imports from the different subject countries, should the orders be revoked.162
158 CR/PR at Table II‐1. 159 CR/PR at Table II‐1. 160 CR at IV‐13, PR at IV‐10. 161 CR at IV‐13, PR at IV‐10. 162 Chairman Williamson considered subject imports from all six countries at issue in his analysis
of reasonable overlap of competition.

26
D. Likely Conditions of Competition163 164
We do not find significant differences in likely conditions of competition among subject imports from Brazil, Indonesia, Mexico, Moldova, and Trinidad and Tobago. The record in these reviews continues to indicate a lack of significant distinctions in conditions of competition among these subject countries insofar as they might impact competition in the U.S. market. Each subject country continues to focus primarily on low‐carbon and high‐carbon industrial grade wire rod.165 The market penetration of four of the five subject countries increased during the original period of investigation, and the remaining country’s market penetration was unchanged.166 Under the discipline of the orders, imports from each of these subject countries have been considerably below pre‐order levels.167 Moreover, imports from each of the subject countries predominantly undersold the domestic like product in the original investigations and the first reviews, except for subject imports from Mexico, which undersold the domestic like product in 26 of 54 possible comparisons in the first reviews.168 In these reviews, subject imports from Mexico, the only subject imports for which the Commission received pricing product data, undersold the domestic like product in 30 of 37 instances.169 Finally, each of the subject industries continued to have significant quantities of unused capacity during portions of the period of review.170
We considered Deacero’s arguments that the Commission should exercise its discretion not to cumulate subject imports from Mexico, but found them unpersuasive in light of the considerations discussed above. We do not find that Deacero’s sales of nonsubject 4.75 mm wire rod differentiate Mexico from the other subject countries. Deacero itself acknowledges that 4.75 mm wire rod is “substitutable” with subject 5.5 mm wire rod, a product that all U.S.
163 Chairman Williamson joins the discussion, but also finds no significant differences in likely conditions of competition that would warrant not cumulating Ukraine with the other subject countries. As discussed in his dissenting views, he does not find that ArcelorMittal’s corporate policy would prevent substantial imports of steel wire rod from ArcelorMittal KR. Once that issue has been disposed of, Ukraine does not present differences with the other subject countries substantial enough to warrant not exercising his discretion to cumulate all subject countries.
164 Commissioner Johanson does not join this section. As detailed in his dissenting views, he does not exercise his discretion to cumulate subject imports from Mexico with those of the other five countries, based primarily on his finding that the industry in Mexico is characterized by a unique combination of high capacity utilization and low export orientation, and so are likely to compete in the U.S. market under different conditions of competition.
165 CR/PR at Tables IV‐27, IV‐11, IV‐15, and IV‐20. No producer or exporter of subject merchandise from Moldova participated in these reviews, and information available does not indicate that MSW has changed its focus from this type of wire rod since the first reviews. First Review Determinations, USITC Pub. 4014, at 19.
166 First Review Determinations, USITC Pub. 4014, at 19. 167 CR/PR at Tables I‐1 and C‐1. 168 CR at V‐18, nn.15 and 16, PR at V‐12 ‐ V‐13 nn.15 and 16 169 CR/PR at V‐8. 170 CR/PR at Tables IV‐7, IV‐12, IV‐17, and IV‐24; CR at IV‐52, PR at IV‐34.

27
producers and other subject producers sell.171 Also, Deacero’s production of 4.75 mm wire rod, which peaked in 2010 at *** short tons and averaged approximately *** short tons during the period of review, represents only a small fraction of the Mexican industry’s total production capacity of *** short tons in 2013 and its actual production of subject merchandise of *** short tons in that year.172 The pricing data also show that Deacero’s smaller diameter wire rod undersold the domestic like product in *** instances.173 Deacero’s witnesses testified that it undersold the domestic industry’s 5.5 mm wire rod to provide a price incentive on substitutable 4.75 mm wire rod products in order to gain sales and market share in the United States and that it would also ship subject wire rod to the United States if the order was revoked.174 Moreover, the fact that Deacero shipped nonsubject wire rod to the United States during the period of review does not distinguish it from producers in Brazil who also shipped large volumes of nonsubject wire rod to the United States during this period.175
E. Conclusion176
We find that the no discernible adverse impact exception to cumulation applies to subject imports from Ukraine and therefore do not cumulate such imports with subject imports from Brazil, Indonesia, Mexico, Moldova, and Trinidad and Tobago.177 We further find that the no discernible adverse impact exception to cumulation does not apply with respect to subject imports from Brazil, Indonesia, Mexico, Moldova, and Trinidad and Tobago and that there would likely be a reasonable overlap of competition between imports from those countries and the domestic like product as well as among subject imports from each of these countries. We also determine that subject imports from Brazil, Indonesia, Mexico, Moldova, and Trinidad and Tobago would be likely to compete under similar conditions of competition. Accordingly, for the reasons discussed above, we exercise our discretion to cumulate subject imports from Brazil, Indonesia, Mexico, Moldova, and Trinidad and Tobago.
171 Tr. at 20 (Campbell). 172 Deacero’s Foreign Producer Questionnaire Response at II‐12; CR/PR at Table IV‐18. 173 CR at F‐4, PR at F‐3. 174 Tr. at 181‐82 (D. Gutierrez, Campbell); Tr. at 210 (Campbell). 175 CR/PR at Table IV‐10. Moreover, we do not find that Mexico’s geographic proximity to the
United States by itself presents a significant difference in likely conditions of competition. 176 Chairman Williamson joins the discussion below, except he includes Ukraine as well, and
cumulates all six countries. 177 For the reasons discussed above and in the Separate and Dissenting Views of Commissioner
David S. Johanson, Commissioner Johanson exercises his discretion to cumulate subject imports from Brazil, Indonesia, Moldova, Trinidad and Tobago, and Ukraine. He determines that subject imports from Mexico are likely to compete in the U.S. market under different conditions of competition from subject imports of the other five countries, and so does not exercise his discretion to cumulate subject imports from Mexico.

28
Legal Standards IV.
In a five‐year review conducted under section 751(c) of the Tariff Act, Commerce will revoke an antidumping or countervailing duty order unless: (1) it makes a determination that dumping or subsidization is likely to continue or recur and (2) the Commission makes a determination that revocation of the antidumping or countervailing duty order “would be likely to lead to continuation or recurrence of material injury within a reasonably foreseeable time.”178 The SAA states that “under the likelihood standard, the Commission will engage in a counterfactual analysis; it must decide the likely impact in the reasonably foreseeable future of an important change in the status quo – the revocation or termination of a proceeding and the elimination of its restraining effects on volumes and prices of imports.”179 Thus, the likelihood standard is prospective in nature.180 The CIT has found that “likely,” as used in the five‐year review provisions of the Act, means “probable,” and the Commission applies that standard in five‐year reviews.181
The statute states that “the Commission shall consider that the effects of revocation or termination may not be imminent, but may manifest themselves only over a longer period of time.”182 According to the SAA, a “‘reasonably foreseeable time’ will vary from case‐to‐case, but normally will exceed the ‘imminent’ timeframe applicable in a threat of injury analysis in original investigations.”183
178 19 U.S.C. § 1675a(a). 179 SAA at 883‐84. The SAA states that “{t}he likelihood of injury standard applies regardless of
the nature of the Commission’s original determination (material injury, threat of material injury, or material retardation of an industry). Likewise, the standard applies to suspended investigations that were never completed.” Id. at 883.
180 While the SAA states that “a separate determination regarding current material injury is not necessary,” it indicates that “the Commission may consider relevant factors such as current and likely continued depressed shipment levels and current and likely continued {sic} prices for the domestic like product in the U.S. market in making its determination of the likelihood of continuation or recurrence of material injury if the order is revoked.” SAA at 884.
181 See NMB Singapore Ltd. v. United States, 288 F. Supp. 2d 1306, 1352 (Ct. Int’l Trade 2003) (“‘likely’ means probable within the context of 19 U.S.C. § 1675(c) and 19 U.S.C. § 1675a(a)”), aff’d mem., 140 Fed. Appx. 268 (Fed. Cir. 2005); Nippon Steel Corp. v. United States, 26 CIT 1416, 1419 (2002) (same); Usinor Industeel, S.A. v. United States, 26 CIT 1402, 1404 nn.3, 6 (2002) (“more likely than not” standard is “consistent with the court’s opinion;” “the court has not interpreted ‘likely’ to imply any particular degree of ‘certainty’”); Indorama Chemicals (Thailand) Ltd. v. United States, 26 CIT 1059, 1070 (2002) (“standard is based on a likelihood of continuation or recurrence of injury, not a certainty”); Usinor v. United States, 26 CIT 767, 794 (2002) (“‘likely’ is tantamount to ‘probable,’ not merely ‘possible’”).
182 19 U.S.C. § 1675a(a)(5). 183 SAA at 887. Among the factors that the Commission should consider in this regard are “the
fungibility or differentiation within the product in question, the level of substitutability between the imported and domestic products, the channels of distribution used, the methods of contracting (such as spot sales or long‐term contracts), and lead times for delivery of goods, as well as other factors that may (Continued…)

29
Although the standard in a five‐year review is not the same as the standard applied in an original investigation, it contains some of the same fundamental elements. The statute provides that the Commission is to “consider the likely volume, price effect, and impact of imports of the subject merchandise on the industry if the orders are revoked or the suspended investigation is terminated.”184 It directs the Commission to take into account its prior injury determination, whether any improvement in the state of the industry is related to the order or the suspension agreement under review, whether the industry is vulnerable to material injury if the orders are revoked or a suspension agreement is terminated, and any findings by Commerce regarding duty absorption pursuant to 19 U.S.C. § 1675(a)(4).185 The statute further provides that the presence or absence of any factor that the Commission is required to consider shall not necessarily give decisive guidance with respect to the Commission’s determination.186
In evaluating the likely volume of imports of subject merchandise if the orders under review are revoked and/or a suspended investigation is terminated, the Commission is directed to consider whether the likely volume of imports would be significant either in absolute terms or relative to production or consumption in the United States.187 In doing so, the Commission must consider “all relevant economic factors,” including four enumerated factors: (1) any likely increase in production capacity or existing unused production capacity in the exporting country; (2) existing inventories of the subject merchandise, or likely increases in inventories; (3) the existence of barriers to the importation of the subject merchandise into countries other than the United States; and (4) the potential for product shifting if production facilities in the foreign country, which can be used to produce the subject merchandise, are currently being used to produce other products.188
In evaluating the likely price effects of subject imports if the orders under review are revoked and/or a suspended investigation is terminated, the Commission is directed to consider whether there is likely to be significant underselling by the subject imports as compared to the domestic like product and whether the subject imports are likely to enter the United States at prices that otherwise would have a significant depressing or suppressing effect on the price of the domestic like product.189
(…Continued) only manifest themselves in the longer term, such as planned investment and the shifting of production facilities.” Id.
184 19 U.S.C. § 1675a(a)(1). 185 19 U.S.C. § 1675a(a)(1). No duty absorption findings have been made for any of the subject
countries. CR at I‐19 n. 19; PR at I‐15 n. 19. 186 19 U.S.C. § 1675a(a)(5). Although the Commission must consider all factors, no one factor is
necessarily dispositive. SAA at 886. 187 19 U.S.C. § 1675a(a)(2). 188 19 U.S.C. § 1675a(a)(2)(A‐D). 189 See 19 U.S.C. § 1675a(a)(3). The SAA states that “{c}onsistent with its practice in
investigations, in considering the likely price effects of imports in the event of revocation and termination, the Commission may rely on circumstantial, as well as direct, evidence of the adverse effects of unfairly traded imports on domestic prices.” SAA at 886.
30
In evaluating the likely impact of imports of subject merchandise if the orders under review are revoked and/or a suspended investigation is terminated, the Commission is directed to consider all relevant economic factors that are likely to have a bearing on the state of the industry in the United States, including but not limited to the following: (1) likely declines in output, sales, market share, profits, productivity, return on investments, and utilization of capacity; (2) likely negative effects on cash flow, inventories, employment, wages, growth, ability to raise capital, and investment; and (3) likely negative effects on the existing development and production efforts of the industry, including efforts to develop a derivative or more advanced version of the domestic like product.190 All relevant economic factors are to be considered within the context of the business cycle and the conditions of competition that are distinctive to the industry. As instructed by the statute, we have considered the extent to which any improvement in the state of the domestic industry is related to the orders under review and whether the industry is vulnerable to material injury upon revocation.191
Findings from the Original Investigations and Prior Reviews V.
A. Conditions of Competition
Original Investigations. In the original determinations, the Commission characterized wire rod as an intermediate product used to make a variety of products. It found that there was a continuum of wire rod products.192 Apparent U.S. consumption of wire rod, measured by quantity, declined from 1999 to 2001. Purchasers asserted that a reason for the decline in demand was increased imports of downstream products incorporating wire rod.193 At the time of the original determinations, the domestic industry consisted of 12 producers. The producers were dispersed geographically, and most individual producers produced a variety of products. Five domestic producers experienced bankruptcies or partial to full shutdowns of their wire rod operations late in the period of investigation.194
The Commission noted that most purchasers reported that subject imports from most sources and the domestic like product were used in the same applications. Purchasers identified quality, price, and availability, in that order, as the most important factors in selecting a supplier.195 The share of the U.S. market held by nonsubject imports was relatively stable from 1999 to 2001. Wire rod imports from all countries except Canada and Mexico were
190 19 U.S.C. § 1675a(a)(4). 191 The SAA states that in assessing whether the domestic industry is vulnerable to injury if the
order is revoked, the Commission “considers, in addition to imports, other factors that may be contributing to overall injury. While these factors, in some cases, may account for the injury to the domestic industry, they may also demonstrate that an industry is facing difficulties from a variety of sources and is vulnerable to dumped or subsidized imports.” SAA at 885.
192 Original Determinations, USITC Pub. 3546 at 23. 193 Original Determinations, USITC Pub. 3546 at 24. 194 Original Determinations, USITC Pub. 3546 at 24. 195 Original Determinations, USITC Pub. 3546 at 25.

31
subject to a tariff rate quota that the President imposed affective March 1, 2000 as a safeguard measure under section 203(a)(3) of the Trade Act of 1974.196
First Reviews. In the first reviews apparent U.S. consumption of wire rod, measured by quantity, was lower at the end of the period than at its inception, but fluctuated on an annual basis.197 Market participants cited several different reasons for decreases in U.S. demand, including declines in construction activity, a weakened U.S. automotive market, and increases in imports of finished downstream wire products.198 During that review period, several U.S. firms declared bankruptcy or closed operations, while others reorganized or merged.199 Several U.S. producers expanded or made improvements to their production operations, and as a result, domestic capacity was greater at the end of the reviews than during the original investigations.200 Two significant domestic wire rod producers, ArcelorMittal USA and Gerdau Ameristeel, were affiliated with producers of subject merchandise.201
The Commission noted that most market participants reported that subject imports from most sources and the domestic like product were highly substitutable, particularly for industrial grades.202 Low carbon industrial quality wire rod constituted the majority of shipments by the domestic industry and from all subject countries except for Canada.203 The share of the U.S. market held by nonsubject imports dropped sharply in 2007 due to a change in Chinese export tax policies affecting wire rod.204 Throughout the period, subject imports supplied smaller quantities of wire rod to the U.S. market than did either the domestic industry or nonsubject sources, and Canada continued to be the largest supplier of subject imports.205
B. Volume of Subject Imports
Original Investigations. In the original investigations, the Commission found that cumulated subject import volume and market penetration rose during the period of investigation. The volume of subject imports increased from 2000 to 2001 despite a simultaneous decline in apparent U.S. consumption. The Commission further found that the increase in market share by cumulated subject imports came at the expense of the domestic industry. Accordingly, the Commission found the volume of cumulated subject imports, and the increase in that volume, to be significant both in absolute terms and relative to production and consumption in the United States.206 With respect to Trinidad and Tobago, the Commission
196 Original Determinations, USITC Pub. 3546 at 25‐26. 197 First Review Determinations, USITC Pub. 4014 at 25. 198 Id. 199 Id. at 26. 200 Id. 201 Id. 202 Id. at 27. 203 Id. 204 Id. 205 Id. 206 Original Determinations, USITC Pub. 3546 at 27‐28.

32
observed that that country was the second or third largest source of subject imports throughout the period of investigation. It indicated that the volume and market penetration of subject imports from Trinidad and Tobago increased during the period of investigation and that these subject imports were concentrated in low carbon industrial quality products, which was a very price sensitive market. The Commission found that, in light of the price‐sensitive market, the volume of subject imports from Trinidad and Tobago was significant.207
First Reviews. In the first review determinations, the Commission found that the orders had a substantial restraining effect on imports from the subject countries as the quantity of subject imports and their share of apparent U.S. consumption fell sharply after the imposition of the orders.208 The Commission further found that the industries in the subject countries were substantial and that there was considerable unused capacity.209 It found that the United States was the world’s largest single market for wire rod in 2006, that the cumulated subject countries exported substantial quantities of wire rod during the period of review, and that the United States had been among the highest‐priced markets during most of the review period.210 Accordingly, the Commission determined that producers in the subject countries would be likely to direct substantial quantities of unused and new capacity to the U.S. market if the orders were revoked.211
In doing so, the Commission rejected respondents’ argument that the United States was an unattractive market because prices were lower than in other markets, finding that significant excess capacity allowed subject producers to supply the U.S. market without diverting exports from any other markets and that no respondent had argued that a subject producer could not profitably sell subject merchandise in the United States upon revocation.212 The Commission likewise rejected respondents’ arguments that Gerdau and ArcelorMittal would not likely increase exports in a manner that would impair the operations of their domestic production affiliates. Specifically, the Commission found that, given that Gerdau did not act as a single entity, the record did not support respondents’ assertions that its affiliation with a U.S. producer would materially restrain its exports to the United States. While the Commission found that ArcelorMittal did act as a single entity in the United States, it found that, even assuming that ArcelorMittal’s corporate structure would deter it from exporting large quantities of subject merchandise upon revocation, much of the unused and additional capacity in the subject countries was attributable to companies not controlled by ArcelorMittal.213
207 Original Determinations, USITC Pub. 3546 at 36‐37. 208 First Review Determinations, USITC Pub. 4014 at 28. 209 First Review Determinations, USITC Pub. 4014 at 29‐30. 210 First Review Determinations, USITC Pub. 4014 at 31. 211 First Review Determinations, USITC Pub. 4014 at 30‐31. 212 First Review Determinations, USITC Pub. 4014 at 31. 213 First Review Determinations, USITC Pub. 4014 at 31‐32.

33
C. Price Effects
Original Investigations. In the original investigations, the Commission found significant underselling of the domestic like product by cumulated subject imports. Cumulated subject imports undersold the domestic like product in approximately two‐thirds of all comparisons, and the Commission highlighted the consistently high underselling margins of subject imports from Brazil, Moldova, and Ukraine. The Commission further concluded that the subject imports suppressed prices to a significant degree, as the domestic industry could not raise prices to cover increased costs.214 With respect to Trinidad and Tobago, the Commission emphasized the nature of the price competition and found that both the domestic like product and subject imports from Trinidad and Tobago were concentrated in the price‐sensitive low carbon industrial quality category.215 The Commission found significant underselling, with subject imports from Trinidad and Tobago underselling the domestic like product in 70.8 percent of quarterly comparisons. It further found that subject imports from Trinidad and Tobago had significant price‐suppressing effects, for reasons paralleling those presented in the cumulated analysis.216
First Reviews. In the first review determinations, the Commission found that price played an important role in purchasing decisions and that the industrial grades of wire rod, in which both the domestic like product and cumulated subject imports tended to be concentrated and considered good substitutes, were highly price sensitive.217 The Commission found that, upon revocation, the quantities of additional cumulated subject imports would likely exceed greatly any amount needed to rectify short supply conditions and, therefore, importers would need to sell on the basis of price. In light of the likely volume of cumulated subject imports and their historic pattern of underselling, the Commission concluded that significant underselling was likely upon revocation. It further found that cumulated subject imports would also likely have significant price‐suppressing or ‐depressing effects. The Commission observed that raw material costs and the ratio of cost of goods sold to net sales increased during the review period and that significant quantities of low‐priced subject imports would likely exacerbate the domestic industry’s inability to raise prices commensurately with increases in costs. Thus, the Commission concluded that cumulated subject imports were likely to have significant price effects.218
D. Impact
Original Investigations. In the original investigations, the Commission found that the domestic industry lost market share as the volume of cumulated subject imports increased.
214 Original Determinations, USITC Pub. 3546 at 29‐30. 215 Original Determinations, USITC Pub. 3546 at 37. 216 Original Determinations, USITC Pub. 3546 at 37‐38. 217 First Review Determinations, USITC Pub. 4014 at 33. Price was characterized as a “very
important” purchasing factor by 38 out of 41 purchasers. Id. at Table II‐4. 218 First Review Determinations, USITC Pub. 4014 at 33‐34.

34
Indicators such as production, domestic shipments, and capacity utilization declined from 1999 to 2000 and fell more sharply from 2000 to 2001. The Commission emphasized the domestic industry’s increasing operating losses and noted declines in employment‐related indicators. The Commission determined that, while other factors contributed to the domestic industry’s financial problems, cumulated subject imports played a significant role in the adverse market conditions facing the domestic industry, including the loss of sales and market share to lower‐priced subject imports. It consequently concluded that cumulated subject imports had a significant impact on the domestic industry.219 The discussion regarding the impact of subject imports from Trinidad and Tobago referenced the discussion of cumulated subject imports.220
First Reviews. In the first reviews, the Commission found that the domestic industry’s capacity had increased irregularly over the period of review, observing that one producer began production operations, another restarted production in a previously closed facility, and two domestic producers anticipated further increasing their capacities in 2008 or 2009.221 The Commission observed that the domestic industry’s production fluctuated within a narrow range during the period of review and that capacity utilization declined because capacity increased more rapidly than production.222 The domestic industry’s U.S. shipments and employment levels fluctuated during the period of review while inventories declined.223 In contrast to the original investigations, the domestic industry generally operated profitably during the period of review, although operating performance fluctuated considerably on an annual basis.224 The Commission attributed these improvements to the orders.225 The Commission found that, if the antidumping and countervailing duty orders were revoked, a significant volume of additional cumulated subject imports would likely enter the U.S. market and undersell the domestic like product, having significant price‐suppressing or ‐depressing effects.226 The Commission determined that the additional imports would likely be significantly greater than needed to rectify any existing supply shortages in the U.S. market and that, given that demand was at its lowest level of the period of review in 2007 and was reportedly expected to decline further, additional imports would not be absorbed by increasing demand.227 Accordingly, the Commission concluded that revocation of the antidumping and countervailing duty orders would likely have a significant adverse impact on the domestic industry’s output, sales, market share, employment, profits, and return on investment.228
219 Original Determinations, USITC Pub. 3546 at 31‐33. 220 Original Determinations, USITC Pub. 3546 at 38. 221 First Review Determinations, USITC Pub. 4014 at 35. 222 First Review Determinations, USITC Pub. 4014 at 35. Capacity utilization was at a period high
of 84.6 percent in 2002 and reached a period low of 69.4 percent in 2005 before increasing to 74.9 percent in 2007. Id.
223 First Review Determinations, USITC Pub. 4014 at 35. 224 First Review Determinations, USITC Pub. 4014 at 35. 225 First Review Determinations, USITC Pub. 4014 at 36. 226 First Review Determinations, USITC Pub. 4014 at 36. 227 First Review Determinations, USITC Pub. 4014 at 36. 228 First Review Determinations, USITC Pub. 4014 at 36.
35
Conditions of Competition and the Business Cycle VI.
In evaluating the likely impact of the subject imports on the domestic industry if an order is revoked, the statute directs the Commission to consider all relevant economic factors “within the context of the business cycle and conditions of competition that are distinctive to the affected industry.”229 The following conditions of competition inform our determinations.
A. Demand Conditions
Wire rod continues to be used as an intermediate product. Most wire rod is sold, or internally transferred, to wire drawers that produce a wide variety of wire products.230 Consequently, demand for wire rod depends on demand for these many downstream products.231 Wire rod is used primarily in the construction, automotive, energy, and agriculture industries.232
Apparent U.S. consumption of wire rod fluctuated during the period of review. Apparent U.S. consumption in 2013 was *** percent below the pre‐recession levels of 2008.233 During the general economic recession, apparent U.S. consumption fell from *** short tons in 2008 to *** short tons in 2009, before increasing in 2010 and 2011 to *** short tons and *** short tons, respectively.234 Apparent U.S. consumption increased to *** short tons in 2012 before declining slightly to 5.30 million short tons in 2013.235
The majority of market participants noted the negative effect of the 2009 recession, with some indicating that, despite some recovery, demand, particularly in the construction market, had not returned to the pre‐recession levels.236 A plurality of firms indicated that demand is expected to increase over the next two years, with a majority reporting that they anticipate demand to increase slowly, particularly in the automotive and construction markets.237 The majority of market participants that responded to the Commission’s questionnaires reported that worldwide demand has fluctuated or decreased since 2008 but anticipate that it will increase or remain unchanged in the future.238 The majority of foreign
229 19 U.S.C. § 1675a(a)(4). 230 CR/PR at II‐1. 231 CR at II‐18 – II‐19, PR at II‐11. Reported end uses include fasteners, wire garment hangers,
wire mesh, nails, concrete reinforcing mesh, baling wire, industrial wire, tire cord/bead, shelving wire, sod staples, suspension springs, and PC strand. Id.
232 CR/PR at II‐1. 233 CR/PR at Table C‐1. 234 CR/PR at Table C‐1. 235 CR/PR at Table C‐1. 236 CR at II‐20, PR at II‐12. 237 CR at II‐21, PR at II‐13. 238 CR/PR at Tables II‐3 and IV‐35

36
producers indicated that demand in their home markets fell during the recession but has generally recovered and is expected to increase.239
B. Supply Conditions
Throughout the period of review, the domestic industry was the largest supplier of wire rod to the U.S. market. The domestic industry’s share of the U.S. market fluctuated during the period of review, ending the period at its lowest level; it was *** percent in 2008, *** percent in 2009, *** percent in 2010, *** percent in 2011, *** percent in 2012, and 67.9 percent in 2013.240 There are ten U.S. producers of wire rod, with seven of these firms internally transferring some of their wire rod production for the manufacture of downstream products.241 The domestic industry’s capacity to produce wire rod fell from 2008 to 2010, increased in 2011, and subsequently fell to a level in 2013 that was 8.5 percent lower than what was reported for 2008. 242 Several U.S. producers reported that they are not operating at full capacity due to market conditions and that import competition limits their ability to produce more wire rod.243
Nonsubject countries are the next largest suppliers to the U.S. wire rod market after the domestic industry. Their share of apparent U.S. consumption declined from 2008 to 2009 but fluctuated upward from 2009 to 2013, for an overall increase of *** percentage points from 2008 to 2013.244 The leading nonsubject source of wire rod imports was China, which accounted for 36.4 percent of total imports in 2013; these imports are subject to ongoing antidumping and countervailing duty investigations.245 Other leading nonsubject sources of wire rod imports include Canada and Japan, which accounted for 28.3 and 15.1 percent, respectively, of total imports in 2013.246
Under the discipline of the orders, subject imports were largely absent from the U.S. market during the period of review. There were no reported U.S. imports of subject wire rod
239 CR at IV‐80, PR at IV‐47. 240 CR/PR at Table C‐1. 241 CR at III‐13, PR at III‐7. 242 CR/PR at Table III‐4. Nucor opened a new wire rod mill at its Darlington, South Carolina
facility in October 2013 and reopened a previously idled facility at Kingman, Arizona. Id. ArcelorMittal’s Georgetown, South Carolina facility, Evraz Pueblo’s Pueblo, Colorado facility, and Keystone’s Peoria, Illinois facility underwent production curtailments and resumptions. CR/PR at III‐1. Gerdau idled the rolling mill at its Perth Amboy, New Jersey facility in ***, and it remains idled. Id. Gerdau also invested in melting and rolling capacity expansions at its Jacksonville, Florida facility during 2008‐2010. Id.
243 CR at III‐9, PR at III‐4. 244 CR at IV‐7, PR at IV‐7; CR/PR at Table C‐1. Nonsubject imports’ share of apparent U.S.
consumption was *** percent in 2008, *** percent in 2009, *** percent in 2010, *** percent in 2011, *** percent in 2012, and 31.9 percent in 2013. CR/PR at Table C‐1.
245 CR/PR at Table IV‐1; CR at IV‐7, PR at IV‐5. See Carbon and Certain Alloy Steel Wire Rod from China, Inv. Nos. 701‐TA‐512 and 731‐TA‐1248 (Preliminary), USITC Publication 4458 (March 2014). The Commission made affirmative preliminary determinations on March 20, 2014. 79 Fed. Reg. 16373 (Mar. 25 2014).
246 CR/PR at Table IV‐2; CR at IV‐7, PR at IV‐5.

37
from Brazil, Indonesia, Moldova, and Ukraine, and subject imports from Trinidad and Tobago ceased after 2008.247 Mexico was the largest supplier of subject imports and the only subject country from which wire rod was imported during each year of the review period.248 Subject imports’ share of the U.S. market fluctuated but remained low throughout the period of review.249
C. Substitutability
Wire rod sold in the United States is categorized by quality according to end use, with 11 major types of wire rod identified by the Iron and Steel Society.250 The Commission requested market participants to classify their shipments into seven different categories. The domestic industry produces wire rod in each of the seven categories. The three largest categories for the domestic industry are low/medium‐low carbon industrial/standard quality (accounting for 49.1 percent of U.S. producers’ U.S. shipments in 2013) followed by high/medium‐high carbon industrial/standard quality (accounting for 27.9 percent of shipments), and cold heading quality (“CHQ”) (accounting for *** percent of shipments).251 Subject imports from Mexico were reported as being only low/medium‐low carbon industrial/standard quality (accounting for *** percent of U.S. importers’ shipments of subject imports in 2013) and high/medium‐high carbon industrial/standard quality (accounting for *** percent of shipments).252 Nonsubject imports were reported in all seven categories; the three largest categories for nonsubject imports were low/medium‐low carbon industrial/standard quality (accounting for 34.2 percent of U.S. importers’ shipments of nonsubject imports in 2013), followed by CHQ (accounting for 25.5 percent of shipments) and high/medium‐high carbon industrial/standard quality (accounting for 18.8 percent of shipments).253 Therefore, there is substantial overlap between the categories of wire rod supplied by the domestic industry, subject imports, and nonsubject imports.
Domestically produced wire rod and subject imports of the same type, particularly in the same industrial quality grades, tend to be highly substitutable.254 For specialty grades, however, not all sources can produce each product, and there may be differences in wire rod with the same specifications that may limit the degree of substitution.255
247 CR at IV‐3, PR at IV‐2; CR/PR at Table IV‐1. 248 CR at IV‐3 – IV‐4, PR at IV‐2; CR/PR at Table IV‐1. 249 CR/PR at Table C‐1. Subject imports’ share of apparent U.S. consumption was *** percent in
2008, *** percent in 2009, *** percent in 2010, *** percent in 2011, *** percent in 2012, and 0.2 percent in 2013. Id.
250 CR at I‐33, PR at I‐26. 251 CR/PR at Table III‐7. 252 CR/PR at Table IV‐3. 253 CR/PR at Table IV‐3. 254 CR at II‐23, PR at II‐14. 255 CR at II‐23 – II‐24, PR at II‐14 – II‐15.

38
D. Other Conditions
The principal inputs used in the U.S. production of wire rod are steel billets (produced from steel scrap), natural gas, and electricity.256 The billets sourced from the United States are produced using minimill technology that melts ferrous scrap and other raw materials in an electric arc furnace.257 The price of steel scrap fluctuated between January 2008 and December 2013, peaking during the last week of July 2008, falling to a period low in the second week of November 2008, increasing irregularly from the end of 2008 through 2010, and then continuing to fluctuate, decreasing slightly from the first week of January 2011 through the last week of December 2013.258 U.S. natural gas prices peaked in mid‐2008 and fell steeply until October 2009 when prices began to rise; prices then decreased irregularly between January 2010 and May 2012 before increasing irregularly through December 2013.259 Electricity prices fluctuated seasonally but with no significant net changes.260
During the period of review, a significant share of domestic production was captively consumed. The domestic industry internally consumed or transferred to related firms more than *** short tons of wire rod in 2013.261 Internal consumption and transfers to related firms accounted for *** percent of the domestic industry’s total shipments in 2008, *** percent in 2009, *** percent in 2010, *** percent in 2011, *** percent in 2012, and *** percent in 2013.262 The *** of such shipments were transferred to related firms, reportedly at market prices.263 Commercial (merchant market) shipments accounted for virtually all of the balance of the domestic industry’s shipments.264
Most U.S. producers and importers set prices on a transaction‐by‐transaction basis.265 However, firms also reported using contracts, set price lists, and other methods, including indexing prices to scrap and other raw material costs as well as market conditions.266
256 CR/PR at V‐1. 257 CR at I‐40, PR at I‐31. 258 CR/PR at V‐1 and Figure V‐1. 259 CR at V‐2 – V‐3, PR at V‐2; CR/PR at Figure V‐2. 260 CR at V‐3, CR/PR at Figure V‐2. 261 Calculated from CR/PR at Table III‐11. We observe that, although several firms reported
internal transfers, a single firm, ***, accounted for the vast majority of the domestic industry’s internal transfers. CR/PR at Table III‐13.
262 CR/PR at Table III‐6. 263 CR/PR at Table III‐6; CR at III‐13 n.10, PR at III‐7 n.10. 264 CR/PR at Table III‐6. 265 CR at V‐5, PR at V‐4; CR/PR at Table V‐1. 266 CR at V‐5, PR at V‐4; CR/PR at Table V‐1.

39
Revocation of the Antidumping and Countervailing Duty Orders on VII.Subject Imports from Brazil, Indonesia, Mexico, Moldova, and Trinidad and Tobago Is Likely to Lead to the Continuation or Recurrence of Material Injury to the Domestic Industry within a Reasonably Foreseeable Time267 268
A. Likely Volume of Subject Imports
As discussed above, under the discipline of the orders, there were very limited volumes of subject imports during the period of review. Cumulated subject imports were *** short tons in 2008, *** short tons in 2009, *** short tons in 2010, *** short tons in 2011, *** short tons in 2012, and 10,333 short tons in 2013.269 Their share of apparent U.S. consumption was *** percent in 2008, *** percent in 2009, *** percent in 2010, *** percent in 2011, *** percent in 2012, and 0.2 percent in 2013.270 271 272
Production capacity in the cumulated subject countries is substantial. The reported aggregate capacity of producers in Brazil, Indonesia, Mexico, Moldova, and Trinidad and Tobago
267 As discussed earlier and in his dissenting views regarding Ukraine, Chairman Williamson cumulates all subject countries. His analysis for the six cumulated countries does not differ in any material respect from the majority’s analysis, which he joins subject to the footnotes below.
268 As discussed earlier and in his Separate and Dissenting Views regarding Mexico, Commissioner Johanson exercises his discretion to cumulate subject imports from Brazil, Indonesia, Moldova, Trinidad and Tobago, and Ukraine, but does not exercise his discretion to cumulate subject imports from Mexico.
269 CR/PR at Table IV‐1. As discussed above, subject imports from Trinidad and Tobago were present in the U.S. market only in 2008; imports of wire rod from Mexico were the only subject imports present in the U.S. market in each year of the period of review. Id.
270 CR/PR at Table C‐1. 271 Chairman Williamson has cumulated subject imports from all six subject countries. His
inclusion of subject imports from Ukraine does not change the data above concerning subject import volumes during the period of review. He joins generally the discussion below, and his addition of Ukraine in his cumulated analysis does not result in any material differences between his analysis and the majority’s. However, his additional consideration of Ukraine’s capacity (reported at *** short tons in 2013), excess capacity (reported at *** short tons in 2013), and export orientation (*** percent of total shipments were exported in 2013) further supports his ultimate conclusion that cumulated subject import volumes will likely be significant if the orders were revoked. See CR/PR at Table IV‐29.
272 Commissioner Johanson has cumulated subject imports from Brazil, Indonesia, Moldova, Trinidad and Tobago, and Ukraine. There were similarly very limited volumes of these cumulated subject imports during the period of review. CR/PR at Table IV‐1. He finds that subject imports for the five countries he has cumulated will likely be equally as significant as the countries that the majority has cumulated because the aggregate capacity in 2013 (*** short tons) was even higher, as was the aggregate excess capacity in 2013 (*** short tons).

40
was *** short tons in 2013.273 Thus, the total reported capacity of producers in cumulated subject countries exceeds the 5.3 million short tons of apparent U.S. consumption in 2013.274 There is also considerable unused capacity in the cumulated subject countries. The reported aggregate excess capacity was *** short tons in 2013.275 Moreover, production capacity is expected to increase in the reasonably foreseeable future.276
We find that producers in the subject countries would likely direct significant quantities of wire rod to the U.S. market should the pertinent orders be revoked. Throughout the period of review, the United States continued to be one of the largest markets for wire rod imports.277 The cumulated subject countries, in the aggregate, exported substantial quantities of wire rod during the period of review.278 In addition, the record in these reviews indicates that the United States has been among the highest priced markets for wire rod during most of the period of
273 CR/PR at Table IV‐6. The “reported” capacity data for Moldova are data published by *** because the sole producer of wire rod in Moldova did not respond to the Commission’s questionnaire in these reviews. Id. at note 1. If we were to rely upon data published by *** and GTIS/GTA for capacity data for the industries in all cumulated subject countries, aggregate capacity would be substantially higher than reported by responding producers in Brazil, Indonesia, Mexico, and Trinidad and Tobago. Published data indicate capacity was *** short tons in 2013. Id. “Published” capacity data for Trinidad and Tobago are the data reported by the Trinidadian producer in questionnaire responses because data from industry monitoring sources were not available. Id. at note 2.
274 CR/PR at Table C‐1. 275 CR/PR at Table IV‐6. As noted above, the “reported” capacity data for Moldova are data
published by ***. Id. at note 1. If we were to rely upon data published by *** and GTIS/GTA for capacity and production data for the industries in all cumulated subject countries, aggregate unused capacity would be substantially higher than reported. Published data indicate unused capacity was *** short tons in 2013. Id. As noted above, published capacity data for Trinidad and Tobago are the data reported by the Trinidadian producer in questionnaire responses. Id. at note 2.
276 Specifically, according to ***, three new mills are forecast to come online in Brazil during 2014‐15, with an estimated combined capacity of approximately *** short tons in 2014 and *** short tons in 2015. CR at IV‐18 – IV‐19, PR at IV‐14. In addition, ***. CR at IV‐23 – IV‐24, PR at IV‐16. Respondent Deacero contends that wire rod capacity in Mexico will decrease as a result of plans to convert capacity in one of its mills from wire rod to special bar quality. Deacero’s Posthearing Brief at 7 (citing Tr. at 140 (Gutierrez)), Exhibit 23 & Responses to Commission’s Questions at 27 (citing Tr. at 227 (Gutierrez)). Deacero, however, has not asserted that this purported conversion will occur in the near future, but rather, its representative testified that any such conversion would be gradual and done slowly. Tr. at 228 (Gutierrez). Accordingly, we rely upon the capacity data reported by Mexican producers in questionnaire responses. Commissioner Johanson does not join the preceding two sentences.
277 CR/PR at Table IV‐40. 278 CR/PR at Tables IV‐8, IV‐10, IV‐13, IV‐14, IV‐17, IV‐19, IV‐22, IV‐24 and IV‐26. The data in
these tables may include some wire products that are not subject merchandise. CR/PR at Tables IV‐10 note, IV‐14 note, IV‐19 note, IV‐22 note and IV‐26 note.

41
review.279 Moreover, we observe that subject producers continue to demonstrate interest in the U.S. market, as is evidenced by their exports of out‐of‐scope wire rod products.280 281 282 This
279 CR/PR at Figure IV‐2 and Table IV‐38. Country‐specific monthly transaction prices for wire rod indicate that Chinese market prices were consistently below U.S. prices. CR/PR at Table IV‐38; CR at IV‐91, PR at IV‐51. Korean wire rod market prices were generally below U.S. prices, with notable exceptions in 2010, 2012, 2013, and 2014. Id. Japanese market prices were generally higher than U.S. market prices in 2009 through the first half of 2012 but consistently lower in 2008 and the latter half of 2012 through the first three months of 2014. Id. Similarly, Canadian market prices were generally higher than U.S. prices in 2009 through the first half of 2013 but generally lower in 2008 and the latter half of 2013 through the first three months of 2014. CR/PR at Table IV‐38. European market prices were higher than U.S. prices for most of 2008 but then consistently lower than U.S. prices from the latter part of 2008 through the first three months of 2014. CR/PR at Figure IV‐2 and Table IV‐38. Although we recognize that these data may not be as precise as pricing data based on specific pricing product definitions, CR at IV‐84, PR at IV‐50, we nonetheless find the data to be demonstrative of the likely attractiveness of the U.S. wire rod market in the reasonably foreseeable future.
280 In particular, the U.S. market continued to be the largest export market for nonsubject wire rod imports from Brazil during the period of review. CR/PR at Table IV‐10. Similarly, subject imports as well as nonsubject wire rod imports from Mexico were present in the U.S. market throughout the period of review, and Deacero itself stated that imports from Mexico maintained a continued “substantial presence” during the review period. CR/PR at Tables IV‐17, IV‐19, C‐1 and Appendix F; Deacero’s Posthearing Brief at 5. Accordingly, notwithstanding Deacero’s assertion that wire rod prices in third countries are higher than U.S. prices, Deacero’s Posthearing Brief at 8‐9 and Prehearing Brief at 23‐26, we find that the persistent presence of wire rod imports from Mexico during the review period demonstrates that the U.S. market continues to be viewed by Mexican producers as an attractive market. Moreover, as discussed above in section III.D., Deacero acknowledged that the 4.75 mm wire rod that it shipped during the review period is “substitutable” with subject 5.5 mm wire rod, and Deacero undersold domestically produced 5.5 mm wire rod by providing a price incentive on its 4.75 mm wire rod to gain sales and market share in the United States. Tr. at 181‐82 (D. Gutierrez, Campbell). Additionally, Deacero indicated that it might also ship subject wire rod to the United States if the order were revoked. Tr. at 210 (Campbell).
281 Respondents argue that Gerdau and ArcelorMittal are unlikely to increase exports from subject countries in a manner that would impair the operations of their domestic production affiliates. AWPA Prehearing Brief at 8‐13. In the first reviews, we found that Gerdau did not act as a single entity, and there is nothing in the record of these second reviews that calls that conclusion into question. Accordingly, there are no material disincentives to Gerdau affiliates to import wire rod to the United States. With respect to ArcelorMittal, the record in these reviews continues to indicate that ArcelorMittal coordinates its global operations. Gerdau Parties’ Posthearing Brief, Responses to Commission’s Questions at 54‐55. However, the record also continues to indicate that substantial portions of the foreign industries are controlled by firms that are not affiliated with ArcelorMittal. As discussed above, ArcelorMittal Brasil was estimated to account for less than *** of Brazilian wire rod production in 2013. CR at IV‐17, PR at IV‐13. Moreover, as discussed above, the majority of new wire rod capacity that is expected to be added in 2014 and 2015 in Brazil is attributable to firms unrelated to ArcelorMittal. CR at IV‐18 – IV‐19 and CR at IV‐23 – IV‐24, PR at IV‐14 and IV‐16. With respect to the wire rod industry in Mexico, we observe that Deacero was estimated to account for *** percent of (Continued…)

42
participation in the U.S. market also indicates that the subject producers have ready access to U.S. distribution networks.
Given the cumulated subject producers’ excess capacity, likely capacity increases, and overall export orientation, and the size and relative attractiveness of the U.S. market, we conclude cumulated subject import volumes will likely be significant, both in absolute terms and relative to U.S. consumption, upon revocation.283
(…Continued) production in 2013. CR at IV‐40, PR at IV‐25. Although ArcelorMittal Point Lisas is the sole producer of wire rod in Trinidad and Tobago, the sole producer of wire rod in Moldova is not affiliated with ArcelorMittal. In addition, although the AWPA asserts that the Commission should consider PT Ispat Indo to be affiliated with ArcelorMittal, Gerdau Parties dispute this assertion and challenged it in the first review. Gerdau Parties’ Posthearing Brief, Responses to Commission’s Questions at 56; First Review Determinations, USITC Report, at IV‐36 n.19. In any event, we observe that *** estimated PT Ispat Indo to account for only *** percent of total rolling wire rod capacity in Indonesia in 2013. CR at IV‐29, PR at IV‐20. PT Ispat Indo itself estimated that it accounted for only *** percent of wire rod production in Indonesia in 2013. PT Ispat Indo Foreign Producer Questionnaire Response. Accordingly, the record indicates that substantial portions of the industries in each of the cumulated subject countries other than Trinidad and Tobago are controlled by companies that are not affiliated with ArcelorMittal. Furthermore, we observe that ***. CR at Appendix D‐24, PR at Appendix D‐3. Thus, to the extent that ArcelorMittal may import to the United States if the orders were revoked, it would likely rely on sources more proximate to the United States, including the subject countries of Mexico and Trinidad and Tobago. This is consistent with ArcelorMittal’s pattern during the period of review, including in 2010 when it experienced closure and idling of U.S. production facilities, to ***. CR/PR at Table III‐9.
282 Chairman Williamson and Commissioner Johanson join the prior footnote’s discussion only in part. In particular, they join its discussion of Gerdau, and its discussion that substantial portions of several foreign industries are controlled by firms not affiliated with ArcelorMittal. However, as discussed in their dissenting views on Ukraine, they do not join any suggestion that ArcelorMittal’s corporate policies would prevent imports into the United States from ArcelorMittal affiliates, and do not join the conclusion that any such imports would be most likely from sources more proximate to the United States.
283 We have also considered several other statutory factors in our analysis of likely subject import volume. Reported end‐of‐period inventories of subject merchandise for 2013 maintained in Brazil, Indonesia, Mexico, and Trinidad and Tobago were *** short tons. CR/PR at Tables IV‐9, IV‐13, IV‐17 and IV‐24. U.S. inventories of subject merchandise were present in the United States only during 2008 and 2011. CR at IV‐11, PR at IV‐9. In ***, U.S. importers’ inventories of subject imports from Trinidad and Tobago were *** short tons; in ***, U.S. importers’ inventories of subject imports from Mexico were *** short tons. CR/PR at Table IV‐5.
The record indicates that there are existing or potential barriers to exports of wire rod applicable to wire rod from Indonesia. Specifically, the record indicates that Malaysia imposed an antidumping duty order against imports of wire rod from Indonesia in 2013 and that Australia initiated an investigation into alleged dumping of rod in coils from Indonesia, Taiwan, and Turkey in 2014. CR at IV‐15, PR at IV‐12. Additionally, Colombia is currently conducting a global safeguard investigation on wire rod, as well as rebar and wire round. Id. Chairman Williamson and Commissioner Johanson note that Mexico imposed an antidumping duty order on wire rod imports from Ukraine in 2000. (Continued…)

43
B. Likely Price Effects
The record in these reviews indicates that subject imports and domestically produced wire rod of the same type are highly substitutable284 and that price is a very important factor in purchasing decisions.285 Moreover, as discussed above, both the domestic like product and subject imports tend to be concentrated in industrial quality grades. Thus, for purchasers of industrial quality grades of wire rod, pricing is particularly important in purchasing decisions.286 287
The Commission collected quarterly pricing data on four wire rod products – two industrial quality products, a mesh quality product, and a product for spring applications.288 Nine U.S. producers and two importers of wire rod from Mexico provided usable pricing data for sales of the requested products, although not all firms reported pricing for all products for all quarters.289 Pricing data reported by these firms accounted for approximately 31.0 percent of U.S. producers’ shipments of wire rod and *** percent of U.S. shipments of subject imports from Mexico during the period of review.290 The pricing data show that cumulated subject imports undersold the domestic like product in 30 out of 37 instances, with margins of underselling ranging from *** to *** percent.291
(…Continued)
Some producers in the cumulated subject countries produce other products in the same facilities where they produce wire rod. Specifically, ArcelorMittal Brasil and all three responding Mexican producers reported producing *** using shared equipment and machinery. CR at IV‐22 and IV‐44; PR at IV‐16 and IV‐29; CR/PR at Tables IV‐9 and IV‐18. ArcelorMittal Point Lisas reported ***. CR at IV‐59, PR at IV‐38; CR/PR at Table IV‐25.
284 CR at II‐23, PR at II‐14. 285 The most often cited top three factors firms consider in their purchasing decisions for wire
rod were quality (33 firms), price (30 firms), and availability (16), with 14 firms citing quality as the most important factor and 12 firms citing price as the most important factor. CR at II‐25 – II‐26, PR at II‐16; CR/PR at Table II‐5. In addition, 36 responding purchasers rated price as a “very important” purchasing factor. CR at II‐27 – II‐28, PR at II‐17; CR/PR at Table II‐6.
286 Chairman Williamson has cumulated subject imports from all six subject countries. He joins generally the discussion below, and his addition of Ukraine in his cumulated analysis does not result in any material differences between his analysis and the majority’s.
287 Commissioner Johanson has cumulated subject imports from Brazil, Indonesia, Moldova, Trinidad and Tobago, and Ukraine. He observes that there are no pricing data for the period of review concerning the subject imports he has cumulated. He finds that these cumulated subject imports will likely have significant adverse price effects because they undersold the domestic like product in 117 of 146 available quarterly comparisons in the original investigations and in 25 of 31 available quarterly comparisons in the first reviews.
288 CR at V‐8, PR at V‐6. 289 CR at V‐8, PR at V‐6. 290 CR at V‐8, PR at V‐6. 291 CR at V‐18, PR at V‐12; CR/PR at Tables V‐3 – V‐6.
44
Given the predominant underselling during both this period of review and the first reviews and the significant underselling in the original investigations,292 as well as our findings that subject imports would likely increase upon revocation, we find that significant underselling would likely recur if the antidumping and countervailing duty orders were revoked. Because of the importance of price in purchasing decisions, this underselling in turn would likely cause the domestic industry to consider either reducing its prices or foregoing price increases to maintain market share, as was the case in the original investigations. We therefore conclude that the likely significant volume of cumulated subject imports of wire rod would likely undersell the domestic like product to a significant degree to gain market share and would also likely have significant price‐depressing or ‐suppressing effects.
C. Likely Impact
Over the period of review, most trade indicators declined as a result of the recession in 2009, subsequently increased through 2011 but then declined in 2012 and 2013. The domestic industry’s capacity decreased from 5.55 million short tons in 2008 to 5.30 million short tons in 2009 and 4.97 million short tons in 2010 before increasing to 5.17 million short tons in 2011 and subsequently falling to 5.13 million short tons in 2012 and 5.10 million short tons in 2013.293 Production quantity similarly decreased from 4.06 million short tons in 2008 to 2.84 million short tons in 2009 before increasing to 3.38 million short tons in 2010 and 5.17 million short tons in 2011 and subsequently decreasing to 5.13 million short tons in 2012 and 5.07 million short tons in 2013.294 Capacity utilization fluctuated during the review period but declined overall; it was 73.1 percent in 2008, 53.6 percent in 2009, 68.2 percent in 2010, 75.5 percent in 2011, 75.6 percent in 2012, and 72.0 percent in 2013.295
The domestic industry’s U.S. shipments, both on a total basis and on a commercial (merchant market) basis, showed patterns similar to those for production. Total U.S. shipments were 4.1 million short tons in 2008, 2.83 million short tons in 2009, 3.34 million short tons in 2010, 3.88 million short tons in 2011, 5.13 million short tons in 2012, and 5.07 million short
292 Cumulated subject imports from Brazil, Indonesia, Mexico, Moldova, and Trinidad and Tobago undersold the domestic like product in 133 of 170 available comparisons in the original investigations and in 45 out of 79 available comparisons in the first reviews. CR at V‐18 nn.15 and 16, PR at V‐12 nn.15 and 16. Chairman Williamson and Commissioner Johanson note that subject imports from Ukraine undersold the domestic like product in *** available comparisons in the original investigations and in *** available comparisons in the first review. Id.
293 CR/PR at Tables III‐5 and C‐1. Gerdau Parties contend that the capacity utilization rate is understated because the figures do not account for all capacity reported by domestic producers in questionnaire responses. Gerdau Parties’ Prehearing Brief at 91‐92. Specifically, the capacity data do not include any capacity at Gerdau’s Perth Amboy, New Jersey facility because that facility has been idled since the second half of 2009. CR at III‐8, PR at III‐4; CR/PR at Table III‐5 note.
294 CR/PR at Tables III‐5 and C‐1. 295 CR/PR at Tables III‐5 and C‐1.

45
tons in 2013.296 Commercial shipments were 2.95 million short tons in 2008, 2.03 million short tons in 2009, 2.41 million short tons in 2010, 2.94 million short tons in 2011, 2.82 million short tons in 2012, and 1.86 million short tons in 2013.297 Inventories relative to U.S. shipments increased from 5.7 percent in 2008 to 6.8 percent in 2009 before declining to 5.8 percent in 2010 and 4.9 percent in 2011; they subsequently increased to 6.1 percent in 2012 and 7.4 percent in 2013.298 As discussed above, although the domestic industry accounted for the majority of apparent U.S. consumption, its market share fluctuated and declined from 2008 to 2013, ending the review period at its lowest level.299
The number of production and related workers employed by the domestic industry and total hours worked fluctuated but declined overall during the review period.300 Wages paid and hourly wages also fluctuated during the period of review but were highest in 2012 before declining in 2013.301 The industry’s productivity also fluctuated but was highest in 2011 and 2013.302
The financial performance of the domestic industry showed some recovery from the recession but subsequently displayed declines from 2011 to 2013. The domestic industry’s total net sales values declined from $3.6 million in 2008 to $1.7 million in 2009 before increasing to $2.3 million in 2010 and $3.1 million in 2011 and then declining to $2.9 million in 2012 and $2.6 million in 2013.303 The domestic industry’s ratio of COGS to net sales increased from 87.9 percent in 2008 to 98.4 percent in 2009, then decreased to 91.6 percent in 2010 and 90.0 percent in 2011 before increasing to 91.7 percent in 2012 and 92.4 percent in 2013.304 As a result, while the domestic industry recovered somewhat from the recession and was profitable
296 CR/PR at Tables III‐6 and C‐1. 297 CR/PR at Table III‐6. As discussed above, although there was substantial captive consumption
during the period of review, the majority of domestic shipments were in the merchant market. The percentage of commercial shipments ranged from 70.8 percent of total U.S. shipments to 75.3 percent on an annual basis during the review period. Id.
298 CR/PR at Tables III‐8 and C‐1. 299 CR/PR at Table C‐1. 300 CR/PR at Tables III‐10 and C‐1. The number of production related workers was 2,339 in 2008,
2,083 in 2009, 2,173 in 2010, 2,239 in 2011, 2,269 in 2012, and 2,192 in 2013. Hours worked were 4.7 million in 2008, 3.8 million in 2009, 4.2 million in 2010, 4.6 million in 2011, 4.6 million in 2012, and 4.3 million in 2013. Id.
301 CR/PR at Tables III‐10 and C‐1. Unit labor costs also fluctuated from year to year but increased slightly from 2008 to 2013. Id.
302 CR/PR at Tables III‐10 and C‐1. 303 CR/PR at Tables III‐11 and C‐1. The domestic industry’s net commercial sales values similarly
declined from $2.6 million in 2008 to $1.2 million in 2009, then increased to $1.7 million in 2010 and $2.4 million in 2011 before declining to $2.2 million in 2012 and $1.9 million in 2013. CR/PR at Table III‐11.
304 CR/PR at Tables III‐11 and C‐1.

46
in every year except for 2009, its operating income did not return to pre‐recession levels.305 The domestic industry’s ratio of operating income to net sales fell from 9.8 percent in 2008 to negative 2.6 percent in 2009, then rose to 4.3 percent in 2010 and 7.2 percent in 2011 before falling to 5.2 percent in 2012 and 4.2 percent in 2013.306 The industry’s capital expenditures decreased from 2008 to 2009 but subsequently increased steadily from 2009 to 2013.307 Research and development expenses, which were much lower than capital expenditures, fluctuated from year to year and were higher in 2012 and 2013 than in 2008.308
Although we acknowledge that most performance indicators declined in 2012 and 2013 after showing some recovery from the recession, we find that the domestic industry is not currently in a vulnerable condition. Nonetheless, as discussed above, should the orders under review be revoked, we have found that the volume of subject imports would likely increase to a significant level.309 310 We have further found that this additional volume of subject imports would likely be priced in a manner that would undersell the domestic like product. Consequently, the domestic industry would need to respond either by forgoing sales and ceding market share or by lowering or restraining prices. Under either circumstance, the domestic industry’s revenues and financial performance would likely decline, resulting in declines in the domestic industry’s production, shipments, market share, and employment. Moreover, as discussed above, although a significant share of U.S. wire rod production is internally transferred, the substantial majority of domestic shipments are in the merchant market. Therefore, we find the existence of captive consumption does not insulate the domestic industry from competition.
We have also considered the role of nonsubject imports in the U.S. market. Nonsubject imports’ share of the U.S. wire rod market fluctuated throughout the period of review and increased overall.311 312 As discussed above, the leading nonsubject source of wire rod imports was China, and those imports are currently subject to ongoing antidumping and countervailing duty investigations. The continued presence of nonsubject imports in the U.S. market, as was the case in the original investigations and first reviews, would not preclude subject imports
305 CR/PR at Tables III‐13 and C‐1. The domestic industry’s operating income was $347.1 million in 2008, negative $42.9 million in 2009, $98.8 million in 2010, $218.0 million in 2011, $148.4 million in 2012, and $107.7 million in 2013. Id.
306 CR/PR at Tables III‐13 and C‐1. 307 CR/PR at Tables III‐14 and C‐1. 308 CR/PR at Table III‐14. Four U.S. producers reported research and development expenses. Id. 309 Chairman Williamson has cumulated subject imports from all six subject countries. He finds
the discussion below is equally applicable to the subject imports he has cumulated. 310 Commissioner Johanson joins the conclusions in this paragraph with respect to the subject
imports from Brazil, Indonesia, Moldova, Trinidad and Tobago, and Ukraine that he has cumulated. 311 CR/PR at Table C‐1. 312 Commissioner Johanson has also considered the subject imports from Mexico that he has not
cumulated. As detailed in his Separate and Dissenting Views, he determines that subject imports from Mexico are not likely to lead to a continuation or recurrence of material injury were the order on Mexico to be revoked.

47
from taking market share from the domestic industry, the largest supplier of wire rod to the U.S. market, or forcing the domestic industry to its lower prices to compete.
Accordingly, in light of the likely significant volumes and likely adverse price effects, we find that revocation of the antidumping and countervailing duty orders would likely have a significant adverse impact on the domestic industry.
Revocation of the Antidumping Order on Subject Imports from Ukraine Is VIII.Not Likely to Lead to the Continuation or Recurrence of Material Injury to the Domestic Industry within a Reasonably Foreseeable Time313
A. Likely Subject Import Volume
For purposes of our analysis of likely subject import volume, we incorporate by reference our discussion of subject imports from Ukraine in section III.B. above. In that discussion, we found that it was unlikely that the largest producer of subject wire rod in Ukraine, ArcelorMittal KR, would ship more than minimal volumes of wire rod to the United States due to its affiliation with the ArcelorMittal Group and lack of geographic proximity to the U.S. market. We further found that the only other significant current subject producer in Ukraine, Yenakiieve, had not shipped wire rod to the Western Hemisphere during the period of review and was unlikely to direct more than a modest portion of its limited excess capacity to the United States. Accordingly, we conclude that the likely volume of subject wire rod imports from Ukraine would not be significant, in absolute terms or relative to production or consumption in the United States, within a reasonably foreseeable time in the event of revocation.
B. Likely Price Effects
During the original investigations, subject imports from Ukraine undersold the domestic like product in 21 of 22 quarterly price comparisons, with an average underselling margin of *** percent.314 In the first reviews, subject imports from Ukraine undersold the domestic like product in all six quarterly price comparisons, with an average margin of underselling of *** percent.315 There were no price comparisons in the current reviews.
We find that pricing data for Ukraine from the original investigations, and the first year of the first review, are not indicative of likely pricing patterns upon revocation of the order.316 The composition of the industry in Ukraine has changed dramatically since the original
313 Chairman Williamson and Commissioner Johanson do not join this section of the opinion. See Separate and Dissenting Views of Chairman Irving A. Williamson and Commission David J. Johanson Regarding Cumulation for Ukraine.
314 CR at V‐18 n.11, PR at V‐4 n.11 315 CR at V‐18 n.11, PR at V‐4 n.11. 316 First Review Determinations, USITC Report, at Table V‐2.

48
investigation, as the mills that have since become ArcelorMittal KR and Yenakiieve were then under different management.317 Moreover, as discussed above, due to ArcelorMittal KR’s affiliation with the ArcelorMittal Group and Yenakiieve’s limited excess capacity and lack of interest or experience in supplying wire rod to markets in the Western Hemisphere, subject imports from Ukraine are not likely to be at significant volumes upon revocation. Consequently, subject producers in Ukraine are not likely to have any incentive to price aggressively to gain U.S. market share. We find that any modest volumes of imports that may be expected to enter the U.S. market from Ukraine upon revocation of the order would be too small to have a material influence on pricing for the entire U.S. market. Given the likely small volume of subject imports from Ukraine in the event of revocation, we find that revocation of the antidumping duty order on subject imports of wire rod from Ukraine would not be likely to lead to significant underselling or significant price depression or suppression within a reasonably foreseeable time.
C. Likely Impact
We incorporate by reference the discussion in section VII.C. above concerning the domestic industry’s performance during the period of review, as well as our finding that the domestic industry is not in a vulnerable condition. Given that we find it likely that there would not be a significant volume of subject imports from Ukraine and there would not be likely significant price effects from these imports, we find that revocation of the antidumping and countervailing duty orders on subject imports from Ukraine is not likely to lead to a significant impact on the domestic industry within a reasonably foreseeable time.
Thus, we conclude that revocation of the antidumping duty order on subject imports from Ukraine would not be likely to lead to continuation or recurrence of material injury to the domestic industry within a reasonably foreseeable time.
Conclusion IX.
For the foregoing reasons, we determine that revocation of the countervailing duty order on carbon and certain alloy steel wire rod from Brazil and the antidumping duty orders on wire rod from Brazil, Indonesia, Mexico, Moldova, and Trinidad and Tobago, would be likely to lead to continuation or recurrence of material injury to an industry in the United States within a reasonably foreseeable time.318 We determine that revocation of the antidumping duty order
317 CR at IV‐65 – IV‐66, PR at IV‐41 – IV‐42; Yenakiieve’s Prehearing Brief at 15‐16. We observe that this is the first time that the Commission has had a chance to consider fully these changes in the industry in Ukraine as no Ukrainian producer participated in the first reviews through filing briefs or providing testimony at the hearing.
318 Commissioner Johanson determines that revocation of the countervailing duty order on wire rod wire rod from Brazil and the antidumping duty orders on wire rod from Brazil, Indonesia, Moldova, Trinidad and Tobago, and Ukraine, would be likely to lead to continuation or recurrence of material injury to an industry in the United States within a reasonably foreseeable time. He determines that (Continued…)

49
on wire rod from Ukraine would not be likely to lead to continuation or recurrence of material injury to an industry in the United States within a reasonably foreseeable time.319
(…Continued) revocation of the antidumping duty order on wire rod from Mexico would not be likely to lead to continuation or recurrence of material injury to an industry in the United States within a reasonably foreseeable time.
319 Chairman Williamson determines that revocation of the countervailing duty order on wire rod wire rod from Brazil and the antidumping duty orders on wire rod from Brazil, Indonesia, Mexico, Moldova, Trinidad and Tobago, and Ukraine, would be likely to lead to continuation or recurrence of material injury to an industry in the United States within a reasonably foreseeable time.


51
SEPARATE AND DISSENTING VIEWS OF CHAIRMAN IRVING A. WILLIAMSON AND COMMISSIONER DAVID S. JOHANSON REGARDING CUMULATION FOR UKRAINE
Based on the record in these reviews, we do not find that subject imports of steel wire rod from Ukraine would likely have no discernible adverse impact on the domestic industry if the order on such imports were revoked. In the original investigations, subject imports from Ukraine increased from 193,003 short tons in 1999 to 367,712 short tons in 2000, then declined to 258,526 short tons in 2001, for an overall increase of 33.9 percent from 1999 to 2001. Their share of apparent U.S. consumption was *** percent in 1999, *** percent in 2000, and *** percent in 2001.1 Subject imports from Ukraine undersold domestic product in 21 of 22 available comparisons.2 In the first five‐year review, with the order in place, subject imports from Ukraine were absent from the U.S. market except in 2002 (11,159 short tons) and 2005 (738 short tons).3 Subject imports undersold domestic product in all 6 comparisons.4 There were no subject imports from Ukraine during the current period of review.5 Two producers of subject product in Ukraine – ArcelorMittal Kryvyi Rih (“ArcelorMittal KR”) and Yenakiieve Iron and Steel Works (“Yenakiieve”) – responded to the Commission’s foreign producer questionnaire in these reviews. While *** presents data that cover other producers, the two responding producers accounted for *** percent of the total wire rod rolling capacity and *** percent of wire rod production in Ukraine during 2013 as reported by ***.6 We consider the two responding producers to account for at least the vast majority of the current industry in Ukraine. The larger of the two responding producers, ArcelorMittal KR, is part of the ArcelorMittal group. Yenakiieve argues that, based on ArcelorMittal’s regional supply policy, this producer is unlikely to export meaningful volumes of steel wire rod to the United States. In particular, Yenakiieve argues that ArcelorMittal’s corporate policy is to serve local markets with local production, and that decisions concerning imports are ***.7 We conclude that ArcelorMittal’s corporate policy is not likely to prevent ArcelorMittal KR from exporting substantial volumes of steel wire rod to the United States in the event of revocation. First, the corporate policy clearly permits imports from other ArcelorMittal mills
1 Original Determinations, USITC Pub. 3546, USITC Report at Table I‐1 (reproduced in CR/PR appendix C). Over the three full years of the original period of investigation, the total volume of subject imports from Ukraine were the second highest of the six countries remaining in these reviews, following only subject imports from Trinidad & Tobago. Id.
2 CR at V‐18 n.15, PR at V‐12 n.15. 3 First Review Determinations, USITC Pub. 4014, USITC Report at Table I‐1. 4 CR at V‐18 n.16, PR at V‐12 n.16. 5 CR/PR at Table C‐1. 6 CR at IV‐67 n. 51; PR at IV‐42 n.51. 7 See, e.g., Yenakiieve’s Prehearing Brief at 5‐6 and 34.

52
depending on market opportunities. ArcelorMittal reports that it “employs a commercial coordination policy that ***” and that “***.”8 Indeed, in the first five‐year review of these orders, despite similar affiliations, the Commission cumulated all subject countries except Canada, and the decision on Canada was not based on ArcelorMittal affiliations.9 Second, over the POR, there have indeed been imports of wire rod into the United States from ArcelorMittal companies, including from ***.10 While ArcelorMittal may have some preference for sourcing U.S. imports from its Western Hemisphere affiliates, we do not find this would prevent imports from other affiliates, such as ArcelorMittal KR, in light of the continuing antidumping duty orders on Mexico and Trinidad and Tobago as well as imports from other affiliates over the period of review. Third, ArcelorMittal KR has *** – in 2013, its capacity utilization rate was *** percent, and its ***.11 Given this level of ***, and the high fixed cost nature of steel wire rod production,12 we find that ArcelorMittal would have a strong incentive to produce additional wire rod in Ukraine and export to the United States if the order were revoked. Fourth, ArcelorMIttal USA is a *** producer. In 2013, it accounted for only *** percent of domestic capacity, and only *** percent of domestic production. ArcelorMittal USA itself was a *** importer of steel wire rod over the POR, and these imports *** over the POR.13 In 2013, its total imports of steel wire rod totaled *** short tons, equivalent to *** percent of its domestic production.14
Based on these facts, we find that, upon revocation, it is likely that there would be U.S. imports of steel wire rod from ArcelorMittal KR. The volume of such imports are of course uncertain, but given the *** at ArcelorMittal KR, such import volumes would likely be at least large enough to have a discernible adverse impact on the domestic industry, even without consideration of the other Ukrainian producer, Yenakiieve.
Having rejected the argument related to ArcelorMittal, we consider the Ukrainian industry as a whole. Questionnaire data indicate that the industry has *** and growing excess capacity. Capacity utilization in Ukraine declined steadily from *** percent in 2010 to *** percent in 2011, *** percent in 2012, and *** percent in 2013.15 Absolute excess capacity has ***, reaching *** tons in 2013; this is equivalent to nearly *** of apparent U.S. consumption in that year.16 We also note that there is some evidence on the record that additional capacity will come online in 2014 at the Dneprovsky (Dzerzhinsky) Metallurgical Plant.17
8 CR at III‐19, PR at III‐10. 9 First Review Determinations, USITC Pub. 4014 at 12‐19. 10 CR/PR at Table I‐12. 11 Foreign Producer Questionnaire Response of ArcelorMittal KR at II‐5a. 12 See CR at III‐40 n.42, III‐42 n.46, and III‐43 n.49; PR at III‐18 n.42, III‐19 n.46, and III‐19 n.49. 13 CR/PR at Table III‐9. 14 CR/PR at Table III‐9. 15 CR/PR at Table IV‐29. 16 CR/PR at Tables IV‐29 and C‐1. 17 See, e.g., Nucor’s Prehearing Brief at 32 and n.177; Gerdau Parties’ Posthearing Brief at Ex. 1 p. 2.

53
The industry in Ukraine is also *** export‐oriented. Exports accounted for *** percent of total shipments throughout the POR;18 the share was *** percent in 2013.19 We also note that in each year of the POR, Ukraine was the world’s third‐ or fourth‐largest exporter of wire rod products; none of the other subject countries were in the top ten.20 Yenakiieve argues that its exports are concentrated in nearby markets, and that it is not likely to export outside those markets. As discussed above, we are considering the Ukrainian industry as a whole. For that industry, exports have been to many countries, and the industry has demonstrated an ability to quickly shift shipments among export markets.21 While some of Ukraine’s largest export markets are currently in Europe, the Middle East, and western Asia, it also has significant exports to Nigeria and Senegal.22 There is also some evidence that Ukraine has reduced its exports to Russia.23 At the Commission’s hearing, the witness from Ukraine stated that the current political situation in Ukraine was not affecting exports of steel products from that country’s ports.24 Moreover, while the Ukrainian industry may not be currently exporting steel wire rod to the Western Hemisphere, it has previously done so, as demonstrated by the trade remedy in place in Mexico, which was imposed in 2000 and has been continued.25
In sum, we find that, upon revocation, there will likely be substantial imports of steel wire rod from ArcelorMittal KR, notwithstanding ArcelorMittal’s corporate policies, and that imports of steel wire rod from Ukraine overall are not likely to have no discernible adverse impact on the domestic industry. We also determine, as discussed in our footnotes to the majority opinion, to exercise our discretion to cumulate Ukraine with the other subject countries we each are cumulating.
18 The record from the original investigations and the first review show that the Ukrainian industry was equally export oriented during those earlier periods. Original Determinations, USITC Pub. 3546, USITC Report at Table VII‐8; First Review Determinations, USITC Pub. 4014, USITC Report at Table IV‐35.
19 CR/PR at Table IV‐29. 20 CR/PR at Table IV‐41. 21 CR/PR at Table IV‐31. 22 Id. 23 Nucor Prehearing Brief at Ex. 1 p. 6 and Ex. 18; Yenakiieve Prehearing Brief at Ex. 16. 24 Tr. at 199 (Dimitrova). 25 CR at IV‐15; PR at IV‐12; Gerdau Parties’ Prehearing Brief at 75 and Ex. 14.


55
SEPARATE AND DISSENTING VIEWS OF COMMISSIONER DAVID S. JOHANSON
I. INTRODUCTION
Based on the record in these five‐year reviews, I concur with my colleagues in determining that material injury is likely to continue or recur within a reasonably foreseeable time if the countervailing duty order on subject imports of carbon and certain alloy steel wire rod (“wire rod”) from Brazil and the antidumping duty orders on subject imports of wire rod from Brazil, Indonesia, Moldova, and Trinidad and Tobago are revoked.1 I write separately from my colleagues, however, as I find that material injury is not likely to continue or recur within a reasonably foreseeable time if the antidumping duty order on subject imports of wire rod from Mexico is revoked. I join the discussion of the Commission majority regarding background (Section I), domestic like product and domestic industry (Section II), cumulation (only Sections III(A)–(C)), legal standards (Section IV), findings from the original investigations and prior reviews (Section V), conditions of competition in the U.S. market (Section VI), and the finding that revocation of the orders with respect to Brazil, Indonesia, Moldova, and Trinidad and Tobago is likely to lead to a continuation or recurrence of material injury (Section VII), with exceptions as noted. I write separately to discuss my analysis of the statutory factors regarding imports from Mexico. II. CUMULATION A. Likelihood of No Discernible Adverse Impact I concur with my colleagues (Section III(B) of majority views) in not finding that subject imports of wire rod from Brazil, Indonesia, Mexico, Moldova, and Trinidad and Tobago would likely have no discernible adverse impact on the domestic industry if those orders were revoked. However, as detailed in our joint dissenting views, Chairman Williamson and I differ from the majority because we do not find that subject imports from Ukraine would likely have no discernible adverse impact on the domestic industry if that order were revoked. B. Likelihood of a Reasonable Overlap of Competition I concur with my colleagues (Section III(C) of majority views) in concluding that there would likely be a reasonable overlap of competition between the domestic like product and subject imports from all six countries.
1 I also find that material injury is likely to continue or recur within a reasonably foreseeable
time if the antidumping duty order on wire rod from Ukraine were revoked. For my views on subject imports from Ukraine, see Separate and Dissenting Views of Chairman Irving A. Williamson and Commissioner David S. Johanson Regarding Cumulation for Ukraine.

56
C. Likely Conditions of Competition I write separately because, based on the evidence, I exercise my discretion to cumulate subject imports from five countries—Brazil, Indonesia, Moldova, Trinidad and Tobago, and Ukraine—but I do not exercise my discretion to cumulate subject imports from Mexico. I base my cumulation decision primarily on my analysis of the likely volume of subject imports that might come from each the six countries in the event of revocation. I find that, of the foreign industries producing wire rod in these six countries, the industry in Mexico is unique in that it alone combines both the highest average capacity utilization and lowest average export orientation over the period of these second reviews. I consider this important as both characteristics make the Mexican industry less likely to export to the U.S. market in the event of revocation.2
Over the period of these second reviews, capacity utilization by the Mexican industry was consistently high and ranged from 85.0 percent in 2013 to 98.1 percent in 2011, and averaged 92.0 percent over 2008‐2013.3 Over the period of these reviews, excess capacity in Mexico ranged from 49,752 short tons in 2011 to 412,708 short tons in 2013, and averaged 201,726 short tons.4 Total exports of wire rod from Mexico, as a share of total shipments, were consistently low and ranged from 9.4 percent in 2009 to 16.6 percent in 2011, and averaged *** percent over 2008‐2013.5 Further, I find that these characteristics of the Mexican industry have been consistent over the periods of the original investigations,6 the first reviews,7 and
2 As will be detailed in Section III(A) of these Separate and Dissenting Views, the combination of
the two characteristics leads me to conclude that a significant increase in subject imports from Mexico is not likely if the antidumping order on Mexico were revoked.
3 CR/PR at Table IV‐17 (average calculated by summing total production and dividing by total capacity over the full six‐year period). I choose to use data from Table IV‐17 because Commission staff considers data reported by *** and GTA to be “overstated” as it contains non‐scope products. CR at IV‐40 n.34 and IV‐47; PR at IV‐26 n.34 and IV‐30.
4 CR/PR at Table IV‐17. Since the recession year of 2009, production capacity in Mexico has increased steadily, and while production also increased steadily through 2012, production declined by 8.6 percent in 2013, leading to higher excess capacity. Id. As I discuss below in Section III(A), this decline in production was primarily related to temporary political conditions that are expected to resolve themselves this year.
5 CR/PR at Table IV‐17 (average calculated by summing total exports and dividing by total shipments over the full six‐year period). Mexico does not appear on the list of the “top 10” exporters of wire rod in the world and total exports reported by Mexico were significantly lower than the volume of exports of the country ranked as the number 10 exporter, Italy. Compare CR/PR at Table IV‐41 with CR/PR at Table IV‐17.
6 Over the period of the original investigations, available questionnaire responses covering an estimated *** percent of Mexican production (and *** percent of exports to the U.S. market) showed the Mexican industry ranging from *** percent capacity utilization in interim 2002 to *** percent in 1999, and averaging *** percent utilization over the period Jan. 1999 to Mar. 2002. Total exports of wire rod from Mexico ranged from *** percent of total shipments in 2000 to *** percent in interim 2002, and averaged *** percent over the period Jan. 1999 to Mar. 2002. 2002 Staff Report at Table VII‐5.

57
these second reviews (suggesting that such characteristics are not simply a manifestation of the presence of these U.S. trade remedies).8
Finally, I find that changes in the structure of the Mexican industry producing wire rod since the period of the original investigation have reinforced its tendencies toward high capacity utilization and low export orientation. Deacero, which was not mentioned as a member of the Mexican wire rod industry in the original investigations, became *** producer in the Mexican industry during the period of the first reviews, accounting for *** Mexican production.9 Deacero’s core business is “downstream wire products” (e.g. chain link fence, barbed wire, staples, and nails)10 and Deacero’s primary reason for producing wire rod is for internal consumption, which accounts for “over 70 percent” of its wire rod production.11 Likewise, at the end of the period of the first review, Sicartsa, the *** exporter to the U.S. market during the period of the original investigations, was acquired by ArcelorMittal and has reduced its presence in the U.S. market to *** of U.S. consumption; 12 ArcelorMittal Las Truchas forecasts that, even in the event of revocation, it would ***.13 In contrast, I find that the other five countries involved in these reviews can be characterized has having either low capacity utilization, or—in the case of Moldova, Trinidad and Tobago, and Ukraine—both low capacity utilization and high export orientation. These characteristics make it likely that they would use their excess capacity, in the event of revocation of the orders, to supply the U.S. market with significant volumes of subject imports. Over the period of these reviews, data contained in the Commission’s staff report show that capacity utilization for the industries producing wire rod in:
Brazil ranged from *** percent in 2009 to *** percent in 2010, and averaged *** percent over 2009‐2013;14
Indonesia ranged from *** percent in 2009 to *** percent in 2011, and averaged *** percent over 2009‐2013;15
Moldova was reportedly *** percent in 2012;16
7 Over the period of the first reviews, available questionnaire responses covering an estimated
*** percent of Mexican production showed the Mexican industry ranging from *** percent capacity utilization in 2006 to *** percent in 2004, and averaging *** percent over 2002‐2007. Total exports of wire rod from Mexico ranged from *** percent of total shipments in 2006 to *** percent in 2002, and averaged *** percent over the period 2002‐2007. 2008 Staff Report at Table IV‐25.
8 Separate and Dissenting Views of Chairman Daniel R. Pearson, First Reviews, USITC Pub. 4014, at 49‐50.
9 2008 Staff Report at IV‐69. In 2013, Deacero accounted for *** percent of total wire rod production in Mexico. CR at IV‐40; PR at IV‐25.
10 Tr. at 141‐42 (D. Gutierrez). 11 Tr. at 140 (S. Gutierrez); Deacero’s prehearing brief at 7‐8 and 26‐27. 12 Tr. at 152 (Campbell); Deacero’s prehearing brief at 5‐6; Deacero’s posthearing brief at 10.
ArcelorMittal Las Truchas argues that its subject imports over this period of review have been only *** ArcelorMittal’s U.S. production. Id.
13 Deacero’s prehearing brief at 6; Deacero’s posthearing brief at 10. 14 CR/PR at Table IV‐7. 15 CR/PR at Table IV‐12.

58
Trinidad and Tobago ranged from *** percent in 2009 to *** percent in 2011, and averaged *** percent over 2008‐2013;17
Ukraine ranged from *** percent in 2009 to *** percent in 2010, and averaged *** percent over 2009‐2013.18
So while none of the other five countries had an average capacity utilization over the
period of these second reviews that exceeded *** percent, Mexico’s average capacity utilization over this period was *** percent. In every year of the period of these reviews, Mexico’s capacity utilization was the highest of the six countries.
Available data on export orientation are less comparable due to the overinclusiveness of some export data (also, the denominator is “shipments” for Mexico and Trinidad and Tobago, but “production” for the other countries), but the data show that export orientation for the industries producing wire rod in:
Brazil ranged from *** percent in 2013 to *** percent in 2009, and averaged *** percent over 2009‐2013;19
Indonesia ranged from *** percent in 2013 to *** percent in 2009, and averaged *** percent over 2009‐2012;20
Moldova was *** percent in 2013;21
Trinidad and Tobago ranged from *** percent in 2008 to *** percent in 2011, and averaged *** percent over 2008‐2013;22
Ukraine ranged from *** percent in 2013 to *** percent in 2012, and averaged *** percent over 2009‐2013.23
While Mexico may not have had the lowest degree of export orientation among the six
subject countries throughout the period of these reviews (as it had in 2009 and 2010), it was always among the lowest three countries (Brazil and Indonesia sometimes having a lower degree of export orientation) and its average over the period of these second reviews was the lowest (at *** percent), again, to the extent that the data are comparable.
I do not place heavy emphasis on Deacero’s shipments of out‐of‐scope 4.75 mm wire rod to the U.S. market and do not view the mere presence of Mexican production of the smaller diameter wire rod as a likely distinguishing condition of competition.24 The peak year of
16 CR/PR at Table IV‐21; CR at IV‐52; PR at IV‐34. 17 CR/PR at Table IV‐24. 18 CR/PR at Table IV‐29. 19 CR/PR at Table IV‐6. Combining production data from Table IV‐7 with (over‐inclusive) export
data from Table IV‐10. 20 CR/PR at Table IV‐6. Combining production data from Table IV‐12 with (over‐inclusive) export
data from Table IV‐14. 21 CR/PR at Table IV‐6. 22 CR/PR at Table IV‐24. 23 CR/PR at Table IV‐6. Combining production data from Table IV‐28 with (over‐inclusive) export
data from Table IV‐31. 24 Cf. Deacero’s prehearing brief at 8‐14.

59
imports of this smaller diameter wire rod was 2010, the last full year prior to the initiation of a circumvention inquiry by Commerce.25 In 2010, Deacero states that it believed that it was unrestrained by the antidumping order for that product and had not yet learned of the circumvention inquiry.26 U.S. imports of the small diameter wire rod from Mexico in 2010 were *** short tons,27 which was *** than subject import volume from Mexico in *** of the period of the original investigations; the peak volume of imports of the smaller diameter wire rod from Mexico in 2010 was also *** than the subject import volumes in each year of the period of the original investigation for three of the other five countries being reviewed here (Moldova, Trinidad and Tobago, and Ukraine).28 As a rough measure, the volume of non‐subject 4.75 mm imports from Mexico would have accounted for *** percent of U.S. consumption in 2010. While the Mexican industry did avail itself of the opportunity to export to the U.S. market outside the discipline of these orders, even in 2010, it did not export a volume of wire rod inconsistent with the limited excess capacity possessed in the Mexican industry (recall from above that Mexican excess capacity averaged just over *** short tons over the period of these reviews); also, even if this quantity of out‐of‐scope exports had been considered in‐scope, it would not have significantly increased the Mexican industry’s level of export orientation.29
Therefore, I determine that, based on the existence of unique conditions of competition inherent in the Mexican industry, subject imports from Mexico would be likely to compete under different conditions of competition than the subject imports from the other five subject countries. Accordingly, for the reasons discussed above, I do not exercise my discretion to cumulate subject imports from Mexico and I consider them separately from all other subject imports. III. REVOCATION OF THE ANTIDUMPING DUTY ORDER ON SUBJECT IMPORTS FROM
MEXICO IS NOT LIKELY TO LEAD TO A CONTINUATION OR RECURRENCE OF MATERIAL INJURY TO THE DOMESTIC INDUSTRY WITHIN A REASONABLY FORESEEABLE TIME
A. Likely Volume of Subject Imports from Mexico During the period of the original investigations, the volume of subject imports from Mexico increased by 118.7 percent, increasing steadily from 122,038 short tons in 1999 to 266,925 short tons in 2001. Over the three full years of the period of the original investigations, subject import volume from Mexico increased the fastest of the six countries under review here, but the aggregate volume of subject imports from Mexico during 1999‐2001 was the ***
25 CR/PR at Table F‐1; CR at I‐23; PR at I‐18. 26 Deacero’s prehearing brief at 3 and 22. 27 CR/PR at Table F‐1. 28 CR/PR at App. C: Reproduction of Table I‐1 from First Review. ***. Id. 29 Instead of the ratio of exports to shipments being 12.8 percent, the ratio would have been
*** percent. CR/PR at Tables IV‐17 and F‐4.

60
largest (behind ***). The U.S. market share held by subject imports from Mexico increased steadily from *** percent in 1999 to *** percent in 2001.30 After imposition of the antidumping duty order against Mexico in 2002, subject imports from Mexico fell irregularly to 11,480 short tons in 2005, and have exceeded that level *** since that year (reaching ***). After falling to a U.S. market share of 0.2 percent in 2005, subject imports from Mexico have never exceeded the *** percent level, which they reached in ***.31
As discussed above in the section on cumulation, my primary reason for not cumulating subject imports from Mexico is that the Mexican industry producing wire rod is unique in that it had, over the period of these second reviews, both the highest average capacity utilization and the lowest average export orientation. Mexico has both low levels of excess capacity with which to increase production of wire rod, and a low propensity to export its production of this product. Both of these characteristics make it unlikely that there will be significant increases in subject imports from Mexico within the reasonably foreseeable future were the antidumping duty order on Mexico to be revoked.
I also find, as discussed above in the cumulation section, that these characteristics have distinguished the Mexican industry producing wire rod even during the period of the original investigations and the period of the first review. Changes in the structure of the Mexican industry since 2002 have acted to further reinforce the high rate of capacity utilization and low export orientation. First, Deacero, which sees itself as primarily a wire products operation that produces its wire rod primarily for internal consumption, became the dominant Mexican producer of wire rod.32 Second, the *** exporter of Mexican wire rod during the original investigations was acquired by ArcelorMittal in 2007 and has since exported *** of wire rod to the United States.33 As an illustration of how these characteristics affect Mexican exports of wire rod, I note that the growth rate in the Mexican economy slowed from about 4 percent in 2011 and 2012 to 1.1 percent in 2013.34 This led to declines in Mexican production, internal consumption/transfers, and home market shipments. Yet total exports ***, increasing by ***
30 2002 Staff Report at Table I‐1. 31 CR/PR at App. C: Reproduction of Table I‐1 from First Review. Over the period of these
reviews, more than *** percent of the in‐scope subject imports from Mexico shown in Table IV‐17 were sourced from ***. *** foreign producer questionnaire response, at 10.
32 Deacero “did not supply wire rod to the U.S. before 2008.” Tr. at 144 (D. Gutierrez). 33 Deacero prehearing brief at 5‐6; Tr. at 152 (Campbell). I am not arguing that the ArcelorMittal
affiliation will, by itself, act to inhibit likely volumes of subject imports from Mexico, but rather that over the six years of this review period, ArcelorMittal Las Truchas’ capacity utilization has never been lower than *** percent (in ***) and was higher than *** percent in four of the six years. ArcelorMittal Las Truchas’ foreign producer questionnaire response at 10. Such ***, rather than global corporate strategy, motivates my finding that the Mexican industry is not likely to increase exports significantly to the U.S. market in the event of revocation.
34 Deacero prehearing brief at 24 and Exhibit 14. This slowdown was blamed, to a large extent, on the change in presidential administrations in Mexico, which occurred in July 2013, and the impact this had on government spending. Therefore, this slowdown appears to be a transitory event, with more normal rates of growth returning this year.
61
short tons (an increase of *** percent).35 Instead of responding to the domestic slowdown by *** exports to maintain capacity utilization, the Mexican industry decreased production, leading to a decline in capacity utilization.36 Although the Mexican wire rod industry is not export oriented, the primary export markets for Mexican wire rod have been primarily to Central and South America.37 Mexican producers view these exports as commercial commitments that are strengthened by the presence of free trade agreements between Mexico and many of these countries in the Americas;38 such trade preferences also act to give Mexican exports of wire rod an advantage over of Chinese exports of wire rod to those markets.39 In the case of the 2013 Colombian safeguard case on wire rod and rebar,40 Mexican exports of wire rod have been assigned a tariff‐rate quota, a privilege that the Chinese were not accorded,41 and Deacero argues that it will be able to continue shipping “the same quantities as before the safeguard investigation was initiated.”42 The Mexican interested parties argue that this is the case as 80 percent of the tariff rate quota volumes will be assigned to “historical importers.”43 Hence I conclude that, in the event that the order on subject imports of wire rod from Mexico were revoked, the likely volume of such imports would not be significant. B. Likely Price Effects of Subject Imports from Mexico
During the period of the original investigations, Mexico does not appear to have been the most likely to undersell among the six countries the Commission is now reviewing. Pricing product data for subject imports from Mexico showed 37 quarters of underselling and 9 quarters of overselling (80.4 percent of comparisons). Of the six countries involved in these second reviews, this was the second lowest percentage of underselling, following only Trinidad
35 CR/PR at Table IV‐17. Mexican production declined by 8.6 percent between 2012 and 2013. 36 While the likelihood and timing of any capacity decreases by individual Mexican producers
were strenuously argued by both parties in these reviews, I note that Deacero argued that “there will be no capacity expansions in Mexico within the reasonably foreseeable future.” Deacero’s responses to Commissioners’ questions at 29.
37 CR/PR at Tables IV‐17 and IV‐19; Deacero’s prehearing brief at 27. 38 Mexico has free trade agreements with Central America (Costa Rica, El Salvador, Guatemala,
Honduras, and Nicaragua), Peru, Bolivia, Uruguay, Chile, and Colombia; a framework agreement with Mercosur; and partial preference arrangements with Argentina, Brazil, Paraguay, Panama, and Ecuador. Deacero’s posthearing brief at Exhibit 11 (list from the Organization of American States).
39 Tr. at 143 (D. Gutierrez); 193 (S. Gutierrez); and 195, 197‐98 (E. Gutierrez); Deacero’s posthearing brief at 9; Deacero’s responses to Commissioners’ questions at 9‐10.
40 CR at IV‐15, PR at IV‐12. 41 Tr. at 197 (E. Gutierrez). 42 Tr. at 155 (Campbell). 43 Deacero’s prehearing brief at 28‐29; Tr. at 143‐44 (D. Gutierrez); Deacero’s posthearing brief
at 9 & Exhibit 12 (showing that the expected Colombian tariff‐rate quota exceeds Mexican exports to Colombia in 2011 and 2012, but not 2013).

62
and Tobago, which had underselling in 69.2 percent of comparisons.44 Mexico also had the second‐lowest average margin of underselling in the original investigations (again, second only to Trinidad and Tobago).45 Only 4 of 25 lost sales allegations from the original investigations involved subject imports from Mexico; of the two purchasers that responded to these allegations, only one partially agreed with the allegation.46 No lost revenue allegations involved subject imports from Mexico.47
In the first review, there were many fewer comparisons, but Brazil undersold the U.S. product in all 3 of its comparison, Indonesia undersold in all 3 of its comparisons, Moldova undersold in all 5 of its comparisons, and Ukraine undersold in all 6 of its comparisons. Trinidad and Tobago undersold the U.S. product in 8 of 14 quarterly comparisons (57.1 percent of comparisons) and Mexico undersold the U.S. product in 26 of 54 quarterly comparisons (48.1 percent of comparisons).48 Granted, these pricing comparisons were conducted under the discipline of U.S. trade remedies, but the data show that Mexico, when compared to the other five subject countries, had less adverse results in the pricing product comparisons.49
Likewise in these second reviews, there were few pricing comparisons and these comparisons only involved subject imports from Mexico, which undersold the U.S. product in 30 of 37 quarterly comparisons (81.1 percent of comparisons). The average margin of underselling in the 30 comparisons was 9.6 percent and the average margin of overselling in the 7 comparisons was 1.8 percent.50 In an attempt to explain the continued underselling by subject imports from Mexico, Mexican interested parties argued that several purchasers’
44 2002 Staff Report at Table V‐10; CR at V‐18 n.15. For pricing product 1, in *** possible
quarters of comparison from the original investigations, prices of subject imports from Mexico were higher than any other of the five countries under review in these second reviews. (This product accounted for *** of the 9 instances of Mexican overselling.) 2002 Staff Report at Table V‐3. For pricing product 2, in *** possible quarters of comparison, prices of subject imports from Mexico were higher than any other of the five countries under review in these reviews. (This product accounted for *** of the 9 instances of Mexican overselling.) 2002 Staff Report at Table V‐4. For pricing product 5, in *** possible quarters of comparison, prices of subject imports from Mexico were higher than any other of the five countries under review in these reviews. (This product accounted for *** of the 9 instances of Mexican overselling.) 2002 Staff Report at Table V‐7. This pattern of relative pricing among the six subject countries is bolstered by data on AUVs, which shows that in all three full years of the period of the original investigations, Mexican AUVs were the second highest (following Trinidad and Tobago) and in the interim 2002 period, Mexican AUVs were the highest. CR/PR at App. C: Reproduction of Table I‐1 from First Review.
45 Both using an arithmetic average and a weighted average. 2008 Staff Report at Table V‐10. 46 2002 Staff Report at Table V‐11. 47 2002 Staff Report at Table V‐12. 48 2008 Staff Report at Table V‐9; CR at V‐18 n.16. 49 2008 Staff Report at Table V‐9. In four of the six years of the period covered by the first
review, Mexico had a weighted average that showed overall overselling. Trinidad and Tobago had one year that showed overall overselling and the weighted averages for the other four countries showed only underselling. Id.
50 CR/PR at Table V‐8.

63
questionnaire responses reflected a preference for domestic product and a stated willingness to pay higher prices for it.51
Domestic interested parties point to the pricing of the 4.75 mm out‐of‐scope product sold by Deacero in 2009‐2011 as evidence of Mexican pricing behavior for the in‐scope product if the order on Mexico were to be revoked.52 For me to consider the pricing of this out‐of‐scope product as relevant to behavior of subject imports post‐revocation, I would need to be able to conclude that the small diameter wire rod that would enter the U.S. market will instead enter the U.S. market as subject imports (at least 5.5 mm in diameter) in the reasonably foreseeable future. The statement by Deacero’s counsel that allegedly confirms Deacero’s intentions is tentatively couched in the form of a double negative: Deacero is “not representing today that they won’t ship any 5.5 but the focus is instead going to be 4.75 and we would say all right we heard 4.75 would be most of their imports.”53 I note that there were some exports of 5.5 mm wire rod to the U.S. market by Deacero in 2011‐2013,54 but such imports were only *** percent of the total subject imports from Mexico shown in Table IV‐17 of the confidential staff report over the six‐year period of these reviews.55
Given that a significant volume of subject imports from Mexico is not likely to occur upon revocation and given the mixed record of underselling by subject imports from Mexico (especially when compared with the other five subject countries), I do not find a likelihood of significant adverse price effects from subject imports from Mexico in the event of revocation of the order. I therefore conclude that, if the order on wire rod imports from Mexico were revoked, the volumes of subject imports from Mexico would not be likely to undersell significantly the domestic product or gain market share, nor would such imports be likely to have significant price depressing or suppressing effects. C. Likely Impact of Subject Imports from Mexico Because Mexico was cumulated with other subject countries in both the original investigations and the first sunset review, the Commission has not had the occasion to weigh the individual contribution of Mexico to the likelihood of a continuation or recurrence of material injury in the event of revocation of this order.56 While I do not place heavy emphasis on the imports of 4.75 mm wire rod from Mexico, I would note that it does not appear that,
51 Deacero responses to Commissioners’ questions at Commissioner Question #2 (pages 6‐7); Tr.
at 224‐25 (Campbell). 52 Gerdau Parties’ responses to Commissioners’ questions at 13‐22. 53 Tr. at 210 (Campbell). 54 Deacero prehearing brief at 7 n.18. 55 ArcelorMittal Las Truchas’ foreign producer questionnaire response at 10. 56 In the first review, Chairman Pearson did decumulate Mexico and found that if the order on
subject imports from Mexico were revoked, such imports would not be likely to have a significant adverse impact on the domestic industry. Separate and Dissenting Views of Chairman Daniel R. Pearson, First Reviews, USITC Pub. 4014, at 52.

64
even in 2010—the peak year of imports of the smaller diameter wire rod—there was any adverse impact on the domestic industry.57 In light of my finding that revocation of the antidumping duty order on subject imports from Mexico would not be likely to lead to a significant increase in the volume of subject imports that would undersell the domestic like product and significantly depress or suppress U.S. producers’ prices, I find that, if the order on imports from Mexico were revoked, such imports would not be likely to have a significant adverse impact on the production, shipments, sales, market share, and revenues of the domestic industry. Accordingly, I conclude that, if the order on imports from Mexico were revoked, subject imports from Mexico would not be likely to have a significant adverse impact on the domestic industry within a reasonably foreseeable time. IV. CONCLUSION For the foregoing reasons, I determine that revocation of the antidumping duty order on wire rod from Mexico would not be likely to lead to continuation or recurrence of material injury to the domestic industry within a reasonably foreseeable time.
57 Between 2009 and 2010 (the peak year of imports of the small diameter wire rod), the
financial indicators of the domestic industry generally improved. Operating income jumped from negative 2.6 percent to 4.3 percent. The COGS‐to‐net‐sales ratio also improved, falling by 6.8 percentage points from 98.4 percent in 2009 to 91.6 percent in 2010.
I‐1
PART I: INTRODUCTION AND OVERVIEW
BACKGROUND
On June 3, 2013, the U.S. International Trade Commission (“Commission” or “USITC”) gave notice, pursuant to section 751(c) of the Tariff Act of 1930, as amended (“the Act”),1 that it had instituted reviews to determine whether revocation of the countervailing duty order on carbon and certain alloy steel wire rod (“wire rod”) from Brazil and the antidumping duty orders on wire rod from Brazil, Indonesia, Mexico, Moldova, Trinidad & Tobago, and Ukraine would likely lead to the continuation or recurrence of material injury to a domestic industry.2 3 On September 6, 2013, the Commission determined that it would conduct full reviews pursuant to section 751(c)(5) of the Act. 4
1 19 U.S.C. 1675(c). 2 Carbon and Certain Alloy Steel Wire Rod from Brazil, Indonesia, Mexico, Moldova, Trinidad and
Tobago, and Ukraine: Institution of five‐year reviews, 78 FR 33103, June 3, 2013. All interested parties were requested to respond to this notice by submitting the information requested by the Commission.
3 In accordance with section 751(c) of the Act, the U.S. Department of Commerce (“Commerce”) published a notice of initiation of five‐year reviews of the subject antidumping and countervailing duty orders concurrently with the Commission’s notice of institution. Initiation of Five‐Year (‘‘Sunset’’) Review, 78 FR 33063, June 3, 2013.
4 Carbon and Certain Alloy Steel Wire Rod from Brazil, Indonesia, Mexico, Moldova, Trinidad and Tobago, and Ukraine: Notice of Commission Determination To Conduct Full Five‐Year Reviews, 78 FR 60316, October 1, 2013. The Commission received a joint response to the notice of institution from six U.S. producers of wire rod (ArcelorMittal USA LLC (“ArcelorMittal USA”), Cascade Steel Rolling Mills Inc. (“Cascade”), Evraz Rocky Mountain Steel (currently known as “Evraz Pueblo”), Gerdau Ameristeel US Inc. (“Gerdau”), Keystone Consolidated Industries, Inc. (“Keystone”), and Nucor Corp. (“Nucor”)); one U.S. importer of subject merchandise from Mexico (Deacero USA, Inc. (“Deacero USA”)); and two producers and exporters of the subject merchandise in Mexico (Deacero S.A. de C.V. (“Deacero”) and Ternium Mexico, S.A. de C.V. (“Ternium Mexico”)). The Commission found that the domestic interested party group response and the respondent interested party group response with respect to Mexico were adequate and determined to conduct a full review of the order on wire rod from Mexico. The Commission also found that the respondent interested party group response with regard to the reviews concerning subject imports from Brazil, Indonesia, Moldova, Trinidad & Tobago, and Ukraine to be inadequate because it did not receive a response from any respondent interested parties with respect to those orders. Notwithstanding the inadequate respondent interested party group responses, the Commission determined to conduct full reviews of the orders on wire rod from Brazil, Indonesia, Moldova, Trinidad & Tobago, and Ukraine in order to promote administrative efficiency in light of the Commission’s determination to conduct a full review of the order on wire rod from Mexico.

I‐2
The following tabulation presents information relating to the background and schedule of this proceeding:5
Effective date Action
October 22, 2002 Commerce’s countervailing duty order on wire rod from Brazil and Canada (67 FR 64871)
October 29, 2002 Commerce’s antidumping duty orders on wire rod from Brazil, Canada, Indonesia, Mexico, Moldova, Trinidad & Tobago, and Ukraine (66 FR 65945)
July 30, 2008
Commerce’s first continuation of countervailing duty order on wire rod from Brazil and antidumping duty orders on wire rod from Brazil, Indonesia, Mexico, Moldova, Trinidad & Tobago, and Ukraine (73 FR 44218)
June 3, 2013 Commission’s institution of five‐year reviews (78 FR 33103)
June 3, 2013 Commerce’s initiation of five‐year reviews (78 FR 33063)
October 1, 2013 Commission’s determinations to conduct full five‐year reviews (78 FR 60316)
October 2, 2013 Commerce’s final results of expedited five‐year review of the countervailing duty order on wire rod from Brazil (78 FR 60850)
October 24, 2013
Commerce’s final results of expedited five‐year reviews of the antidumping duty orders on wire rod from Brazil, Indonesia, Mexico, Moldova, Trinidad & Tobago, and Ukraine (78 FR 63450)
December 11, 2013 Commission’s scheduling of the reviews (78 FR 76653, December 18, 2013)
April 22, 2014 Commission’s hearing
May 30, 2014 Commission’s vote
June 16, 2014 Commission’s determinations and views
5 The Commission’s notice of institution, notice to conduct full reviews, scheduling notice, and statement on adequacy are referenced in appendix A and may also be found at the Commission’s web site (internet address www.usitc.gov). Commissioners’ votes on whether to conduct expedited or full reviews may also be found at the web site. Witnesses that appeared at the Commission’s hearing are presented in Appendix B.

I‐3
THE ORIGINAL INVESTIGATIONS
The original investigations resulted from petitions filed by counsel on behalf of Co‐Steel Raritan, Inc., Perth Amboy, New Jersey; GS Industries, Inc., Charlotte, North Carolina; Keystone Consolidated Industries, Inc., Dallas, Texas; and North Star Steel Texas, Inc., Edina, Minnesota, on August 31, 2001, alleging that an industry in the United States is materially injured and threatened with material injury by reason of subsidized imports of wire rod from Brazil, Canada, Germany, Trinidad & Tobago, and Turkey and less‐than‐fair‐value (“LTFV”) imports of wire rod from Brazil, Canada, Egypt, Germany, Indonesia, Mexico, Moldova, South Africa, Trinidad & Tobago, Ukraine, and Venezuela. In October 2002, the Commission determined that a domestic industry was materially injured by reason of subsidized imports of wire rod from Brazil and Canada and by reason of LTFV imports of wire rod from Brazil, Canada, Indonesia, Mexico, Moldova, Trinidad & Tobago, and Ukraine.6 The U.S. Department of Commerce published countervailing duty orders on subject imports from Brazil and Canada on October 22, 2002.7 Commerce published antidumping duty orders on subject imports from Brazil, Canada, Indonesia, Mexico, Moldova, Trinidad & Tobago, and Ukraine on October 29, 2002.8 Effective
6 Carbon and Certain Alloy Steel Wire Rod from Brazil, Canada, Germany, Indonesia, Mexico, Moldova, Trinidad and Tobago, and Ukraine, Inv. Nos. 701‐TA‐417‐421, 731‐TA‐953, 954, 956‐959, 961, and 962 (Final), USITC Publication 3546, October 2002 (“Original Determination”). Subsequent to Commerce’s final negative countervailing duty determinations with respect to Trinidad & Tobago and Turkey, the Commission terminated the countervailing duty investigations concerning those countries. 67 FR 62075, October 3, 2002. The investigations concerning subject imports from Egypt, South Africa, and Venezuela were terminated after the Commission found in its preliminary determination that imports from those three subject countries were negligible. Carbon and Certain Alloy Steel Wire Rod from Brazil, Canada, Egypt, Germany, Indonesia, Mexico, Moldova, South Africa, Trinidad and Tobago, Turkey, Ukraine, and Venezuela, Inv. Nos. 701‐TA‐417‐421,731‐TA‐953‐963 (Preliminary), USITC Publication 3456, October 2001. The antidumping and countervailing duty investigations concerning subject imports from Germany were terminated after the Commission found in its final determination that imports from Germany were negligible. Carbon and Certain Alloy Steel Wire Rod from Brazil, Canada, Germany, Indonesia, Mexico, Moldova, Trinidad and Tobago, Turkey, and Ukraine, Inv. Nos. 701‐TA‐417‐421 and 731‐TA‐953, 954, 956‐959, 961, and 962 (Final), USITC Publication 3546, October 2002.
7 Notice of Countervailing Duty Orders: Carbon and Certain Alloy Steel Wire Rod from Brazil and Canada, 67 FR 64871, October 22, 2002.
8 Notice of Amended Final Determination of Sales at Less Than Fair Value and Antidumping Duty Order: Carbon and Certain Alloy Steel Wire Rod from Canada, 67 FR 65944, October 29, 2002; Notice of Antidumping Duty Orders: Carbon and Certain Alloy Steel Wire Rod from Brazil, Indonesia, Mexico, Moldova, Trinidad and Tobago, and Ukraine, 67 FR 65945, October 29, 2002.

I‐4
January 23, 2004, Commerce revoked the countervailing duty order on subject imports from Canada.9
The only litigation concerning the Commission’s determinations on subject imports at issue in these reviews was an appeal of the Commission’s affirmative determination on subject imports from Trinidad & Tobago.10 The Court of International Trade (“CIT”) affirmed that determination. However, the Federal Circuit vacated and remanded so that: (1) the Commission could ascertain whether imports from subject countries other than Trinidad & Tobago were an alternative cause of injury to the domestic industry and (2) to conduct the analysis required by the decision in Bratsk Aluminum Smelter v. United States, 444 F.3d 1369 (Fed. Cir. 2006). On first remand, the Commission reached a negative determination applying the replacement/benefit test it perceived was mandated by the Federal Circuit.11 The CIT affirmed. On appeal, the Federal Circuit again vacated and remanded. On second remand, the Commission reached an affirmative determination.12 The CIT affirmed. There were no further proceedings.
THE FIRST FIVE‐YEAR REVIEWS
The Commission instituted its first five‐year reviews of the countervailing duty order on wire rod from Brazil and the antidumping duty orders on wire rod from Brazil, Canada, Indonesia, Mexico, Moldova, Trinidad & Tobago, and Ukraine on September 4, 2007.13 ln June 2008, the Commission completed its full first five‐year reviews of the subject orders and determined that revocation of the countervailing duty order on subject imports from Brazil and antidumping orders on subject imports from Brazil, Indonesia, Mexico, Moldova, Trinidad &
9 Carbon and Certain Alloy Steel Wire Rod from Canada: Final Results of Countervailing Duty Changed Circumstances Review and Revocation of Countervailing Duty Order, in Whole, 69 FR 3330, January 23, 2004.
10 Carbon and Certain Alloy Steel Wire Rod from Brazil, Canada, Egypt, Germany, Indonesia, Mexico, Moldova, South Africa, Trinidad and Tobago, Turkey, Ukraine, and Venezuela, Inv. Nos. 701‐TA‐417‐421,731‐TA‐953‐963 (Preliminary), USITC Publication 3456 (October 2001), pp. 36‐38.
11 Carbon and Certain Alloy Steel Wire Rod from Trinidad and Tobago, lnv. No. 731‐TA‐961 (Final) (Remand), USITC Publication 3903, January 2007.
12 Carbon and Certain Alloy Steel Wire Rod from Trinidad and Tobago, lnv. No. 731‐TA‐961 (Final) (Second Remand), USITC Publication 4170, June 2010. Commissioners Okun, Pearson, and Pinkert dissented.
13 Carbon and Certain Alloy Steel Wire Rod from Brazil, Canada, Indonesia, Mexico, Moldova, Trinidad and Tobago, and Ukraine, 72 FR 50696, September 4, 2007.

I‐5
Tobago, and Ukraine would be likely to lead to continuation or recurrence of material injury to an industry in the United States within a reasonably foreseeable time.14
Following affirmative determinations in the first five‐year reviews by Commerce and the Commission,15 Commerce issued a continuation of the countervailing duty order on wire rod from Brazil and the antidumping duty orders on wire rod from Brazil, Indonesia, Mexico, Moldova, Trinidad & Tobago, and Ukraine, effective July 30, 2008.16 The Commission’s determinations in the first five‐year reviews were not appealed.
SUMMARY DATA
Table I‐1 presents a summary of data for the final years of the original investigations (2001) and the first five‐year reviews (2007), and a summary of data collected in the current full second five‐year reviews (2008‐13). A summary of data from the original investigations and first‐five year reviews is presented separately in appendix C.
14 Carbon and Certain Alloy Steel Wire Rod from Brazil, Canada, Indonesia, Mexico, Moldova, Trinidad and Tobago, and Ukraine, Inv. Nos. 701‐TA‐417 and 731‐TA‐953, 954, 957‐959, 961, and 962 (Review), USITC Publication 4014, June 2008. The Commission determined that subject imports from Canada would not be likely to lead to continuation or recurrence of material injury to an industry in the United States within a reasonably foreseeable time. Commissioner Okun dissented from the determination concerning subject imports from Trinidad & Tobago. Commissioner Pearson dissented from the determinations concerning subject imports from Mexico and Trinidad & Tobago. Commissioners Lane and Pinkert dissented from the determination concerning subject imports from Canada.
15 Carbon and Certain Alloy Steel Wire Rod from Brazil, Canada, Indonesia, Mexico, Moldova, Trinidad and Tobago, and Ukraine, 73 FR 41116, July 17, 2008; Carbon and Certain Alloy Steel Wire Rod from Brazil: Final Results of Expedited Five–Year Sunset Review of the Countervailing Duty Order , 73, FR 1323, January 8, 2008; Carbon and Certain Alloy Steel Wire Rod from Brazil, Canada, Indonesia, Mexico, Moldova, Trinidad and Tobago, and Ukraine: Final Results of the Expedited Sunset Reviews of the Antidumping Duty Orders, 73 FR 1321, January 8, 2008.
16 Carbon and Certain Alloy Steel Wire Rod from Brazil, Indonesia, Mexico, Moldova, Trinidad and Tobago, and Ukraine: Continuation of Antidumping and Countervailing Duty Orders, 73 FR 44218, July 30, 2008.

I‐6
Table I-1 Wire rod: Comparative data from the original investigations, first five-year reviews, and second five-year reviews, 2001,
2007, and 2008-13
(Quantity=short tons; Value=1,000 dollars; Unit values, unit labor costs, and unit expenses=dollars per short ton)
Item
Original invs.
First reviews Second reviews
2001 2007 2008 2009 2010 2011 2012 2013 Quantity (short tons)
U.S. consumption *** 5,858,981 *** *** *** *** *** 5,300,149 Share of quantity (percent) Share of U.S. consumption: U.S. producers' share *** 69.6 *** *** *** *** *** 67.9 U.S. importers' share: Brazil *** 0.0 0.0 0.0 0.0 0.0 0.0 0.0 Canada *** *** (1) (1) (1) (1) (1) (1) Indonesia *** 0.0 0.0 0.0 0.0 0.0 0.0 0.0 Mexico *** 0.1 *** *** *** *** *** 0.2 Moldova *** 0.0 0.0 0.0 0.0 0.0 0.0 0.0 Trinidad & Tobago *** 1.6 *** 0.0 0.0 0.0 0.0 0.0 Ukraine *** 0.0 0.0 0.0 0.0 0.0 0.0 0.0 Subtotal, subject sources *** *** *** *** *** *** *** 0.2 Grade 1080 tire cord/bead from subject sources (2) *** *** *** *** *** *** 1.8 All other sources3 *** *** *** *** *** *** *** 30.1 Subtotal, nonsubject *** *** *** *** *** *** *** 31.9 Total imports *** 30.4 *** *** *** *** *** 32.1 Value (1,000 dollars) U.S. consumption *** 3,403,602 *** *** *** *** *** 3,756,412 Share of value (percent) Share of U.S. consumption: U.S. producers' share *** 68.8 *** *** *** *** *** 67.3 U.S. importers' share: Brazil *** 0.0 0.0 0.0 0.0 0.0 0.0 0.0 Canada *** *** (1) (1) (1) (1) (1) (1) Indonesia *** 0.0 0.0 0.0 0.0 0.0 0.0 0.0 Mexico *** 0.1 *** *** *** *** *** 0.2 Moldova *** 0.0 0.0 0.0 0.0 0.0 0.0 0.0 Trinidad & Tobago *** 1.4 *** 0.0 0.0 0.0 0.0 0.0 Ukraine *** 0.0 0.0 0.0 0.0 0.0 0.0 0.0 Subtotal, subject Sources *** *** *** *** *** *** *** 0.2 Grade 1080 tire cord/bead from subject sources (2) *** *** *** *** *** *** 1.7 All other sources3 *** *** *** *** *** *** *** 30.8 Subtotal, nonsubject *** *** *** *** *** *** *** 32.5 Total imports *** 31.2 *** *** *** *** *** 32.7Continued on the following page.

I‐7
Table I-1--Continued Wire rod: Comparative data from the original investigations, first five-year reviews, and second five-year reviews, 2001,
2007, and 2008-13
(Quantity=short tons; Value=1,000 dollars; Unit values, unit labor costs, and unit expenses=dollars per short ton)
Item
Original invs.
First reviews Second reviews
2001 2007 2008 2009 2010 2011 2012 2013U.S. imports from-- Brazil Quantity *** 0 0 0 0 0 0 0 Value *** 0 0 0 0 0 0 0 Unit value *** (4) (4) (4) (4) (4) (4) (4) Canada Quantity *** (1) (1) (1) (1) (1) (1) Value *** (1) (1) (1) (1) (1) (1) Unit value *** (1) (1) (1) (1) (1) (1) Indonesia Quantity *** 0 0 0 0 0 0 0 Value *** 0 0 0 0 0 0 0 Unit value *** (4) (4) (4) (4) (4) (4) (4) Mexico Quantity *** 8,244 *** *** *** *** *** 10,333 Value *** 4,263 *** *** *** *** *** 6,128 Unit value *** $517 *** *** *** *** *** $593Moldova Quantity *** 0 0 0 0 0 0 0 Value *** 0 0 0 0 0 0 0 Unit value *** (4) (4) (4) (4) (4) (4) (4) Trinidad & Tobago Quantity *** 95,325 21,794 0 0 0 0 0 Value *** 46,228 14,298 0 0 0 0 0 Unit value *** $485 $656 (4) (4) (4) (4) (4) Ukraine Quantity *** 0 0 0 0 0 0 0 Value *** 0 0 0 0 0 0 0 Unit value *** (4) (4) (4) (4) (4) (4) (4) Subtotal, subject Quantity *** *** *** *** *** *** *** 10,333 Value *** *** *** *** *** *** *** 6,128 Unit value *** *** *** *** *** *** *** $5931080 tire cord/bead from subject sources: Quantity (2) *** 139,459 71,759 129,184 116,513 102,517 96,639 Value (2) *** 126,654 50,808 91,621 103,073 84,521 64,506 Unit value (2) *** $908 $708 $709 $885 $824 $667Other nonsubject:3
Quantity *** *** 1,536,768 777,083 1,284,771 1,059,512 1,391,895 1,593,718 Value *** *** 1,360,431 550,614 988,457 992,791 1,159,903 1,156,290 Unit value *** *** $885 $709 $769 $937 $833 $726Subtotal, nonsubject Quantity *** *** 1,676,227 848,842 1,413,955 1,176,024 1,494,413 1,690,357 Value *** *** 1,487,085 601,423 1,080,078 1,095,863 1,244,424 1,220,797 Unit value *** *** $887 $709 $764 $932 $833 $722All countries: Quantity *** 1,782,699 *** *** *** *** *** 1,700,690 Value *** 1,063,201 *** *** *** *** *** 1,226,925 Unit value *** $596 *** *** *** *** *** $721Continued on the following page.

I‐8
Table I-1--Continued Wire rod: Comparative data from the original investigations, first five-year reviews, and second five-year reviews, 2001,
2007, and 2008-13
(Quantity=short tons; Value=1,000 dollars; Unit values, unit labor costs, and unit expenses=dollars per short ton)
Item Original
invs. First
reviews Second reviews 2001 2007 2008 2009 2010 2011 2012 2013
U.S. industry: Capacity (quantity) *** 5,429,678 5,546,751 5,295,752 4,965,095 5,173,168 5,131,954 5,073,815Production (quantity) *** 4,067,549 4,055,641 2,837,165 3,384,322 3,907,416 3,879,060 3,655,088Capacity utilization (percent) *** 74.9 73.1 53.6 68.2 75.5 75.6 72.0U.S. shipments: Quantity *** 4,076,282 4,050,961 2,833,426 3,340,954 3,876,145 3,809,728 3,599,459 Value *** 2,340,401 3,485,005 1,651,451 2,246,759 3,012,054 2,826,974 2,529,487 Unit value *** $574 $860 $583 $672 $777 $742 $703Export shipments: Quantity *** *** 39,707 39,301 42,049 34,687 26,748 24,319 Value *** *** 31,925 22,886 26,912 28,888 31,597 22,566 Unit value *** *** $804 $582 $640 $833 $1,181 $928Ending inventory *** 152,512 231,279 195,717 196,677 193,261 235,848 266,868Inventories/total shipments *** *** 5.7 6.8 5.8 4.9 6.1 7.4Production workers *** 2,397 2,339 2,083 2,173 2,239 2,269 2,192Hours worked (1,000) *** 5,174 4,741 3,825 4,220 4,552 4,587 4,258Wages paid ($1,000) *** 161,821 170,467 128,170 145,939 166,385 174,648 156,838Hourly wages *** $31.28 $35.96 $33.51 $34.58 $36.55 $38.07 $36.83Productivity (short tons per 1,000 hours) *** 786.0 855.4 741.7 802.0 858.4 845.7 858.4
Unit labor costs *** $39.78 $42.03 $45.18 $43.12 $42.58 $45.02 $42.91Financial data: Net sales: Quantity *** 4,087,541 4,126,388 2,881,432 3,384,018 3,920,918 3,836,475 3,623,777 Value *** 2,347,208 3,547,031 1,679,395 2,274,325 3,048,561 2,858,572 2,552,054 Unit value *** $574 $860 $583 $672 $778 $745 $704 Cost of goods sold *** 2,219,518 3,116,677 1,652,958 2,083,987 2,743,826 2,622,588 2,358,335 Gross profit (loss) *** 127,690 430,354 26,437 190,338 304,735 235,984 193,719 Operating income (loss) *** 74,869 347,095 (42,915) 98,754 218,013 148,351 107,694 Unit COGS *** $543 $755 $574 $616 $700 $684 $651 Unit operating income *** $18 $84 $(15) $29 $56 $39 $30 COGS/sales (percent) *** 94.6 87.9 98.4 91.6 90.0 91.7 92.4 Operating income (loss)/sales (percent) *** 3.2 9.8 (2.6) 4.3 7.2 5.2 4.21 As Canada is no longer subject to an antidumping duty order, data for Canada are not presented separately from the "all other sources" line for the 2008-13 annual periods. 2 Data on 1080 tire cord/tire bead wire rod were not reported separately in the original investigations. 3 Data on U.S. imports from the Canadian exporter Stelco, which had in previous proceedings been reported separately from the "all other sources" line have been combined into the "all other sources" line. The data presented are overstated by imports of wire rod of less than 5mm in diameter imported from Canada. ***. 4 Undefined.
Source: Compiled from official Commerce statistics and data submitted in response to Commission questionnaires; Investigation Nos. 701-TA-417 and 731-TA-953, 954, 957-959, 961, and 962 (Review): Carbon and Certain Alloy Steel Wire Rod from Brazil, Canada, Indonesia, Mexico, Moldova, Trinidad and Tobago, and Ukraine--Staff Report, INV-FF-058, May 15, 2008, table I-1.

I‐9
As the data presented in table I‐1 show, apparent U.S. consumption of wire rod totaled approximately 5.3 million short tons ($3.8 billion) in 2013. U.S. producers’ U.S. shipments of wire rod totaled 3.6 million short tons ($2.5 billion) in 2013, and accounted for 67.9 percent of the quantity of apparent U.S. consumption. There were no reported U.S. imports from five of the six countries subject to these reviews during 2013. U.S. imports from Mexico (i.e., the only subject country reporting subject imports during 2013) totaled 10,333 short tons ($6.1 million) in 2013 and accounted for 0.2 percent of the quantity of apparent U.S. consumption, whereas total nonsubject U.S. imports (primarily wire rod from China, Canada, and Japan) totaled 1.7 million short tons ($1.2 billion) in 2013 and accounted for 31.9 percent of the quantity of apparent U.S. consumption. The quantity of apparent U.S. consumption has decreased irregularly since 2001, while U. S. producers’ share of consumption has fluctuated upward, reaching its highest levels in 2009 and 2011 before falling to 67.9 percent in 2013. Since the original investigations and the first five‐year reviews, the share of subject imports declined overall, while the share of nonsubject imports generally increased, led by increases in imports from China in recent years.
The three leading sources of subject imports in 2001 and 2007 were, in descending order of magnitude, Canada (no longer subject), Trinidad & Tobago, and Mexico. As previously indicated, the only source of subject imports in 2013 was Mexico. U.S. imports of wire rod from Brazil, Moldova, and Ukraine largely ceased following the imposition of duties in 2002, while U.S. imports of wire rod from Indonesia, the smallest supplier during the original investigations, ceased after 2005. The U.S. imports of wire rod from Trinidad & Tobago ceased after 2008.
The U.S. producers’ reported capacity was lower in 2007 than reported in 2001, while production and capacity utilization fluctuated to a level in 2007 that was higher than reported in 2001. U.S. producers’ reported capacity increased from 2007 to 2008 but generally fell threafter, whereas production and capacity utilization fluctuated from 2007 to 2012 with the lowest levels reported during 2009‐10. The quantity of U.S. producers’ U.S. shipments fluctuated upward from the original investigations (2001) to the first reviews (2007), but fluctuated downward thereafter. The level of employment remained relatively flat from the end of the original investigations through 2007, but declined overall from 2007 to 2013.
RELATED INVESTIGATIONS
Title VII investigations
The Commission has conducted a number of previous import relief investigations on wire rod products or similar merchandise. Table 1‐2 presents data on previous and related title VII investigations.

I‐10
Table I-2 Wire rod: Previous and related title VII investigations
Original investigation First review Second review
Current status Date1 Number Country Outcome Date1 Outcome Date1 Outcome
1982 731-TA-88 Venezuela Negative - - - - -
1982 731-TA-113 Brazil Affirmative - - - - ITA revoked 9/20/85
1982 731-TA-114 Trinidad & Tobago Affirmative - - - - ITA revoked 12/14/87
1982 701-TA-148 Brazil Affirmative2 - - - - Investigation terminated 8/21/85
1982 701-TA-149 Belgium Affirmative2 - - - - Petition withdrawn11/9/82
1982 701-TA-150 France Affirmative2 - - - - Petition withdrawn 11/9/82
1983 701-TA-209 Spain Affirmative - - - - ITA revoked 9/11/85
1983 731-TA-157 Argentina Affirmative 1998 Negative - - -
1983 731-TA-158 Mexico Negative2 - - - - -
1983 731-TA-159 Poland Negative - - - - -
1983 731-TA-160 Spain Affirmative - - - - ITA revoked 9/16/85
1984 731-TA-205 E. Germany Affirmative2 - - - - Petition withdrawn 8/1/85
1985 701-TA-243 Portugal Negative2 - - - - -
1985 701-TA-244 Venezuela Affirmative2 - - - - Petition withdrawn 7/24/85
1985 731-TA-256 Poland Affirmative2 - - - - Petition withdrawn 9/10/85
1985 731-TA-257 Portugal Affirmative2 - - - - Petition withdrawn 11/20/85
1985 731-TA-258 Venezuela Affirmative2 - - - - Petition withdrawn 8/30/85
1992 701-TA-314 Brazil Affirmative 1999 - - - ITA revoked 11/15/99
1992 701-TA-315 France Affirmative 1999 - - - ITA revoked 11/15/99
1992 701-TA-316 Germany Affirmative 1999 - - - ITA revoked 11/15/99
1992 701-TA-317 United Kingdom Affirmative 1999 - - - ITA revoked 11/15/99
1992 731-TA-552 Brazil Affirmative 1999 - - - ITA revoked 11/15/99
1992 731-TA-553 France Affirmative 1999 - - - ITA revoked 11/15/99
1992 731-TA-554 Germany Affirmative 1999 - - - ITA revoked 11/15/99
1992 731-TA-555 United Kingdom Affirmative 1999 - - - ITA revoked 11/15/99
1992 731-TA-572 Brazil Negative - - - - -
1993 731-TA-646 Brazil Negative - - - - -
Table continued on next page.

I‐11
Table I-2--Continued Wire rod: Previous and related title VII investigations
Original investigation First review Second review
Current status Date1 Number Country Outcome Date1 Outcome Date1 Outcome
1993 731-TA-647 Canada Affirmative2 - - - - Petition withdrawn 4/18/94
1993 731-TA-648 Japan Negative - - - - -
1993 731-TA-649 Trinidad & Tobago Negative2 - - - - -
1994 701-TA-359 Germany Negative2 - - - - -
1994 731-TA-686 Belgium Affirmative2 - - - - Petition withdrawn 7/7/94
1994 731-TA-687 Germany Negative2 - - - - -
1997 701-TA-368 Canada Negative - - - - -
1997 701-TA-369 Germany Negligible3 - - - - -
1997 701-TA-370 Trinidad & Tobago Negative - - - - -
1997 701-TA-371 Venezuela Negative - - - - -
1997 731-TA-763 Canada Negative - - - - -
1997 731-TA-764 Germany Negative - - - - -
1997 731-TA-765 Trinidad & Tobago Negative - - - - -
1997 731-TA-766 Venezuela Negative - - - - -
2001 701-TA-417 Brazil Affirmative 2007 Affirmative 2013 - Current review
2001 701-TA-418 Canada Affirmative - - - - ITA revoked 1/23/04
2001 701-TA-419 Germany Negative - - - - -
2001 701-TA-420 Trinidad & Tobago Negative4 - - - - -
2001 701-TA-421 Turkey Negative4 - - - - -
2001 731-TA-953 Brazil Affirmative 2007 Affirmative 2013 - Current review
2001 731-TA-954 Canada Affirmative 2007 Negative - - -
2001 731-TA-955 Egypt Negligible3 - - - - -
2001 731-TA-956 Germany Negligible3 - - - - -
2001 731-TA-957 Indonesia Affirmative 2007 Affirmative 2013 - Current review
2001 731-TA-958 Mexico Affirmative 2007 Affirmative 2013 - Current review
2001 731-TA-959 Moldova Affirmative 2007 Affirmative 2013 - Current review
2001 731-TA-960 South Africa Negligible3 - - - - -
2001 731-TA-961 Trinidad & Tobago Affirmative 2007 Affirmative 2013 - Current review
2001 731-TA-962 Ukraine Affirmative 2007 Affirmative 2013 - Current review
2001 731-TA-963 Venezuela Negligible3 - - - - -
2005 731-TA-1099 China Negative2 - - - - -
2005 731-TA-1100 Germany Negative2 - - - - -
2005 731-TA-1101 Turkey Negative2 - - - - -
2014 701-TA-512 China Affirmative2 - - - - Final determination pending
2014 731-TA-1248 China Affirmative2 - - - - Final determination pending
1 “Date” refers to the year in which the investigation or review was instituted by the Commission. 2 Preliminary determination. 3 The Commission found subject imports to be negligible, and its investigation was thereby terminated. 4 The Department of Commerce made a negative determination.
Source: Various Commission publications.

I‐12
Safeguard investigation
In 1999, the Commission conducted a safeguard investigation under section 202 of the Trade Act of 1974 to determine whether steel wire rod was being imported into the United States in such increased quantities as to be a substantial cause of serious injury, or the threat thereof, to the domestic industry producing an article like or directly competitive with the imported article. The Commission was equally divided in its injury determination.17 The President considered the determination of the Commissioners voting in the affirmative and issued Proclamation 7273 imposing relief in the form of a Tariff Rate Quota (“TRQ”) on imports of steel wire rod for a period of three years and one day, effective March 1, 2000.
Imports of subject products in excess of the quarterly or the annual quota amounts were assessed duties in addition to the column‐1 general rates of duty in the amounts of 10 percent ad valorem in the first year of relief (in‐quota quantity of 1,580,000 short tons); 7.5 percent ad valorem in the second year of relief (in‐quota quantity of 1,611,600 short tons); and 5 percent ad valorem in the third year of relief (in‐quota quantity of 1,643,832 short tons). The President subsequently issued Proclamation 7505 effective November 24, 2001, modifying the TRQ, by providing that the in‐quota quantity of the TRQ be allocated among these four supplier country groupings: European Community; Commonwealth of Independent States; Trinidad and Tobago; and all other countries.18
STATUTORY CRITERIA AND ORGANIZATION OF THE REPORT
Statutory criteria
Section 751(c) of the Act requires Commerce and the Commission to conduct a review no later than five years after the issuance of an antidumping or countervailing duty order or the suspension of an investigation to determine whether revocation of the order or termination of the suspended investigation “would be likely to lead to continuation or recurrence of dumping or a countervailable subsidy (as the case may be) and of material injury.”
Section 752(a) of the Act provides that in making its determination of likelihood of continuation or recurrence of material injury‐‐
(1) IN GENERAL.‐‐ . . . the Commission shall determine whether revocation of an order, or termination of a suspended investigation, would be likely to lead to continuation or recurrence of material injury within a reasonably foreseeable time.
17 Pursuant to section 311(a) of the North American Free Trade Agreement (“NAFTA”) Implementation Act, the Commission made negative findings with respect to imports of wire rod from Canada and Mexico.
18 Carbon and Certain Alloy Steel Wire Rod from Brazil, Canada, Indonesia, Mexico, Moldova, Trinidad and Tobago, and Ukraine, Investigation Nos. 701‐TA‐417 and 731‐TA‐953, 954, 957‐959, 961, and 962 (Review), USITC Publication 4014, June 2008, pp. I‐11‐I‐12.

I‐13
The Commission shall consider the likely volume, price effect, and impact of imports of the subject merchandise on the industry if the order is revoked or the suspended investigation is terminated. The Commission shall take into account‐‐
(A) its prior injury determinations, including the volume, price effect, and impact of imports of the subject merchandise on the industry before the order was issued or the suspension agreement was accepted, (B) whether any improvement in the state of the industry is related to the order or the suspension agreement, (C) whether the industry is vulnerable to material injury if the order is revoked or the suspension agreement is terminated, and (D) in an antidumping proceeding . . ., (Commerce’s findings) regarding duty absorption . . ..
(2) VOLUME.‐‐In evaluating the likely volume of imports of the subject merchandise if the order is revoked or the suspended investigation is terminated, the Commission shall consider whether the likely volume of imports of the subject merchandise would be significant if the order is revoked or the suspended investigation is terminated, either in absolute terms or relative to production or consumption in the United States. In so doing, the Commission shall consider all relevant economic factors, including‐‐
(A) any likely increase in production capacity or existing unused production capacity in the exporting country, (B) existing inventories of the subject merchandise, or likely increases in inventories, (C) the existence of barriers to the importation of such merchandise into countries other than the United States, and (D) the potential for product‐shifting if production facilities in the foreign country, which can be used to produce the subject merchandise, are currently being used to produce other products.
(3) PRICE.‐‐In evaluating the likely price effects of imports of the subject merchandise if the order is revoked or the suspended investigation is terminated, the Commission shall consider whether‐‐
(A) there is likely to be significant price underselling by imports of the subject merchandise as compared to domestic like products, and

I‐14
(B) imports of the subject merchandise are likely to enter the United States at prices that otherwise would have a significant depressing or suppressing effect on the price of domestic like products.
(4) IMPACT ON THE INDUSTRY.‐‐In evaluating the likely impact of imports of the subject merchandise on the industry if the order is revoked or the suspended investigation is terminated, the Commission shall consider all relevant economic factors which are likely to have a bearing on the state of the industry in the United States, including, but not limited to–
(A) likely declines in output, sales, market share, profits, productivity, return on investments, and utilization of capacity, (B) likely negative effects on cash flow, inventories, employment, wages, growth, ability to raise capital, and investment, and (C) likely negative effects on the existing development and production efforts of the industry, including efforts to develop a derivative or more advanced version of the domestic like product.
The Commission shall evaluate all such relevant economic factors . . . within the context of the business cycle and the conditions of competition that are distinctive to the affected industry.
Section 752(a)(6) of the Act states further that in making its determination, “the Commission may consider the magnitude of the margin of dumping or the magnitude of the net countervailable subsidy. If a countervailable subsidy is involved, the Commission shall consider information regarding the nature of the countervailable subsidy and whether the subsidy is a subsidy described in Article 3 or 6.1 of the Subsidies Agreement.”
Organization of report
Information obtained during the course of the reviews that relates to the statutory criteria is presented throughout this report. A summary of trade and financial data for wire rod as collected in the reviews is presented in appendix C. U.S. industry data are based on the questionnaire responses of ten U.S. producers of wire rod that are believed to have accounted for all domestic production of wire rod in 2013. U.S. import data and related information are based on Commerce’s official import statistics and the questionnaire responses of 37 U.S. importers of wire rod. The U.S. producers and importers and their shares of U.S. production and U.S. imports, respectively, are presented later in Part I of this report (see “U.S. Market Participants”). Foreign industry data and related information are based on the questionnaire responses of one producer in Brazil, one producer in Indonesia, three producers in Mexico, one producer in Trinidad & Tobago, and two producers in Ukraine. Coverage information on the eight responding producers in the subject countries are presented in country‐specific sections in Part IV of this report. The producer of wire rod in Moldova did not provide a response to the Commission’s questionnaire. Therefore, the foreign industry data and related information for

I‐15
the wire rod industry in Moldova are based on publicly available industry information and ***. Responses by U.S. producers, importers, purchasers, and foreign producers of wire rod to a series of questions concerning the significance of the existing antidumping and countervailing duty orders and the likely effects of revocation of such orders are presented in appendix D. Appendix E presents financial data for 2011‐13, excluding internal consumption and transfers to related parties. Appendix F presents data and other information with respect to wire rod in diameters less than 5.0 mm.
COMMERCE’S REVIEWS
Administrative reviews19
Commerce has completed one or more administrative reviews of the outstanding antidumping duty orders on wire rod from Brazil, Canada, Indonesia, Mexico, and Trinidad & Tobago. Commerce has completed no administrative reviews of the outstanding antidumping duty orders on wire rod from Moldova and Ukraine, nor of the countervailing duty order on wire rod from Brazil.20
Brazil
Commerce completed one antidumping duty administrative review with regard to the
antidumping duty order on imports of wire rod from Brazil prior to the first five‐year review. The results of the administrative review are shown in table I‐3. Commerce has not conducted any administrative reviews since it issued its final results of the first expedited five‐year review.
Table I-3 Wire rod: Administrative review of the antidumping duty order for Brazil
Date results published Period of review Producer or exporter Margin (percent)
May 17, 2005 (70 FR 28271) 4/10/2002 - 9/30/2003 Belgo Mineira1 98.69All others 74.35
1 ArcelorMittal Brasil is the successor to Belgo Mineira.
Source: Cited Federal Register notice.
19 No duty absorption findings have been made for any of the subject countries. Issues and Decision Memorandum for the Final Results of Expedited Second Sunset Reviews of the Antidumping Duty Orders on Carbon and Certain Alloy Steel Wire Rod from Brazil, Indonesia, Mexico, Moldova, Trinidad and Tobago, and Ukraine, October 17, 2013, p. 5.
20 For previously reviewed or investigated companies not included in an administrative review, the cash deposit rate continues to be the company‐specific rate published for the most recent period.

I‐16
Indonesia
Commerce completed one antidumping duty administrative review with regard to subject imports of wire rod from Indonesia prior to the first five‐year review. The results of the administrative review are shown in table I‐4. Commerce has not conducted any administrative reviews since it issued its final results of the first expedited five‐year review.
Table I-4 Wire rod: Administrative review of the antidumping duty order for Indonesia
Date results published Period of review Producer or exporter Margin (percent)
October 19, 2005 (70 FR 60787) 10/1/2003 - 9/30/2004P.T. Ispat Indo 0.381
All others 4.061 De minimis margin (i.e., margin is less than 0.5 percent), therefore no cash deposit was required to be paid to Customs. Source: Cited Federal Register notice.
Mexico
Commerce completed five antidumping duty administrative reviews with regard to subject imports of wire rod from Mexico. The results of the administrative reviews are shown in table I‐5.
Table I-5 Wire rod: Administrative reviews of the antidumping duty order for Mexico
Date results published Period of review Producer or exporter Margin
(percent)
May 16, 2005 (70 FR 25809) 4/10/2002 - 9/30/2003
Hylsa 5.45Sicartsa 1.06All others 20.11
May 15, 2006 (71 FR 27989) 10/1/2003 - 9/30/2004
Hylsa 1.81Sicartsa 1.26All others 20.11
March 13, 2008 (73 FR 13532) 10/1/2005 - 9/30/2006 Hylsa 17.94
March 7, 2012 (77 FR 13545) 10/01/2009 - 9/30/2010 Arcelor Mittal Las Truchas1 5.59
May 14, 2013 (78 FR 28190) 10/01/2010 - 9/30/2011 Deacero 12.081 Arcelor Mittal Las Truchas is the successor-in-interest to Sicartsa (76 FR 45509, July 29, 2011). Source: Cited Federal Register notices.

I‐17
Trinidad & Tobago
Commerce completed six antidumping duty administrative reviews with regard to subject imports of wire rod from Trinidad & Tobago. The results of the administrative reviews are shown in table I‐6.
Table I-6 Wire rod: Administrative reviews of the antidumping duty order for Trinidad & Tobago
Date results published Period of review Producer or exporter Margin
(percent)
March 15, 2005 (70 FR 12648) 4/10/2002 - 9/30/2003 CIL 3.61All others 11.40
November 16, 2005 (70 FR 69512) 10/1/2003 - 9/30/2004 CIL 4.13All others 11.40
March 6, 2007 (72 FR 9922) 10/1/2004 - 9/30/2005 Mittal Steel Point Lisas 0.061
All others 11.40
November 7, 2007 (72 FR 62824) 1011/2005 - 9/30/2006 Mittal Steel Point Lisas 0.401
All others 11.40March 12, 2009 (74 FR 10722) 10/01/2006 - 9/30/2007 Arcelor Mittal Point Lisas2 1.56February 25, 2010 (75 FR 8650) 10/01/2007 - 9/30/2008 Arcelor Mittal Point Lisas2 23.95
1 De minimis margin (i.e., margin is less than 0.5 percent), therefore no cash deposit was required to be paid to Customs. 2 ArcelorMittal Point Lisas Limited is the successor–in–interest to Mittal Steel Point Lisas (73 FR 30052, May 23, 2008).
Source: Cited Federal Register notices.

I‐18
Changed circumstances reviews
Commerce completed four changed circumstances reviews with regard to imports of wire rod subject to these second five‐year reviews. The results of the changed circumstances reviews are shown in table I‐7.
Table I-7 Wire rod: Changed circumstances reviews
Publication date (FR cite) Requestor Final result
November 12, 2003 (68 FR 64079) Petitioners
Commerce initiated a changed circumstances review to clarify the technical descriptions of certain grade 1080 tire cord/bead quality wire rod that were originally excluded from the scope of the countervailing duty order. In its final results, Commerce amended the technical description so that certain grade 1080 tire cord/bead quality steel wire rod “having no non-deformable inclusions greater than 20 microns and no deformable inclusions greater than 35 microns” rather than just those “having no inclusions greater than 20 microns” were revoked from the countervailing duty order, effective July 24, 2003.
May 23, 2008 (73 FR 30052)
ArcelorMittal Point Lisas
Commerce determined that ArcelorMittal Point Lisas is the successor-in-interest to Mittal Steel Point Lisas Ltd.
May 13, 2009 (74 FR 22514)
Ternium Mexico
Commerce determined that Ternium Mexico is the successor-in-interest to Hylsa.
July 29, 2011 (76 FR 45509)
ArcelorMittal Las Truchas
Commerce determined that ArcelorMittal Las Truchas is the successor-in-interest to Sicartsa.
Source: Cited Federal Register notices.
Scope inquiry reviews
On May 11, 2004, Commerce initiated a scope inquiry to clarify the exclusion for grade 1080 tire cord quality wire rod and tire bead quality wire rod from the antidumping and countervailing duty orders on wire rod from Brazil. On May 9, 2005, Commerce issued a final scope ruling and determined that for grade 1080 tire cord quality wire rod and tire bead quality wire rod, the phrase, “having no inclusions greater than 20 microns” means no inclusions greater than 20 microns in any direction.21
Anti‐circumvention inquiry
On June 8, 2011, at the request of the domestic industry, Commerce initiated a circumvention inquiry into whether Mexican wire rod producers Deacero and Ternium Mexico shipped wire rod with an actual diameter measuring 4.75 mm to 5.00 mm in a manner that
21 Notice of Scope Rulings, 70 FR 55110 (September 20, 2005).

I‐19
constituted merchandise altered in form or appearance in such minor respects that it should be included within the scope.22 On October 1, 2012, Commerce published its final determination of circumvention, finding that (1) Ternium was not covered by the affirmative anti‐circumvention inquiry because it had not shipped wire rod with diameters of 4.75 to 5.0 mm to the United States; and (2) shipments of wire rod with an actual diameter of 4.75 mm to 5.00 mm by Deacero constituted merchandise altered in form or appearance in such minor respects that it should be included within the scope of the order on wire rod from Mexico.23 Deacero appealed Commerce’s final circumvention finding to the CIT and a remand order was issued on September 30, 2013.24 Pursuant to the direction from the CIT, Commerce reversed its final determination “under respectful protest” and found on final remand that wire rod with an actual diameter of 4.75 mm to 5.00 mm shipped to the United States by Deacero is outside the scope of the order and, thus, such shipments do not constitute a circumventing minor alteration.25 The CIT ruling on Commerce’s final remand determination is pending.
Certain data and other information concerning the Mexican production, U.S. imports, and U.S. purchases of the imported smaller diameter wire rod (4.75 mm to 5.0 mm) produced by Deacero in Mexico were requested in these reviews. As noted above, such information provided in response to questionnaires transmitted to U.S. importers, purchasers, and foreign producer Deacero is presented separately in appendix F.
Five‐year reviews
Countervailing duty order concerning Brazil
Commerce has issued the final results of its expedited second five‐year review of the countervailing duty order concerning Brazil.26 Table I‐8 presents information with respect to the countervailable subsidies found by Commerce in the original investigation and subsequent five‐year reviews.
22 Carbon and Certain Alloy Steel Wire Rod from Mexico: Initiation of Anti‐Circumvention Inquiry of Antidumping Duty Order, 76 FR 33218, June 8, 2011.
23 Carbon and Certain Alloy Steel Wire Rod from Mexico: Affirmative Final Determination of Circumvention of the Antidumping Order, 77 FR 59892, October 1, 2012.
24 Deacero S.A. de C.V. and Deacero USA Inc. v. United States and Arcelormittal USA LLC, Gerdau Ameristeel U.S. Inc., Evraz Rocky Mountain Steel, and Nucor Corporation, Court No. 12‐00345; Slip Op. 13‐126 (CIT 2013) (“Deacero Remand”).
25 Final Results of Redetermination Pursuant to Court Remand (Deacero Remand), Office of Enforcement & Compliance, International Trade Administration, January 28, 2014.
26 Carbon and Certain Alloy Steel Wire Rod from Brazil: Final Results of the Expedited Second Sunset Review of the Countervailing Duty Order, 78 FR 60850, October 2, 2013; and Issues and Decision Memorandum for the Final Results of the Expedited Sunset Review of the Countervailing Duty Order on Carbon and Certain Alloy Steel Wire Rod from Brazil, September 25, 2013.

I‐20
Table I-8 Wire rod: Commerce’s original and first and second five-year countervailable subsidy margins for producers/exporters in Brazil
Producer/exporter Original margin
(percent) First five-year review
margin (percent)
Second five-year review margin
(percent)
Belgo Mineira1 6.74 6.74 6.74
Gerdau SA 2.76 2.76 2.31
All others 5.64 5.64 4.531 ArcelorMittal Brasil is the successor to Belgo Mineira. Source: Countervailing duty order, 67 FR 64871, October 22, 2002; final results of first expedited sunset review, 73 FR 1323, January 8, 2008; final results of second expedited sunset review, 78 FR 60850, October 2, 2013.
The following seven programs were found by Commerce to confer countervailable subsidies in the original investigation:
1. Financing for the Acquisition or Lease of Machinery and Equipment through the
Special Agency for Industrial Financing; 2. Programa de Financiamento as Exportações; 3. Tax Incentives Provided by the Amazon Region Development Authority (“SUDAM”)
and the Northeast Region Development Authority (“SUDENE”); 4. Debt Forgiveness/Equity Infusions Provided to Usina Siderurgica da Bahia S.A.
(previously 1988 Equity Infusions/Debt Forgiveness Provided to Usina Siderurgica da Bahia S.A.) (specific to Gerdau S.A. (Gerdau));
5. National Bank for Economic and Social Development Financing for the Acquisition of Dedini Siderurgica de Piracicaba (specific to Companhia Siderugica Belgo‐Mineira (Belgo Mineira));
6. National Bank for Economic and Social Development Financing for the Acquisition of Mendes Junior Siderurgica S.A. (specific to Belgo Mineira); and
7. “Presumed” Tax Credit for the Program of Social Integration and the Social Contributions of Billings on Inputs Used in Exports. In the second five‐year review of the countervailing duty order concerning Brazil,
Commerce found that these countervailable programs continue to exist and be used by Brazilian producers and exporters of wire rod and that a countervailable subsidy is likely to continue or recur if the order is revoked. Although it did not remove the “Debt Forgiveness/Equity Infusions Provided to Usina Siderurgica da Bahia S.A.” program, Commerce recalculated the rate for Gerdau and “All others” to remove the ad valorem subsidy rate of 0.45 percent attributed to Gerdau under this program because the benefits received by Gerdau in

I‐21
1986, 1987, and 1989 were fully allocated over the average useful life of the subject merchandise (i.e., 15 years).27
Commerce also found that three of the seven programs fall under Article 3.1 of the SCM Agreement,28 which states that the following subsidies shall be prohibited: (a) subsidies contingent, in law or in fact, whether solely or as one of several other conditions, upon export performance; and (b) subsidies contingent, whether solely or as one of several other conditions, upon the use of domestic over imported goods.
1. Programa de Financiamento as Exportações 2. “Presumed” Tax Credit for the Program of Social Integration and the Social
Contributions of Billings on Inputs Used in Exports 3. Financing for the Acquisition or Lease of Machinery and Equipment through the
Special Agency for Industrial Financing
Commerce found that the remaining four programs do not fall within the meaning of Article 3.1 of the SCM Agreement, but could be subsidies described in Article 6.1 of the SCM Agreement if the amount of the subsidy exceeds five percent, as measured in accordance with Annex IV of the SCM Agreement. They also could fall within the meaning of Article 6.1 if they constitute debt forgiveness, grants to cover debt repayment, or are subsidies to cover operating losses sustained by an industry or enterprise. However, Commerce found that there was insufficient information on the record of the second five‐year review in order to make such a determination.
27 Commerce noted that although the benefits Gerdau received under “Debt Forgiveness/Equity Infusions Provided to Usina Siderurgica da Bahia S.A.” were non‐recurring in nature and were fully allocated over the average useful life of the subject merchandise, the non‐recurring subsidy program was not removed because there is no information on the record that it was terminated. Issues and Decision Memorandum for the Final Results of the Expedited Sunset Review of the Countervailing Duty Order on Carbon and Certain Alloy Steel Wire Rod from Brazil, September 25, 2013.
28 Consistent with section 752(a)(6) of the Act, Commerce provided information concerning the nature of the subsidy and whether it is a subsidy described in Article 3 or Article 6.1 of the 1994 World Trade Organization Agreement on Subsidies and Countervailing Measures (“SCM Agreement”). It noted, however, that Article 6.1 of the SCM Agreement expired effective January 1, 2000. Issues and Decision Memorandum for the Final Results of the Expedited Sunset Review of the Countervailing Duty Order on Carbon and Certain Alloy Steel Wire Rod from Brazil, September 25, 2013.

I‐22
Antidumping duty orders
Commerce has issued the final results of its expedited second five‐year reviews of the antidumping duty orders concerning Brazil, Indonesia, Mexico, Moldova, Trinidad & Tobago, and Ukraine.29 Table I‐9 presents information with respect to the dumping margins.
Table I-9 Wire rod: Commerce’s original and first and second five-year dumping margins for producers/exporters, by subject country
Producer/exporter Original margin
(percent)
First five-year review margin
(percent)
Second five-year review
margin (percent)
Brazil
Belgo Mineira/Arcelor Mittal Brasil 94.73 94.73 94.73
All others 74.35 74.45 74.45
Indonesia
PT Ispat Indo 4.06 4.06 4.05
All others 4.06 4.06 4.05
Mexico
Sicartsa/ArcelorMittal Las Truchas 20.11 20.11 20.11
All others 20.11 20.11 20.11
Moldova
Moldova-wide rate 369.10 369.10 369.10
Trinidad & Tobago
Caribbean Ispat/ArcelorMittal Point Lisas 11.40 11.40 11.40
All others 11.40 11.40 11.40
Ukraine
Krivorozhstal 116.37 116.37 116.37
All others 116.37 116.37 116.37
Source: Antidumping duty order, 67 FR 34899, May 16, 2002; final results of expedited sunset review, 73 FR 1321, January 8, 2008; final results of second expedited sunset review, 78 FR 63450, October 24, 2013.
29 Carbon and Certain Alloy Steel Wire Rod from Brazil, Indonesia, Mexico, Moldova, Trinidad and Tobago, and Ukraine: Final Results of the Expedited Second Sunset Reviews of the Antidumping Duty Orders, 78 FR 63450, October 24, 2013.
I‐23
THE SUBJECT MERCHANDISE
Commerce’s scope
The scope of these reviews as defined by Commerce in its expedited second five‐year review determinations is as follows:
The merchandise subject to these orders is certain hot‐rolled
products of carbon steel and alloy steel, in coils, of approximately round cross section, 5.00 mm or more, but less than 19.00 mm, in solid cross‐sectional diameter.
Specifically excluded are steel products possessing the above‐noted physical characteristics and meeting the Harmonized Tariff Schedule of the United States (“HTSUS”) definitions for (a) stainless steel; (b) tool steel; c) high nickel steel; (d) ball bearing steel; and (e) concrete reinforcing bars and rods.
Also excluded are (f) free machining steel products (i.e., products that contain by weight one or more of the following elements: 0.03 percent or more of lead, 0.05 percent or more of bismuth, 0.08 percent or more of sulfur, more than 0.04 percent of phosphorus, more than 0.05 percent of selenium, or more than 0.01 percent of tellurium). Also excluded from the scope are 1080 grade tire cord quality wire rod and 1080 grade tire bead quality wire rod. This grade 1080 tire cord quality rod is defined as: (i) grade 1080 tire cord quality wire rod measuring 5.0 mm or more but not more than 6.0 mm in cross‐sectional diameter; (ii) with an average partial decarburization of no more than 70 microns in depth (maximum individual 200 microns); (iii) having no non‐deformable inclusions greater than 20 microns and no deformable inclusions greater than 35 microns; (iv) having a carbon segregation per heat average of 3.0 or better using European Method NFA 04‐114; (v) having a surface quality with no surface defects of a length greater than 0.15 mm; (vi) capable of being drawn to a diameter of 0.30 mm or less with 3 or fewer breaks per ton, and (vii) containing by weight the following elements in the proportions shown: (1) 0.78 percent or more of carbon, (2) less than 0.01 percent of aluminum, (3) 0.040 percent or less, in the aggregate, of phosphorus and sulfur, (4) 0.006 percent or less of nitrogen, and (5) not more than 0.15 percent, in the aggregate, of copper, nickel and chromium.
This grade 1080 tire bead quality rod is defined as: (i) grade 1080 tire bead quality wire rod measuring 5.5 mm or more but not more than 7.0 mm in cross‐sectional diameter; (ii) with an average partial decarburization of no more than 70 microns in depth (maximum individual 200 microns); (iii) having no non‐deformable inclusions greater

I‐24
than 20 microns and no deformable inclusions greater than 35 microns; (iv) having a carbon segregation per heat average of 3.0 or better using European Method NFA 04‐114; (v) having a surface quality with no surface defects of a length greater than 0.2 mm; (vi) capable of being drawn to a diameter of 0.78 mm or larger with 0.5 or fewer breaks per ton; and (vii) containing by weight the following elements in the proportions shown: (1) 0.78 percent or more of carbon, (2) less than 0.01 percent of soluble aluminum, (3) 0.040 percent or less, in the aggregate, of phosphorus and sulfur, (4) 0.008 percent or less of nitrogen, and (5) either not more than 0.15 percent, in the aggregate, of copper, nickel and chromium (if chromium is not specified), or not more than 0.10 percent in the aggregate of copper and nickel and a chromium content of 0.24 to 0.30 percent (if chromium is specified).
For purposes of the grade 1080 tire cord quality wire rod and the grade 1080 tire bead quality wire rod, an inclusion will be considered to be deformable if its ratio of length (measured along the axis ‐ that is, the direction of rolling ‐ of the rod) over thickness (measured on the same inclusion in a direction perpendicular to the axis of the rod) is equal to or greater than three. The size of an inclusion for purposes of the 20 microns and 35 microns limitations is the measurement of the largest dimension observed on a longitudinal section measured in a direction perpendicular to the axis of the rod. This measurement methodology applies only to inclusions on certain grade 1080 tire cord quality wire rod and certain grade 1080 tire bead quality wire rod that are entered, or withdrawn from warehouse, for consumption on or after July 24, 2003.
The designation of the products as “tire cord quality” or “tire bead quality” indicates the acceptability of the product for use in the production of tire cord, tire bead, or wire for use in other rubber reinforcement applications such as hose wire. These quality designations are presumed to indicate that these products are being used in tire cord, tire bead, and other rubber reinforcement applications, and such merchandise intended for the tire cord, tire bead, or other rubber reinforcement applications is not included in the scope. However, should the petitioners or other interested parties provide a reasonable basis to believe or suspect that there exists a pattern of importation of such products for other than those applications, end‐use certification for all products meeting the physical description of subject merchandise that are not specifically excluded are included in this scope.30
30 For additional information regarding Deacero’s exports of wire rod, see the “Anti‐circumvention inquiry” section of this chapter.

I‐25
Tariff treatment
Wire rod is imported under the following statistical reporting numbers of the Harmonized Tariff Schedule of the United States (“HTSUS” or “HTS”): 7213.91.3011, 7213.91.3015, 7213.91.3020 (added on July 1, 2008), 7213.91.3092 (discontinued on July 1, 2008), 7213.91.3093 (added on July 1, 2008),31 7213.91.4500, 7213.91.6000, 7213.99.0030, 7213.99.0090, 7227.20.0000 (discontinued on July 1, 2008), 7227.20.0030 (added on July 1, 2008), 7227.20.0080 (added on July 1, 2008),32 7227.90.6010, 7227.90.6020 (added on July 1, 2008), 7227.90.6030 (added on January 1, 2014), 7227.90.6035 (added on January 1, 2014), 7227.90.6080 (discontinued on July 1, 2008),33 and 7227.90.6085 (added on July 1, 2008, and discontinued on January 1, 2014).34 At the time of the original investigations general U.S. tariffs on wire rod, applicable to U.S. imports that are products of the subject countries and reported under these provisions, ranged from 0.8 to 0.9 percent ad valorem for nonalloy steel and were 1.8 percent ad valorem for alloy steel. By January 1, 2004, these tariffs had been eliminated, resulting in a general duty rate of “Free.”
31 HTS 7213.91.3092 was replaced with two new breakouts, specifically 7213.91.3020 (covering welding‐quality, nonalloy wire rod, with a circular diameter of less than 14 mm, not tempered, not treated and not partly manufactured) and 7213.91.3093 (covering other than of welding quality, nonalloy wire rod with a circular diameter of less than 14 mm, not tempered, not treated and not partly manufactured). HTSUS 2008 ‐ Supplement 1, “Change Record,” July 1, 2008, p. 11; HTSUS 2008 ‐ Supplement 1, “Chapter 72 Iron and Steel,” July 1, 2008, p. XV 72‐18; and HTSUS 2008 – Revision 2, “Chapter 72 Iron and Steel,” April 16, 2008, p. XV 72‐18. 32 HTS 7227.20.0000 was replaced with two new breakouts, specifically 7227.20.0030 (covering welding‐quality, silico‐manganese alloy wire rod) and 7227.20.0080 (covering other than of welding quality, silico‐manganese alloy wire rod). HTSUS 2008 ‐ Supplement 1, “Change Record,” July 1, 2008, p. 11; HTSUS 2008 ‐ Supplement 1, “Chapter 72 Iron and Steel,” July 1, 2008, p. XV 72‐36; and HTSUS 2008 – Revision 2, “Chapter 72 Iron and Steel,” April 16, 2008, p. XV 72‐36. 33 HTS 7227.90.6080 was replaced with two new breakouts, specifically 7227.90.6020 (covering welding‐quality, other alloy wire rod) and 7227.90.6085 (covering other than of welding quality, other alloy wire rod). HTSUS 2008 ‐ Supplement 1, “Change Record,” July 1, 2008, p. 11; HTSUS 2008 ‐ Supplement 1, “Chapter 72 Iron and Steel,” July 1, 2008, p. XV 72‐36; and HTSUS 2008 – Revision 2, “Chapter 72 Iron and Steel,” April 16, 2008, p. XV 72‐36. 34 HTS 7227.90.6085 was replaced with four new breakouts, including 7227.90.6030 (covering other alloy wire rod with a circular diameter of less than 14 mm) and 7227.90.6035 (covering other alloy wire rod with a circular diameter of 14 mm or more but less than 19 mm). The other two new breakouts, 7227.90.6040 (other alloy bars and rods with a circular diameter of 19 mm or more) and 7227.90.6090 (cross‐section shapes other than circular), are considered bar and rod products outside the scope of these investigations. HTSUS 2014 ‐ Basic, “Change Record,” January 1, 2014, pp. 6‐7; and HTSUS 2014 ‐ Basic, “Iron and Steel,” January 1, 2014, p. XV 72‐36.

I‐26
THE PRODUCT
Description and applications35
Wire rod is a hot‐rolled intermediate steel product of circular or approximately circular cross section that typically is produced in nominal fractional diameters up to 47/64 inch (18.7 mm) and sold in irregularly wound coils, primarily for subsequent drawing and finishing by wire drawers.36 Wire rod is essentially used only to manufacture wire, which is either fabricated into downstream wire products or incorporated into finished products.37 Wire rod sold in the United States is categorized by “quality” according to end use. End‐use categories are broad descriptions with overlapping metallurgical qualities, chemistries,38 and physical characteristics.39
Table I‐10 presents quality and commodity descriptions for 11 major types of wire rod, as indicated by the Iron and Steel Society. Industrial quality wire rod currently accounts for the majority of wire rod consumed in the United States. It is primarily intended for drawing into industrial (or standard) quality wire that, in turn, is used to manufacture such products as nails, reinforcing wire mesh and chain link fence. Most of the industrial quality wire rod is produced and sold in the smallest cross‐sectional diameter that is hot rolled in substantial commercial quantities (7/32 inch or 5.5 mm). Industrial quality wire rod generally is manufactured from low‐ or medium‐low‐carbon steel.40 Other relatively large‐volume qualities of wire rod consumed in the United States include high‐ and medium‐high carbon and cold‐heading quality.
35 Carbon and Certain Alloy Steel Wire Rod from China, Inv. Nos. 701‐TA‐512 and 731‐TA‐1248 (Preliminary), USITC Publication 4458, March 2014, pp. I‐10 – I‐12; Carbon and Certain Alloy Steel Wire Rod from Brazil, Canada, Indonesia, Mexico, Moldova, Trinidad and Tobago, and Ukraine, Inv. Nos. 701‐TA‐417 and 731‐TA‐953, 954, 957‐959, 961, and 962 (Review), USITC Publication 4014, June 2008, pp. I‐22 – I‐24; and Carbon and Certain Alloy Steel Wire Rod from China, Germany, and Turkey, Inv. Nos. 731‐TA‐1099‐1101 (Preliminary), USITC Publication 3832, January 2006, pp. I‐6 – I‐7.
36 Wire drawers (also referred to as redrawers) manufacture wire and wire products and may be either independent or afflilated with wire rod producers.
37 Carbon and Certain Alloy Steel Wire Rod from China, Inv. Nos. 701‐TA‐512 and 731‐TA‐1248 (Preliminary), USITC Publication 4458, March 2014, p. I‐11.
38 Steel chemistries are designated as “grades” of standardized composition ranges for carbon, nonferrous metals, and nonmetallic elements. See e.g., table 2‐1, Standard Steels for Wire Rods and Wire Nonresulfurized Carbon Steels, Manganese Maximum Not Exceeding 1.00 Percent. Iron and Steel Society, Steel Products Manual: Carbon Steel Wire and Rods, August 1993, p. 6. Wire rod of AISI/SAE grade 1080 steel contains 0.75‐0.88 percent carbon, 0.60‐0.90 manganese, a maximum of 0.040 percent phosphorous, and 0.050 percent sulfur. Ibid.
39 Steel ductility, hardness, and tensile strength are positively correlated with carbon content. Alloying elements can be added at the steel melting stage of the manufacturing process to impart various characteristics to the wire rod.
40 Iron and Steel Society, Steel Products Manual: Carbon Steel Wire and Rods, August 1993, p. 36.

I‐27
High‐ and medium‐high carbon wire rod are intended for drawing into wire for such products as strand, upholstery spring, mechanical spring, rope, screens, and pre‐stressed concrete wire.41
Table I-10 Wire rod: Quality, end uses, and important characteristics
Quality End uses Important characteristics
Chain quality Electric welded chain Butt-welding properties and uniform internal soundness
Cold-finishing quality Cold-drawn bars Surface quality
Cold-heading quality Cold-heading, cold-forging, cold-extrusion products
Internal soundness, good surface quality, may require thermal treatments
Concrete reinforcement
Nondeformed rods for reinforcing concrete (plain round or smooth surface rounds)
Chemical composition important only insofar as it affects mechanical property
Fine wire Insect screen, weaving wire, florist wire
Rods must be suitable for drawing into wire sizes as small as 0.035 inch (0.889 mm) without intermediate annealing; internal quality important
High carbon and medium-high carbon
Strand and rope, tire bead, upholstery spring, mechanical spring, screens, aluminum conductors steel reinforced core, pre-stressed concrete strand; pipe wrap wire is a subset
Requires thermal treatment prior to drawing; however, it is not intended to be used for music wire or valve spring wire
Industrial (standard) quality
Nails, coat hangers, mesh for concrete reinforcement, fencing
Can only be drawn a limited number of times before requiring thermal treatment
Music spring wire Springs subject to high stress; valve springs are a subset
Restrictive requirements for chemistry, cleanliness, segregation, decarburization, surface imperfections
Scrapless nut
Fasteners produced by cold heading, cold expanding, cold punching, thread tapping Internal soundness, good surface quality
Tire cord Tread reinforcement in pneumatic tires
Restrictive requirements for cleanliness, segregation, decarburization, chemistry, surface imperfections
Welding quality
Wire for gas welding, electric arc welding, submerged arc welding, metal inert gas welding Restrictive requirements for uniform chemistry
Source: Iron and Steel Society, Steel Products Manual: Carbon Steel Wire and Rods, August 1993, pp. 35-37.
41 The end uses of very high quality wire rod are those where manufacturing process involve large amounts of cold deformation of the steel such as in recessed quality cold heading; those that are safety critical, such as automotive wheel bolts and tire reinforcing wire; those that have very demanding consistency requirements or unusual steel chemistry requirements, such as certain welding grades; and other applications that put unusual and demanding requirements on the steel.

I‐28
According to witnesses for domestic producers, there are no specific types of wire rod within the scope of these investigations that the domestic industry cannot supply.42 Moreover, a witness further testified that the domestic industry supplies the full range of wire rods purchased in the U.S. market.43 Counsel for domestic producers testified that wire rod below 5.5 mm in diameter was not commercially available at the time of the original investigations (August 31, 2001), as no firm in the United States, Mexico, or any other subject country produced and sold such smaller diameter wire rod in the U.S. market.44 Witnesses for Evraz Pueblo, Gerdau, and Nucor testified that their firms do not produce smaller diameter (4.75 mm) wire rod in the United States.45 Counsel for Deacero observed that Charter Steel produced wire rod of diameters as small as 4.0 mm, prior to the issuance of antidumping orders.46 However, Charter Steel no longer produces this product,47 having ***.48 According to domestic‐industry witnesses, customers did not request 4.75 mm diameter wire rod,49 as smaller diameter wire rod was not necessary to manufacture their downstream products.50 Moreover, Evraz Pueblo, Gerdau, and Nucor declined to pursue production of smaller diameter wire rod, concluding that the product price required to justify the capital investment and production costs was too high for the anticipated market conditions.51
Mexican producer Deacero described its U.S. shipments as predominantly of smaller diameter, 4.75 mm wire rod.52 According to Deacero witnesses, the firm did not supply wire rod to the U.S. market prior to 2008, when U.S. customers inquired about 4.75 mm wire rod,53 a size not otherwise available from domestic producers during the period of review.54 Previously,
42 Hearing transcript, pp. 118 (Goettl), 118 (Strinaman), and 119 (Ashby).
43 Hearing transcript, p. 46 (Ashby).
44 Hearing transcript, p. 71 (Luberda).
45 Hearing transcript, pp. 74 (Ashby), 74 (Kerkvliet), and 89 (Nystrom).
46 Deacero’s prehearing brief, p. 10; and exhibit 5, Certain Steel Wire Rod from Brazil and Japan, Inv. Nos. 701‐TA‐646 and 648 (Final), USITC Publication 2761, March 1994, p. II‐22; and Charter Steel, “History.”
47 Charter Steel currently produces wire rod in diameters ranging from 5.5 mm to 40 mm. Charter Steel, “Products & Capabilities, Bar & Rod Rolling,” http://www.chartersteel.com/products/rolling.php.
48 The representative of Charter Steel ***, e‐mail correspondence with Commission staff, May 1, 2, and 6, 2014.
49 Hearing transcript, pp. 74 (Ashby), 74 (Kerkvliet), and 75 and 89 (Nystrom).
50 Hearing transcript, p. 89 (Goettl).
51 Hearing transcript, pp. 74 (Ashby), 74 (Kerkvliet) and 89 (Goettl), and 75 (Nystrom).
52 During the review period, nearly *** percent of U.S. wire‐rod imports from Mexico were of 4.75 mm diameter wire rod. Deacero’s prehearing brief, p. 8.
53 Hearing transcript, pp. 144 (D. Gutierrez) and 179 (S. Gutierrez).
54 Deacero’s prehearing brief, pp. 8‐9; and hearing transcript, p. 20 (Campbell).
I‐29
the smallest diameter wire rod produced by Deacero was 5.5 mm in diameter.55 Considering the potential demand as justification for the investment, after more than a year in development, Deacero began production of 4.75 mm wire rod at its Celaya mill.56 Deacero began selling its 4.75 mm diameter wire rod into the U.S. market beginning in October 2008.57
A witness for G3 Steel Group LLC (“G3 Steel”), a U.S. distributor that began selling Deacero’s 4.75 mm wire rod in 2009 and continued to do so until 2012, testified that some customers requested this smaller diameter wire rod because they previously purchased it from Ivaco of Canada.58 Ivaco Rolling Mills (Ivaco) produces wire rod at its rolling mill in L'Orignal, Ontario, with annual wire rod production capacity of 850,000 tons. Ivaco currently hot‐rolls wire rods in diameters ranging from 4.75 mm to 25.5 mm,59 of various carbon and alloy steel grades, with more than 80 pecent of its output being produced for high‐carbon, cold‐heading, and welding quality applications.60 In contrast, Deacero reportedly produces predominantly low to medium‐low carbon industrial‐quality wire rod.61
Deacero attributed continued growth in its sales of 4.75 mm diameter wire rod in the U.S. market to advantages identified by its customers for using 4.75 mm over 5.5 mm wire rod (the most common diameter sold in the United States).62 Deacero and its customers highlighted cost savings63 as well as the ability to manufacture new64 and improved wire products.65
55 Hearing transcript, p. 144 (D. Gutierrez).
56 Hearing transcript, pp. 144 (D. Gutierrez) and 184 (E. Gutierrez). Celaya is located in the southeastern portion of the north‐central Mexican state of Guanajuato.
57 Deacero’s prehearing brief, p. 9.
58 Hearing transcript, pp. 145‐146 (Heileg).
59 Ivaco requires a minimum order size of 750 metric tons (827 short tons) for its 4.75 mm wire rod, but only 600 metric tons (661 short tons) for ordering all other diameters. Ivaco, “Rolling Schedule, May 1, 2014,” http://www.ivacorm.com/RollingSchedule.
60 See: Ivaco, “Products,” http://www.ivacorm.com/Products.
61 Deacero’s posthearing brief, “Responses to Commissioner questions,” p. 5.
62 Hearing transcript, pp. 144‐145 (D. Gutierrez); Deacero’s prehearing brief, pp. 10‐12; and exhibit 7, “Purchaser declarations.” For further details, see also, Deacero’s posthearing brief, exhibit 5, “Purchaser statements regarding 4.75 mm wire rod and summary sheet.”
63 A witness for Cavert Wire Co. (Cavert) claimed that drawing 4.75 mm wire rod required only three dies as opposed to the four dies required for drawing 5.5 mm wire rod to produce steel wire; using one less die reduced its production costs by 25 percent (i.e., for electricity, cooling lubricants, and replacement dies), and speeded‐up production and increased productivity. Further, 5.5 mm wire rod was previously reduced in the first draft (draw) down to a diameter of about 0.187 inch (4.75 mm), so starting with 4.75 mm wire rod already achieves the initial 0.187‐inch diameter even before beginning the drawing process. Hearing transcript, pp. 149‐150 (Spittler); Deacero’s prehearing brief, pp. 10‐11; and Deacero’s posthearing brief, pp. 13‐14.
Further, a witness for G3 Steel testified that wire drawers can draw‐down 4.75 mm wire rod directly to finer diameter wire without having to anneal (heat treat) the wire to restore ductility by relieving accumulated work hardening and brittleness, as less drawing is required. In contrast, 5.5 mm
(continued...)

I‐30
Domestic producers66 and respondent Deacero67 generally agree that 4.75 mm wire rod is a substitute for 5.5 mm wire rod, the most common diameter sold in the United States. However, witnesses for domestic producers testified there are no downstream applications that require use of 4.75 mm wire rod.68 Witnesses and counsel for domestic producers describe cost savings as “minimal” from drawing smaller diameter 4.75 mm wire rod,69 and one witnesses characterized the users of this lower diameter wire rod as benefitting much more from lower rod prices than lower costs of wire production.70
Manufacturing processes71
The manufacturing process for wire rod consists of several stages: (1) melting and refining to set the steel’s chemical and metallurgical properties; (2) casting the steel into a semifinished shape (billet); (3) hot‐rolling the billet into rod on a multistand, high‐speed rolling mill; and (4) coiling and controlled cooling of the wire rod as it passes along a Stelmor deck, a
(…continued) wire rod requires annealing to achieve some finer diameter wires, which raises production costs through longer production times and additional natural‐gas consumption. Wire annealing also requires wire drawers to either operate and maintain their own annealing equipment or outsource the annealing process to other firms. Hearing transcript, pp. 146‐174 (Heileg); Deacero’s prehearing brief, p. 11; and Deacero’s posthearing brief, pp. 14‐15.
Finally, according to the witness, a G3 Steel customer mentioned experiencing fewer wire breaks, better tool life, and improved production “uptime” (i.e., less production downtime) with 4.75 mm wire rod, as opposed to using larger diameter wire rod. Hearing transcript, p. 147 (Heileg).
64 Starting with 4.75 mm wire rod also expands Cavert’s capabilities to produce smaller diameter wire, down to 16‐gauge (0.062‐inch diameter) wire as opposed to 14‐gauge (0.08‐inch diameter) wire with 5.5 millimeter wire rod. Hearing transcript, pp. 149‐150 (Spittler); Deacero’s prehearing brief, pp. 10‐11; and Deacero’s posthearing brief, p. 15.
65 Another advantage of using smaller diameter (4.75 mm) wire rod is enhanced product quality as fewer draws reduce the likelihood of imparting drawing defects and work hardening and brittleness in the wire. Deacero’s prehearing brief, p. 11; and Deacero’s posthearing brief, pp. 15‐16.
66 Domestic producers’ prehearing brief, p. 27.
67 Deacero’s prehearing brief, p. 3; hearing transcript pp. 217‐218 (Campbell); and Deacero’s posthearing brief, pp. 1, 10, 13, and 16.
68 Hearing transcript, p. 70 (Kerkvliet and Nystrom).
69 Hearing transcript, pp. 70 (Price), 72 (Goettl), and 73‐74 (Kerkvliet).
70 Hearing transcript, p. 72 (Goettl).
71 Carbon and Certain Alloy Steel Wire Rod from China, Inv. Nos. 701‐TA‐512 and 731‐TA‐1248 (Preliminary), USITC Publication 4458, March 2014, pp. I‐13 – I‐18; Carbon and Certain Alloy Steel Wire Rod from Brazil, Canada, Indonesia, Mexico, Moldova, Trinidad and Tobago, and Ukraine, Inv. Nos. 701‐TA‐417 and 731‐TA‐953, 954, 957‐959, 961, and 962 (Review), USITC Publication 4014, June 2008, pp. I‐22 – I‐24; and Carbon and Certain Alloy Steel Wire Rod from China, Germany, and Turkey, Inv. Nos. 731‐TA‐1099‐1101 (Preliminary), USITC Publication 3832, January 2006, pp. I‐6 – I‐7.

I‐31
specialized conveyor unique to the wire rod industry. The equipment used to produce wire rod is much the same throughout the world and without significant differences in production technology.72
U.S. and foreign wire rod manufacturers have made capital investments in their production facilities to improve processing efficiencies and product quality. Standards of product quality (e.g., tighter dimensional tolerances, control over residuals, and coil weight) have become higher across the entire range of wire rod products largely in response to customer demands for improved performance on the customer's equipment. These improvements have tended to blur the distinctions among quality terms over time.73
Melting stage
There are two primary process routes by which steel for rod is made in the United States and in foreign countries: the integrated process, which employs blast furnaces and basic oxygen furnaces (“BOFs”), and the nonintegrated (or “minimill”) production process, which utilizes an electric arc furnace (“EAF”) to produce raw steel. In both processes, pig iron, ferrous scrap, and/or direct reduced iron (“DRI”)74 are charged into BOFs or EAFs. In the United States, steel for rod production is melted from ferrous scrap in an EAF, along with other raw materials that may also be added as part of the EAF charge.75 Alloy agents are added to the liquid steel to impart specific properties to finished steel products. The molten steel is poured or tapped from the furnace to a ladle, which is an open topped, refractory lined vessel that has an off‐center opening in its bottom and is equipped with a nozzle. Meanwhile, the primary steelmaking vessel (either EAF or BOF) may be charged with new materials to begin another refining cycle.
72 Carbon and Certain Alloy Steel Wire Rod from China, Inv. Nos. 701‐TA‐512 and 731‐TA‐1248 (Preliminary), USITC Publication 4458, March 2014, p. I‐13.
73 Carbon and Certain Alloy Steel Wire Rod from China, Germany, and Turkey, Invs. Nos. 731‐TA‐1099‐1101 (Preliminary), USITC Publication 3832, January 2006, p. I‐8.
74 The advantage of using DRI or pig iron (BOF steel) is the low levels of residual elements (e.g., copper, chromium, nickel, molybdenum, and tin) and reduced gaseous content (particularly nitrogen) that they impart to the steel. Compared to BOF steel, EAF scrap‐based steel contains higher levels of certain residuals, which adversely affect yields and drawing efficiencies, and limit such scrap‐based steel use in certain critical applications.
75 Minimills use ferrous scrap as their primary raw material but may add DRI or hot‐briquetted iron and/or pig iron to the mix, depending on the specifications for the end product and the relative costs of the raw materials. Minimills that produce high quality rod products, such as high carbon, cold heading quality, tire cord quality, and/or other special quality wire rod may use less ferrous scrap and more DRI than other steelmakers, however the production process in general does not change. Both steelmaking processes are increasingly overlapped in terms of chemistries (and are not considered material differences), with increasing blast furnace use of scrap and EAF use of DRI and pig iron. Carbon and Certain Alloy Steel Wire Rod from China, Inv. Nos. 701‐TA‐512 and 731‐TA‐1248 (Preliminary), USITC Publication 4458, March 2014, p. I‐14.

I‐32
Molten steel typically is treated in a ladle metallurgy station, where its chemistry is refined to give the steel those properties required for specific applications. At the ladle metallurgy, or secondary steel making, station the chemical content (particularly that of carbon and sulfur) is adjusted, and alloying agents may be added.76 The steel may be degassed (eliminating oxygen and hydrogen) at low pressures.77 Ladle metallurgy stations are equipped with electric arc power to adjust the temperature of the molten steel for optimum casting and to allow it to serve as a holding reservoir for the casting stage.
76 Boron can be added as ferroboron to molten steel (in concentrations of 0.0015–0.0030 percent or 15–30 parts per million (ppm)) to increase the hardenability of the steel. However, because of boron’s high reactivity with any dissolved oxygen and nitrogen in the molten steel, ferroboron is the last addition at the ladle metallurgy station, under controlled conditions, and only after the molten steel is “killed” (deoxidized or degassed). Shieldalloy Metallurgical Corp., “Boron,” Ferroalloys & Alloying Additives Online Handbook, November 23, 2000. Boron enhances the ductility (drawability) of low carbon steels, hardness of cold heading grade steels, and heat treatability and tensile strength of higher carbon steels. Carbon and Certain Alloy Steel Wire Rod from China, Inv. Nos. 701‐TA‐512 and 731‐TA‐1248 (Preliminary), USITC Publication 4458, March 2014, p. I‐14. Chinese wire rod often contains trace additions of boron (exceeding 0.0008 percent or 8 ppm) for it to be classified as alloy steel rather than carbon steel. In July 2010, the Chinese government removed a VAT rebate for carbon steel exports but continued offering the rebate for alloy steel exports. Subsequently, Chinese producers reportedly added boron to claim the rebate for their alloy steel exports, rather than for metallurgical purposes. HTSUS (2014), “Chapter 72 Iron and Steel, Note 1(f) Other Alloy Steel,” January 1, 2014, p. XV 72‐2; and Carbon and Certain Alloy Steel Wire Rod from China, Inv. Nos. 701‐TA‐512 and 731‐TA‐1248 (Preliminary), USITC Publication 4458, March 2014, p. I‐14. Articles appearing in the industry and trade press mention boron additions to wire rod as a means of both avoiding Chinese export taxes and of gaining tax rebates. See, e.g., Frizell, Samuel, “Chinese Wire Rod Imports Spike,” American Metal Market, August 19, 2013; Nagi, Catherine, “Chinese Rod Hits Shores But Avoids Import Data,” American Metal Market, January 11, 2013; and Cowden, Michael, “Chinese Wire Rod Imports Rising: Trader,” American Metal Market, May 22, 2012.
77 Liquid steel absorbs gasses from the atmosphere and from the materials used in the steelmaking process. These gasses, chiefly oxygen and hydrogen, cause embrittlement, voids, and nonmetallic inclusions. Low pressures, such as in a vacuum, aid the release of oxygen in gas form without the need for additions of deoxidizers such as silicon, aluminum, or titanium, which form nonmetallic inclusions. Additionally, carbon content may be reduced more easily at low pressure (because it combines with oxygen to form carbon monoxide and is released in gas form), resulting in a more ductile steel. Moreover, hydrogen gas causes embrittlement, low ductility, and blow holes in steel; vacuum treatment more easily removes hydrogen from the steel. Hence the use of deoxidizing processes results in more efficient process and cleaner steel.
I‐33
Casting stage
Once molten steel with the requisite properties has been produced, it is cast into a form that can enter the rolling process. Continuous (strand) casting is the method primarily used in the United States. In strand casting, the ladle containing molten steel is transferred from the ladle metallurgy station to the caster and the molten steel is poured at a controlled rate into a tundish (reservoir dam), which in turn controls the rate of flow of the molten steel in to the molds at the top of the caster. The tundish may have a special design or employ electromagnetic stirring to ensure homogeneity of the steel. The strand caster is designed to produce billets in the desired cross sectional dimensions, based on the dimensions of the rod and the design of the rolling mill. Billets may be sent directly (“hot charged”) into the rolling mill or, depending upon the rolling mill's schedule, sent to a storage yard. While in storage, they may be inspected and subjected to one or more conditioning operations (e.g., grinding or turning) to prepare them for hot rolling. This preparation is more common with cold heading quality rods intended to be made into fasteners.78
Rolling stage
The wire rod rolling process determines the rod’s size (diameter) and dimensional precision, depth of decarburization, surface defects and seams, amount of mill scale, structural grain size, and within limits set by the chemistry, tensile strength and other physical properties. There is little or no difference among the wire rod rolling mills in the United States, or between U.S. mills and their foreign competitors.79 A larger billet will produce a heavier coil. Also, usable coil size may be limited by the capabilities of the wire drawer’s equipment and machinery.
Modern rod rolling mills consist of five parts: a roughing mill, an intermediate mill, a pre finishing mill, a no twist finishing mill, and a coiler combined with a conveyor cooling bed along which the coiled rod travels prior to being collected, tied, compacted, and readied for shipment. Wire rod mills typically consist of 22 to 29 rolling stands and the specialized Stelmor conveyor deck;80 the need for uniform metallurgical properties requires close temperature control accomplished by accelerating or retarding the rod’s cooling as it is rolled and conveyed
78 The purpose of these surface treatments is to make the steel billet softer and more ductile (annealing); in the case of surface grinding, seam and folds are removed.
79 The rolling process, however, can be optimized for various quality levels. The rolling process for higher quality steel, such as for cold heading quality and other surface sensitive products, must be designed to maximize surface integrity. This is managed by the number of rolling stands used to get to a specific end diameter, the design of the reductions taken at each step, and the design of the guiding equipment used to keep the steel moving on the proper path through the mill.
80 The Stelmor conveyor deck allows for controlled cooling of the wire rod. The cooling speed imparts certain physical characteristics, thereby enabling producers to produce a wider range of wire rod qualities. Likewise, the Stelmor deck may be optimized for specific end products. For example, ***. Most, if not all, U.S. wire rod producers have installed controlled cooling capacities.

I‐34
along the Stelmor deck. This is accomplished by water quench, forced air drafts, or by lowering removable hoods overtop the deck. Metallurgical quality, temperature, and dimensional tolerance usually are inspected in‐line.
Exiting the reheat furnace, the billet is initially reduced on the roughing mill (which usually consists of approximately five stands). It then is passed through and successively reduced in size on several more stands, termed intermediate rolling. After the last intermediate rolling stand, the rolling mill usually splits into dual lines and the product is passed along to a pre finishing mill which reduces it further in diameter. Rod mills often employ a “twist” mill for primary and intermediate rolling, but the final rolling is nearly always on a no twist Morgan vee mill (the rolls in each of approximately five stands are set at 90‐degree angles to allow the rod to be rolled without twisting). This produces a nearly uniform non‐oriented grain structure in the steel.
Cooling stage
After exiting the last finishing stand, the rod is coiled into concentric loops and placed on a conveyor which moves the hot wire rod along while it cools. During rolling, the rod is water cooled as it travels along the Stelmor deck; cooling practices are varied depending on the designated end use of the rod and the customer’s preferences. The speed at which the rod is cooled affects the consistency and formation of its metallurgical structure (grain structure and physical properties such as tensile strength). It also affects scale buildup, which determines yield losses at the wire drawer. The cooling rate may be varied through the use of removable covers (insulating hoods which may be independently raised or lowered) over the deck or blown air cooling, or a combination of the two, or through varying the speed of the roller table. The end user often specifies the cooling practice of the rod purchased.
At the end of the cooling deck, workers crop the ends of each rod to remove the part of the rod which may be of lower quality due to uneven temperature control; the cropped ends are also used for testing and inspection. The rod is then collected onto a carrier, transferred to a “c” hook, compacted, tied, and readied for shipment, or for further finishing or in‐house fabrication. Figure I‐1 illustrates the reheat through cooling stages of the wire rod production process.

I‐35
Figure I-1 Wire rod: Reheat and rolling process
Source: POSCO Web site, http://www.steel-n.com/esales/general/us/catalog/wire_rod/, accessed March 10, 2008.
Domestic producers manufacture various types of wire rod on essentially the same equipment, in the same facilities, and with the same production personnel. While changes to production processes are limited, changes in chemical composition, alloying elements and other raw materials, stand fittings, and cooling speed determine the quality of the wire rod produced. The basic equipment, machinery, facilities, and production personnel, however, remain, the same for the production of industrial quality, tire cord quality, welding quality, and cold heading quality wire rod.
I‐36
DOMESTIC LIKE PRODUCT ISSUES
In its original determinations and full first five‐year reviews, the Commission defined the domestic like product as all wire rod products, which included grade 1080 tire cord and tire bead quality wire rod excluded from Commerce’s scope, and it defined the domestic industry as all domestic producers of wire rod.81 In its notice of institution in these current second five‐year reviews, the Commission solicited comments from interested parties regarding the appropriate domestic like product and domestic industry.82 The domestic producers indicated in their responses to the Commission’s notice of institution in these current reviews that they agree with the Commission’s definitions of domestic like product and domestic industry. Respondent Deacero indicated in its response that it “does not object” to the Commission’s definitions of the domestic like product and domestic industry and respondent Ternium did not comment on the definitions in its response.83
In their prehearing brief, domestic producers ArcelorMittal USA, Gerdau, Evraz, and Keystone again noted that they agree with the Commission’s domestic like product definition in the original investigations and first five‐year reviews and added that no respondent has challenged that definition.84 Yenakiieve also indicated in its prehearing brief that it does not disagree with the Commission’s definition of the domestic like product.85
No party requested that the Commission collect data concerning other possible domestic like products in their comments on the Commission’s draft questionnaires. No other interested party provided further comment on the domestic like product.
81 Carbon and Certain Alloy Steel Wire Rod from Brazil, Canada, Germany, Indonesia, Mexico, Moldova, Trinidad and Tobago, Turkey, and Ukraine: Investigations Nos. 701‐TA‐417‐421 (Final) and Investigations Nos. 731‐TA‐953, 954, 956‐959, 961, and 905 (Final), USITC Publication 3546, October 2002, p. 7; and Carbon and Certain Alloy Steel Wire Rod from Brazil, Canada, Indonesia, Mexico, Moldova, Trinidad and Tobago, and Ukraine, Investigation Nos. 701‐TA‐417 and 731‐TA‐953, 954, 957‐959, 961, and 962 (Review), USITC Publication 4014, June 2008, pp. 8‐10.
82 Carbon and Certain Alloy Steel Wire Rod from Brazil, Indonesia, Mexico, Moldova, Trinidad and Tobago, and Ukraine: Institution of five‐year reviews, 78 FR 33103, June 3, 2013.
83 Response of ArcelorMittal USA LLC, Cascade Steel Rolling Mills Inc., Evraz Rocky Mountain Steel, Gerdau Ameristeel US Inc., Keystone Consolidated Industries, Inc., and Nucor Corp., July 2, 2013, p. 31; and Response of Deacero S.A. de C.V. and Deacero USA, Inc., July 3, 2013, p. 15.
84 Prehearing brief of domestic producers ArcelorMittal USA, Gerdau, Evraz, and Keystone (hereinafter referred to as “Domestic producers’ prehearing brief”), p. 5.
85 Yenakiieve’s prehearing brief, p. 5.

I‐37
U.S. MARKET PARTICIPANTS
U.S. producers
During the original investigations, 12 firms supplied the Commission with complete information on their U.S. operations with respect to wire rod. These 12 firms accounted for more than *** percent of U.S. production of wire rod products during 2001.86 During the full first five‐year reviews, 10 firms supplied the Commission with information on their U.S. operations. These 10 firms accounted for all known production of wire rod in the United States during 2007.87
In these current second five‐year reviews, the Commission issued U.S. producers’ questionnaires to 10 firms, all of which provided the Commission with information on their wire rod operations. These 10 firms are believed to account for all known U.S. production of wire rod in 2013.88 Presented in table I‐11 is a list of current domestic producers of wire rod and each company’s position on the continuation of the orders, production locations(s), related and/or affiliated firms, and share of reported production of wire rod in 2008‐13.
86 The 12 U.S. producers that supplied the Commission with complete questionnaire information during the original investigations are: ***.
87 The 10 U.S. producers that supplied the Commission with usable questionnaire information during the first five‐year reviews are: ArcelorMittal USA; Cascade; Charter Steel, Division of Charter Manufacturing (“Charter”); Gerdau Ameristeel; Keystone; Nucor; Oklahoma Steel and Wire, which is the wire products related firm of Mid American Steel and Wire Co. (“Mid American”); Republic Engineered Products (“Republic”); Rocky Mountain Steel Mills (“Rocky Mountain”); and Sterling Steel Co., LLC (“Sterling”).
88 The 10 U.S. producers that supplied the Commission with usable questionnaire information during the second five‐year reviews are: ArcelorMittal USA, Cascade, Charter, Evraz Pueblo (formerly known as Rocky Mountain), Gerdau, Keystone, Mid American, Nucor, Republic, and Sterling.

I‐38
Table I-11 Wire rod: U.S. producers, positions on orders, U.S. production locations, related and/or affiliated firms, and shares of 2008-13 reported U.S. production
Firm Position
on orders U.S. production
locations Parent firm
Share of 2008-13
U.S. production
ArcelorMittal USA mixed1 Georgetown, SC East Chicago, IN ArcelorMittal SA (Luxembourg)2 ***
Cascade *** McMinnville, OR Schnitzer Steel Industries, Inc. (Portland, OR) ***
Charter ***
Cuyahoga Heights, OH Fostoria, OH Saukville, WI Charter Manufacturing (Mequon, WI) ***
Evraz Pueblo support Pueblo, CO Evraz North America (Chicago, IL)3 ***
Gerdau support
Beaumont, TX Jacksonville, FL Perth Amboy, NJ (idled) Gerdau SA (Brazil)4 ***
Keystone support Peoria, IL Contran Corp. (Dallas, TX) ***
Mid American *** Madill, OK - ***
Nucor support
Wallingford, CT Norfolk, NE Kingman, AZ Darlington, SC - ***
Republic ***5 Lorain, OH
Industrias ICH (Mexico) (***) Grupo Simec (Mexico) (***)
Pacific Steel (Mexico) (***) ***
Sterling *** Sterling, IL Leggett & Platt, Inc. (Carthage, MO) ***
100.01 ArcelorMittal USA takes no position on the continuation of the order concerning Trinidad & Tobago. ArcelorMittal USA supports the continuation of all other orders. 2 ArcelorMittal SA has subsidiary wire rod producers in Algeria, Argentina, Bosnia and Herzegovina, Brazil, Canada, Costa Rica, Czech Republic, France, Germany, Mexico, Morocco, Poland, Spain, Trinidad & Tobago, and Ukraine. 3 ***. 4 ***. 5 ***. 6 ***. Source: Compiled from data submitted in response to Commission questionnaires.

I‐39
No domestic producer reported production of wire rod in a foreign trade zone. Five domestic producers (***) reported that since January 1, 2008, they have been involved in toll agreements regarding the production of wire rod.89
Although no U.S. producers reported the direct imports of subject merchandise in these second five‐year reviews and no U.S. producers reported domestic purchases of the subject merchandise from U.S. importers, three U.S. producers reported that they are related to foreign producers of the subject merchandise. Gerdau reported that it is a wholly‐owned subsidiary of wire rod producer Gerdau SA of Brazil. ArcelorMittal USA reported that it is a wholly‐owned subsidiary of ArcelorMittal SA (Luxembourg), which has subsidiary wire rod producers in numerous countries, including subject countries Brazil, Mexico, Trinidad & Tobago, and Ukraine. Republic reported that its parent company, Grupo Simec, owns Grupo San Luis, a wire rod producer in Mexico.90
The domestic producers argue that no U.S. producer should be excluded from the domestic industry as a related party. They note that U.S. producers Gerdau and ArcelorMittal USA are primarily interested in U.S. production, did not benefit from affiliations with the subject producers or importers of wire rod, did not import subject merchandise during 2008‐13, and do not support revocation of any of the orders.91 Ukrainian respondent Yenakiieve also indicated that it does not see a basis on which to exclude ArcelorMittal or Gerdau from the domestic industry.92
U.S. importers
In the original investigations, 27 U.S. importing firms supplied the Commission with usable information on their operations involving the importation of wire rod, accounting for *** percent of U.S. imports of wire rod during 2001. Of the responding U.S. importers, one was also a domestic producer: Charter ***. In the Commission’s full first five‐year reviews, 26 firms supplied usable import data, accounting for approximately 73 percent of total U.S. imports of wire rod in 2007, and 90 percent of subject imports in that year. Reporting U.S. importers of wire rod at that time imported primarily from the subject countries of Brazil, Canada (no longer subject), Mexico, Trinidad & Tobago, and nonsubject Germany. No domestic producer reported direct imports during the Commission’s first five‐year review.
In these current second five‐year reviews, the Commission issued U.S. importers’ questionnaires to approximately 125 firms believed to be importers of wire rod, as well as to all
89 ***. 90 ***. 91 The domestic producers also noted that domestic producer Republic Steel also appears to be
focused on U.S. production and not benefiting from the affiliation, and does not support revocation of any orders. Domestic producers’ prehearing brief, pp. 5‐6.
92 Yenakiieve’s prehearing brief, p. 5.
I‐40
U.S. producers of wire rod.93 Usable questionnaire responses were received from 37 importing firms, representing virtually all U.S. imports of wire rod from Mexico in 2013, and 84.8 percent of U.S. imports of wire rod from nonsubject countries in that year, primarily from China, Canada, and Japan.94 There were no reported U.S. imports from Brazil, Indonesia, Moldova, Trinidad & Tobago, or Ukraine during 2013. U.S. imports of wire rod from Brazil, Moldova, and Ukraine largely ceased following the imposition of duties in 2002 and the U.S. imports of wire rod from Indonesia and Trinidad & Tobago ceased after 2005 and 2008, respectively.
Table I‐12 lists all responding U.S. importers of wire rod from subject and nonsubject sources, their locations, and their shares of U.S. imports during 2008‐13. Reported subject imports were concentrated in a few firms. Five importers reported importing subject wire rod from Mexico during 2008‐13, with *** alone accounting for *** percent of total reported imports from Mexico during 2013. Thirty‐five importers reported U.S. imports of nonsubject wire rod during 2008‐13, with the largest three nonsubject importers (***) accounting for slightly more than one half of reported imports from nonsubject sources during 2008‐13.
Table I-12 Wire rod: Reporting U.S. importers, parent companies, sources of imports, locations, and shares of reported imports, 2008-13
* * * * * * *
U.S. purchasers
The Commission received 36 usable questionnaire responses from firms that bought wire rod during 2008‐13. The majority of purchasers (33 of 36) reported that they were end users of wire rod, two reported that they were distributors, and one reported that it was an independent wire producer and seller. All 36 purchasers reported their firms’ total purchases (by quantity) of wire rod by country in 2013. Approximately 69.0 percent of total reported purchases of wire rod was U.S.‐produced wire rod, 2.9 percent was from Brazil (all nonsubject products including tire bead and tire cord), 0.2 percent was from Mexico, and the remaining 27.9 percent was wire rod from nonsubject countries (primarily Canada and China, but also included Germany, the Netherlands, Korea, UAE, Japan, the United Kingdom, Turkey, Spain, and South Africa). In general, responding U.S. purchasers were located in the Midwest and the Southeast. The largest purchasers of wire rod in 2013 were ***.
93 None of the U.S. producers reported direct imports of wire rod. 94 The questionnaire import coverage calculation for nonsubject countries is based on the share of
reported U.S. imports from nonsubject sources relative to such data as reported by official Commerce import statistics. The questionnaire import coverage calculation for Mexico is based on an examination of importing firms as reported in proprietary Customs documents.
I‐41
APPARENT U.S. CONSUMPTION AND U.S. MARKET SHARES
Data concerning apparent U.S. consumption of wire rod during 2008‐13 are shown in table I‐13. U.S. market share data are presented in table I‐14.
The quantity of apparent U.S. consumption fell from a six‐year high of *** short tons during 2008 to a six‐year low of *** short tons in 2009. Apparent U.S. consumption generally increased thereafter to 5.3 million short tons in 2013. The U.S. producers’ share of apparent U.S. consumption, which fluctuated between *** and *** percent during 2008‐13, was at a six‐year low during 2013. The share of U.S. consumption held by subject imports from Mexico fluctuated during 2008‐13, but remained below *** percent in all annual periods. There were no reported U.S. imports from Brazil, Indonesia, Moldova, or Ukraine during 2008‐13. There were U.S. imports of wire rod from Trinidad & Tobago only during 2008. These imports accounted for *** percent of apparent U.S. consumption in that year.
MERCHANT MARKET APPARENT U.S. CONSUMPTION AND U.S. MARKET SHARES
Data concerning merchant market apparent U.S. consumption of wire rod during 2008‐13 are shown in table I‐15. U.S. merchant market share data are presented in table I‐16.95
The quantity of merchant market apparent U.S. consumption fell from a six‐year high of *** short tons during 2008 to a six‐year low of *** short tons in 2009. Merchant market apparent U.S. consumption generally increased thereafter to *** short tons in 2013. The U.S. producers’ share of merchant market apparent U.S. consumption, which fluctuated between *** and *** percent during 2008‐13, was at a six‐year low during 2013. The share of merchant market U.S. consumption held by subject imports from Mexico fluctuated during 2008‐13, but remained at or below *** percent in all annual periods. Imports from Trinidad & Tobago during 2008 accounted for *** percent of merchant market apparent U.S. consumption in that year.
95 Merchant market apparent consumption does not include internal consumption and transfers to related firms by U.S. producers.

I‐42
Table I-13 Wire rod: U.S. shipments of domestic product, U.S. imports, and apparent U.S. consumption, 2008-13
Item Calendar year
2008 2009 2010 2011 2012 2013 Quantity (short tons)
U.S. producers' U.S. shipments 4,050,961 2,833,426 3,340,954 3,876,145 3,809,728 3,599,459Imports from-- Brazil 0 0 0 0 0 0 Indonesia 0 0 0 0 0 0 Mexico *** *** *** *** *** 10,333 Moldova 0 0 0 0 0 0 Trinidad & Tobago 21,794 0 0 0 0 0 Ukraine 0 0 0 0 0 0 Subtotal, subject *** *** *** *** *** 10,333 1080 tire cord/tire bead from subject sources 139,459 71,759 129,184 116,513 102,517 96,639 All other sources1 1,536,768 777,083 1,284,771 1,059,512 1,391,895 1,593,718 Subtotal, nonsubject 1,676,227 848,842 1,413,955 1,176,024 1,494,413 1,690,357Total U.S. imports *** *** *** *** *** 1,700,690Apparent U.S. consumption *** *** *** *** *** 5,300,149
Value (1,000 dollars) U.S. producers' U.S. shipments 3,485,005 1,651,451 2,246,759 3,012,054 2,826,974 2,529,487Imports from-- Brazil 0 0 0 0 0 0 Indonesia 0 0 0 0 0 0 Mexico *** *** *** *** *** 6,128 Moldova 0 0 0 0 0 0 Trinidad & Tobago 14,298 0 0 0 0 0 Ukraine 0 0 0 0 0 0 Subtotal, subject *** *** *** *** *** 6,128 1080 tire cord/tire bead from subject sources 126,654 50,808 91,621 103,073 84,521 64,506 All other sources1 1,360,431 550,614 988,457 992,791 1,159,903 1,156,290 Subtotal, nonsubject 1,487,085 601,423 1,080,078 1,095,863 1,244,424 1,220,797Total U.S. imports *** *** *** *** *** 1,226,925Apparent U.S. consumption *** *** *** *** *** 3,756,4121 The data presented are overstated by imports of wire rod of less than 5mm in diameter imported from Canada. ***.
Source: Compiled from data submitted in response to Commission questionnaires.

I‐43
Table I-14 Wire rod: U.S. consumption and market shares, 2008-13
Item Calendar year
2008 2009 2010 2011 2012 2013 Quantity (short tons)
Apparent U.S. consumption *** *** *** *** *** 5,300,149
Share of quantity (percent) U.S. producers' U.S. shipments *** *** *** *** *** 67.9Imports from-- Brazil 0.0 0.0 0.0 0.0 0.0 0.0 Indonesia 0.0 0.0 0.0 0.0 0.0 0.0 Mexico *** *** *** *** *** 0.2 Moldova 0.0 0.0 0.0 0.0 0.0 0.0 Trinidad & Tobago *** 0.0 0.0 0.0 0.0 0.0 Ukraine 0.0 0.0 0.0 0.0 0.0 0.0 Subtotal, subject *** *** *** *** *** 0.2 1080 tire cord/tire bead from subject sources *** *** *** *** *** 1.8 All other sources *** *** *** *** *** 30.1 Subtotal, nonsubject *** *** *** *** *** 31.9Total U.S. imports *** *** *** *** *** 32.1
Value (1,000 dollars) Apparent U.S. consumption *** *** *** *** *** 3,756,412
Share of value (percent) U.S. producers' U.S. shipments *** *** *** *** *** 67.3Imports from-- Brazil 0.0 0.0 0.0 0.0 0.0 0.0 Indonesia 0.0 0.0 0.0 0.0 0.0 0.0 Mexico *** *** *** *** *** 0.2 Moldova 0.0 0.0 0.0 0.0 0.0 0.0 Trinidad & Tobago *** 0.0 0.0 0.0 0.0 0.0 Ukraine 0.0 0.0 0.0 0.0 0.0 0.0 Subtotal, subject *** *** *** *** *** 0.2 1080 tire cord/tire bead from subject sources *** *** *** *** *** 1.7 All other sources *** *** *** *** *** 30.8 Subtotal, nonsubject *** *** *** *** *** 32.5Total U.S. imports *** *** *** *** *** 32.7Source: Compiled from data submitted in response to Commission questionnaires.

I‐44
Table I-15 Wire rod: U.S. merchant market shipments of domestic product, U.S. imports, and merchant market apparent U.S. consumption, 2008-13
* * * * * * *
Table I-16 Wire rod: Merchant market U.S. consumption and market shares, 2008-13
* * * * * * *

II‐1
PART II: CONDITIONS OF COMPETITION IN THE U.S. MARKET
U.S. MARKET CHARACTERISTICS
U.S. producers and importers typically sell wire rod directly to wire drawing firms and/or produce and sell wire or wire products. Internal consumption and transfers to related firms accounted for more than one‐quarter of U.S. producers’ U.S. shipments of domestically produced wire rod in 2013. U.S. shipments of domestically produced wire rod, in turn, accounted for 67.9 percent of apparent U.S. consumption in 2013. Imports from the subject countries were limited and accounted for 0.2 percent of the total U.S. market in 2013; and imports from nonsubject countries (as well as grade 1080 tire bead and tire cord wire rod from subject countries) accounted for 31.9 percent.1
Wire rod is used primarily in construction, automotive, energy, and agriculture industries as a variety of downstream products. In the U.S. market, carbon quality wire rod is most commonly consumed. As shown in figure II‐1, high and medium‐high carbon industrial and standard quality wire rod and low and medium‐low carbon industrial and standard quality wire rod accounted for more than three‐fourths U.S. producers’ U.S. shipments of wire rod during 2013.2 Similarly, the majority of purchasers reported buying low and medium‐low carbon industrial and standard quality rods. Figure II-1 Wire rod: U.S. producers’ U.S. shipments, by type, 2013
* * * * * * *
CHANNELS OF DISTRIBUTION
The majority of wire rod sold in the United States is shipped to end users. U.S. producers and importers of product from Trinidad & Tobago and nonsubject countries sold mainly to end users while importers of wire rod from Mexico sold to end users in 2008‐09, to distributors in 2010‐11 and then split between both channels in 2012‐13 as shown in table II‐1.
1 U.S. shipments of wire rod imported from Mexico were sold in small quantities during each year between 2008 and 2013; U.S. shipments of wire rod imported from Trinidad & Tobago were sold in 2008. There were no imports from Brazil, Indonesia, Moldova, and Ukraine during 2008‐13.
2 Ten U.S. producers and two importers of subject product from Mexico reported their U.S. shipments by type of wire rod in 2013.

II‐2
Table II-1 Wire rod: U.S. producers’ and importers’ share of reported U.S. shipments, by sources and channels of distribution, 2008-20131
Item Calendar year 2008 2009 2010 2011 2012 2013
Share of quantity (percent) U.S. producers' U.S. shipments to: Distributors 12.3 7.3 4.4 12.0 13.3 13.1 End users 87.7 92.7 95.6 88.0 86.7 86.9U.S. importers' U.S. shipments of imports from Mexico to: Distributors *** *** *** *** *** *** End users *** *** *** *** *** ***U.S. importers' U.S. shipments of imports from Trinidad & Tobago to: Distributors *** *** *** *** *** *** End users *** *** *** *** *** ***U.S. importers' U.S. shipments of imports from all other sources to: Distributors *** *** *** *** *** *** End users *** *** *** *** *** ***1 There were no subject imports from Brazil, Indonesia, Moldova, and Ukraine between 2008 and 2013. Source: Compiled from data submitted in response to Commission questionnaires.
GEOGRAPHIC DISTRIBUTION
U.S. producers and importers from Mexico reported selling wire rod to all regions in the contiguous United States (table II‐2). Five of the 10 responding producers and one of four responding importers from Mexico reported selling nationwide. The sole responding importer of wire rod from Trinidad & Tobago reported that it only sold to markets ***. The majority of U.S. producers’ sales (79.2 percent) were shipped between 101 and 1,000 miles, 13.7 percent was shipped within 100 miles of their production facility, and 7.2 percent was shipped over 1,000 miles. Importers of wire rod from Mexico shipped the majority of their product (*** percent) over 1,000 miles and the remaining *** percent was shipped between 101 and 1,000 miles. The importer of wire rod from Trinidad & Tobago reported that *** percent of its sales were shipped *** from its firm’s U.S. point of shipment.

II‐3
Table II-2
Wire rod: Geographic market areas in the United States served by U.S. producers and importers, by number of responding firms
Region U.S. producers Importers of product
from Mexico Importers of product from
Trinidad & Tobago
Northeast 9 1 *** Midwest 10 1 *** Southeast 9 2 *** Central Southwest 8 2 *** Mountain 7 1 *** Pacific Coast 7 3 *** Other1 1 0 ***
1 All other U.S. markets, including AK, HI, PR, and VI, among others. Source: Compiled from data submitted in response to Commission questionnaires.
SUPPLY AND DEMAND CONSIDERATIONS
U.S. supply
Domestic production
Based on available information, U.S. producers of wire rod have the ability to respond to changes in demand with moderate changes in the quantity of shipments of U.S.‐produced wire rod to the U.S. market. The main contributing factors to this degree of responsiveness of supply are the availability of unused capacity and the ability to produce alternative products; however, other factors such as insufficient export markets and low levels of inventories tend to moderate this degree of responsiveness.
Industry capacity
Domestic capacity utilization decreased irregularly from 73.1 percent in 2008 to 72.0 percent in 2013. Domestic capacity decreased by 8.5 percent and U.S. production fell by 9.9 percent from 2008 to 2013. This relatively moderate level of capacity utilization suggests that U.S. producers may have moderate excess capacity to increase production of product in response to an increase in prices.
Alternative markets
U.S. producers’ exports, as a share of total shipments, did not exceed 1.4 percent between 2008 and 2013. U.S. producers’ export shipments declined from 1.0 percent in 2008 to 0.7 percent in 2013 indicating that U.S. producers may have limited ability to shift shipments between the U.S. market and other markets in response to price changes. Three U.S. producers stated that it would be difficult to shift their shipments to other markets. U.S. producers reported tariff barriers to trade in other markets, specifically in Argentina, Brazil, and Honduras.

II‐4
Internal consumption and transfers to related firms
U.S. producers’ internal consumption increased from *** percent of total shipments in 2008 to *** percent in 2013. Their transfers to related firms increased from *** percent of total shipments in 2008 to *** percent in 2013.
Inventory levels
U.S. producers’ inventories increased from 5.7 percent of total shipments in 2008 to 7.4 percent in 2013. These inventory levels suggest that U.S. producers may have some ability to respond to changes in demand with changes in the quantity shipped from inventories.
Production alternatives
Nine of ten responding U.S. producers stated that they could switch production from wire rod to other products. Other products that producers reportedly produce on the same equipment as wire rod are concrete reinforcing bar (rebar) and other nonsubject bar and rod products. The relatively large volume of these other products produced on shared equipment increases domestic producers’ ability to switch production to wire rod.
Changes in supply
Six of 10 U.S. producers, 9 of 20 importers, and 17 of 32 responding purchasers reported changes that affected U.S. supply since 2008. The majority of firms noted the fluctuating U.S. capacity due to plant closures in 2009 (Gerdau’s mill in Perth Amboy, New Jersey and ArcelorMittal's plant in Georgetown, South Carolina), the re‐opening of mills in 2011 (ArcelorMittal's plant in Georgetown, South Carolina), and the added capacity of Nucor’s plant in Darlington, South Carolina in 2013.3 Other changes include: increased cost for raw material inputs and energy, increased transportation costs and delivery times, and increased imports of Chinese product.
Supply constraints
The majority of purchasers reported that they experienced no supply constraints. However, 10 of 35 of responding purchasers reported issues with supply from about one‐half of U.S. producers, particularly during 2011. Several purchasers reported that there was a lack of domestic capacity that resulted in delays in delivery times during 2011.4 Thee purchasers, ***, ***, and ***, reported sporadic allocation issues with several U.S. producers including: ArcelorMittal USA, Charter, Evraz, Georgetown, Gerdau, Keystone, Nucor, and Sterling Steel. Additionally, *** reported that several mills (Charter, Evraz, Georgetown, Gerdau, Keystone,
3 According to Gerdau, the Perth Amboy facility could be brought back on line if demand warranted. Hearing transcript, p. 78 (Kerkvliet); Domestic producers’ posthearing brief, p. 2.
4 For example, ***. ***. ***.

II‐5
and Nucor) were unable to produce the grade and quality it required. *** reported that Gerdau was unable to supply normal quantities of wire rod during the first half of 2013 due to “major software implementation.”5
However, according to U.S. producers, the delays in shipments occurred due to limited regional availability of the product which entails longer domestic shipping times into a specific local region. However, U.S. producers stated that the domestic industry, as a whole, has sufficient capacity to supply U.S. demand.6 According to Nucor, “Any reported supply constraints reflect isolated incidents at individual mills, rather than the domestic industry's ability to supply the U.S. market as a whole.”7
Supply of subject imports
The sensitivity of supply of wire rod imports from Brazil, Indonesia, Mexico, Moldova, Trinidad & Tobago, and Ukraine to changes in price in the U.S. market depends upon such factors as the existence of excess capacity, the levels of inventories, and the existence of export markets. The Commission received no questionnaire responses from Moldovan suppliers in these reviews. Relevant information for Brazil, Indonesia, Mexico, Trinidad & Tobago, and Ukraine follows.
5 According to Gerdau, ***. Domestic producers’ posthearing brief, exhibit 1, p. 38. 6 Hearing transcript, pp. 86‐87 (Nystrom and Ashby). 7 Nucor stated that it has always been able to fulfill its customers’ demands. Nucor’s posthearing
brief, exhibit 1, p. 4‐5.

II‐6
Subject imports from Brazil
The Commission received one questionnaire response from Brazilian producer of wire rod, ArcelorMittal Brasil.8 Based on available information, ArcelorMittal Brasil has the ability to respond to changes in demand with small‐to‐moderate changes in the quantity of shipments of wire rod to the U.S. market. The main contributing factors to this degree of responsiveness of supply are the ability to produce alternative products and the existence of alternate markets; however, other factors such as the levels of unutilized capacity and inventories tend to moderate this degree of responsiveness.
Industry capacity
Reported capacity remained constant at *** short tons during 2008‐13. ArcelorMittal Brasil’s reported capacity utilization decreased from *** percent in 2008 to *** percent in 2013.
Alternative markets
ArcelorMittal Brasil reported that *** of its shipments were either shipped to its home market or were consumed internally (figure II‐2). Its total exports, as a share of total shipments, declined from *** percent in 2008 to *** percent in 2013. ArcelorMittal Brasil exported primarily to countries ***; there were no reported exports to the United States during 2008‐13. It reported that ***. The main reasons included: ***.
Figure II-2 Wire rod: Shares of total shipments of wire rod by Brazilian producer, by destination, 2008-13
* * * * * * *
Inventory levels
ArcelorMittal Brasil’s inventories, relative to total shipments, increased from *** percent in 2008 to *** percent in 2013.
Production alternatives
ArcelorMittal Brasil reported that it produces *** on the same equipment and machinery used to produce wire rod. It reported that its production ***.
8 According to ***, ArcelorMittal Brasil accounted for *** percent of total wire rod rolling capacity in Brazil during 2013.

II‐7
Subject imports from Indonesia
The Commission received one questionnaire response from Indonesian producer of wire rod, Ispat Indo.9 Based on available information, Ispat Indo has the ability to respond to changes in demand with moderate changes in the quantity of shipments of wire rod to the U.S. market. The main contributing factors to this degree of responsiveness of supply are the availability of unused capacity and the existence of alternate markets; however, other factors such as low levels of inventories and the inability to produce alternate products tend to moderate this degree of responsiveness.
Industry capacity
Reported capacity remained constant at *** short tons during 2008‐13. Ispat Indo’s reported capacity utilization decreased from *** percent in 2008 to *** percent in 2013.
Alternative markets
Ispat Indo reported that *** of its shipments were shipped to its home market (figure II‐3). Its total exports, as a share of total shipments, declined from *** percent in 2008 to *** percent in 2013. Ispat Indo exported *** to Asia; there were no reported exports to the United States during 2008‐13. It reported that ***. It reported that ***.
Figure II-3 Wire rod: Shares of total shipments of wire rod by Indonesian producer, by destination, 2008-13
* * * * * * *
Inventory levels
Ispat Indo’s inventories, as a share of total shipments, decreased from *** percent in 2008 to *** percent in 2013.
Production alternatives
Ispat Indo reported that it does not produce other products on the same equipment and machinery used to produce wire rod.
9 According to ***, Ispat Indo accounted for *** percent of total wire rod rolling capacity in Indonesia during 2013.

II‐8
Subject imports from Mexico
The Commission received three questionnaire responses from Mexican producers of wire rod.10 Based on available information, producers of wire rod from Mexico have the ability to respond to changes in demand with moderate‐to large changes in the quantity of shipments of wire rod to the U.S. market. The main contributing factors to this degree of responsiveness of supply are the existence of alternate markets; the ability to produce alternate products, and some unused capacity; and however, low levels of inventories tend to moderate this degree of responsiveness.
Industry capacity
Mexican producers’ capacity utilization fluctuated during 2008‐13, increasing from 88.5 percent in 2008 to 98.1 percent in 2011 before falling to 85.0 percent in 2013. Reported capacity increased from 2.4 million short tons in 2008 to 2.8 million short tons in 2013.
Alternative markets
Mexican producers reported that *** of their shipments was either shipped to its home market or was consumed internally (figure II‐4). Their total exports, as a share of total shipments, increased from *** percent in 2008 to 16.0 percent in 2013. Mexican producers exported primarily to ***. Mexican producers Deacero and Ternium both reported that ***. Deacero also stated that ***. ArcelorMittal Las Truchas reported that ***.
Figure II-4 Wire rod: Shares of total shipments of wire rod by Mexican producers, by destination, 2008-13
* * * * * * *
Inventory levels
Mexican producers’ inventories, as a share of total shipments, fluctuated during 2008‐13, increasing from 5.5 percent in 2008 to 7.6 percent in 2012 before falling to 6.7 percent in 2013.
Production alternatives
All three Mexican producers reported that they produce other products on the same equipment and machinery used to produce wire rod. Mexican producer Ternium reported ***.
10 According to hearing testimony, these three producers are the principal wire rod producers in Mexico. Hearing transcript, p. 153 (Campbell). See Part IV for more information.
II‐9
Subject imports from Trinidad & Tobago
The Commission received one questionnaire response from Trinidad & Tobago producer, ArcelorMittal Point Lisas.11 Based on available information, this producer of wire rod from Trinidad & Tobago has the ability to respond to changes in demand with large changes in the quantity of shipments of wire rod to the U.S. market. The main contributing factors to this degree of responsiveness of supply are the levels of unutilized capacity and inventories, existence of alternate markets, and the ability to produce alternate products.
Industry capacity
ArcelorMittal Point Lisas’ capacity remained constant at *** short tons during 2008‐13. Its capacity utilization fluctuated during 2008‐13, increasing from *** percent in 2008 to *** percent in 2011 before falling to *** percent in 2013.
Alternative markets
ArcelorMittal Point Lisas reported that *** of its shipments were exported, with *** percent of its shipments wire rod sold in its home market (figure II‐5). Its total exports, as a share of total shipments, increased from *** percent in 2008 to *** percent in 2011 before falling to *** percent in 2013. ArcelorMittal Point Lisas exported primarily to ***. It reported that ***.
Figure II-5 Wire rod: Shares of total shipments of wire rod by Trinidad & Tobago producer, by destination, 2008-13
* * * * * * *
Inventory levels
ArcelorMittal Point Lisas’ inventories, as a share of total shipments, increased from *** percent in 2008 to *** percent in 2011 before falling to *** percent in 2013.
Production alternatives
ArcelorMittal Point Lisas reported that it produces *** using the same machinery and equipment it uses to produce wire rod. It reported that ***.
11 ArcelorMittal Point Lisas accounted for all known production of wire rod in Trinidad & Tobago during 2008‐13.

II‐10
Subject imports from Ukraine
The Commission received two questionnaire responses from Ukrainian producers of wire rod.12 Based on available information, producers of wire rod from Ukraine have the ability to respond to changes in demand with large changes in the quantity of shipments of wire rod to the U.S. market. The main contributing factors to this degree of responsiveness of supply are the availability of unused capacity, the existence of alternate markets, and the ability to produce alternate products; however, low levels of inventories tend to moderate this degree of responsiveness.
Industry capacity
Ukrainian producers’ capacity utilization fluctuated during 2008‐13, increasing from *** percent in 2008 to *** percent in 2010 before falling to *** percent in 2013. Reported capacity increased from *** short tons in 2008 to *** short tons in 2013.
Alternative markets
Ukrainian producers reported that *** of their shipments were exported (figure II‐6). Their total exports, as a share of total shipments, increased from *** percent in 2008 to *** percent in 2010 before falling to *** percent in 2013. Ukrainian producers did not export to the United States during 2008‐13. ArcelorMittal Kryvyi Rih reported that ***. Ukrainian producer Yenakiieve Steel reported that ***. It also noted that ***.
Figure II-6 Wire rod: Shares of total shipments of wire rod by Ukrainian producers, by destination, 2008-13
* * * * * * *
Inventory levels
Ukrainian producers’ inventories, as a share of total shipments, increased *** from *** percent in 2008 to *** percent in 2013.
Production alternatives
Both Ukrainian producers reported that ***. ArcelorMittal Kryvyi Rih reported that ***. Yenakiieve Steel reported that ***.
12 According to ***, the two Ukrainian producers (ArcelorMittal Kryvyi Rih and Yenakiieve Iron and Steel Works) accounted for *** in Ukraine in 2013.

II‐11
Nonsubject imports
The largest sources of nonsubject imports during 2008‐13 were China, Canada, and Japan. Combined, these countries accounted for 80.3 percent of nonsubject imports in 2013.
New suppliers
Seventeen of 36 purchasers reported new suppliers including, Nucor Steel’s new mill in Darlington, South Carolina and Kingman, Arizona; Beitai Steel (China); Duferco (nonsubject importer); Samsung Steel; Metal One; and Tangshan (China). Eighteen of 34 purchasers anticipate new suppliers to enter into the market, with several of the purchasers noting an increase of suppliers from China.
U.S. demand
Based on available information, the overall demand for wire rod is likely to experience moderate changes in response to changes in price. The main contributing factors are the lack of substitute products, which reduces responsiveness, and the large cost share of wire rod in most of its end‐use products which increases the potential to import downstream products, thus increasing demands’ responsiveness to price changes.
End uses
U.S. demand for wire rod depends on the demand for a variety of U.S.‐produced downstream products. Reported end uses include fasteners, wire garment hangers, wire mesh, nails, concrete reinforcing mesh, baling wire, industrial wire, tire cord/bead, shelving wire, sod staples, suspension springs, and PC strand. All ten responding U.S. producers, 20 of 21 responding importers, 29 of 36 purchasers, and all 8 responding foreign producers reported no changes in end uses. A few firms noted an increase in wire rod consumption in certain applications, particularly the automotive sector.
Business cycles
Short‐term demand for wire rod tends to be cyclical and follow trends in the construction industry. Five of ten U.S. producers, 6 of 23 importers, and 17 of 32 purchasers indicated that the market was subject to business cycles. Several firms noted that demand for wire rod is driven by downstream products used in the automotive and construction industry which is seasonal. Several firms noted that demand tends to fall in the winter when construction slows down.
The majority of firms (5 of 6 producers, 17 of 20 importers, and 15 of 27 purchasers) reported that wire rod is not subject to distinct conditions of competition. However, several firms noted that they must compete with foreign producers of finished wire products. Other firms noted the volume of U.S. imports of wire rod, particularly the increasing imports of wire rod from China.

II‐12
Five of 8 producers, 2 of 10 importers, and 14 of 19 purchasers reported that there have been changes to business cycles and/or conditions of competition since 2008. Three producers and 5 purchasers stated that the market has not recovered from the economic recession and the recovery of the construction industry has been slow. Two producers and one purchaser reported that conditions of competition have changed due to the growing imports of wire rod from China. One purchaser noted the consolidation of mills, as well as the new production or expansion of existing production capacity has changed the condition of competition since 2008. One producer (***) reported that there are now shorter lead times for customers to place orders, averaging 30‐33 day rolling schedule.
Apparent U.S. consumption
Apparent U.S. consumption of wire rod fluctuated during 2008‐13, falling in 2009 during the general economic recession and then slowly beginning to recover during 2010‐13. Overall, apparent U.S. consumption in 2013 was *** percent lower than in 2008.
Demand trends
Table II‐3 presents firm responses regarding U.S. demand for wire rod since 2008. While firm responses in table II‐3 are varied, the majority of firms described similar trends and factors in their narrative responses. The majority of producers and importers noted the financial recession and its negative effect on demand for wire rod, particularly in the construction industry. Four producers and five importers reported that while demand has improved since the recession, demand has not returned to pre‐recession levels. Several importers reported an improved and increased demand for wire rod in residential and commercial construction, and the automotive market. The majority of purchasers attributed an increased or fluctuated demand to the financial recession and a slowly recovering market. Several purchasers noted that demand in the construction market has recovered slightly but has still not reached 2008 levels. Three purchasers reported that demand for wire rod has decreased in the United States because firms have moved to importing finished products versus producing the finished good that uses wire rod domestically. A plurality of firms expect demand to increase over the next two years. In their narrative responses, the majority of firms reported that they anticipate demand for wire rod to continue to slowly increase, particularly in automotive markets and construction.

II‐13
Table II-3
Wire rod: Firms’ responses regarding U.S. demand, by number of responding firms
Item Number of firms reporting
Increase No change Decrease Fluctuate
Demand inside the United States since 2008: U.S. producers 0 2 8 0
Importers 7 5 6 5 Purchasers 9 1 13 11 Foreign producers 0 2 3 1
Anticipated demand inside the United States: U.S. producers 4 2 1 3
Importers 7 8 2 7 Purchasers 13 2 5 13 Foreign producers 5 1 0 1
Demand for purchasers' final products since 2008: Purchasers 11 1 8 15
Source: Compiled from data submitted in response to Commission questionnaires.
Substitute products
Substitutes for wire rod are very limited. All U.S. producers, the majority of importers (21 of 23) and purchasers (31 of 35), and all foreign producers (8) reported that there were no substitutes and did not anticipate any future changes in substitutes.13 Two importers and four purchasers identified substitutes for wire rod.14 *** reported that rebar can be substituted for wire rod in concrete reinforcement. *** reported that aluminum and welding can be used in place of wire rod for fastening components. *** reported that plastic and glass can be substituted for wire rod in refrigerator shelves and stamped steel can be substituted in HVAC screens. *** reported that plastic strapping and twine can be used in place of wire rod for tying up bales of materials to be recycled as well as tying up finished goods for shipping. *** reported that synthetics can be substituted for wire rod for static load suspenders. All three
13 Purchasers were asked if smaller diameter wire rod (4.75 mm) was interchangeable with wire rod with a diameter of 5.00 mm or greater. Twenty‐one of 35 responding purchasers reported that smaller diameter wire rod was interchangeable with wire rod. Purchasers reported that they use smaller wire rod in the following applications: nails, bailing wire, multiple fencing applications, and wire mesh products. One purchaser, ***, reported that using the smaller diameter wire rod has reduced its production costs because the 4.75 mm rod takes less draft (or die) to reduce the same wire gauge as when using 5.550 mm wire rod thereby increasing the speed of production; it reported that using less dies results in decreased electricity as well as lubricant.
14 While not a direct substitute, *** reported that imported finished products was a substitute for wire rod used in manufacturing domestically produced products. It reported that the price of imported finished products (fasteners) has an effect on its wire rod purchasing decisions. It stated that is has to purchase at a highly competitive price in order to stay competitive, as a manufacturer, with fasteners coming in from China.

II‐14
purchasers reported that changes in price of these substitutes do not affect the price for wire rod.
The majority of firms (all 10 producers, 25 of 26 importers, 30 of 33 purchasers, and all 8 foreign producers) reported that there have not been changes in substitutes since 2008. Additionally, the majority of U.S. producers (all 10), importers (24 of 26), purchasers (28 of 31), and foreign producers (all 8) reported that they do not anticipate new substitutes in the near future. However, one importer and three purchasers reported that there have been changes in substitutes since 2008 and that they anticipate new substitutes. *** reported that due to weight restrictions based on improved vehicle efficiencies, customers are looking to reduce the weight of parts while maintaining strength, therefore, suggesting that new substitutes will be created to replace wire rod. *** reported that there has been advancement in the use of carbon fiber, rubber belting, and synthetics as substitutes for wire rod and *** identified plastics for bail ties.
Cost share
Wire rod accounts for a large share of the cost of the end‐use products in which it is used, although cost shares vary widely due to the wide range of products that use wire rod. Eight producers, six importers and 35 purchasers reported the cost share of wire rod in final products which ranged from 29 percent to 100 percent. Wire rod accounted for 60 percent or greater of the total cost in 83 of the 104 final products reported by firms. Cost share information for products most commonly reported by firms include:
40 to 90 percent of the cost of various types of wire
60 to 90 percent of the cost of various meshes
45 to 85 percent of the cost of nails, staples, and fasteners
60 to 80 percent of the cost of chain link and barbed wire for fencing
33 to 60 percent of the cost of tire cord/tire bead
SUBSTITUTABILITY ISSUES
The degree of substitution between domestic and imported wire rod depends upon such factors as relative prices, quality (e.g., grade standards, reliability of supply, defect rates, etc.), and conditions of sale (e.g., price discounts/rebates, lead times between order and delivery dates, payment terms, product services, etc.). Based on available information, staff believes that where there are identical forms of wire rod, there is usually a high degree of substitutability between domestically produced wire rod and wire rod imported from subject sources. For common types of wire rod (such as industrial or standard quality), product typically will be highly substitutable with other product of the same specification even when the products are not identical, although there may be a need for retooling of the process to adjust to small differences. For specialty grades, however, not all sources can produce each product,
II‐15
and even differences between wire rod with the same specifications from different sources may limit the degree of substitution.15
Lead times
Wire rod is primarily produced‐to‐order. U.S. producers reported that 97.0 percent of their commercial shipments were produced‐to‐order, with lead times averaging 20‐45 days. The remaining 3.0 percent of domestic producers’ commercial shipments came from inventories, with lead times averaging 3‐7 days. Mexican importer *** reported that *** of its commercial shipments were produced‐to‐order, with lead times averaging *** days. Mexican importer *** reported that *** percent of its commercial shipments were produced‐to‐order, with lead times averaging *** days; the remaining *** percent of its commercial shipments came from inventories, with lead times averaging *** days.
Knowledge of country sources
Thirty‐five purchasers indicated they had marketing/pricing knowledge of domestic product, 15 of Mexican product, 5 of Brazilian product, 1 of Indonesian product, and 24 of nonsubject countries. No purchasers reported marketing/pricing knowledge of product from Moldova, Trinidad & Tobago, and Ukraine.
As shown in table II‐4, most purchasers and their customers never make purchasing decisions based on the country of origin. Many purchasers reported that they always or usually make purchasing decisions based on the producer; however, the majority of purchasers reported that their customers do not make purchasing decisions based on the producer. Of the 17 purchasers that reported that they always or usually make decisions based the manufacturer, 11 firms cited quality; other reasons cited include availability, price, supplier reliability, and transportation costs.
15 Carbon and Certain Alloy Steel Wire Rod from Brazil, Canada, Germany, Indonesia, Mexico, Moldova, Trinidad and Tobago, Turkey, and Ukraine: Investigation Nos. 701‐TA‐417 and 731‐TA‐953, 954, 957‐959, 961, and 962 (Review), USITC Publication 4014, June 2008, p. II‐11.

II‐16
Table II-4
Wire rod: Purchasing decisions based on producer and country of origin, by number of reporting firms
Purchaser/customer decision Always Usually Sometimes Never
Purchaser makes decision based on producer 8 9 12 8 Purchaser’s customers make decision based on producer 1 1 15 17 Purchaser makes decision based on country 3 4 16 12 Purchaser’s customers make decision based on country 0 2 16 16
Source: Compiled from data submitted in response to Commission questionnaires.
Factors affecting purchasing decisions
The most often cited top three factors firms consider in their purchasing decisions for wire rod were quality (33 firms), price (30 firms), and availability (16 firms) as shown in table II‐5. Quality was the most frequently cited first most important factor (cited by 14 firms), followed by price (12 firms); quality was the most frequently reported second most important factor (16 firms); and price and availability were the most frequently reported third most important factor (10 firms).
Table II-5 Wire rod: Ranking of factors used in purchasing decisions as reported by U.S. purchasers, by number of reporting firms
Factor First Second Third Total Quality 14 16 3 33 Price 12 8 10 30 Availability 1 5 10 16 Other1 9 7 13 29
1 Other factors delivery, payment terms, extension of credit, supplier-customer relationship, total cost, traditional supplier for the first factor; supplier reliability, delivery time, product range and product specifications for the second factor; and delivery time, supplier relationship, payment terms, product range, reliability of supplier, and traditional supplier for the third factor. Source: Compiled from data submitted in response to Commission questionnaires.
Purchasers were asked to identify the factors that determine the quality of wire rod. Purchasers reported several specific factors including: grade; meeting specifications; uniformity; chemical properties; tensile strength; surface quality and condition; formability; drawability; workability; diameter tolerance; steel purity; packaging; and factors related to the shape, consistent dimensions, size tolerance, and roundness. More generally, purchasers sought minimal problems when manufacturing which included minimal breakage and welds as expected. According to purchaser ***, “Carbon and alloy steel wire rod is not a homogenous product. The end uses of wire rod vary greatly. The technical requirements for the different

II‐17
types of wire rod vary greatly. This variation in technical and quality requirements is most significant in the specialty value added products such as welding quality wire rod.”16
The majority of purchasers (24 of 36) reported that they “usually” purchase the lowest‐priced product for their purchases, 12 reported “sometimes”, 1 reported “always” and 1 reported “never”. When asked if they purchased wire rod from one source although a comparable product was available at a lower price from another source, 23 purchasers reported reasons including quality and consistency of product, payment terms, shorter lead times, delivery reliability, product availability, low minimum order requirements, technical service, product specifications, use of long‐term contracts, supplier loyalty, and length of time to fill order. Fourteen of 34 responding purchasers reported that certain types of product were only available from a single source.17 One purchaser (***) reported that 50 percent of its proprietary specifications are currently not produced in the United States. One purchaser (***) stated that the C1090 5.5 mm wire rod is only available from Japanese and German producers.
Importance of specified purchase factors
Purchasers were asked to rate the importance of 15 factors in their purchasing decisions (table II‐6). The factors rates as “very important” by more than half of responding purchasers were price (36), availability (34), product consistency (33), delivery time (30), reliability of supply (30), quality meets industry standards (29), U.S. transportation costs (25), and delivery terms (20).
Table II-6 Wire rod: Importance of purchase factors, as reported by U.S. purchasers, by number of responding firms
Factor Very
important Somewhat important
Not important
Availability 34 2 0 Delivery terms 20 14 2 Delivery time 30 5 1 Discounts offered 7 24 5 Extension of credit 13 17 6 Minimum quantity requirements 6 17 13 Packaging 15 18 4 Price 36 1 0 Product consistency 33 4 0 Product range 7 25 5 Quality exceeds industry standards 10 18 8 Quality meets industry standards 29 6 1 Reliability of supply 30 6 0 Technical support/service 14 19 4 U.S. transportation costs 25 10 2
Source: Compiled from data submitted in response to Commission questionnaires.
16 Purchaser questionnaire response, section III‐15. 17 Eight of these 14 purchasers noted that the 4.75 mm wire rod is not produced in the United States
and is only available from Canadian and Mexican producers.

II‐18
Supplier certification
Twenty‐nine of 34 responding purchasers require that all of the wire rod they purchase be certified. Purchasers reported that the time to qualify a new supplier ranged from 30 to 365 days. Twelve of 35 responding purchasers reported that domestic or foreign supplier has failed in its attempt to qualify product, or had lost its approved status since 2008. Four purchasers identified domestic suppliers with product quality issues including: Nucor Steel, ArcelorMittal (U.S.‐based), CMC, Evraz, Gerdau, Keystone, Charter Steel, and Georgetown. Three purchasers reported that Chinese suppliers have failed to qualify product due to quality issues. According to ***, it is very difficult for mills to produce wire rod that consistently meets welding quality standards. It reported that it has tested many suppliers since 2008, of which many have either never been approved or lost their approved supplier status because of poor performance and lack of supply. *** stated that approximately 60 percent of the suppliers qualify and 40 percent do not receive an approved supplier status.
Changes in purchasing patterns
Purchasers were asked about changes in their purchasing patterns from different sources since 2008 (table II‐7); reasons reported for changes in sourcing included price, availability, and product range. Twenty of 34 responding purchasers reported that they had changed suppliers since 2008. Most purchasers noted the large number of wire rod suppliers and stated that they change suppliers most often because of price and availability.
Table II-7
Wire rod: Changes in purchase patterns from U.S., subject, and nonsubject countries
Source of purchases Did not
purchase Decreased Increased Constant Fluctuated
United States 1 9 11 5 10 Brazil 30 0 2 0 2 Indonesia 33 0 0 0 0 Mexico 16 10 4 0 5 Moldova 33 0 0 0 0 Trinidad & Tobago 31 1 0 0 2 Ukraine 33 0 0 0 0 All other sources 7 5 10 7 5
Source: Compiled from data submitted in response to Commission questionnaires.
Importance of purchasing domestic product
Purchasing U.S.‐produced product was not an important factor in purchasers’ decisions. In aggregate, the 34 responding purchasers reported that approximately 80.6 percent of their total purchases of wire rod in 2013 did not require domestic product. Twenty of 35 responding purchasers reported that they were required to purchase some domestic product by law or regulation (e.g., “Buy American” provisions) which accounted for 14.6 percent of total purchases in 2013; ten purchasers reported that approximately 3.7 percent of total purchases

II‐19
had domestic requirements by customers; and four purchasers reported that approximately 1.2 percent of total purchases in 2013 were required domestic product for other reasons including specific product requirements or application end‐use.
Comparisons of domestic products, subject imports, and nonsubject imports
Purchasers were asked a number of questions comparing wire rod produced in the United States, subject countries, and nonsubject countries. First, purchasers were asked for a country‐by‐country comparison on the same 15 factors (table II‐8) for which they were asked to rate the importance. 18
Purchaser responses were sparse except for comparisons between U.S.‐Mexico, U.S.‐Brazil, and U.S.‐nonsubject countries. In general, purchasers indicated that U.S. product was superior in terms of delivery times and technical support in most country comparisons. When comparing products from the United States and Brazil, most purchasers reported that U.S. product was superior to Brazilian product in terms of delivery time and U.S. transportation costs, and a plurality ranked U.S. superior in availability, delivery terms, technical support/service. Most U.S. purchasers reported that U.S. product was comparable to product from Brazil for all other characteristics.
When comparing products from the United States and Mexico, most purchasers reported that the products were comparable in the majority of factors. The exceptions to these were delivery time, wherein a plurality of purchasers reported that the U.S. product was superior, as well as product range and technical support/service wherein a plurality reported the products were comparable.
When comparing domestic product with product imported from nonsubject countries, most purchasers reported that the products were comparable in most factors. The exceptions were availability, delivery terms, and technical support, wherein a plurality of purchasers reported that domestic product was superior. The majority of purchasers reported that domestic product was superior in terms of delivery times. Additionally, purchasers were split on price, wherein 12 purchasers reported that the products were comparable in price and 12 purchasers reported that nonsubject prices were lower.
18 Purchasers did not provide country comparisons for the following country pairs: Brazil vs. Moldova; Brazil vs. Ukraine; Indonesia vs. Mexico; Indonesia vs. Moldova; Indonesia vs. Trinidad & Tobago; Indonesia vs. Ukraine; Mexico vs. Ukraine; Moldova vs. Ukraine; Trinidad vs. Ukraine; and Ukraine vs. nonsubject countries.

II‐20
Table II-8
Wire rod: Purchasers’ comparisons between U.S.-produced and imported product
Factor
U.S. vs. Brazil U.S. vs.
Indonesia U.S. vs. Mexico U.S. vs. Moldova
S C S S C I S C I S C I
Availability 3 3 1 3 0 0 8 11 2 1 0 1Delivery terms 3 2 2 3 0 0 7 12 2 1 1 0Delivery time 4 1 2 3 0 0 10 9 2 1 0 1Discounts offered 2 5 0 2 1 0 5 12 4 0 2 0Extension of credit 1 4 2 2 0 1 1 16 3 0 1 1Minimum quantity requirements 3 4 0 3 0 0 3 16 1 1 0 1Packaging 1 5 1 2 1 0 4 16 1 0 2 0Price1 0 5 1 2 1 0 4 12 5 0 2 0Product consistency 2 4 1 3 0 0 5 16 0 1 1 0Product range 2 3 2 2 1 0 6 10 5 0 1 1Quality exceeds industry standards 2 3 2 3 0 0 6 14 0 1 0 1Quality meets industry standards 2 4 1 3 0 0 3 17 0 1 1 0Reliability of supply 2 4 1 2 1 0 7 13 1 0 1 1Technical support/service 3 3 1 3 0 0 9 10 2 1 1 0U.S. transportation costs1 4 3 0 3 0 0 6 12 3 1 1 0
Factor U.S. vs. Trinidad
& Tobago U.S. vs. Ukraine
U.S. vs. nonsubject countries
Brazil vs. Indonesia
S C I S C I S C I S C I
Availability 2 2 0 1 0 0 12 10 4 1 0 0Delivery terms 2 2 0 1 0 0 13 10 3 1 0 0Delivery time 2 1 1 1 0 0 19 4 3 1 0 0Discounts offered 0 3 0 0 1 0 3 17 4 0 1 0Extension of credit 0 3 1 0 0 1 3 19 3 0 1 0Minimum quantity requirements 2 1 1 1 0 0 8 14 3 0 1 0Packaging 0 4 0 0 1 0 4 20 1 0 1 0Price1 0 4 0 0 1 0 1 12 12 0 1 0Product consistency 1 3 0 1 0 0 3 17 5 1 0 0Product range 0 4 0 0 1 0 2 20 3 1 0 0Quality exceeds industry standards 1 2 1 1 0 0 3 17 6 1 0 0Quality meets industry standards 1 2 0 1 0 0 2 20 2 0 1 0Reliability of supply 1 2 1 0 1 0 6 15 4 0 1 0Technical support/service 2 1 1 1 0 0 13 10 2 0 1 0U.S. transportation costs1 2 2 0 1 0 0 8 14 3 0 1 0
Table continued on following page.

II‐21
Table II-8--Continued
Wire rod: Purchasers’ comparisons between U.S.-produced and imported product
Factor
Brazil vs. Mexico
Brazil vs. Trinidad &
Tobago
Brazil vs. nonsubject countries
Indonesia vs. nonsubject countries
S C I S C I S C I S C I
Availability 1 3 1 0 1 0 0 4 0 0 0 1Delivery terms 1 4 0 0 1 0 0 4 0 0 0 1Delivery time 1 3 1 0 1 0 1 3 0 0 0 1Discounts offered 1 4 0 0 1 0 1 3 0 0 0 1Extension of credit 0 5 0 0 1 0 0 4 0 0 0 1Minimum quantity requirements 0 4 1 0 1 0 0 4 0 0 0 1Packaging 2 3 0 0 1 0 1 3 0 0 0 1Price1 0 4 1 0 1 0 0 4 0 0 0 1Product consistency 3 3 0 0 1 0 0 4 0 0 0 1Product range 2 3 0 0 1 0 0 4 0 0 0 1Quality exceeds industry standards 3 2 0 0 1 0 0 4 0 0 0 1Quality meets industry standards 1 4 0 0 1 0 0 4 0 0 0 1Reliability of supply 1 4 0 0 1 0 0 4 0 0 0 1Technical support/service 2 3 0 0 1 0 0 4 0 0 0 1U.S. transportation costs1 0 4 1 0 1 0 0 5 0 0 1 0
Factor Mexico vs. Moldova
Mexico vs. Trinidad &
Tobago
Mexico vs. nonsubject countries
Moldova vs. Trinidad &
Tobago
S C I S C I S C I S C I
Availability 0 1 0 1 1 0 2 7 3 0 0 1Delivery terms 0 0 1 1 1 0 2 7 3 0 1 0Delivery time 1 0 0 1 1 0 4 5 3 0 0 1Discounts offered 0 0 1 0 2 0 2 9 1 0 1 0Extension of credit 0 1 0 0 2 0 1 10 1 0 1 0Minimum quantity requirements 0 1 0 1 1 0 1 10 1 0 0 1Packaging 0 0 1 0 2 0 2 9 1 0 1 0Price1 0 1 0 0 2 0 0 7 5 0 1 0Product consistency 0 0 1 0 2 0 1 10 1 0 1 0Product range 0 0 1 0 1 0 2 6 3 0 0 1Quality exceeds industry standards 0 0 1 0 2 0 1 8 3 0 0 1Quality meets industry standards 0 1 0 0 1 0 1 8 2 0 1 0Reliability of supply 0 1 0 1 1 0 2 8 2 0 0 1Technical support/service 0 0 1 1 1 0 2 9 1 0 1 0U.S. transportation costs1 0 2 0 1 1 0 3 9 0 0 1 0
Table continued on following page.

II‐22
Table II-8--Continued
Wire rod: Purchasers’ comparisons between U.S.-produced and imported product
Factor
Moldova vs. nonsubject countries
Trinidad & Tobago vs. nonsubject countries
S C I S C I
Availability 0 0 1 0 2 1Delivery terms 0 1 0 0 3 0Delivery time 0 0 1 0 3 0Discounts offered 0 1 0 0 2 0Extension of credit 0 1 0 0 3 0Minimum quantity requirements 0 0 1 0 2 0Packaging 0 1 0 0 3 0Price1 0 1 0 0 2 1Product consistency 0 1 0 0 2 0Product range 0 0 1 0 2 0Quality exceeds industry standards 0 0 1 0 2 1Quality meets industry standards 0 1 0 0 2 0Reliability of supply 0 1 1 0 1 2Technical support/service 0 1 0 0 3 0U.S. transportation costs1 0 1 0 0 3 0
1 A rating of superior means that price/U.S. transportation costs is generally lower. For example, if a firm reported “U.S. superior,” it meant that the U.S. product was generally priced lower than the imported product. Note.--S=first listed country’s product is superior; C=both countries’ products are comparable; I=first list country’s product is inferior. Source: Compiled from data submitted in response to Commission questionnaires.
In order to determine whether U.S.‐produced wire rod can generally be used in the same applications as imports from subject countries, U.S. producers, importers, and purchasers were asked whether the products can “always,” “frequently,” “sometimes,” or “never” be used interchangeably. As shown in table II‐9, most U.S. producers reported that wire rod from all country pairs was “always” interchangeable and a majority of importers reported that wire rod from all country pairs was “always” or “frequently” interchangeable. Purchasers were more divided in their responses. Several firms noted that product interchangeability depends on the mill, not the country in which the wire rod is produced. The majority of firms reported that the interchangeability depends on the end application and the quality of wire rod required; low quality wire rod used in IQ or mesh will tend to be more interchangeable, however, wire rod used to make cold heading fasteners or tie cord will be more difficult to interchange. Importer *** noted that for the non‐standard grades of alloy welding rods, there are no U.S mills that produce the very tight chemistry ranges required, and therefore it sources from the Netherlands. One purchaser reported that wire rod from Mexico or China often has poor surface quality with rust. *** reported that wire rod from Moldova and Ukraine is lower in quality and therefore, low carbon wire rod used for mesh making is the only type that is interchangeable. *** stated that “Wire rod produced in Mexico can be interchangeable; however, some grades are not regularly produced in the U.S. and therefore, availability is limited. Wire rod imported from the other countries that are used to make automotive parts

II‐23
are tested extensively and approved by the automaker for specific parts and performance; therefore, it has limit interchangeability.”19
Table II-9
Wire rod: Interchangeability between wire rod produced in the United States and in other countries, by country pairs
Country pair Number of U.S.
producers reporting Number of U.S.
importers reporting Number of
purchasers reporting
A F S N A F S N A F S N
U.S. vs. subject countries: U.S. vs. Brazil 8 1 0 0 2 5 0 0 5 1 3 1
U.S. vs. Indonesia 8 1 0 0 1 5 1 0 2 1 2 0
U.S. vs. Mexico 8 1 1 0 1 10 2 0 8 7 7 0
U.S. vs. Moldova 8 1 0 0 1 3 2 0 2 0 3 0
U.S. vs. Trinidad & Tobago 8 1 0 0 1 7 1 0 4 2 3 0
U.S. vs. Ukraine 8 1 0 0 1 4 1 0 2 0 1 0
Subject countries comparisons: Brazil vs. Indonesia 7 1 0 0 1 4 2 0 2 0 3 1
Brazil vs. Mexico 7 1 0 0 1 5 2 0 2 3 4 1 Brazil vs. Moldova 7 1 0 0 1 4 1 0 1 0 2 0 Brazil vs. Trinidad & Tobago 7 1 0 0 1 4 1 0 2 1 2 1 Brazil vs. Ukraine 7 1 0 0 1 4 1 0 1 0 1 0 Indonesia vs. Mexico 7 1 0 0 1 5 2 0 3 1 3 0 Indonesia vs. Moldova 7 1 0 0 1 4 1 0 1 0 2 0 Indonesia vs. Trinidad & Tobago 7 1 0 0 1 4 1 0 2 1 2 0 Indonesia vs. Ukraine 7 1 0 0 1 4 1 0 1 0 1 0 Mexico vs. Moldova 7 1 0 0 1 5 1 0 1 0 2 0 Mexico vs. Trinidad & Tobago 7 1 0 0 1 5 2 0 3 0 4 0 Mexico vs. Ukraine 7 1 0 0 1 5 1 0 1 0 2 0 Moldova vs. Trinidad & Tobago 7 1 0 0 1 4 1 0 2 0 2 0 Moldova vs. Ukraine 7 1 0 0 1 4 1 0 1 0 1 0 Trinidad & Tobago vs. Ukraine 7 1 0 0 1 4 1 0 1 0 1 0Nonsubject countries comparisons: U.S. vs. nonsubject 9 1 0 0 2 9 5 2 8 15 6 1 Brazil vs. nonsubject 7 1 0 0 2 4 1 1 2 3 3 0 Indonesia vs. nonsubject 7 1 0 0 2 4 1 1 2 1 2 0 Mexico vs. nonsubject 7 1 0 0 2 5 2 1 3 7 4 0 Moldova vs. nonsubject 7 1 0 0 2 3 2 1 2 1 2 0 Trinidad & Tobago vs. nonsubject 7 1 0 0 3 4 2 1 2 1 3 0
Ukraine vs. nonsubject 7 1 0 0 2 3 2 1 2 1 1 0Note.—A=Always, F=Frequently, S=Sometimes, N=Never. Source: Compiled from data submitted in response to Commission questionnaires.
19 Importer questionnaire response, section III‐30.
II‐24
As can be seen from table II‐10, 17 responding purchasers reported that domestically‐produced product “always” met minimum quality specifications.20 The majority of purchasers reported that they did not have any knowledge of the quality specifications of wire rod from most subject countries. However, seven of seventeen responding purchasers reported that the Mexican product “always” met minimum quality specifications.
Table II-10
Wire rod: Ability to meet minimum quality specifications, by source and number of reporting firms1
Source Always Usually Sometimes Rarely or
never Don’t know
United States 17 16 0 1 0
Brazil 2 2 1 0 26
Indonesia 0 0 1 0 28
Mexico 7 9 1 0 16
Moldova 0 1 0 0 28
Trinidad & Tobago 1 2 0 0 26
Ukraine 0 0 0 0 29
Other: Canada 3 3 0 0 0
Other: China 8 12 1 0 0
Other: Turkey 3 7 0 0 0 1 Purchasers were asked how often domestically produced or imported wire rod meets minimum quality specifications for their own or their customers’ uses. Source: Compiled from data submitted in response to Commission questionnaires.
In addition, producers, importers, and purchasers were asked to assess how often differences other than price were significant in sales of wire rod from the United States, subject, or nonsubject countries. As seen in table II‐11, most producers reported that there were “never” differences other than price and most importers reported that there were “sometimes” or “never” differences other than price. Purchaser responses were more divided. The most common difference reported by firms was shorter delivery and lead times. Other differences included: grade ranges, purity levels, steel quality, technical support, availability of ultra‐high carbon for certain end‐use applications, and availability of smaller diameter wire rod.
20 ***. Purchaser questionnaire response, section III‐13.

II‐25
Table II-11
Wire rod: Significance of differences other than price between wire rod produced in the United States and in other countries, by country pairs
Country pair Number of U.S.
producers reporting Number of U.S.
importers reporting Number of
purchasers reporting
A F S N A F S N A F S N
U.S. vs. subject countries: U.S. vs. Brazil 0 0 3 6 1 0 2 2 3 2 2 4
U.S. vs. Indonesia 0 0 3 6 1 0 2 2 3 0 0 3
U.S. vs. Mexico 0 0 3 6 3 2 3 2 4 4 7 7
U.S. vs. Moldova 0 0 3 6 1 0 2 1 4 0 0 2
U.S. vs. Trinidad & Tobago 0 0 3 6 1 1 3 1 3 2 1 3
U.S. vs. Ukraine 0 0 3 6 1 0 2 1 2 0 0 2
Subject countries comparisons: Brazil vs. Indonesia 0 0 2 6 1 0 2 2 2 0 0 2
Brazil vs. Mexico 0 0 2 6 2 0 2 2 2 2 3 2 Brazil vs. Moldova 0 0 2 6 1 0 2 1 2 0 0 1 Brazil vs. Trinidad & Tobago 0 0 2 6 1 0 2 1 2 1 1 1 Brazil vs. Ukraine 0 0 2 6 1 0 2 1 2 0 0 1 Indonesia vs. Mexico 0 0 2 6 2 0 2 2 2 0 1 2 Indonesia vs. Moldova 0 0 2 6 1 0 2 1 2 0 0 1 Indonesia vs. Trinidad & Tobago 0 0 2 6 1 0 2 1 2 0 1 1 Indonesia vs. Ukraine 0 0 2 6 1 0 2 1 2 0 0 1 Mexico vs. Moldova 0 0 2 6 2 0 2 1 2 0 0 1 Mexico vs. Trinidad & Tobago 0 0 2 6 2 0 2 1 2 1 1 2 Mexico vs. Ukraine 0 0 2 6 2 0 2 1 2 0 0 1 Moldova vs. Trinidad & Tobago 0 0 2 6 1 0 2 1 2 0 1 1 Moldova vs. Ukraine 0 0 2 6 1 0 2 1 2 0 0 1 Trinidad & Tobago vs. Ukraine 0 0 2 6 1 0 2 1 2 0 0 1 Nonsubject countries comparisons: U.S. vs. nonsubject 0 0 2 8 5 4 4 3 6 7 9 8 Brazil vs. nonsubject 0 0 1 7 3 1 2 2 2 2 2 2 Indonesia vs. nonsubject 0 0 1 7 3 1 2 2 2 1 1 2 Mexico vs. nonsubject 0 0 1 7 4 1 2 1 2 3 6 2 Moldova vs. nonsubject 0 0 1 7 3 1 2 1 2 1 1 1 Trinidad & Tobago vs. nonsubject 0 0 1 7 3 1 2 2 2 1 1 2
Ukraine vs. nonsubject 0 0 1 7 3 1 2 1 2 1 1 2 Note.--A = Always, F = Frequently, S = Sometimes, N = Never. Source: Compiled from data submitted in response to Commission questionnaires.

II‐26
ELASTICITY ESTIMATES
This section discusses elasticity estimates. Although parties were encouraged to comment on these estimates in their prehearing or posthearing briefs, none commented.
U.S. supply elasticity
The domestic supply elasticity21 for wire rod measures the sensitivity of the quantity supplied by U.S. producers to changes in the U.S. market price of wire rod. The elasticity of domestic supply depends on several factors including the level of excess capacity, the ease with which producers can alter capacity, producers’ ability to shift to production of other products, the existence of inventories, and the availability of alternate markets for U.S.‐produced wire rod. Analysis of these factors earlier indicates that the U.S. industry is likely to be able to slightly increase or decrease shipments to the U.S. market; an estimate in the range of 1 to 3 is suggested.
U.S. demand elasticity
The U.S. demand elasticity for wire rod measures the sensitivity of the overall quantity demanded to a change in the U.S. market price of wire rod. This estimate depends on factors discussed earlier such as the existence, availability, and commercial viability of substitute products, as well as the component share of the wire rod in the production of any downstream products. Based on the available information, the aggregate demand for wire rod is likely to be moderately elastic; a range of ‐0.5 to ‐0.75 is suggested.
Substitution elasticity
The elasticity of substitution depends upon the extent of product differentiation between the domestic and imported products.22 Product differentiation, in turn, depends upon such factors as quality (e.g., chemistry, appearance, etc.) and conditions of sale (e.g., availability, sales terms/ discounts/ promotions, etc.). Based on available information, the elasticity of substitution between U.S.‐produced wire rod and imported wire rod is likely to be in the range of 3 to 5.
21 A supply function is not defined in the case of a non‐competitive market. 22 The substitution elasticity measures the responsiveness of the relative U.S. consumption levels of
the subject imports and the domestic like products to changes in their relative prices. This reflects how easily purchasers switch from the U.S. product to the subject products (or vice versa) when prices change.

III‐1
PART III: CONDITION OF THE U.S. INDUSTRY
OVERVIEW
From 2008 to 2013, the domestic wire rod industry experienced production curtailments and resumptions, capacity expansions, facilities openings or re‐openings, and facilities shutdowns.1 Nucor opened a new wire rod mill at its Darlington, South Carolina, facility in October 2013, and reopened a previously idled facility at Kingman, Arizona, in November 2010. ArcelorMittal’s Georgetown, South Carolina facility, Evraz Pueblo’s Pueblo, Colorado facility, and Keystone’s Peoria, Illinois facility underwent production curtailments and resumptions during 2008‐12. Gerdau idled the rolling mill at its facility in Perth Amboy, New Jersey, in August 2009, after having closed the melt shop at this facility in February 2007.2 The rolling mill remains idled at this time and would require ***.3 Gerdau also invested in melting and rolling capacity expansions at its Jacksonville, Florida, facility during 2008‐10. Table III‐1 summarizes important events that have occurred in the U.S. industry since January 2008.
BACKGROUND
Information in this section is based on the questionnaire responses of 10 producers that are believed to have accounted for all known U.S. production during 2013.
CHANGES IN EXISTING OPERATIONS
Domestic producers were asked to indicate whether their firm had experienced any plant openings, relocations, expansions, acquisitions, consolidations, closures, or prolonged shutdowns because of strikes or equipment failure; curtailment of production because of shortages of materials or other reasons, including revision of labor agreements; or any other change in the character of their operations or organization relating to the production of wire rod since 2008. Eight domestic producers indicated that they had experienced such changes; their responses are presented in table III‐2.
1 Previously, during 2002‐06, the industry underwent extensive restructuring through bankruptcies, corporate consolidations, facilities acquisitions, and new entrants. See Carbon and Certain Alloy Steel Wire Rod from Brazil, Canada, Indonesia, Mexico, Moldova, Trinidad and Tobago, and Ukraine, Inv. Nos. 701‐TA‐417 and 731‐TA‐953, 954, 957‐959, 961, and 962 (Review), USITC Publication 4014, June 2008, pp. III‐1 to III‐2 and table III‐1.
2 American Metal Market, “Melt Shop Closure Saves Money for Ameristeel,” February 8, 2007.
3 ***. Domestic producers’ posthearing brief, exhibit 1, “Responses to Commissioner questions, Gerdau’s Perth Amboy facility,” pp. 58‐60. For further information, see exhibit 24, “***.”

III‐2
Table III-1 Wire rod: Survey of industry events, 2008-13
Period
Company
Description of event (curtailment, expansion, opening, reopening, resumption, shutdown)
January 2008 Keystone Curtailment and resumption: Resumption of operations after a late-December outage was hindered by various difficulties at the Peoria, IL, facility, which reportedly resulted in an estimated 6,000-7,000 tons of lost production.
January 2008 Gerdau Expansion: Investment plans were announced for boosting the annual rolling capacity by 400,000 at the Jacksonville, FL, facility, with completion anticipated by 2010. Rolling capacity expansion would enable Gerdau to match the recently expanded melting capacity at this facility which currently exceeds 1 million tons.
October- November 2008
Keystone Curtailment and resumption: The Peoria, IL, facility was reopened after a temporary shutdown for furnace maintenance, but management placed a majority of employees on a week-to-week layoff schedule, due to reportedly “generally slow” business conditions.
October 2008- January 2009
ArcelorMittal Curtailment and resumption: The Georgetown, SC, facility, was temporarily idled in October-November 2008 and again in December 2008- January 2009, as part of parent company ArcelorMittal SA’s plans to cutback fourth-quarter 2008 output of all steel mill products by 30 percent worldwide and by 35 percent in the United States, which resulted in the temporary lay-offs of some 300 employees. Although the facility reopened in January 2009, 51 employees were permanently laid-off.
November- December 2008
Evraz Pueblo Curtailment and resumption: The bar and rod mill at the Pueblo, CO, facility was temporarily idled due to lack of customer orders.
June 2009 Gerdau Shutdown: Halting of production announced at the Perth Amboy, NJ, rolling mill, followed by addition of another shift at the Beaumont, TX, facility to meet customer orders and to stock the warehouse.
July 2009 ArcelorMittal Shutdown: Georgetown, SC, facility closed down, after labor negotiations failed to reach agreement for keeping the facility open. Halting in late June of the melt shop (with 1 million tons of annual capacity) and in early July of the rolling-mill operations (with 750,000 tons of annual capacity) affected some 265 hourly employees and 53 salaried employees.
November 2010 Nucor Reopening: Restarted operations at Kingman, AZ, facility, previously acquired in 2003 from the former North Star Steel Co., to produce both wire rods and concrete reinforcing bars. This rolling mill has an anticipated output capacity rating of 500,000 tons annually, but the July 2009 air-quality permit limited production to 350,000 tons annually. Other Nucor bar mills with excess melting capacity supply billets to the Kingman rolling mill.
January 2011 ArcelorMittal Reopening: Georgetown, SC, facility resumed production. This facility, being capable of melting 1 million short tons of crude steel and rolling 750,000 tons of wire rod annually, actually rolled about 380,000 tons annually between 2006 and 2008. With plans to continue the previous practice of rolling to order, rather than also for building-up warehouse inventory, initial production was estimated to reach about 264,000 tons of wire rods annually. Reopening of this facility was anticipated to bring back 185 union employees, under a new labor agreement that was ratified back in June 2010, and 44 managers.
Fourth-quarter 2012
ArcelorMittal Curtailment: Operations at the Georgetown, SC, facility were cutback from three to two shifts, along with laying-off of 30 employees.
October 2013 Nucor Opening: Shipments commenced from the newly constructed wire-rod mill at the Darlington, SC facility. This new wire-rod mill has an annual output capacity rating of 300,000 tons and is capable of producing wire rods with diameters down to 5.5 mm and coiled bars up to 2 inches in diameter, in a full range of low-, medium-, and high-carbon contents.
Source: American Metal Market, Metal Bulletin, and individual company Internet web sites.

III‐3
Table III-2 Wire rod: Changes in the character of U.S. operations since January 1, 2008
* * * * * * *
ANTICIPATED CHANGES IN EXISTING OPERATIONS
The Commission asked domestic producers to report anticipated changes in the character of their operations relating to the production of wire rod. Four domestic producers (***) indicated that they do not anticipate any changes in the character of their operations. The responses of the remaining six domestic producers appear in table III‐3.
Table III-3 Wire rod: Anticipated changes in the character of U.S. operations
* * * * * * *
U.S. PRODUCTION, CAPACITY, AND CAPACITY UTILIZATION
Table III‐4 presents U.S. producers’ production, capacity, and capacity utilization. U.S. capacity for wire rod fell from 2008 to 2010, increased in 2011, and fell thereafter to a level that was 8.5 percent lower than reported for 2008. Domestic production fluctuated during the six‐year period to a level in 2013 that is 9.9 percent lower than that reported in 2008. Capacity utilization also fluctuated during 2008‐13 ranging from a high of 75.6 percent (2012) to a low of 53.6 percent (2009).
Table III-4 Wire rod: U.S. producers’ production, capacity, and capacity utilization, 2008-13
Item Calendar year
2008 2009 2010 2011 2012 2013 Quantity (short tons)
Capacity 5,546,751 5,295,752 4,965,095 5,173,168 5,131,954 5,073,815Production 4,055,641 2,837,165 3,384,322 3,907,416 3,879,060 3,655,088
Ratio (percent) Capacity utilization 73.1 53.6 68.2 75.5 75.6 72.0Note.— ***. Source: Compiled from data submitted in response to Commission questionnaires.
While aggregate production quantity declined overall from 2008 to 2013 with most firms reporting decreases in production over the period, three firms (***) reported overall increases in production, ranging between *** and *** percent from 2008 to 2013.
Although six U.S. producers reported no changes in the capacity to produce wire rod, one firm (***) reported overall declines in capacity and three firms (***) reported overall increases in capacity. ***.
Gerdau reported *** the closure of its Perth Amboy, New Jersey rolling mill in August 2009. The Gerdau facility, which is dedicated to wire rod production and has an annual capacity of 750,000 short tons, remains idled at this time and would require six months to one year to

III‐4
resume wire rod production.4 Staff adjusted the capacity data presented in this report to exclude Gerdau’s idled 750,000 annual short ton capacity at its Perth Amboy, New Jersey facility during the last half of 2009 and during 2010‐13. This is consistent with the manner in which the Commission defines capacity,5 as well as with the manner in which domestic capacity data are treated by independent market research.6 The annual wire rod capacity reported by *** for Gerdau’s Perth Amboy facility ***.7
Although ArcelorMittal reported ***.8 James Sanderson, President of the Steelworkers Local 7898 that represents steelworkers at the ArcelorMittal plant in Georgetown, South Carolina, testified at the Commission’s hearing that “In 2008, we basically were in operation and we went down in 2009 and we stayed down until the later part of 2011 and actually started production in 2012.”9 However, because production did resume, and, consistent with the manner in which the firm’s capacity data are treated in independent market research, staff did not adjust the reported data.
CONSTRAINTS ON CAPACITY
All U.S. producers, ***, reported constraints in the manufacturing process. Reported constraints in the manufacturing process for the U.S. producers include melting capacity, which is constrained by environmental air permits; steel availability; speed of equipment, rolling capacity, employee resources, market conditions, and import competition. Three U.S. producers (***) that collectively accounted for *** of domestic production in 2013 specifically noted that they are not operating at full capacity due to the market conditions and that weakened demand due to import competition limits their ability to produce more wire rod.
4 Carbon and Certain Alloy Steel Wire Rod from China, Inv. Nos. 701‐TA‐512 and 731‐TA‐1248 (Preliminary), USITC Publication 4458 (March 2014), p. III‐3; and Domestic producers’ prehearing brief, p. 56.
5 In its instructions that accompanied the questionnaires issued in these reviews, the Commission defined capacity as follows: The level of production that your establishment(s) could reasonably have expected to attain during the specified periods. Assume normal operating conditions (i.e., using equipment and machinery in place and ready to operate; normal operating levels (hours per week/weeks per year) and time for downtime, maintenance, repair, and cleanup; and a typical or representative product mix).
6 ***. 7 Ibid. 8 The overall annual plant capacity reported by ArcelorMittal USA for Georgetown is *** short tons,
*** short tons of which are allocated for wire rod. The overall annual plant capacity for Indiana Harbor is *** short tons, *** short tons of which are allocated for wire rod.
9 Hearing transcript, p. 77 (Sanderson).
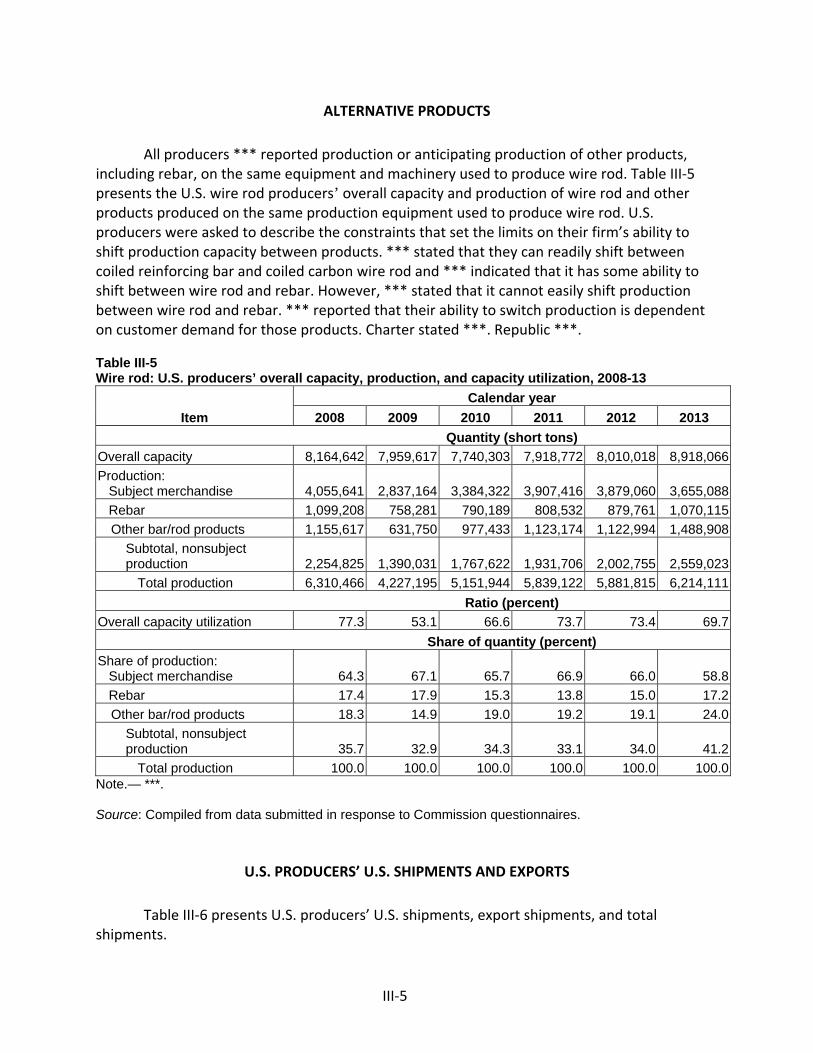
III‐5
ALTERNATIVE PRODUCTS
All producers *** reported production or anticipating production of other products, including rebar, on the same equipment and machinery used to produce wire rod. Table III‐5 presents the U.S. wire rod producers’ overall capacity and production of wire rod and other products produced on the same production equipment used to produce wire rod. U.S. producers were asked to describe the constraints that set the limits on their firm’s ability to shift production capacity between products. *** stated that they can readily shift between coiled reinforcing bar and coiled carbon wire rod and *** indicated that it has some ability to shift between wire rod and rebar. However, *** stated that it cannot easily shift production between wire rod and rebar. *** reported that their ability to switch production is dependent on customer demand for those products. Charter stated ***. Republic ***.
Table III-5 Wire rod: U.S. producers’ overall capacity, production, and capacity utilization, 2008-13
Item
Calendar year
2008 2009 2010 2011 2012 2013
Quantity (short tons)
Overall capacity 8,164,642 7,959,617 7,740,303 7,918,772 8,010,018 8,918,066
Production: Subject merchandise 4,055,641 2,837,164 3,384,322 3,907,416 3,879,060 3,655,088
Rebar 1,099,208 758,281 790,189 808,532 879,761 1,070,115
Other bar/rod products 1,155,617 631,750 977,433 1,123,174 1,122,994 1,488,908
Subtotal, nonsubject production 2,254,825 1,390,031 1,767,622 1,931,706 2,002,755 2,559,023
Total production 6,310,466 4,227,195 5,151,944 5,839,122 5,881,815 6,214,111
Ratio (percent)
Overall capacity utilization 77.3 53.1 66.6 73.7 73.4 69.7
Share of quantity (percent)
Share of production: Subject merchandise 64.3 67.1 65.7 66.9 66.0 58.8
Rebar 17.4 17.9 15.3 13.8 15.0 17.2
Other bar/rod products 18.3 14.9 19.0 19.2 19.1 24.0
Subtotal, nonsubject production 35.7 32.9 34.3 33.1 34.0 41.2
Total production 100.0 100.0 100.0 100.0 100.0 100.0Note.— ***. Source: Compiled from data submitted in response to Commission questionnaires.
U.S. PRODUCERS’ U.S. SHIPMENTS AND EXPORTS
Table III‐6 presents U.S. producers’ U.S. shipments, export shipments, and total shipments.
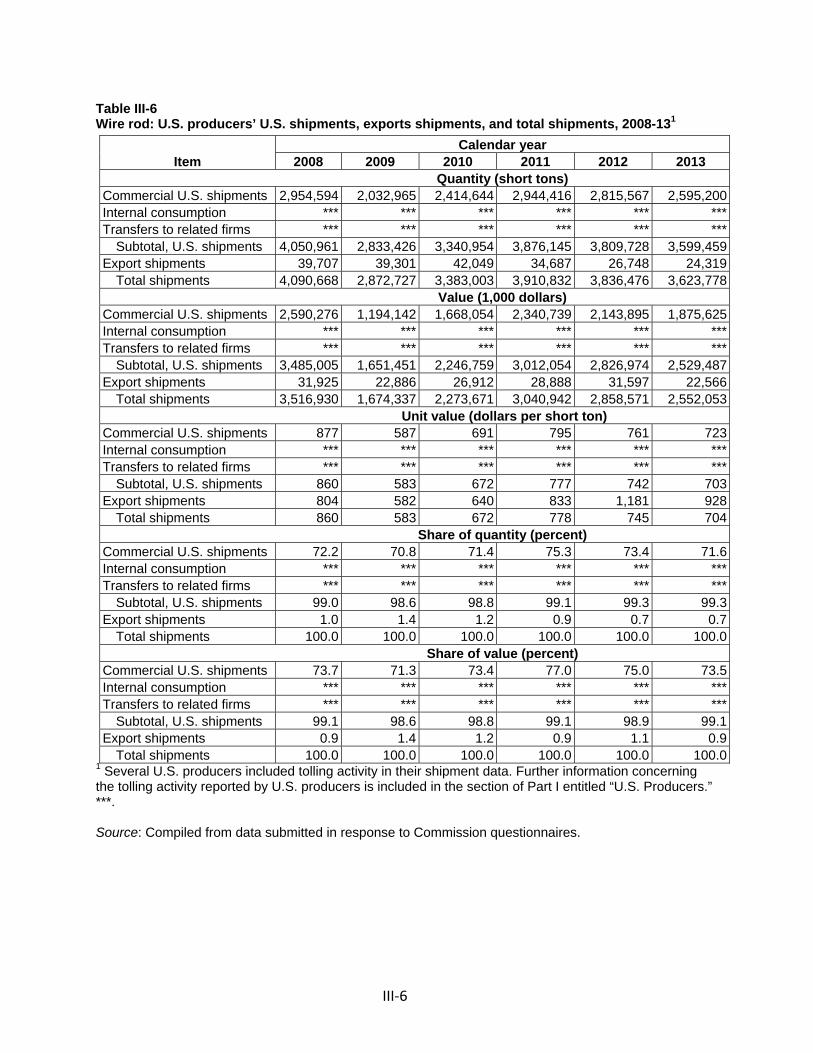
III‐6
Table III-6 Wire rod: U.S. producers’ U.S. shipments, exports shipments, and total shipments, 2008-131
Item Calendar year
2008 2009 2010 2011 2012 2013 Quantity (short tons) Commercial U.S. shipments 2,954,594 2,032,965 2,414,644 2,944,416 2,815,567 2,595,200Internal consumption *** *** *** *** *** ***Transfers to related firms *** *** *** *** *** ***
Subtotal, U.S. shipments 4,050,961 2,833,426 3,340,954 3,876,145 3,809,728 3,599,459Export shipments 39,707 39,301 42,049 34,687 26,748 24,319
Total shipments 4,090,668 2,872,727 3,383,003 3,910,832 3,836,476 3,623,778 Value (1,000 dollars) Commercial U.S. shipments 2,590,276 1,194,142 1,668,054 2,340,739 2,143,895 1,875,625Internal consumption *** *** *** *** *** ***Transfers to related firms *** *** *** *** *** ***
Subtotal, U.S. shipments 3,485,005 1,651,451 2,246,759 3,012,054 2,826,974 2,529,487Export shipments 31,925 22,886 26,912 28,888 31,597 22,566
Total shipments 3,516,930 1,674,337 2,273,671 3,040,942 2,858,571 2,552,053 Unit value (dollars per short ton) Commercial U.S. shipments 877 587 691 795 761 723Internal consumption *** *** *** *** *** ***Transfers to related firms *** *** *** *** *** ***
Subtotal, U.S. shipments 860 583 672 777 742 703Export shipments 804 582 640 833 1,181 928
Total shipments 860 583 672 778 745 704 Share of quantity (percent) Commercial U.S. shipments 72.2 70.8 71.4 75.3 73.4 71.6Internal consumption *** *** *** *** *** ***Transfers to related firms *** *** *** *** *** ***
Subtotal, U.S. shipments 99.0 98.6 98.8 99.1 99.3 99.3Export shipments 1.0 1.4 1.2 0.9 0.7 0.7
Total shipments 100.0 100.0 100.0 100.0 100.0 100.0 Share of value (percent) Commercial U.S. shipments 73.7 71.3 73.4 77.0 75.0 73.5Internal consumption *** *** *** *** *** ***Transfers to related firms *** *** *** *** *** ***
Subtotal, U.S. shipments 99.1 98.6 98.8 99.1 98.9 99.1Export shipments 0.9 1.4 1.2 0.9 1.1 0.9
Total shipments 100.0 100.0 100.0 100.0 100.0 100.01 Several U.S. producers included tolling activity in their shipment data. Further information concerning the tolling activity reported by U.S. producers is included in the section of Part I entitled “U.S. Producers.” ***. Source: Compiled from data submitted in response to Commission questionnaires.

III‐7
The quantity of U.S. producers’ U.S. shipments declined steeply from 2008 to 2009, increased from 2009 to 2011, and fell to a level in 2013 that was 11.1 percent lower than the level reported in 2008. The value and unit value of U.S. producers’ U.S. shipments followed a similar trend, declining overall by 27.3 percent and 18.3 percent, respectively.
Commercial U.S. shipments accounted for between 70.8 and 75.3 percent of U.S. producers’ total shipments of wire rod during 2008‐13, whereas internal consumption accounted for between *** and *** percent of U.S. producers’ total shipments of wire rod and transfers to related firms accounted for between *** and *** percent.10 Seven firms, ***, reported internally consuming or transferring wire rod to a related firm to produce a downstream product. U.S. producers reported internal consumption and company transfers of wire rod for the production of nails, garment hangers, wire shelving, prestressed concrete strand, oil tempered and other high carbon wire, drawn wire (including tire bead, high carbon and fine wire quality), cold finished bars, cold headed parts, mesh, agricultural fencing, armoring wire, galvanized wire, concrete reinforcing mesh, and bed spring components.
U.S. producers’ total exports of wire rod accounted for between 0.7 to 1.4 percent of their total shipments during 2008‐13. Five out of ten producers reported exports of wire rod, predominately to Canada and Mexico, as well as to ***. U.S. producers contend that it is hard to compete in export markets due to the lower priced product there, particularly from the Chinese producers. Evraz does export some high end value products to Mexico.11
10 Aggregate domestic producers’ internal consumption fell from *** short tons in 2008 to *** short tons in 2009, before generally increasing to *** short tons in 2013. Aggregate domestic producers’ company transfers fell from *** short tons in 2008 to *** short tons in 2009, before generally increasing to *** short tons in 2013. Domestic company representatives present at the Commission’s hearing testified that such transfers are made at market prices. Hearing transcript, pp. 83‐84 (Stirnaman (Keystone), Nystron (Nucor), and Kerkvliet (Gerdau)).
11 Carbon and Certain Alloy Steel Wire Rod from China, Inv. Nos. 701‐TA‐512 and 731‐TA‐1248 (Preliminary), USITC Publication 4458, March 2014, p. III‐6.

III‐8
U.S. PRODUCERS’ U.S. SHIPMENTS, BY APPLICATION
Table III‐7 presents U.S. producers’ U.S. shipments by type in 2013. All U.S. producers reported U.S. shipments of high/medium‐high carbon industrial/standard quality wire rod and all *** reported U.S. shipments of low/medium‐low carbon industrial/standard quality wire rod. These two types of wire rod together accounted for more than three‐fourths of all types of U.S. producers’ U.S. shipments during 2013.
Table III-7 Wire rod: U.S. producers’ U.S. shipments, by type, 2013
Item Quantity
(short tons) Share
(percent) Number of
reporting firms
Low/medium-low carbon industrial/standard quality 1,768,913 49.1 9
High/medium-high carbon industrial/standard quality 1,002,954 27.9 10
Tire cord or tire bead quality *** *** ***
Welding quality *** *** ***
Cold heading quality (“CHQ”) *** *** ***
Other specialty carbon and alloy quality *** *** ***
All other wire rod *** *** ***
Total, U.S. shipments 3,599,459 100.0 10Source: Compiled from data submitted in response to Commission questionnaires.
Cold heading quality (“CHQ”) wire rod, which accounted for *** percent of all types of U.S. producers’ U.S. shipments in 2013, is produced by *** domestic producers and welding quality wire rod, which accounted for *** percent of all types of U.S. producers’ U.S. shipments in 2013, is produced by *** domestic producers. *** is the largest domestic producer of these types of wire rod. *** together accounted for almost all domestic production of tire cord or tire bead quality wire rod, which accounted for *** percent of all types of U.S. producers’ U.S. shipments in 2013.12 Other specialty carbon and alloy quality wire rod is produced by five
12 ArcelorMittal makes a wide variety of wire rod grades at its facilities, including low, medium, high carbon, tire cord, tire bead, and welding wire rod. Evraz produces low carbon mesh and industrial grade wire rod, however its product mix is weighted heavily toward high and medium carbon steels. Evraz also produces medium carbon grades of wire rod for the furniture and bedding spring rod business, as well as high carbon rod for the making of PC strand, rubber reenforcement and wire row. In addition, Evraz produces welding quality wire rod. Carbon and Certain Alloy Steel Wire Rod from China, Inv. Nos. 701‐TA‐512 and 731‐TA‐1248 (Preliminary), USITC Publication 4458 (March 2014), p. III‐8.

III‐9
producers (the largest of which is ***) and all other wire rod is produced by three producers (the largest of which is ***).13
U.S. producers were asked to describe the qualitative differences among the different types of wire rod. Three firms (***) said there were no or little differences. Other firms stated that wire rod is on a continuum of grades, qualities, chemistry variances, and end uses and that the qualitative differences between each relate to charge design and scrap cost to create a higher carbon product. One firm stated that some overlap occurs especially if higher quality materials are used in a lower quality application. For example, CHQ could be used in some industrial quality applications or welding wire could be used in industrial quality applications. One firm stated that CHQ, other special carbon and alloy, and tire cord are the highest quality.
U.S. PRODUCERS’ INVENTORIES
Table III‐8 presents U.S. producers’ end‐of‐period inventories and the ratio of these inventories to U.S. producers’ production, U.S. shipments, and total shipments during 2008‐13. U.S. producers’ inventories of wire rod fell sharply from 2008 to 2009, remained relatively stable through 2011, before increasing to a six‐year high in 2013. Overall, inventories were 15.4 percent higher in 2013 than in 2008, with *** accounting for the largest share of the increase. Inventories relative to total shipments fluctuated during 2008‐13, ranging from a low of 4.9 percent in 2011 to a high of 7.4 percent in 2013.
Table III-8 Wire rod: U.S. producers’ inventories, 2008-13
Item Calendar year
2008 2009 2010 2011 2012 2013 Quantity (short tons) U.S. producers' end-of-period inventories 231,279 195,717 196,677 193,261 235,848 266,868 Ratio (percent)
Ratio of inventories to-- U.S. production 5.7 6.9 5.8 4.9 6.1 7.3 U.S. shipments 5.7 6.9 5.9 5.0 6.2 7.4 Total shipments 5.7 6.8 5.8 4.9 6.1 7.4Source: Compiled from data submitted in response to Commission questionnaires.
13 Gerdau produces a wide variety of wire rod types ranging from low to high carbon rod, welding rod, cold‐heading quality rod and many other special types of rod as well. Carbon and Certain Alloy Steel Wire Rod from China, Inv. Nos. 701‐TA‐512 and 731‐TA‐1248 (Preliminary), USITC Publication 4458 (March 2014), p. III‐8.
III‐10
U.S. PRODUCERS’ IMPORTS AND PURCHASES
U.S. producers reported no direct imports or domestic purchases of domestically produced or imported wire rod from the subject countries during 2008‐13. *** U.S. producer (***) reported the domestic purchase of *** wire rod *** during ***. *** explained that this domestic purchase of wire rod produced by *** was for resale purposes.
Republic, as well as two other U.S. producers (Gerdau and ArcelorMittal USA), reported that they are related to foreign producers of the subject merchandise. Republic reported that its parent company, Grupo Simec, owns Grupo San Luis, a wire rod producer in Mexico. ***. Gerdau reported that it is a wholly‐owned subsidiary of wire rod producer Gerdau SA of Brazil. Gerdau SA did not provide a response to the Commission’s foreign producer questionnaire in these reviews. ArcelorMittal USA reported that it is a wholly‐owned subsidiary of ArcelorMittal SA (Luxembourg), which has subsidiary wire rod producers in numerous countries, including subject countries Brazil, Mexico, Trinidad & Tobago, and Ukraine. There were no reported imports of subject merchandise from Brazil or Ukraine during 2008‐13 and there were no reported imports of subject merchandise from Trinidad & Tobago by ArcelorMittal firms during 2008‐13.
Table III‐9 presents data on ArcelorMittal USA’s U.S. production and U.S. imports of wire rod from Mexico during 2008‐13 as reported by the following ArcelorMittal related firms: ***. These data show that the ratio of ArcelorMittal’s U.S. imports from *** to its U.S. production remained below *** percent during every annual period 2008‐13, except for 2010 at which point the ratio ***, as ArcelorMittal experienced the closure of its Georgetown facility and the idling of its Indiana Harbor facility. The ratio of ArcelorMittal’s U.S. imports from *** to its U.S. production increased from *** percent in 2008 to *** percent in 2010 and ranged between *** percent and *** percent during 2011‐13. The vast majority (i.e., ***) of ArcelorMittal’s U.S. imports from “all other sources” are from ***.
Table III-9 Wire rod: ArcelorMittal’s U.S. production, imports, and import ratios to U.S. production, 2008-13
* * * * * * *
In response to an argument concerning its regional supply policy, ArcelorMittal reported that it “employs a commercial coordination policy that ***.” It added that “***.” In response to a Commission question concerning whether or not it considers the United States to be part of an integrated North American steel market, ArcelorMittal noted that “***.”14
14 Domestic producers’ posthearing brief, exh. 1, pp. 56‐57.

III‐11
U.S. EMPLOYMENT, WAGES, AND PRODUCTIVITY
Table III‐10 shows U.S. producers’ employment‐related data during 2008‐13. Several employment‐related indicators fell steeply from 2008 to 2009 and recovered somewhat thereafter to levels below those reported in 2008. The level of production‐related workers (PRWs), total hours worked, and total wages paid fell overall by 6.3, 10.2, and 8.0 percent, respectively, from 2008 to 2013. Although seven domestic producers reported overall declines in the number of PRWs, the largest declines in the reported data were primarily attributed to the employment indicators reported by ***. The President of the Steelworkers Local 7898, representing steelworkers at the ArcelorMittal Georgetown facility, testified at the hearing that the closure of ArcelorMittal’s Georgetown mill from July 2009 until January 2011 “put 307 steelworkers out of work for an extended period of time and put a strain on the community…”15 Reported industry aggregate hourly wages, unit labor costs, and productivity fluctuated during 2008‐13, but were slightly higher in 2013 than in 2008.
Table III-10 Wire rod: Average number of production and related workers, hours worked, wages paid to such employees, hourly wages, productivity, and unit labor costs, 2008-13
Item Calendar year
2008 2009 2010 2011 2012 2013 Production related workers (PRWs) (number) 2,339 2,083 2,173 2,239 2,269 2,192Total hours worked (1,000 hours) 4,741 3,825 4,220 4,552 4,587 4,258Hours worked per PRW (hours) 2,027 1,836 1,942 2,033 2,022 1,943Wages paid ($1,000) 170,467 128,170 145,939 166,385 174,648 156,838Hourly wages (dollars per hour) $35.96 $33.51 $34.58 $36.55 $38.07 $36.83Productivity (short tons per 1,000 hours) 855.4 741.7 802.0 858.4 845.7 858.4Unit labor costs (dollars per short ton) $42.03 $45.18 $43.12 $42.58 $45.02 $42.91Source: Compiled from data submitted in response to Commission questionnaires.
15 Hearing transcript, pp. 48‐49 (Sanderson).

III‐12
FINANCIAL EXPERIENCE OF U.S. PRODUCERS
Background
This section of the report presents the wire rod financial results of ten U.S. producers. Wire rod financial results were reported primarily on the basis of U.S. generally accepted accounting principles (GAAP) and for calendar‐year periods.16 While no single U.S. producer accounts for the majority of overall wire rod sales volume, the three largest volume producers accounted for *** percent of total sales volume during 2008‐13: ***. The remaining producers ranged from *** percent of total sales volume (***) to *** percent of total sales volume (***).
The majority of the industry’s wire rod revenue reflects commercial sales (73.3 percent of total sales), followed by transfers (*** percent of total sales) and a relatively small amount classified as internal consumption (*** percent of total sales). While most U.S. producers also reported transfers, only *** reported that transfers are the majority of their wire rod revenue.17 Internal consumption was only reported by ***.18 Several U.S. producers also included tolling activity in their trade information and financial results. Revenue and other financial elements specific to wire rod tolling operations are not presented separately in the relevant tables below.19
16 The exceptions were Gerdau, reporting its financial results on the basis of International Financial Reporting Standards (IFRS) and Charter, reporting its financial results for fiscal‐year periods ending August 31.
17 ***. March 6, 2014 e‐mail with attachments (incl. revised table II‐6) from *** to USITC auditor. March 5, 2014 e‐mail with attachments (incl. revised table II‐6) from *** to USITC auditor. March 4, 2014 e‐mail with attachment from *** to USITC auditor. March 5, 2014 e‐mail with attachment from *** to USITC auditor. March 28, 2014 e‐mail with attachment from *** to USITC auditor. March 7, 2014 e‐mail with attachment from counsel on behalf of *** to USITC auditor. February 28, 2014 e‐mail with attachment from *** to USITC auditor.
18 ***. March 5, 2014 e‐mail with attachment from *** to USITC auditor. ***. March 7, 2014 e‐mail with attachment from counsel on behalf of *** to USITC auditor.
19 Tolling activity introduces a limited degree of potential double counting with respect to wire rod sales volume. Given the eliminating effect of toll‐processing fees that are included in revenue and in cost of goods sold, tolling activity in general does not appear to distort or otherwise undermine the validity of the industry’s consolidated financial results.

III‐13
Four producers, ***, reported that they purchase primary raw materials from related parties: ***.20 21 With respect to inputs other than raw material which are purchased from a related company, ***.22 23
Operations on wire rod
Table III‐11 presents income‐and‐loss data for the U.S. industry’s wire rod operations. Table III‐12 presents a variance analysis of these financial results.24 Table III‐13 presents selected company‐specific financial information.
20 *** U.S. producer questionnaires, response to question III‐7. ***. March 18, 2014 e‐mail with attachment from *** to USITC auditor.
21 ***. March 28, 2014 e‐mail with attachment from *** to USITC auditor. 22 *** U.S. producer questionnaire, response to question III‐7. 23 With regard to input purchases from related companies, the Commission’s standard practice requires
the elimination of the related company’s profit or loss from the relevant COGS reported in the financial section of the U.S. producer questionnaire. The intent of this adjustment is for the related company’s actual cost to be recognized in determining the financial results reported to the Commission. The U.S. producers referenced above generally indicated that they complied with the Commission’s requested input valuation. ***. *** U.S. producer questionnaire, response to question III‐7.
24 The Commission’s variance analysis is calculated in three parts: sales variance, COGS variance, and sales, general and administrative (SG&A) expenses variance. Each part consists of a price variance (in the case of the sales variance) or a cost variance (in the case of the COGS and SG&A expenses variances) and a volume (quantity) variance. The sales or cost variance is calculated as the change in unit price/cost times the new volume, while the volume variance is calculated as the change in volume times the old unit price/cost. Summarized at the bottom of table III‐12, the price variance is from sales, the cost/expense variance is the sum of those items from COGS and SG&A, respectively, and the net volume variance is the sum of the price, COGS, and SG&A volume variances.
Most U.S. producers indicated that product mix did not change substantially during 2008‐13 which generally enhances the utility of the Commission’s variance analysis. USITC auditor prehearing notes. ***. March 4, 2014 e‐mail with attachment from *** to USITC auditor.

III‐14
Table III-11 Wire rod: Results of operations of U.S. producers, 2008-13
Item
Fiscal year
2008 2009 2010 2011 2012 2013
Quantity (short tons)
Commercial sales 2,993,932 2,072,311 2,456,711 2,979,103 2,842,314 2,619,518
Internal consumption *** *** *** *** *** ***
Transfers to related firms *** *** *** *** *** ***
Total net sales quantity 4,126,388 2,881,432 3,384,018 3,920,918 3,836,475 3,623,777
Value ($1,000)
Commercial sales 2,621,392 1,217,068 1,694,976 2,369,626 2,175,493 1,898,192
Internal consumption *** *** *** *** *** ***
Transfers to related firms *** *** *** *** *** ***
Total net sales value 3,547,031 1,679,395 2,274,325 3,048,561 2,858,572 2,552,054
Cost of goods sold:
Raw materials 2,146,334 991,037 1,395,604 1,975,923 1,801,045 1,579,821
Direct labor 184,687 109,149 132,708 156,676 152,847 139,485
Other factory costs 785,656 552,772 555,675 611,227 668,696 639,029
Total cost of goods sold 3,116,677 1,652,958 2,083,987 2,743,826 2,622,588 2,358,335
Gross profit 430,354 26,437 190,338 304,735 235,984 193,719
SG&A expenses 83,259 69,352 91,584 86,722 87,633 86,025
Operating income or (loss) 347,095 (42,915) 98,754 218,013 148,351 107,694
Interest expense 21,662 16,828 10,972 8,532 1,552 3,424
Other expenses 11,226 12,672 11,590 10,953 9,984 8,452
Other income items 848 845 1,075 856 406 612
Net income or (loss) 315,055 (71,570) 77,267 199,384 137,221 96,430
Depreciation/amortization 53,415 52,222 46,948 46,192 47,134 48,420
Estimated cash flow from operations 368,470 (19,348) 124,215 245,576 184,355 144,850
Ratio to net sales (percent)
Raw materials 60.5 59.0 61.4 64.8 63.0 61.9
Direct labor 5.2 6.5 5.8 5.1 5.3 5.5
Other factory costs 22.1 32.9 24.4 20.0 23.4 25.0
Cost of goods sold 87.9 98.4 91.6 90.0 91.7 92.4
Gross profit1 12.1 1.6 8.4 10.0 8.3 7.6
SG&A expenses 2.3 4.1 4.0 2.8 3.1 3.4
Operating income or (loss) 9.8 (2.6) 4.3 7.2 5.2 4.2
Net income or (loss) 8.9 (4.3) 3.4 6.5 4.8 3.8
Table continued on next page.

III‐15
Table III-11-- Continued Wire rod: Results of operations of U.S. producers, 2008-13
Item
Fiscal year
2008 2009 2010 2011 2012 2013
Ratio to cost of goods sold (percent)
Raw materials 68.9 60.0 67.0 72.0 68.7 67.0
Direct labor 5.9 6.6 6.4 5.7 5.8 5.9
Other factory costs 25.2 33.4 26.7 22.3 25.5 27.1
Unit values (dollars per short ton)
Commercial sales 876 587 690 795 765 725
Internal consumption *** *** *** *** *** ***
Transfers *** *** *** *** *** ***
Total net sales 860 583 672 778 745 704
Cost of goods sold:
Raw materials 520 344 412 504 469 436
Direct labor 45 38 39 40 40 38
Other factory costs 190 192 164 156 174 176
Total cost of goods sold 755 574 616 700 684 651
Gross profit 104 9 56 78 62 53
SG&A expenses 20 24 27 22 23 24
Operating income or (loss) 84 (15) 29 56 39 30
Number of firms reporting
Operating losses 1 5 2 1 2 3
Data 10 10 10 10 10 101 The following reconciles period-to-period changes in the components of the COGS-to-sales ratio to corresponding changes in gross profit ratio. A period-to-period change that increases the COGS-to-sales ratio yields a corresponding decline in gross profit ratio, while a period-to-period change that decreases the COGS-to-sales ratio yields a corresponding increase in gross profit ratio.
Item
Fiscal year
2008-09 2009-10 2010-11 2011-12 2012-13
Ratio to net sales (percent)
Raw materials (1.5) 2.4 3.5 (1.8) (1.1)
Direct labor 1.3 (0.7) (0.7) 0.2 0.1
Other factory costs 10.8 (8.5) (4.4) 3.3 1.6
Cost of goods sold 10.6 (6.8) (1.6) 1.7 0.7
Gross profit (10.6) 6.8 1.6 (1.7) (0.7)
Source: Compiled from data submitted in response to Commission questionnaires.

III‐16
Table III-12 Wire rod: Variance analysis on the operations of U.S. producers, 2008-13
Item
Fiscal year
2008-09 2009-10 2010-11 2011-12 2012-13
Total net revenue: Value ($1,000)
Price variance (797,475) 302,006 413,397 (124,334) (148,036)
Volume variance (1,070,161) 292,924 360,839 (65,655) (158,482)
Total net sales variance (1,867,636) 594,930 774,236 (189,989) (306,518)
Cost of sales:
Raw materials:
Cost variance 507,735 (231,708) (358,896) 132,323 121,372
Volume variance 647,562 (172,859) (221,423) 42,555 99,852
Net raw material variance 1,155,297 (404,567) (580,319) 174,878 221,224
Direct labor:
Cost variance 19,817 (4,521) (2,913) 455 4,888
Volume variance 55,721 (19,038) (21,055) 3,374 8,474
Net direct labor variance 75,538 (23,559) (23,968) 3,829 13,362
Other factory costs:
Cost variance (4,153) 93,513 32,610 (70,633) (7,406)
Volume variance 237,037 (96,416) (88,162) 13,164 37,073
Net other factory cost i
232,884 (2,903) (55,552) (57,469) 29,667
Net cost of sales:
Cost variance 523,399 (142,716) (329,199) 62,145 118,854
Volume variance 940,320 (288,313) (330,640) 59,093 145,399
Total net cost of sales i
1,463,719 (431,029) (659,839) 121,238 264,253
Gross profit variance (403,917) 163,901 114,397 (68,751) (42,265)
SG&A expenses:
Expense variance (11,213) (10,135) 19,392 (2,779) (3,250)
Volume variance 25,120 (12,097) (14,530) 1,868 4,858
Total SG&A variance 13,907 (22,232) 4,862 (911) 1,608
Operating income variance (390,010) 141,669 119,259 (69,662) (40,657)
Summarized as:
Price variance (797,475) 302,006 413,397 (124,334) (148,036)
Net cost/expense variance 512,186 (152,852) (309,806) 59,367 115,604
Net volume variance (104,721) (7,485) 15,668 (4,695) (8,225)
Source: Compiled from data submitted in response to Commission questionnaires.

III‐17
Table III-13 Wire rod: Results of operations of U.S. producers, by firm, 2008-13
* * * * * * *
Sales volume
Table III‐13 shows that all U.S. producers reported lower sales volume between 2008 and 2009. In general, U.S. producers attributed this pattern to the impact of the recession on wire rod demand.25 *** reported lower sales volume between 2008 and 2009 (*** percent and *** percent, respectively), their volume declines on a percentage basis were *** compared to the other U.S. producers. ***.26 ***.27
*** reported the *** company‐specific percentage decline in sales volume between 2008 and 2009 (***). ***.28 ***.29
Sales value
In addition to the underlying base price, wire rod revenue includes surcharges related to primary inputs, as well as fuel costs associated with freight. In general, however, application of surcharges is not uniform among the U.S. producers. With regard to companies indicating that their revenue includes surcharges, ***.30 ***.31 ***.32
Other companies, primarily referencing raw material inputs, generally indicated that they do not use surcharges. ***.33 ***.34 ***.35 ***.36 ***.37 ***.38
As shown in table III‐13, the period‐to‐period directional trend of company‐specific average sales values was the same for all U.S. producers. Directionally, the trend of average sales value and
25 USITC auditor notes (prehearing). ***. March 5, 2014 e‐mail with attachment from *** to USITC auditor.
26 March 4, 2014 e‐mail with attachment from *** to USITC auditor. 27 ***. February 28, 2014 e‐mail with attachment from *** to USITC auditor. 28 March 6, 2014 e‐mail with attachments (incl. revised table II‐6) from *** to USITC auditor. 29 ***. March 4, 2014 e‐mail with attachment from *** to USITC auditor. 30 March 5, 2014 e‐mail with attachments (incl. revised table II‐6) from *** to USITC auditor. 31 March 5, 2014 e‐mail with attachment from *** to USITC auditor. 32 March 4, 2014 e‐mail with attachment from *** to USITC auditor. 33 March 6, 2014 e‐mail with attachments (incl. revised table II‐6) from *** to USITC auditor. 34 March 4, 2014 e‐mail with attachment from *** to USITC auditor. 35 March 4, 2014 e‐mail with attachment from *** to USITC auditor. 36 March 28, 2014 e‐mail with attachment from *** to USITC auditor. ***. Ibid. 37 March 7, 2014 e‐mail with attachment from counsel on behalf of *** to USITC auditor. 38 February 28, 2014 e‐mail with attachment from *** to USITC auditor.

III‐18
average raw material cost was also the same.39 While company‐specific average sales values were generally in a similar range, *** average sales values compared to the other U.S. producers.40
Cost of goods sold and gross profit
On an overall basis, the total cost of raw materials in table III‐11 reflects a composite of inputs which includes various grades of ferrous scrap, DRI, alloys, and steel billets.41 As a share of wire rod COGS, raw material costs ranged from a low of 60.0 percent in 2009 to a high of 72.0 percent in 2011.
Other factory costs, the second largest component of total wire rod COGS, was at its highest level as a share of total COGS in 2009, at 33.4 percent, and at its lowest level in 2011, at 22.3 percent.42 Notwithstanding the importance of fixed and semi‐fixed manufacturing costs (see
39 Notwithstanding the fact that average sales value and average raw material costs reflect the same directional trend, the corresponding magnitude of company‐specific changes in average sales value and average raw material costs were not necessarily the same. ***. March 4, 2014 e‐mail with attachment from *** to USITC auditor.
40 ***. March 5, 2014 e‐mail with attachments (incl. revised table II‐6) from *** to USITC auditor. ***. Ibid.
***. March 4, 2014 e‐mail with attachment from *** to USITC auditor. 41 While the directional trend of company‐specific average raw material costs was almost uniformly the
same (see table III‐13), the relatively wide range of company‐specific average raw material costs appears to reflect differences such as company‐specific product mix, as well as variations in underlying raw material.
With regard to its primary raw materials, *** referenced scrap and indicated that it accounts for *** percent of COGS. February 28, 2014 e‐mail with attachment from *** to USITC auditor. *** reported that scrap and alloys represent their primary raw material inputs. ***. March 5, 2014 e‐mail with attachments (incl. revised table II‐6) from *** to USITC auditor. March 4, 2014 e‐mail with attachment from *** to USITC auditor. March 5, 2014 e‐mail with attachment from *** to USITC auditor. *** reported that its primary raw material inputs are scrap, pig iron, and alloys. March 4, 2014 e‐mail with attachment from *** to USITC auditor. *** listed scrap, DRI, additives, and fluxes as the primary raw material inputs. March 6, 2014 e‐mail with attachments (incl. revised table II‐6) from *** to USITC auditor. ***. March 28, 2014 e‐mail with attachment from *** to USITC auditor. ***. March 7, 2014 e‐mail with attachment from counsel on behalf of *** to USITC auditor.
42 This pattern, in general, is consistent with changes in underlying wire rod production and sales volumes. Other factory costs represent a combination of fixed, variable, and mixed (semi‐fixed/semi‐variable) costs which differ by company based on factors such as manufacturing operations, product mix, and company‐specific accounting choices regarding cost assignment. All things being equal, the directional trend of other factory costs (on an average basis and as a share of total COGS), would tend to be the opposite of the directional trend of corresponding production and sales volume due to the presence of fixed manufacturing costs and changes in fixed cost absorption. ***. March 5, 2014 e‐mail with attachment from *** to USITC auditor.
In addition to fixed cost absorption, changes in the relative and absolute levels of other factory costs also reflect additional company‐specific factors; e.g., in 2008 and 2009, ***. March 18, 2014 e‐mail with attachment from *** to USITC auditor. ***. March 7, 2014 e‐mail with attachment from counsel on behalf of *** to USITC auditor. ***.

III‐19
footnote 42), other factory costs also include energy costs (e.g., electricity and natural gas) which, to a large extent, are variable in terms of cost behavior.43 As described by *** and similar to the pattern reported by other U.S. producers, ***.44
Table III‐11 shows that direct labor, the smallest component of COGS, ranged from a low of 5.7 percent of total COGS in 2011 to a high of 6.6 percent in 2009. Notwithstanding the more variable nature of direct labor, the higher share of direct labor in 2009 is generally consistent with lower production and sales volumes in that year.
As shown in table III‐11, overall sales volume declined substantially between 2008 and 2009, recovered somewhat between 2009 and 2011, and then declined between 2011 and 2013. While metal margin (the difference between average sales value and average raw material cost) as a ratio to sales was lower in the second half of the period, the ratio increased between 2011 and 2013 (see table III‐13). 45 In general and given the pattern of metal margin, the industry’s declining gross profitability between 2011 and 2013 appears to be more related to factors such as the direct and indirect impact of reduced sales volume and increasing levels of other factory costs (on a relative basis) (see note 1 to table III‐11).46
*** reported the *** company‐specific gross profit ratios and were *** companies to report operating losses throughout most of the period (see table III‐13). As described by ***.47 ***.48
***, which generated the *** company‐specific gross profit ratios for most of the period, confirmed that this pattern primarily reflects the ***.49 ***.50
43 March 6, 2014 e‐mail with attachments (incl. revised table II‐6) from *** to USITC auditor. March 5, 2014 e‐mail with attachments (incl. revised table II‐6) from *** to USITC auditor. March 4, 2014 e‐mail with attachment from *** to USITC auditor. March 5, 2014 e‐mail with attachment from *** to USITC auditor. March 7, 2014 e‐mail with attachment from counsel on behalf of *** to USITC auditor. February 28, 2014 e‐mail with attachment from *** to USITC auditor.
44 March 4, 2014 e‐mail with attachment from *** to USITC auditor. 45 As a general term (i.e., not specific to wire rod in particular), “metal margin” usually refers to the
difference between current sales value and the corresponding relevant market price for the primary metal input, in this case ferrous scrap. For purposes of this report, “metal margin” refers to the difference between average sales value and average raw material costs, as recognized for financial reporting purposes. As shown in Table III‐13, company‐specific metal margins were not uniform. In addition to variations in underlying cost classification, direct comparability of metal margin is, in all likelihood, also limited by company‐specific differences such as the timing of raw material purchases and corresponding inventory turnover (raw material, work in process, and finished goods).
46 For example and as shown in table III‐13, ***. March 4, 2014 e‐mail with attachment from *** to USITC auditor.
47 March 6, 2014 e‐mail with attachments (incl. revised table II‐6) from *** to USITC auditor. ***. 48 March 4, 2014 e‐mail with attachment from *** to USITC auditor. 49 ***. February 28, 2014 e‐mail with attachment from *** to USITC auditor. 50 March 28, 2014 e‐mail with attachment from *** to USITC auditor

III‐20
SG&A expenses and operating income or (loss)
Table III‐13 shows that larger‐volume wire rod producers reported SG&A expense ratios (SG&A expenses divided by total revenue) which were generally in a similar range. While company‐specific variations in the level of SG&A expenses generally appear to be consistent with changes in corresponding sales volume,51 several of the large‐volume producers (***) reported patterns of SG&A expenses which appear somewhat unusual. In response to questions regarding the pattern of their SG&A expenses, the following explanations were provided: ***;52 ***;53 ***.54
As shown in table III‐11, the industry’s SG&A expense ratio peaked in 2009 (4.1 percent) and then fluctuated somewhat lower but remained above the lowest level reported (2.3 percent in 2008). The absence of substantial changes in the industry’s SG&A expense ratio indicates that SG&A expenses were generally a secondary factor in terms of explaining wire rod operating results; i.e., revenue and cost factors impacting financial results at the gross level appear to be more important.
Capital expenditures and research and development expenses
Table III‐14 presents capital expenditures and research and development (R&D) expenses by firm.
Table III-14 Wire rod: Capital expenditures and research and development expenses of U.S. producers, 2008-13
* * * * * * *
***.55 ***.56 The following company‐specific capital expenditures were also noteworthy: ***;57 and ***.58
As shown in table III‐14, R&D expenses were reported by less than half the U.S. producers and were ***.59 ***.60 ***.61
51 ***. March 6, 2014 e‐mail with attachments (incl. revised table II‐6) from *** to USITC auditor. March 7, 2014 e‐mail from *** to USITC auditor.
52 March 4, 2014 e‐mail with attachment from *** to USITC auditor. 53 March 18, 2014 e‐mail with attachment from *** to USITC auditor. 54 March 12, 2014 e‐mail with attachment from counsel on behalf of *** to USITC auditor. ***. March
18, 2014 e‐mail with attachment from counsel on behalf of *** to USITC auditor. 55 March 7, 2014 e‐mail with attachment from counsel on behalf of *** to USITC auditor. 56 March 5, 2014 e‐mail with attachments (incl. revised table II‐6) from *** to USITC auditor. 57 ***. February 28, 2014 e‐mail with attachment from *** to USITC auditor. 58 March 4, 2014 e‐mail with attachment from *** to USITC auditor 59 March 4, 2014 e‐mail with attachment from *** to USITC auditor. 60 March 6, 2014 e‐mail with attachments (incl. revised table II‐6) from *** to USITC auditor. 61 March 7, 2014 e‐mail with attachment from counsel on behalf of *** to USITC auditor.

IV‐1
PART IV: U.S. IMPORTS AND THE FOREIGN INDUSTRIES
U.S. IMPORTS
Overview
In these second five‐year reviews, the Commission issued U.S. importers’ questionnaires to approximately 125 firms believed to be importers of wire rod,1 as well as to all U.S. producers of wire rod.2 Usable questionnaire responses were received from 37 firms: 5 firms representing almost all U.S. imports of wire rod from Mexico in 2013 (based on proprietary Customs information and questionnaire responses)3 and 35 firms representing 95.0 percent of U.S. imports of wire rod from nonsubject countries (based on official U.S. import statistics for nonsubject countries) during 2008‐13. There were no reported U.S. imports from Brazil,4 Indonesia, Moldova, Trinidad & Tobago, or Ukraine during 2013.5 U.S. imports of wire rod from Brazil, Moldova, and Ukraine largely ceased following the imposition of duties in 2002 and the U.S. imports of wire rod from Indonesia and Trinidad & Tobago ceased after 2005 and 2008, respectively.
In light of the data coverage by the Commission’s questionnaires, import data in this report are based on official Commerce statistics for wire rod imported from Trinidad & Tobago and nonsubject sources and on questionnaire responses for wire rod imported from Mexico. All imports of wire rod from Brazil reported in official statistics are believed to be grade 1080 tire
1 The Commission issued questionnaires to those firms identified in the responses to the Commission’s notice of institution, along with firms that, based on a review of data provided by U.S. Customs and Border Protection (“Customs”), may have accounted for more than one percent of total imports during 2008‐13 under the following HTS subheadings: 7213.91.3011, 7213.91.3015, 7213.91.3020, 7213.91.3092 (deleted on July 1, 2008), 7213.91.3093 (added on July 1, 2008), 7213.91.4500, 7213.91.6000, 7213.99.0030, 7213.99.0090, 7227.20.0000, 7227.20.0030, 7227.20.0080, 7227.90.6010, 7227.90.6020, 7227.90.6080 (deleted on July 1, 2008), and 7227.90.6085 (added on July 1, 2008).
2 None of the U.S. producers reported direct imports of wire rod. 3 Proprietary Customs information indicates that the only other sizeable importer of merchandise
from Mexico under the applicable HTS numbers for wire rod was ***. However, in response to the Commission’s importer questionnaire, *** reported that it has not imported wire rod into the United States from any country since January 1, 2008.
4 Import data reported for Brazil in official statistics have been reclassified in this report as nonsubject 1080 tire cord and tire bead.
5 One U.S. importer of wire rod from Trinidad & Tobago provided a response to the Commission’s questionnaire. (***) reported U.S. imports of *** short tons ($***) of wire rod from Trinidad & Tobago during 2008, accounting for *** percent of total U.S. imports of wire rod from Trinidad & Tobago in 2008 based on Census data. *** is believed to have accounted for virtually all U.S. imports of wire rod from Trinidad & Tobago during 2008. *** did not provide a response to the Commission’s importer questionnaire.

IV‐2
cord and tire bead wire rod and have therefore been classified as nonsubject imports in this report. No other subject country reported U.S. imports of the excluded grade 1080 tire cord or tire bead based on questionnaire data. Also, U.S. imports of wire rod with a diameter of 4.75 mm to 5.00 mm shipped to the United States by Deacero in Mexico have been found by Commerce on remand to be outside the scope of the order and have been removed from official U.S. imports from Mexico (as well as the calculation of apparent consumption) presented in this report.6 Certain data and other information concerning Deacero’s production and U.S. imports and U.S. purchases of Deacero’s smaller diameter wire rod are presented separately in appendix F.
One importer (***) reported entering or withdrawing wire rod from a foreign trade zone. The firm, which accounted for *** percent of responding U.S. importers’ U.S. imports from nonsubject sources during 2008‐13, provided data concerning its nonsubject U.S. imports of wire rod from ***. Another importer (***) reported entering or withdrawing wire rod from a bonded warehouse. The importer, which accounted for *** percent of responding U.S. importers’ U.S. imports from nonsubject sources during 2008‐13, provided data concerning its nonsubject U.S. imports of wire rod from ***. *** reported imports of wire rod under the temporary importation under bond (“TIB”) program. ***.
Imports from subject and nonsubject countries
Table IV‐1 presents information on subject U.S. imports of wire rod from Brazil, Indonesia, Mexico, Moldova, Trinidad & Tobago, Ukraine, and imports from all other sources during 2008‐13. There were no reported U.S. imports of subject wire rod from Brazil, Indonesia, Moldova, and Ukraine during 2008‐13 and U.S. imports of wire rod Trinidad & Tobago ceased after 2008. During 2008, U.S. imports of wire rod from Trinidad & Tobago amounted to 21,794 short tons ($14.3 million) and accounted for *** percent of total U.S. imports of wire rod. The quantity of imports of wire rod from Mexico, which accounted for *** percent of total U.S. imports of wire rod in 2008, fluctuated during 2008‐13 but was higher in 2013 than in 2008. During 2013, U.S. imports of subject wire rod from Mexico amounted to 10,333 short tons ($6.1 million) and accounted for 0.6 percent of total wire rod imports. Imports of wire rod from nonsubject sources decreased by 49.4 percent from 2008 to 2009 but fluctuated thereafter, reaching a level in 2013 that was 0.8 percent higher than that reported in 2008.
Table IV‐1 also presents data on the ratio of U.S. imports to U.S. production. Imports of wire rod from subject sources were less than *** percent of U.S. production during 2008‐13, while imports of wire rod from nonsubject sources ranged from 29.9 to 46.2 percent of U.S. production. Total imports of wire rod were equivalent to 46.5 percent of U.S. production in 2013, or *** percentage points higher than reported in 2008.
6 The data presented for U.S. imports from nonsubject sources, however, are overstated by imports of wire rod of less than 5mm in diameter imported from Canada. ***.

IV‐3
Table IV-1 Wire rod: U.S. imports, by source, 2008-13
Item Calendar year
2008 2009 2010 2011 2012 2013 Quantity (short tons)
U.S. imports from-- Brazil1 0 0 0 0 0 0
Indonesia 0 0 0 0 0 0
Mexico2 *** *** *** *** *** 10,333Moldova 0 0 0 0 0 0Trinidad & Tobago 21,794 0 0 0 0 0Ukraine 0 0 0 0 0 0 Subtotal, subject *** *** *** *** *** 10,3331080 tire cord/bead from subject sources1 139,459 71,759 129,184 116,513 102,517 96,639All other sources3 1,536,768 777,083 1,284,771 1,059,512 1,391,895 1,593,718 Subtotal, nonsubject 1,676,227 848,842 1,413,955 1,176,024 1,494,413 1,690,357
Total U.S. imports *** *** *** *** *** 1,700,690 Value ($1,000)
U.S. imports from-- Brazil1 0 0 0 0 0 0
Indonesia 0 0 0 0 0 0
Mexico2 *** *** *** *** *** 6,128Moldova 0 0 0 0 0 0Trinidad & Tobago 14,298 0 0 0 0 0Ukraine 0 0 0 0 0 0 Subtotal, subject *** *** *** *** *** 6,1281080 tire cord/bead from subject sources1 126,654 50,808 91,621 103,073 84,521 64,506All other sources3 1,360,431 550,614 988,457 992,791 1,159,903 1,156,290 Subtotal, nonsubject 1,487,085 601,423 1,080,078 1,095,863 1,244,424 1,220,797
Total U.S. imports *** *** *** *** *** 1,226,925 Unit value (dollars per short ton)
U.S. imports from-- Brazil1 (4) (4) (4) (4) (4) (4)
Indonesia (4) (4) (4) (4) (4) (4)
Mexico2 *** *** *** *** *** 593
Moldova (4) (4) (4) (4) (4) (4)
Trinidad & Tobago 656 (4) (4) (4) (4) (4)
Ukraine (4) (4) (4) (4) (4) (4) Subtotal, subject *** *** *** *** *** 5931080 tire cord/bead from subject sources1 908 708 709 885 824 667All other sources3 885 709 769 937 833 726 Subtotal, nonsubject 887 709 764 932 833 722
Total U.S. imports *** *** *** *** *** 721Table continued on following page.
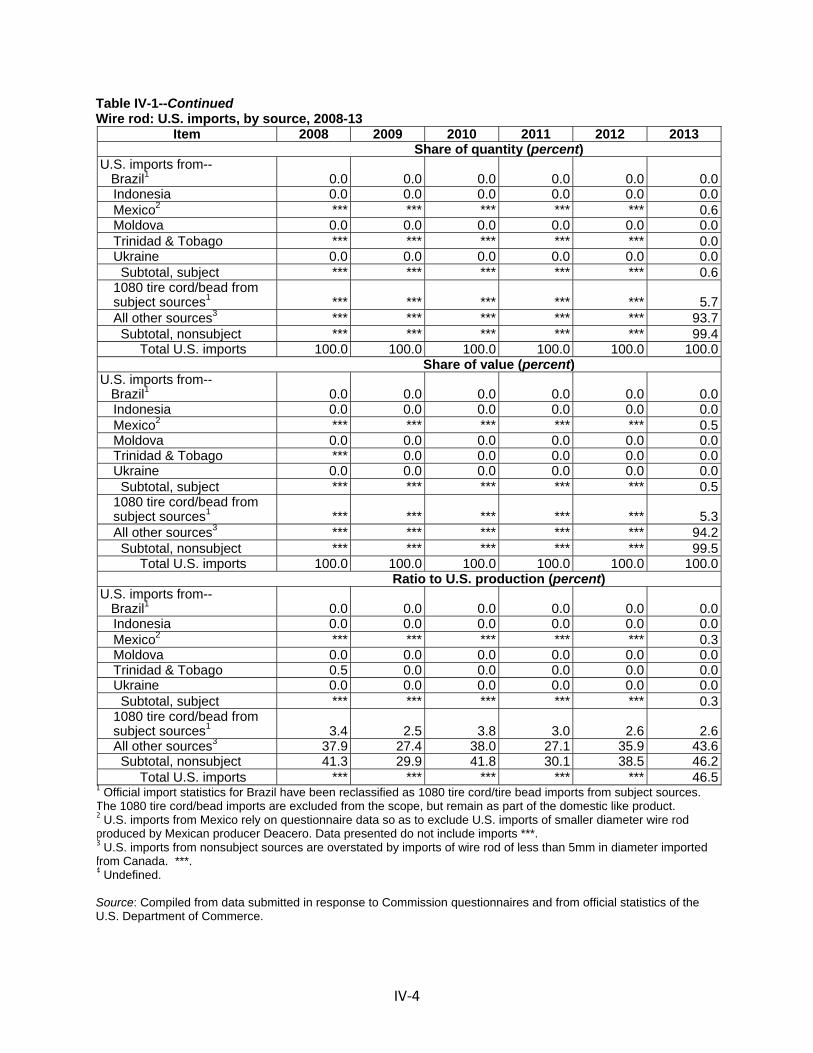
IV‐4
Table IV-1--Continued Wire rod: U.S. imports, by source, 2008-13
Item 2008 2009 2010 2011 2012 2013 Share of quantity (percent) U.S. imports from-- Brazil1 0.0 0.0 0.0 0.0 0.0 0.0
Indonesia 0.0 0.0 0.0 0.0 0.0 0.0Mexico2 *** *** *** *** *** 0.6Moldova 0.0 0.0 0.0 0.0 0.0 0.0Trinidad & Tobago *** *** *** *** *** 0.0Ukraine 0.0 0.0 0.0 0.0 0.0 0.0 Subtotal, subject *** *** *** *** *** 0.61080 tire cord/bead from subject sources1 *** *** *** *** *** 5.7All other sources3 *** *** *** *** *** 93.7 Subtotal, nonsubject *** *** *** *** *** 99.4
Total U.S. imports 100.0 100.0 100.0 100.0 100.0 100.0 Share of value (percent) U.S. imports from-- Brazil1 0.0 0.0 0.0 0.0 0.0 0.0
Indonesia 0.0 0.0 0.0 0.0 0.0 0.0Mexico2 *** *** *** *** *** 0.5Moldova 0.0 0.0 0.0 0.0 0.0 0.0Trinidad & Tobago *** 0.0 0.0 0.0 0.0 0.0Ukraine 0.0 0.0 0.0 0.0 0.0 0.0 Subtotal, subject *** *** *** *** *** 0.51080 tire cord/bead from subject sources1 *** *** *** *** *** 5.3All other sources3 *** *** *** *** *** 94.2 Subtotal, nonsubject *** *** *** *** *** 99.5
Total U.S. imports 100.0 100.0 100.0 100.0 100.0 100.0 Ratio to U.S. production (percent) U.S. imports from-- Brazil1 0.0 0.0 0.0 0.0 0.0 0.0
Indonesia 0.0 0.0 0.0 0.0 0.0 0.0Mexico2 *** *** *** *** *** 0.3Moldova 0.0 0.0 0.0 0.0 0.0 0.0Trinidad & Tobago 0.5 0.0 0.0 0.0 0.0 0.0Ukraine 0.0 0.0 0.0 0.0 0.0 0.0 Subtotal, subject *** *** *** *** *** 0.31080 tire cord/bead from subject sources1 3.4 2.5 3.8 3.0 2.6 2.6All other sources3 37.9 27.4 38.0 27.1 35.9 43.6 Subtotal, nonsubject 41.3 29.9 41.8 30.1 38.5 46.2
Total U.S. imports *** *** *** *** *** 46.51 Official import statistics for Brazil have been reclassified as 1080 tire cord/tire bead imports from subject sources. The 1080 tire cord/bead imports are excluded from the scope, but remain as part of the domestic like product. 2 U.S. imports from Mexico rely on questionnaire data so as to exclude U.S. imports of smaller diameter wire rod produced by Mexican producer Deacero. Data presented do not include imports ***. 3 U.S. imports from nonsubject sources are overstated by imports of wire rod of less than 5mm in diameter imported from Canada. ***. 4 Undefined. Source: Compiled from data submitted in response to Commission questionnaires and from official statistics of the U.S. Department of Commerce.

IV‐5
Table IV‐2 presents data for U.S. imports of wire rod from the top ten nonsubject sources. Imports of wire rod from all nonsubject sources combined fell from 2008 to 2009 but fluctuated upward from 2009 to 2013. The leading nonsubject source of wire rod imports during 2013 was China; such imports currently are subject to ongoing antidumping and countervailing duty investigations.7 U.S. imports from China, which accounted for 36.4 percent of total imports in 2013, fluctuated during 2008‐13. U.S. imports from China were 49.1 percent higher in 2013 than in 2008. Other leading sources of wire rod imports from nonsubject countries include Canada and Japan, which accounted for 28.3 and 15.1 percent of total imports in 2013, respectively.
7 Carbon and Certain Alloy Steel Wire Rod from China, Inv. Nos. 701‐TA‐512 and 731‐TA‐1248 (Preliminary), USITC Publication 4458 (March 2014). The Commission made affirmative preliminary determinations on March 20, 2014 (79 FR 16373, March 25, 2014).

IV‐6
Table IV-2 Wire rod: Imports from nonsubject countries and nonsubject wire rod, by source, 2008-13
Item
Calendar year
2008 2009 2010 2011 2012 2013
Quantity (short tons) U.S. imports from-- China 415,125 8,416 16,931 357 242,047 618,818
Canada1 535,752 342,094 542,513 501,045 491,132 480,813
Japan 232,038 125,007 216,463 236,084 262,275 257,503
Brazil2 139,459 71,759 129,184 116,513 102,517 96,639
Germany 124,567 44,529 60,308 91,892 72,565 73,016
United Kingdom 13,314 26,960 56,422 46,323 70,107 56,395
Korea 18,020 13,461 16,687 9,868 25,575 37,567
Turkey 148,332 97,057 189,372 109,574 165,819 33,182
Spain 6,129 18,594 36,623 19,574 28,743 32,725
South Africa 0 0 28,188 11,454 11,316 1,629
All other sources 43,491 100,965 121,263 33,342 22,316 2,070
Nonsubject imports 1,676,227 848,842 1,413,955 1,176,024 1,494,413 1,690,357
Share of total imports (percent)3 U.S. imports from-- China *** *** *** (4) *** 36.4
Canada *** *** *** *** *** 28.3
Japan *** *** *** *** *** 15.1
Brazil2 *** *** *** *** *** 5.7
Germany *** *** *** *** *** 4.3
United Kingdom *** *** *** *** *** 3.3
Korea *** *** *** *** *** 2.2
Turkey *** *** *** *** *** 2.0
Spain *** *** *** *** *** 1.9
South Africa *** *** *** *** *** 0.1
All other sources *** *** *** *** *** 0.1
Nonsubject imports *** *** *** *** *** 99.41 U.S. imports from nonsubject sources are overstated by imports of wire rod of less than 5mm in diameter imported from Canada. ***. 2 Consistent with the treatment in table IV-1, all U.S. imports from Brazil have been classified as nonsubject 1080 tire cord/tire bead quality merchandise. 3 Total U.S. imports are presented in table IV-1. 4 ***. Source: Compiled from data submitted in response to Commission questionnaires and from official statistics of the U.S. Department of Commerce.

IV‐7
U.S. SHIPMENTS OF IMPORTS, BY APPLICATION
Table IV‐3 presents responding U.S. importers’ U.S. shipments of imports, by type and source, in 2013. *** firms reported subject U.S. imports of wire rod from Mexico during 2013, *** of which were high/medium‐high or low/medium‐low carbon industrial/standard quality wire rod. Thirty‐one U.S. importers of wire rod from nonsubject sources reported data concerning their U.S. shipments, by type, during 2013. Slightly more than one‐half of these U.S. shipments were high/medium‐high or low/medium‐low carbon industrial/standard quality wire rod and about one‐quarter were CHQ wire rod. U.S. importers also reported smaller amounts of welding, tire cord/tire bead, and other specialty carbon and alloy quality wire rod from nonsubject sources during 2013.
Table IV-3 Wire rod: U.S. importers’ U.S. shipments, by type, 2013
Item Quantity
(short tons) Share
(percent) Number of
reporting firms Mexico Low/medium-low carbon industrial/standard quality *** *** ***High/medium-high carbon industrial/standard quality *** *** ***Tire cord or tire bead quality *** *** ***Welding quality *** *** ***Cold heading quality (“CHQ”) *** *** ***Other specialty carbon and alloy quality *** *** ***All other wire rod *** *** *** Total, U.S. shipments *** *** *** Nonsubject Low/medium-low carbon industrial/standard quality 457,004 34.2 15High/medium-high carbon industrial/standard quality 250,825 18.8 11Tire cord or tire bead quality 69,811 5.2 8Welding quality *** *** ***Cold heading quality (“CHQ”) 340,682 25.5 8Other specialty carbon and alloy quality *** *** ***All other wire rod *** *** *** Total, U.S. shipments 1,334,336 100.0 31Source: Compiled from data submitted in response to Commission questionnaires.

IV‐8
U.S. IMPORTERS’ IMPORTS SUBSEQUENT TO DECEMBER 31, 2013
The Commission requested importers to indicate whether they had imported or arranged for the importation of wire rod for delivery after December 31, 2013. Twenty‐six importers reported that they imported or arranged for imports of wire rod in 2014 and eight indicated they had no such arrangements. Table IV‐4 presents data reported by U.S. importers concerning their arranged imports of wire rod.
Table IV-4 Wire rod: U.S. importers' arranged imports, 2014
Item 2014
Jan-Mar Apr-June July-Sept Oct-Dec Quantity (short tons) U.S. importers' imports arranged from-- Brazil 0 0 0 0 Indonesia 0 0 0 0 Mexico *** *** 0 0 Moldova 0 0 0 0 Trinidad & Tobago 0 0 0 0 Ukraine 0 0 0 0 All other sources1 278,358 238,743 25,307 25,376 Total, all sources *** *** 25,307 25,376
1 Other sources reported are: ***. Source: Compiled from data submitted in response to Commission questionnaires.

IV‐9
U.S. IMPORTERS’ INVENTORIES
Table IV‐5 presents data for inventories of U.S. imports of wire rod in the United States. As the data illustrate, inventories of subject imports were present in the United States in minor quantities only during 2008 and 2011. *** accounted for all of the inventories of subject imports from Trinidad & Tobago held in the United States during *** and *** accounted for all of the inventories of subject imports from Mexico held in the United States during ***. These inventories accounted for less than *** percent of U.S. shipments of such imports during 2008‐13 as reported by responding U.S. importers. The inventory levels of nonsubject imports were higher than subject imports, and were equivalent to between 4.6 and 8.8 percent of U.S. shipments of such imports during 2008‐13. Nineteen importers of wire rod from nonsubject sources reported holding inventories. During 2013, the leading nonsubject importers holding inventories of wire rod in the United States were ***.
Table IV-5 Wire rod: U.S. importers’ end-of-period inventories of imports, by source, 2008-13
Item Calendar year
2008 2009 2010 2011 2012 2013 Imports from Mexico: Inventories (short tons) *** *** *** *** *** *** Ratio to U.S. imports (percent) *** *** *** *** *** *** Ratio to U.S. shipments of imports (percent) *** *** *** *** *** ***Imports from Trinidad & Tobago: Inventories (short tons) *** *** *** *** *** *** Ratio to U.S. imports (percent) *** *** *** *** *** *** Ratio to U.S. shipments of imports (percent) *** *** *** *** *** ***Imports from nonsubject sources: Inventories (short tons) 106,455 61,033 72,308 61,769 90,584 105,991 Ratio to U.S. imports (percent) 8.3 9.4 6.7 6.9 4.5 7.8 Ratio to U.S. shipments of imports (percent) 8.5 8.8 6.8 6.8 4.6 7.9Source: Compiled from data submitted in response to Commission questionnaires.
CUMULATION CONSIDERATIONS
In assessing whether imports should be cumulated, the Commission determines whether U.S. imports from the subject countries compete with each other and with the domestic like product and has generally considered four factors: (1) fungibility, (2) presence of sales or offers to sell in the same geographical markets, (3) common or similar channels of distribution, and (4) simultaneous presence in the market. Additional information concerning fungibility, geographical markets, and simultaneous presence in the market is presented below.
Fungibility
Different countries sell different ranges of wire rod grades in the United States. U.S. producers’ and U.S. importers’ U.S. shipments, by type, for 2013 were presented earlier in this

IV‐10
report at tables III‐7 and IV‐3. The first two categories, low and medium‐low carbon industrial and standard quality wire rod, and high and medium‐high carbon industrial and standard quality wire rod (other than tire cord and tire bead) are typically classified as “standard,” “commodity,” or “industrial” grades. The next four categories, tire cord and tire bead wire rod, welding quality wire rod, CHQ wire rod, and other specialty carbon and alloy quality wire rod, are considered “specialty quality” or “specialty” grades. The remaining “all other” category includes any other types of wire rod.
During 2013, 77.0 percent of U.S. producers’ total U.S. shipments were of the standard grades. The remaining 23.0 percent of total U.S. shipments were comprised of specialty grades, which were dominated by CHQ wire rod, with lesser amounts of tire cord/tire bead, welding, and other specialty carbon and alloy quality wire rod. *** firms reported subject U.S. imports of wire rod from Mexico during 2013, *** of which were high/medium‐high or low/medium‐low carbon industrial/standard quality wire rod.
Presence in the market
As previously indicated, there were no U.S. imports of subject wire rod from Brazil, Indonesia, Moldova, or Ukraine during 2008‐13. According to official import statistics for calendar year 2008, subject wire rod was imported into the United States from Trinidad & Tobago during four months of the year and subject wire rod was imported into the United States from Mexico during nine months of that year. Subject U.S. imports from Mexico entered the U.S. market during at least nine months during 2009‐13 (i.e., nine months of 2009, eleven months of 2010, ten months of 2011, and 12 months of 2012 and 2013).8
Geographical markets9
As noted previously, wire rod produced in the United States is shipped nationwide. During 2008, imports from Trinidad & Tobago entered the United States through New Orleans, Louisiana; Philadelphia, Pennsylvania; and San Juan, Puerto Rico. During 2008‐13, imports from Mexico entered the United States through Laredo and El Paso, Texas; Los Angeles, California; Nogales, Arizona; Seattle, Washington; New Orleans, Louisiana; and Mobile, Alabama. The vast majority of imports from Mexico entered through Laredo, Texas.
8 The analysis of the monthly presence of Mexican wire rod in the U.S. market excludes *** nonsubject smaller diameter wire rod. ***.
9 Additional information on geographic markets may be found in Part II of this report.

IV‐11
SUBJECT COUNTRY PRODUCERS
Table IV‐6 presents 2013 capacity, production, and export data, for the subject countries, based on data from questionnaires, GTIS/GTA export data, and ***.
Table IV-6 Wire rod: Comparison of capacity, production, net capacity changes, exports, and net exports, in subject countries, 2013
Item Capacity Production Net capacity change (2008-13)
Published Reported Published Reported Published Reported Quantity (1,000 short tons)Brazil *** *** *** *** *** ***Indonesia *** *** *** *** *** ***Mexico *** 2,758 *** 2,345 *** 341Moldova *** ***1 ***1 ***1 *** ***1
Trinidad & Tobago *** *** ***2 *** *** ***Ukraine *** *** *** *** *** *** Total *** *** *** *** *** ***
Item Exports Net exports
Published Reported Published Quantity (1,000 short tons)Brazil 293 *** (56)Indonesia 563 *** (456)3
Mexico 361 380 319Moldova 1024 (1) 904
Trinidad & Tobago 1214 *** 1194
Ukraine 1,454 *** 1,4201 The “reported” capacity data presented for Moldova in this table are data published by *** because Moldova Steel Works, the sole producer of wire rod in Moldova, did not provide a response to the Commission’s questionnaire in these reviews. The “published” and “reported” production data presented are an estimate provided by the domestic interested parties in their response to the notice of institution. Global Trade Information Systems Inc., Global Trade Atlas (GTIS/GTA), does not publish external trade data for Moldova. 2 The “published” production data presented for Trinidad & Tobago are those reported by the Trinidadian producer in response to the Commission’s questionnaire because country-specific production data for Trinidad & Tobago are not prepared and published by ***. GTIS/GTA does not publish external trade data for Trinidad & Tobago. 3 Export and net export data presented for Indonesia (published) are for 2012, the most recent available year. 4 Data for Moldova’s and Trinidad & Tobago’s imports and exports were constructed from the reported exports and imports, respectively, of their trading partners whose data were reported to GTIS/GTA. Note.—GTIS/GTA export and net export data presented may include grade 1080 tire cord and tire bead wire rod. Note.—The data presented above are compiled from common sources to maintain data consistency. However, these data do not include capacity estimates for the operations of Master Steel of Indonesia or for Simec and Talleres y Aceros of Mexico. Moreover, published data do include capacity for certain operations for which the production of wire rod is uncertain or disputed (see below).
Source: “Published” data from *** and GTIS/GTA (HS 7213.91 (Bars And Rods, Hot-Rolled, In Irregularly Wound Coils, Of Iron Or Nonalloy Steel, Of Circular Cross-Section Measuring Less Than 14 Mm In Diameter), 7213.99 (721399, Bars And Rods, Hot-Rolled, In Irregularly Wound Coils, Of Iron Or Nonalloy Steel, nesoi), 7227.20 (Bars And Rods Of Silico-Manganese Steel, Hot-Rolled, In Irregularly Wound Coils), and 7227.90 (Bars And Rods Of Alloy Steel (Other Than Stainless), Hot-Rolled, In Irregularly Wound Coils); “Reported” data from Commission questionnaire responses.

IV‐12
The Commission asked U.S. importers and producers of wire rod in the subject countries to identify tariff or nontariff barriers to trade (for example, antidumping or countervailing duty findings or remedies, tariffs, quotas, or regulatory barriers) concerning their exports of wire rod to countries other than the United States. The Commission also asked the subject foreign producers to identify ongoing investigations in countries other than the United States that could result in tariff or non‐tariff barriers to trade for their exports of wire rod. Responding firms provided the following information concerning barriers to trade:
Colombia is currently conducting a global safeguard investigation on wire rod, as well as rebar and wire round. Although a final determination has not been issued, Colombia imposed a provisional safeguard tariff of 21.29 percent on imports of wire rod in 2013.
Malaysia imposed an antidumping duty order against imports of wire rod from Indonesia in 2013. According to Malaysia’s Ministry of International Trade and Industry, the antidumping duty rates were nil for P.T. Ispat Indo and 25.20 percent for all other producers and exporters.
Mexico imposed an antidumping duty order against wire rod imports from Ukraine.
There are ongoing antidumping investigations in Russia, Belarus, and Kazakhstan concerning wire rod produced in Ukraine.
Australia initiated an investigation into alleged dumping of rod in coils from Indonesia, Taiwan, and Turkey, according to anti‐dumping notice 2014/27, published on April 10, 2014.

IV‐13
THE INDUSTRY IN BRAZIL
Overview
During the original investigations, the Commission identified five producers of wire rod in Brazil. Three firms, accounting for *** percent of Brazilian production of wire rod, provided data in response to the Commission's questionnaire in the original investigations: Barra Mansa, Belgo‐Mineira (“Belgo”), and Gerdau. Barra Mansa estimated that it accounted for *** percent of Brazilian production in 2001, Belgo estimated that it accounted for *** percent, and Gerdau estimated that it accounted for *** percent. The three responding Brazilian firms collectively accounted for all exports of the subject merchandise from Brazil to the United States.10
Responses to the Commission's foreign producer questionnaire in the Commission’s first five‐year reviews were received from ArcelorMittal Brasil (successor to Belgo) and Gerdau (Aҫominas and Aҫos Longos), while Barra Mansa, part of Votorantim Metais’ Steel Business Unit, did not respond. ArcelorMittal Brasil estimated that it accounted for *** percent of Brazilian production in 2007, and Gerdau estimated that it accounted for *** percent of production of wire rod in Brazil during that year, totaling *** percent coverage of the wire rod industry in Brazil.11
The following five firms were identified by parties as currently operating producers of wire rod in Brazil in these current second five‐year reviews: ArcelorMittal Brasil, Votorantim Metals/Barra Mansa, Companhia Siderúrgica Nacional (“CSN”), Gerdau Aҫos Brasil, and Villares Metals.12 Gerdau Aҫos Brasil and ArcelorMittal Brasil together are estimated to account for *** percent of total wire rod capacity in Brazil. Gerdau Aҫos Brasil is believed to be the largest wire rod producer in Brasil, accounting for *** percent of total wire rod rolling capacity during 2013 according to data published by ***. ArcelorMittal Brasil, the second largest wire rod producer in Brazil, was the only wire rod producer in Brazil that responded to the Commission's foreign
10 The following 2001 data were provided by the three responding Brazilian firms in the original investigations: capacity (*** short tons); production (*** short tons); capacity utilization (*** percent); exports/shipments (*** percent); and inventories/shipments (*** percent). Staff Report, May 15, 2008 (INV‐FF‐058), table IV‐14.
11 The following 2007 data were provided by the two responding Brazilian firms in the first five‐year reviews: capacity (*** short tons); production (*** short tons); capacity utilization (*** percent); exports/shipments (*** percent); and inventories/shipments (*** percent). Staff Report, May 15, 2008 (INV‐FF‐058), table IV‐14.
12 *** reports that CSN does not currently have the capacity to produce wire rod in Brazil but is expected to have *** short tons of capacity in 2014. The following additional firm in Brazil was identified by *** as having wire rod rolling capacity during 2013: *** (approximately *** short tons of capacity). *** estimated that this firm accounted for approximately *** percent of total wire rod rolling capacity in Brazil during 2013.

IV‐14
producer questionnaire in these second five‐year reviews.13 There were no reported exports of the subject merchandise to the United States during 2008‐13.14 According to ***, production in Brazil during 2013 was *** short tons. Reported production by ArcelorMittal Brasil was *** short tons, yielding a theoretical coverage of *** percent of Brazilian production during 2013 by the responding firm. *** firm‐by‐firm capacity data indicate that ArcelorMittal Brasil accounted for *** percent of total wire rod rolling capacity in Brazil during 2013. Total wire rod rolling capacity and production data reported by *** include grade 1080 tire cord and tire bead wire rod, which are believed to have accounted for all exports of wire rod to the United States during 2008‐13.15
Table IV‐7 presents data published by *** on overall Brazilian capacity, production, and consumption of wire rod. Also presented in the tabulation are calculated net exports/imports (i.e., production minus consumption).16
Table IV-7
Wire rod: Overall Brazilian capacity, production, consumption, and calculated net exports/imports
* * * * * * *
The *** data show that although capacity increased from 2008 to 2009, it remained constant thereafter. According to ***, there was an increase in the wire rod rolling capacity in Brazil in the amount of *** short tons during 2008‐13 and projections indicate that the capacity to produce wire rod in Brazil are expected to climb in 2014 and 2015. Three new mills were forecasted to come online in Brazil during 2014‐15. The three mills are GV do Brasil in Pindamonhangaba (2014), CSN in Volta Redonda (2014), and Siderurgica Latino‐Americana S/A (Silat) in Caucaia (2015), with an estimated combined capacity of approximately *** short tons in 2014 and *** short tons in 2015. In addition, the Brazilian group Vetorial is the corporate entity to which the Paraguayan government reportedly plans to lease the Aceros del Paraguay
13 Numerous attempts were made by Commission staff to contact Gerdau Aҫos Brasil directly and through its U.S. affiliate, domestic producer Gerdau Ameristeel, in order to secure a questionnaire response. However, the firm did not provide a response to the Commission’s foreign producer questionnaire.
14 As previously noted in this report, U.S. imports of subject wire rod from Brazil largely ceased following the imposition of duties in 2002. Table IV‐1 indicates that there are believed to have been no U.S. imports of subject wire rod during 2008‐13.
15 According to Customs data, more than *** percent of imports reported from Brazil was imported from ***. No antidumping duties were levied against those entries and ***. Therefore, official import statistics are believed to be 1080 tire cord/bead or other nonsubject wire rod and have been reclassified as such for purposes of this report.
16 This calculation may differ from GTA data on exports and imports, primarily due to rounding.

IV‐15
(Acepar) S.A. mill,17 with production of wire rod and concrete reinforcing bar intended for both the Brazilian and Paraguayan markets.18
According to ***, production and consumption of wire rod in Brazil fluctuated upward from 2009 to 2013 and are expected to increase further in 2014 and 2015. Capacity reported by *** for 2013 for all Brazilian producers was *** short tons, and production was *** short tons, or *** percent of published capacity. Brazilian production of wire rod exceeded consumption in 2009‐11, while consumption exceeded production in 2012‐13. *** projections for production and consumption in Brazil indicate that it will once again become a net exporter of wire rod during 2014‐15.
Operations on wire rod
Data provided by ArcelorMittal Brasil concerning its wire rod operations in Brazil during calendar years 2008‐13 are presented in table IV‐8.
Table IV-8 Wire rod: Brazilian producer ArcelorMittal Brasil’s capacity, production, shipments, and inventories, 2008-13
* * * * * * *
ArcelorMittal Brasil’s capacity and production
As previously noted, *** data indicate that ArcelorMittal Brasil accounted for *** percent of total wire rod rolling capacity in Brazil during 2013. ArcelorMittal Brasil’s capacity to produce wire rod in Brazil, which was based on operating *** hours per week and *** weeks per year, remained constant at *** short tons during 2008‐13. The firm’s production fluctuated during 2008‐13, but was *** percent lower at *** short tons in 2013 than reported in 2008. Capacity utilization was *** percent during 2013 and ranged between *** and *** percent during 2008‐13.
17 Acepar’s integrated mill, located in Villa Hayes, Paraguay, produces wire rod with diameters ranging from 5.5 mm to 12.0 mm. See: “Acepar, “Productos, Alambrones para trefileria” (“Products, Wire rods for wire drawing”), http://www.acepar.com.py/productos.html (in Spanish).
18 The Paraguayan government took over the Acepar mill, which was previously privatized in 1997, as the operators were unable to meet the privatization obligations to increase output of wire rod and concrete reinforcing bar. Acepar’s capacity utilization rate declined in each successive year since 2006, to only *** percent of its *** metric tons (*** short tons) of annual production capacity by 2013. ***.

IV‐16
In addition to the production of wire rod, ArcelorMittal Brasil reported the production of *** using shared equipment and machinery in its facilities in Brazil. Table IV‐9 presents ArcelorMittal Brasil’s overall capacity and production of wire rod and other products produced on the same production equipment used to produce wire rod.
Table IV-9 Wire rod: Brazilian producer ArcelorMittal Brasil’s overall capacity, production, and capacity utilization, 2008-13
* * * * * * *
ArcelorMittal Brasil estimated that wire rod accounted for *** percent of its 2013 total sales. The overall production data presented indicate that wire rod accounted for between *** and *** percent of the firm’s overall production on the same machinery and equipment as wire rod during 2008‐13. *** was reported by the firm to be the constraint that set the limit on its production capacity and *** was the constraint that set the limit on its ability to shift production capacity between products. ArcelorMittal Brasil reported ***. It explained ***. It estimated ***. The Brazilian producer reported that ***.
Shipments of wire rod produced in Brazil
ArcelorMittal Brasil’s total shipments of wire rod fell overall by *** percent from 2008 to 2013. The firm’s internal consumption and home market together accounted for the majority of the firm’s total shipments of wire rod, and an increasing share during 2008‐13. During 2013, internal consumption and home market shipments accounted for *** percent of the firm’s total shipments of wire rod.
ArcelorMittal Brasil’s export shipments of wire rod decreased absolutely overall from *** short tons in 2008 to *** short tons in 2013. The firm reported that there were no exports of subject wire rod to the United States during 2008‐13. ArcelorMittal Brasil reported that its principal *** markets include ***, its principal *** markets include ***, and that its *** export markets include ***.
Detailed information on the export destinations for Brazilian wire rod as published by the Global Trade Information Systems Inc., Global Trade Atlas (GTIS/GTA), is presented in table IV‐10. These data include grade 1080 tire cord and tire bead, which is not subject to these reviews, and are therefore overstated.

IV‐17
Table IV-10 Wire rod: Brazil’s exports, by destination, 2008-13
Destination
Calendar year
2008 2009 2010 2011 2012 2013
Quantity (short tons)
United States 144,438 79,433 125,993 114,440 102,006 105,979
Argentina 19,978 29,766 25,225 23,505 10,865 24,729
Korea 28,703 8,756 35,700 45,308 18,345 22,421
Chile 20,890 12,510 17,809 2,603 3,831 20,835
Malaysia - 2,163 13,098 9,793 13,265 14,247
Canada 18,755 12,426 18,346 34,278 28,372 12,732
Colombia 83,618 75,003 50,125 45,989 29,350 10,542
Peru 70,159 56,841 26,666 14,017 6,087 9,845
Portugal 10,623 15,344 8,009 4,453 2,348 8,975
Nigeria - 36,596 - 440 5,510 7,647
All other 253,626 375,587 185,398 186,218 53,480 54,554
World 650,790 704,426 506,372 481,044 273,459 292,505
Value ($1,000)
United States 120,679 48,512 82,639 94,688 76,714 65,759
Argentina 14,871 13,082 14,771 15,392 7,456 15,389
Korea 19,286 4,038 25,250 40,144 14,880 15,017
Chile 13,774 5,157 9,991 1,642 2,259 11,338
Malaysia - 1,127 7,800 7,989 10,797 10,586
Canada 12,653 6,421 9,575 23,678 20,422 8,059
Colombia 60,343 32,783 27,232 27,578 17,522 5,769
Peru 53,147 25,049 14,363 9,130 3,695 5,446
Portugal 8,553 7,415 4,993 3,107 1,470 4,055
Nigeria - 14,781 - 236 2,949 4,057
All other 198,767 163,159 107,180 124,643 35,730 33,078
World 502,073 321,524 303,792 348,227 193,894 178,553 Table continued on the following page.

IV‐18
Table IV-10--Continued Wire rod: Brazil’s exports, by destination, 2008-13
Destination
Calendar year
2008 2009 2010 2011 2012 2013
Unit value (per short ton)
United States 836 611 656 827 752 620
Argentina 744 439 586 655 686 622
Korea 672 461 707 886 811 670
Chile 659 412 561 631 590 544
Malaysia - 521 595 816 814 743
Canada 675 517 522 691 720 633
Colombia 722 437 543 600 597 547
Peru 758 441 539 651 607 553
Portugal 805 483 623 698 626 452
Nigeria - 404 - 535 535 531
All other 784 434 578 669 668 606
World 771 456 600 724 709 610
Share of quantity (percent)
United States 22.2 11.3 24.9 23.8 37.3 36.2
Argentina 3.1 4.2 5.0 4.9 4.0 8.5
Korea 4.4 1.2 7.1 9.4 6.7 7.7
Chile 3.2 1.8 3.5 0.5 1.4 7.1
Malaysia - 0.3 2.6 2.0 4.9 4.9
Canada 2.9 1.8 3.6 7.1 10.4 4.4
Colombia 12.8 10.6 9.9 9.6 10.7 3.6
Peru 10.8 8.1 5.3 2.9 2.2 3.4
Portugal 1.6 2.2 1.6 0.9 0.9 3.1
Nigeria - 5.2 - 0.1 2.0 2.6
All other 39.0 53.3 36.6 38.7 19.6 18.7
World 100.0 100.0 100.0 100.0 100.0 100.0 Note.-Data include grade 1080 tire cord and tire bead. Source: Compiled from GTIS/GTA, as reported by the Foreign Trade Secretariate SECEX in Brazil to GTIS (HS codes 7213.91, 7213.99, 7227.20, and 7227.90).

IV‐19
ArcelorMittal Brasil’s shipments, by type
Table IV‐11 presents data on ArcelorMittal Brasil’s total shipments, by type, during 2013. As the data indicate, high/medium‐high carbon industrial/standard quality wire rod and low/medium‐low carbon industrial/standard quality wire rod together accounted for approximately *** of ArcelorMittal Brasil’s total shipments during 2013.
Table IV-11 Wire rod: ArcelorMittal Brasil’s total shipments, by type, 2013
* * * * * * *
THE INDUSTRY IN INDONESIA
Overview
Seven producers of wire rod in Indonesia were identified in the Commission's original investigations. Data presented in the Commission’s final report were obtained from one producer, PT Ispat Indo, which reported that it accounted for *** percent of Indonesian wire rod production and *** percent of exports to the United States in 2001.19 In the first five‐year reviews, the Commission received no questionnaire responses from Indonesian producers.20
According to ***, there are six firms in Indonesia that maintain wire rod rolling capacity: Gunung Garuda in Bekasi (estimated *** short tons of capacity), PT Ispat Indo in Surubaya (estimated *** short tons of capacity),21 PT Krakatau Steel in Cilegon and Growth Sumatra in Medan (each estimated at *** short tons of capacity), Hanil Jaya Metalworks in Surabaya (estimated *** short tons of capacity), and Budidharma Jakarta in Jakarta (estimated *** short tons of capacity).22 A second published source, SBB’s The World Steel Capacity Book 2010, identified PT Ispat Indo, Krakatau, and a producer not identified by ***, Master Steel – as
19 The following 2001 data were provided by PT Ispat Indo in the original investigations: capacity (*** short tons); production (*** short tons); capacity utilization (*** percent); exports/shipments (*** percent); and inventories/shipments (*** percent). Staff Report, May 15, 2008 (INV‐FF‐058), table IV‐22.
20 The following published *** 2007 data for Indonesia were presented in the Commission’s first five‐year review staff report, as no questionnaire responses were provided by Indonesian producers: capacity (*** short tons); production (*** short tons); capacity utilization (*** percent); and exports/shipments (*** percent). Staff Report, May 15, 2008 (INV‐FF‐058), table IV‐14.
21 PT Ispat Indo’s reported capacity of *** short tons is larger than reported by ***. 22 According to company websites for Growth Sumatra and Hanil Jaya, these firms may produce bar
rather than wire rod. Growth Steel company website, http://gs.growthsteelgroup.com/fm_encrypt.php, accessed on May 3, 2014; Hanil Jaya company website, http://www.haniljayasteel.com/main/page4.html , accessed on May 3, 2014. No company website was found for Budidharma Jakarta.
IV‐20
producers in Indonesia with annual capacities of approximately *** tons, plus a smaller fourth producer, Gunung Steel.23
PT Ispat lndo, which was identified by domestic interested parties to be the largest wire rod producer in Indonesia today,24 responded to the Commission’s foreign producer questionnaire in these second five‐year reviews. There were no reported exports of the subject merchandise to the United States during 2008‐13.25 According to ***, production in Indonesia during 2013 was *** short tons. Reported production by PT Ispat Indo was *** short tons, yielding a theoretical coverage of *** percent of Indonesian production during 2013 by the responding firm. *** firm‐by‐firm capacity data indicate that PT Ispat Indo accounted for *** percent of total wire rod rolling capacity in Indonesia during 2013, although this figure is based on capacity calculated for the six firms identified earlier, and does not include Master Steel.
Table IV‐12 presents data published by *** on Indonesian capacity, production, and consumption of wire rod. Also presented in the tabulation are calculated net exports/imports (i.e., production minus consumption).26
Table IV-12
Wire rod: Overall Indonesian capacity, production, consumption, and calculated net exports/imports
* * * * * * *
These data indicate that capacity in Indonesia has remained unchanged at *** short tons since at least 2008 and projections indicate no changes in capacity during 2014 and 2015. Production of wire rod in Indonesia increased from 2009 to 2011 but was lower in 2013. Projections indicate that production of wire rod is expected to once again increase during 2014
23 Krakatua Steel’s wire rod mill began operating in 1979 with a production capacity of 200,000 (metric) tons per year. Following modifications and expansions during 1992‐99, the mill is capable of producing 450,000 (metric) tons of wire rod per year. According to its 2013 annual report, the company produced 220,269 (metric) tons of wire rod in 2013 and sold 223,899 (metric) tons domestically, with no export sales. The company accounts for an estimated 22 percent of the Indonesian wire rod market. Krakatau Steel, “About Us / Production Facilities,” found at http://www.krakatausteel.com; Krakatau Steel, “Challenges for Stronger Growth,” 2013 annual report, pp. 50, 52, and 66. Master Steel (PT The Master Steel Mfc) was established in 1972 and sells “high quality wire rod in different sizes, grades and standards” that are “produced to international specifications.” Master Steel, “Products / Wire,” found at http://www.themastersteel.com. The company is believed by one published source to have 500,000 metric tons of wire rod capacity at its Jakarta facility, with an unconfirmed additional wire rod mill in Gresik, East Java. The company reports an on‐going modernization and expansion project including a 500,000 (metric) ton wire‐rod and bar combi‐mill, expected to increase capacity in 2014. Master Steel, “Brief Profile” found at http://www.themastersteel.com; SBB, The World Steel Capacity Book 2012, p. 2; and “Indonesia’s Master Steel adding new long plants,” Steel Business Briefing, 21 September 2007.
24 Response of the Domestic Interested Parties, July 2, 2013, p. 21. 25 As previously noted in this report, U.S. imports of wire rod from Indonesia ceased after 2005. 26 This calculation may differ from GTA data on exports and imports, primarily due to rounding.
IV‐21
and 2015. Capacity reported by *** for 2013 for all Indonesian producers was *** short tons, and production was *** short tons, yielding a capacity utilization of *** percent. Since 2010, Indonesia consumed more wire rod than it produced and projections indicate that Indonesia will remain a net importer of wire rod during 2014‐15.
Operations on wire rod
Data provided by PT Ispat Indo concerning its wire rod operations in Indonesia during calendar years 2008‐13 are presented in table IV‐13.
Table IV-13
Wire rod: Indonesian producer PT Ispat Indo’s capacity, production, shipments, and inventories, 2008-13
* * * * * * *
PT Ispat Indo’s capacity and production in Indonesia
As previously noted, *** data indicate that PT Ispat Indo accounted for *** percent of total wire rod rolling capacity in Indonesia during 2013. According to ***, there has been no change in the wire rod rolling capacity in Indonesia during 2008‐13. In fact, PT Ispat Indo’s capacity to produce wire rod in Indonesia, which was based on operating *** hours per week and *** weeks per year, remained constant at *** short tons during 2008‐13. The firm’s production fluctuated during 2008‐13, but was *** percent lower at *** short tons in 2013 than reported in 2008. Capacity utilization was *** percent during 2013 and ranged between *** and *** percent during 2008‐13.
PT Ispat Indo reported the production of no other products in addition to wire rod using shared equipment and machinery in its facilities in Indonesia. PT Ispat Indo estimated that wire rod accounted for *** percent of its 2013 total sales. The firm reported *** set the limit on its production capacity and that since it produces no other products it does not shift production capacity between products. It added *** limit the availability to shift such production. PT Ispat Indo reported ***. The firm further reported ***. The Indonesia producer reported that ***. The firm explained ***.
Shipments of wire rod produced in Indonesia
PT Ispat Indo’s total shipments of wire rod fell from 2008 to 2010, increased in 2011, and fell thereafter. The firm’s total shipments fell overall by *** percent from 2008 to 2013. The firm’s home market shipments accounted for the majority of the firm’s total shipments of wire rod and an increasing share during 2008‐13. During 2013, internal consumption and home market shipments accounted for *** percent of the firm’s total shipments of wire rod.
PT Ispat Indo’s export shipments of wire rod have fallen absolutely and as a share of total shipments overall from *** percent in 2008 to *** percent in 2013. The firm reported that there were no exports of subject wire rod to the United States or the European Union during

IV‐22
2008‐13. Principal *** markets for PT Ispat Indo’s wire rod include *** and *** export markets include ***.
Detailed information on the export destinations for Indonesian wire rod as published by the GTIS/GTA for 2008‐12 is presented in table IV‐ 14.27 These data include grade 1080 tire cord and tire bead, which is not subject to these reviews, and may therefore be overstated.
Table IV-14 Wire rod: Indonesia’s exports, by destination, 2008-12
Destination
Calendar year
2008 2009 2010 2011 2012
Quantity (short tons)
Australia 26,590 20,423 7,343 33,308 31,832
Bangladesh 5,464 7,726 7,509 12,911 11,498
Pakistan 4,944 11,208 14,166 12,062 2,402
New Zealand 3,337 2,112 3,751 2,907 1,751
United Arab Emirates 6,212 - - - 1,720
Philippines 9,177 5,843 5,010 10,364 1,580
Malaysia 2,310 - 56 16,445 1,239
Sri Lanka 5,022 4,073 1,540 4,308 1,293
India 34,505 16,967 9,204 2,186 1,048
Brunei Darussalam - - - 1,578 794
All other1 109,971 126,652 97,878 85,303 802
World 207,533 195,002 146,457 181,372 55,960
Value ($1,000)
Australia 20,450 10,017 4,129 22,326 19,956
Bangladesh 4,540 3,646 4,858 9,012 8,344
Pakistan 3,458 5,620 8,285 8,522 1,700
New Zealand 2,258 1,079 2,145 1,976 1,153
United Arab Emirates 4,930 - - - 1,201
Philippines 6,739 3,127 3,145 7,302 1,109
Sri Lanka 1,548 - 31 11,054 789
Malaysia 3,461 2,397 1,194 3,129 1,107
India 21,985 8,219 5,261 1,575 714
Brunei Darussalam - - - 1,053 526
All other1 73,076 61,773 58,202 59,542 639
World 142,446 95,880 87,250 125,490 37,238 Table continued on the following page.
27 GTIS/GTA data for Indonesia are not yet available for calendar year 2013.

IV‐23
Table IV-14--Continued Wire rod: Indonesia’s exports, by destination, 2008-12
Destination
Calendar year
2008 2009 2010 2011 2012
Unit value (per short ton)
Australia 769 491 562 670 627
Bangladesh 831 472 647 698 726
Pakistan 700 501 585 707 708
New Zealand 677 511 572 680 658
United Arab Emirates 794 - - - 698
Philippines 734 535 628 705 702
Malaysia 670 - 554 672 637
Sri Lanka 689 589 775 726 856
India 637 484 572 720 681
Brunei Darussalam - - - 667 662
All other1 664 488 595 698 797
World 686 492 596 692 665
Share of quantity (percent)
Australia 12.8 10.5 5.0 18.4 56.9
Bangladesh 2.6 4.0 5.1 7.1 20.5
Pakistan 2.4 5.7 9.7 6.7 4.3
New Zealand 1.6 1.1 2.6 1.6 3.1
United Arab Emirates 3.0 - - - 3.1
Philippines 4.4 3.0 3.4 5.7 2.8
Sri Lanka 1.1 - 0.0 9.1 2.2
Malaysia 2.4 2.1 1.1 2.4 2.3
India 16.6 8.7 6.3 1.2 1.9
Brunei Darussalam - - - 0.9 1.4
All other1 53.0 64.9 66.8 47.0 1.4
World 100.0 100.0 100.0 100.0 100.0 1 Prior to 2012, Iran was the single largest destination for Indonesian exports of wire rod. Exports to Iran dropped to zero in 2012. Note.--Data for Indonesia are not yet available for calendar year 2013. Data include grade 1080 tire cord and tire bead. Source: Compiled from GTIS/GTA, as reported by “Statistics Indonesia” to GTIS (HS codes 7213.91, 7213.99, 7227.20, and 7227.90).

IV‐24
PT Ispat Indo’s shipments, by type
Table IV‐15 presents data on PT Ispat Indos’s total shipments, by type, during 2013. As the data indicate, high/medium‐high carbon industrial/standard quality wire rod and low/medium‐low carbon industrial/standard quality wire rod together accounted for *** percent of PT Ispat Indo’s total shipments during 2013.
Table IV-15 Wire rod: PT Ispat Indo’s total shipments, by type, 2013
* * * * * * *
THE INDUSTRY IN MEXICO
Overview
At the time of the original investigations, six Mexican firms were believed to have produced wire rod. Two firms, accounting for *** percent of Mexican production of wire rod, provided data in response to the Commission’s questionnaire in the original investigations: Hylsa and Siderurgica Lazaro Cardenas Las Truchas (“Sicartsa”). These two firms reported that they collectively accounted for *** percent of exports to the United States during 2001. According to official Commerce statistics, exports by these firms to the United States in 2001 accounted for *** percent of U.S. imports of subject wire rod from Mexico in 2001.28
The following seven firms were identified as producers of wire rod in Mexico in the Commission’s first five‐year reviews: Aceros Nacionales, Aceros San Luis, AHMSA‐Altos Hornos de Mexico, Atlax, Deacero, Sicartsa, and Hylsa. Responses to the Commission’s questionnaire were received from producers Deacero, Hylsa, and Sicartsa. By their estimation, these three producers accounted for *** percent of production in Mexico during 2007 (***).29
In their responses to the Commission’s notice of institution in these current second five‐year reviews, the interested parties identified the following five producers of wire rod in Mexico: ArceIorMittaI LasTruchas (successor to Sicartsa), Aceros San Luis, Altos Hornos de Mexico (“AHMSA”), Ternium México SA de CV (“Ternium”) (successor to Hylsa), and Talleres y Aceros. *** identified the following additional firms in Mexico as having wire rod rolling capacity during 2013: Aceros Nacionales SA de CV; Camesa; Deacero; and Siderurgica Tultitlan
28 The following 2001 data were provided by the two responding Mexican firms in the original investigations: capacity (*** short tons); production (*** short tons); capacity utilization (*** percent); exports/shipments (*** percent); and inventories/shipments (*** percent). Staff Report, May 15, 2008 (INV‐FF‐058), table IV‐24.
29 The following 2007 data were provided by the three responding Mexican firms in the first five‐year reviews: capacity (*** short tons); production (*** short tons); capacity utilization (*** percent); exports/shipments (*** percent); and inventories/shipments (*** percent). Staff Report, May 15, 2008 (INV‐FF‐058), table IV‐24.

IV‐25
(“Sidertul”). Hearing testimony suggested that Aceros Nationales, Sidertul, and Camesa do not produce wire rod in Mexico. 30 Aceros Camesa, AHMSA, and Sidertul provided questionnaire responses in these second five‐year reviews indicating that they are not wire rod producers.
Deacero, Ternium, and ArcelorMittal las Truchas provided responses to the Commission’s foreign producer questionnaire in these second five‐year reviews. Hearing testimony indicates that these three companies are the principal producers of wire rod in Mexico,31 although Talleres y Aceros and Simec also are believed to produce wire rod. 32 33
Mexican wire rod producer Deacero is the largest manufacturer of wire rod in Mexico, accounting for *** percent of total wire rod production in Mexico during 2013. According to ***, production in Mexico during 2013 was *** short tons. Aggregate reported production by the three responding wire rod producers in Mexico was 2.345 million short tons, yielding a theoretical coverage of *** percent of Mexican production during 2013 by the responding firms. *** firm‐by‐firm capacity data indicate that the three responding Mexican producers accounted for *** wire rod rolling capacity in Mexico during 2013, other than that attributed to AHMSA, Aceros Nationales, Siderurgica Tultitlan, and Camesa.
30 Mexican wire rod producer Deacero testified at the Commission’s hearing that it had acquired Aceros Nationales in 1999 and the production facilities were shut down and the assets sold outside Mexico. Deacero also testified that Sidertul is a producer of rebar in Mexico that was acquired by Gerdau in 2007 and Camesa is a producer of wire and wire rope in Mexico. Hearing transcript, p. 153 (Campbell).
31 Hearing transcript, p. 153 (Campbell). 32 Talleres y Aceros (sometimes identified as TYASA) is located in Orizaba, Veracruz, and produces a
variety of long products, including wire rod and products produced from wire rod. Talleres y Aceros, “Talleres y Aceros, fabricante de productos TA,” found at talleresyaceros.com.mx. TYASA reported that it maintained annual wire rod capacity of *** tons during 2008‐13. TYASA stated that it is focused on *** sales, exporting only to ***, and that it produced *** tons of wire rod in 2013. Letter from *** to Mary Messer, May 16, 2014.
33 Grupo Simec, known for commercial purposes as Simec, is a diversified manufacturer, processor and distributor of SBQ steel and structural steel products with production and commercial operations in the United States, Mexico and Canada. On May 30, 2008, Simec acquired all the capital stock of Aceros DM, and certain affiliated companies (“Grupo San”), with corrugated rebar and other long product operations in San Luis Potosí, Mexico. Simec operates five minimills in Mexico, with a wire rod rolling mill in its Aceros DM / San Luis Potosí location. Simec sold 21,400 tons of wire rod in 2012, 100 percent of which was sold within Mexico. Simec’s Aceros DM / San Luis Potosí location, with installed capacity of 400,000 tons, produced 388,047 tons of finished product in 2012, distributed as follow (in percent): rebar (78), light structurals (5), wire rod (5), electro‐welded wire mesh (5), and electro‐welded wire mesh panel (7). See generally Grupo Simec, Form 20‐F, Annual Report Pursuant To Section 13 or 15(D) Of The Securities Exchange Act Of 1934 for the fiscal year ended December 31, 2012.

IV‐26
Table IV‐16 presents data published by *** on overall Mexican capacity, production, and consumption of wire rod. Also presented in the tabulation are calculated net exports/imports (i.e., production minus consumption).34
Table IV-16
Wire rod: Overall Mexican capacity, production, consumption, and calculated net exports/imports
* * * * * * *
The *** data show that capacity to produce wire rod in Mexico remained constant at *** short tons during 2008‐13 and projections indicate that there is no change in capacity expected in 2014 and 2015. According to ***, production of wire rod in Mexico increased from 2009 to 2011 but fell thereafter. Production is expected to increase during 2014 and 2015. Capacity reported by *** for 2013 for all Mexican producers was *** short tons, and production was *** short tons, yielding a capacity utilization of *** percent for the Mexican wire rod industry. Mexican production of wire rod exceeded consumption during 2008‐13 and *** projections for production and consumption in Mexico indicate that it will continue to be a net exporter of wire rod during 2014‐15.
34 The net export/import calculation may differ from GTA data on exports and imports, primarily due to rounding. Also, note that the data reported by *** for Mexico are overstated, as they include not only the data for firms believed to have not been producers of wire rod, but also include the data for grade 1080 tire cord and tire bead wire rod and smaller diameter wire rod produced by Deacero that have been excluded by the Department of Commerce from the scope of the orders.

IV‐27
Operations on wire rod
Aggregate data provided by ArcelorMittal Las Truchas, Deacero, and Ternium concerning their wire rod operations in Mexico during calendar years 2008‐13 are presented in table IV‐17.
Table IV-17 Wire rod: Mexican producers ArcelorMittal Las Truchas, Deacero, and Ternium’s capacity, production, shipments, and inventories, 2008-13
Item
Actual experience Calendar year
2008 2009 2010 2011 2012 2013 Quantity (short tons) Capacity 2,417,205 2,304,946 2,482,603 2,606,163 2,625,106 2,757,570Production 2,139,484 2,096,645 2,279,689 2,556,411 2,566,149 2,344,862End-of-period inventories 119,699 156,624 159,165 192,768 194,722 159,917Shipments: Internal consumption/ Transfers *** *** *** *** *** ***
Home market shipments *** *** *** *** *** ***
Export shipments to: United States *** *** *** *** *** *** European Union *** *** *** *** *** *** Asia *** *** *** *** *** *** All other markets *** *** *** *** *** *** Total exports *** 193,724 290,724 419,479 379,513 379,963 Total shipments 2,185,456 2,063,393 2,279,900 2,525,125 2,558,539 2,378,082 Ratios and shares (percent) Capacity utilization 88.5 91.0 91.8 98.1 97.8 85.0Inventories/production 5.6 7.5 7.0 7.5 7.6 6.8Inventories/total shipments 5.5 7.6 7.0 7.6 7.6 6.7Share of total shipments: Internal consumption/ Transfers *** *** *** *** *** *** Home market shipments *** *** *** *** *** ***
Export shipments to: United States *** *** *** *** *** *** European Union *** *** *** *** *** *** Asia *** *** *** *** *** *** All other markets *** *** *** *** *** *** Total exports *** 9.4 12.8 16.6 14.8 16.0 Total shipments 100.0 100.0 100.0 100.0 100.0 100.0Continued on the following page.

IV‐28
Table IV-17--Continued Wire rod: Mexican producers ArcelorMittal Las Truchas, Deacero, and Ternium’s capacity, production, shipments, and inventories, 2008-13
Item
Actual experience Calendar year
2008 2009 2010 2011 2012 2013 Value (1,000 dollars)
Shipments: Home market shipments *** *** *** *** *** ***
Export shipments to: United States *** *** *** *** *** *** European Union *** *** *** *** *** *** Asia *** *** *** *** *** *** All other markets *** *** *** *** *** *** Total exports *** *** *** *** *** *** Total shipments1 905,006 509,493 710,507 986,036 965,352 833,112 Unit value (dollars per short ton)
Shipments: Home market shipments *** *** *** *** *** ***
Export shipments to: United States *** *** *** *** *** *** European Union *** *** *** *** *** *** Asia *** *** *** *** *** *** All other markets *** *** *** *** *** *** Total exports *** *** *** *** *** *** Total shipments1 810 486 545 689 653 5831 Excludes internal consumption for which value data were not gathered. Note.—Principal *** markets include ***. Principal ** markets include ***. *** export markets include ***. Source: Compiled from data submitted by ArcelorMittal Las Truchas, Deacero (adjusted to remove nonsubject smaller diameter wire rod), and Ternium in response to the Commission’s foreign producer questionnaire.

IV‐29
Capacity and production in Mexico
The reported capacity to produce wire rod in Mexico by the three responding producers, which was based on operating *** hours per week and *** weeks per year, fluctuated upward by 14.1 percent from 2.4 million short tons in 2008 to 2.8 million short tons in 2013. The firms’ aggregate production increased irregularly during 2008‐12, but fell in 2013. Aggregate reported production was 9.6 percent higher at 2.3 million short tons in 2013 than reported in 2008. Capacity utilization was 85.0 percent during 2013, the lowest reported for any year during 2008‐13.
In addition to the production of wire rod, all three responding Mexican producers reported the production of *** using shared equipment and machinery in their wire rod facilities in Mexico. Deacero subsequently clarified its response to the Commission’s questionnaire by stating that it “can only produce wire rod, which is coiled, on certain rebar mills that can produce coiled rebar.”35 Table IV‐18 presents the reported aggregate overall capacity and production of wire rod and other products produced on the same production equipment used to produce wire rod in Mexico.
Table IV-18 Wire rod: Mexican producers ArcelorMittal Las Truchas, Deacero, and Ternium’s overall capacity, production, and capacity utilization, 2008-13
* * * * * * *
ArcelorMittal Las Truchas, Deacero, and Ternium estimated that wire rod accounted for ***, ***, and *** percent of their 2013 total sales, respectively. The overall production data presented indicate that subject wire rod accounted for between *** and *** percent of the firms’ aggregate overall production on the same machinery and equipment as wire rod during 2008‐13. The capacity to produce wire rod is affected by ***. *** were reported by the firms to be the primary constraints that set the limit on their production capacity. Several factors that constrain the firms’ ability to shift production capacity between product lines were reported: ***.
ArcelorMittal Las Truchas and Ternium reported that they experienced ***. Deacero reported ***.36 All three responding Mexican producers reported that ***.
35 Deacero’s prehearing brief, p. 29 36 The domestic interested parties noted in their response to the Commission’s notice of institution in
these reviews that Deacero completed the construction of a new wire rod mini‐mill in Saltillo, Mexico in 2011, with annual rolling capacity of 800,000 to 1 million tons per year. They also noted that Deacero ***. Response of Domestic Industry, July 2, 2013, p. 23. Deacero indicated that these claims are inaccurate with respect to wire rod. Deacero’s prehearing brief, pp. 23‐24.

IV‐30
Shipments of wire rod produced in Mexico
The three responding producers’ total shipments of wire rod fluctuated during 2008‐13, but were 8.8 percent higher in 2013 than reported in 2008. The firms’ internal consumption and home market together accounted for the majority of the firms’ total shipments of wire rod, but they accounted for an overall declining share of total shipments during most of the years 2008‐13. During 2013, internal consumption and home market shipments together accounted for *** percent of the firms’ total shipments of wire rod.
The three responding producers’ export shipments of wire rod decreased in the aggregate from 2008 to 2009, and increased until 2011 before declining again in 2013. Total exports were *** percent higher in 2013 than reported in 2008. Aggregate exports of subject wire rod to the United States increased from 2008 to 2010, but fluctuated thereafter to a level in 2013 that was *** percent higher than that reported in 2008. The Mexican producers reported that their principal *** markets include ***, its principal *** markets include ***, and *** export markets include ***.
Detailed information on the export destinations for Mexican wire rod as published by the GTIS/GTA is presented in table IV‐19. These data include grade 1080 tire cord and tire bead, which is not subject to these reviews, and are therefore overstated. In addition, smaller diameter wire rod produced by Deacero (diameter of 4.75 mm to 5.0 mm) is also believed to be included in the data reported by the GTIS/GTA.

IV‐31
Table IV-19 Wire rod: Mexico’s exports, by destination, 2008-13
Destination
Calendar year
2008 2009 2010 2011 2012 2013
Quantity (short tons)
Colombia 25,688 41,192 53,327 94,777 92,319 192,108
Canada 36,063 7,784 38,791 68,806 77,973 42,446
Ecuador 15,941 15,873 18,051 48,192 34,869 22,868
United States 11,885 28,432 694,233 91,504 36,560 21,251
Guatemala 40,992 46,157 32,123 46,355 30,043 19,005
Argentina - - - - - 15,103
Dominican Republic 8,541 4,254 39 - - 12,153
El Salvador 16,660 23,834 23,723 18,270 26,895 9,609
Peru 11,855 21,621 22,585 45,959 36,219 7,537
Chile - 5,549 10,832 - 5,056 5,029
All other 84,038 31,461 22,159 69,574 23,896 13,789
World 251,663 226,156 915,863 483,437 363,831 360,899
Value ($1,000 dollars)
Colombia 20,606 16,234 28,859 63,164 57,574 113,192
Canada 30,447 4,716 21,495 45,611 45,524 23,940
Ecuador 15,841 6,012 10,975 32,518 22,445 15,147
United States 12,365 15,950 80,068 55,818 23,958 12,468
Guatemala 26,751 20,526 18,263 30,664 19,437 11,399
Argentina - - - - - 9,221
Dominican Republic 8,809 1,779 21 - - 8,183
El Salvador 12,857 10,487 11,188 11,950 17,839 5,936
Peru 13,034 10,545 13,453 33,236 24,186 4,640
Chile - 3,071 7,102 - 3,409 3,103
All other 64,151 12,863 11,632 45,677 15,484 9,316
World 204,861 102,182 203,055 318,637 229,855 216,544 Table continued on the following page.

IV‐32
Table IV-19--Continued Wire rod: Mexico’s exports, by destination, 2008-13
Destination
Calendar year
2008 2009 2010 2011 2012 2013
Unit value (per short ton)
Colombia 802 394 541 666 624 589
Canada 844 606 554 663 584 564
Ecuador 994 379 608 675 644 662
United States 1,040 561 115 610 655 587
Guatemala 653 445 569 661 647 600
Argentina - - - - - 611
Dominican Republic 1,031 418 538 - - 673
El Salvador 772 440 472 654 663 618
Peru 1,099 488 596 723 668 616
Chile - 553 656 - 674 617
All other 763 409 525 657 648 676
World 814 452 222 659 632 600
Share of quantity (percent)
Colombia 10.2 18.2 5.8 19.6 25.4 53.2
Canada 14.3 3.4 4.2 14.2 21.4 11.8
Ecuador 6.3 7.0 2.0 10.0 9.6 6.3
United States 4.7 12.6 75.8 18.9 10.0 5.9
Guatemala 16.3 20.4 3.5 9.6 8.3 5.3
Argentina - - - - - 4.2
Dominican Republic 3.4 1.9 0.0 - - 3.4
El Salvador 6.6 10.5 2.6 3.8 7.4 2.7
Peru 4.7 9.6 2.5 9.5 10.0 2.1
Chile - 2.5 1.2 - 1.4 1.4
All other 33.4 13.9 2.4 14.4 6.6 3.8
World 100.0 100.0 100.0 100.0 100.0 100.0 Note.-Data include grade 1080 tire cord and tire bead wire rod and smaller diameter wire rod produced by Deacero, which are not merchandise subject to the order concerning Mexico. Source: Compiled from GTIS/GTA, as reported to GTIS by the Instituto Nacional de Estadistica y Geografia (INEGI) (HS codes 7213.91, 7213.99, 7227.20, and 7227.90).

IV‐33
Shipments, by type
Table IV‐20 presents data on the three responding producers’ total shipments, by type, during 2013. As the data indicate, high/medium‐high carbon industrial/standard quality wire rod and low/medium‐low carbon industrial/standard quality wire rod together accounted for *** percent of the Mexican producers’ total shipments during 2013.
Table IV-20 Wire rod: Total shipments of wire rod produced in Mexico, by type, 2013
* * * * * * *
THE INDUSTRY IN MOLDOVA
Overview
The only firm believed to be producing wire rod in Moldova, Moldova Steel Works, provided data in response to the Commission's questionnaire in the original investigations.37 Moldova Steel Works also provided data in the first five‐year reviews.38 The structure of the wire rod industry in Moldova has changed little since the imposition of the original order, with Moldova Steel Works accounting for all known production in Moldova.39 However, the firm did not submit a response to the Commission's foreign producer questionnaire in these second five‐year reviews.
Table IV‐21 presents data published by *** on overall Moldovan capacity. The *** data show that capacity remained unchanged from 2008 to 2013. Projections for 2014 and 2015 indicate no change in the capacity to produce wire rod in Moldova is expected. Production and consumption data for Moldova are not published by ***.
37 The following 2001 data were provided by Moldova Steel Works in the original investigations: capacity (*** short tons); production (*** short tons); capacity utilization (*** percent); exports/shipments (*** percent); and inventories/shipments (*** percent). Staff Report, May 15, 2008 (INV‐FF‐058), table IV‐28.
38 The following 2007 data were provided by Moldova Steel Works in the first five‐year reviews: capacity (*** short tons); production (*** short tons); capacity utilization (*** percent); exports/shipments (*** percent); and inventories/shipments (*** percent). Staff Report, May 15, 2008 (INV‐FF‐058), table IV‐28.
39 The domestic interested parties reported that, since the last sunset review, the ownership of Moldova Steel Works has changed. It stated that the Moldovan producer is currently managed by Metallinvest Holding, Russia’s largest iron ore miner. This company is not affiliated with Ukrainian producer Yenakiieve’s parent company, MetInvest. Response of Domestic Industry, July 2, 2013, pp. 25‐26; and Hearing transcript, pp. 200‐201 (Lewis).

IV‐34
Table IV-21
Wire rod: Overall Moldovan capacity, production, consumption, and calculated net exports/imports
* * * * * * *
Operations on wire rod
Moldova Steel Works reportedly produces low‐carbon and high‐carbon wire rod, as well as welding quality and CHQ wire rod in Moldova.40 Time series data reported by *** indicate that the capacity to produce wire rod in Moldova has remained unchanged at *** short tons during 2008‐13. Other sources estimate the Moldovan plant’s overall capacity to produce rolled products at *** short tons.41 In addition, the domestic interested parties estimated Moldova Steel Works’ production of wire rod in 2012 at 174,809 short tons and its 2012 capacity utilization for rolled products at approximately about 37 percent.42 The domestic interested parties also reported that, although Moldova Steel Works essentially ceased exports of wire rod to the United States following the imposition of the antidumping duty order, the producer remains ***.43
Detailed information on the export destinations for Moldovan wire rod as published by GTIS/GTA is presented in table IV‐22.
40 Response of Domestic Industry, July 2, 2013, p. 25. 41 ***, as cited in Response of Domestic Industry, July 2, 2013, p. 26. 42 Response of Domestic Industry, July 2, 2013, p. 26. 43 ***, as cited in Response of Domestic Industry, July 2, 2013, p. 26.

IV‐35
Table IV-22 Wire rod: Exports from Moldova, 2008-13
Reporting destination
Calendar year
2008 2009 2010 2011 2012 2013
Quantity (short tons)
Romania 99,901 28,948 8,338 35,412 93,979 59,854
Poland 101,312 30,633 25,354 15,025 14,707 34,158
Ukraine 10,882 2,256 5,721 35,084 23,147 5,678
Slovakia 26,199 5,434 3,799 125 368 737
Russia 62,259 35,902 26,860 9,877 2,287 611
Georgia 0 0 0 0 0 405
Czech Republic 1,919 0 588 0 0 140
Azerbaijan 0 0 136 274 1,226 138
Brazil 12,381 29,233 75,620 540 9,296 0
Canada 0 0 5,523 0 0 0
All other countries 62,945 21,552 10,468 3,062 625 0Total reporting countries 377,798 153,960 162,405 99,399 145,635 101,721
Value (1,000)
Romania 87,863 13,254 4,368 22,882 51,814 31,821
Poland 77,580 12,747 14,221 10,585 9,535 19,499
Ukraine 10,507 1,145 3,225 25,589 16,621 3,969
Slovakia 23,511 2,475 2,143 88 204 419
Russia 49,811 16,781 15,106 6,888 1,526 373
Georgia 0 0 0 0 0 242
Czech Republic 1,491 0 346 0 0 83
Azerbaijan 0 0 95 211 836 94
Brazil 9,434 15,340 38,847 356 5,733 0
Canada 0 0 3,169 0 0 0
All other countries 50,028 11,587 5,817 2,796 428 0Total reporting countries 310,225 73,329 87,336 69,395 86,696 56,499
Table continued on next page.

IV‐36
Table IV-22--Continued Wire rod: Exports from Moldova, 2008-13
Reporting destination
Calendar year
2008 2009 2010 2011 2012 2013
Unit value (dollars per short ton)
Romania 879 458 524 646 551 532
Poland 766 416 561 705 648 571
Ukraine 966 507 564 729 718 699
Slovakia 897 455 564 707 554 568
Russia 800 467 562 697 667 610
Georgia 0 0 0 0 0 599
Czech Republic 777 0 589 0 0 593
Azerbaijan 0 0 698 768 682 679
Brazil 762 525 514 659 617 0
Canada 0 0 574 0 0 0
All other countries 795 538 556 913 684 0Total reporting countries 821 476 538 698 595 555
Share of quantity (percent)
Romania 26.4 18.8 5.1 35.6 64.5 58.8
Poland 26.8 19.9 15.6 15.1 10.1 33.6
Ukraine 2.9 1.5 3.5 35.3 15.9 5.6
Slovakia 6.9 3.5 2.3 0.1 0.3 0.7
Russia 16.5 23.3 16.5 9.9 1.6 0.6
Georgia 0.0 0.0 0.0 0.0 0.0 0.4
Czech Republic 0.5 0.0 0.4 0.0 0.0 0.1
Azerbaijan 0.0 0.0 0.1 0.3 0.8 0.1
Brazil 3.3 19.0 46.6 0.5 6.4 0.0
Canada 0.0 0.0 3.4 0.0 0.0 0.0
All other countries 16.7 14.0 6.4 3.1 0.4 0.0Total reporting countries 100.0 100.0 100.0 100.0 100.0 100.0
Note.--Data may include 1080 tire cord and tire bead. Source: Compiled from GTIS/GTA based on partner country imports from Moldova using HS codes: 7213.91, 7313.99, 7227.20, and 7227.90. Accessed on March 29, 2014, and not all reporting countries had provided 2013 data as of the date compiled.

IV‐37
THE INDUSTRY IN TRINIDAD & TOBAGO
Overview
One firm, accounting for all Trinidadian production of wire rod, provided data in response to the Commission’s questionnaire in the original investigations: Caribbean Ispat.44 The successor firm to Carribean Ispat, ArcelorMittal Point Lisas, responded to the Commission’s questionnaire in the first sunset reviews.45 The structure of the wire rod industry in Trinidad & Tobago has changed little since the final investigations and the first five‐year reviews, with one producer accounting for all production in the country. ArcelorMittal Point Lisas, which accounted for all known production of wire rod in Trinidad & Tobago, provided a response to the Commission’s questionnaire in these current second five‐year reviews.
Table IV‐23 presents data published by *** on overall Trinidadian capacity. The ***data show that capacity remained unchanged from 2008 to 2013. Projections for 2014 and 2015 indicate no change in the capacity to produce wire rod in Trinidad & Tobago is expected. Production and consumption data are not published by ***.
Table IV-23
Wire rod: Overall Trinidadian capacity, production, consumption, and calculated net exports/imports
* * * * * * *
Operations on wire rod
Data provided by ArcelorMittal Point Lisas concerning its wire rod operations in Trinidad & Tobago during calendar years 2008‐13 are presented in table IV‐24.
Table IV-24 Wire rod: Trinidadian producer ArcelorMittal Point Lisas’ capacity, production, shipments, and inventories, 2008-13
* * * * * * *
44 The following 2001 data were provided by Caribbean Ispat in the original investigations: capacity (*** short tons); production (*** short tons); capacity utilization (*** percent); exports/shipments (*** percent); and inventories/shipments (*** percent). Staff Report, May 15, 2008 (INV‐FF‐058), table IV‐31.
45 The following 2007 data were provided by the ArcelorMittal Point Lisas in the first five‐year reviews: capacity (*** short tons); production (*** short tons); capacity utilization (*** percent); exports/shipments (*** percent); and inventories/shipments (*** percent). Staff Report, May 15, 2008 (INV‐FF‐058), table IV‐14.

IV‐38
Capacity and production in Trinidad & Tobago
ArcelorMittal Point Lisas’ capacity to produce wire rod in Trinidad & Tobago, which was based on operating *** hours per week and *** weeks per year, remained constant at *** short tons during 2008‐13. The firm’s production fluctuated during 2008‐13, but was *** percent higher at *** short tons in 2013 than reported in 2008. Capacity utilization was *** percent during 2013 and ranged between *** and *** percent during 2008‐13.
In addition to the production of wire rod, ArcelorMittal Point Lisas reported ***. Table IV‐25 presents ArcelorMittal Point Lisas’ overall production and capacity ***.
Table IV-25 Wire rod: Trinidadian producer ArcelorMittal Point Lisas’ overall capacity, production, and capacity utilization, 2008-13
* * * * * * *
ArcelorMittal Point Lisas estimated that wire rod accounted for *** percent of its 2013 total sales. The overall production data presented indicate that wire rod accounted for between *** and *** percent of the firm’s overall production during 2008‐13. In response to a request for information pertaining to the constraints that set the limits on production capacity, ArcelorMittal Point Lisas indicated that “***.” The firm added that “***.” Concerning the firm’s ability to shift production capacity between wire rod and rebar in coil, ArcelorMittal Point Lisas noted “***.” In response to a request for information concerning changes experienced in the character of operations, ArcelorMittal Point Lisas reported the following:
***. ***. The Trinidadian producer reported ***.
Shipments of wire rod produced in Trinidad & Tobago
ArcelorMittal Point Lisas’ total shipments of wire rod fluctuated upward, reaching *** during 2011 before declining in 2012 and 2013. The firm’s total shipments were *** percent higher in 2013 than in 2008. The firm reported *** internal consumption of wire rod during 2008‐13 and home market shipments accounted for *** generally declining share of total shipments (i.e., ranging from *** percent of total shipments of wire rod during 2008‐13).
ArcelorMittal Point Lisas’ export shipments of wire rod, which accounted for *** of the firm’s total wire rod shipments during 2008‐13, generally increased from 2008 to 2011, but fell thereafter to a level in 2013 that was *** percent higher than reported in 2008. ArcelorMittal Point Lisas reported that its principal *** market is *** and that *** export markets include ***. The firm noted that, since 2008, it has increased its exports to ***. The firm reported that there were no exports of subject wire rod to the United States during 2009‐13. Detailed information on the export destinations for Trinidadian wire rod as published by GTIS/GTA is presented in table IV‐26.

IV‐39
Table IV-26 Wire rod: Exports from Trinidad & Tobago, 2008-13
Destination
Calendar year
2008 2009 2010 2011 2012 2013
Quantity (short tons)
El Salvador 17,181 0 9,833 23,817 16,955 21,790
Nicaragua 9,309 1,238 10,189 16,391 14,907 19,370
France 30,600 15,900 24,363 15,364 15,538 18,515
Guatemala 7,783 0 6,796 9,323 9,056 16,009
Peru 0 0 20,470 42,789 32,790 11,595
Ecuador 8,889 8,967 28,898 42,871 37,371 10,487
Brazil 45,037 0 39,435 85,345 15,351 4,865
Chile 0 0 0 0 0 3,142
Honduras 7,859 0 8,734 4,940 264 2,008
Colombia 0 0 14,432 11,363 45,533 1,829
All other countries 72,129 66,990 248,334 14,793 38,748 410Total reporting
countries 198,787 93,095 411,484 266,996 226,513 110,020
Value (1,000)
El Salvador 13,669 0 6,379 19,230 12,985 14,973
Nicaragua 6,434 1,222 6,427 11,799 11,122 12,716
France 27,969 8,670 15,277 11,218 11,380 12,455
Guatemala 6,275 0 5,973 7,916 6,679 10,744
Peru 0 0 13,691 32,256 24,504 8,082
Ecuador 5,966 5,129 17,751 31,473 27,546 7,078
Brazil 44,088 0 25,516 61,896 11,310 3,091
Chile 0 0 0 0 0 2,259
Honduras 7,573 0 5,849 6,207 5,668 3,357
Colombia 0 0 9,086 8,766 33,003 1,282
All other countries 49,816 36,117 25,531 11,295 27,943 232Total reporting
countries 161,789 51,138 131,480 202,057 172,138 76,270Table continued on next page.

IV‐40
Table IV-26--Continued Wire rod: Exports from Trinidad & Tobago, 2008-13
Destination
Calendar year
2008 2009 2010 2011 2012 2013
Unit value (dollars per short ton)
El Salvador 796 0 649 807 766 687
Nicaragua 691 987 631 720 746 656
France 914 545 627 730 732 673
Guatemala 806 0 879 849 738 671
Peru 0 0 669 754 747 697
Ecuador 671 572 614 734 737 675
Brazil 979 0 647 725 737 635
Chile 0 0 0 0 0 719
Honduras 964 0 670 1,257 21,468 1,672
Colombia 0 0 630 771 725 701
All other countries 691 539 103 764 721 566Total reporting
countries 814 549 320 757 760 693
Share of quantity (percent)
El Salvador 8.6 0.0 2.4 8.9 7.5 19.8
Nicaragua 4.7 1.3 2.5 6.1 6.6 17.6
France 15.4 17.1 5.9 5.8 6.9 16.8
Guatemala 3.9 0.0 1.7 3.5 4.0 14.6
Peru 0.0 0.0 5.0 16.0 14.5 10.5
Ecuador 4.5 9.6 7.0 16.1 16.5 9.5
Brazil 22.7 0.0 9.6 32.0 6.8 4.4
Chile 0.0 0.0 0.0 0.0 0.0 2.9
Honduras 4.0 0.0 2.1 1.9 0.1 1.8
Colombia 0.0 0.0 3.5 4.3 20.1 1.7
All other countries 36.3 72.0 60.4 5.5 17.1 0.4Total reporting
countries 100.0 100.0 100.0 100.0 100.0 100.0Note.--Data may include 1080 tire cord and tire bead. Source: Compiled from GTIS/GTA based on partner country imports from Trinidad & Tobago using HS codes 7213.91, 7313.99, 7227.20, and 7227.90. Accessed on March 29, 2014 and not all reporting countries had provided 2013 data as of the date compiled.

IV‐41
Shipments, by type
Table IV‐27 presents data on ArcelorMittal Point Lisas’ total shipments, by type, during 2013. High/medium‐high carbon industrial/standard quality wire rod and low/medium‐low carbon industrial/standard quality wire rod together accounted for *** percent of ArcelorMittal Point Lisas’ total shipments during 2013. *** of the firm’s wire rod shipments during 2013 was accounted for by ***.
Table IV-27 Wire rod: Trinidadian producer ArcelorMittal Point Lisas’ total shipments, by type, 2013
* * * * * * *
THE INDUSTRY IN UKRAINE
Overview
The Commission identified three producers of wire rod in Ukraine during the time of the original investigations. The data presented in the Commission's final report during those original investigations were submitted by Krivorozhstal, which reported that in 2001 it accounted for *** percent of Ukrainian production of subject wire rod and *** percent of subject exports to the United States. Exports by this firm accounted for *** percent of U.S. imports of subject wire rod from Ukraine in 2001, according to official Commerce statistics.46
Six firms were identified as wire rod producers in Ukraine during the first five‐year reviews: ArcelorMittal Kryvyi Rih (successor firm to Krivorozhstal), Makeevka Metallurgical Integrated Plant (or Makiyivka Metallurgical Plant), Yenakiievskyi Metalurhiynyi Zavod VAT (or Yenakievo Metallurgical Plant), PJSC Donetskiy Steel Mill, PJSC Enakiivskiy Steel Mill, and PJSC Dniprovskiy Steel Mill. ln the first five‐year reviews, the Commission received a questionnaire response from the largest producer in Ukraine, ArcelorMittal Kryvyi Rih, accounting for an estimated *** percent of 2007 wire rod production in Ukraine. According to ***, there was no listed capacity for wire rod for any producer in Ukraine other than ArcelorMittal Kryvyi Rih at the time of the first five‐year reviews. Accordingly, the data presented on Ukrainian production of wire rod for the first five‐year reviews were believed to represent at least the majority of (if not all) production of wire rod in Ukraine.47
46 The following 2001 data were provided by Krivorozhstal in the original investigations: capacity (*** short tons); production (*** short tons); capacity utilization (*** percent); exports/shipments (*** percent); and inventories/shipments (*** percent). Staff Report, May 15, 2008 (INV‐FF‐058), table IV‐34.
47 The following 2007 data were provided by ArcelorMittal Kryvyi Rih in the first five‐year reviews: capacity (*** short tons); production (*** short tons); capacity utilization (*** percent); exports/shipments (*** percent); and inventories/shipments (*** percent). Staff Report, May 15, 2008 (INV‐FF‐058), table IV‐34.

IV‐42
The domestic interested parties indicated in their response to the Commission’s notice of institution in these current second five‐year reviews that there are three main producers of wire rod in Ukraine today (Makiyivka Metallurgical Plant (“Makiyivka”), ArcelorMittal Kryvyi Rih, and the Yenakievo Steel Group (formerly Yenakievo Metallurgical Plant). *** identifies four facilities with wire rod rolling capacity in Ukraine during 2013: ArcelorMittal Kryvyi Rih, Makeevsky Iron and Steel (“Makeevsky”), Donetsk Electrometallurgical Mill (“Donetsk”), and Euro Finance.48 Hearing testimony by Ukrainian respondent, however, indicates that only Yenakiieve Iron and Steel Works (“Yenakiieve”) and ArcelorMittal Kryvyi Rih currently produce wire rod in Ukraine.49
Both ArcelorMittal Kryvyi Rih and Yenakiieve responded to the Commission's foreign producer questionnaire in these second five‐year reviews. There were no reported exports of the subject merchandise to the United States by either firm during 2008‐13. According to ***, wire rod production in Ukraine during 2013 was *** short tons. Reported production by ArcelorMittal Kryvyi Rih and Yenakiieve combined was *** short tons, theoretically yielding full coverage of Ukrainian production during 2013 by the responding firms.
Table IV‐28 presents data published by *** on overall Ukrainian capacity, production, and consumption of wire rod. Also presented in the tabulation are calculated net exports/imports (i.e., production minus consumption).50 As previously indicated, the *** data are for four Ukrainian firms (ArcelorMittal Kryvyi Rih, Donetsk, Euro Finance, and Makeevsky).51
Table IV-28
Wire rod: Overall Ukrainian capacity, production, consumption, and calculated net exports/imports
* * * * * * *
Although the *** data show that capacity increased by *** short tons from 2010 to 2013 and projections indicate that the capacity to produce wire rod in Ukraine is expected to climb by *** in 2014, the additional capacity reported by *** is for firms that are not believed to be producers of wire rod in Ukraine (***). According to ***, there was an increase in the wire rod rolling capacity in Ukraine in the amount of ***
48 According to the company website for Donetsk, this firm appears to produce bar but not wire rod. Donetsk company website, http://www.mechel.com/sector/steel/demz/production/, accessed on May 5, 2014. No company websites were found for Makiyivka , Makeevsky, or Euro Finance.
49 The company representative for Yenakiieve explained that, in October 2010, Yenakiieve obtained a controlling interest in Makiyivka. Yenakiieve permanently decommissioned its own wire production facilities resulting in the permanent elimination of that production capacity and it resumed production of wire rod solely at facilities leased from Makiyivka in 2011. Hearing transcript, p. 160 (Dimitrova).
50 This calculation may differ from GTA data on exports and imports, primarily due to rounding. 51 The two responding producers in Ukraine (ArcelorMittal Kryvyi Rih and Yenakiieve) accounted for
*** percent of total wire rod rolling capacity and *** percent of wire rod production in Ukraine during 2013 as reported by the ***.

IV‐43
short tons during 2011‐12 ***. Another increase in the aggregate wire rod rolling capacity in the amount of *** short tons was reported for 2013 by ***.
According to ***, production of wire rod in Ukraine increased from 2009 to 2010 but fell thereafter. Consumption fluctuated during 2008‐13 within a range of *** short tons. Production and consumption are expected to increase in 2014 and 2015. Capacity reported by *** for 2013 was *** short tons, and production was *** short tons, or *** percent of published capacity. Ukrainian production of wire rod exceeded consumption during 2008‐13. *** projections for production and consumption in Ukraine indicate that it will continue to be a net exporter of wire rod during 2014‐15.
Operations on wire rod
Data provided by ArcelorMittal Kryvyi Rih and Yenakiieve concerning their wire rod operations in Ukraine during calendar years 2008‐13 are presented in table IV‐29. According to reported data, ArcelorMittal Kryvyi Rih was the larger of the two producers, accounting for *** percent of reported wire rod production in Ukraine in 2013, whereas Yenakiieve was the smaller of the two responding producers, accounting for *** percent of reported 2013 wire rod production in Ukraine.
Table IV-29 Wire rod: Ukrainian producers ArcelorMittal Kryvyi Rih and Yenakiieve’s capacity, production, shipments, and inventories, 2008-13
* * * * * * *
Capacity and production in Ukraine
ArcelorMittal Kryvyi Rih’s and Yenakiieve’s capacity to produce wire rod in Ukraine was based on operating *** hours per week and *** weeks per year. ArcelorMittal Kryvyi Rih’s wire rod capacity ***. Yenakiieve’s wire rod capacity ***. The firm reported no data for 2010, as its mill underwent “decommissioning” during 2010. Aggregate reported capacity for wire rod in Ukraine fell from 2008 to 2010, increased in 2011, and fell thereafter to a level that was *** percent higher than the level reported in 2008. Aggregate reported production fluctuated during 2008‐13, but was *** percent higher at *** short tons in 2013 than reported in 2008. Capacity utilization was *** percent during 2013 and ranged between *** and *** percent during 2008‐13.
In addition to the production of wire rod, ArcelorMittal Kryvyi Rih and Yenakiieve reported *** using shared equipment and machinery in its wire rod facilities in Ukraine. Table IV‐30 presents aggregate reported overall capacity and production of wire rod and other products produced on the same production equipment used to produce wire rod in Ukraine.

IV‐44
Table IV-30 Wire rod: Ukrainian producers ArcelorMittal Kryvyi Rih and Yenakiieve’s overall capacity, production, and capacity utilization, 2008-13
* * * * * * *
ArcelorMittal Kryvyi Rih and Yenakiieve estimated that wire rod accounted for *** and
*** percent of their 2013 total sales, respectively. The overall production data presented indicate that wire rod accounted for *** percent of the firms’ overall production on the same equipment as wire rod during 2008‐13. *** were reported by the firms to be constraints that set the limits on their production capacities. *** were the constraints that set the limit on Yenakiieve Steel’s ability to shift production capacity between products. ArcelorMittal Kryvyi Rih reported that it has ***.
In response to a request for information concerning any changes in the character of its operations, ArcelorMittal Kryvyi Rih indicated ***. Yenakiieve reported ***.
Yenakiieve supplemented its response with the following narrative: ***. Both responding Ukrainian producers indicated ***. The Ukrainian producers also
reported that they ***.
Shipments of wire rod produced in Ukraine
Aggregate total shipments of wire rod produced in Ukraine fluctuated during 2008‐13, but were *** percent higher in 2013 than reported in 2008. Exports accounted for the majority of the firms’ aggregate total shipments of wire rod, accounting for *** to *** percent of total shipments during 2008‐13. During 2013, internal consumption and home market shipments combined accounted for *** percent of total shipments of wire rod.
Aggregate export shipments of wire rod fluctuated during 2008‐13, but were higher in 2013 than in 2008. The firms reported that there were no exports of subject wire rod to the United States during 2008‐13. Principal *** markets for wire rod produced in Ukraine include ***. Principal *** markets include ***. *** export markets include ***. Detailed information on the export destinations for wire rod produced in Ukraine as published by GTIS/GTA is presented in table IV‐31.
Shipments, by type
Table IV‐32 presents aggregate data on total wire rod shipments reported by ArcelorMittal Kryvyi Rih and Yenakiieve, by type, during 2013. As the data indicate, high/medium‐high carbon industrial/standard quality wire rod and low/medium‐low carbon industrial/standard quality wire rod together accounted for *** percent of wire rod shipped by the Ukrainian producers during 2013.
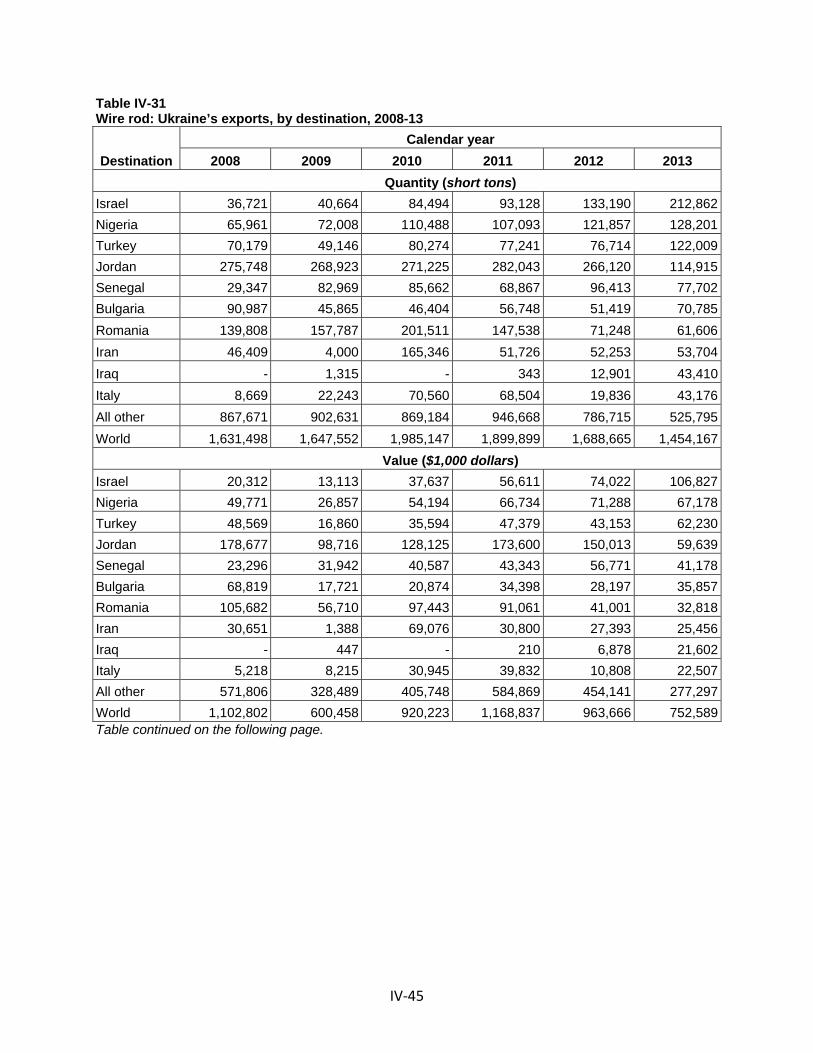
IV‐45
Table IV-31 Wire rod: Ukraine’s exports, by destination, 2008-13
Destination
Calendar year
2008 2009 2010 2011 2012 2013
Quantity (short tons)
Israel 36,721 40,664 84,494 93,128 133,190 212,862
Nigeria 65,961 72,008 110,488 107,093 121,857 128,201
Turkey 70,179 49,146 80,274 77,241 76,714 122,009
Jordan 275,748 268,923 271,225 282,043 266,120 114,915
Senegal 29,347 82,969 85,662 68,867 96,413 77,702
Bulgaria 90,987 45,865 46,404 56,748 51,419 70,785
Romania 139,808 157,787 201,511 147,538 71,248 61,606
Iran 46,409 4,000 165,346 51,726 52,253 53,704
Iraq - 1,315 - 343 12,901 43,410
Italy 8,669 22,243 70,560 68,504 19,836 43,176
All other 867,671 902,631 869,184 946,668 786,715 525,795
World 1,631,498 1,647,552 1,985,147 1,899,899 1,688,665 1,454,167
Value ($1,000 dollars)
Israel 20,312 13,113 37,637 56,611 74,022 106,827
Nigeria 49,771 26,857 54,194 66,734 71,288 67,178
Turkey 48,569 16,860 35,594 47,379 43,153 62,230
Jordan 178,677 98,716 128,125 173,600 150,013 59,639
Senegal 23,296 31,942 40,587 43,343 56,771 41,178
Bulgaria 68,819 17,721 20,874 34,398 28,197 35,857
Romania 105,682 56,710 97,443 91,061 41,001 32,818
Iran 30,651 1,388 69,076 30,800 27,393 25,456
Iraq - 447 - 210 6,878 21,602
Italy 5,218 8,215 30,945 39,832 10,808 22,507
All other 571,806 328,489 405,748 584,869 454,141 277,297
World 1,102,802 600,458 920,223 1,168,837 963,666 752,589 Table continued on the following page.

IV‐46
Table IV-31--Continued Wire rod: Ukraine’s exports, by destination, 2008-13
Destination
Calendar year
2008 2009 2010 2011 2012 2013
Unit value (per short ton)
Israel 553 322 445 608 556 502
Nigeria 755 373 490 623 585 524
Turkey 692 343 443 613 563 510
Jordan 648 367 472 616 564 519
Senegal 794 385 474 629 589 530
Bulgaria 756 386 450 606 548 507
Romania 756 359 484 617 575 533
Iran 660 347 418 595 524 474
Iraq - 340 - 612 533 498
Italy 602 369 439 581 545 521
All other 659 364 467 618 577 527
World 676 364 464 615 571 518
Share of quantity (percent)
Israel 2.3 2.5 4.3 4.9 7.9 14.6
Nigeria 4.0 4.4 5.6 5.6 7.2 8.8
Turkey 4.3 3.0 4.0 4.1 4.5 8.4
Jordan 16.9 16.3 13.7 14.8 15.8 7.9
Senegal 1.8 5.0 4.3 3.6 5.7 5.3
Bulgaria 5.6 2.8 2.3 3.0 3.0 4.9
Romania 8.6 9.6 10.2 7.8 4.2 4.2
Iran 2.8 0.2 8.3 2.7 3.1 3.7
Iraq - 0.1 - 0.0 0.8 3.0
Italy 0.5 1.4 3.6 3.6 1.2 3.0
All other 53.2 54.8 43.8 49.8 46.6 36.2
World 100.0 100.0 100.0 100.0 100.0 100.0 Note.-Data include grade 1080 tire cord and tire bead. Source: Compiled from GTIS/GTA reported to GTIS by the State Customs Committee of Ukraine (HS codes 7213.91, 7213.99, 7227.20, and 7227.90).
Table IV-32 Wire rod: Total shipments reported by Ukrainian producers ArcelorMittal Kryvyi Rih and Yenakiieve, by type, 2013
* * * * * * *

IV‐47
GLOBAL MARKET
Production
Global production of wire rod has grown considerably in recent years. According to one published source,52 global production increased by *** percent between 2009 and 2013 (table IV‐33). In terms of sheer volume, China, the world’s largest producer, accounted for the greatest production increase over this period, and it is forecasted to lead global production in the coming years as well. China accounted for *** percent of worldwide production in 2013. Production in China grew between 2009 and 2013 period from *** short tons to ***short tons, an increase of *** percent. Production growth in China is forecasted to *** thereafter from *** short tons in 2014 to *** short tons in 2018, an increase of *** percent. Data compiled by *** on historical, current, and projected global production of wire rod are presented in tables IV‐33 and IV‐34.53
Table IV-33
Wire rod: Global and regional production of wire rod, 2009-13
* * * * * * *
Table IV-34
Wire rod: Forecasts of global and regional production of wire rod, 2014-18
* * * * * * *
Consumption
U.S. producers indicated that demand for wire rod outside the United States has fluctuated or decreased since 2008, and anticipate these trends to continue (table IV‐35). Other market participants were more divided in their views. The majority of foreign producers noted that demand for wire rod in their home markets fell during the worldwide financial recession of 2008‐09 but has generally recovered and the majority of the foreign producers anticipate that demand will increase in their home markets.
52 ***.
53 Published sources of data for wire rod are believed to consist of carbon and alloy (other than stainless) steel wire rods including grade 1080 tire cord and tire bead wire rod. Data may also include tool steel, high nickel steel, ball bearing steel, and free machining steel products.

IV‐48
Table IV-35 Wire rod: Firms’ responses regarding demand outside the United States, by number of responding firms
Item Number of firms reporting
Increase No change Decrease Fluctuate Demand outside the United States since 2008: U.S. producers 0 1 3 4
Importers 6 5 1 7 Purchasers 9 1 7 1 Foreign producers 1 1 3 3
Demand in home market since 2008: Foreign producers 3 2 1 2 Anticipated demand outside the United States: U.S. producers 0 0 2 7
Importers 6 7 0 4 Purchasers 9 3 2 6 Foreign producers 5 2 0 1
Anticipated demand in home market: Foreign producers 7 1 0 0
Source: Compiled from data submitted in response to Commission questionnaires.
Data compiled by *** on historical, current, and forecast global consumption of wire rod are presented in tables IV‐36 through IV‐37. 54 Worldwide consumption of wire rod increased by *** percent between 2009 and 2013. Consumption in China grew during this period from *** short tons to *** short tons during this period, an increase of *** percent. Global consumption is forecast to continue to grow in the coming years, with the growth evenly distributed in all major markets. Consumption growth in China is forecasted to *** during 2014‐18 from *** short tons to *** short tons, an increase of *** percent.
Table IV-36
Wire rod: Global and regional apparent consumption of wire rod, 2009-13
* * * * * * *
Table IV-37
Wire rod: Forecasts of global and regional apparent consumption of wire rod, 2014-18
* * * * * * *
54 See Part II of this report for the individual perspectives of U.S. producers, importers, and purchasers on demand in the United States and in other markets.

IV‐49
Prices
The Commission asked producers, importers, and purchasers to compare market prices of wire rod in U.S. and non‐U.S. markets. Responding producers and importers indicated prices generally fluctuate with the price of raw materials in the market. As the price of scrap increases, the price of wire rod will increase.55
Six domestic producers were able to compare U.S. and non‐U.S. market prices, and reported that U.S. producer prices are generally higher than foreign producer prices.56 Some producers cited higher prices for attracting increasing imports to the U.S. market rather than foreign markets,57 and another specifically highlighted increasing import volumes from China and Mexico.58 One producer noted that prices in both the U.S. and even Canadian markets were being pushed down by Chinese imports.59 Another producer noted that Chinese prices are the lowest of any major market.60
Twelve importers were able to provide price comparisons between the United States and Canada, China, Japan, Korea, the Netherlands. In a general comparison, two importers reported that prices in the United States are higher, typically 12‐percent or $100 per ton, respectively.61 One importer described how prices are “generally the same” in both Canada and the United States, as these markets are integrated.62 Other importers mentioned that high‐quality grade wire rod imported from Japan is higher priced than the corresponding U.S. product,63 that Korean wire rod is cheaper by $200 per metric ton,64 and that wire rod originating from the Netherlands is comparable in price in both the U.S. and other foreign markets.65 In comparing prices between China and the United States, an importer noted that Chinese prices are lower by $68‐$80 per ton.66 Another importer reported that wire rod sells for $550 per metric ton in the Chinese market compared to over $800 per metric ton in the U.S. market.67
55 ***’s producer questionnaire responses, IV‐14; and ***’s importer questionnaire responses, III‐19.
56 ***’s producer questionnaire responses, IV‐22.
57 ***’s producer questionnaire responses, IV‐22.
58 ***’s producer questionnaire response, IV‐22.
59 ***’s producer questionnaire response, IV‐22.
60 ***’s producer questionnaire response, IV‐22.
61 ***’s importer questionnaire responses, III‐27.
62 ***’s importer questionnaire response, III‐27.
63 ***’s importer questionnaire response, III‐27.
64 ***’s importer questionnaire response, III‐27.
65 ***’s importer questionnaire response, III‐27.
66 ***’s importer questionnaire response, III‐ 27.
67 ***’s importer questionnaire response, III‐27.

IV‐50
Published price data are available from several reputable sources, although often such data are available by subscription only and cannot be reproduced without consent of their publisher. These data, however, are collected based on different product categories, timing, and commercial considerations, and thereby may not be directly comparable with each other. Moreover, such data are distinct from the pricing data presented in Part V of this report, which are collected directly from U.S. producers and U.S. importers via the Commission’s questionnaires according to precise product definitions.
As reported by MEPS, world prices for wire rod increased irregularly between January 2008 and March 2014, increasing from $*** per short ton to $*** per short ton during that time, but below the peak price of $*** per short ton in July 2008.68 Figure IV‐1 presents the average world price of wire rod between January 2008 and March 2014. Figure IV‐2 presents prices of wire rod by regions between January 2008 and March 2014.
Figure IV-1 Wire rod: Average world price per short ton for wire rod, January 2008-March 2014
* * * * * * * Figure IV-2 Wire rod: Prices per short ton by region, January 2008-March 2014
* * * * * * *
68 Original data are published in metric tons, and were converted to short tons using the following conversion factor: 1 metric ton = 1.1023 short tons. MEPS, World Carbon Steel Product Prices, found at http://www.meps.co.uk, retrieved on March 19‐25, 2014. Prices are an arithmetic average of the low transaction values identified in the EU, Asia, and North America, converted into U.S. dollars.

IV‐51
As presented in table IV‐38, country‐specific monthly transaction prices for wire rod are also compiled by MEPS,69 and show monthly price fluctuations across major producing countries. According to data compiled by MEPS, U.S. negotiated transaction prices for U.S.‐produced wire rod rose since the beginning of 2008 to a peak in July and August of that year, before bottoming out in May 2009. Wire rod subsequently rose until March 2011, but not as high as the peak back in summer of 2008, and declined through November 2013. Between December 2013 and March 2014, prices rose to regain the level of December 2010.
Table IV-38
Wire rod: Negotiated transaction prices (ex-mill) for wire rod, by country and by month,
January 2008-March 2014
* * * * * * *
Prices in Canada closely followed U.S. prices, with the price differential ranging between $*** below U.S. prices in November 2008 and $*** above U.S. prices in December 2012. The gap between U.S. and Canadian prices has continued to widen since the narrowest difference ($*** below U.S. prices) in November 2013 through March 2014.
In Europe, major steel market price trends for wire rod also followed those in the United States, but with a higher average peak values in July and August 2008 ($*** above the U.S. price level). In contrast, the subsequent price peaked occurred 2 months later (in May 2011) and at lower average values ($***) compared to the U.S. price peak back in March 2011. In the first three months of 2014, European average prices were $*** below those in the United States for wire rod.
With regard to Asian markets, Chinese market prices were consistently below, by $*** per short ton, U.S. wire rod prices, throughout January 2008 to March 2014. Korean wire rod market prices generally were below those in the United States, with notable exceptions during July‐December 2010 (on average, $*** above U.S. prices) and November 2013‐February 2014 (on average, $*** above U.S. prices). Japanese market prices generally exceeded U.S. prices in mid‐2009 through mid‐2012, fluctuating from $*** above U.S. prices to $*** below U.S. prices. On average, Japanese market prices were $*** above U.S. prices over the January 2008‐March 2014 period.
69 MEPS, International Steel Review, January 2005‐March 2014 editions, p. 1.

IV‐52
Additional global supply and demand factors
Worldwide, the majority of wire rod rolling mill capacity during 2008‐13 resides in China, with *** percent, by ***’s estimate. Apparent rolling mill capacity in China grew between 2008 and 2013 from *** short tons to *** short tons, an increase of *** percent. These capacity figures, while large, are less than published production levels.70 Outside of China, *** percent of wire rod rolling mill capacity during this period resides in Europe; *** in Asia, other than China; *** in Central and South America; *** percent in North America; and *** percent in the CIS. Table IV‐39 presents regional rolling mill capacities for wire rod and their respective shares of global capacity.
Table IV-39
Wire rod: Global and regional rolling mill capacities, 2008-13, and forecasts of global and regional rolling mill capacities, 2014-15
* * * * * * *
With respect to trade in wire rod, both imports and exports worldwide grew between 2008 and 2013. As shown in table IV‐40, between 2008 and 2013,71 worldwide wire rod imports increased by 10.3 percent. Exports have similarly grown, as shown in table IV‐41; between 2008 and 2013, worldwide wire rod exports increased by 11.3 percent. The global export data show that China is the world’s largest exporter of wire rod. Although global exports of wire rod from China fell by 78.8 percent from 2008 to 2009, such exports grew by 643.0 percent from 2009 to 2013. Detailed information on the export destinations for wire rod produced in China as published by GTIS/GTA is presented in table IV‐42.
70 Domestic producers— ArcelorMittal USA, Evraz Pueblo, Gerdau, and Keystone— noted that ***. Domestic producers’ prehearing brief, footnote 31, pp. 59‐60.
71 Import and export data for 2013 were not yet available for all countries that report to GTIS/GTA.
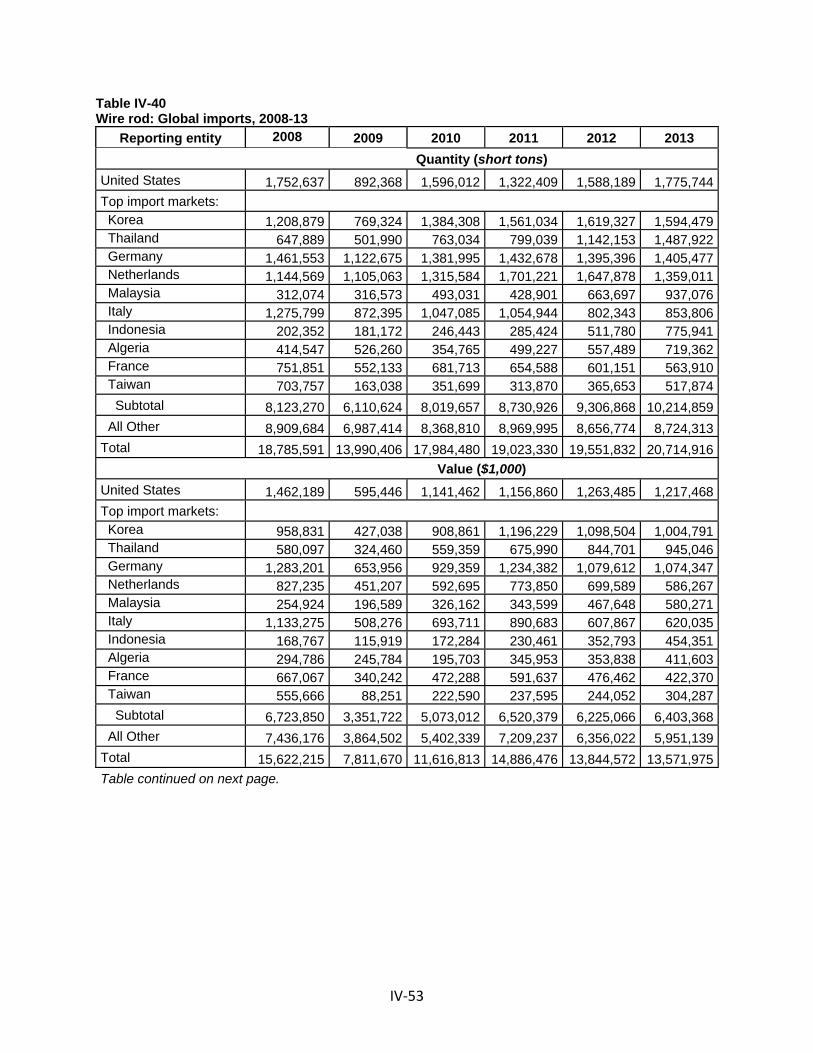
IV‐53
Table IV-40 Wire rod: Global imports, 2008-13
Reporting entity 2008 2009 2010 2011
2012 2013
Quantity (short tons)
United States 1,752,637 892,368 1,596,012 1,322,409 1,588,189 1,775,744 Top import markets:
Korea 1,208,879 769,324 1,384,308 1,561,034 1,619,327 1,594,479 Thailand 647,889 501,990 763,034 799,039 1,142,153 1,487,922 Germany 1,461,553 1,122,675 1,381,995 1,432,678 1,395,396 1,405,477 Netherlands 1,144,569 1,105,063 1,315,584 1,701,221 1,647,878 1,359,011 Malaysia 312,074 316,573 493,031 428,901 663,697 937,076 Italy 1,275,799 872,395 1,047,085 1,054,944 802,343 853,806 Indonesia 202,352 181,172 246,443 285,424 511,780 775,941 Algeria 414,547 526,260 354,765 499,227 557,489 719,362 France 751,851 552,133 681,713 654,588 601,151 563,910 Taiwan 703,757 163,038 351,699 313,870 365,653 517,874 Subtotal 8,123,270 6,110,624 8,019,657 8,730,926 9,306,868 10,214,859 All Other 8,909,684 6,987,414 8,368,810 8,969,995 8,656,774 8,724,313 Total 18,785,591 13,990,406 17,984,480 19,023,330 19,551,832 20,714,916
Value ($1,000)
United States 1,462,189 595,446 1,141,462 1,156,860 1,263,485 1,217,468 Top import markets:
Korea 958,831 427,038 908,861 1,196,229 1,098,504 1,004,791 Thailand 580,097 324,460 559,359 675,990 844,701 945,046 Germany 1,283,201 653,956 929,359 1,234,382 1,079,612 1,074,347 Netherlands 827,235 451,207 592,695 773,850 699,589 586,267 Malaysia 254,924 196,589 326,162 343,599 467,648 580,271 Italy 1,133,275 508,276 693,711 890,683 607,867 620,035 Indonesia 168,767 115,919 172,284 230,461 352,793 454,351 Algeria 294,786 245,784 195,703 345,953 353,838 411,603 France 667,067 340,242 472,288 591,637 476,462 422,370 Taiwan 555,666 88,251 222,590 237,595 244,052 304,287 Subtotal 6,723,850 3,351,722 5,073,012 6,520,379 6,225,066 6,403,368 All Other 7,436,176 3,864,502 5,402,339 7,209,237 6,356,022 5,951,139 Total 15,622,215 7,811,670 11,616,813 14,886,476 13,844,572 13,571,975 Table continued on next page.

IV‐54
Table IV-40--Continued Wire rod: Global imports, 2008-13
Reporting entity 2008 2009 2010 2011
2012 2013
Unit value (per short ton)
United States $834 $667 $715 $875 $796 $686 Top import markets:
Korea 793 555 657 766 678 630 Thailand 895 646 733 846 740 635 Germany 878 582 672 862 774 764 Netherlands 723 408 451 455 425 431 Malaysia 817 621 662 801 705 619 Italy 888 583 663 844 758 726 Indonesia 834 640 699 807 689 586 Algeria 711 467 552 693 635 572 France 887 616 693 904 793 749 Taiwan 790 541 633 757 667 588 Subtotal 828 549 633 747 669 627 All Other 835 553 646 804 734 682 Total 832 558 646 783 708 655 Note.‐‐HS codes included: 7213.91, 7213.99, 7227.20, and 7227.90. Source: Reported by GTIS/GTA.

IV‐55
Table IV-41 Wire rod: Global exports, 2008-13
Reporting entity 2008 2009 2010 2011
2012 2013
Quantity (short tons)
United States 145,815 151,913 177,046 191,942 167,925 149,341 Top 10 markets: China 5,545,712 1,174,400 2,524,968 3,210,167 6,087,504 8,725,688 Germany 2,264,025 1,701,298 2,069,053 2,193,541 2,274,289 2,042,663 Japan 1,190,846 966,694 1,575,939 1,599,688 1,463,040 1,788,215 Ukraine 1,631,483 1,647,537 1,985,129 1,899,882 1,688,650 1,454,154 Czech Republic 621,843 638,757 772,511 871,262 948,862 938,712 Spain 694,838 678,691 685,098 721,932 937,992 792,624 Turkey 850,952 1,143,459 1,096,805 1,239,062 985,226 727,076 Korea 473,690 635,359 502,623 504,893 589,268 716,841 United Kingdom 638,388 549,777 746,309 612,855 669,620 679,671 Italy 684,873 588,166 610,650 603,394 644,959 663,238 Subtotal 14,596,650 9,724,139 12,569,085 13,456,675 16,289,411 18,528,882 All other 7,228,898 7,054,274 8,259,399 8,024,719 6,463,567 5,770,590 Total 21,971,363 16,930,326 21,005,530 21,673,337 22,920,904 24,448,813
Value ($1,000)
United States 117,814 111,961 143,278 162,572 160,429 143,198 Top 10 markets China 4,314,943 564,568 1,393,123 2,108,971 3,404,928 4,392,955 Germany 1,939,840 940,555 1,325,841 1,774,878 1,565,412 1,379,100 Japan 1,053,210 712,525 1,345,667 1,640,268 1,403,642 1,473,109 Ukraine 1,102,802 600,458 920,223 1,168,837 963,666 752,589 Czech Republic 527,673 337,341 472,244 670,219 627,811 596,301 Spain 637,486 384,465 466,207 620,235 658,203 553,173 Turkey 576,164 472,738 551,351 774,095 573,829 398,188 Korea 356,397 363,988 363,719 431,267 443,799 472,712 United Kingdom 529,219 283,599 455,020 482,787 457,221 437,341 Italy 612,391 315,212 383,484 488,439 440,574 431,579 Subtotal 11,650,125 4,975,449 7,676,878 10,159,996 10,539,085 10,887,048 All other 5,759,194 3,439,548 4,666,643 5,844,100 4,398,537 3,719,079 Total 17,527,133 8,526,958 12,486,799 16,166,668 15,098,051 14,749,325 Table continued on next page.

IV‐56
Table IV-41--Continued Wire rod: Global exports, 2008-13
Reporting entity 2008 2009 2010 2011
2012 2013
Unit value (per short ton)
United States $808 $737 $809 $847 $955 $959 Top 10 markets China 778 481 552 657 559 503 Germany 857 553 641 809 688 675 Japan 884 737 854 1,025 959 824 Ukraine 676 364 464 615 571 518 Czech Republic 849 528 611 769 662 635 Spain 917 566 680 859 702 698 Turkey 677 413 503 625 582 548 Korea 752 573 724 854 753 659 United Kingdom 829 516 610 788 683 643 Italy 894 536 628 809 683 651 Subtotal 798 512 611 755 647 588 All other 797 488 565 728 681 644 Total 798 504 594 746 659 603 Note.‐‐HS codes included: 7213.91, 7213.99, 7227.20, and 7227.90. Source: Reported by GTIS/GTA.

IV‐57
Table IV-42 Wire rod: Exports from China, by destination, 2008-13
Destination 2008 2009 2010 2011
2012 2013
Quantity (short tons)
South Korea 915,350 480,403 926,675 1,108,333 1,271,870 1,222,563 Thailand 443,224 167,629 370,103 467,676 834,352 1,112,951 Vietnam 447,015 149,758 277,148 250,939 429,878 754,186 United States 426,677 6,863 11,079 1,316 332,368 691,899 Indonesia 104,309 8,147 73,489 106,088 420,893 610,565 Philippines 311,466 20,817 138,375 170,531 315,083 573,987 Malaysia 129,140 44,607 157,091 187,347 367,269 492,963 Singapore 123,554 20 42,371 28,195 177,378 325,377 Japan 197,356 159,945 269,283 307,547 396,600 286,352 Saudi Arabia 222,765 1,191 15,340 61,904 285,353 256,039 All other 2,224,855 135,019 244,015 520,290 1,256,460 2,398,807 World 5,545,712 1,174,400 2,524,968 3,210,167 6,087,504 8,725,688 Value ($1,000)
South Korea 689,233 222,442 502,085 724,949 737,939 632,065 Thailand 349,718 83,993 209,331 303,208 471,708 566,552 Vietnam 295,595 70,263 151,498 165,516 242,043 379,269 United States 361,597 3,449 6,285 1,245 178,155 340,534 Indonesia 75,587 4,190 42,067 71,627 239,090 317,000 Philippines 221,407 12,119 72,786 108,589 169,625 274,805 Malaysia 107,857 21,754 85,400 122,797 207,593 256,762 Singapore 90,518 14 22,115 17,625 97,847 161,012 Japan 139,683 73,335 145,618 203,228 225,966 145,433 Saudi Arabia 186,801 635 9,384 41,619 156,234 128,544 All other 1,796,947 72,375 146,554 348,569 678,728 1,190,979 World 4,314,943 564,568 1,393,123 2,108,971 3,404,928 4,392,955 Table continued on next page.

IV‐58
Table IV-42--Continued Wire rod: Exports from China, by destination, 2008-13
Destination 2008 2009 2010 2011
2012 2013
Unit value (per short ton)
South Korea 753 463 542 654 580 517Thailand 789 501 566 648 565 509Vietnam 661 469 547 660 563 503United States 847 503 567 947 536 492Indonesia 725 514 572 675 568 519Philippines 711 582 526 637 538 479Malaysia 835 488 544 655 565 521Singapore 733 680 522 625 552 495Japan 708 458 541 661 570 508Saudi Arabia 839 533 612 672 548 502All other 808 536 601 670 540 496 World 778 481 552 657 559 503 Share of quantity (percent) South Korea 16.5 40.9 36.7 34.5 20.9 14.0Thailand 8.0 14.3 14.7 14.6 13.7 12.8Vietnam 8.1 12.8 11.0 7.8 7.1 8.6United States 7.7 0.6 0.4 0.0 5.5 7.9Indonesia 1.9 0.7 2.9 3.3 6.9 7.0Philippines 5.6 1.8 5.5 5.3 5.2 6.6Malaysia 2.3 3.8 6.2 5.8 6.0 5.6Singapore 2.2 0.0 1.7 0.9 2.9 3.7Japan 3.6 13.6 10.7 9.6 6.5 3.3Saudi Arabia 4.0 0.1 0.6 1.9 4.7 2.9All other 40.1 11.5 9.7 16.2 20.6 27.5 World 100.0 100.0 100.0 100.0 100.0 100.0 Note.‐‐HS codes included: 7213.91, 7213.99, 7227.20, and 7227.90. Source: Reported by GTIS/GTA.

V‐1
PART V: PRICING DATA
FACTORS AFFECTING PRICES
Raw material costs
The primary inputs used in the production of wire rod are billets produced from steel scrap, natural gas, and electricity. Different types of steel scrap are used in different types of wire rod, with busheling scrap used to produce higher‐end product and heavy melt used to produce less‐specialized wire rod.1 As discussed in greater detail in Part III of this report, raw materials as a share of cost of goods sold (“COGS”) ranged from 60.0 percent to 72.0 percent, with a weighted average of 67.2 percent during 2008‐13.
Steel scrap prices fluctuated between January 2008 and December 2013, peaking during the last week of July 2008 and then falling to a period low in the second week of November 2008 (figure V‐1). Prices of all three steel scrap materials increased irregularly from the end of 2008 through the end of 2010 and then continued to fluctuate, decreasing slightly from the first week of January 2011 through the last week of December 2013.
Figure V-1
U.S. ferrous scrap prices: Weekly scrap prices, January 2008-March 2014
Source: American Metal Market LLC.
1 Carbon and Certain Alloy Steel Wire Rod From Brazil, Canada, Germany, Indonesia, Mexico, Moldova, Trinidad and Tobago, Turkey, and Ukraine: Investigation Nos. 701‐TA‐417 and 731‐TA‐953, 954, 957‐959, 961, and 962 (Review), USITC Publication 4014, June 2008, p. V‐1.
0
100
200
300
400
500
600
700
800
900
1000
Do
llars
per
sh
ort
to
n
Shredded auto scrap No. 1 heavy melt No. 1 busheling

V‐2
The majority of producers reported that raw material costs are the primary factor in pricing wire rod. However, three producers reported that although raw material costs have been increasing, they have been unable to recover those costs due to low‐priced wire rod imports, primarily from China. The majority of producers (8 of 10) reported that they expect steel scrap costs to continue fluctuating monthly; three of these producers expect raw material costs to trend upward.
Energy prices have also fluctuated since 2008; however, the price fluctuations for natural gas prices were more pronounced than those for electricity (figure V‐2). Overall, U.S. natural gas prices decreased during the period.2 U.S. natural gas prices peaked in mid‐2008 and then fell steeply until October 2009 when prices began to rise. Prices of natural gas decreased irregularly between January 2010 and May 2012, and then increased irregularly through December 2013 and into 2014. Electricity process fluctuated seasonally but with no significant net changes.3
Figure V-2
U.S. natural gas and electricity prices for industrial customers, monthly, January 2008-February 2014
Source: U.S. Energy Information Administration, http://www.eia.doe.gov, retrieved on May 6, 2014.
2 Annual U.S. natural gas prices for industrial customers fell 51.7 percent from $9.65 per thousand cubic feet in 2008 to $4.66 per thousand cubic feet in 2013.
3 Average annual electricity prices for industrial customers fell 1/100 cent from 6.83 cents per kilowatt‐hour to 6.82 cents per kilowatt‐hour between 2008 and 2013.
0.00
1.00
2.00
3.00
4.00
5.00
6.00
7.00
8.00
9.00
0.00
2.00
4.00
6.00
8.00
10.00
12.00
14.00
2008 2009 2010 2011 2012 2013 2014
Cen
ts p
er k
ilow
att-
ho
ur
Do
llars
per
th
ou
san
d c
ub
ic f
eet
U.S. natural gas industrial price Electricity industrial price

V‐3
Transportation costs to the U.S. market
Overseas transportation costs have declined overall since 2008. One index often used as a broad measure of overseas shipping costs is the Baltic Dry Index.4 Increasing from 10,000 at the beginning of 2008 to its peak of more than 11,500 by the first half of 2008, the index had fallen to under 1,000 in the beginning of 2009 and did not rise above 5,000 through the rest of the period (2009‐20013).
Transportation costs for wire rod shipped from subject countries to the United States averaged 8.8 percent for Brazil, 2.4 percent for Mexico, and 9.2 percent for Trinidad and Tobago during 2008‐13.5 6 These estimates were derived from official import data and represent the transportation and other charges on imports.7 8
The majority of importers (19 of 25) reported that the exporter arranged international transportation to the customer.9 Four foreign producers from Brazil, Indonesia, Mexico, and Trinidad and Tobago reported that *** arranged transportation. Two of three Mexican producers and both Ukrainian producers reported that *** arranged transportation. Three foreign producers reported the cost of shipping wire rod to the United States in 2013; the Brazilian producer reported that transportation cost was $*** per short ton; the Mexican producer reported that transportation costs was $*** per short ton; and the Indonesian
4 The Baltic Dry Index is “a shipping and trade index created by the London‐based Baltic Exchange that measures changes in the cost to transport raw materials such as metals, grains and fossil fuels by sea. The Baltic Exchange directly contacts shipping brokers to assess price levels for a given route, product to transport and time to delivery (speed). The Baltic Dry Index is a composite of three sub‐indexes that measure different sizes of dry bulk carriers (merchant ships) ‐ Capesize, Supramax and Panamax. Multiple geographic routes are evaluated for each index to give depth to the index's composite measurement. It is also known as the ‘Dry Bulk Index’.” Found at http://www.investopedia.com/terms/b/baltic_dry_index.asp, retrieved May 8, 2014.
5 Trinidad and Tobago data are based on 2008 import data. 6 There were no imports of subject product from Indonesia, Moldova, and Ukraine between 2008 and
2013. 7 The estimated transportation costs were obtained by comparing the customs and c.i.f. values for all
years combined (2008‐13) for HTS subheadings 7213.91.3011, 7213.91.3015, 7213.91.3020, 7213.91.3092, 7213.91.3093, 7213.91.4500, 7213.91.6000, 7213.99.0030, 7213.99.0090, 7227.20.0000, 7227.20.0030, 7227.20.0080, 7227.90.6010, 7227.90.6020, 7227.90.6080, and 7227.90.6085.
8 In the original investigations, transportation costs for wire rod were estimated using official import data in 2001. Transportation costs averaged 14.4 percent for Brazil, 10.1 percent for Indonesia, 8.9 percent for Mexico, 11.6 percent for Moldova, 8.4 percent for Trinidad and Tobago, and 11.7 percent for Ukraine. Carbon and Certain Alloy Steel Wire Rod from Brazil, Canada, Germany, Indonesia, Mexico, Moldova, Trinidad and Tobago, Turkey, and Ukraine, Inv. Nos. 701‐TA‐417‐421 and 731‐TA‐953, 954, 956‐959, 961, and 962 (Final), USITC Staff Report, p. V‐1.
9 Seven importers reported that the importer arranged international transportation; however, no importer reported the cost of shipping wire rod to the United States.

V‐4
producer reported that the cost was $*** per short ton. The Ukrainian respondent estimated that transportation and logistical costs would be $*** per short ton.10 11
U.S. inland transportation costs
All nine responding U.S. producers and 8 of 12 responding importers reported that they typically arrange transportation to their customers. U.S. producers reported that their U.S. inland transportation costs averaged 5 to 8 percent while importers reported costs of 1 to 14 percent.
PRICING PRACTICES
Pricing methods
As presented in table V‐1, U.S. producers and importers sell primarily on transaction‐by‐transaction negotiations. However, firms also reported using contracts, set price lists, and other methods including indexing prices to scrap and other raw material costs as well as current market conditions. The majority of producers (9 of 12) and importers (17 of 21) reported that they consider the cost of scrap steel when setting prices for wire rod. Three producers and three importers reported that they use a separate surcharge for scrap prices.
Table V-1 Wire rod: U.S. producers’ and importers’ reported price setting methods, by number of responding firms1
Method U.S. producers Importers Transaction-by-transaction 8 19 Contract 4 6 Set price list 0 1 Other 4 2
1 The sum of responses down may not add up to the total number of responding firms as each firm was instructed to check all applicable price setting methods employed. Source: Compiled from data submitted in response to Commission questionnaires.
10 This estimate includes $*** for inland U.S. freight costs and $*** for related lead time and other discounts. Yenakiieve’s posthearing brief, pp. 14‐15.
11 Both domestic interested parties disagree with Yenakiieve’s freight estimates. Hearing transcript, p. 107 (Price). Nucor suggests that it would cost approximately $*** per short ton to ship wire rod to the United States. Nucor’s posthearing brief, p.19.

V‐5
As shown in table V‐2, U.S. producers and importers reported their 2013 U.S. commercial shipments of wire rod by type of sale. U.S. producers reported selling the majority of their wire rod split between short‐term contracts and the spot market while both importers of wire rod from Mexico reported selling *** of their product in ***.12
Table V-2
Wire rod: U.S. producers’ and importers’ shares of U.S. commercial shipments by type of sale, 2013
Type of sale U.S. producers Importers of product from
Mexico
Long-term contracts 3.5 ***
Short-term contracts 51.2 ***
Spot sales 45.3 ***
Total 100.0 100.0
Note.--Because of rounding, figures may not add to the totals shown. Source: Compiled from data submitted in response to Commission questionnaires.
The majority of purchasers (28 of 35) reported that they purchase product monthly, 5 purchase weekly, and 5 purchase daily, 4 purchase quarterly, and one purchases annually.13 All 35 responding purchasers reported that they did not expect their purchasing patterns to change in the next two years. Most (25 of 34) purchasers contact 1 to 5 suppliers before making a purchase.
Sales terms and discounts
U.S. producers and importers quote prices both on an f.o.b. and a delivered basis. Four of 10 U.S. producers and 20 of 24 importers reported that they sold on a delivered basis. The majority of producers (6 of 10) and importers (21 of 24) do not offer discounts. Two producers and two importers reported that they offer quantity‐based discounts and two producers and one importer reported that they offer total volume discounts. Five producers reported sales terms of ½ percent 10 net 30, three reported net 30 days, two reported 1 percent 10 net 30 days, and one reported ¾ percent 10 net 30 days. In contrast, 17 importers reported net 30 days, seven reported net 60 days, two reported 2/10 net 30 days, and one reported 1 percent 10 net 30 days.
Price leadership
Purchasers reported that Charter Steel, Keystone Steel & Wire, Nucor, and Gerdau were price leaders.
12 No importers from other subject countries reported their sale types. 13 Four purchasers indicated that their purchasing frequency varied throughout the year.

V‐6
PRICE DATA
The Commission requested U.S. producers and importers to provide quarterly data for the total quantity and f.o.b. value of the following wire rod products shipped to unrelated U.S. customers during 2008‐13.
Product 1.—Industrial quality wire rod, grade C1006, 5.5 mm (7/32 inch) through 12 mm (15/32 inch) in diameter, for hangers, chain link fencing, collated nails and staples, grates, and other formed products (in green condition, e.g., NOT cleaned, coated, etc.).
Product 2.--Industrial quality wire rod, grade C1008 through C1010, 5.5 mm (7/32 inch) through 12 mm (15/32 inch) in diameter, for hangers, chain link fencing, collated nails and staples, grates, and other formed products (in green condition, e.g., NOT cleaned, coated, etc.).
Product 3.—Mesh quality wire rod, grades C1006 through C1015, 5.5 mm (7/32 inch) through 14 mm (9/16 inch) in diameter, for the manufacturing of concrete reinforcement products such as wire for A-82 applications (in green condition, e.g., NOT cleaned, coated, etc.).
Product 4.—Grades C1050 through C1070, 5.5 mm (7/32 inch) through 6.5 mm (1/4 inch) in diameter, for spring applications excluding valve spring (in green condition, e.g., NOT cleaned, coated, etc.).
Nine U.S. producers and two importers of wire rod from Mexico provided usable pricing data for sales of the requested products, although not all firms reported pricing for all products for all quarters.14 Pricing data reported by these firms accounted for approximately 31.0 percent of U.S. producers’ shipments of product and *** percent of U.S. shipments of subject imports from Mexico during 2008‐13. Price data for products 1‐4 are presented in tables V‐3 to V‐6 and figures V‐3 to V‐6.
14 Two importers, ***, provided price data for sales of the requested products. In addition, price data for Deacero’s U.S. imports of smaller diameter wire rod from Mexico were reported and are presented separately in appendix F.

V‐7
Table V-3
Wire rod: Weighted-average f.o.b. prices and quantities of domestic and imported product 11 and margins of underselling/(overselling), by quarters, January 2008-December 2013
Period
United States Mexico Price
(per short ton) Quantity
(short tons) Price
(per short ton) Quantity
(short tons) Margin
(percent) 2008: Jan.-Mar. $629.93 66,223 -- 0 --
Apr.-June 832.84 80,992 -- 0 --
July-Sept. 968.10 67,422 -- 0 --
Oct.-Dec. 765.95 33,674 -- 0 --2009: Jan.-Mar. 587.37 31,373 -- 0 --
Apr.-June 499.70 30,834 -- 0 --
July-Sept. 527.86 70,119 -- 0 --
Oct.-Dec. 538.35 77,718 -- 0 --2010: Jan.-Mar. 582.31 55,887 -- 0 --
Apr.-June 649.32 56,231 $*** *** ***
July-Sept. 621.07 49,317 *** *** ***
Oct.-Dec. 598.35 66,348 -- 0 --2011: Jan.-Mar. 696.23 52,619 -- 0 --
Apr.-June 744.55 52,991 -- 0 --
July-Sept. 746.72 55,490 -- 0 --
Oct.-Dec. 726.84 57,352 *** *** ***2012: Jan.-Mar. 740.49 51,424 *** *** ***
Apr.-June 742.20 50,288 *** *** ***
July-Sept. 665.61 51,449 *** *** ***
Oct.-Dec. 647.02 47,934 -- 0 --2013: Jan.-Mar. 661.33 52,525 -- 0 --
Apr.-June 661.06 57,184 -- 0 --
July-Sept. 647.37 39,538 -- 0 --
Oct.-Dec. 623.74 60,619 -- 0 --1 Product 1: Industrial quality wire rod, grade C1006, 5.5 mm (7/32 inch) through 12 mm (15/32 inch) in diameter, for hangers, chain link fencing, collated nails and staples, grates, and other formed products (in green condition, e.g., NOT cleaned, coated, etc.). Source: Compiled from data submitted in response to Commission questionnaires.

V‐8
Table V-4
Wire rod: Weighted-average f.o.b. prices and quantities of domestic and imported product 21 and margins of underselling/(overselling), by quarters, January 2008-December 2013
Period
United States Mexico Price
(per short ton) Quantity
(short tons) Price
(per short ton) Quantity
(short tons) Margin
(percent) 2008: Jan.-Mar. $608.01 112,341 -- 0 --
Apr.-June 803.18 104,554 $*** *** ***
July-Sept. 983.72 96,361 -- 0 --
Oct.-Dec. 827.86 24,431 *** *** ***2009: Jan.-Mar. 571.40 26,070 *** *** ***
Apr.-June 500.46 76,105 *** *** ***
July-Sept. 527.13 100,010 *** *** ***
Oct.-Dec. 536.43 87,642 *** *** ***2010: Jan.-Mar. 545.32 105,556 *** *** ***
Apr.-June 592.48 133,320 *** *** ***
July-Sept. 593.19 90,253 *** *** ***
Oct.-Dec. 596.34 78,875 *** *** ***2011: Jan.-Mar. 682.67 124,344 -- 0 --
Apr.-June 725.59 147,345 -- 0 --
July-Sept. 725.42 124,031 -- 0 --
Oct.-Dec. 710.89 136,296 *** *** ***2012: Jan.-Mar. 719.16 130,660 *** *** ***
Apr.-June 716.01 126,868 *** *** ***
July-Sept. 651.67 108,924 *** *** ***
Oct.-Dec. 636.10 80,176 -- 0 --2013: Jan.-Mar. 644.23 109,879 -- 0 --
Apr.-June 661.44 96,010 -- 0 --
July-Sept. 630.02 82,624 -- 0 --
Oct.-Dec. 623.65 82,123 *** *** ***1 Product 2: Industrial quality wire rod, grade C1008 through C1010, 5.5 mm (7/32 inch) through 12 mm (15/32 inch) in diameter, for hangers, chain link fencing, collated nails and staples, grates, and other formed products (in green condition, e.g., NOT cleaned, coated, etc.). Source: Compiled from data submitted in response to Commission questionnaires.

V‐9
Table V-5
Wire rod: Weighted-average f.o.b. prices and quantities of domestic and imported product 31 and margins of underselling/(overselling), by quarters, January 2008-December 2013
Period
United States Mexico Price
(per short ton) Quantity
(short tons) Price
(per short ton) Quantity
(short tons) Margin
(percent) 2008: Jan.-Mar. $600.10 157,970 -- 0 --
Apr.-June 793.82 145,963 -- 0 --
July-Sept. 999.38 123,287 -- 0 --
Oct.-Dec. 807.31 55,134 -- 0 --2009: Jan.-Mar. 603.57 38,034 -- 0 --
Apr.-June 505.46 74,545 -- 0 --
July-Sept. 522.94 99,487 $*** *** ***
Oct.-Dec. 540.38 67,544 -- 0 --2010: Jan.-Mar. 573.33 97,267 -- 0 --
Apr.-June 646.31 91,568 *** *** ***
July-Sept. 627.89 91,037 -- 0 --
Oct.-Dec. 612.42 74,798 *** *** ***2011: Jan.-Mar. 681.09 108,039 -- 0 --
Apr.-June 731.76 102,588 -- 0 --
July-Sept. 737.61 101,646 -- 0 --
Oct.-Dec. 712.69 117,620 *** *** ***2012: Jan.-Mar. 723.55 142,543 *** *** ***
Apr.-June 717.04 128,694 *** *** ***
July-Sept. 656.06 132,341 *** *** ***
Oct.-Dec. 629.73 103,770 -- 0 --2013: Jan.-Mar. 641.09 122,648 -- 0 --
Apr.-June 657.91 125,272 -- 0 --
July-Sept. 630.92 109,866 -- 0 --
Oct.-Dec. 621.26 96,799 *** *** ***1 Product 3: Mesh quality wire rod, grades C1006 through C1015, 5.5 mm (7/32 inch) through 14 mm (9/16 inch) in diameter, for the manufacturing of concrete reinforcement products such as wire for A-82 applications (in green condition, e.g., NOT cleaned, coated, etc.). Source: Compiled from data submitted in response to Commission questionnaires.

V‐10
Table V-6
Wire rod: Weighted-average f.o.b. prices and quantities of domestic and imported product 41 and margins of underselling/(overselling), by quarters, January 2008-December 2013
Period
United States Mexico Price
(per short ton) Quantity
(short tons) Price
(per short ton) Quantity
(short tons) Margin
(percent) 2008: Jan.-Mar. $627.11 17,631 -- 0 --
Apr.-June 887.76 22,243 -- 0 --
July-Sept. 1,104.35 19,659 -- 0 --
Oct.-Dec. 923.51 12,244 -- 0 --2009: Jan.-Mar. 643.94 9,758 -- 0 --
Apr.-June 559.51 12,149 -- 0 --
July-Sept. 577.72 15,681 -- 0 --
Oct.-Dec. 589.57 16,120 -- 0 --2010: Jan.-Mar. 638.25 21,382 -- 0 --
Apr.-June 698.52 25,649 $*** *** ***
July-Sept. 709.34 11,310 *** *** ***
Oct.-Dec. 681.55 13,490 -- 0 --2011: Jan.-Mar. 745.64 22,551 -- 0 --
Apr.-June 791.11 28,115 -- 0 --
July-Sept. 794.67 19,343 -- 0 --
Oct.-Dec. 767.57 19,378 *** *** ***2012: Jan.-Mar. 758.35 27,350 *** *** ***
Apr.-June 766.40 30,372 *** *** ***
July-Sept. 716.99 15,614 *** *** ***
Oct.-Dec. 699.44 16,814 -- 0 --2013: Jan.-Mar. 715.71 19,751 -- 0 --
Apr.-June 710.42 22,564 -- 0 --
July-Sept. 687.67 18,132 *** *** ***
Oct.-Dec. 701.67 14,469 *** *** ***1 Product 4: Grades C1050 through C1070, 5.5 mm (7/32 inch) through 6.5 mm (1/4 inch) in diameter, for spring applications excluding valve spring (in green condition, e.g., NOT cleaned, coated, etc.). Source: Compiled from data submitted in response to Commission questionnaires.

V‐11
Figure V-3
Wire rod: Weighted-average prices and quantities of domestic and imported product, by quarters, January 2008-December 2013
* * * * * * * Figure V-4
Wire rod: Weighted-average prices and quantities of domestic and imported product, by quarters, January 2008-December 2013
* * * * * * * Figure V-5
Wire rod: Weighted-average prices and quantities of domestic and imported product, by quarters, January 2008-December 2013
* * * * * * * Figure V-6
Wire rod: Weighted-average prices and quantities of domestic and imported product, by quarters, January 2008-December 2013
* * * * * * *
Price trends
Prices for wire rod fluctuated during 2008‐13 with prices generally falling from third quarter 2008 peak levels into 2009, increasing during the latter half of 2009 through 2011, and then falling during 2012‐13. Overall, prices for wire rod increased between the first quarter of 2008 and the last quarter in 2013. Table V‐7 summarizes the price trends, by country and by product. As shown in the table, domestic price increases ranged from 2.6 percent to 11.9 percent during 2008‐13 while import price increases ranged from *** percent to *** percent. Domestic prices for all four products steadily increased from first quarter of 2008 and then peaked during the third quarter of 2011; domestic prices generally declined over the following nine quarters. Available price data of wire rod imported from Mexico is sporadic but shows similar price trends to domestic prices, with prices peaking in the fourth quarter of 2011 before falling through the end of the period.

V‐12
Table V-7 Wire rod: Summary of weighted-average f.o.b. prices for products 1-4 from the United States and Mexico
Item Number of quarters
Low price
(per unit)
High price
(per unit) Change in
price1 (percent)
Product 1
United States 24 499.70 968.10 (1.0)Mexico 6 *** *** *** Product 2
United States 24 500.46 983.72 2.6 Mexico 15 *** *** *** Product 3
United States 24 505.46 999.38 3.5 Mexico 8 *** *** *** Product 4
United States 24 559.51 1,104.35 11.9 Mexico 8 *** *** ***
1 Percentage change from the first quarter in which data were available to the last quarter in which price data were available, based on rounded data. Source: Compiled from data submitted in response to Commission questionnaires.
Price comparisons
As shown in table V‐8, prices for wire rod imported from Mexico were below those for U.S.‐produced product in 30 of 37 instances; margins of underselling ranged from *** to *** percent. In the remaining 7 instances, prices for wire rod imported from Mexico were higher than domestic prices, with margins of overselling ranging from *** to ***.15 16
15 In the original investigations, Brazilian product undersold domestic product in 38 of 47 possible price comparisons, with an average margin of *** percent; Indonesian product undersold domestic product in all 3 possible price comparisons, with an average margin of *** percent; product imported from Mexico undersold domestic product in 37 of 46 possible comparisons, with an average margin of *** percent; product imported from Moldova undersold domestic product in 19 of 22 possible price comparisons, with an average margin of *** percent; product imported from Trinidad and Tobago undersold domestic product in 36 of 52 possible price comparisons, with an average margin of *** percent; product imported from Ukraine undersold domestic product in 21 of 22 possible price comparisons, with an average margin of *** percent.
Also in the original investigations, domestic producers alleged lost revenues from imports from Brazil (*** allegations) and lost sales from imports from Brazil (*** allegations), Moldova (***), Mexico (***), Trinidad and Tobago (***), and Ukraine (***). Domestic producers alleged *** lost revenues or lost sales from imports from Indonesia. Carbon and Certain Alloy Steel Wire Rod from Brazil, Canada, Germany, Indonesia, Mexico, Moldova, Trinidad and Tobago, Turkey, and Ukraine, Inv. Nos. 701‐TA‐417‐
(continued...)

V‐13
Table V-8
Wire rod: Instances of underselling/overselling and the range and average of margins, by product from Mexico, January/March 2008-October/December 2013
Product
Underselling Overselling Number
of instances
Range (percent)
Average margin
(percent)
Number of
instances Range
(percent)
Average margin
(percent)
Product 1 4 *** *** 2 *** ***
Product 2 12 *** *** 3 *** ***
Product 3 6 *** *** 2 *** ***
Product 4 8 *** *** 0 -- --
Total 30 *** 9.6 7 *** (1.8) Source: Compiled from data submitted in response to Commission questionnaires.
(…continued) 421 and 731‐TA‐953, 954, 956‐959, 961, and 962 (Final), USITC Staff Report, pp. V‐15‐V‐29 and tables V‐11 and V‐12.
16 In the first reviews, product imported from Brazil undersold domestic product in all 3 possible price comparisons, with an average margin of *** percent; Indonesian product undersold domestic product in all 3 possible price comparisons, with an average margin of *** percent; product imported from Mexico undersold domestic product in 26 of 54 possible comparisons, with margins of underselling ranging from *** to *** percent; product imported from Moldova undersold domestic product in all 5 possible price comparisons, with an average margin of *** percent; product imported from Trinidad and Tobago undersold domestic product in 8 of 14 possible price comparisons, with margins of underselling ranging from *** to *** percent; product imported from Ukraine undersold domestic product in all 6 possible price comparisons, with an average margin of *** percent. Carbon and Certain Alloy Steel Wire Rod from Brazil, Canada, Germany, Indonesia, Mexico, Moldova, Trinidad and Tobago, Turkey, and Ukraine, Inv. Nos. 701‐TA‐417‐421 and 731‐TA‐953, 954, 956‐959, 961, and 962 (Final), USITC Staff Report, pp. V‐15‐V‐29; and Carbon and Certain Alloy Steel Wire Rod from Brazil, Canada, Indonesia, Mexico, Moldova, Trinidad and Tobago, and Ukraine, Inv. Nos. 701‐TA‐417 and 731‐TA‐953, 954, 957‐959, 961, and 962 (Review), USITC Staff Report, p. V‐26.


A‐1
APPENDIX A
FEDERAL REGISTER NOTICES


A‐3
The Commission makes available notices relevant to its investigations and reviews on its website, www.usitc.gov. In addition, the following tabulation presents, in chronological order, Federal Register notices issued by the Commission and Commerce during the current proceeding.
Citation Title Link
78 FR 33063 June 3, 2013 Initiation of Five-Year (“Sunset”) Review
http://www.usitc.gov/trade_remedy/731_ad_701_cvd/investigations/2013/wire_rod/PDF/Commerce%20initiation.pdf
78 FR 33103 June 3, 2013
Carbon and Certain Alloy Steel Wire Rod From Brazil, Indonesia, Mexico, Moldova, Trinidad and Tobago, and Ukraine: Institution of five-year reviews
http://www.usitc.gov/trade_remedy/731_ad_701_cvd/investigations/2013/wire_rod/PDF/Institution.pdf
78 FR 60316 October 1, 2013
Carbon and Certain Alloy Steel Wire Rod From Brazil, Indonesia, Mexico, Moldova, Trinidad and Tobago, and Ukraine: Notice of Commission Determination To Conduct Full Five- Year Reviews
http://www.usitc.gov/trade_remedy/731_ad_701_cvd/investigations/2013/wire_rod/PDF/Notice%20to%20conduct%20full%20review.pdf
78 FR 60850 October 2, 2013
Carbon and Certain Alloy Steel Wire Rod From Brazil: Final Results of the Expedited Second Sunset Review of the Countervailing Duty Order
http://www.usitc.gov/trade_remedy/731_ad_701_cvd/investigations/2013/wire_rod/PDF/Commerce%20final%20results%20CVD.pdf
78 FR 63450 October 24, 2013
Carbon and Certain Alloy Steel Wire Rod From Brazil, Indonesia, Mexico, Moldova, Trinidad and Tobago, and Ukraine: Final Results of the Expedited Second Sunset Reviews of the Antidumping Duty Orders
http://www.usitc.gov/trade_remedy/731_ad_701_cvd/investigations/2013/wire_rod/PDF/Commerce%20final%20results%20AD.pdf
78 FR 76653 December 18, 2013
Carbon and Certain Alloy Steel Wire Rod From Brazil, Indonesia, Mexico, Moldova, Trinidad and Tobago, and Ukraine: Scheduling of full five-year reviews concerning the countervailing duty order on carbon and certain alloy steel wire rod from Brazil and the antidumping duty orders on carbon and certain alloy steel wire rod from Brazil, Indonesia, Mexico, Moldova, Trinidad and Tobago, and Ukraine
http://www.usitc.gov/trade_remedy/731_ad_701_cvd/investigations/2013/wire_rod/PDF/Scheduling.pdf
Note.–The press release announcing the Commission’s determinations concerning adequacy and the conduct of a full or expedited review can be found at http://usitc.gov/press_room/news_release/2013/er0906ll1.htm. A summary of the Commission’s votes concerning adequacy and the conduct of a full or expedited review can be found at http://pubapps2.usitc.gov/sunset/caseProfSuppAttmnt/download/11596. The Commission’s explanation of its determinations can be found at http://pubapps2.usitc.gov/sunset/caseProfSuppAttmnt/download/11597.


B‐1
APPENDIX B
LIST OF HEARING WITNESSES


B‐3
CALENDAR OF PUBLIC HEARING
Those listed below appeared as witnesses at the United States International Trade Commission’s hearing: Subject: Carbon and Certain Alloy Steel Wire Rod from Brazil, Indonesia, Mexico, Moldova, Trinidad and Tobago, and Ukraine
Inv. Nos.: 701-TA-417 and 731-TA-953, 957-959, 961and 962 (Second Review)
Date/Time: April 22, 2014 - 9:30 a.m. Sessions will be held in connection with these investigations in the Main Hearing Room (room 101), 500 E Street, S.W., Washington, DC. EMBASSY WITNESSES: Embassy of Ukraine Washington, DC Ihor Baranetskyi, Acting Head of the Economic Division Oleksandr Pakhil, Second Secretary Embassy of Mexico Washington, DC
Salvador Behar, Legal Counsel for International Trade TIME OPENING REMARKS: ALLOCATION: In Support of Continuation (Kathleen W. Cannon, Kelley Drye 5 minutes
& Warren LLP) In Opposition to Continuation (Jay C. Campbell, White & Case LLP; 5 minutes and Craig A. Lewis, Hogan Lovells US LLP)

B‐4
In Support of the Continuation of TIME Antidumping and Countervailing Duty Orders: ALLOCATION: 60 minutes total Kelley Drye & Warren LLP Washington, DC on behalf of ArcelorMittal USA LLC Evraz Pueblo Gerdau Ameristeel US Inc. Keystone Consolidated Industries, Inc. James Kerkvliet, Vice President of Sales and Marketing, Gerdau Ameristeel US Edward Goettl, Manager of Wire Rod Sales, Gerdau Ameristeel US Vic Stirnaman, President, Keystone Consolidated Industries, Inc.
Stephen Ashby, Director of Rod and Bar Sales, Evraz Pueblo James Sanderson, President, USW Local 7898 Michael Kerwin, Director, Georgetown Economic Services Gina E. Beck, Economist, Georgetown Economic Services
Kathleen W. Cannon ) Paul C. Rosenthal ) ) – OF COUNSEL
Benjamin Blase Caryl ) R. Alan Luberda )
Wiley Rein LLP Washington, DC on behalf of Nucor Corporation (“Nucor”) Eric Nystrom, National Marketing Manager for Wire Rod, SBQ, and Cold Finish Products, Nucor Alan H. Price ) Daniel B. Pickard ) – OF COUNSEL Maureen E. Thorson )

B‐5
In Opposition to the Continuation of TIME Antidumping and Countervailing Duty Orders: ALLOCATION: 60 minutes total White & Case LLP Washington, DC on behalf of Deacero S.A.P.I de C.V. (“Deacero”) Deacero USA, Inc. (“Deacero USA”) Sergio Gutierrez, Chief Executive Officer, Deacero Eugenio Gutierrez, Vice President of Finance & International Trade, Deacero Daniel Gutierrez, Vice President of Industrial Sales, Deacero Luis Leal, International Trade Manager, Deacero Charles Spittler, Chief Operating Officer, Cavert Wire Company, Inc. Bill Heileg, Co-Owner and Member, G3 Steel Group LLC David E. Bond ) ) – OF COUNSEL Jay C. Campbell ) Hogan Lovells US LLP Washington, DC on behalf of Public Joint Stock Company Yenakiieve Iron and Steel Works (“Yenakiieve”) Elena Dimitrova, Head of Marketing, Commercial Service, Sales Directorate, Metinvest Holding, LLC Craig A. Lewis ) Jonathan T. Stoel ) – OF COUNSEL Wesley V. Carrington )


C‐1
APPENDIX C
SUMMARY DATA


Table C-1Wire rod: Summary data concerning the U.S. market, 2008-13
2008 2009 2010 2011 2012 2013 2008-13 2008-09 2009-10 2010-11 2011-12 2012-13U.S. consumption quantity:
Amount................................................. *** *** *** *** *** 5,300,149 *** *** *** *** *** ***Producers' share (1)............................. *** *** *** *** *** 67.9 *** *** *** *** *** ***Importers' share (1):
Brazil................................................. 0.0 0.0 0.0 0.0 0.0 0.0 0.0 0.0 0.0 0.0 0.0 0.0Indonesia........................................... 0.0 0.0 0.0 0.0 0.0 0.0 0.0 0.0 0.0 0.0 0.0 0.0Mexico............................................... *** *** *** *** *** 0.2 *** *** *** *** *** ***Moldova............................................. 0.0 0.0 0.0 0.0 0.0 0.0 0.0 0.0 0.0 0.0 0.0 0.0Trinidad & Tobago............................. *** 0.0 0.0 0.0 0.0 0.0 *** *** *** *** *** ***Ukraine.............................................. 0.0 0.0 0.0 0.0 0.0 0.0 0.0 0.0 0.0 0.0 0.0 0.0
Subtotal, subject sources................ *** *** *** *** *** 0.2 *** *** *** *** *** ***1080 tire cord/tire bead...................... *** *** *** *** *** 1.8 *** *** *** *** *** ***All others sources.............................. *** *** *** *** *** 30.1 *** *** *** *** *** ***
Subtotal, nonsubject sources.......... *** *** *** *** *** 31.9 *** *** *** *** *** ***Total imports................................ *** *** *** *** *** 32.1 *** *** *** *** *** ***
U.S. consumption value:Amount................................................. *** *** *** *** *** 3,756,412 *** *** *** *** *** ***Producers' share (1)............................. *** *** *** *** *** 67.3 *** *** *** *** *** ***Importers' share (1):
Brazil................................................. 0.0 0.0 0.0 0.0 0.0 0.0 0.0 0.0 0.0 0.0 0.0 0.0Indonesia........................................... 0.0 0.0 0.0 0.0 0.0 0.0 0.0 0.0 0.0 0.0 0.0 0.0Mexico............................................... *** *** *** *** *** 0.2 *** *** *** *** *** ***Moldova............................................. 0.0 0.0 0.0 0.0 0.0 0.0 0.0 0.0 0.0 0.0 0.0 0.0Trinidad & Tobago............................. *** *** *** *** *** 0.0 *** *** *** *** *** ***Ukraine.............................................. 0.0 0.0 0.0 0.0 0.0 0.0 0.0 0.0 0.0 0.0 0.0 0.0
Subtotal, subject sources................ *** *** *** *** *** 0.2 *** *** *** *** *** ***1080 tire cord/tire bead...................... *** *** *** *** *** 1.7 *** *** *** *** *** ***All others sources.............................. *** *** *** *** *** 30.8 *** *** *** *** *** ***
Subtotal, nonsubject sources.......... *** *** *** *** *** 32.5 *** *** *** *** *** ***Total imports................................ *** *** *** *** *** 32.7 *** *** *** *** *** ***
U.S. imports from:Brazil:
Quantity............................................. 0 0 0 0 0 0 (2) (2) (2) (2) (2) (2)
Value................................................. 0 0 0 0 0 0 (2) (2) (2) (2) (2) (2)
Unit value.......................................... (2) (2) (2) (2) (2) (2) (2) (2) (2) (2) (2) (2)
Ending inventory quantity................... 0 0 0 0 0 0 (2) (2) (2) (2) (2) (2)Indonesia:
Quantity............................................. 0 0 0 0 0 0 (2) (2) (2) (2) (2) (2)
Value................................................. 0 0 0 0 0 0 (2) (2) (2) (2) (2) (2)
Unit value.......................................... (2) (2) (2) (2) (2) (2) (2) (2) (2) (2) (2) (2)
Ending inventory quantity................... 0 0 0 0 0 0 (2) (2) (2) (2) (2) (2)Mexico:
Quantity............................................. *** *** *** *** *** 10,333 *** *** *** *** *** ***Value................................................. *** *** *** *** *** 6,128 *** *** *** *** *** ***Unit value.......................................... *** *** *** *** *** $593 *** *** *** *** *** ***Ending inventory quantity................... *** *** *** *** *** 0 *** *** *** *** *** ***
Moldova:
Quantity............................................. 0 0 0 0 0 0 (2) (2) (2) (2) (2) (2)
Value................................................. 0 0 0 0 0 0 (2) (2) (2) (2) (2) (2)
Unit value.......................................... (2) (2) (2) (2) (2) (2) (2) (2) (2) (2) (2) (2)
Ending inventory quantity................... 0 0 0 0 0 0 (2) (2) (2) (2) (2) (2)Trinidad & Tobago:
Quantity............................................. 21,794 0 0 0 0 0 (100.0) (100.0) (2) (2) (2) (2)
Value................................................. 14,298 0 0 0 0 0 (100.0) (100.0) (2) (2) (2) (2)
Unit value.......................................... $656 (2) (2) (2) (2) (2) (2) (2) (2) (2) (2) (2)
Ending inventory quantity................... *** 0 0 0 0 0 *** *** (2) (2) (2) (2)Ukraine:
Quantity............................................. 0 0 0 0 0 0 (2) (2) (2) (2) (2) (2)
Value................................................. 0 0 0 0 0 0 (2) (2) (2) (2) (2) (2)
Unit value.......................................... (2) (2) (2) (2) (2) (2) (2) (2) (2) (2) (2) (2)
Ending inventory quantity................... 0 0 0 0 0 0 (2) (2) (2) (2) (2) (2)Subtotal, subject sources: C D E F G
Quantity............................................. *** *** *** *** *** 10,333 *** *** *** *** *** ***Value................................................. *** *** *** *** *** 6,128 *** *** *** *** *** ***Unit value.......................................... *** *** *** *** *** $593 *** *** *** *** *** ***Ending inventory quantity................... *** *** *** *** *** 0 *** *** *** *** *** ***
Table continued on next page............
(Quantity=short tons; Value=1,000 dollars; Unit values, unit labor costs, and unit expenses=dollars per short ton; Period changes=percent--exceptions noted)
Reported dataCalendar year
Period changesComparison periods

Table C-1Wire rod: Summary data concerning the U.S. market, 2008-13
2008 2009 2010 2011 2012 2013 2008-13 2008-09 2009-10 2010-11 2011-12 2012-13
U.S. imports from: 1080 tire cord/tire bead:
Quantity............................................. 139,459 71,759 129,184 116,513 102,517 96,639 (30.7) (48.5) 80.0 (9.8) (12.0) (5.7)Value................................................. 126,654 50,808 91,621 103,073 84,521 64,506 (49.1) (59.9) 80.3 12.5 (18.0) (23.7)Unit value.......................................... $908 $708 $709 $885 $824 $667 (26.5) (22.0) 0.2 24.7 (6.8) (19.0)
Ending inventory quantity................... 0 0 0 0 0 0 (2) (2) (2) (2) (2) (2)All other sources:
Quantity............................................. 1,536,768 777,083 1,284,771 1,059,512 1,391,895 1,593,718 3.7 (49.4) 65.3 (17.5) 31.4 14.5Value................................................. 1,360,431 550,614 988,457 992,791 1,159,903 1,156,290 (15.0) (59.5) 79.5 0.4 16.8 (0.3)Unit value.......................................... $885 $709 $769 $937 $833 $726 (18.0) (20.0) 8.6 21.8 (11.1) (12.9)Ending inventory quantity................... 106,455 61,033 72,308 61,769 90,584 105,991 (0.4) (42.7) 18.5 (14.6) 46.6 17.0
Subtotal, nonsubject sources:Quantity............................................. 1,676,227 848,842 1,413,955 1,176,024 1,494,413 1,690,357 0.8 (49.4) 66.6 (16.8) 27.1 13.1Value................................................. 1,487,085 601,423 1,080,078 1,095,863 1,244,424 1,220,797 (17.9) (59.6) 79.6 1.5 13.6 (1.9)Unit value.......................................... $887 $709 $764 $932 $833 $722 (18.6) (20.1) 7.8 22.0 (10.6) (13.3)Ending inventory quantity................... 106,455 61,033 72,308 61,769 90,584 105,991 (0.4) (42.7) 18.5 (14.6) 46.6 17.0
Total imports:Quantity............................................. *** *** *** *** *** 1,700,690 *** *** *** *** *** ***Value................................................. *** *** *** *** *** 1,226,925 *** *** *** *** *** ***Unit value.......................................... *** *** *** *** *** $721 *** *** *** *** *** ***Ending inventory quantity................... *** *** *** *** *** 105,991 *** *** *** *** *** ***
U.S. producers':Average capacity quantity..................... 5,546,751 5,295,752 4,965,095 5,173,168 5,131,954 5,073,815 (8.5) (4.5) (6.2) 4.2 (0.8) (1.1)Production quantity............................... 4,055,641 2,837,165 3,384,322 3,907,416 3,879,060 3,655,088 (9.9) (30.0) 19.3 15.5 (0.7) (5.8)Capacity utilization (1)........................... 73.1 53.6 68.2 75.5 75.6 72.0 (1.1) (19.5) 14.6 7.4 0.1 (3.5)U.S. shipments:
Quantity............................................. 4,050,961 2,833,426 3,340,954 3,876,145 3,809,728 3,599,459 (11.1) (30.1) 17.9 16.0 (1.7) (5.5)Value................................................. 3,485,005 1,651,451 2,246,759 3,012,054 2,826,974 2,529,487 (27.4) (52.6) 36.0 34.1 (6.1) (10.5)Unit value.......................................... $860 $583 $672 $777 $742 $703 (18.3) (32.3) 15.4 15.6 (4.5) (5.3)
Export shipments:Quantity............................................. 39,707 39,301 42,049 34,687 26,748 24,319 (38.8) (1.0) 7.0 (17.5) (22.9) (9.1)Value................................................. 31,925 22,886 26,912 28,888 31,597 22,566 (29.3) (28.3) 17.6 7.3 9.4 (28.6)Unit value.......................................... $804 $582 $640 $833 $1,181 $928 15.4 (27.6) 9.9 30.1 41.8 (21.4)
Ending inventory quantity...................... 231,279 195,717 196,677 193,261 235,848 266,868 15.4 (15.4) 0.5 (1.7) 22.0 13.2Inventories/total shipments (fn1)........... 5.7 6.8 5.8 4.9 6.1 7.4 1.7 1.2 (1.0) (0.9) 1.2 1.2Production workers............................... 2,339 2,083 2,173 2,239 2,269 2,192 (6.3) (10.9) 4.3 3.0 1.3 (3.4)Hours worked (1,000s).......................... 4,741 3,825 4,220 4,552 4,587 4,258 (10.2) (19.3) 10.3 7.9 0.8 (7.2)Wages paid ($1,000)............................ 170,467 128,170 145,939 166,385 174,648 156,838 (8.0) (24.8) 13.9 14.0 5.0 (10.2)Hourly wages........................................ $35.96 $33.51 $34.58 $36.55 $38.07 $36.83 2.4 (6.8) 3.2 5.7 4.2 (3.3)Productivity (short tons per 1,000 hours) 855.4 741.7 802.0 858.4 845.7 858.4 0.3 (13.3) 8.1 7.0 (1.5) 1.5Unit labor costs..................................... $42.03 $45.18 $43.12 $42.58 $45.02 $42.91 2.1 7.5 (4.5) (1.3) 5.7 (4.7)Net sales:
Quantity............................................. 4,126,388 2,881,432 3,384,018 3,920,918 3,836,475 3,623,777 (12.2) (30.2) 17.4 15.9 (2.2) (5.5)Value................................................. 3,547,031 1,679,395 2,274,325 3,048,561 2,858,572 2,552,054 (28.1) (52.7) 35.4 34.0 (6.2) (10.7)Unit value.......................................... $860 $583 $672 $778 $745 $704 (18.1) (32.2) 15.3 15.7 (4.2) (5.5)
Cost of goods sold (COGS).................. 3,116,677 1,652,958 2,083,987 2,743,826 2,622,588 2,358,335 (24.3) (47.0) 26.1 31.7 (4.4) (10.1)Gross profit of (loss)............................. 430,354 26,437 190,338 304,735 235,984 193,719 (55.0) (93.9) 620.0 60.1 (22.6) (17.9)SG&A expenses................................... 83,259 69,352 91,584 86,722 87,633 86,025 3.3 (16.7) 32.1 (5.3) 1.1 (1.8)
Operating income or (loss).................... 347,095 (42,915) 98,754 218,013 148,351 107,694 (69.0) (2) (2) 120.8 (32.0) (27.4)Capital expenditures............................. 54,283 35,731 48,287 54,987 95,351 163,405 201.0 (34.2) 35.1 13.9 73.4 71.4Unit COGS........................................... $755 $574 $616 $700 $684 $651 (13.8) (24.0) 7.4 13.6 (2.3) (4.8)Unit SG&A expenses............................ $20 $24 $27 $22 $23 $24 17.7 19.3 12.4 (18.3) 3.3 3.9
Unit operating income or (loss).............. $84 $(15) $29 $56 $39 $30 (64.7) (2) (2) 90.5 (30.5) (23.1)COGS/sales (1).................................... 87.9 98.4 91.6 90.0 91.7 92.4 4.5 10.6 (6.8) (1.6) 1.7 0.7Operating income or (loss)/sales (1)...... 9.8 (2.6) 4.3 7.2 5.2 4.2 (5.6) (12.3) 6.9 2.8 (2.0) (1.0)
Notes:
(1)--Report data are in percent and period changes are in percentage points.(2)--Undefined.
Source: Compiled from data submitted in response to Commission questionnaires and from official statistics of the U.S. Department of Commerce as adjusted.
(Quantity=short tons; Value=1,000 dollars; Unit values, unit labor costs, and unit expenses=dollars per short ton; Period changes=percent--exceptions noted)
Reported data Period changesCalendar year Comparison periods

C‐5
The pages that follow are a direct duplication of the historical data presented in table I‐1
of the Commission’s staff report in the first five‐year review of the orders.

I-5
Table I-1Wire rod: Summary data from the original investigations and the current full five-year reviews, 1999-2007
(Quantity=short tons; value=1,000 dollars; unit values, unit labor costs, and unit financial data are per short ton)
Item 1999 2000 2001 2002 2003 2004 2005 2006 2007
U.S. consumption quantity: Amount *** *** *** 7,753,874 6,590,919 8,135,080 6,505,628 7,109,045 5,858,981
Producers’ share1 *** *** *** 51.4 62.8 50.3 57.4 53.7 69.6
Importer's share: Brazil1 2 *** *** *** *** 0.0 0.0 0.0 0.0 0.0
Canada1 *** *** *** *** *** *** *** *** ***
Indonesia1 *** *** *** 0.5 0.0 0.4 0.0 0.0 0.0
Mexico1 *** *** *** 1.6 0.3 0.8 0.2 0.1 0.1
Moldova1 *** *** *** 0.2 0.0 0.0 0.0 0.0 0.0
Ukraine1 *** *** *** 0.1 0.0 0.0 0.0 0.0 0.0
Subtotal1 *** *** *** *** *** *** *** *** ***
Trinidad & Tobago1 *** *** *** 5.0 2.2 3.2 1.6 1.9 1.6
Subject subtotal1 *** *** *** *** *** *** *** *** ***
Stelco1 *** *** *** *** *** *** *** *** ***
Grade 1080 tire cord/tire bead1 2 (2) (2) (2) *** *** *** *** *** ***
Other countries1 2 *** *** *** 29.2 22.8 35.2 30.7 35.9 16.9
Total imports1 *** *** *** 48.6 37.2 49.7 42.6 46.3 30.4
U.S. consumption value: Amount *** *** *** 2,411,891 2,138,988 4,109,959 3,592,264 3,838,199 3,403,602
Producers’ share1 *** *** *** 53.5 63.3 53.1 58.1 56.0 68.8
Importer's share: Brazil1 2 *** *** *** *** 0.0 0.0 0.0 0.0 0.0
Canada1 2 *** *** *** *** *** *** *** *** ***
Indonesia1 *** *** *** 0.4 0.0 0.4 0.0 0.0 0.0
Mexico1 *** *** *** 1.4 0.3 0.8 0.2 0.1 0.1
Moldova1 *** *** *** 0.2 0.0 0.0 0.0 0.0 0.0
Ukraine1 *** *** *** 0.1 0.0 0.0 0.0 0.0 0.0
Subtotal1 *** *** *** *** *** *** *** *** ***
Trinidad & Tobago1 *** *** *** 4.5 1.8 3.0 1.4 1.7 1.4
Subject subtotal1 *** *** *** *** *** *** *** *** ***
Stelco1 *** *** *** *** *** *** *** *** ***
Grade 1080 tire cord/tire bead1 2 (2) (2) (2) *** *** *** *** *** ***
Other countries1 2 *** *** *** 25.8 21.6 31.8 28.5 32.4 16.9
Total imports1 *** *** *** 46.5 36.7 46.9 41.9 44.0 31.2
Table continued on following page.

I-6
Table I-1--ContinuedWire rod: Summary data from the original investigations and the current full five-year reviews, 1999-2007
(Quantity=short tons; value=1,000 dollars; unit values, unit labor costs, and unit financial data are per short ton)
Item 1999 2000 2001 2002 2003 2004 2005 2006 2007
U.S. imports from-- Brazil: Quantity *** *** *** *** 0 0 0 0 0
Value *** *** *** *** 0 0 0 0 0
Unit value $*** $*** $*** $*** -- -- -- -- --
Canada: Quantity *** *** *** *** *** *** *** *** ***
Value *** *** *** *** *** *** *** *** ***
Unit value $*** $*** $*** $*** $*** $*** $*** $*** $***
Indonesia: Quantity 69,805 86,940 60,065 40,863 0 29,937 333 0 0
Value 14,884 19,669 13,116 10,494 0 17,247 262 0 0
Unit value $213 $226 $216 $257 -- $576 $785 -- --
Mexico: Quantity 122,038 159,818 266,925 123,380 19,986 68,498 11,480 4,256 8,244
Value 29,449 39,337 64,309 34,548 6,296 33,332 6,283 2,032 4,263
Unit value $241 $246 $241 $280 $315 $487 $547 $477 $517
Moldova: Quantity 190,239 191,074 187,370 18,826 0 0 0 0 0
Value 38,888 41,667 39,439 3,708 0 0 0 0 0
Unit value $204 $216 $210 $197 -- -- -- -- --
Ukraine: Quantity 193,003 367,712 258,526 11,159 0 0 738 0 0
Value 35,568 75,568 49,770 2,446 0 0 501 0 0
Unit value $184 $206 $193 $219 -- -- $680 -- --
Subtotal: Quantity *** *** *** *** *** *** *** *** ***
Value *** *** *** *** *** *** *** *** ***
Unit value $*** $*** $*** $*** $*** $*** $*** $*** $***
Trinidad & Tobago: Quantity 341,815 287,507 355,089 386,419 146,783 260,618 104,804 133,326 95,325
Value 87,289 75,511 91,335 107,445 39,267 124,194 50,039 64,253 46,228
Unit value $255 $263 $257 $278 $268 $477 $477 $482 $485
Subject subtotal: Quantity *** *** *** *** *** *** *** *** ***
Value *** *** *** *** *** *** *** *** ***
Unit value $*** $*** $*** $*** $*** $*** $*** $*** $***
Table continued on following page.

I-7
Table I-1--ContinuedWire rod: Summary data from the original investigations and the current full five-year reviews, 1999-2007
(Quantity=short tons; value=1,000 dollars; unit values, unit labor costs, and unit financial data are per short ton)
Item 1999 2000 2001 2002 2003 2004 2005 2006 2007
U.S. imports from– Stelco: Quantity *** *** *** *** *** *** *** *** ***
Value *** *** *** *** *** *** *** *** ***
Unit value $*** $*** $*** $*** $*** $*** $*** $*** $***
Grade 1080 tire cord/tire bead: Quantity (2) (2) (2) *** *** *** *** *** ***
Value (2) (2) (2) *** *** *** *** *** ***
Unit value (2) (2) (2) $*** $*** $*** $*** $*** $***
All other countries:2
Quantity *** *** *** 2,262,306 1,505,183 2,859,490 1,997,826 2,554,966 992,163
Value *** *** *** 622,360 462,923 1,308,240 1,024,997 1,244,511 574,316
Unit value $*** $*** $*** $275 $308 $458 $513 $487 $579
All countries: Quantity 2,787,291 2,987,084 3,066,218 3,765,047 2,453,575 4,039,783 2,773,119 3,294,798 1,782,699
Value 807,586 899,451 875,963 1,121,780 784,088 1,927,796 1,505,063 1,690,689 1,063,201
Unit value $290 $301 $286 $298 $320 $477 $543 $513 $596
U.S. producers’--Capacity quantity *** *** *** 4,771,377 5,040,727 4,920,229 5,392,176 5,371,016 5,429,678
Production quantity *** *** *** 4,035,005 4,052,215 4,089,091 3,741,120 3,877,367 4,067,549
Capacity utilization *** *** *** 84.6 80.4 83.1 69.4 72.2 74.9
U.S. shipments: Quantity *** *** *** 3,988,827 4,137,344 4,095,297 3,732,509 3,814,247 4,076,282
Value *** *** *** 1,290,111 1,354,900 2,182,163 2,087,201 2,147,510 2,340,401
Unit value $*** $*** $*** $323 $327 $533 $559 $563 $574
Export shipments: Quantity *** *** *** *** *** *** *** *** ***
Value *** *** *** *** *** *** *** *** ***
Unit value $*** $*** $*** $*** $*** $*** $*** $*** $***
Table continued on following page.

I-8
Table I-1--ContinuedWire rod: Summary data from the original investigations and the current full five-year reviews, 1999-2007
(Quantity=short tons; value=1,000 dollars; unit values, unit labor costs, and unit financial data are per short ton)
Item 1999 2000 2001 2002 2003 2004 2005 2006 2007
U.S. producers’-- Ending inventory quantity *** *** *** 250,935 136,816 140,019 164,647 174,288 152,512
Inventories/total shipments1 *** *** *** *** *** *** *** *** ***
Production workers *** *** *** 2,461 2,513 2,543 2,407 2,395 2,397
Hours worked (1,000 hours) *** *** *** 5,545 5,378 5,474 4,919 5,296 5,174
Wages paid (1,000 dollars) *** *** *** 140,328 139,194 145,620 143,664 161,223 161,821
Hourly wages $*** $*** $*** $25.31 $25.88 $26.60 $29.21 $30.45 $31.28
Productivity (tons/1,000 hours) *** *** *** 728 754 747 761 732 786
Unit labor costs $*** $*** $*** $34.78 $34.35 $35.61 $38.40 $41.58 $39.78
Net sales: Quantity *** *** *** 3,996,011 4,151,601 4,103,563 3,749,761 3,844,808 4,087,541
Value *** *** *** 1,291,920 1,358,707 2,182,872 2,100,194 2,165,513 2,347,208
Unit value $*** $*** $*** $323 $327 $532 $560 $563 $574
Cost of goods sold (“COGS”) *** *** *** 1,188,586 1,361,436 1,819,855 1,887,745 2,024,653 2,219,518
Gross profit or (loss) *** *** *** 103,334 (2,729) 363,017 212,449 140,860 127,690
Operating income or (loss) *** *** *** 59,982 (45,952) 305,241 158,656 85,506 74,869
U.S. producers’-- Unit COGS $*** $*** $*** $296 $328 $443 $503 $527 $543
Unit operating income or (loss) $*** $*** $*** $16 ($11) $74 $42 $22 $18
COGS/sales1 *** *** *** 92.0 100.2 83.4 89.9 93.5 94.6
Operating income or (loss)/sales1 *** *** *** 4.6 (3.4) 14.0 7.6 3.9 3.2
Capital expenditures *** *** *** 30,524 44,338 49,807 83,826 68,513 49,632
1 In percent. 2 Imports of Grade 1080 wire rod have been subtracted from U.S. imports of wire rod ***. Grade 1080 is included in imports from “all other sources.” See data files in theoriginal investigations.
Note.--Because of the pending negative determination on remand regarding Trinidad & Tobago, throughout this report, data concerning Trinidad & Tobago are presented assubject merchandise but appear separately from the subtotals of data concerning the other six subject countries.
Source: INV-Z-162, table C-2a, for 1999-2001. Data for 2002-07 were compiled in response to Commission questionnaires and from official Commerce statistics.

D‐1
APPENDIX D
COMMENTS BY U.S. PRODUCERS, IMPORTERS, PURCHASERS, AND FOREIGN PRODUCERS REGARDING THE EFFECTS OF THE ORDERS
AND THE LIKELY EFFECTS OF REVOCATION


D-3
This appendix is confidential in its entirety
* * * * * * *


E‐1
APPENDIX E
FINANCIAL RESULTS ON MERCHANT MARKET SALES AS REPORTED IN THE MOST RECENTLY COMPLETED PRELIMINARY‐PHASE
INVESTIGATIONS


E‐3
Table E-1 Wire rod: Results of merchant market operations of U.S. producers, fiscal years 2011-13
Item
Fiscal year
2011 2012 2013
Quantity (short tons)
Total commercial sales quantity 2,979,103 2,842,314 2,619,518
Value ($1,000)
Total commercial sales value 2,369,626 2,175,493 1,898,192
Cost of goods sold
Raw materials 1,548,308 1,373,248 1,179,200
Direct labor 110,752 109,358 97,527
Other factory costs 479,006 524,800 485,620
Total cost of goods sold 2,138,066 2,007,406 1,762,348
Gross profit 231,560 168,087 135,844
SG&A expenses 69,833 69,485 67,354
Operating income 161,727 98,602 68,490
Other income/(expense), net (12,445) (4,473) (4,103)
Net income 149,282 94,129 64,387
Depreciation/amortization 37,012 36,983 37,269
Cash flow 186,294 131,112 101,656
Ratio to net sales (percent)
Cost of goods sold
Raw materials 65.3 63.1 62.1
Direct labor 4.7 5.0 5.1
Other factory costs 20.2 24.1 25.6
Total COGS 90.2 92.3 92.8
Gross profit 9.8 7.7 7.2
SG&A expenses 2.9 3.2 3.5
Operating income 6.8 4.5 3.6
Net income 6.3 4.3 3.4
Table continued on next page.

E‐4
Table E-1--Continued Wire rod: Results of merchant market operations of U.S. producers, fiscal years 2011-13
Item
Fiscal year
2011 2012 2013
Unit value (dollars per short ton)
Commercial sales 795 765 725
Cost of goods sold
Raw materials 520 483 450
Direct labor 37 38 37
Other factory costs 161 185 185
Total cost of goods sold 718 706 673
Gross profit 78 59 52
SG&A expenses 23 24 26
Operating income 54 35 26
Number of firms reporting
Operating losses *** *** ***
Data 10 10 10
Source: Compiled from data submitted in response to Commission questionnaires. Carbon and Certain Alloy Steel Wire Rod from China, Investigation Nos. 701-TA-512 and 731-TA-1248 (Preliminary), USITC Publication 4458, March 2014, table VI-1, pp. VI-2-VI-3.

F‐1
APPENDIX F
SMALLER DIAMETER WIRE ROD FROM DEACERO


F‐3
This appendix is confidential in its entirety
* * * * * * *