carbon dynamics associated with - california air … · “carbon dynamics associated with...
TRANSCRIPT
1
“Carbon Dynamics Associated with Even-Aged Forest Management”
Researched and written for Climate Action Reserve (CAR) by:
Drs. Bryan C. Foster1, Timothy A. Robards2, and William S. Keeton3,4
Dec. 12, 2010
1 Bryan C. Foster, Ph.D. is CarbonPlus Director at the Ecologic Development Fund. Email: [email protected] 2 Timothy A. Robards, Ph.D. is a Senior Scientist/Forest Biometrician with Spatial Informatics Group LLC.
Email: [email protected] 3 William S. Keeton, Ph.D. is Associate Professor at the Rubenstein School of Environment and Natural Resources,
University of Vermont, Email: [email protected] 4 David Ray provided comments via internal review, Email: [email protected]
2
INTRODUCTION
The first section of the paper (A) describes even- and uneven-aged treatments in the
context of natural disturbance history by forest type in the U.S. and Canada. This
section also introduces variable retention treatments, which maintain growth and
reproduction of shade intolerant commercial species. We model variable retention
versus clearcutting in an original study and summarize the model results in terms of
comparative carbon yields in section D (―An Examination of Silvicultural Influences for
the Climate Action Reserve Improved Forest Management Protocol: A Case Study of
the Coastal Pacific Northwest Douglas-fir Type‖).
Throughout the paper, we de-emphasize the use of the terms even- and uneven-aged
due to a distinct focus on variable retention two-aged treatments for reproduction of
intermediate to shade-tolerant commercial species, and also due to the consideration of
rotation length in addition to retention quantity in carbon accounting. The analysis in the
paper focuses on the comparative carbon in the above and below ground portions of
trees, due to the fact that site preparation treatments including utilization of lying dead
wood, soil scarification, and prescribed burning of litter layers can be conducted at
various intensities under a number of silviculture treatments.
Our literature review and modeling study combined indicate that four factors are most
important in determining the net changes in forest and atmospheric carbon associated

3
with less retention (even-aged) or greater retention (uneven-aged) stand-scale
silvicultural treatments, as elaborated in section (B):
(1) The carbon storage potential based on the pre-treatment land use and productivity
has a significant influence on forest carbon. Any harvestingtreatment will reduce carbon
in stocked land versus not harvesting even accounting for in-use forest products pool
due to conversion inefficiencies, with this effect particularly pronounced in forests with
high initial stocking. Angiosperm stands have higher average wood density than
gymnosperm stands so may be preferentially maintained in a mixed wood land scape to
maximize carbon. In some but not all cases higher site productivity will translate into
higher carbon.
(2) The quantity of live tree retention significantly determines forest carbon. Higher
retention levels, particularly larger diameter trees, generally result in higher carbon
stocks. However, this effect is likely forest-type dependent (see section A of literature
review), with less diminishment of carbon stocks in intermediate to shade-tolerant
angiosperm forest types. The modeling results of intermediate to intolerant (shade)
Douglas-fir showed no impact of silvicultural retention treatment with only rotation period
providing a significant difference. One possible explanation is that the Forest
Visualization System (FVS) model only allowed spatially dispersed treatments, which
may have limited Douglas-fir growth and regeneration compared to aggregated
patterns. Aubrey et al., 2008 in the DEMO study, reported increased annual growth
efficiency 5 years after dispersed harvesting due to cutting suppressed and codominant
trees which was also the cutting rule for our FVS model run, but other studies in
4
Douglas-fir have not only reported reduced height growth and regeneration as low as
20% retention, but have also reported high retained tree mortality from skid trail damage
and wind throw (Drever and Lerzman, 2001 and Newsome et al., 2010). Harmon et al.
(2009) modeled Douglas-fir under STANDCARB. Nearly all treatments had
asymptotes of carbon stocks from both ecosystem and products at 60-80 year rotation
intervals comparable to our study. However, in aggregated spatial configurations (such
as patch or group selection cuts) intermediate retention level treatments of 40-60%
emerged as maximizing carbon in the 60-80 year interval, an effect we could not
demonstrate, whereas in dispersed configurations all treatments were equivalent at this
rotation interval, comparable to our modeling study.
(3) The length of the rotation length (even-aged) or entry period (uneven-aged) also
significantly determines forest carbon. In the stands modeled, longer rotation lengths
will generally increase forest carbon stocks at least to 100 years and potentially 200
years. This factor can be more significant than retention levels in intermediate to
shade-intolerant gymnosperm and mixed forest types, while retention levels can be
more significant in determining total forest carbon in intermediate to shade-tolerant
angiosperm forest types. Our modeling suggests that rotation ages linked to annual
growth culmination may maximize live tree carbon stocks.
(4) The quantified effects of silvicultural treatments on total net sequestration or
emissions of carbon will depend significantly on how carbon accounting boundaries are
drawn, i.e., which carbon pools and downstream effects are included in the analysis.
5
In terms of in situ ecosystem stocks, the quantity of woody debris recruitment varies
temporally between even-aged management and uneven-aged management,
irrespective of utilization and site preparation activities.
In terms of forest product accounting, Harmon et al. (2009) modeled Douglas-fir ranging
from low utilization crediting (50% of harvested live tree carbon converted to long-lived
forest products with losses of 2%/yr), to high utilization crediting (75% of harvested live
tree carbon converted to long-lived forest products with losses of 1%/yr). Clearcutting
treatments only approached the equivalent carbon levels where retention is high under
assumptions of high utilization crediting.
In terms of leakage, Taylor et al. (2008) used the carbon budget model used by the
Canadian forest sector (CBM-CFS3) to compare the effect of partial and clearcutting in
100% stocked red spruce forests over a 240 year period. On a per hectare basis,
partial cutting removed less than half as much biomass, but occurred twice as
frequently as clearcutting. Over an 80 year clearcut rotation and two partial cutting
entries, 85% of merchantable biomass was removed from the clearcut treatments
compared to 80% in partial-cut treatments, to account for volume losses due to higher
anticipated mortality from wind exposure and logging operations damage in partially-cut
treatments. The partial harvest resulted in 49.8 Mg C/ha greater carbon in the forest,
but 16.8 Mg C/ha less merchantable timber, which may be considered as 34% leakage,
assuming full timber demand inelasticity with reduced supply. The leakage effect could
6
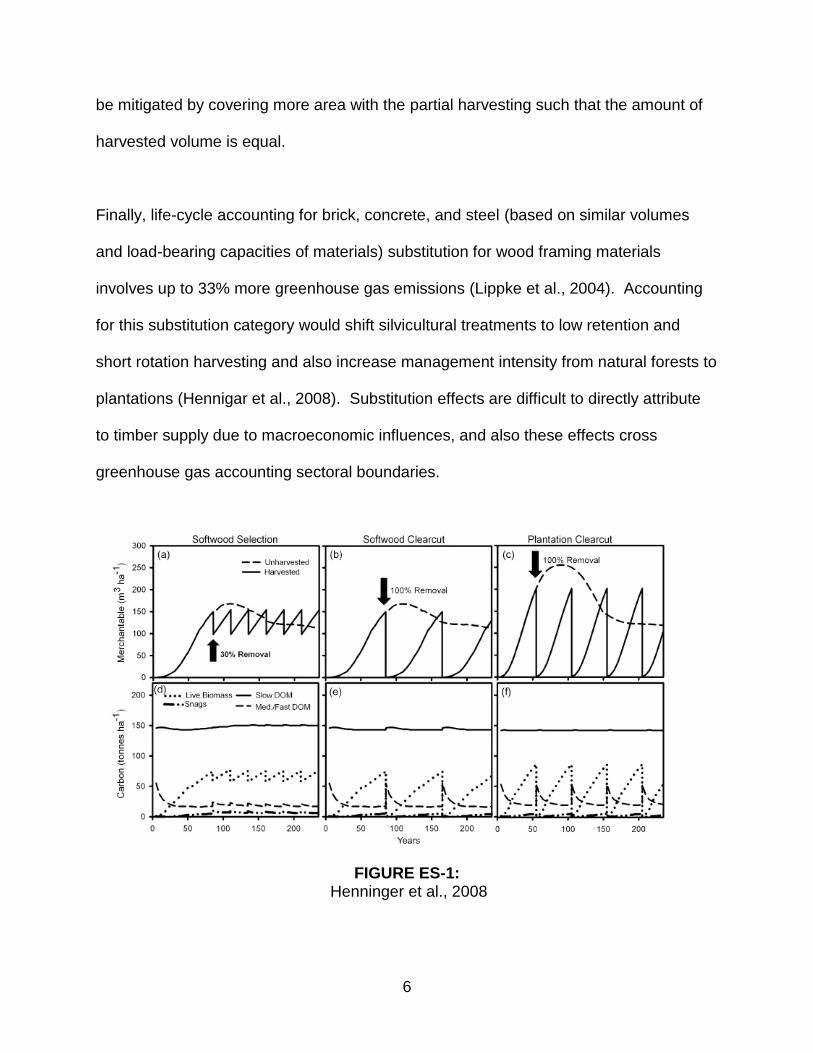
be mitigated by covering more area with the partial harvesting such that the amount of
harvested volume is equal.
Finally, life-cycle accounting for brick, concrete, and steel (based on similar volumes
and load-bearing capacities of materials) substitution for wood framing materials
involves up to 33% more greenhouse gas emissions (Lippke et al., 2004). Accounting
for this substitution category would shift silvicultural treatments to low retention and
short rotation harvesting and also increase management intensity from natural forests to
plantations (Hennigar et al., 2008). Substitution effects are difficult to directly attribute
to timber supply due to macroeconomic influences, and also these effects cross
greenhouse gas accounting sectoral boundaries.
FIGURE ES-1: Henninger et al., 2008
7
(A) Variation in the use of even- and uneven-aged management practices by forest type and biogeographic region in North America.
Definitions of silvicultural treatments
Silviculture is defined as the ―theory and practice of controlling forest establishment,
composition, structure, and growth‖ (Smith et al., 1997). Silvicultural treatments include
both treatments of regeneration to remove the overstory to establish a new tree
population (defined as even-aged (1 age class: clearcut and seed tree), multi-aged (2+
age classes: shelterwood) or uneven-aged (3+ age classes: individual tree and group
selection)), and intermediate treatments (thinning from above, thinning from below, and
geometric thinning) to improve the existing stand’s commercial value and regulate its
growth. Treatments are applied at the scale of stands and stands are contiguous
groups of trees uniform in composition, age class, site quality, and condition. An ―age
class‖ and ―cohort‖ are synonymous terms typically used to refer to a 10-20 year
aggregation of trees originating from a single natural disturbance or silvicultural
regeneration treatment.
Even-aged and uneven-aged regeneration methods
Clearcutting or cleancutting treatments involve removing all vegetation and making all
growing space available for new plants. Other even-aged regeneration treatments
retain some mature trees for a short period of time, typically 5-15 years, after
‖seed/establishment cutting‖ and while regeneration is still flexible and less vulnerable
to breakage during the final removal cut. These treatments include seed tree which
retains widely scattered trees of the desired species and dominant crown position with a
high live crown ratio to provide seed for wind-scattered natural regeneration (which

8
works for light-seeded shade-intolerant species, e.g. pines). Traditional shelterwood
cutting typically involves two-stages, an establishment or seed cut and final removal cut
(which works for species with advanced regeneration and intermediate tolerance, e.g.
oaks), but may also involve multiple removal cuts. Extended and irregular shelterwood
treatments involve maintaining mature trees (or reserves) for longer periods, typically up
to one additional rotation. The primary distinction between the seed tree and
shelterwood regeneration treatments involves the influence of residual trees on
microsite conditions (primarily light levels) for regeneration.
Uneven-aged silvicultural treatments include single-tree and group selection and
maintain at least three age classes at the stand level. This approach is also referred to
as ‖continuous cover forestry‖ treatments since it maintains perpetual forest cover
through partial cuts marked by periodic stand ―entries‖ or ―cutting cycles‖ rather than
―rotations‖ used in even-aged management. Single-tree selection is often practiced
based on the BDq method (Guldin, 1991) specifying a total basal area (B), maximum
diameter class at breast height (D), and target constant ratio between adjacent diameter
classes (q); which is conceptually a regulated stand with trees in each age/diameter
class represented by equivalent growing space (Nyland, 2001). Group selection occurs
with adjacent trees rather than only individuals and can be based on either a BDq or an
area control approach of maintaining equal area for each diameter class (generally
populous small diameter trees and exponentially fewer large diameter trees). Please
see Appendix A (Table A1) for a summary of employment of even- and uneven-aged
silvicultural treatments by forest type in the North America.
9
Disturbance-based forest management as an alternative to traditional even-
and uneven-aged silvicultural treatments
In at least two respects, even- and uneven-aged practices both fail to mimic natural
disturbances and thus fail to maintain structure to support or ―life boat through
disturbances‖ late seral species (Angers et al., 2005): (1) uniformity of application
spatially tending toward extremes of low (<10% basal area retained) or high (>70%
basal area retained) as opposed to variable retention; and (2) lack of retention of large
live standing and dead standing and downed trees. In terms of the first point for
example, openings of 20-200 m2 characterize uneven-aged management in hardwood
forests of New England and the Great Lakes, but openings up to 1000 m2 are
necessary for regeneration of intermediate species such as yellow birch (Webster and
Lorimer, 2005), openings with a wide range of 10-5000 m2 occur naturally with windfall
disturbances, and openings up to 8000 m2 are necessary for maintaining early-
successional bird species (Hanson and Lorimer, 2007). As an example of the second
point, late successional forests in the northern hardwood region are characterized by
abundant large live and standing dead trees (>=40 cm dbh), and late-successional
spruce-fir forests are characterized by this factor combined with large (>=35 cm dbh)
fallen woody debris (Whitman and Hagan, 2007), but this size of debris is uncommon in
managed forests. The rationale for natural disturbance-based forest management
involves limiting the ―manipulation of forest ecosystems...within the [historical range of
variability] established by natural disturbance patterns prior to extensive human
alteration of the landscape‖ (Seymour and Hunter 1999). In addition to maintaining
10
habitat for late-successional species, mimicry of natural disturbances may increase
provision of ecosystem services including carbon storage (Franklin et al., 2002). Our
modeling study examines whether these management practices (particularly variable
retention harvesting) affect carbon dynamics over a potential project lifetime of 100
years and we determined that rotation rather than retention is a significant variable for
intermediate to intolerant forest types, while the literature review in part (B) suggests
that the opposite may be true for intermediate to tolerant forest types.
Disturbance-based forest management or emulation silviculture involves three areas
that expand upon conventional silvicultural treatments: (1) variable retention harvesting,
a component of disturbance-based forest management involving retention of live trees
in multiple rotations to enable structural characteristics of mature forests, a treatment
that might be termed ―irregular shelterwood with reserves‖; targets for maintaining large
diameter (>=30 cm dbh) live trees or legacy trees include 14-20 m2/ha in northern
hardwood forests (Nunery and Keeton, 2010) and 6-10 m2/ha in longleaf pine (Palik et
al., 2010) (we mimicked this variable in FVS by establishing basal area retention targets
and establishing cutting rules to cut suppressed and codominant trees); and (2)
consideration of not only rotation and retention, but also spatial extent or magnitude,
which allows for potential landscape rather than only stand scale considerations, such
as maintenance of wildlife corridors and stream-side habitats (Lindenmayer and
Franklin 2002; Seymour et al. 2002) (this factor was not included in FVS due to spatial
limitations of the modeling program therefore potential biodiversity implications were not
considered).

11
Variability in size and frequency of historic disturbance regimes in U.S.
North and Keeton (2008) have reviewed natural disturbance history in a variety of
temperate forest types, and identified barriers to closely mimicking these disturbances.
In the Pacific Northwest, crown fire return intervals tend to be much longer than
commercial rotations for timber, varying along precipitation gradients from 200 years in
drier central Oregon to 1000 years in wetter coastal Washington. In addition, both fires
and wind blowdowns would impact 5,000-10,000 hectares at once under specific
environmental conditions, though the impact would be heterogeneous. In the Rocky
Mountain and Southeastern pine regions, low-intensity surface fires were historically
frequent, but spatially heterogeneous in fashion not typically accounted in current
management practices: entire watershed-scale burns of high intensity fires greater than
1,000 HA were infrequent (>250 years), riparian burns of approximately 10 HA were
also infrequent (>100 years), midslope surface burns of approximately 100 HA were
periodic (>20 years), and ridgetop burns of approximately 5 HA were frequent (>3.5
years). In New England, historic disturbances occur at various spatial and temporal
scales from moderate frequency (100 years) and low intensity (<10% of biomass
affected) and small extent (0.05 HA) from windthrow and surface fires to lower
frequency but higher intensity and extent from ice storms and hurricanes (Seymour et
al., 2002). A reconstruction of natural forest disturbances suggests that the current U.S.
Forest Service FIA inventory indicates that 4% of the landscape is currently in seedling-
sapling stage in Massachusetts, whereas 10% was in this stage in coastal pine-oak
forests that dominate the state under historic natural disturbance regimes, and 25% of

12
Maine forests are in seedling-sapling stage, whereas the historic natural disturbance
regime was 3-7% (Lorimer and White, 2003). In summary, although historical natural
disturbances provide a useful template for ecological comparison, barriers exist to exact
replication of historical disturbances including large-scale disturbances in Pacific
Northwest infeasible in checkerboard ownership landscapes, high variability in
disturbance intensity from fires in Rocky Mountains and Southeast that would greatly
complicate management, and low disturbance history in New England in areas with the
most productive commercial forest land.
13
Case study on variable retention component of
natural disturbance based silviculture: DEMO
One of the most intensively researched natural disturbance-based silviculture
experiments focused on variable retention is the Demonstration of Ecosystem
Management Options (DEMO) study, which consists of six treatments, each 13 ha in
size, replicated at six locations (blocks) in Douglas-fir dominated forests in western
Washington and Oregon (Hansen et al., 1995, Aubrey et al., 2008). The experiment
used a randomized complete block design:
(1) unharvested control—a reference for assessing responses to harvest and natural
temporal variation
(2) 75% aggregated retention—all merchantable trees (>18 cm dbh) were harvested
from three 1-ha circular gaps (56.4 m radius; 25% of the treatment unit);
(3) 40% aggregated retention—five circular 1-ha aggregates were retained (40% of the
treatment unit); all merchantable trees in the surrounding matrix (―clearcut areas‖)
were harvested;
(4) 40% dispersed retention (highest stand retention level to allow morphological
development of Douglas-fir)—dominant and co-dominant trees were retained in an
even distribution throughout the treatment unit; in each block, the basal area retained
was equal to that retained in the corresponding 40% aggregated treatment;
(5) 15% aggregated retention—two circular 1-ha aggregates were retained (15% of the
treatment unit); all merchantable trees in the surrounding matrix were harvested;
(6) 15% dispersed retention—dominant and co-dominant trees were retained in an even
distribution throughout the treatment unit; in each block, the basal area retained was
14
equal to that retained in the corresponding 15% aggregated treatment (Aubrey et al.,
2008).
Aggregate retention patterns >20% basal area provided greatest benefits in
late seral species retention in gymnosperm and mixed forests
Aggregates at 40% retention provided refugia for a variety of late seral species including
litter-dwelling arthropods, flying squirrels, shade-tolerant vascular plants, and
bryophytes such as mosses and liverworts, compared to dispersed retention treatments
(Aubrey et al., 2008). Greater retention of coarse barked hardwood tree species in
aggregates also enabled lichen growth. Due to contrasting neighborhood impacts of
angiosperm and gymnosperm tree species (such as differences in calcium soil and
depth of the duff due to litter quality and decomposition rates), hardwood survival was
higher in aggregations. A review of green tree retention in gymnosperm forests
suggests that aggregates of greater than at least 20% basal area and at least one
hectare size can provide biodiversity benefits, such as favoring bryophytes which
require shady, moist habitats (Rosenvald and Lohmus, 2008). Aggregated retention
can also allow strategic location of aggregated retention areas as wildlife corridors or
streamside protection zones. Higher and aggregated retention patterns were also
favored aesthetically, although greater slash (which provides habitat for bryophytes,
salamanders and other species) was viewed negatively (Ribe, 2009).

15
Dispersed retention patterns provided greatest tree growth benefits, but
studies vary on appropriate level of retention for Douglas-fir to provide
sufficient light
The growth efficiency of dispersed retention at 40% was greatest due both to removal of
trees in lower crown classes which may have been deformed or dying, and also wider
distribution to fully utilize growing space (Aubrey et al., 2008). In contrast, dispersed
trees at 15% retention had high annualized cumulative mortality from windthrow. High
rates of mortality due to skidding damage near trails (far exceeding 0.5% estimated
background mortality rate) is also likely in dispersed retention treatments during first 5-
10 years after felling (Thorpe et al., 2008), but was not reported with DEMO.
Other studies, in contrast to DEMO findings, have demonstrated reduced height growth
at 25-40% dispersed retention for intolerant Douglas-fir and larch relative to 0%
retention, but not for shade tolerant species such as cedar, fir and spruce (Drever and
Lerzman, 2001, Newsome et al., 2010). Harmon et al. (2009) suggests that 20%
dispersed retention treatments may diminish Douglas-fir populations to 35% from 70%
of live tree biomass. Another risk besides species shifts in partial harvests is spread of
Armillaria ostoyae and Inontus tomentosus root rots, but no evidence of increased
incidence was reported during at least first five years of stand development with up to
50% retention (DeLong et al., 2005).
16
(B) Even and uneven-aged management practices impacts on forest carbon during a potential project lifetime (i.e. 100 years).
Initial conditions of species composition and site quality determine carbon
storage potential
Forest types might be targeted for forest carbon projects based on their carbon stocks
and predicted response to management interventions. In a boreal mixed wood
simulation of 200 years, maximizing carbon involved intensifying harvests in
gymnosperm stands via conversion from natural regeneration to plantations to increase
forest product carbon storage, while also minimizing harvests in angiosperm stands
which have higher wood densities and growth rates (2.5 m3/ha/yr vs. 2.0 m3/ha/yr) to
increase forest ecosystem carbon storage (Hennigar et al., 2008).
In addition to forest type, differences in site quality may influence carbon storage
potential. Within a given forest type, higher than average site quality may mitigate
diminishment of carbon stocks from disturbances by approximately 10-20% due to
faster annual live tree growth rates (Keyser, 2010).
17
Higher live tree retention of larger diameter trees will create higher carbon stocks
in intermediate to shade-tolerant angiosperm forests
Starting with an initial condition of a standing forest, any natural or human disturbance
that reduces live tree biomass will reduce ecosystem-level carbon stocks, partly due to
processing inefficiencies of 33-50% of cut volume (Harmon et al., 2009).
Nunery and Keeton (2010) used the Forest Vegetation Simulator (FVS) to project forest
carbon and wood product carbon over 150 years in response to various silvicultural
treatments in the northern hardwood forest type. Initial forest conditions were based on
data from 32 US Forest Service Forest Inventory and Analysis plots. Simulations of a
range of even-and uneven-aged prescriptions demonstrated that greater retention
resulted in greater carbon stocks, with stands treated with individual/single tree
selection (ITS) storing up to 33% greater carbon than stands treated with clearcutting
(see Figure B1). Favoring retention of larger diameter live trees in particular (via high
legacy tree retention targets of up to 12 trees/ha of average 41 cm dbh in the single tree
selection treatments) increased forest carbon storage and had a more substantial
impact than either extension of rotation or cutting cycle length.

18
FIGURE B-1 Nunery and Keeton (2010)
Retention of larger diameter trees in particular may have a positive impact on forest
carbon stocks (Nunery and Keeton, 2010). Commercial thinning in an even-aged
cherry-maple forest showed that thinning primarily overtopped and suppressed trees
from below only accelerated stand growth and development, resulting in similar levels of
forest ecosystem carbon to untreated stands after 25 years (Hoover and Stout, 2007).
However, thinning from above that removed dominants and co-dominants to the same
relative density target reduced stand carbon stocks including live tree, dead wood and
forest products by one-third over the 25 year period, presumably via stagnation.
19
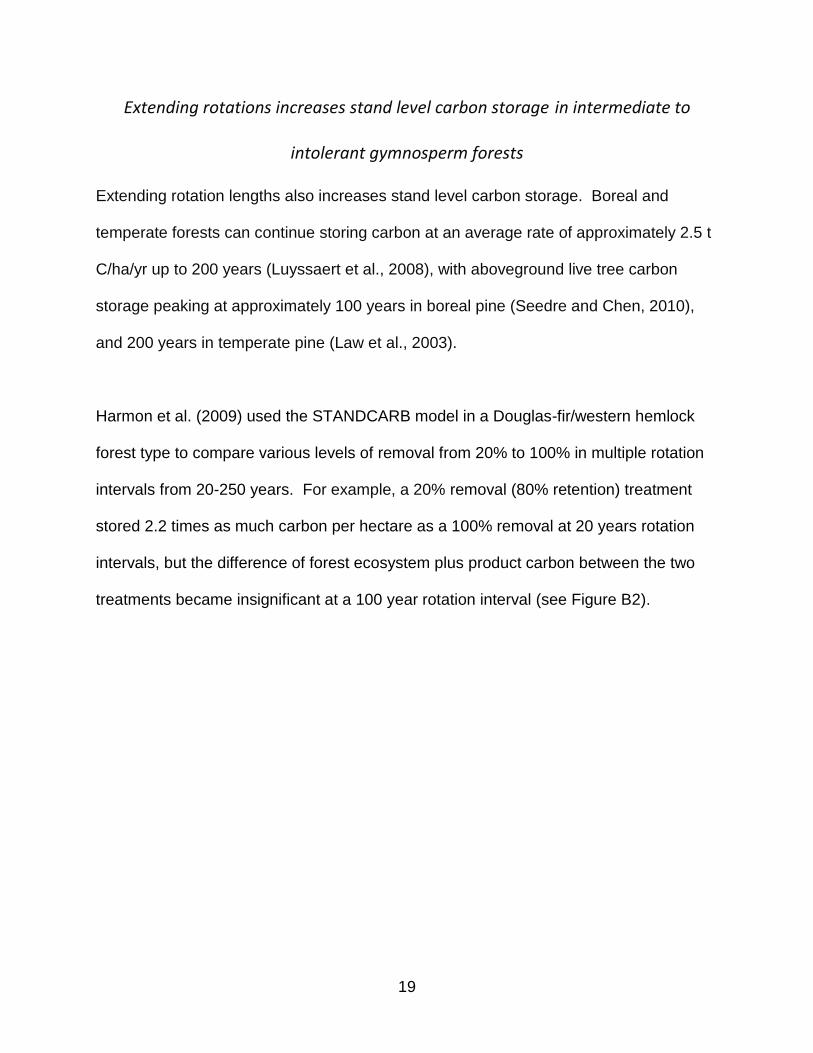
Extending rotations increases stand level carbon storage in intermediate to
intolerant gymnosperm forests
Extending rotation lengths also increases stand level carbon storage. Boreal and
temperate forests can continue storing carbon at an average rate of approximately 2.5 t
C/ha/yr up to 200 years (Luyssaert et al., 2008), with aboveground live tree carbon
storage peaking at approximately 100 years in boreal pine (Seedre and Chen, 2010),
and 200 years in temperate pine (Law et al., 2003).
Harmon et al. (2009) used the STANDCARB model in a Douglas-fir/western hemlock
forest type to compare various levels of removal from 20% to 100% in multiple rotation
intervals from 20-250 years. For example, a 20% removal (80% retention) treatment
stored 2.2 times as much carbon per hectare as a 100% removal at 20 years rotation
intervals, but the difference of forest ecosystem plus product carbon between the two
treatments became insignificant at a 100 year rotation interval (see Figure B2).
20
FIGURE B-2: Harmon et al., (2009)
(C)Effect of even-aged management and uneven-aged management on lying
dead wood, litter and duff, and soil carbon.
Lying dead wood
Lying dead wood or downed necromass includes branches, twigs, and boles that can be
divided into fine woody debris and coarse woody debris based on size class. U.S.
Forest Service Forest Inventory and Analysis (FIA) establishes size classes based on
diameter at mid-point of segment length. Fine woody debris includes: <0.64, <2.5, and

21
2.5-7.6 cm size classes based on fire fuel classes (0.25-1, 1-5, 5-10 cm based on
Intergovernmental Panel on Climate Change (IPCC) 2006 Guidelines for National
Greenhouse Gas Inventories definition). Coarse woody debris includes: 7.6-22.6 and
>22.6 cm size classes (10-20, >20 cm size based on IPCC Guidelines). In addition to
size, woody debris is typically characterized by species name and decomposition state
on an index from 1-5, with 1 being newly fallen to 3 being branchless to 5 being nearly
fully decomposed (Maser et al., 1979). Rates of decomposition for downed wood are
typically 1-5%/yr in gymnosperm and mixed forest high latitude zones with low
temperatures unfavorable to decomposition (Laiho and Prescott, 2004) 5-10%/yr in
angiosperm temperate forests (Harmon and Hua, 1991, Gough et al., 2007) and
10+%/yr in wet lowland tropical forests. High lignin content and high volume to surface
ratios are additional factors that may slow decomposition. Laiho and Prescott (2004)
estimate that 15 cm average diameter gymnosperm logs in direct contact with ground in
Alberta, Canada, would decompose completely in 35-45 years.
Table B.1 in Appendix B shows 5-15% of aboveground ecosystem carbon stored in
lying dead wood in New England northern hardwood forest, 8% in mid-Atlantic oak-
hickory forest, and 5-10% in Rocky Mountain western conifer forest (Bradford et al.,
2009), which exceeds required carbon accounting in shrubs and herbaceous understory
and matches accounting for standing dead wood. Similar results were found in a boreal
forests (Hagemann et al., 2009) and moist and montane neotropical forests (Delaney et
al., 1997). The inclusion of aboveground stumps as coarse woody debris in managed
forests can further increase coarse woody debris stocks (North et al., 2009).
22
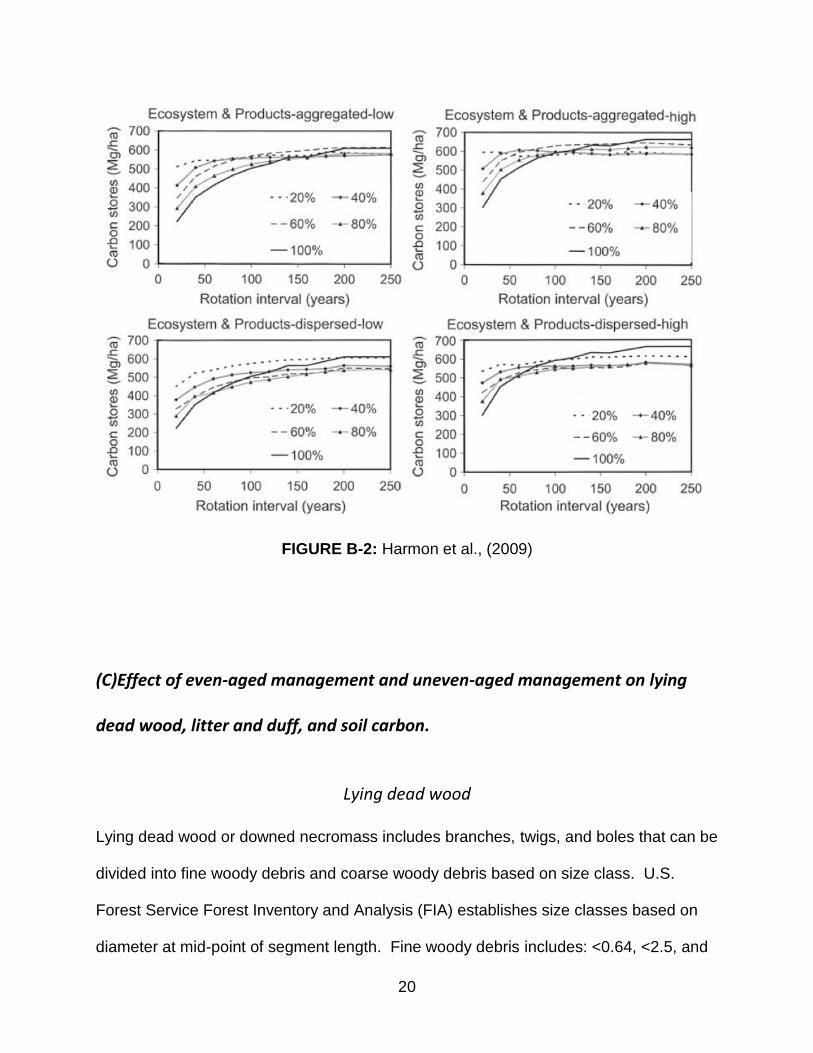
Woody debris accumulation typically follows a U-shaped curve during even-aged forest
stand development, with the largest volumes encountered during the stand initiation
stage, followed by decomposition so that levels drop to a minimum during stem
exclusion stage, then rebuilding again with contribution of detritus from single tree and
group senescence during the understory re-initiation stage (Oliver and Larson, 1996).
Woody debris recruitment (both standing and downed) is determined not only by stand
development stage, but also by type, frequency and intensity of past disturbances, both
human and natural (Pyle et al., 2008). In a boreal black spruce-balsam fir forest for
example, total aboveground biomass of fallen necromass was 54 t C/ha immediately
after commercial clearcut harvesting, over eight times greater than biomass in snags,
then dropped to 10 tons 17 years after harvest and reached minimum of 2.5 tons 35
years after harvest, then rose again to 24 tons at old growth stage over 100+ years in
chronosequence (Hagemann et al., 2009).
Even-aged management is likely to negatively influence standing but not necessarily
downed wood stocks in the short term, depending on tree utilization for biomass,
firewood, or pulp markets, and also subsequent slash treatment5. Eight years post-
harvest in Missouri Ozark Mountains, snag biomass in clearcuts was less than one-
tenth the level in unharvested control and single-tree selection. In contrast, downed
5 In terms of natural forest management, snags are widely recognized as an important component of
wildlife habitat. . Lohr et al. (2002) demonstrated the importance of snags by removing them in 40- to 50-year old loblolly pine plantations in South Carolina, which negatively affected total bird species diversity and dramatically reduced woodpecker abundance. However, fallen woody debris removal also caused declines in populations of nearly all bird guilds including weak excavators, secondary cavity nesters, and neotropical migrants who used debris primarily for feeding on insects.
23
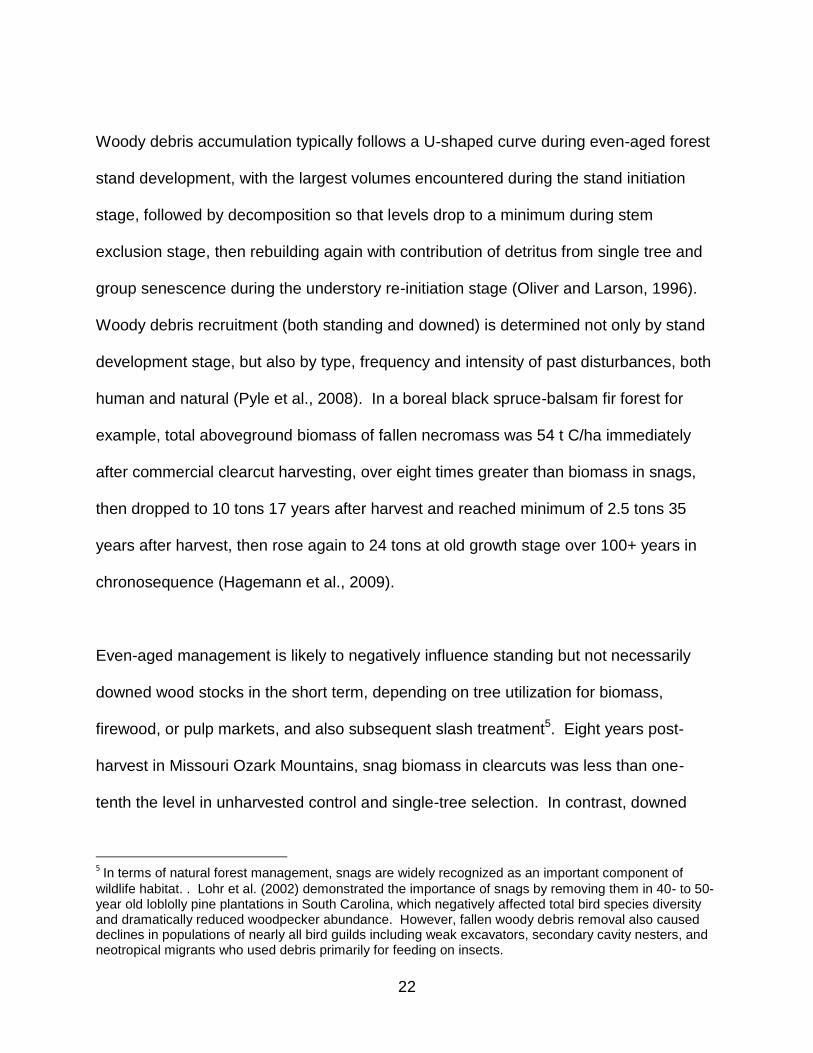
woody debris biomass was two times the level in clearcut as in control and single-tree
selection (Li et al., 2007). Over time, the paucity of retention of both live and dead
standing trees in clearcuts with slash treatment will reduce the recruitment of downed
dead wood. Over 30 years after clearcutting treatments in the northern Rocky
Mountains, fallen coarse woody debris biomass was 700% lower in second growth
clearcut than in old growth forests (1 t C/ha vs. 7 t C/ha), even though other biomass
stocks were only approximately 100% lower including live trees (25 t C/ha vs. 47 t
C/ha), coarse roots (6 t C/ha vs. 13 t C/ha), and forest floor (5 t C/ha vs. 8 t C/ha)
(Bisbing et al., 2010).
FIGURE C-1: (Woodall and Westfall, 2009).
Litter and duff

24
Litter, on top of duff, constitutes recognizable non-woody plant parts, such as leaves
and flowers (O1 organic matter layer) (6-10 mm in diameter based on IPCC standards).
Duff constitutes partly decomposed, relatively uncompacted organic material above
mineral soil (O2 organic matter layer) (2-6 mm diameter based on IPCC standards).
Together duff and litter constitute the forest floor.
In boreal forests, the quantity of carbon in forest floors may be particularly high,
constituting an equivalent of 40% of aboveground carbon stocks, exceeding many other
stocks outside of live trees, due to low rate of decomposition (Kranabetter, 2009; Table
C.1). Similar ratios are found in gymnosperm high alpine regions (Bradford et al.,
2009). The forest floor carbon stocks might also account for bryophytes such as
sphagnum moss and buried coarse woody debris in boreal and wet temperate forests,
which can more than double the proportion of total ecosystem carbon stored in the
forest floor (Goulden et al., 2008). Regeneration harvests promote increased
decomposition of organic matter due to increased temperatures and soil surface
exposure, thus reducing forest floor depth, but this impact may be offset by the organic
matter contribution to soil from logging slash (Johnson and Curtis, 2001). In temperate
forests, the forest floor generally constitutes the equivalent of 10-30% of aboveground
carbon stocks as shown Table C.1 (Johnson et al., 2010). In tropical forests the forest
floor generally constitutes <10% of ecosystem biomass due to rapid decomposition
rates (Delaney et al., 1997). Changes in the forest floor carbon pool, though
uncorrelated with live tree retention as explained below, can significantly influence total
forest carbon stocks.
25
Logging operations (such as dispersed ground-based skidding without snow cover)
rather than silvicultural treatment are anticipated to have the greatest impact on forest
floor carbon by causing physical disturbance and accelerating forest floor
decomposition (Jandl et al. 2007). In addition, broadcast burning can result in losses of
litter carbon up to 60% during the first five years post burn, without evident re-
accumulation by year 20 (Kranabetter and Macadam, 2007). Prescribed burning for
crown fire control in Rocky Mountain conifer forests resulted in emissions of 4.5-18 t
C/ha, largely from forest floor emissions, and resulted in emissions of 14.5 t C/ha in
northern California (North et al., 2009). Thinning small to medium sized trees to
concentrate diameter increment in larger trees can partially offset these emissions over
10-20 years (Hurteau and North, 2009), but these emissions must be counted at the
time they occur under accrual accounting principles. Peat soil draining may also
significantly reduce forest floor carbon.
Soil Carbon
Mineral soil carbon is a significant component of forest ecosystem carbon stocks,
typically constituting between one-third and two-thirds of total ecosystem biomass and
typically outweighing aboveground tree biomass in young forests. However, neither
forest age nor natural or human disturbance appear to impact soil carbon in a consistent
manner. For example, in an Ozark oak forest uneven-aged management and
clearcutting did not result in significant soil carbon change relative to unharvested
control (Li et al., 2007). Thinning and regeneration harvests have also had no
consistent impact on soil carbon in boreal forests (Martin et al., 2005). Over 100 years

26
or longer, modeling in boreal forests suggests that whole tree harvests (removing entire
trees from a stand rather than only the boles without dispersion of tops and branches
back into the stand) will diminish soil organic matter and nitrogen content, thus
diminishing net primary productivity by up to one-third (Peng et al., 2002). However,
field studies in northern New Hampshire and Maine temperate forests with a short time
of 15 years have not demonstrated reductions in soil carbon under whole tree
harvesting treatments (McLaughlin and Philips, 2006). Indeed, over a 2 year period,
whole tree harvesting and clearcutting in Douglas-fir forests in Washington increased
mineral soil carbon (>50 cm depth) relative to levels under initial forest cover conditions
by increasing root decomposition via higher temperatures (Slesak et al., 2009). In
contrast to peat drainage in tropical forests (Page et al., 2002), peat drainage in
temperate and boreal forests may not necessarily involve net greenhouse gas
emissions as drainage minimizes sedge growth, and sedges are a main exporter of
methane to the atmosphere from methanogenic microbes, though a time lag may be
involved which will need to be accounted until forest carbon stocks reach a density over
100 m3/ha which reduces sedge growth (Minkkinen et al., 2002). Soil carbon is not
anticipated to change substantially as a result of most project activities, except in cases
of direct soil disturbance such as plowing, ripping, furrowing, and subsoiling which are
widely documented to reduce forest ecosystem carbon (Dias et al., 2007). Research
on potential negative soil carbon impacts from multiple rotation whole tree harvests and
also peat drainage in boreal and temperate forests should continue to be monitored.
27
(D) A Case Study of the Carbon Stocks in Various Management Regimes in a
Coastal Pacific Northwest Douglas-Fir Forest Type
Introduction
The carbon sequestration and storage implications of silviculture for North American
forests have been studied for a number of geographical areas, forest types, and life
cycle components. Past studies have not, however, addressed in detail the question of
how quantification results differ depending on the scope of the analysis (i.e., different
sources, sinks, and effects considered). The study presented here examines the net
sequestration of carbon under a range of silvicultural practices quantified according to
Version 3.2 of the CAR forestry protocol for improved forest management.
Methods
The Pacific Northwest Cascade mixed forest (McNab et al. 2005, M242), Oregon and
Washington Coast Range was studied. Initial starting data were from the USDA Forest
Service, Forest Inventory Analysis (FIA) program (FIA 2010). The growth simulator used
was the Forest Vegetation Simulator (FVS), Pacific Northwest variant (PN) version
07/02/2010 (Keyser 2010).
The carbon estimates were based on the FIA volume and biomass functions for above-
ground live tree components (FIA 2009a, b), the function given in the protocol for below-
28
ground live tree biomass (Cairns et al. 1997), and other components were estimated
using the FVS Fire and Fuels Extension (FFE) carbon tracking (Rebain 2010).
The following parameters were used to screen plots, producing a similar set of data for
analysis.
(3) Assessment Area: M242A
(4) Forest Type: 201, Douglas-fir
(5) Maximum Slope: 50%
(6) Landowner Code: 46, private
(7) Maximum Elevation: 3000 feet (914 meters)
(8) Ground Land Class: 120, timberland
(9) Physiographic Class: Mesic
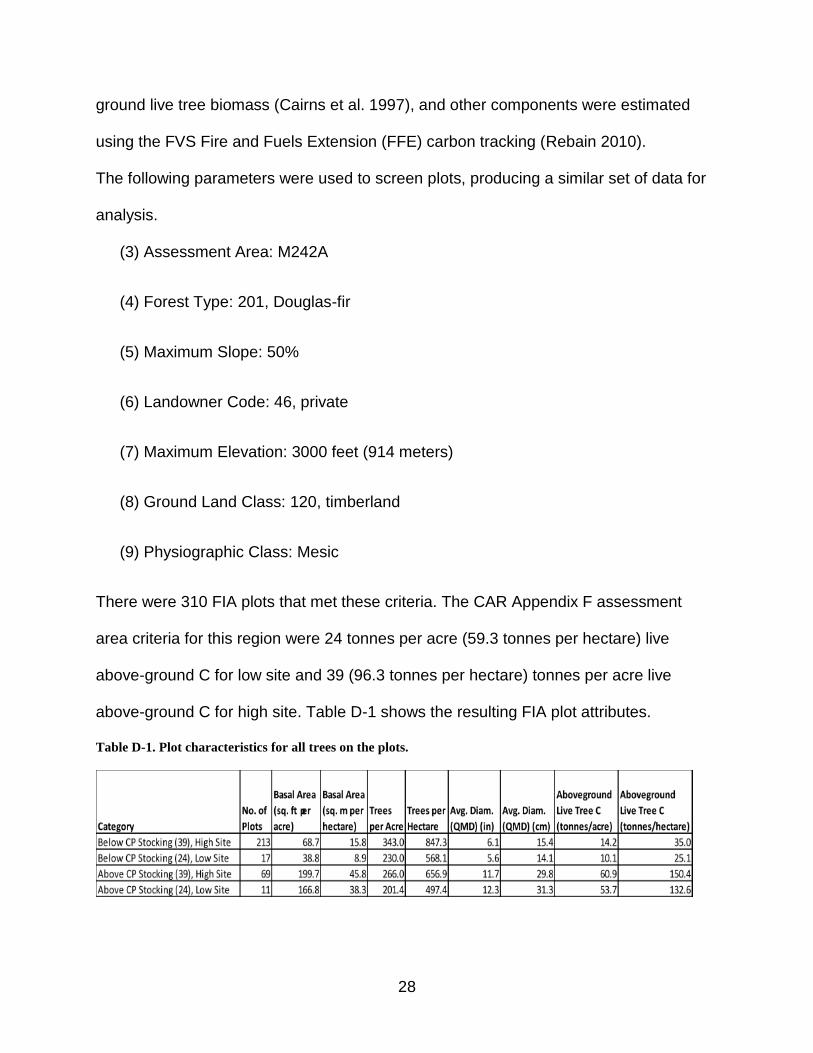
There were 310 FIA plots that met these criteria. The CAR Appendix F assessment
area criteria for this region were 24 tonnes per acre (59.3 tonnes per hectare) live
above-ground C for low site and 39 (96.3 tonnes per hectare) tonnes per acre live
above-ground C for high site. Table D-1 shows the resulting FIA plot attributes.
Table D-1. Plot characteristics for all trees on the plots.
29
In order to estimate the relative carbon stocks produced based on the CAR forestry
protocol, 100-year simulations of growth, harvest and regeneration were produced.
Each simulation started with the FIA measured data assuming a start year of 2010.
Plots were grown in 5-year increments. If a harvest occurred in a decade then it was
scheduled to occur mid-period so that 5 years of growth would occur before and after
the harvest. Regeneration harvests (clearcut, variable retention) were followed by
planting of Douglas-fir on a 12x12 foot (3.7 m) spacing, which produced 304 trees per
acre (751 trees per hectare). Where the stand age was available for the plot, it was
used as a criterion for implementing a regeneration harvest. Otherwise a zero age was
assigned. Each regeneration cycle was repeated. Considering a 50-year rotation for
example, if a stand was 30 years of age it was harvested in decade three and again 50
years later in decade eight in the FVS projections. A range of silviculture was
considered including a no-harvest scenario; clearcut at ages 30, 50, 70 and 90; and
dispersed variable retention (VR) leaving 15% and 40% of basal area at ages 30, 50, 70
and 90. Each plot was considered independently as a project. This allowed an analysis
to identify factors that were influential on carbon stocking under the Climate Action
Reserve protocol. Grouping plots into projects would have been more realistic from a
project development perspective, but would have reduced the ability to draw inferences
with the subsequent analysis. When combining all the plots it was possible to examine
other factors such as site quality and starting inventories. The example in Appendix C
was for carbon yields and not reductions, which requires a projection of project activity
and baseline to calculate gross reductions. Gross reductions were estimated using a
linear programming optimization library (GIPALS, 2010) as part of Spatial Informatics

30
Group, LLC carbon analysis software. Reductions for each plot were calculated by
maximizing the gross CRTs. Baselines were allowed to select any combination of
prescriptions while project activities were run using the following scenarios.
(1) Grow with no harvest.
(2) Clearcut at 30 years.
(3) Clearcut at 50 years.
(4) Clearcut at 70 years.
(5) Clearcut at 90 years.
(6) Dispersed Variable Retention (15% retention) at 30 years.
(7) Dispersed Variable Retention (15% retention) at 50 years.
(8) Dispersed Variable Retention (15% retention) at 70 years.
(9) Dispersed Variable Retention (15% retention) at 90 years.
(10) Dispersed Variable Retention (40% retention) at 30 years.
(11) Dispersed Variable Retention (40% retention) at 50 years.
(12) Dispersed Variable Retention (40% retention) at 70 years.
(13) Dispersed Variable Retention (40% retention) at 90 years.
Reductions were calculated based on the CAR improved forest management equation
6.1 in version 3.2 of the forestry protocols. This incorporated onsite and offsite carbon, a
20% leakage deduction, secondary effects estimates and negative carryovers. Buffer
pool reductions were not applied as they would have been the same across all plots and
would not have contributed information to the analysis. If the project activity landfill pool
was less than the baseline landfill pool then the difference was subtracted from the
reductions. If offsite carbon reductions were greater than onsite carbon reductions then
an adjustment was made disallowing the difference in credit, which is consistent with
the protocol.
31
Data Analysis
The age class distribution of the plots was plotted to inform the context of the harvest
scheduling. The simulations described above resulted in 4,030 data points for analysis.
Two response variables were analyzed:
1. required carbon pools, and
2. all carbon pools but soil (inclusion of fallen woody debris, shrubs, and forest floor
in-situ carbon pools).
The data was analyzed using recursive partitioning (Breiman et al. 1984; Everitt and
Hothorn 2006; Murthy 1998). The Rpart library (Therneau et al. 2007), version 3.1-36,
was used for the modeling analysis. Recursive partitioning on the data was conducted
using default parameters. Pruning of the resulting trees was conducted automatically
using the cost-complexity prune function (Breiman et al. 1984) to minimize the cross-
validated prediction error (Everitt and Hothorn 2006).
The independent variables considered were as follows:
Silvicultural method + Rotation Age: Clearcut (30, 50, 70, 90), VR-15 (30, 50, 70, 90), VR-40 (30, 50, 70, 90), No-harvest
Silvicultural method: Clearcut, VR-15, VR-40, No-harvest
Rotation Age: 30, 50, 70, 90, NA(no-harvest)
Common Practice Site Class: Low or High
Quadratic Mean Diameter (QMD) of the initial stand
Gross thousand cubic foot volume of the initial stand
Site Class based on FIA classes: 1-7
Percent slope: 0-100%
Aspect: 0 - 359 degrees
32
Age of initial stand
The site classes and common practice site class produced the same results as did the
QMD and volume of initial stands. The carbon pool contributions were estimated for
each scenario that was identified as statistically significant. This was done for the
analysis conducted on all the pools but soil and was reported as percent contribution.
Two additional analyses were performed to compare the impacts of the protocol rules
relative to a straight averaging of carbon yields over the 100-year period for the
projected project activity. This was done for the required pools and all the pools except
soil. The landfill pool was included.
Results
The age class distribution is shown in Figure D-1. Private forestlands in this region are
clearly distributed in younger age classes, which will have a bearing on the results of
the analysis given that we are considering a 100-year harvest schedule. Tables D-2 and
D-3 (metric) shows the average carbon stocks in order of importance with factor II being
a subset of factor I, etc. Unharvested stands produced the highest average carbon
stocking (248 t/a) and rotation age 30 produced the lowest average carbon (95 t/a).

33
Figure D-1. Age class distribution of plots.
Rotation ages of 70 and 90 produced the highest stocking, where harvesting occurred,
with an average of 161 t/a. Higher quality sites (FIA site class 1-3) produced higher
stocking on average than lower quality sites: 167 t/a versus 98 t/a. Higher sites with
rotation ages of 70 produced higher carbon stocking on average than 90 year rotations:
186 t/a versus 148 t/a. Rotation ages of 50 produced average carbon stocks of 130 t/a.

34
Table D-2. Average carbon stocks from project activity (carbon tonnes/acre) for the required pools only.
I II III I II III
248
Higher Initital Vol. 267
Lower Initial Vol. 194
161
Lower Site 98
167
Rotation Age 70 186
Rotation Age 90 148
Rotation Age 50 130
Rotation Age 30 95
Factor Average Stocks
Rotation Age 70 and 90
Higher Site
No harvest
Table D-3. Average carbon stocks from project activity (carbon tonnes/hectare) for the required pools only.
I II III I II III
613
Higher Initital Vol. 659
Lower Initial Vol. 479
398
Lower Site 242
412
Rotation Age 70 459
Rotation Age 90 366
Rotation Age 50 321
Rotation Age 30 235
Factor Average Stocks
Rotation Age 70 and 90
Higher Site
No harvest
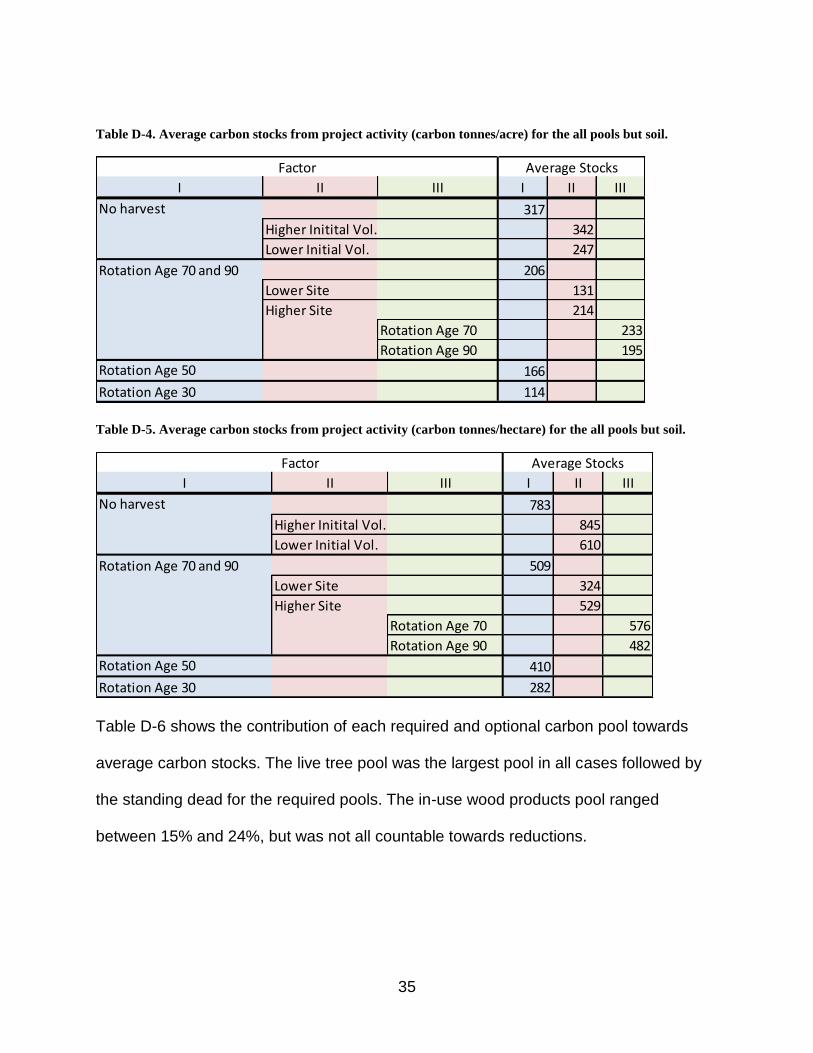
Tables D-4 and D-5 (metric) show the resulting average carbon stocks considering all
the carbon pools but soil. The general patterns are the same.
35
Table D-4. Average carbon stocks from project activity (carbon tonnes/acre) for the all pools but soil.
I II III I II III
317
Higher Initital Vol. 342
Lower Initial Vol. 247
206
Lower Site 131
214
Rotation Age 70 233
Rotation Age 90 195
Rotation Age 50 166
Rotation Age 30 114
Factor Average Stocks
Rotation Age 70 and 90
Higher Site
No harvest
Table D-5. Average carbon stocks from project activity (carbon tonnes/hectare) for the all pools but soil.
I II III I II III
783
Higher Initital Vol. 845
Lower Initial Vol. 610
509
Lower Site 324
529
Rotation Age 70 576
Rotation Age 90 482
Rotation Age 50 410
Rotation Age 30 282
Factor Average Stocks
No harvest
Rotation Age 70 and 90
Higher Site
Table D-6 shows the contribution of each required and optional carbon pool towards
average carbon stocks. The live tree pool was the largest pool in all cases followed by
the standing dead for the required pools. The in-use wood products pool ranged
between 15% and 24%, but was not all countable towards reductions.

36
Table D-6. Contribution of each carbon pool as a percent of the total average stocking.
Live Tree Standing Dead In-Use Landfill Shrubs/Forbs Down Dead Floor
No Harvest 64% 14% 0% 0% 0% 17% 4%
Rot. Ages 70 and 90 41% 11% 15% 10% 0% 17% 6%
Rot. Ages 70 and 90, Lower Site 38% 10% 16% 11% 0% 17% 8%
Rot. Ages 70 and 90, Higher Site 41% 12% 15% 10% 0% 17% 6%
Rot. Age 70, Higher Site 49% 11% 14% 10% 0% 16% 6%
Rot. Age 90, Higher Site 37% 13% 18% 12% 0% 20% 7%
Rot. Age 50 35% 10% 24% 16% 0% 15% 8%
Rot. Age 30 49% 4% 24% 16% 0% 7% 11%
Description
Required Pools Optional Pools

37
Discussion
Carbon stocks produced using the CAR forestry protocol for improved forest
management were clearly influenced by presence or absence of harvesting activities.
Preservation scenarios were optimal for carbon stocks, but we did not consider leakage,
land-use change nor natural disturbance risk from wind and fire. For example, in terms
of land-use change, if a working forest was converted to a "no harvest" management
then leakage would emerge as a larger factor. Next to presence and absence of
harvesting, the next most influential factor appeared to be the age of the harvested
trees. For the forest type modeled, Northwest Coast Douglas-fir, a rotation age of
around 70 appeared optimal, probably due to culmination of mean annual increment.
Shorter rotations of 50 and 30 years produced the lowest stocks on average in Douglas-
fir, with a reduction of over two-thirds compared to a 70 year rotation. A rotation of 90
years reduced carbon stocks compared to 70 years. Projections of coastal redwood
would be longer to maximize carbon based on its later culmination of biomass, likely
over 100 years; and projections of loblolly pine would be shorter based on its earlier
culmination.
The third substantial finding was that site class and initial stocking were influential in
determining carbon stocks for 70 year rotations; and initial stocking was significant for
90 year rotations. Lower site class reduced carbon stocks by nearly 60% by lowering
growing space potential. Initial stocking levels had a similar but less profound impact of
approximately 30% likely due to reversal of biomass volume from high initial to lower
38
residual levels with harvesting (in line with our initial finding that all harvesting reduces
ecosystem level carbon in a standing forest).
A complex array of factors combine when considering silviculture within a 100-year
harvest schedule with fixed rules for the various on and offsite carbon pools. The use of
realistic inventory data representative of a region (FIA) in a simulation context (FVS) is a
useful means of understanding this complexity in a real-world context and identifying
important variables over time.
This analysis shows that:
1) all harvesting reduces forest carbon by over 40% when starting with a
standing forest;
2) rotation length overrides retention due to silvicultural treatment as the
significant factor influencing forest carbon and the age of maximum mean
annual increment for the dominant species likely determines the rotation
interval for maximizing forest carbon; variable retention treatments had no
significant impact on carbon stocks when considering all forest carbon stocks,
and may have had negative impacts due to leakage not considered in our
analysis;
3) higher site quality classes will enable greater carbon reductions over time and
lower initial stocking levels will allow less diminishment from harvesting,
together increasing potential carbon stocks.

39
A 100-year harvest schedule is necessary for baseline calculations in a Climate Action
Reserve improved forest management project. The project activity could, however, be
as short as one year with subsequent monitoring. Project length, initial inventory
conditions, economics, or other factors could influence optimal carbon reductions for a
given project. We modeled dispersed variable retention silviculture in this paper as a
means of characterizing silviculture less intense than clearcutting but still actively
managed. While difficult to model accurately due to competition and regeneration
factors, other forms of silvicultural methods such as aggregated variable retention,
group selection or single tree selection may interact with the other factors analyzed in
this paper in different ways in this and other forest types.

40
APPENDIX A
Variation in the use of even- and uneven-aged management practices by forest type and biogeographic region in North America.
Silviculture practices vary by region. Table A1 displays this variation and
compares the dominant silviculture activity to the natural disturbance most
commonly associated with the forest type.
TABLE A1: Common management practice by forest type in U.S. (Barrett, 1995)
Note the following trends:
*Uneven-aged treatments generally have frequent entry cycles compared to even-aged
rotation lengths to achieve similar volume targets;
*Uneven- and 2-aged treatments are primarily employed in forests with windthrow and
surface fire natural disturbance history, whereas even-aged treatments are primarily
employed in forest types with crown fire disturbance history;
*Note that uneven-aged silvicultural treatments are not widely employed in reality. In
areas with high landownership by nonindustrial private/family forest owners such as
U.S. Northeast and Southeast (Best et al., 2001), exploitative partial harvesting to
maximize current harvest economic value without consideration of future stand growth
and regeneration is commonplace (Munsell and Germain, 2007), typically involving
―high grading‖ (selective cutting of individual trees of highest commercial value in terms
of size, species, and quality).

41

42

43

44
45
APPENDIX B
(B) Relative carbon stocks by carbon pools in various forest types
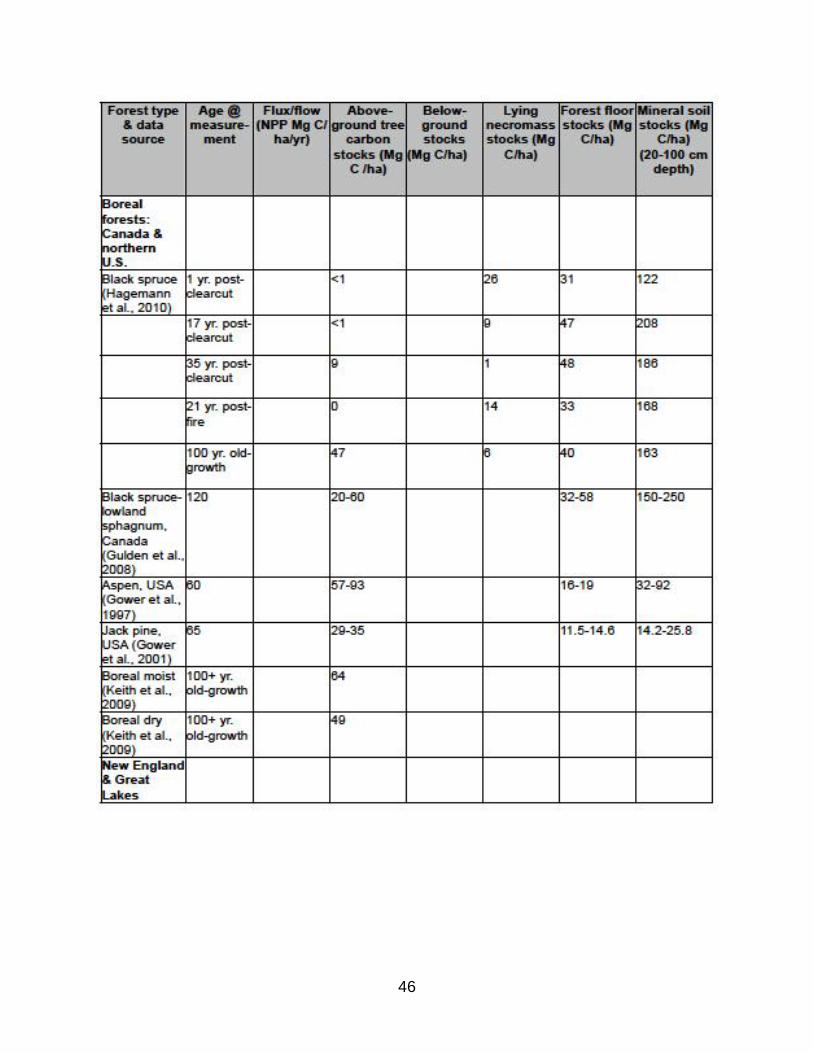
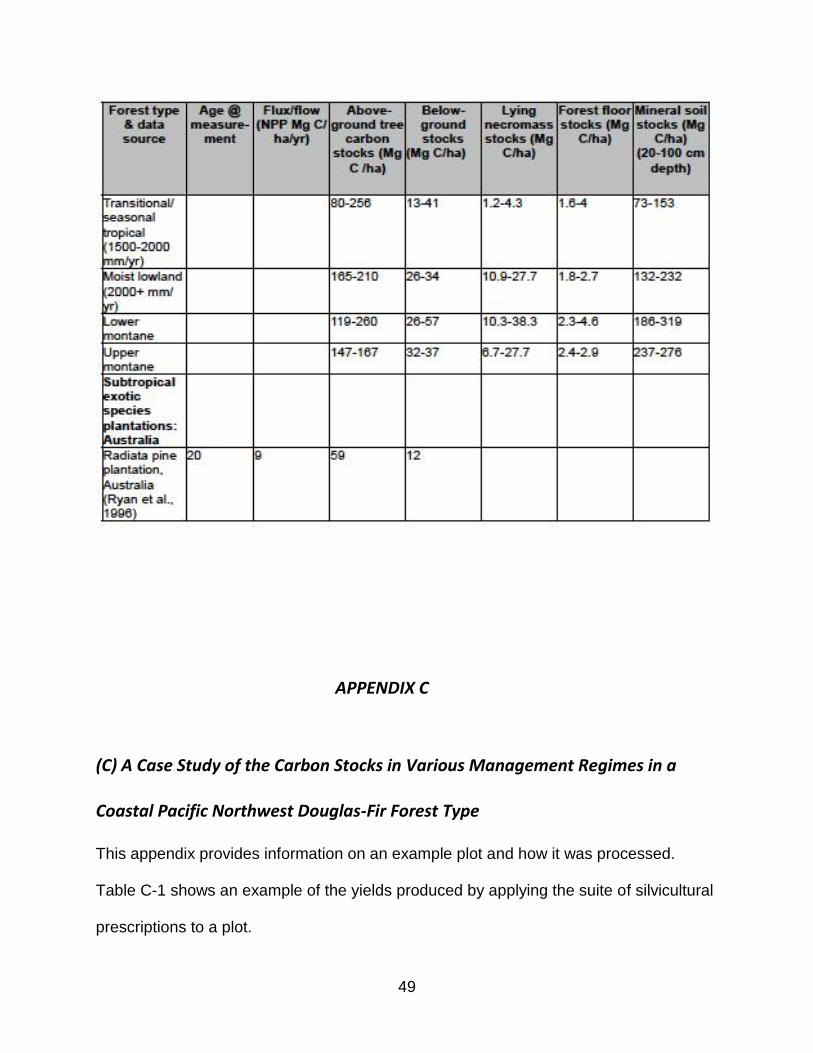
TABLE B1: Representative summary of measured carbon stocks in various
forest types.
Note the following trends:
*aboveground tree biomass (live and dead) increases with age and is highest in moist
temperate forests, such as Pacific Northwest;
*belowground biomass varies from 12-66% of aboveground tree biomass and is
greatest in young forests and in dry forests as a proportion of aboveground biomass;
*lying necromass varies from 2.5-20% of aboveground tree biomass and has low
correlation with forest age and type since it is strongly influenced by disturbances,
generally following a U-shaped curve from high densities at early and late successional
stages;
*forest floor (C) ranges widely from <10% to >50% of aboveground tree carbon and is
positively related to decomposition recalcitrance of tree material and low temperatures
that retard decomposition, thus highest levels are in boreal and montane gymnosperm
forest types;
*and mineral soil constitutes 33-66% of forest ecosystem carbon and often represents
the largest carbon pool in young forests before aboveground stocks accumulate.
46

47

48
49
APPENDIX C
(C) A Case Study of the Carbon Stocks in Various Management Regimes in a
Coastal Pacific Northwest Douglas-Fir Forest Type
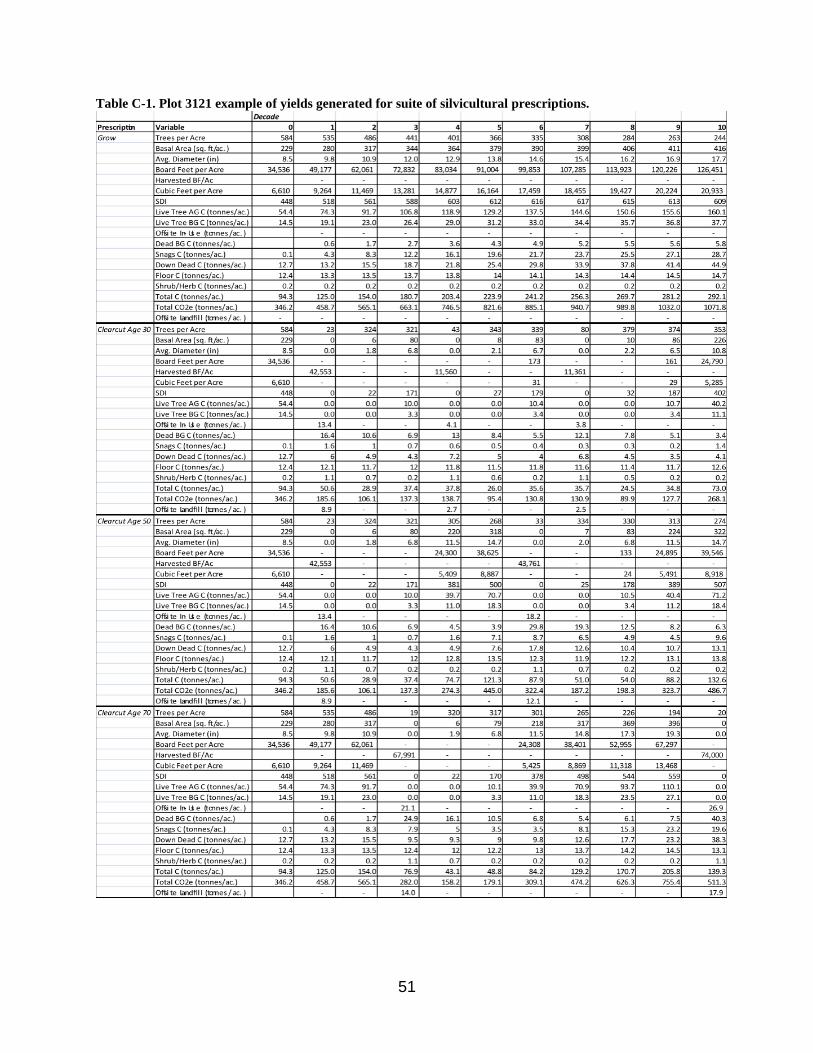
This appendix provides information on an example plot and how it was processed.
Table C-1 shows an example of the yields produced by applying the suite of silvicultural
prescriptions to a plot.

50
A summary of the total carbon yields for one example plot is shown in Figure C-2. Table
C-2 shows the average carbon yield over the 100-year period. The effect of silviculture
for the example plot shows that any harvesting reduces carbon. The average yield for
the clearcuts was 330 t/a (815 t/h), 359 t/a (887 t/h) for VR 15%, 379 t/a (936 t/h) for VR
40% and 775 t/a (1913 t/h) for the "no harvest" grow scenario. Looking across
silviculture and considering age of trees when harvested yields an average of 214 t/a
(529 t/h) at 30 years, 296 t/a (731 t/h) at 50 years, 434 t/a (1,072 t/h) at 70 years and
480 t/a (1,186 t/h) at 90 years. In this example for one plot, harvest versus no harvest
appears to be the biggest factor for carbon yields, followed by stand age at harvest
rather than retention via silvicultural treatment. Note that this example is carbon yield,
not Climate Action Reserve creditable reductions (since baseline and leakage are not
considered), and illustrates how the yields were constructed for a single plot.
Figure C-3 shows the baseline elements for the example plot. The silviculture selected
for the baseline will consist of whatever combinations are required to most closely
model the long-term common practice average, 24 tonnes per acre (59.3 t/h) in
aboveground live tree carbon in this case. The onsite carbon for the baseline was
averaged as was the offsite in-use and landfill pools.
51
Table C-1. Plot 3121 example of yields generated for suite of silvicultural prescriptions.

52

53
\
Figure C-2. Total carbon (CO2e) yields (without landfill) for example plot 3121 by silvicultural method.

54
Table C2. Example of average carbon yield by silviculture for plot 3121.
Figure C-3. Baseline pools and averages for example plot 3121.
Figure C-4. Project activity pools for example plot 3121 with clearcut treatments on a 70 year rotation.
55
WORKS CITED
2010. GIPALS32. Optimalon Software, Kitchener, Ontario. Angers, et al. 2005. Comparing composition and structure in old-growth and harvested (selection and diameter-limit cut) northern hardwood stands in Quebec. Forest Ecology and Management 217:275-293. Aubrey, K.B., C.B. Halpern, and C.E. Peterson. Variable-retention harvests in the Pacific Northwest: A review of short-term findings from the DEMO study 2008. Forest Ecology and Management 258:398-408. Barrett, J.W., ed. 1995. Regional Silviculture of the United States, 3rd ed. New York, NY: John Wiley and Sons. Best, C. and Wayborn, L.A. 2001. America’s Private Forests: Status and Stewardship. Washington, D.C.: Island Press. Bisbing, S.M., Alaback, P.B., and Deluca, T.H. 2010. Carbon storage in old-growth and second growth fire-dependent western larch forests of the Inland Northwest, USA. Forest Ecology and Management 259:1041-1049. Borjesson, P. and Gustavsson, L. 2000. Greenhouse gas balances in building construction: wood versus concrete from forest and land-use perspectives. Energy Policy 28:575-588. Boston, K. and Bettinger, P. 2006. An economic and landscape evaluation of the green-up rules for California, Oregon, and Washington (USA). Forest Policy and Economics 8:251–266. Bradford, J.B. et al. 2009. Detrital carbon pools in temperate forests. Canadian Journal of Forest Research 39:802-813.
Bradford, J.B. and Kastendick, D.N. 2010. Age-related patterns of forest complexity and carbon storage in pine aspen-birch ecosystems of northern Minnesota, USA. Canadian Journal of Forest Research 40:401-409.
Breiman, L., J. Friedman, C.J. Stone, and R.A. Olshen. 1984. Classification and regression trees. Chapman & Hall/CRC, Boca Raton, FL.
Cairns, M.A., S. Brown, E.H. Helmer, and G.A. Baumgardner. 1997. Root biomass
allocation in the world's upland forests. Oecologia 111:1-11. Chiang, J-M, and Brown, K.J. 2010. The effects of thinning and burning treatments on within-canopy variation of leaf traits in hardwood forests of southern Ohio. Forest Ecology and Management 260:1065-1075.

56
Davis, S.C. et al. 2009. Forest carbon sequestration changes in response to forest harvest. Forest Ecology and Management 258:2101-2109.
Delaney M., S. Brown, A.E. Lugo, A. Torres-Lezama, and N. Bello Quintero. 1997. The distribution of organic carbon in major components of forests located in five life zones of Venezuela. Journal of Tropical Ecology 13:697-708.
DeLong, D.L. et al. 2005. Survival and growth response of seedlings in root disease infected partial cuts in the Interior Cedar Hemlock zone of southeastern British Columbia. Forest Ecology and Management 206:365–379. Dias, A.C., Luis, A., and Capela, I. 2007. Carbon dioxide emissions from forest operations in Portuguese eucalypt and maritime pine stands. Scandinavian Journal of Forest Research 22:422-432. Drever, C.R. and Lertzman, K.P. 2001. Light-growth responses of coastal Douglas-fir and western redcedar saplings under different regimes of soil moisture and nutrients. Canadian Journal of Forest Resources 31: 2124–2133. Ericsson, E. et al. 2007. Integrated carbon analysis of forest management practices and wood substitution. Canadian Journal of Forest Resources 37:671-681. Everitt, B.S., and T. Hothorn. 2006. A handbook of statistical analyses using Rpart.
Chapman & Hall/CRC, Taylor & Francis Group, Boca Raton, FL. 275 p. Fahey, T.J. et al. 2005. The biogeochemistry of carbon at Hubbard Brook. Biogeochemistry 75:109-176. FIA. 2009a. Regional biomass equations used by FIA to estimate bole, bark and
branches (dated 13 May 2009). USDA Forest Service, Pacific Northwest Research Station.
FIA. 2009b. Volume estimation for the PNW-FIA Integrated Database (dated 13 May
2009). USDA Forest Service, Pacific Northwest Research Station. FIA. 2010. Forest Inventory and Analysis Program. USDA Forest Service, Washington,
D.C. Foley, T.G., Richer, D.B., and Galik, C.S. 2009. Extending rotation age for carbon sequestration: A cross-protocol comparison of North American forest offsets. Forest Ecology and Management 259:201-209. Franklin, J. et al., 2002. Disturbances and structural development of natural forest ecosystems with silvicultural implications, using Douglas-fir forests as an example. Forest Ecology and Management 155:399-423.
57
Gough, C.M., et al. 2008. Controls on annual forest carbon storage: Lessons from the past and predictions for the future. Bioscience 58:609-622. Gough, C.M. et al. 2010. Wood net primary production resilience in an unmanaged forest transitioning from early to middle succession. Forest Ecology and Management 260:36-41. Goulden, M.L. et al. 1998. Sensitivity of boreal forest carbon balance to soil thaw. Science 279:214-217. Gower, S.T. et al. 2001. Net primary production and carbon allocation patterns of boreal forest ecosystems. Ecological Applications 11:1395-1411. Gulden, J.M. 1991. Uneven-aged BDq regulation of Sierra Nevada mixed conifers. Western Journal of Applied Forestry 6:27-32. Hagemann, U., Moroni, M.T., and Makeschin, F. 2009. Deadwood abundance in Labrador high-boreal black spruce forests. Canadian Journal of Forest Resources 39:131-142. Hagemann, U. et al. 2010. Comparing measured and modeled forest carbon stocks in high-boreal forests of harvest and natural-disturbance origin in Labrador, Canada. Ecological Modeling 221:825-839. Hamilton, J.G. et al. 2002. Forest carbon balance under elevated CO2. Oecologia 131:250-260. Hansen, A.J. et al. 1995. Alternative silvicultural regimes in the Pacific Northwest: Simulations of ecological and economic effects. Ecological Applications 5:535-554. Hanson, J.J. and Lorimer, C.G. 2007. Forest structure and light regimes following moderate wind storms: Implications for multi-cohort management. Ecological Applications 17:1325-1340. Hanson, Jacob J., and Craig G. Lorimer. 2007. Forest structure and light regimes following moderate wind storms: Impliactions for multi-cohort management. Ecological Applications 17:1325–1340 Harmon ME, Harmon JM, Ferrell WK, Brooks D. 1996. Modeling the accumulation of forest products in the Pacific North- west. Clim Change 33:521–50. Harmon, M.E. and Hua, C. 1991. Coarse Woody Debris Dynamics in Two Old-Growth Ecosystems BioScience 41: 604-610
58
Harmon, M.E., Moreno, A., and Domingo, J.B. 2009. Effects of partial harvest on the carbon stores in the Douglas-fir/western hemlock forests: A simulation study. Ecosystems 12:777-791. Harmon, M.E. and Marks, B. 2002. Effects of silvicultural practices on carbon stores in Douglas-fir – western hemlock forests in the Pacific Northwest, U.S.A.: results from a simulation model. Canadian Journal of Forest Resources 32: 863–877. Hennigar, C.R., MacLean, D.A., and Amos-Binks, L.J. 2008. A novel approach to optimize management strategies for carbon stored in both forests and wood products. Forest Ecology and Management 256:786-797. Hoover, C. and S. Stout. 2007. The Carbon Consequences of Thinning Techniques: Stand Structure Makes a Difference. Journal of Forestry:266-270. Hurteau, M. and North, M. 2009. Fuel treatment effects on tree-based forest carbon storage and emissions under modeled wildfire scenarios. Frontiers of Ecology and Environment 7(8): 409–414. Jandl et al. 2007. How strongly can forest management influence soil carbon sequestration? Geoderma 137:253-268. Johnson, D.W. and P.S. Curtis. 2001. Effects of forest management on soil carbon and nitrogen storage: Meta analysis. Forest Ecology and Management 140:227-238. Keith, H., Mackey, B.G., and Lindenmayer, D.B. 2009. Re-evaluation of forest biomass carbon stocks and lessons from the world’s most carbon dense forests. PNAS 106:11635-11640. Keyser, C.E. 2010. Pacific Northwest Coast (PN) Variant Overview – Forest Vegetation
Simulator. Internal Rep. U. S. Department of Agriculture, Forest Service, Forest Management Service Center. 49.
Keyser, T.A. 2010. Thinning and site quality influence aboveground tree carbon stocks in yellow-poplar forests of the southern Appalachians. Canadian Journal of Forest Resources 40:659-667. Kranabetter, JM. 2009. Site carbon storage among productivity gradients of a late seral southern boreal forest. Canadian Journal of Forest Research 39:1053-60. Kranabetter, JM and Macadam, AM. 2007. Changes in carbon storage of broadcast burn plantations over 20 years. Canadian Journal of Soil Science 87:93-102. Laiho, R. and C. Prescott. 2004. Decay and nutrient dynamics of coarse woody debris in northern gymnosperm forests. Canadian Journal of Forest Resources 34:763-777.
59
Law, B.E. et al. 2003. Changes in carbon storage and fluxes in a chronosequence of ponderosa pine. Global Change Biology 9:510-524. Li, Q. et al. 2007. Effects of timber harvest on carbon pools in Ozark forests. Canadian Journal of Forest Research 37:2337-2348. Lippke, B., Wilson, J., Perez-Garcia, J., Bowyer, J. and Meil, J. 2004. CORRIM: Life- Cycle Environmental Performance of Renewable Building Materials. Forest Products Journal 54(6); 8–19 Lohr S.M., Gauthreaux S.A., Kilgo J.C.. 2002. Importance of coarse woody debris to avian communities in loblolly pine forests. Conserv. Biol. 16: 767–777. Lorimer, C.G. and White, A.S. 2003. Scale and frequency of natural disturbances in the northeastern U.S.: Implications for early successional forest habitats and regional age distributions. Forest Ecology and Management 185:41-64. Luyssaert, s. Et al. 2008. Old growth forests as global carbon sinks. Nature 455:213-215
Malhi, Y., Baldocchi, D.D. and Jarvis, P.G. 1999. The carbon balance of tropical, temperate and boreal forests. Plant, Cell and the Environment 22:715-740. Martin, J.L. et al. 2005. Carbon pools in a boreal mixed-wood logging chronosequence. Global Change Biology 11:1883-1894. Maser, C., R.G. Anderson, K. Cromack Jr., J.T. Williams and R.E. Martin. 1979. Dead and down woody material. In J.W. Thomas, ed. Wildlife habitats in managed forests: the Blue Mountains of Oregon and Washington. Washington, D.C.:USDA Forest Service Agricultural Handbook No. 553. McLaughlin, J.W. and S.A. Philips. 2006. Soil carbon nitrogen and base cation cycling 17 years after whole-tree harvesting in a low-elevation red spruce-balsam fir forested watershed in central Maine, USA. Forest Ecology and Management 222:234-253. McNab, W.H., D.T. Cleland, J.A. Freeouf, J.E. Keys Jr., G.J. Nowacki, and C.A.
Carpenter. 2005. Description of ecological subregions: sections of the conterminous United States [CD-ROM]. U.S. Department of Agriculture, Forest Service. 80.
Minkkinen, K., Korhonen, R., Savolainen, I. and Laine, J. 2002. Carbon balance and radiative forcing of Finnish peatlands 1900-2100- impact of forestry drainage. Global Change Biology 8:785-799. Mitchell, A.K. et al. 2007. Regenerating montane conifers with variable retention systems in a coastal British Columbia forest: 10-year results. Forest Ecology and Management 246:240-250.
60
Munsell, J.F. and R.H. Germain. 2007. Woody biomass energy: An opportunity for silviculture on NIPF in New York. Journal of Forestry 105:398-402. Murthy, S.K. 1998. Automatic construction of decision trees from data: a multi-
disciplinary survey. Data Mining and Knowledge Discovery 2:345-389. Neilson, E.T. et al. 2007. Spatial distribution of carbon in natural and managed stands in an industrial forest in New Brunswick, Canada. Forest Ecology and Management 253:148–160 Neilson, E.T. et al. 2008. Optimal on- and off-site forest carbon sequestration under existing timber supply constraints in northern New Brunswick. Canadian Journal of Forest Resources 38:2784-2796. Newsome, T.A. 2010. Ten-year regeneration responses to varying levels of over-story retention in two productive southern British Columbia ecosystems. Forest Ecology and Management 260:132–145. Noormets, A., Chen, J. and Crow, T.R. 2007. Age-Dependent changes in ecosystem carbon fluxes in managed forests in northern Wisconsin, USA. Ecosystems 10:187-203. Nunery, J.S. and Keeton, W.S. 2010. Forest carbon storage in the northeastern United States: Net effects of harvesting frequency, post-harvest retention, and wood products. Forest Ecology and Management 259:1363–1375. Oliver, D.C. and B.C. Larson. 1996. Forest Stand Dynamics. New York, NY: Wiley. Ordonez, J.A.B. et al. 2008. Carbon content in vegetation, litter, and soil under 10 different land-use and land-cover classes in the Central Highlands of Michoacan, Mexico. Forest Ecology and Management 255:2074-2084. Peichl, M. and Arain, A.A. 2006. Above- and belowground ecosystem biomass and carbon pools in an age-sequence of temperate pine plantation forests. Agricultural and Forest Meteorology 140:51-63. Peng, C. et al. 2002. Effects of harvesting regimes on carbon and nitrogen dynamics of boreal forests in central Canada: A process model simulation. Ecological Modelling 155:177-189. Perez-Garcia, J. et al. 2005. An assessment of carbon pools, storage, and wood products market substitution using life-cycle analysis results. Wood and Fiber Science 37:140-148.

61
Piotto, D. et al. 2010. Silvicultural and economic aspects of pure and mixed native tree species plantations on degraded pasturelands in humid Costa Rica. New Forests 39:369-385. Puettmann, M.E. et al. 2010. Cradle-to-gate life-cycle inventory of U.S. wood products. Wood and Fiber Science 42:15-28. Rebain, S.A. 2010. The Fire and Fuels Extension to the Forest Vegetation Simulator:
Updated Model Documentation. Internal Rep. U. S. Department of Agriculture, Forest Service, Forest Management Service Center. 361.
Ribe, R.G. 2009. In-stand scenic beauty of variable retention harvests and mature forests in the U.S. Pacific Northwest: The effects of basal area, density, retention pattern, and down wood. Journal of Environmental Management 91:245-260 Rosenvald, R. and A. Lohmus. 2008. For what, when, and where is green-tree retention better than clear-cutting? A review of the biodiversity aspects 2008. FEM 255:1-15. Ryan, M.G. et al. 1996. Foliage, fine-root, woody-tissue and stand respiration in Pinus radiata in relation to nitrogenn status. Tree Physiology 16:333-343. Seedre, M. and Chen, H.Y.N. 2010. Carbon dynamics of aboveground live vegetation of boreal mixedwoods after wildfire and clearcutting. Canadian Journal of Forest Resources 40:1862-1869. Seymour, R.S. and Hunter, M.L. 1998. Principles of Ecological Forestry. New York, NY: Wiley. Siitonen, J. et al. 2000. Coarse woody debris and stand characteristics in mature managed and old-growth boreal forests in southern Finland. Forest Ecology and Management 128:211-225. Slesak, R.A., Schoenholtz, S.H., and Harrington, T.B. 2010. Soil respiration and carbon responses to debris and competing vegetation. Forest, Range and Wildland Soils 74:936-946. Smith, D.M. et al. 1997. The Practice of Silviculture: Applied Forest Ecology. New York, NY: John Wiley and Sons. Smithwick, E.A. et al. 2002. Potential upper bounds of carbon stores in forests of the Pacific Northwest. Ecological Applications 12:1303-1317. Taylor, A.R., Wang, J.R., and Kurz, W.A. 2008. Effects of harvesting intensity on carbon stocks in eastern Canadian red spruce forests: An exploratory analysis using the CBM- CFS3 simulation model. Forest Ecology and Management 255:3632-3641.
62
Therneau, T.M., B. Atkinson, and B. Ripley. 2007. The Rpart package. Thorpe, H.C., Thomas, S.C. and Caspersen, J.P. 2008. Tree mortality following partial harvests is determined by skidding proximity. Ecological Applications 18:1652-1663. Webster, C.R. and Lorimer, C.G. 2005. Minimum opening sizes for canopy recruitment of midtolerant tree species: A retrospective approach. Ecological Applications 15:1245-1262. Whitman, A.A. and J.M. Hagan. 2007. An index to identify late-successional forest in temperate and boreal zones. Forest Ecology and Management 246:144-154. Woodall, C.W. and Westfall, J.A. 2009. Relationships between the stocking levels of live trees and dead tree attributes in forests of the United States. Forest Ecology and Management 258:2602-2608