carbon factor for wood fuels for the supplier obligation ... · wood fuels used in boilers may be...
TRANSCRIPT

Carbon factor for wood fuels for the Supplier Obligation Final report
Report to Defra
ED01858010
Issue Number 2
January 2009
Carbon factor for wood fuels AEA/ED01858010/Issue 2 for the supplier obligation
ii AEA
Title Carbon factor for wood fuels for the supplier obligation
Customer Defra
Customer reference
Confidentiality, copyright and reproduction
Copyright AEA Technology plc
File reference M:\Projects\Policy_Group\Live_Projects\ED01858010 Defra TAPS 3
BIOMASS
Reference number ED1858010- Issue 1
AEA group
329 Harwell Didcot Oxfordshire OX11 0QJ t: 0870 190 6411 f: 0870 190 6318 AEA is a business name of AEA Technology plc AEA is certificated to ISO9001 and ISO14001 Author Name Judith Bates and Simon Henry
Approved by Name Judith Bates
Signature
Date

AEA/ED01858010/Issue 2 Carbon factor for wood fuels for the supplier obligation
AEA iii
Executive summary
Defra asked AEA to estimate the CO2 equivalent factor of wood pellets and chips, in kg CO2 eq/MWh, including emissions from transport and processing of the wood, and emissions associated with combustion. AEA were also asked to estimate the NOx and black carbon emissions associated with transport, processing and combustion, and consider whether these indirect greenhouse gases could be included in the overall CO2 equivalent factor. In order to do this, a modified version of the Biomass Environmental Assessment Tool (BEAT2) was used. Emissions were estimated from the production of heat by the combustion of wood chips and pellets from a range of sources. These included:
Forestry residues: unused timber (e.g. branchwood) from conventional forestry operations.
Short rotation coppice: an energy crop (typically willow) in the UK which is grown and harvested every few years.
‘Clean’ wood waste: wood waste from sawmills, or wood waste (if untreated) from furniture production.
The results showed that GHG emissions were generally greater for wood pellets rather than chips, though there were large variations between different sources. In summary, emissions were lowest for wood processing wastes and forest residues from the UK and highest for SRC and imported wood from Canada and the Baltic. For wood pellets, there was little difference in emissions between bulk drying (forcing air through the pellets) and batch drying with diesel (some heating of the chips), though where batch drying occurred using wood fuel an emissions reduction was seen. Due to the variability in the emissions it makes it difficult to recommend a carbon factor for use in the supplier obligation. Therefore three options were presented that may go someway to addressing this variability. The results for NOx emissions showed the impact of long distance transportation, with the highest emissions coming from wood from the Baltic States and Canada especially, for both chips and pellets. For wood fuel sourced in the UK, the combustions phase represented a significant proportion of the total emissions. As this figure is the same across all feedstocks there was little variation in total emissions between either pellets or chips or between different sources from within the UK. The situation was similar for PM10 emissions, with the combustion phase representing a larger proportion of total emissions. Consequently, there was less variation between chips and pellets and between different sources, even for wood fuel sourced from Canada and the Baltic States. A brief review of the role of NOx and PM10 as GHGs was also conducted. It found that the relationship between these emissions and climate change is complicated and that there is no accepted global warming potential for these pollutants. Therefore it was concluded that it does not seem appropriate to convert the estimates of NOx and PM10 emissions to kg CO2 eq and to include them in the total carbon factor for wood fuels. Finally a comparison between emissions across the lifecycle of fossil and wood fuels was made. It was found that GHG emissions from the production of natural gas and light fuel oil are of the same order of magnitude as those associated with the production of wood chips. For pellets emissions are substantially greater than for fossil fuels. It could therefore be argued that only including these emissions for wood fuels is underestimating the GHG savings which are achieved. In the case NOx emissions from fuel production for chips, it was found that they are of a similar order of magnitude as light fuel oil, unless they are transported long distances, in which case they are substantially higher due to NOx emissions from shipping. NOx emissions for pelleted fuels are higher than for fossil fuels, again particularly so if they are transported long distances by ship. PM10 emissions follow a similar pattern. Combustion related NOx emissions are similar for wood, oil and gas, but PM10 emissions are three to four times higher than emissions from oil combustion.
Carbon factor for wood fuels AEA/ED01858010/Issue 2 for the supplier obligation
iv AEA
Table of contents
1 Introduction 1
2 Methodology 2
2.1 Wood Fuels 2
2.2 GHG Emissions 2
2.3 NOx and black carbon emissions 3
2.4 The role of NOx and PM10 as GHGs 4
3 Results 6
3.1 GHG emissions 6
3.2 NOx Emissions 8
3.3 PM10 Emissions 9
3.4 Comparison with fossil fuels 11
4 References 13
5 Appendices 14
5.1 Tabulated GHG Emissions Data 14
5.2 Tabulated NOx Emissions Data 17
5.3 Tabulated PM10 Emissions Data 18
AEA/ED01858010/Issue 2 Carbon factor for wood fuels for the supplier obligation
AEA 1
1 Introduction
The Carbon Emissions Reduction Target (CERT) came into effect on 1st April 2008, replacing the
Energy Efficiency Commitment (EEC). It is an obligation on energy suppliers to achieve targets for promoting reductions in carbon emissions in the household sector. One form of technology the obligation will support is biomass boilers both for individual dwellings and blocks of flats. These boilers will burn either wood chips or pellets. Under CERT, a factor of 0.0249 kg CO2 /kWh was assumed for wood. Using this carbon factor means that biomass boilers are, at least on paper, highly cost effective measures for energy suppliers to subsidise. However, the true greenhouse gas (GHG) factor for biomass may be higher, because of the CO2 (and other greenhouse gases) emitted in the processing and transport of biomass. Defra therefore asked AEA to estimate the CO2 equivalent factor of wood pellets and chips, in kg CO2 eq/MWh, including emissions from transport and processing of the wood, and emissions associated with combustion. AEA were also asked to estimate the NOx and black carbon emissions associated with transport, processing and combustion, and consider whether these indirect greenhouse gases could be included in the overall CO2 equivalent factor.
Carbon factor for wood fuels AEA/ED01858010/Issue 2 for the supplier obligation
2 AEA
2 Methodology
2.1 Wood Fuels
There are several potential sources of wood fuel, including:
Forestry residues: unused timber (e.g. branchwood) from conventional forestry operations.
Short rotation coppice: an energy crop (typically willow) in the UK which is grown and harvested every few years.
‘Clean’ wood waste: wood waste from sawmills, or wood waste (if untreated) from furniture production.
Forestry residues and clean wood waste may be sourced from the UK or imported from overseas, typically from countries with a large forestry industry. Wood fuels used in boilers may be in either the form of chips, or pellets. The latter are often preferred, particularly for smaller boilers, because of the advantages they offer e.g. they are easier to handle and store, and boiler feeding can be automated. In order to process chips into pellets, they must first be dried, so that they can then be milled and formed into pellets. Various processes may be used for drying pre – pelletisation. For this study we considered bulk drying, where the chips are dried by forcing air through them, and batch drying, where there is also some heating of the chips to aid drying. For batch drying we looked at two options – one where heat for drying is provided by oil, and one where a portion of the wood fuel is burnt to provide the heat for drying. The wood fuel sources and drying methods we have considered in the study are summarised in Table 2.1. For imported fuels, we considered imports from the Baltic States and Canada.
Table 2.1 Sources of wood fuels and the method of drying.
Fuel Type
Source Drying methods
Chips
Forest residues (UK and imported)
Natural drying Wood processing waste (UK and imported)
Short rotation coppice
Pellets
Forest residues (UK and imported) Bulk Drying (forced ventilation); Batch drying (using diesel as a fuel) Batch drying (using wood as a fuel)
Wood processing waste (UK and imported)
Short rotation coppice
For combustion related emissions, we considered three typical types of boiler size
Domestic <50kW
Community 500kW
Commercial 2MW
2.2 GHG Emissions
The Biomass Environmental Assessment Tool (BEAT2) was used to estimate the emissions of the direct greenhouse gases (GHGs), CO2, CH4 and N2O from production, process and transport of the above fuels
1. This tool has been developed by AEA and North Energy Associates for Defra (and the
Environment Agency), and allows the assessment of the environmental impacts of a variety of bioenergy technologies in a consistent way. The tool calculates the emissions of the direct greenhouse gases, CO2, CH4 and N2O over the whole life cycle of a biomass energy scheme, from cultivation of the energy crop, through processing and transport of the fuel, to combustion of the fuel at a power station or boiler, and disposal of ashes. Emissions from the production of machinery, the combustion/generation plant, and major inputs such as agrochemicals are also included.
1 BEAT2 can be downloaded from the Biomass Energy Centre website
http://www.biomassenergycentre.org.uk/portal/page?_pageid=74,153193&_dad=portal&_schema=PORTAL

AEA/ED01858010/Issue 2 Carbon factor for wood fuels for the supplier obligation
AEA 3
For the purposes of this analysis we used data from BEAT on greenhouse gas emissions up to the point of delivery of the wood fuel to the boiler. We generally used the default data in BEAT which represents typical practice for biomass production and processing. We have assumed a transport distance of 90km by road (round trip) for delivery of fuel to boilers, and additional transport by road to a port and onwards by ship for imported fuels. Data on GHG emissions from combustion of wood in boilers are the average of measurements AEA has recently conducted on boilers in Scotland.
Table 2.2 GHG emissions from combustion of wood fuels in boilers (g/GJ)
Pollutant Fuel type Domestic <50 kW Community 500 kW Commercial (2MW)
CH4 Chips 5 5 0.5
Pellets 10 5 0.5
N2O Chips 5 5 5
Pellets 5 5 5
Emissions of CH4 and N2O were converted to kg CO2 eq using the global warming potentials from the IPCC’s second assessment report i.e. a GWP for CH4 of 21 and for N2O of 310. While the IPCC’s 4
th
assessment report contains revised values for these GWPs, the values from the second assessment report are used in reporting the UK’s GHG inventory and will be used to determine its compliance under the Kyoto protocol.
2.3 NOx and black carbon emissions
As discussed earlier, DEFRA also wished to explore the contribution that emissions of the indirect greenhouse gases, NOx and black carbon emissions, associated with the production and transport of wood fuels might make to the overall carbon factor for wood fuels. The methodology used to estimate NOx and black carbon emissions is described below, and the attribution of a GWP for these gases to allow conversion of emissions to CO2 eq is discussed in Section 2.4. Emissions of NOx and black carbon are not included in BEAT2, however the methodology used for estimating GHG emissions in the tool, combining information on the activities and materials involved in particular steps (e.g. diesel used in cultivation operations, steel used in agricultural machinery and fencing) with emissions factors for that activity (e.g. CO2 from diesel use, CO2 from steel production) can easily be extended to NOx and black carbon by including the appropriate emissions factors for these pollutants. Within the scope of this project it was not possible to enter emissions factors for all of the individual processes in BEAT; and we therefore concentrated on those activities which were the main source of GHG emissions, as these are likely to be the main sources of NOx and black carbon. They included:
Diesel used in the cultivation, harvesting, transport and drying processes.
Petrol used in the cultivation process.
Electricity and heating oil used in the drying process.
The manufacture of steel used in the cultivation process (e.g. in manufacture of agricultural equipment and fencing).
There is no ‘black carbon’ emissions inventory, so PM10 emissions factors were used as this was considered the most relevant emission factor for the sources considered i.e. for diesel combustion most PM10 would be black carbon. Table 2.3 below shows the emission factors that were used, and their sources.
Table 2.3 NOx and PM10 emission factors
NOx emissions PM10 emissions Unit Source
Agricultural machinery
6.03 x 10⁻⁴
5.88 x 10⁻⁴
kg/MJ diesel Adapted from the NAEI
Chainsaws 3.00 x 10⁻⁵
6.37 x 10⁻⁷
kg/MJ petrol Adapted from the NAEI
Shipping 1.70 x 10⁻³
6.47 x 10⁻⁵
kg/MJ diesel UK ship emissions inventory, Entec 2008
Lorries 7.57 x 10⁻⁴
1.83 x 10⁻⁵
kg/MJ diesel Adapted from the NAEI
Electricity 3.14 x 10⁻⁴
9.13 x 10⁻⁶
kg/MJ electricity Adapted from the NAEI
Carbon factor for wood fuels AEA/ED01858010/Issue 2 for the supplier obligation
4 AEA
Heating oil in boiler
4.44 x 10⁻⁵
4.45 x 10⁻⁶
kg/MJ oil Adapted from the NAEI
Mild steel 4.38 x 10⁻³
5.15 x 10⁻³
kg/kg steel Ecoinvent life cycle database
Steel wire 4.83 x 10⁻³
5.40 x 10⁻³
kg/kg steel Ecoinvent life cycle database
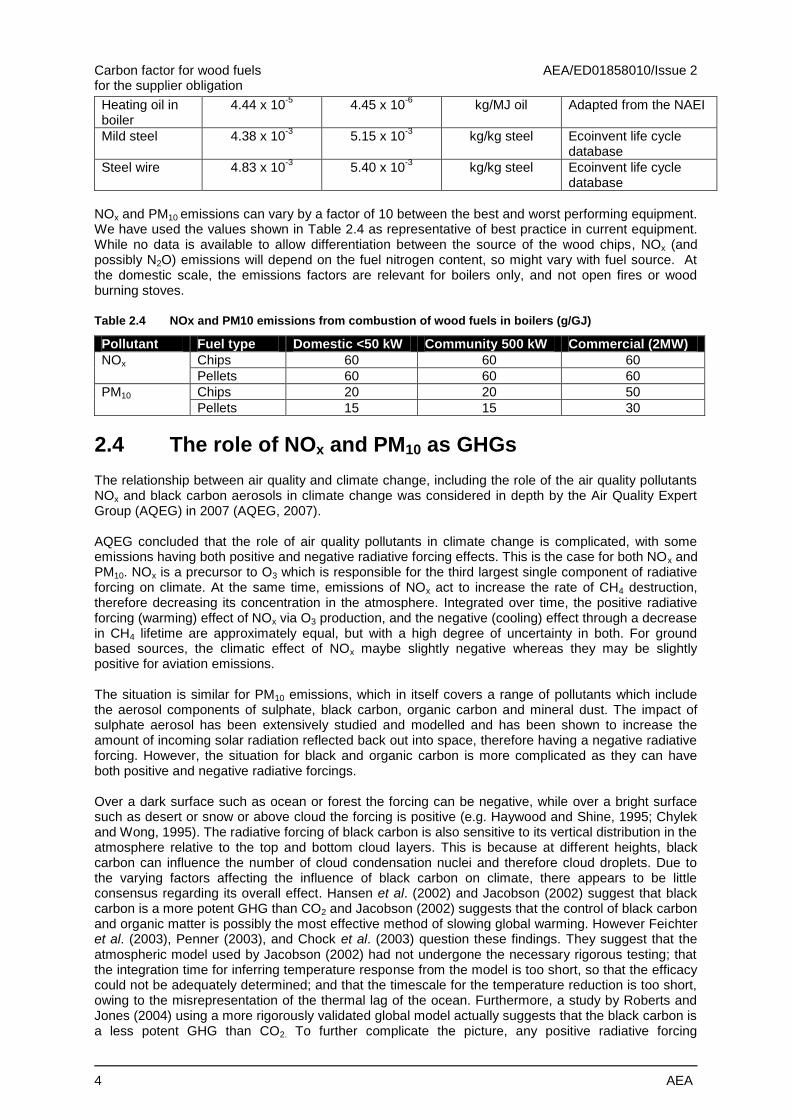
NOx and PM10 emissions can vary by a factor of 10 between the best and worst performing equipment. We have used the values shown in Table 2.4 as representative of best practice in current equipment. While no data is available to allow differentiation between the source of the wood chips, NOx (and possibly N2O) emissions will depend on the fuel nitrogen content, so might vary with fuel source. At the domestic scale, the emissions factors are relevant for boilers only, and not open fires or wood burning stoves.
Table 2.4 NOx and PM10 emissions from combustion of wood fuels in boilers (g/GJ)
Pollutant Fuel type Domestic <50 kW Community 500 kW Commercial (2MW)
NOx Chips 60 60 60
Pellets 60 60 60
PM10 Chips 20 20 50
Pellets 15 15 30
2.4 The role of NOx and PM10 as GHGs
The relationship between air quality and climate change, including the role of the air quality pollutants NOx and black carbon aerosols in climate change was considered in depth by the Air Quality Expert Group (AQEG) in 2007 (AQEG, 2007). AQEG concluded that the role of air quality pollutants in climate change is complicated, with some emissions having both positive and negative radiative forcing effects. This is the case for both NOx and PM10. NOx is a precursor to O3 which is responsible for the third largest single component of radiative forcing on climate. At the same time, emissions of NOx act to increase the rate of CH4 destruction, therefore decreasing its concentration in the atmosphere. Integrated over time, the positive radiative forcing (warming) effect of NOx via O3 production, and the negative (cooling) effect through a decrease in CH4 lifetime are approximately equal, but with a high degree of uncertainty in both. For ground based sources, the climatic effect of NOx maybe slightly negative whereas they may be slightly positive for aviation emissions. The situation is similar for PM10 emissions, which in itself covers a range of pollutants which include the aerosol components of sulphate, black carbon, organic carbon and mineral dust. The impact of sulphate aerosol has been extensively studied and modelled and has been shown to increase the amount of incoming solar radiation reflected back out into space, therefore having a negative radiative forcing. However, the situation for black and organic carbon is more complicated as they can have both positive and negative radiative forcings. Over a dark surface such as ocean or forest the forcing can be negative, while over a bright surface such as desert or snow or above cloud the forcing is positive (e.g. Haywood and Shine, 1995; Chylek and Wong, 1995). The radiative forcing of black carbon is also sensitive to its vertical distribution in the atmosphere relative to the top and bottom cloud layers. This is because at different heights, black carbon can influence the number of cloud condensation nuclei and therefore cloud droplets. Due to the varying factors affecting the influence of black carbon on climate, there appears to be little consensus regarding its overall effect. Hansen et al. (2002) and Jacobson (2002) suggest that black carbon is a more potent GHG than CO2 and Jacobson (2002) suggests that the control of black carbon and organic matter is possibly the most effective method of slowing global warming. However Feichter et al. (2003), Penner (2003), and Chock et al. (2003) question these findings. They suggest that the atmospheric model used by Jacobson (2002) had not undergone the necessary rigorous testing; that the integration time for inferring temperature response from the model is too short, so that the efficacy could not be adequately determined; and that the timescale for the temperature reduction is too short, owing to the misrepresentation of the thermal lag of the ocean. Furthermore, a study by Roberts and Jones (2004) using a more rigorously validated global model actually suggests that the black carbon is a less potent GHG than CO2. To further complicate the picture, any positive radiative forcing
AEA/ED01858010/Issue 2 Carbon factor for wood fuels for the supplier obligation
AEA 5
associated with black carbon is likely to be fully or partially offset by the negative forcing associated with organic carbon from the same sources. Given the complex nature of the relationship between emissions of NOx and PM10 and climate change, the uncertainties involved in estimating their contribution to global warming, and the lack of an accepted GWP for emissions of these pollutants, it does not seem appropriate, particularly for a regulatory scheme such as the Supplier obligation to convert the estimates of NOx and PM10 emissions to kg CO2 eq and to include them in the total carbon factor for wood fuels.

Carbon factor for wood fuels AEA/ED01858010/Issue 2 for the supplier obligation
6 AEA
3 Results
3.1 GHG emissions
The estimates of GHG emissions for chips and pellets are shown in Figure 3.1 for wood chips and Figure 3.2 for wood pellets. They are based on combustion in community scale size boilers (about 500 kW); as combustion related emissions are similar for the three boiler sizes considered. Data is presented in tabular form in Appendix 5.1.
3.1.1 Wood chips
The source of the wood chips has a significant influence, with emissions associated with Canadian forest residues (at 40 kg CO2/MWh) being two to three times greater than emissions associated with forest residues or wood processing waste from the UK (at 13 and 17 kg CO2/MWh). This is due to the much larger distances the chips have to be transported, and the same effect, but to a lesser extent, can be seen in the emissions associated with wood chips from the Baltic region. In summary, the impact of transporting forestry residues or wood processing waste to the UK adds about 10 kg CO2/MWh for transport from the Baltic region and just over 20 kg CO2/MWh if transported from Canada.
Figure 3.1 GHG emissions from combustion of wood chips
0
5
10
15
20
25
30
35
40
45
UK forest
residues
Baltic forest
residues
Canadian
forest residues
Short rotation
coppice
Wood
processing
waste
Baltic wood
processing
waste
Canadian
wood
processing
waste
kg
CO
2 e
q p
er
MW
h f
ue
l
Fuel supply Combustion
3.1.2 Wood pellets
The carbon factor for pellets is higher than for chips due to the additional energy consumption involved in drying, milling and pelletising, and ranges from 30 to 106 kg CO2/MWh depending on the type of wood used to produce the pellets, its source, and method for drying the wood pre-pelletisation. The highest emissions are associated with the processing of short rotation coppice. This is mainly due to the high moisture content of the wood and therefore the energy requirements in the drying process. Once again, the impact of transporting wood from abroad can be seen with higher emissions from the Baltic and Canadian sources, especially for wood processing waste.

AEA/ED01858010/Issue 2 Carbon factor for wood fuels for the supplier obligation
AEA 7
Figure 3.2 GHG emissions from combustion of wood pellets.
0
20
40
60
80
100
120
Bulk
drying
Batch
drying
(diesel)
Batch
drying
(wood
fuel)
Bulk
drying
Bulk
drying
Bulk
drying
Batch
drying
(diesel)
Batch
drying
(wood
fuel)
Bulk
drying
Batch
drying
(diesel)
Batch
drying
(wood
fuel)
Bulk
drying
Bulk
drying
UK forest residues BFR CFR Short rotation coppice UK wood processing waste BWPW CWPW
kg
CO
2 e
q p
er
MW
h f
uel
Fuel supply Combustion
Note BRF = Baltic Forest Residues, CFR = Canadian Forest Residues, BWPW = Baltic Wood Processing Waste, CWPW = Canadian Wood Processing Waste.
3.1.3 Impact of IPCC Global Warming Potentials
All the data provided in Figure 3.1 and Figure 3.2 is based on Global Warming Potentials (GWP) supplied in the IPCC’s Second Assessment Report (SAR). This is because it is mandatory to use these GWPs for reporting purposes under the United Nations Framework Convention on Climate Change (UNFCCC). However, these GWPs have been updated in both the Third Assessment Report (TAR) and the Fourth Assessment Report (AR4). Consequently, the total GHG emissions are affected by which GWPs are used. Total emissions, using GWPs from all three reports is presented in Table 5.4 for wood chips Table 5.5 for wood pellets. Overall the impact of using the revised GWPs is monor, changing the estimate of total GHG emissions in CO2 eq by 1% or less.
3.1.4 A carbon factor for use in the supplier obligation
The analysis shows that the carbon factor associated with wood fuels, particularly pelletised wood fuels can vary significantly depending on the source of the wood, distance it is transported, and for pellets, the method used to dry the wood chips prior to pelletisation. For any boiler installation which falls under the Supplier Obligation, it is unlikely that the energy supplier would be able to guarantee the wood fuel source which would be used to supply the boiler over the next ten to twenty years. The use of individual factors relating to specific feedstocks, e.g. wood chips from SRC or pellets from UK forest residues therefore does not seem practicable. Three options remain:

Carbon factor for wood fuels AEA/ED01858010/Issue 2 for the supplier obligation
8 AEA
To adopt a precautionary approach and use the highest of the values estimated above on the basis that this will ensure that savings are not overestimated. For chips this would give a value of 40.4 kg CO2eq/MWh and for pellets a value of 106.1 kg CO2eq/MWh.
To take an average of the values estimated above. However, there are several disadvantages with this; firstly, due to the ranges in the values, there is large scope to over or underestimate actual emissions, depending on what feedstock is used. Secondly, the analysis presented above does not cover all possible sources of wood fuel in the UK. Therefore any average value is likely to be relatively arbitrary and again this presents scope to either over or underestimate actual emissions.
To take a view of the likely mix of sources of wood chips and pellets in the medium term and calculate a weighted average from the carbon factors listed above. This could be based on an estimation of current and future resource estimates. However, as the market matures, the quantities of wood fuel traded internationally are likely to increase. Therefore, there would still be a degree of subjectivity in any figure calculated using this methodology.
3.2 NOx Emissions
The estimates of NOx emissions for chips and pellets are shown in Figure 3.3 for wood chips and Figure 3.4 for wood pellets. Again they are based on combustion in community scale size boilers. Data is presented in tabular form in Appendix 5.3.
3.2.1 Wood chips
As was the case with GHGs, wood chips from the Baltic region and Canada have the highest NOx emissions. This is largely due to emissions associated with the combustion of diesel fuel used during transportation. For chips sourced in the UK, emissions in the fuel supply process are relatively small and the majority are produced during combustion.
Figure 3.3 NOx emissions from combustion of wood chips
0
0.1
0.2
0.3
0.4
0.5
0.6
0.7
0.8
UK forest
residues
Baltic forest
residues
Canadian
forest
residues
Wood
processing
waste
Short
rotation
coppice
Short
rotation
coppice
Baltic wood
processing
waste
Canadian
wood
processing
waste
kg
/MW
h f
ue
l
Fuel supply Combustion
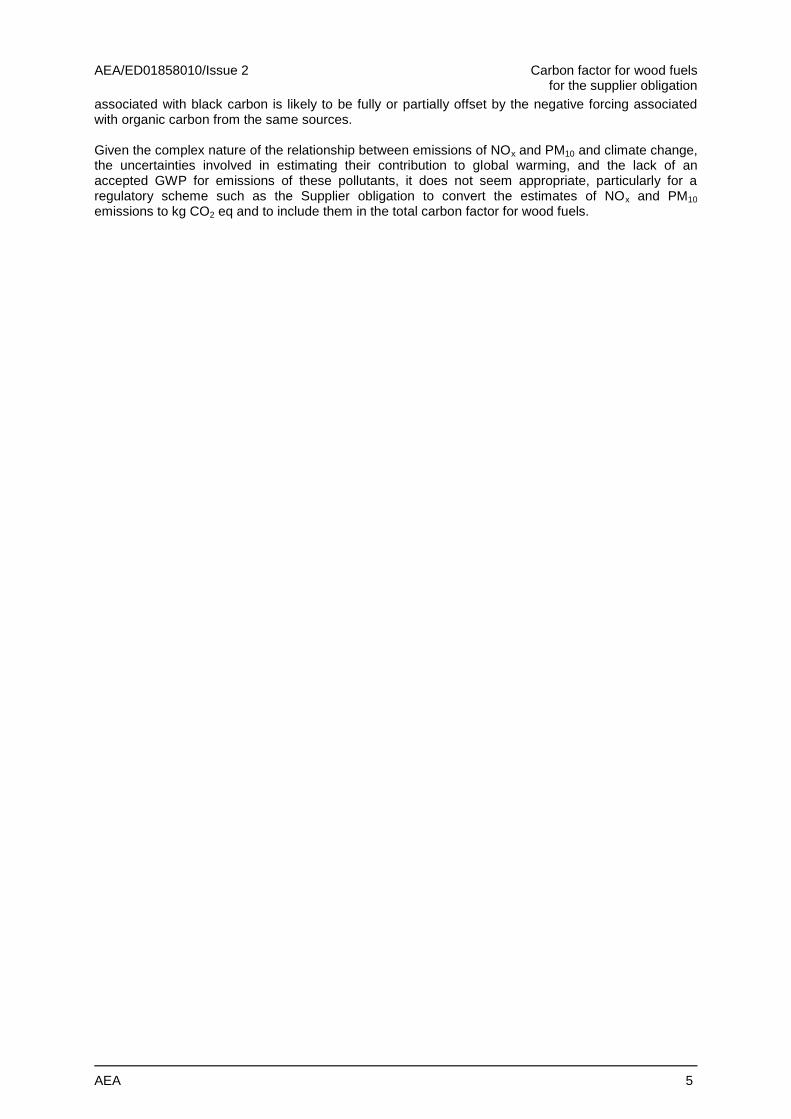
3.2.2 Pellets
Once again, wood pellets sourced from the Baltic region and Canada has the highest emissions, and the majority of these are associated with the fuel supply process. On average, transport from Canada adds about 0.5 kg NOx/MWh and transport from the Baltic region adds about 0.2 kg NOx/MWh. For
AEA/ED01858010/Issue 2 Carbon factor for wood fuels for the supplier obligation
AEA 9
pellets sourced in the UK, the range in values is relative small (0.13 kg NOx/MWh) and the majority of emissions are associated with combustion.
Figure 3.4 NOx emissions from combustion of wood pellets.
0
0.2
0.4
0.6
0.8
1
1.2
Bulk drying Batch
drying
(diesel)
Batch
drying
(w ood
fuel)
Bulk drying Bulk drying Bulk drying Batch
drying
(diesel)
Batch
drying
(w ood
fuel)
Bulk drying Batch
drying
(diesel)
Batch
drying
(w ood
fuel)
Bulk drying Bulk drying
UK forest residues BFR CFR Short rotation coppice UK w ood processing w aste BWPW CWPW
kg
/MW
h f
ue
l
Fuel supply Combustion
Note BRF = Baltic Forest Residues, CFR = Canadian Forest Residues, BWPW = Baltic Wood Processing Waste, CWPW = Canadian Wood Processing Waste.
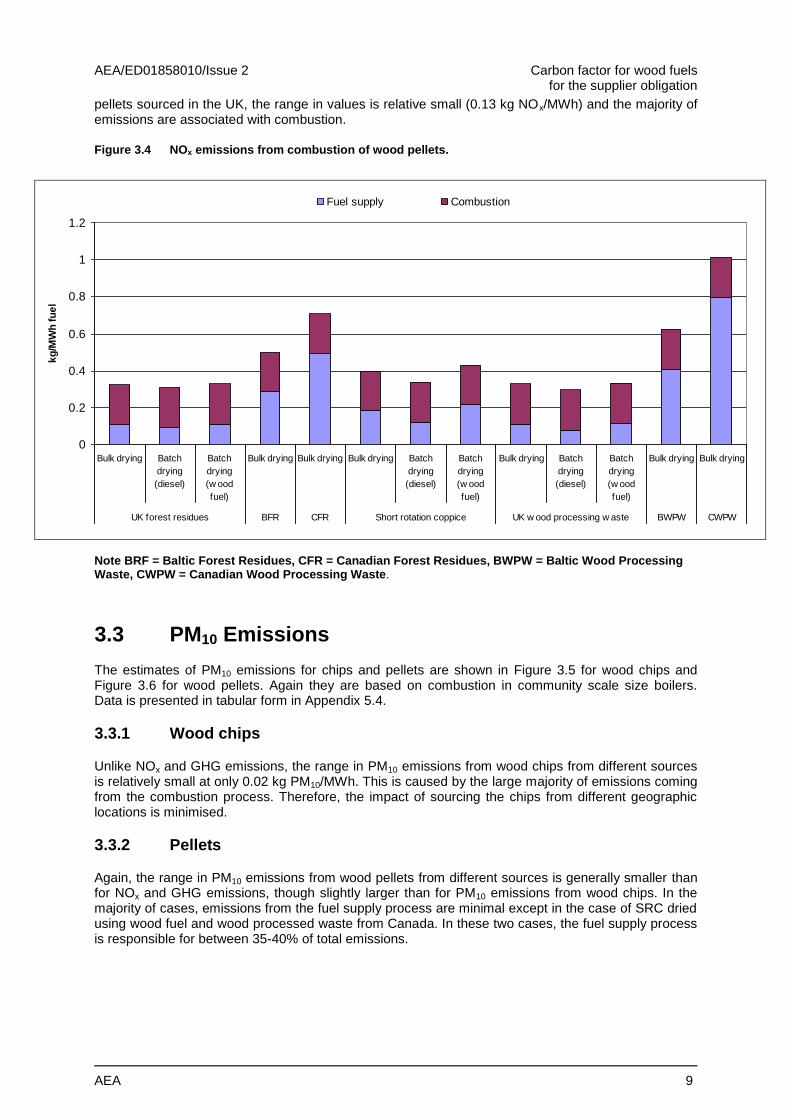
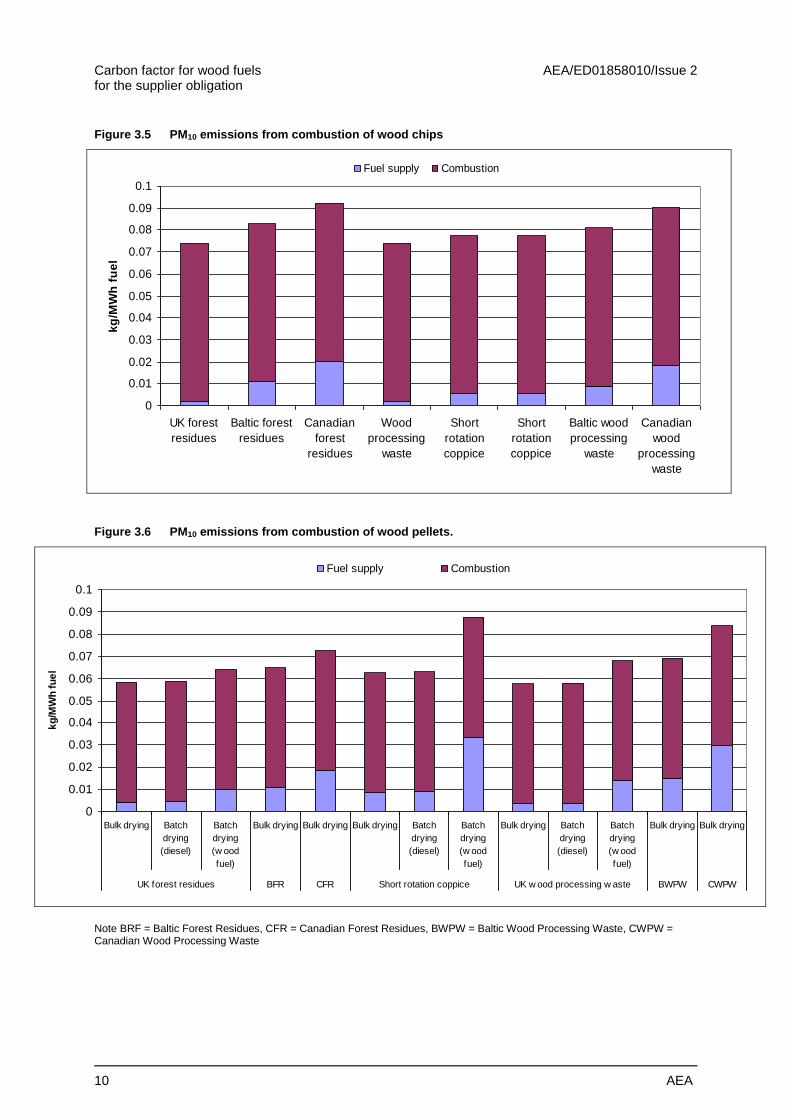
3.3 PM10 Emissions
The estimates of PM10 emissions for chips and pellets are shown in Figure 3.5 for wood chips and Figure 3.6 for wood pellets. Again they are based on combustion in community scale size boilers. Data is presented in tabular form in Appendix 5.4.
3.3.1 Wood chips
Unlike NOx and GHG emissions, the range in PM10 emissions from wood chips from different sources is relatively small at only 0.02 kg PM10/MWh. This is caused by the large majority of emissions coming from the combustion process. Therefore, the impact of sourcing the chips from different geographic locations is minimised.
3.3.2 Pellets
Again, the range in PM10 emissions from wood pellets from different sources is generally smaller than for NOx and GHG emissions, though slightly larger than for PM10 emissions from wood chips. In the majority of cases, emissions from the fuel supply process are minimal except in the case of SRC dried using wood fuel and wood processed waste from Canada. In these two cases, the fuel supply process is responsible for between 35-40% of total emissions.
Carbon factor for wood fuels AEA/ED01858010/Issue 2 for the supplier obligation
10 AEA
Figure 3.5 PM10 emissions from combustion of wood chips
0
0.01
0.02
0.03
0.04
0.05
0.06
0.07
0.08
0.09
0.1
UK forest
residues
Baltic forest
residues
Canadian
forest
residues
Wood
processing
waste
Short
rotation
coppice
Short
rotation
coppice
Baltic wood
processing
waste
Canadian
wood
processing
waste
kg
/MW
h f
ue
l
Fuel supply Combustion
Figure 3.6 PM10 emissions from combustion of wood pellets.
0
0.01
0.02
0.03
0.04
0.05
0.06
0.07
0.08
0.09
0.1
Bulk drying Batch
drying
(diesel)
Batch
drying
(w ood
fuel)
Bulk drying Bulk drying Bulk drying Batch
drying
(diesel)
Batch
drying
(w ood
fuel)
Bulk drying Batch
drying
(diesel)
Batch
drying
(w ood
fuel)
Bulk drying Bulk drying
UK forest residues BFR CFR Short rotation coppice UK w ood processing w aste BWPW CWPW
kg
/MW
h f
ue
l
Fuel supply Combustion
Note BRF = Baltic Forest Residues, CFR = Canadian Forest Residues, BWPW = Baltic Wood Processing Waste, CWPW = Canadian Wood Processing Waste
AEA/ED01858010/Issue 2 Carbon factor for wood fuels for the supplier obligation
AEA 11
3.4 Comparison with fossil fuels
3.4.1 GHG Emissions
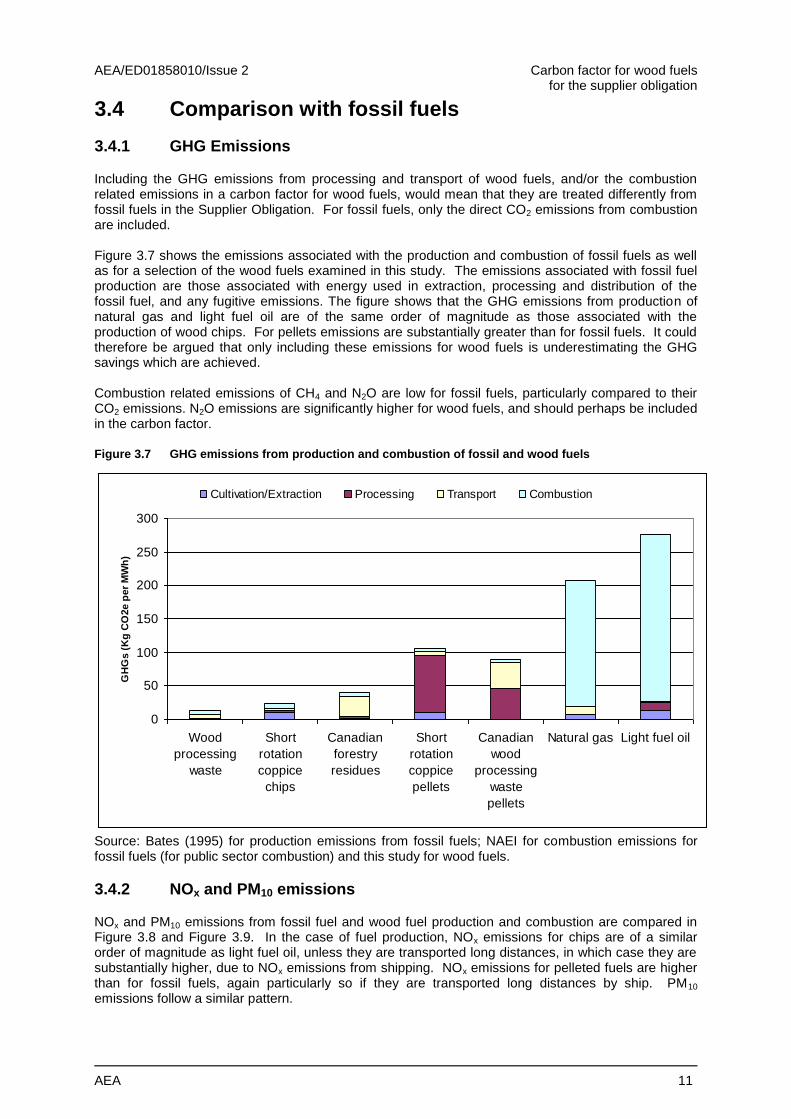
Including the GHG emissions from processing and transport of wood fuels, and/or the combustion related emissions in a carbon factor for wood fuels, would mean that they are treated differently from fossil fuels in the Supplier Obligation. For fossil fuels, only the direct CO2 emissions from combustion are included. Figure 3.7 shows the emissions associated with the production and combustion of fossil fuels as well as for a selection of the wood fuels examined in this study. The emissions associated with fossil fuel production are those associated with energy used in extraction, processing and distribution of the fossil fuel, and any fugitive emissions. The figure shows that the GHG emissions from production of natural gas and light fuel oil are of the same order of magnitude as those associated with the production of wood chips. For pellets emissions are substantially greater than for fossil fuels. It could therefore be argued that only including these emissions for wood fuels is underestimating the GHG savings which are achieved. Combustion related emissions of CH4 and N2O are low for fossil fuels, particularly compared to their CO2 emissions. N2O emissions are significantly higher for wood fuels, and should perhaps be included in the carbon factor.
Figure 3.7 GHG emissions from production and combustion of fossil and wood fuels
0
50
100
150
200
250
300
Wood
processing
waste
Short
rotation
coppice
chips
Canadian
forestry
residues
Short
rotation
coppice
pellets
Canadian
wood
processing
waste
pellets
Natural gas Light fuel oil
GH
Gs (
Kg
CO
2e p
er
MW
h)
Cultivation/Extraction Processing Transport Combustion
Source: Bates (1995) for production emissions from fossil fuels; NAEI for combustion emissions for fossil fuels (for public sector combustion) and this study for wood fuels.
3.4.2 NOx and PM10 emissions
NOx and PM10 emissions from fossil fuel and wood fuel production and combustion are compared in Figure 3.8 and Figure 3.9. In the case of fuel production, NOx emissions for chips are of a similar order of magnitude as light fuel oil, unless they are transported long distances, in which case they are substantially higher, due to NOx emissions from shipping. NOx emissions for pelleted fuels are higher than for fossil fuels, again particularly so if they are transported long distances by ship. PM10 emissions follow a similar pattern.

Carbon factor for wood fuels AEA/ED01858010/Issue 2 for the supplier obligation
12 AEA
Combustion related NOx emissions are similar for wood, oil and gas, but PM10 emissions are three to four times higher than emissions from oil combustion.
Figure 3.8 NOx emissions from production and combustion of fossil and wood fuels.
0
200
400
600
800
1000
1200
Wood
processing
waste
Short
rotation
coppice
chips
Canadian
forestry
residues
Short
rotation
coppice
pellets
Canadian
wood
processing
waste
pellets
Natural gas Light fuel oil
g N
Ox/M
Wh
Cultivation/Extraction Processing Transport Combustion
Source: Bates (1995) for production emissions from fossil fuels; NAEI for combustion emissions for fossil fuels (for public sector combustion) and this study for wood fuels.
Figure 3.9 PM10 emissions from production and combustion of fossil and wood fuels.
0
10
20
30
40
50
60
70
80
90
100
Wood
processing
waste
Short
rotation
coppice
chips
Canadian
forestry
residues
Short
rotation
coppice
pellets
Canadian
wood
processing
waste
pellets
Natural gas Light fuel oil
g N
Ox/M
Wh
Cultivation/Extraction Processing Transport Combustion
Source: Bates (1995) for production emissions from fossil fuels; NAEI for combustion emissions for fossil fuels (for public sector combustion) and this study for wood fuels.
AEA/ED01858010/Issue 2 Carbon factor for wood fuels for the supplier obligation
AEA 13
4 References
Air Quality Expert Group, 2007. Air quality and climate change: a UK perspective, Defra. Coleman, 2008. Personal Communication, Peter Coleman, AEA, 9
th December 2008.
Bates, J, 1995. Full Fuel Cycle Atmospheric Emissions and Global Warming Impacts from UK Electricity Generation, ETSU R-88, HMSO. Chock, D.P., Song, Q.Y., Hass, H., Schell, B., Ackermann, I. (2003). Comment on “Control of fossil-fuel particulate black carbon and organic matter, possibly the most effective method of slowing global warming’’ by M.Z. Jacobson. Journal of Geophysical Research – Atmospheres 108, (D24) Art.No. 4769. Chylek, P. and Wong, J. (1995). Effect of Absorbing Aerosols on Global Radiation Budget. Geophysical Research Letters 22 (8), 929-931. Feichter, J., Sausen, R., Grassl, H. and Fiebig, M. (2003). Comment on “Control of fossil-fuel particulate black carbon and organic matter, possibly the most effective method of slowing global warming’’ by M.Z. Jacobson. Journal of Geophysical Research – Atmospheres 108, (D24): Art. No. 4767. Hansen, J., Sato, M., Nazarenko, L., Ruedy, R., Lacis, A., Koch, D., Tegen, I., Hall, T., Shindell, D., Santer, B., Stone, P., Novakov, T., Thomason, L., Wang, R., Wang, Y., Jacob, D., Hollandsworth, S., Bishop, L., Logan, J., Thompson, A., Stolarski, R., Lean, J., Willson, R., Levitus, S., Antonov, J., Rayner, N., Parker, D. and Christy, J. (2002). Climate forcings in Goddard Institute for Space Studies SI2000 simulations. Journal Of Geophysical Research - Atmospheres 107 (D18): Art. No. 4347. Haywood, J.M. and Shine, K.P. (1995). The Effect of Anthropogenic Sulfate And Soot Aerosol On The Clear-Sky Planetary Radiation Budget. Geophysical Research Letters 22 (5), 603-606. Jacobson, M.Z. (2002). Control of fossil-fuel particulate black carbon and organic matter, possibly the most effective method of slowing global warming. Journal of Geophysical Research 107 (D19), 4410, doi:10.1029/2001JD001376. Jones, A., Roberts, D.L., and Slingo, A. (1994). A climate model study of indirect radiative forcing by anthropogenic aerosols. Nature 370, 450-453. Penner, J.E. (2003). Comment on “Control of fossil-fuel particulate black carbon and organic matter, possibly the most effective method of slowing global warming’’ by M.Z. Jacobson. Journal of Geophysical Research – Atmospheres 108, (D24): Art. No. 4771.

AEA 14
5 Appendices
5.1 Tabulated GHG Emissions Data
Table 5.1 GHG emissions from combustion of wood chips (kg CO2 eq per MWh fuel)
Feed stock Fuel supply Combustion Total
UK forest residues 10.4 6.2 16.6
Baltic forest residues 22.2 6.2 28.4
Canadian forest residues 34.2 6.2 40.4
Short rotation coppice 16.7 6.2 22.9
Wood processing waste 6.9 6.2 13.1
Baltic wood processing waste 16.0 6.2 22.2
Canadian wood processing waste 27.8 6.2 34.0
Table 5.2 GHG emissions from combustion of wood pellets (kg CO2 eq per MWh fuel)
Feed stock Drying method Fuel supply Combustion Total
UK forest residues
Bulk drying 38.3 6.2 44.4
Batch drying (diesel) 36.3 6.2 42.5
Batch drying (wood fuel) 23.7 6.2 29.9
Baltic Forest Residues Bulk drying 49.9 6.2 56.1
Canadian Forest Residues Bulk drying 59.8 6.2 66.0
Short rotation coppice
Bulk drying 99.9 6.2 106.1
Batch drying (diesel) 95.5 6.2 101.7
Batch drying (wood fuel) 52.4 6.2 58.6
UK wood processing waste
Bulk drying 51.1 6.2 57.3
Batch drying (diesel) 48.4 6.2 54.6
Batch drying (wood fuel) 24.4 6.2 30.6
Baltic Wood Processing Waste Bulk drying 65.5 6.2 71.7
Canadian Wood Processing Waste Bulk drying 84.1 6.2 90.3
Table 5.3 Life cycle GHG emissions from the combustion of a selection of wood chips and pellets. (kg CO2 eq per MWh fuel)
Feedstock Cultivation Processing Transport Combustion Total
Wood processing waste 0.00 1.98 4.88 6.23 13.10
Short rotation coppice chips 11.13 3.14 2.46 6.23 22.96
Canadian forestry residues 1.07 3.19 29.97 6.23 40.46
Short rotation coppice pellets 10.16 85.46 4.69 6.23 106.54
Canadian wood processing waste pellets 0.00 46.40 37.73 6.23 90.36

AEA 15
5.2 Tabulated GHG Emissions Data, by IPCC Report
Table 5.4 GHG emissions from combustion of wood chips (kg CO2 eq per MWh fuel), using different GWPs from the three latest IPCC reports.
Feedstock IPCC Report Fuel supply Combustion Total Rank
UK forest residues
SAR 10.45 6.19 16.64 1
TAR 10.44 5.96 16.40 3
AR4 10.45 6.03 16.48 2
Baltic forest residues
SAR 22.24 6.19 28.43 1
TAR 22.22 5.96 28.18 3
AR4 22.25 6.03 28.28 2
Canadian forest residues
SAR 34.23 6.19 40.42 1
TAR 34.22 5.96 40.17 3
AR4 34.25 6.03 40.28 2
Short rotation coppice
SAR 16.73 6.19 22.92 1
TAR 16.59 5.96 22.55 3
AR4 16.63 6.03 22.66 2
Wood processing waste
SAR 6.87 6.19 13.05 1
TAR 6.86 5.96 12.81 3
AR4 6.86 6.03 12.89 2
Baltic wood processing waste
SAR 15.98 6.19 22.17 1
TAR 15.97 5.96 21.93 3
AR4 15.99 6.03 22.02 2
Canadian wood processing waste
SAR 27.83 6.19 34.02 1
TAR 27.82 5.96 33.78 3
AR4 27.85 6.03 33.87 2
Note: SAR = Second Assessment Report, TAR = Third Assessment Report, AR4 = Fourth Assessment Report. The rankings indicate highest and lowest emissions, 1 = highest emissions, 3 = lowest emissions.
Table 5.5 GHG emissions from combustion of wood pellets (kg CO2 eq per MWh fuel), using different GWPs from the three latest IPCC reports.
Feedstock Drying method IPCC
Report Fuel supply Combustion Total Rank
UK forest residues
Bulk drying
SAR 38.25 6.19 44.44 2
TAR 38.35 5.96 44.31 3
AR4 38.49 6.03 44.52 1
Batch drying (diesel)
SAR 36.30 6.19 42.49 1
TAR 36.34 5.96 42.30 3
AR4 36.41 6.03 42.44 2
Batch drying (wood fuel)
SAR 23.72 6.19 29.91 1
TAR 23.75 5.96 29.71 3
AR4 23.83 6.03 29.86 2
Baltic Forest Residues
Bulk drying
SAR 49.88 6.19 56.07 2
TAR 49.98 5.96 55.94 3
AR4 50.14 6.03 56.16 1
Canadian Forest Residues
Bulk drying
SAR 59.81 6.19 66.00 2
TAR 59.92 5.96 65.87 3
AR4 60.08 6.03 66.11 1
Short rotation coppice
Bulk drying SAR 99.87 6.19 106.06 2
TAR 100.06 5.96 106.02 3

AEA 16
AR4 100.48 6.03 106.51 1
Batch drying (diesel)
SAR 95.53 6.19 101.72 2
TAR 95.51 5.96 101.47 3
AR4 95.69 6.03 101.72 1
Batch drying (wood fuel)
SAR 52.38 6.19 58.57 2
TAR 52.33 5.96 58.28 3
AR4 52.55 6.03 58.58 1
UK wood processing waste
Bulk drying
SAR 51.13 6.19 57.32 2
TAR 51.30 5.96 57.26 3
AR4 51.51 6.03 57.54 1
Batch drying (diesel)
SAR 48.41 6.19 54.60 2
TAR 48.47 5.96 54.43 3
AR4 48.57 6.03 54.60 1
Batch drying (wood fuel)
SAR 24.40 6.19 30.59 1
TAR 24.45 5.96 30.41 3
AR4 24.56 6.03 30.59 2
Baltic Wood Processing Waste
Bulk drying
SAR 65.48 6.19 71.67 2
TAR 65.65 5.96 71.60 3
AR4 65.87 6.03 71.90 1
Canadian Wood Processing Waste
Bulk drying
SAR 84.13 6.19 90.32 2
TAR 84.30 5.96 90.26 3
AR4 84.54 6.03 90.57 1
Note: SAR = Second Assessment Report, TAR = Third Assessment Report, AR4 = Fourth Assessment Report. The rankings indicate highest and lowest emissions, 1 = highest emissions, 3 = lowest emissions.

AEA 17
5.3 Tabulated NOx Emissions Data
Table 5.6 NOx emissions from combustion of wood chips (kg NOx per MWh fuel)
Feedstock Fuel supply Combustion Total
UK forest residues 0.06 0.22 0.28
Baltic forest residues 0.28 0.22 0.50
Canadian forest residues 0.53 0.22 0.74
Wood processing waste 0.05 0.22 0.26
Short rotation coppice 0.05 0.22 0.26
Short rotation coppice 0.05 0.22 0.26
Baltic wood processing waste 0.24 0.22 0.45
Canadian wood processing waste 0.48 0.22 0.70
Table 5.7 NOx emissions from combustion of wood pellets (kg NOx per MWh fuel)
Feed stock Drying method Fuel supply Combustion Total
UK forest residues
Bulk drying 0.11 0.22 0.32
Batch drying (diesel) 0.09 0.22 0.31
Batch drying (wood fuel) 0.11 0.22 0.33
Baltic Forest Residues Bulk drying 0.29 0.22 0.50
Canadian Forest Residues Bulk drying 0.49 0.22 0.71
Short rotation coppice
Bulk drying 0.18 0.22 0.40
Batch drying (diesel) 0.12 0.22 0.34
Batch drying (wood fuel) 0.22 0.22 0.43
UK wood processing waste
Bulk drying 0.11 0.22 0.33
Batch drying (diesel) 0.08 0.22 0.30
Batch drying (wood fuel) 0.12 0.22 0.33
Baltic Wood Processing Waste Bulk drying 0.41 0.22 0.63
Canadian Wood Processing Waste Bulk drying 0.80 0.22 1.01
Table 5.8 Life cycle NOx emissions from the combustion of a selection of wood chips and pellets. (kg NOx per MWh fuel).
Feedstock Cultivation Processing Transport Combustion Total
Wood processing waste 0.00 0.01 0.04 0.22 0.26
Short rotation coppice chips 0.01 0.02 0.02 0.22 0.26
Canadian forestry residues 0.00 0.02 0.51 0.22 0.74
Short rotation coppice pellets 0.01 0.14 0.04 0.22 0.40
Canadian wood processing waste pellets 0.00 0.07 0.72 0.22 1.01
AEA 18
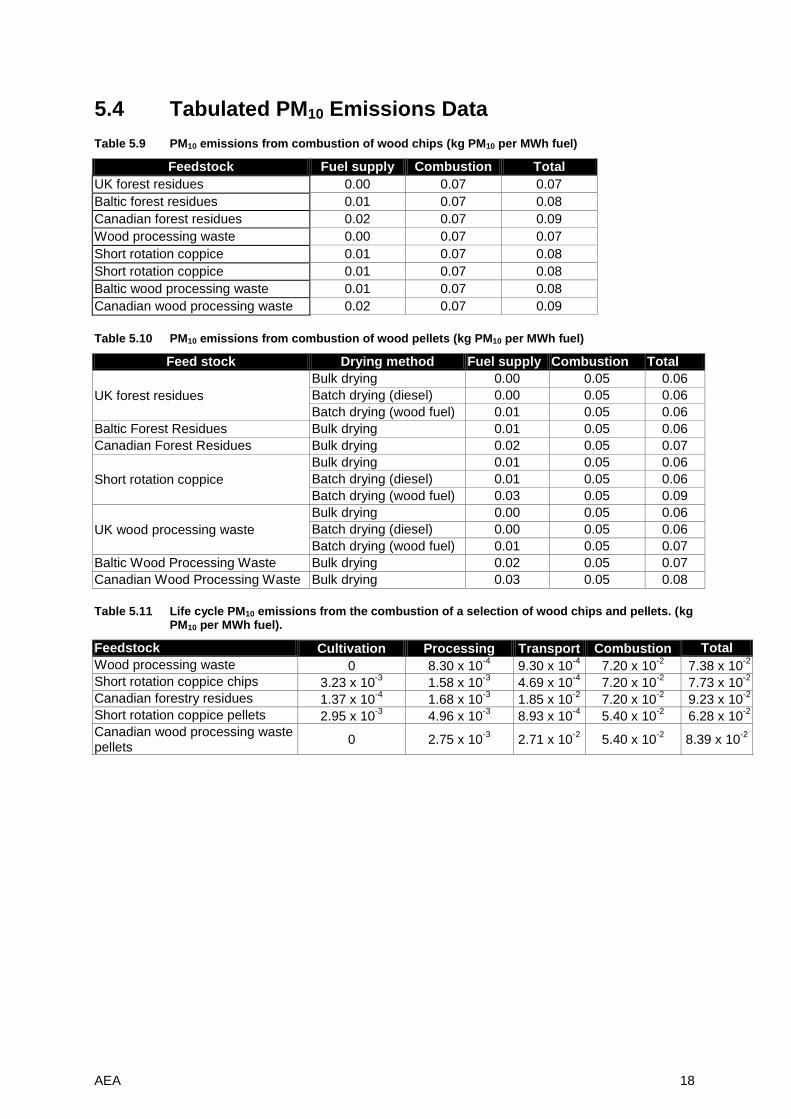
5.4 Tabulated PM10 Emissions Data
Table 5.9 PM10 emissions from combustion of wood chips (kg PM10 per MWh fuel)
Feedstock Fuel supply Combustion Total
UK forest residues 0.00 0.07 0.07
Baltic forest residues 0.01 0.07 0.08
Canadian forest residues 0.02 0.07 0.09
Wood processing waste 0.00 0.07 0.07
Short rotation coppice 0.01 0.07 0.08
Short rotation coppice 0.01 0.07 0.08
Baltic wood processing waste 0.01 0.07 0.08
Canadian wood processing waste 0.02 0.07 0.09
Table 5.10 PM10 emissions from combustion of wood pellets (kg PM10 per MWh fuel)
Feed stock Drying method Fuel supply Combustion Total
UK forest residues
Bulk drying 0.00 0.05 0.06
Batch drying (diesel) 0.00 0.05 0.06
Batch drying (wood fuel) 0.01 0.05 0.06
Baltic Forest Residues Bulk drying 0.01 0.05 0.06
Canadian Forest Residues Bulk drying 0.02 0.05 0.07
Short rotation coppice
Bulk drying 0.01 0.05 0.06
Batch drying (diesel) 0.01 0.05 0.06
Batch drying (wood fuel) 0.03 0.05 0.09
UK wood processing waste
Bulk drying 0.00 0.05 0.06
Batch drying (diesel) 0.00 0.05 0.06
Batch drying (wood fuel) 0.01 0.05 0.07
Baltic Wood Processing Waste Bulk drying 0.02 0.05 0.07
Canadian Wood Processing Waste Bulk drying 0.03 0.05 0.08
Table 5.11 Life cycle PM10 emissions from the combustion of a selection of wood chips and pellets. (kg PM10 per MWh fuel).
Feedstock Cultivation Processing Transport Combustion Total
Wood processing waste 0 8.30 x 10⁻⁴
9.30 x 10⁻⁴
7.20 x 10⁻²
7.38 x 10⁻²
Short rotation coppice chips 3.23 x 10⁻³
1.58 x 10⁻³
4.69 x 10⁻⁴
7.20 x 10⁻²
7.73 x 10⁻²
Canadian forestry residues 1.37 x 10⁻⁴
1.68 x 10⁻³
1.85 x 10⁻²
7.20 x 10⁻²
9.23 x 10⁻²
Short rotation coppice pellets 2.95 x 10⁻³
4.96 x 10⁻³
8.93 x 10⁻⁴
5.40 x 10⁻²
6.28 x 10⁻²
Canadian wood processing waste pellets
0 2.75 x 10⁻³
2.71 x 10⁻²
5.40 x 10⁻²
8.39 x 10⁻²

AEA 19
AEA group 329 Harwell Didcot Oxfordshire OX11 0QJ Tel: 0870 190 6411 Fax: 0870 190 6388