carbon fiber counting - nasa · · 2013-08-31assoc1ated w1th large pool f1res of jet fuel...
TRANSCRIPT

II III 111111 1111 11111111I111 I111 I11I 1111I111I1I11111 I11I1111I111I
3 1176 00162 4072
]
t , , .
/IIlSA Tm- %0/17
NASA Technical Memorandum 80117
NASA-TM-8011719800019945
Carbon Fiber Counting
Richard A. Pr1.de
June 1980
NI\SI\ National Aeronautics and Space Administration
Langley Research Center Hampton, Virginia 23665
I'
111111111111111111111111111111111111111111111 NF00670
II ~ 111111 1111 11111111I111 I111 I11I 1111I111I1I11111 I11I1111I111I
1176 00162 4072
]
t , , .
/IIlSA Tm- %0/17
NASA Technical Memorandum 80117
NASA-TM-8011719800019945
Carbon Fiber Counting
Richard A. Pr1.de
June 1980
NI\SI\ National Aeronautics and Space Administration
Langley Research Center Hampton, Virginia 23665
I'
111111111111111111111111111111111111111111111 NF00670
https://ntrs.nasa.gov/search.jsp?R=19800019945 2018-05-30T09:02:33+00:00Z

l 2 Government Accession No 1 Report No
NASA TM-80117 4 Title and Subtitle
Carbon Fiber Countlng
7 Author(s) Richard A. Pride
9 Performing Organization Name and Address
NASA-Langley Research Center Hampton, VA 23665
3 Recipient's Catalog No
5 Report Date June 1980
6 Performing OrganizatIOn Code
8 Performing Organization Report No
10 Work Unit No
534-03-23-01 11 Contract or Grant No
~~~~~~~~~~~~~~~~~~~~~~~~~~~~~~~ 13 Ty~~ Report~d P~lod Cov~~ 12 Sponsorl ng Agency Name and Address Technical Memorandum
Natl0nal Aeronautlcs and Space Administration Washington, DC 20546
14 Sponsoring Agency Code
15 Supplementary Notes
, 6 Abstract
A method has been developed for characterizing the number and lengths of carbon flbers accidentally released by the burning of composlte portions of civl1 aircraft structure ln a jet fuel fire after an accldent. The method was developed as part of a Langley Research Center assessment of the risk associated wlth such release. Representatlve sampllngs of carbon fibers collected on transparent stlcky fllm were counted from photographlc enlargements wlth a computer-alded technlque which also provided flber lengths. Comparlsons have been made between the Langley method and the methods used by three other laboratories through a round-robln counting of 12 selected sticky sampler records. Conslstent results were obtalned among counts from Langley and two of the other laboratories. A major source of counting error was found ln the technlque of the fourth laboratory which, when corrected, placed their flber counts wlthin the same range as the others.
'7 Key Words (Suggested by Author(s)) Flber-released carbon flbers Graphlte flbers
'8 Distribution Statement UnclaSSlfled - Unlimited
Flber length
19 SecUrity Classlf (of thiS report)
UnClaSSlfled 20 Security Classlf (of this page)
UnClaSSlfled
SubJect category 24
21 No of Pages
15 22 Price"
A02
N-305 For sale by the National Tcchnlcallnformatlon SerVice, Springfield Virginia 22161
I 2 Government Accession No 1 Report No
NASA TM-80117 4 Title and Subtitle
Carbon Fiber Countlng
7 Author(s) Richard A. Pride
9 Performing Organization Name and Address
NASA-Langley Research Center Hampton, VA 23665
3 Recipient's Catalog No
5 Report Date June 1980
6 Performing OrganizatIOn Code
8 Performing Organization Report No
10 Work Unit No
534-03-23-01 11 Contract or Grant No
~~~~~~~~~~~~~~~~~~~~~~~~~~~~~~~ 13 Ty~~ Report~d P~lod Cov~~ 12 Sponsorl ng Agency Name and Address Technical Memorandum
Natl0nal Aeronautlcs and Space Administration Washington, DC 20546
14 Sponsoring Agency Code
15 Supplementary Notes
, 6 Abstract
A method has been developed for characterizing the number and lengths of carbon flbers accidentally released by the burning of composlte portions of civl1 aircraft structure ln a jet fuel fire after an accldent. The method was developed as part of a Langley Research Center assessment of the risk associated wlth such release. Representatlve sampllngs of carbon fibers collected on transparent stlcky fllm were counted from photographlc enlargements wlth a computer-alded technlque which also provided flber lengths. Comparlsons have been made between the Langley method and the methods used by three other laboratories through a round-robln counting of 12 selected sticky sampler records. Conslstent results were obtalned among counts from Langley and two of the other laboratories. A major source of counting error was found ln the technlque of the fourth laboratory which, when corrected, placed their flber counts wlthin the same range as the others.
'7 Key Words (Suggested by Author(s)) Flber-released carbon flbers Graphlte flbers
'8 Distribution Statement UnclaSSlfled - Unlimited
Flber length
19 SecUrity Classlf (of thiS report)
UnClaSSlfled 20 Security Classlf (of this page)
UnClaSSlfled
SubJect category 24
21 No of Pages
15 22 Price"
A02
N-305 For sale by the National Tcchnlcallnformatlon SerVice, Springfield Virginia 22161

CARBON FIBER COUNTING
By Rlchard A. Pride NASA-Langley Research Center
SUMMARY
A method has been developed for characterizing the number and lengths of carbon fibers accidentally released by the burning of composite portions of civll aircraft structure in a jet fuel fire after an accident. The method was developed as part of a Langley Research Center assessment of the risk associated with such release. Representative samplings of carbon fibers collected on transparent sticky fllm were counted from photographic enlargements with a computer-aided technique which also provided flber lengths. Comparlsons have been made between the Langley method and the methods used by three other laboratories through a round-robin counting of 12 selected sticky sampler records. Conslstent results were obtained among counts from Langley and two of the other laboratories. A maJor source of counting error was found ln the technique of the fourth laboratory which, when corrected, placed their fiber counts within the same range as the others.
INTRODUCTION
The Graphlte Flbers Risk Analysis Program Office at Langley Research Center has been charged wlth assessing the risk assoclated wlth the accidental release of carbon fiber which might occur from the burning of composlte portions of a civil alrcraft structure ln a Jet fuel flre during or after an accident. Determlning the number and size of carbon fibers released from a burned composite was a major part of the investlgation that was necessary in order to determine the risk of electrical or electronlc equipment malfunctions or damage from short circuitlng if airborne carbon fibers settle on electrical contacts.
Composite plates and structural elements were burned in laboratory experiments under a variety of conditions which influence the release of single fibers. Generally, representative portions of these flbers were collected on sticky samplers which then were lnspected to determine quantity and size. Similar samplers have been used with the few outdoor experiments conducted. Because of the generally short lengths and small diameters of single carbon fibers released from burned structural composltes, examlnation of collection samplers was done with visual magnlficatlon ranging from about 8 to 20X. The number of fibers deposited on any glven sampler ranged from zero
up to tens of thousands, depend1ng on the part1cular cond1t1ons of the compos1te burn and the locat1on and Slze of the sampler. Count1ng large numbers of f1bers 1S ted10us and becomes more d1ff1cult when large quant1t1es of mult1ple f1ber clumps and compos1te lam1nae str1ps are interm1ngled with the slngle f1bers. Soot part1cles released from incomplete combust1on assoc1ated w1th large pool f1res of Jet fuel 1ncrease the d1ff1culty of d1st1ngu1sh1ng slngle f1bers.
Several techn1ques were therefore developed for eff1c1ent count1ng of the slngle f1bers by var10US organ1zat1ons, based on the1r exper1ence and on the type of records ava1lable for count1ng. Generally, these techn1ques 1ncluded some form of sampl1ng from the total record, Slnce 1t 1S 1mpract1cal to count the large numbers of f1bers on the ent1re sample. However, large var1at1ons were observed 1n the measured results and 1t was suspected that some of the var1at1ons might be due to d1fferences 1n count1ng techn1ques rather than to d1fferences 1n fiber release cond1t1ons. Therefore, a round-rob1n counting of selected st1cky paper records has been conducted under the ausp1ces of the Naval Surface Weapons Center, Dahlgren, V1rg1n1a. Four laborator1es wh1ch were act1vely 1nvolved 1n count1ng f1bers 1n the J01nt DODNASA carbon f1ber r1sk analys1s program part1c1pated 1n the round-rob1n.
Th1s report descr1bes the method used to count and to character1ze carbon f1bers at the Langley Research Center and presents the results from the count1ng of the selected roundrob1n samples. Overall results of the r1sk assessment were presented at an 1ndustry/government br1ef1ng held December 4-5, 1979, at the Langley Research Center (ref. 1).
FIBER COUNTING METHODOLOGY
Small sticky cyl1nders were used to measure carbon f1ber exposure levels for many of the exper1ments conducted at the Langley Research Center on the vulnerab1l1ty of electr1cal equ1pment (ref. 2). These cyllnders were constructed from 50 mm squares of 0.5mm thlCk adheslve-coated polyester film. The transparent fllm was rolled, adheslve slde out, on a l3mm d1ameter mandrel to form the cyllnders. The overlapPlng edges of the fllm were JOlned by the adheslve coatlng. The cyllnders were supported In a flow stream by attachlng the overlap reg10n to a Wlre strut. After exposure, the cyllnders were cut at the overlapplng JOlnt, unrolled, and pressed, adheslve-slde-down, agalnst a mlcrofllm aperture card ( a computer card w1th a transparent fllm-covered openlng 35 mm x 48 mm).
Flbers were counted by dlrect examlnatlon of a 35mm x 35mm square area of the mounted stlcky fllm through a stereo mlcroscope at 20X magnlflcatlon. In the mlcroscope wlth obllque
2

front 111umlnatlon, carbon flbers were easily distinguished from other forms of flbrous contamlnatlon and from scratches on the transparent stlcky material. For 11ght deposits of fibers up to about 50 fibers on a 35-millimeter square (4 x 10 4 fibers/m 2 ) countlng the total area of the sampler was done easily with the mlcroscope. However, for heav1er deposlts of f1bers, or if fiber lengths were to be determined, an alternate method was developed.
An enlarged photograph1c pr1nt was made from the aperturecard-mounted st1cky sampler w1th the same microfilm printer that is used to reproduce full-s1ze cop1es of engineering drawlngs after they have been m1crof1lmed. The 20X enlargement was then placed on a magnetic d1g1t1zer board and the fibers were ldentif1ed to a computer by touch1ng the ends of thelr lmages w1th a magnet1c pen. A computer program computed the lengths of f1bers from the coord1nates of the 1dentified fiber ends, and at the complet10n of scann1ng the photograph, the computer printed a l1stlng of all the f1bers 1n a length-ordered sequence from shortest to longest.
Slngle-f1ber lengths down to about 0.1 rom can be clearly resolved; however, for the current 1nvestigation, only those f1bers of lengths greater than one millimeter were considered Slnce these were the only ones of 1nterest as potential hazards 1n the short c1rcu1t1ng of electr1cal equipment.
ROUND-ROBIN COUNTING
The round-rob1n count1ng was planned with four selected st1cky paper samplers from each of three tests conducted ins1de a closed chamber at the Naval Surface Weapons Center (NSWC), Dahlgren, V1rg1n1a (ref. 3). Graph1te-epoxy plates were burned and an explos1ve charge was then detonated beneath the res1due, Y1eldlng depos1ts of s1ngle f1bers, mult1ple-fiber clumps, str1ps, and p1eces. Three of these tests were selected for the round-robln count1ng as be1ng representat1ve of heavy, medlum, and l1ght depos1t10n. The st1cky-paper samplers in all these tests were flat transparent sheets of adhesive-coated polyester f1lm 15 by 23 cm la1d on the floor of the test chamber 1n a regular pattern 1n order to sample the deposition of fibers released in the test. F1ber clumps and str1ps are readily V1S1ble aga1nst a mottled background of soot and fine partlcles 1n a photograph of a tYP1cal NSWC chamber stlcky sampler (flg. 1). S1ngle f1bers are essent1ally 1nv1s1ble at the magn1ficat1on 1n th1s photograph but are more or less uniformly dlstributed over the ent1re surface.
In order to count these samplers by the Langley method, a 35 rom square p1ece was cut from the lower rlght corner of each sampler, (fig. 2) and mounted on an aperture card wh1ch was
3
then printed as a photographic enlargement at 20X. The photographs of the lighter depos1tions were counted over the entire area, whereas for the medium and heavy depositions, only about three percent of the photographed area was counted. In the photographs of the medium and heavy deposits, an area 12.7 cm (5 inches) square was marked near the center of the photograph (where fiber 1mage contrast was the greatest) and the f1bers 1n this area were counted. The count 1ncluded f1bers Wh1Ch were part1ally in and partially out of the square 1f they crossed either the left hand or the bottom boundary of the marked area.
As a check on the representat1ve nature of the area counted, four adJo1ning areas were marked and counted on one of the med1um depos1t1on photographs and two adjo1n1ng areas on one of the heavy depos1t1on photographs. The 10cat1on of these areas 1S shown in f1gure 2.
RESULTS AND DISCUSSION
The results of the counting 1n the selected area of each of the photographed samplers are given 1n Table I. In each of the samplers, the actual area counted conta1ned from 21 to 78 fibers w1th lengths greater than 1 rom. The proJected total fibers on the 15 x 23 cm st1cky were obta1ned by mult1plY1ng the actual f1bers counted by the ratio of the total sticky area to the area counted. For the heavy and the med1um depos1t1ons this mult1plier was generally 864, wh1le for the llght depositions it was only about 30.
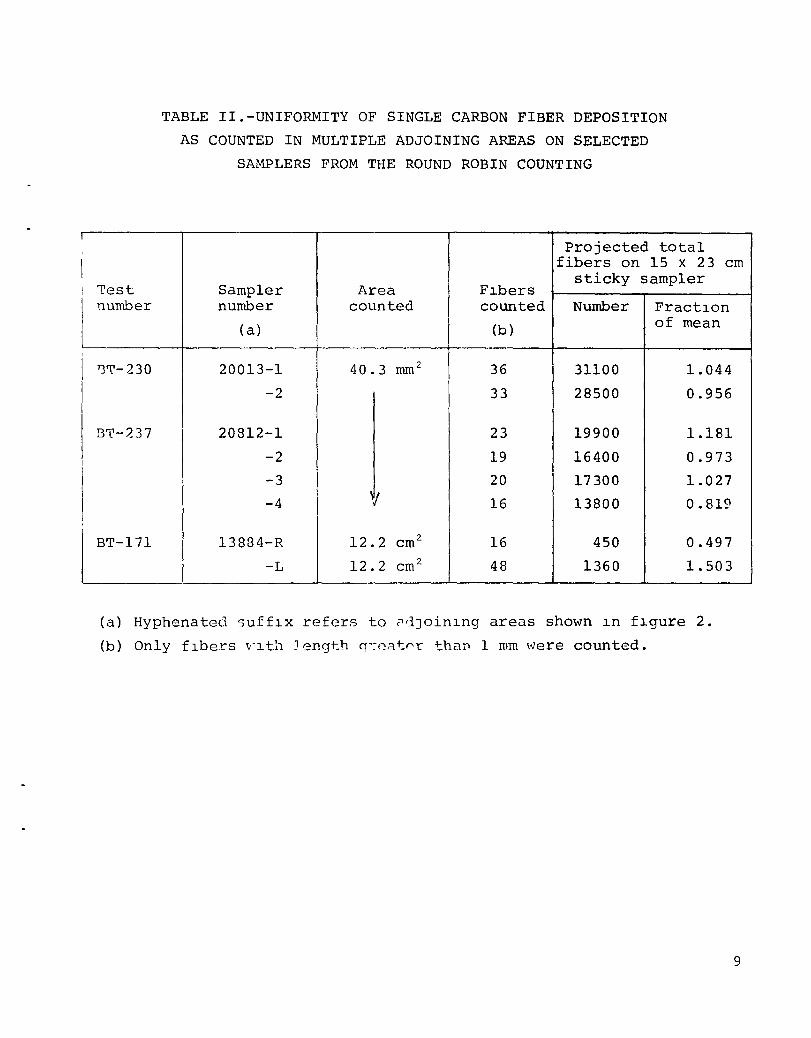
For the heavy depos1t sample (number 20013, Table II), the two adJo1n1ng areas counted ylelded proJected total fiber counts of 31100 and 28500, wh1ch were w1th1n plus or m1nus 5 percent of the average of the two areas. For the med1um depos1t sample (number 20812), the four adJo1n1ng areas counted Y1elded proJected total f1ber counts rang1ng from 13800 to 19900 Wh1Ch were w1th1n plus or m1nus 18 percent of the four-area average of 16,800.
For the llghter depos1t1on samples as much of the 35 rom square p1ece as could be photographed was counted. A qU1ck scan of the ent1re sampler 1nd1cated apparently uniform deposition; hO\Ol'2Ver, because the depos1t1on was so Ilght, it was difficult to be certain of un1formlty. n check was made on sample number 13884 by cuttlng a second 35 rom square from the lower left corner and countlng 1tS flbers. ns shown ln Table II, there was a 3 to 1 difference in the total count of fibers on the two areas taken as representat1ve of thlS sampler, WhlCh can also be expressed as plus or mlnus 50 percent of the average. But the count on both of them compared wlth either medlum or heavy deposlts was low.
4
then printed as a photographic enlargement at 20X. The photographs of the lighter depos1tions were counted over the entire area, whereas for the medium and heavy depositions, only about three percent of the photographed area was counted. In the photographs of the medium and heavy deposits, an area 12.7 cm (5 inches) square was marked near the center of the photograph (where fiber 1mage contrast was the greatest) and the f1bers 1n this area were counted. The count 1ncluded f1bers Wh1Ch were part1ally in and partially out of the square 1f they crossed either the left hand or the bottom boundary of the marked area.
As a check on the representat1ve nature of the area counted, four adJo1ning areas were marked and counted on one of the med1um depos1t1on photographs and two adjo1n1ng areas on one of the heavy depos1t1on photographs. The 10cat1on of these areas 1S shown in f1gure 2.
RESULTS AND DISCUSSION
The results of the counting 1n the selected area of each of the photographed samplers are given 1n Table I. In each of the samplers, the actual area counted conta1ned from 21 to 78 fibers w1th lengths greater than 1 rom. The proJected total fibers on the 15 x 23 cm st1cky were obta1ned by mult1plY1ng the actual f1bers counted by the ratio of the total sticky area to the area counted. For the heavy and the med1um depos1t1ons this mult1plier was generally 864, wh1le for the llght depositions it was only about 30.
For the heavy depos1t sample (number 20013, Table II), the two adJo1n1ng areas counted ylelded proJected total fiber counts of 31100 and 28500, wh1ch were w1th1n plus or m1nus 5 percent of the average of the two areas. For the med1um depos1t sample (number 20812), the four adJo1n1ng areas counted Y1elded proJected total f1ber counts rang1ng from 13800 to 19900 Wh1Ch were w1th1n plus or m1nus 18 percent of the four-area average of 16,800.
For the llghter depos1t1on samples as much of the 35 rom square p1ece as could be photographed was counted. A qU1ck scan of the ent1re sampler 1nd1cated apparently uniform deposition; hO\Ol'2Ver, because the depos1t1on was so Ilght, it was difficult to be certain of un1formlty. n check was made on sample number 13884 by cuttlng a second 35 rom square from the lower left corner and countlng 1tS flbers. ns shown ln Table II, there was a 3 to 1 difference in the total count of fibers on the two areas taken as representat1ve of thlS sampler, WhlCh can also be expressed as plus or mlnus 50 percent of the average. But the count on both of them compared wlth either medlum or heavy deposlts was low.
4
In addition to the total number of fibers counted, the d1str1bution of the number of f1bers by length increment was also determined (see Table III). The percentage of the total in each one-mill1meter 1ncrement from 1 to 7 mm was tabulated for the ind1vidual samplers as well as for the average within each depos1t1on category. F1gure 3 presents these average d1str1butl0ns by length in graph1cal form. Although the longest fibers counted were in the 6-7 mm length range, the distribution was concentrated pr1mar1ly in the 1 and 2 mm lengths, with a tendency to be more sharply peaked for the Ilghter deposit1on.
The mean lengths and the standard dev1at1on of the fiber lengths are also given 1n Table III for each of the samplers counted. The consistency 1n these values 1S an indication of slmilarity with1n the d1str1but1ons of fiber lengths for the var10US samplers selected for th1S round robin counting. Mean fiber lengths for f1bers greater than 1 mm 1n length ranged from a h1gh of 2.4 mm for a heavy depos1t1on to a low of 1.5mm for a Ilght depos1t1on. Th1S var1at1on 1n mean f1ber length with f1ber release dens1ty may have been the result of the same d1fferences in burn t1me, burn temperature, or carbon-fiber compos1te spec1men construct1on that produced the variat10ns in f1ber release density. However, 1t was not a strong trend and these three tests were not suff1C1ent in themselves to draw a conclUS1on concern1ng factors wh1ch may 1nfluence variations in average lengths of f1re-released f1bers.
Part1c1pants from the four laborator1es involved 1n the round rob1n f1ber count1ng met at the Langley Research Center May 10, 1979, to d1SCUSS the techn1ques used by each laboratory and to present data wh1ch had prev10usly been submitted to the Naval Surface Weapons Center. (ref. 4). The £our part1c1-pat1nq laborator1es were Defense and Space Systems Group of TRW, Inc., Scient1f1c Serv1ce, Inc., U. S. Army Dugway Proving Ground, and NASA-Langley Research Center. A summary of the fiber count1ng 1S listed in Table IV and is shown graphically in F1gure 4 for the Ilght, med1um and heavy deposits.
All four laborator1es obta1ned reasonably consistent total f1ber counts for the samplers from the Ilght deposition test (687 fibers average per sampler or 0.2 x 10 5 fibers/m 2 ). All four used Slm1lar methods of total f1ber count1ng within specifled subd1v1s1ons of the total sampler area. The size of the area and method of location var1cd among laboratories.
For the medium (6.5 x 10 5 fibers/m 2 ) and heavy (11.4 x 10 5
f1bers/m 2 ) depos1t1on tests, three of the laboratories continued to use the total f1ber count1ng methods. Dugway Proving Ground changed to a techn1que for count1ng based on an application of the Buffon needle drop proble~ (ref. 5). This technique prov1ded an expedient and systematLc method for count1ng when the fiber
5

denslty on the samplers was so great that overlapping and crlsscrossing of flbers made total flber countlng difficult. However, ln the round robin counting, thlS technlque gave results which were conslstently greater than the other three laboratories' total flber counting methods. As can be seen, (fig. 4), the Dugway results were 2.8 and 2.3 tlmes greater than the average of the other laboratory flber counts for heavy and medium deposits.
Subsequent lnvestlgation at Dugway found that the grid lines prlnted on a transparent overlay used in the Buffon countlng technique were too thlCk and blased the count, and ln additlon the people countlng flbers were havlng difflculty dcterrnlnlng whlch flbers to accept and which to reject when the length was close to the 1 rnrn llmlt. Wlth length spectra similar to those ln figure 3, there were many flbers with lengths close to 1 Nm. The addltlon of 1 rnrn reference marks on the transparent overlay has helped resolve the uncertalnty and Dugway has reported that a recount of the round-robln samplers wlth the reference marks and with thln grld llnes has reduced thelr total flber counts to a level conslstent wlth the averages of the other three laboratorles.
SClentlflc Servlce, Inc. (SSI) lndlcated that they could not analyze accurately the heavy deposit samplers wlth their total flber countlng method without flrst redlstrlbuting the flbers, thereby destroYlng the orlglnal samples.
CONCLUDING REMARKS
A method for countlng and slzlng by length single carbon flbers released from burnlng composlte materlals was developed nt the Langley Research Center. ThlS method used photographlc enlargement and a computer-alded countlng technlque for characterizing 35 mm stlcky collector samplers. The method has been used in a round-robln countlng exercise among four laboratorles on four selected stlcky paper samplers from each of three tests representatlve of heavy, medlum, and llght deposlts of cnrbon flbers. For ad]Olnlng areas on the same sampler, countlng varlatlons of about 5 percent from average were established for heavy deposlts, 18 percent for medlum deposlts and 50 percent for the small quantlty of flbers on the light deposit. The nverage flber length for flbers greater than 1 rnrn ln length rnnged from 2.4 to 1.5 mm over all 12 samplers.
Round robln countlng of slngle carbon flbers establlshed reasonably conslstent total flb~r counts for llght deposltlon samplers, 0.2 x 10~ flbers/m). For medlum (6.5 x 10 5 flbers/m 2 )
nnd heavy (11.4 x 10 5 flbers/m 2 ) deposltlon samplers, the Langley ~ountlng method gave total £Jhcr counts that were conslstent ~'ll th two other labora carles 11 Slnr'f slmJ_lar approaches. However, the expedlent countlng ~Cth0~ ~dnptp~ by Dugway Proving Ground
6

gave fiber counts that were two to three times greater than the average of the other laboratories. The Dugway method has been subsequently modif1ed to better d1fferentiate which of the fibers should be counted. W1th this mod1f1cation the Dugway total f1ber counts were reported to be consistent with the counts of the other laboratories.
REFERENCES
1. Assessment of Carbon F1ber Electrical Effects. NASA CP-2119, 1980.
2. Exper1menta1 and Ana1yt1ca1 Stud1es for the NASA Graph1te F1ber R1Sk Assessment. (The Bionetics Corporation, NASA Contract NASl-15238). NASA CR-159214, 1980.
3. Babinsk1, T. C. and Musselman, K. A.: Burn/Blast Tests of A1rcraft Structural Elements. U. S. Naval Surface Weapons Center, NSWC/DL TR 3897, 1978.
4. Review and Ana1ys1s of F1ber Counting Methods. (Arthur D. L1tt1e, Inc., U. S. Naval Surface Weapons Center Contract), NSWC TR-80-210, 1980.
5. Salomon, Lothar L.i Trethewey, John D.i and Bushnell, Me1V1n J.: Eva1uat10n fo Clouds of Airborne Fibers. The Army SC1ence Conference Proceed1ngs, 18-21 June 1974, Vol. III Pr1nc1pa1 Authors S-Z, Un1ted States Military Academy, West P01nt, NY. AD 785675.
7

TABLE I.-SINGLE CARBON FIBERS COUNTE~ AND PROJECTED TOTAL
CARBON FIBERS ON STICKY SAMPLERS SELECTED FOR ROUND ROBIN
COUNTING FROM THREE NSWC CHAMBER BURN AND EXPLODE TESTS
Area Flbers ProJected total fibers
Test & sampler nUMber counted counted on 15 x 23 cm (a) stlcky sampler
BT-230 Heavy deposltlon
19968 40.3 mm 2 53 45800
19970
J 47 40600
19980 37 32000
20013 80.6 69 29800
BT-237 Medlum deposltion
20803 40.3 mm 2 32 27600
20805 t 23 19900
20810 23 19900
20812 161. 2 78 16800
l3T-171 Llght deposltlon
13863 10.5 cm 2 22 730
13875 10.5 26 860
13882 10.5 21 700
13884 24.4 64 900
(A) Only flbers wlth length Greater thon 1 mm were counted.
8
I
TABLE II.-UNIFORMITY OF SINGLE CARBON FIBER DEPOSITION
AS COUNTED IN MULTIPLE ADJOINING AREAS ON SELECTED
SAMPLERS FROM THE ROUND ROBIN COUNTING
Projected total
I fibers on 15 x 23 cm
Sampler Area Flbers sticky sampler
number counted counted Number Fractlon i 1'est I number
( a) (b) of mean
L ______ +-________ ~--__ ----~------~----~------~ I 13'1'-230 20013-1 40.3 mm 2 36 31100 1.044
-2 33 28500 0.956
B'1'-?37 20812-1 23 19900 1.181
-2 19 16400 0.973
-3 20 17300 1.027
-4 0/ 16 13800 0.819
13884-R 12.2 cm 2 16 450 0.497
-L 12.2 cm 2 48 1360 1.503
,
~!--------------~----------~----------~--------~--------~ (a) Hyphenated sufflX refers to ~~Joinlng areas shown ln flgure 2.
(b) Only flbers "-1 th ] ength (r~c;;'lt"L thuD 1 mm were counted.
9
TABLE II.-UNIFORMITY OF SINGLE CARBON FIBER DEPOSITION
AS COUNTED IN MULTIPLE ADJOINING AREAS ON SELECTED
SAMPLERS FROM THE ROUND ROBIN COUNTING
Projected total
I fibers on 15 x 23 cm
Sampler Area Flbers sticky sampler
number counted counted Number Fractlon i 1'est I number
( a) (b) of mean
L------+---------~--------~------4_----_4------~ I 13'1'-230 20013-1 40.3 mm 2 36 31100 1.044
-2 33 28500 0.956
B'1'-?37 20812-1 23 19900 1.181
-2 19 16400 0.973
-3 20 17300 1.027
-4 IIJ 16 13800 0.819 ,
13884-R 12.2 cm 2 16 450 0.497
-L 12.2 cm 2 48 1360 1.503 ~,--------------~----------~----------~--------~--------~ (a) Hyphenated sufflX refers to ~~Joinlng areas shown ln flgure 2.
(b) Only flbers "-1 th ] ength (r~c;;'lt"L thuD 1 mm were counted.
9

TABLE III.-DISTRIBUTION OF SINGLE CARBON FIBERS BY LENGTH CATEGORY,
MEAN LENGTH, AND STANDARD DEVIATION BASED ON COUNTS OF FIBER
DEPOSITION ON STICKY SAMPLERS SELECTED FOR ROUND ROBIN
COUNTING FROM THREE NSWC BURN AND EXPLODE TESTS
Percentage of flbers of length category
Test & sampler number Std. 1- 2- 3- 4- 5- 6- Mean dev. 1.9 2.9 3.9 4.9 5.9 6.9 length of
mm mm mm mm mm mm mm length
BT-230 Heavy deposltion
19968 47 42 11 - - - 2.12 0.70
19970 34 44 11 9 2 - 2.41 .98
19980 73 19 5 3 - - 1. 77 .73
20013 66 25 9 - - - 1. 80 .64
Average 55 33 9 2 1 - 2.02
B-237 Medlum deposl.tl.on
20803 72 19 3 3 3 - 1.79 0.94
20805 83 13 4 - - - 1. 55 .57
20810 52 22 26 - - - 2.14 .97
20812 76 14 9 1 - - 1. 73 .76
Average 72 16 10 1 1 - 1. 78
BT-171 Llght deposltlon
13863 82 18 - - - - 1. 50 0.46
13875 92 4 - - - 4 1. 56 1. 02
13882 90 5 - - 5 - 1.53 0.89
13884 81 14 3 - 2 - 1. 54 0.74
Averaqe 84 11 2 - 2 1 1. 53
10

TABLE IV.-ROUND ROBIN FIBER COUNTING OF TWELVE NSWC
CHAMBER BURN & EXPLODE TEST STICKY SAMPLERS REPORTED
AT LANGLEY RESEARCH CENTER MAY 10, 1979
Total single flbers on 15 x 23 cm sticky Test & sampler number sampler as determined by participants*
DPG
BT-230 Heavy deposltlon
19968 120885
19970 130959
19980 83320
20013 06254
Average 107854
BT-237 Medlum deposltlon
20803 74202
20805 48464
20810 44667
20812 38610
Average 51486
BT-171 Llght deposltlon
13863 907
13875 510
13882 I 477 I
13884 ___ r_ 317
\ Average 553
~Partlclpatlng 12~orato~'cs:
DPG us Army ne1Cf .~y ",:,,1.:'0" 1"'1 Ground LRC Nl\Sl\. l.an<]lC'·,' Rcc;r>'l1'·r-}, ('''''lter SSI S';l~n':lflc SerV 1 ""0, Tn';.
LRC SSI
45800 -40600 -32000 -29800 -37000
27600 40000
19900 29100
19900 23850
16800 29800
21000 30688
730 1088
860 0
700 816
900 1474
800 844
T~W De:ense and SpCll.:0 [)vr;"':r::I's Group of TRW, Inc.
TRW
48869
52016
33794
31475
41538
18341
15108
13358
17102
15977
622
674
499
407
550
11
I
TABLE IV.-ROUND ROBIN FIBER COUNTING OF TWELVE NSWC
CHAMBER BURN & EXPLODE TEST STICKY SAMPLERS REPORTED
AT LANGLEY RESEARCH CENTER MAY 10, 1979
Total single flbers on 15 x 23 cm sticky Test & sampler number sampler as determined by participants*
DPG
BT-230 Heavy deposltlon
19968 120885
19970 130959
19980 83320
20013 06254
Average 107854
BT-237 Medlum deposltlon
20803 74202
20805 48464
20810 44667
20812 38610
Average 51486
BT-171 Llght deposltlon
13863 907
13875 510
13882 I 477 I
13884
--~~ 317
\ Average 553
~Partlclpatlng 12~orato~'cs:
DPG us Army ne1Cf .~y ",:,,1.:'0" 1"'1 Ground LRC Nl\Sl\. l.an<]lC'·,' Rcc;r>'l1'·r-}, ('''''lter SSI S';l~n':lflc SerV 1 ""0, Tn';.
LRC SSI
45800 -40600 -32000 -29800 -37000
27600 40000
19900 29100
19900 23850
16800 29800
21000 30688
730 1088
860 0
700 816
900 1474
800 844
T~W De:ense and SpCll.:0 [)vr;"':r::I's Group of TRW, Inc.
TRW
48869
52016
33794
31475
41538
18341
15108
13358
17102
15977
622
674
499
407
550
11
I

f [,
12
from n size
12

15 by 23 cm sticky sampler
Primary areas counted:
Light deposition
Medium an,d heavy deposition
35 mm
Figure' 2. - RepresentativE~areas of sticky sampler that were counted for fiber deposition determination and for deposition \.miformity comparisons on selected samplers .
13
15 by 23 cm sticky sampler
Primary areas counted:
Light deposition
Medium an,d heavy deposition
35 mm
Figure' 2. - RepresentativE~areas of sticky sampler that were counted for fiber deposition determination and for deposition \.miformity comparisons on selected samplers .
13

Percent of total fibers within length
interval
100
100
100
50
Heavy deposition
Medium deposition
Light deposition
Fiber length, mm
Figure 3. - Distribution 8£ single carbon fibers by length for fiber lengths greater than 1 mm. Results from fiber deposits on sticky samplers selected for round robin counting.
14

15xlO
Projected total fibers
on 15 x 23 cm
sampler
1
5
4 -
o
10
5
rAVerage
L__ Heavy deposit
Medium deposit
Light deposit
DPG LRC TRW SSI
Figure 4. - Round robin fiber counting results from four laboratories counting from four samplers of each of
three NSWC tests.
15
15xlO
Projected total fibers
on 15 x 23 cm
sampler
1
5
4 -
o
10
5
rAVerage
L__ Heavy deposit
Medium deposit
Light deposit
DPG LRC TRW SSI
Figure 4. - Round robin fiber counting results from four laboratories counting from four samplers of each of
three NSWC tests.
15

End of Document End of Document