carbon life cycle analysis of co eor for net carbon ... library/events/2017/carbon-storage... ·...
TRANSCRIPT
U.S. Department of EnergyNational Energy Technology Laboratory
Mastering the Subsurface Through Technology Innovation, Partnerships and Collaboration:Carbon Storage and Oil and Natural Gas Technologies Review Meeting
August 1-3, 2017
Carbon Life Cycle Analysis of CO2-EOR for Net Carbon Negative Oil
(NCNO) ClassificationDE-FE0024433
Vanessa Nuñez-LopezBureau of Economic Geology
The University of Texas

2
Presentation Outline
• Project Overview: Goals and Objectives• Technical Status• Accomplishments to Date• Lessons Learned• Synergy Opportunities• Project Summary

Problem Statement
Carbon captured
Carbon utilized (CO2-EOR)
Carbon stored
Oil produced, refined, burned.
Carbon emitted
• Is CO2-EOR a valid option for greenhouse gas emission reduction? Are geologically stored carbon volumes larger that direct/indirect emissions resulting from CO2-EOR operations?

4
Project Overview: Goals and Objectives
• Identify and frame critical carbon balance components for the accurate mass accounting of a CO2-EOR operation.
• Develop strategies that are conducive to achieving a NCNO classification.
• Develop a comprehensive, yet commercially applicable, monitoring, verification, and accounting (MVA) methodology.
Goal: To develop a clear, universal, repeatable methodology for making the determination of whether a CO2-EOR operation can be classified as Net carbon Negative Oil (NCNO)
Objectives:

Selection of system boundaries for NCNO classification: Cradle-to-Grave
Selected system boundary
Study focus

Technical Status: Carbon Mass Accounting Methodology at the EOR Site
6𝑀𝑀𝑠𝑠𝑠𝑠𝑠𝑠𝑠𝑠𝑠𝑠𝑠𝑠 = 𝑀𝑀𝑠𝑠𝑠𝑠𝑠𝑠𝑡𝑡𝑡𝑡 𝑖𝑖𝑖𝑖𝑖𝑖𝑠𝑠𝑖𝑖𝑠𝑠𝑠𝑠𝑠𝑠 − 𝑀𝑀𝑠𝑠𝑠𝑠𝑖𝑖𝑟𝑟𝑖𝑖𝑡𝑡𝑠𝑠 − 𝑀𝑀𝑡𝑡𝑠𝑠𝑠𝑠𝑠𝑠 𝑠𝑠𝑠𝑠𝑠𝑠𝑠𝑠𝑠𝑠𝑠𝑠𝑠𝑠𝑡𝑡𝑖𝑖𝑠𝑠 − 𝑀𝑀𝑡𝑡𝑠𝑠𝑠𝑠𝑠𝑠 𝑠𝑠𝑠𝑠𝑠𝑠𝑠𝑠𝑡𝑡𝑖𝑖𝑠𝑠
𝑀𝑀𝑠𝑠𝑠𝑠𝑠𝑠𝑠𝑠𝑠𝑠𝑠𝑠 = 𝑀𝑀𝑝𝑝𝑠𝑠𝑠𝑠𝑖𝑖𝑝𝑡𝑡𝑠𝑠𝑠𝑠𝑠𝑠 − 𝑀𝑀𝑡𝑡𝑠𝑠𝑠𝑠𝑠𝑠 𝑠𝑠𝑠𝑠𝑠𝑠𝑠𝑠𝑠𝑠𝑠𝑠𝑠𝑠𝑡𝑡𝑖𝑖𝑠𝑠 − 𝑀𝑀𝑡𝑡𝑠𝑠𝑠𝑠𝑠𝑠 𝑠𝑠𝑠𝑠𝑠𝑠𝑠𝑠𝑡𝑡𝑖𝑖𝑠𝑠

Technical Status: Cranfield Static Model
7
Inactive region
Active blocks
Core samples for relative permeability experiments
Cranfield overview:• Clastic Mississippi field
• Apex of 4-way closed anticline
• Main pay is ~10,000 ft deep
• Pi = 4,600 psi, Ti = 150°F
• Original gas cap
• Productive during 1940s and 50s
• CO2 injection started in 2007• Available mass accounting data as required by
SECARB’s monitoring program.

8
Technical Status: Numerical SimulationCompositional model simulates CO2 injection
• Compositional simulation• Total number of block = 82,500• 25 yrs injection +75 yrs of post injection
• CMG-GEM compositional package
• Solubility modeled with Henry’s law
• Oil and gas PVT tuned • History matching of
historic production data (1944-1964)
• Oil, water, gas production data is available
• Shut-in period (1964-2008)
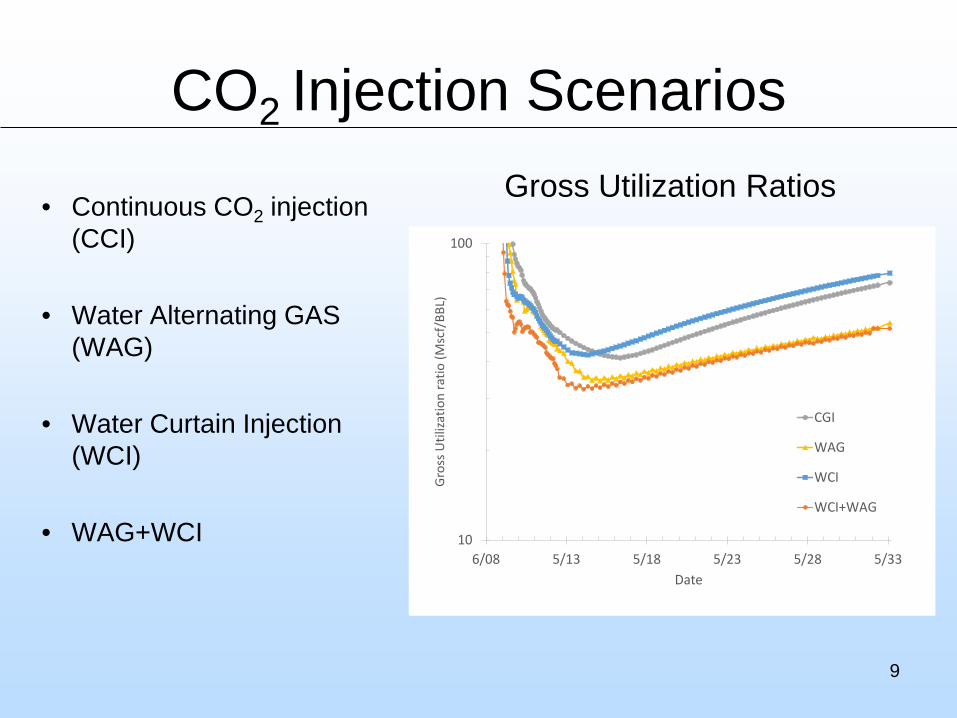
CO2 Injection Scenarios
9
• Continuous CO2 injection (CCI)
• Water Alternating GAS (WAG)
• Water Curtain Injection (WCI)
• WAG+WCI
Gross Utilization Ratios
10
100
6/08 5/13 5/18 5/23 5/28 5/33
Gro
ss U
tiliza
tion
ratio
(Msc
f/BB
L)
Date
CGI
WAG
WCI
WCI+WAG

CO2 Injection Scenarios
10
• Continuous CO2 injection (CCI)
• Water Alternating GAS (WAG)
• Water Curtain Injection (WCI)
• WAG+WCI 1
10
100
6/08 5/13 5/18 5/23 5/28 5/33
Net
Util
izatio
n ra
tio (M
scf/
BBL)
Date
CGI
WAG
WCI
WCI+WAG
Net Utilization Ratios

CO2 Injection Scenarios
11
Net CO2 Stored
0
0.5
1
1.5
2
2.5
0 1 2 3 4 5 6 7 8
Net
CO
2St
ored
(Mill
ion
tonn
es)
HCPV injected
CGI
WAG
WCI
WCI+WAG
0
1
2
3
4
5
6
7
8
0 1 2 3 4 5 6 7 8
% O
OIP
HCPV injected
CGI
WAG
WCI
WCI+WAG
Oil Recovery Factor

12
Trapping Mechanisms: WAG- CGI evolution
0
20
40
60
80
100
0 25 50 75
% T
rapp
ing
cont
ribut
ion
for W
AG
Time (years)
Structural Solubility Residual
0
20
40
60
80
100
0 25 50 75
% T
rapp
ing
cont
ribut
ion
for C
GI
Time (years)
Structural Solubility Residual
CGI WAG

13
Carbon Balance Evolution: Gate to Gate
Accomplishments to Date
14
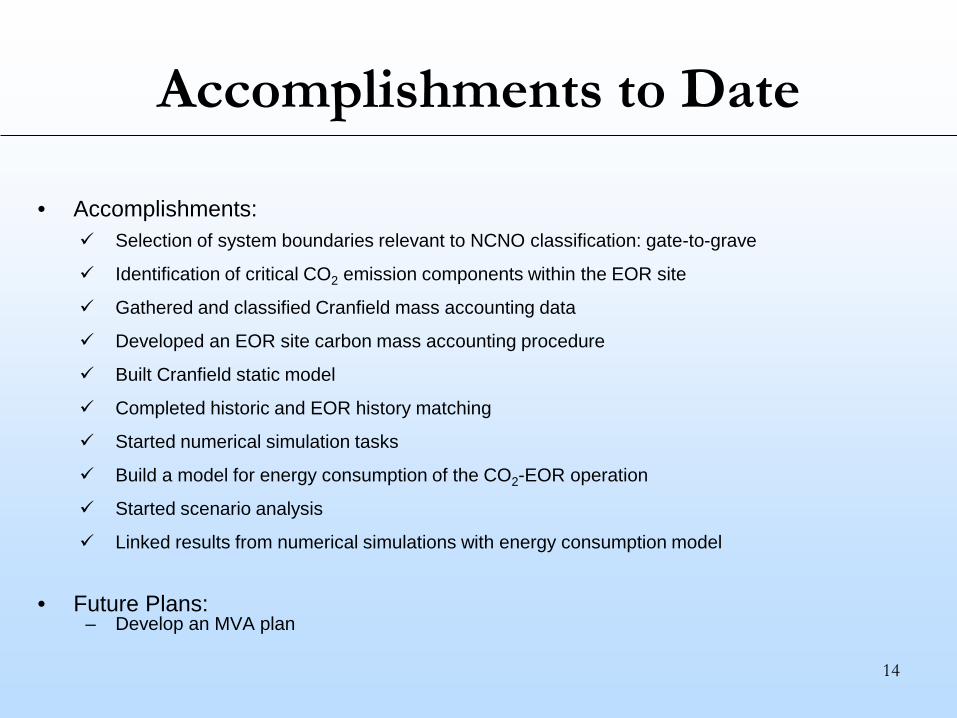
• Accomplishments: Selection of system boundaries relevant to NCNO classification: gate-to-grave
Identification of critical CO2 emission components within the EOR site
Gathered and classified Cranfield mass accounting data
Developed an EOR site carbon mass accounting procedure
Built Cranfield static model
Completed historic and EOR history matching
Started numerical simulation tasks
Build a model for energy consumption of the CO2-EOR operation
Started scenario analysis
Linked results from numerical simulations with energy consumption model
• Future Plans: – Develop an MVA plan

Lessons Learned
15
• CO2 storage is greatest in absolute volume terms for the CGI scenario, with 1.5 million tons (Mt) CO2 stored. In decreasing order, this is followed by 1.3 Mt CO2 stored for WAG, and 0.6 Mt for both WCI and WAG+WCI scenarios. CGI injects a larger gross volume of CO2, so a larger volume is left behind.
• CO2 net utilization ratio, defined as the amount of CO2 injected to produce 1 unit of oil, is lowest for hybrid WAG+WCI scenario, followed by WCI, WAG and CGI in increasing order.
• Oil production is greatest in absolute volume for the CGI scenario, with 4 million barrels (MMbbl) of incremental oil produced, versus 3 MMbbl for WAG, 2.5 MMbbl for WCI and 2 MMbbl for the hybrid WAG+WCI scenario.
• Our numerical simulations, based on Cranfield CO2-EOR project data, demonstrate that flood efficiency variations are significant and mostly depend on the operator‘s selected field development strategy. These variations greatly affect the carbon balance of a project.

Synergy Opportunities
– Our NCNO methodology can be applied to the development of any hydrocarbon resource (conventional or unconventional) for Carbon Balance assessments.
16

Appendix– These slides will not be discussed during the presentation, but
are mandatory.
17

18
Benefit to the Program Program goals being addressed.
(4) Develop Best Practice Manuals for monitoring, verification, accounting (MVA), and assessment; site screening, selection, and initial characterization; public outreach; well management activities; and risk analysis and simulation.In support of:(1) Develop and validate technologies to ensure 99 percent storage permanence.
Project benefits statement.The project will conduct research under Quantifying the Carbon Balance of CO2-EOR Operations and Identifying “Net Carbon Negative Oil”, via development of a reliable, clear, repeatable and universal CO2-EOR mass accounting methodology. The overall impact of this study will be the economic influence that a project classified as Net Carbon Negative Oil (NCNO*) would have on a CO2-EOR operation, if future laws and regulations provide value to the emissions and/or storage of CO2.
*NCNO is defined in the FOA as oil whose carbon emission to the atmosphere, when burned or otherwise used, is less than the amount of carbon permanently stored in the reservoir in order to produce the oil

19
Organization Chart
Lead OrganizationUT-BEG
Michael Young, Associate Director
BEGAdmisistration
Principal InvestigatorVanessa Nuñez-Lopez
Research Scientist Associate
Seyyed Hosseini (Dynamic Modeling)Research Associate
Reza GanjdaneshPostdoctorate Scholar
Tip Meckel (Static Modeling, Mass Accounting)
Research Scientist
Susan Hovorka (Mass Accounting, MVA)Sr. Research Scientist
BEG ResearcherTBD
Senior Oversight Larry Lake, UT-PGE Faculty
Susan Hovorka, UT-BEG

20
Gantt Chart