carbon market sensitive green supply chain network design
TRANSCRIPT

Carbon Market Sensitive Green Supply Chain Network Design
Amin Chaabane, jr. eng., Ph.D. Student
Supervised by
Prof. Amar Ramudhin and Prof. Marc Paquet
Department of Automated Manufacturing Engineering École de Technologie Supérieure
Montreal, Quebec, Canada
Accepted in IEEE International Conference on Industrial Engineering and Engineering Management (IEEM), 2008 (Singapour, Dec. 8-11, 2008).

© 2008 A. Chaabane, A. Ramudhin, M. Paquet 2
� Introduction� Context
� Motivation and objective
� Kyoto protocol
� Carbon Market
� Literature� Limitations
� Model formulation
� Experimentation � Managerial insights
� Conclusion
Outline

© 2008 A. Chaabane, A. Ramudhin, M. Paquet 3
Introduction – Context
� Supply chain strategies of last decade :� Warehouse consolidation
� Lean and agile supply chains
� Just in time
� Offshore manufacturing
� Low cost country sourcing
� How green are these strategies ?
� How relevant are they if the carbon trading market became a reality (a price tag for carbon emissions)?

© 2008 A. Chaabane, A. Ramudhin, M. Paquet 4
Introduction – Context
Climate Change : who is the responsible !!!
© 2008 A. Chaabane, A. Ramudhin, M. Paquet 5
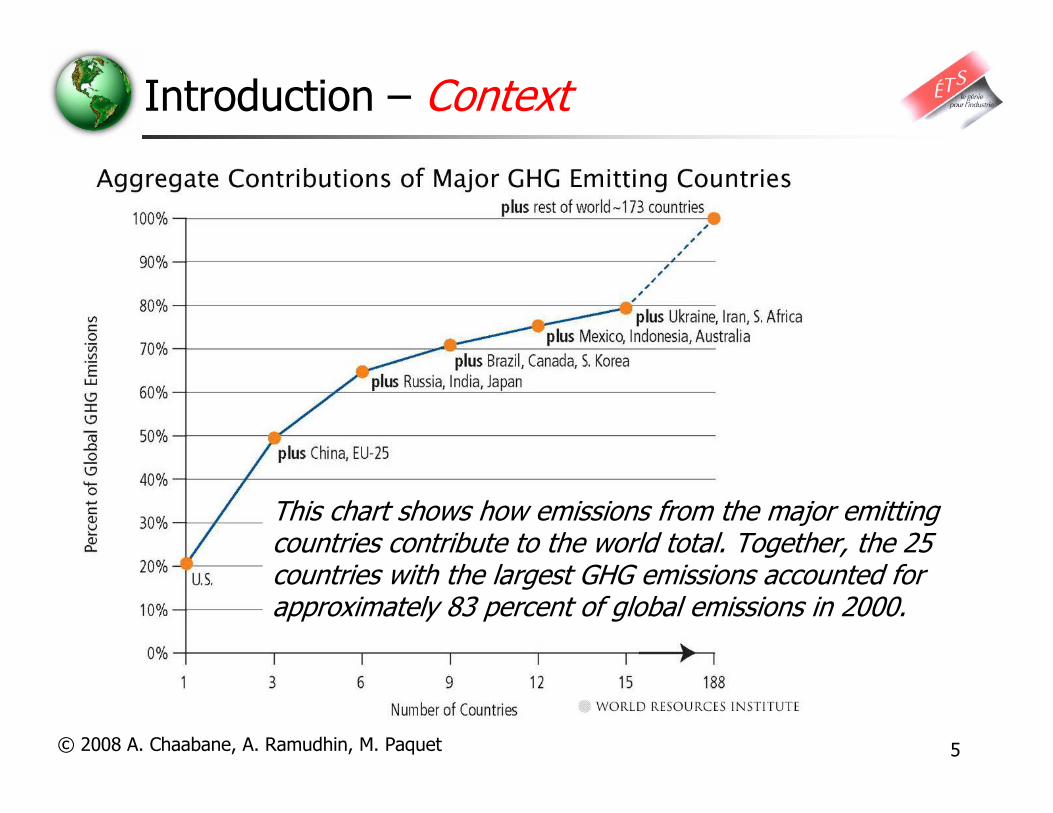
Introduction – Context
This chart shows how emissions from the major emittingcountries contribute to the world total. Together, the 25 countries with the largest GHG emissions accounted for approximately 83 percent of global emissions in 2000.

© 2008 A. Chaabane, A. Ramudhin, M. Paquet 6
The Kyoto Protocol: key features
� Entry into force: February 16, 2005� US and Australia did not ratify
� Differentiated commitments:� Developed countries and countries with economies in transition agree to quantified legally-binding targets (overall objective leads to a 5% reduction from 1990 levels by 2008-2012)
� Six gases,:� carbon dioxide (CO2), � methane (CH4), � nitrous oxide (N2O), � Sulphur hexafluoride (SF6),� Per fluorocarbons (PFC) and � Hydro fluorocarbons (HFC).

© 2008 A. Chaabane, A. Ramudhin, M. Paquet 7
The Kyoto Protocol: key features
� Target should be achieved through:
� Domestic Reductions � Carbon Sinks: direct human-induced land use change and forestry activities
� International Credits (Kyoto Mechanisms):� International Emissions Trading� Project –Based: Joint Implementation (in industrialized countries)
� Project – Based: Clean Development Mechanism (in developing countries)
� Negotiations on next period (post-2012) to start in 2005

© 2008 A. Chaabane, A. Ramudhin, M. Paquet 8
Introduction – Context
� Carbon trading markets: a new reality for Green Supply Chain Management
6$ per ton
25€ per ton
13$ per ton30 may 2008, launched

© 2008 A. Chaabane, A. Ramudhin, M. Paquet 9
Structure of the Carbon Market 2006(worth close to $22 billion in 2006)
Allowance MarketsProject-Based
Transactions
UK ETS
EU Emission
Trading Scheme
Chicago Climate
Exchange
New South Wales
Certificates
Primary JI &
CDM
Voluntary
& RetailOther
Compliance
226 MtCO2e
8 MtCO2e 8 MtCO2e 2 MtCO2e
8 MtCO2e
16 MtCO2e
764 MtCO2e
Credible
C-asset

© 2008 A. Chaabane, A. Ramudhin, M. Paquet 10
� Trends :� ‘Corporate Responsibility’ reporting (green accounts) is on the
rise (from 45% of Global fortune 250 companies in 2002 to 67% in 2005)[1]
� Texas Instruments saved USD 8 million each year by reducing its transit packaging budget for its semiconductor business through source reduction, recycling, and use of reusable packaging systems
[1] Source : KPMG “International Survey of Corporate Responsibility reporting in 2005”
� Regulations :� The government of Canada (ecoAction, 2007) plans to regulate
both GHG emissions and air pollutants� “impose mandatory targets on industry to achieve a goal of an absolute reduction of
150 mega tons in GHG emissions by 2020”
� The U.S. Environmental Protection Agency’s (EPA, 2006)announced that by 2012, 160 Million Metric Tons of Carbon Equivalent (MMTCE) of emission will be reduced
� “99 MMTCE will be reduced in the industry sector and 15 MMTCE will be reduced in the transportation sector”
Introduction – Context

© 2008 A. Chaabane, A. Ramudhin, M. Paquet 11
� Develop a decision support system (DSS) for strategic and environmental supply chain network design analysis :
� Calculate a supply chain’s existing carbon footprint (calculation of GHG emissions) based on the current supply chain network structure
� Determine the most cost effective supply chain network design based on user-defined GHG reduction targets
� Incorporate carbon offsets into cost and footprint calculations to optimize where carbon credits should be purchased and applied: Environmental Cost
Introduction – Objective

© 2008 A. Chaabane, A. Ramudhin, M. Paquet 12
Literature – Problem context
� Green supply chain management (GSCM) and problems context :
� Green design� Environmentally conscious design (ECD)
� Life-cycle assessment/analysis (LCA)
� Green operations� Supplier selection
� Green manufacturing and remanufacturing
� Reverse logistics and network design
� Waste management
� Minimize the use of energy
Srivastava, S.K. (2007) Green supply-chain management: A state-of-the-art literature review, International Journal of Management Reviews, 9, 1, 53-80.

© 2008 A. Chaabane, A. Ramudhin, M. Paquet 13
Literature – Methodology
� Green supply chain management (GSCM) based methodology / approach :
� Empirical studies� Case studies
� Interviews and surveys
� Though papers
� Simulation and game theory
� Mathematical modelling� Non Linear Programming (LP)
� Multi-criteria decision making
� LP and Mixed Integer LPSrivastava, S.K. (2007) Green supply-chain management: A state-of-the-art literature review, International Journal of Management Reviews, 9, 1, 53-80.

© 2008 A. Chaabane, A. Ramudhin, M. Paquet 14
Literature – Limitations
� GSCM studied supply chain problems much more form operational point of view
� For the green supply chain network design� The problem is not studied enough
� Research stress on reverse logistics activities � Unable to quantify clearly the real impact of such improvement relative to
GHG emission reduction and the supply chain configuration
� Lack of standardized, comprehensive and up-to-date data� Industry is struggling to find the right trade-off between
� Green supply chains
� Lean supply chains
� Agile supply chains

© 2008 A. Chaabane, A. Ramudhin, M. Paquet 15
A GSCM framework
Environmental conscious
supply chain network design
Adapted from the SCOR Modelhttp://www.supply-chain.org/cs/root/scor_tools_resources/scor_model/scor_model

© 2008 A. Chaabane, A. Ramudhin, M. Paquet 16
Methodology: Mathematical programming
© 2008 A. Chaabane, A. Ramudhin, M. Paquet 17
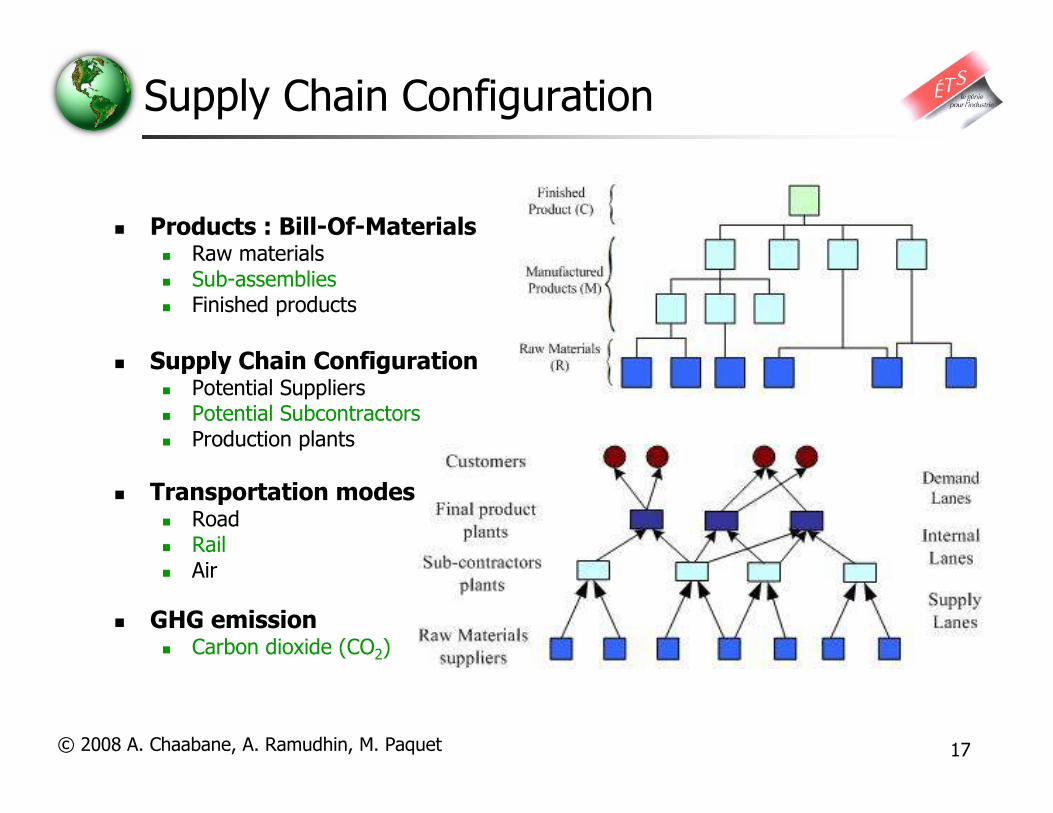
Supply Chain Configuration
� Products : Bill-Of-Materials� Raw materials � Sub-assemblies � Finished products
� Supply Chain Configuration� Potential Suppliers � Potential Subcontractors� Production plants
� Transportation modes � Road � Rail � Air
� GHG emission� Carbon dioxide (CO2)

© 2008 A. Chaabane, A. Ramudhin, M. Paquet 18
Model formulation
� Minimize the total supply chain cost� Majors decisions are:
� Select
� Suppliers, sub-contractors and production centers
� Transportation modes to use between nodes
� Assign
� Raw materials to suppliers
� Sub-assemblies to sub-contractors
� Determine
� Products flow between nodes
� GHG emissions (carbon dioxide equivalent)
� Subject to � Technological constraints

© 2008 A. Chaabane, A. Ramudhin, M. Paquet 19
Formulation – Objective Function
� The total cost includes fixed and variable costs
� Fixed costs are:
� Fixed costs for facilities (a)
� Assignment of raw materials to suppliers and manufactured products to subcontractors (b)
� Variable costs are of five types:
� Supply of raw materials and manufacturing products (c)
� Shipment costs (related to the number of shipments) (d)
� Transportation costs (e)
� GHG emissions credits (f)
1
( ) ( ) ( )
( ( ))
( ) ( )
Min
+
p p p p
p p
i i ip ip ip ip
i V S p M R i S V p M R i S V
a b c
k k k k
i ij ijp ijp
i S V j S D k K p M R i S V j S Suc P D k K
d e
A a Y c X
l U t F
λ∈ ∪ ∈ ∪ ∈ ∪ ∈ ∪ ∈ ∪
∈ ∪ ∈ ∪ ∈ ∈ ∪ ∈ ∪ ∈ ∪ ∈
= + +
+
∑ ∑ ∑ ∑ ∑
∑ ∑ ∑ ∑ ∑ ∑ ∑
F
������������ ���������
��������� ������� �
�( ( ))
( )
( , )Emission
p p p
k k
p ijp p p ip
p M R i S V j S Suc P D k K p M i SCap
f
d i j F X Lδ α π β π∈ ∪ ∈ ∪ ∈ ∪ ∈ ∈ ∈
+ + − ∑ ∑ ∑ ∑ ∑∑
�����
�����������������������������
(1)

© 2008 A. Chaabane, A. Ramudhin, M. Paquet 20
Formulation – Constraints
� Number of operational sites
� Node capacity
� Capacity constraints � Maximum time capacity use for subcontractors
� Minimum time capacity use for subcontractors
� Maximum capacity for suppliers
� Conservation of flow
)p p
ip p
i S V
Y m p R M∈ ∪
≤ (∀ ∈ ∪∑
0 ( , )ip ip ip p p
X b Y p R M i S V− ≤ ∀ ∈ ∪ ∀ ∈ ∪
0,i
ip ip i i
p M
X te T A i S∈
− ≤ ∀ ∈∑
0,i
ip ip i i i
p M
X te T A i Sρ∈
− ≥ ∀ ∈∑
0 ( )i i
ip i ip i
p R p R
X b A i Vρ∈ ∈
− ≥ ∀ ∈
∑ ∑
(2)
(3)
(4)
(5)
(6)
( ( ))
0 ( , )ijp
k
ip p p
j S Suc p D k K
X F p P i V S∈ ∪ ∈
− ≥ ∀ ∈ ∀ ∈ ∪∑ ∑ (7)

© 2008 A. Chaabane, A. Ramudhin, M. Paquet 21
Formulation – Constraints
� BOM constraints
� Demand constraints
� Transportation capacity constraints� Maximum number of transportation modes that can be used
� Volume capacity
� Weight capacity
0 ( , , )i i
k k k
p ijp ij
p R M
F U i V S j S D k Kδ κ∈ ∪
− ≤ ∀ ∈ ∪ ∀ ∈ ∪ ∀ ∈∑
0 ( , , )i i
k k k
p ijp ij
p R M
F U i V S j S D k Kπ ψ∈ ∪
− ≤ ∀ ∈ ∪ ∀ ∈ ∪ ∀ ∈∑
( , )k
ij ij
k K
Z i V S j S Dτ∈
≤ ∀ ∈ ∪ ∀ ∈ ∪∑
( , )idp
p
k
pd
i S k K
F d p C d D∈ ∈
= ∀ ∈ ∀ ∈∑∑ (10)
(11)
(12)
(13)
' '
' ( )
0 ( , ( ( )))jip
p p
k
pp ip
j V S k K p Suc p
F g X p M R i S Suc p∈ ∪ ∈ ∈
− = ∀ ∈ ∪ ∀ ∈∑ ∑ ∑ (8)

© 2008 A. Chaabane, A. Ramudhin, M. Paquet 22
� Logical constraints
� The number of shipments between two nodes is not nil only if thetransportation mode is actually used
� A transportation mode is used between two nodes only if the number of shipments is not nil:
� The number of shipment between two nodes using a transportation mode is nil if there is no flow of products
� A site is operational if it is open for one product at least:
0 ( , , )k k
ij ijU MZ i V S j S D k K− ≤ ∀ ∈ ∪ ∀ ∈ ∪ ∀ ∈
( , , )k k
ij ijZ U i V S j S D k K≤ ∀ ∈ ∪ ∀ ∈ ∪ ∀ ∈
( , , )i i
k k
ij ijp
p R M
U F i V S j S D k K∈ ∪
≤ ∀ ∈ ∪ ∀ ∈ ∪ ∀ ∈∑
0 ( , )ip i i iY A i S V p M R− ≤ ∀ ∈ ∪ ∀ ∈ ∪
(14)
(15)
(16)
(9)
Formulation – Constraints

© 2008 A. Chaabane, A. Ramudhin, M. Paquet 23
� Integer, binary, and non-negativity constraints� Transport variables and the quantities supplied are non negative
� Binary variables:
� The number of shipments must be integer:
0 ( , , ( ( )) , )ijp
k
p pF p R M i V S j S suc p D k K≥ ∀ ∈ ∪ ∀ ∈ ∪ ∀ ∈ ∪ ∀ ∈
0 ( ( , ) )ip p pX p i R V M S≥ ∀ ∈ × ∪ ×
{ }0,1 , ( , )ip p pY p i R V M S∈ ∀ ∈ × ∪ ×
{ }0,1 ,iA i S V∈ ∀ ∈ ∪
{ }0,1 ( , , )ij
kZ i V S j S D k K∈ ∀ ∈ ∪ ∀ ∈ ∪ ∀ ∈
integer ( , , ( ( )) , )ij
k
p pU p P i V S j S Suc p D k K ∀ ∈ ∀ ∈ ∪ ∀ ∈ ∪ ∀ ∈
(17)
(18)
(20)
(19)
(21)
(22)
Formulation – Constraints

© 2008 A. Chaabane, A. Ramudhin, M. Paquet 24
Parameters – Data input
� How to find Emission Factors ?
� Example: IPCC Emission Factor Database (EFDB)
Supply Chain Activity Data Required
Transportation � Carbon Emission factor (kg CO2 per gallon) or CO2 per Freight (kg CO2 per ton-mile)
Production � Carbon Conversion Factor per kg of Product produced (kg CO2per kg)
Plant � By plant location, the user enters the Energy Consumption per Space (e.g. kWh per sq. ft.), the Energy Consumption per Capacity (e.g. kWh per production hr) and a Carbon Conversion Factor (kg CO2 per kWh).
Warehouses � By warehouse location, the user enters the Energy Consumption (e.g. kWh per sq ft.), the Carbon Conversion Factor (kg CO2 per kWh) and the Area to Apply (entire size of warehouse, or average inventory volume)
http://www.ipcc-nggip.iges.or.jp/EFDB/main.php

© 2008 A. Chaabane, A. Ramudhin, M. Paquet 25
Environmental data
Summary of the model (DSS)
Actual information system
SAP Excel CRM CATIAMY SAP
SCM
Environmental Conscious and
Carbon Market Sensitive Supply
Chain Network Design
GHG Emissions and cost analysisThe total cost–CO2 emission curve
600 000,0 $
700 000,0 $
800 000,0 $
900 000,0 $
1 000 000,0 $
19 200
19 400
19 600
19 800
20 000
20 200
20 400
20 600
20 800
21 000
21 200
CO2 Emission limit (UB emission)
Total Logistic Cost ($)
68 600 $
190 000 $
31 600 $
132 000 $
45 062 $
300 952 $
54 000 $
9 750 $
225 500 $
67 000 $
189 000 $
36 915 $
357 571 $
18 040 $
190 000 $
132 000 $
308 483 $
38 588 $
54 000 $
9 750 $
31 600 $
Fixed cos
t
Startup fo
r Raw M
aterials
Startup fo
r Manufactur
ed Produ
cts
Variable
Cost Raw
Materials
Variable
Cost for M
anufactu
red Produ
cts
Transpor
tation Co
st
Emission Co
st
Cost minimization
CO2 emission minimization
Goal Programming
Fixed cost
17%
Startup for
Manufactured
Products
7%
Startup for Raw
Materials
1%
Variable Cost
Raw Materials
4%Variable Cost for
Manufactured
Products
25%
Transportation
Cost
40%
Emission Cost
6%
Optimization Model

© 2008 A. Chaabane, A. Ramudhin, M. Paquet 26
Experimentation – Example
� Environmental supply chain network design example
Number of variables
Binaryvariables
Integervariables
Continuous variables
Number of constraints
Inequalityconstraints
Equality constraints
MILP
statistics207 64 42 101 232 210 22
MILP model characteristics
Transportation
modeType
Payload
(tons)
CO2
(grams/ton-mile)
Road Class 8b 12.5 187
rail Intermodal rail 2,093 40
airBoeing
747-40070 1,385
Freight transportation emission factors
(grams/ton-mile)

© 2008 A. Chaabane, A. Ramudhin, M. Paquet 27
Experimentation – Results
� The MILP problem is solved by CPLEX Interactive Optimizer
GHG emission limit (UPEmission) (in tons)
Total Cost ($)
Base scenario 21 012 763 364 $
Scenario 2 20 687 764 421 $
Scenario 3 20 361 764 421 $
Scenario 4 20 035 764 421 $
Scenario 5 19 710 768 802 $
Scenario 6 19 709 768 802 $
Scenario 7 19 500 796 032 $
Scenario 8 19 383 962 626 $
© 2008 A. Chaabane, A. Ramudhin, M. Paquet 28
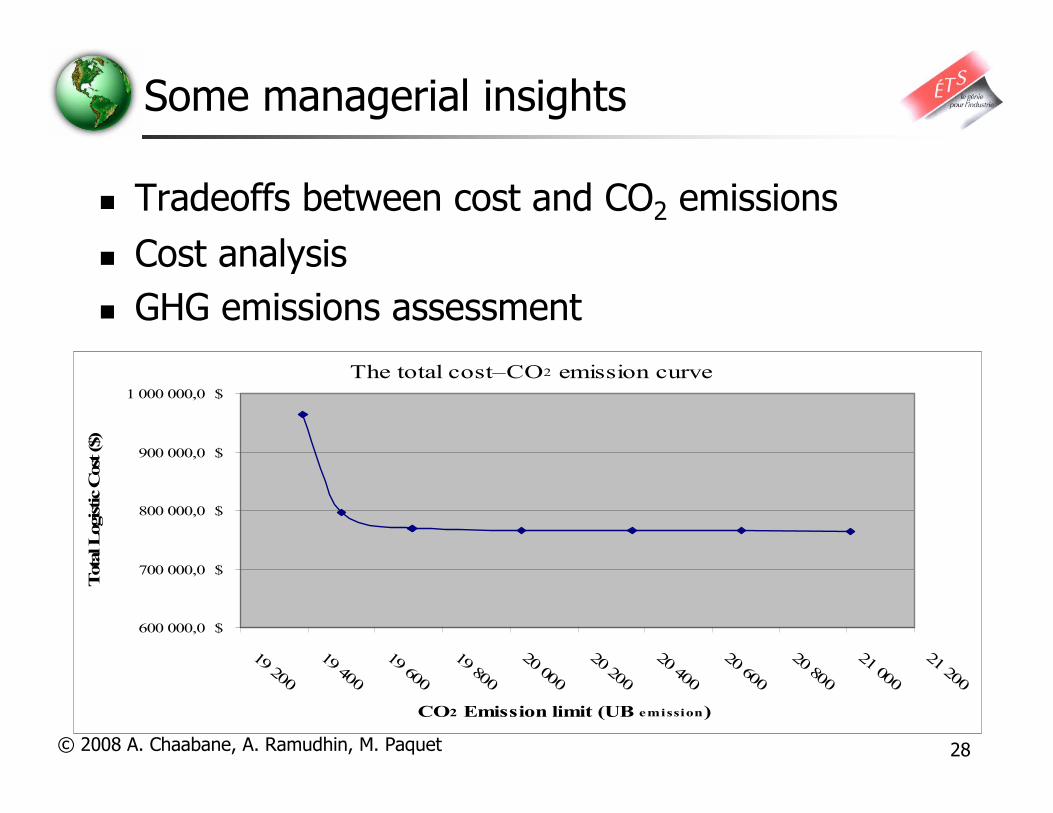
Some managerial insights
� Tradeoffs between cost and CO2 emissions
� Cost analysis
� GHG emissions assessment
The total cost–CO2 emission curve
600 000,0 $
700 000,0 $
800 000,0 $
900 000,0 $
1 000 000,0 $
19 200
19 400
19 600
19 800
20 000
20 200
20 400
20 600
20 800
21 000
21 200
CO2 Emission limit (UB emission)
Total Logistic Cost ($)

© 2008 A. Chaabane, A. Ramudhin, M. Paquet 29
68 600 $
225 500 $
9 750 $
54 000 $
300 952 $
45 062 $
132 000 $
31 600 $
190 000 $
18 040 $
357 571 $
36 915 $
189 000 $
67 000 $
Fixed cost
Startup fo
r Raw Materia
ls
Startup fo
r Manufacture
d Products
Variable C
ost Raw M
aterials
Variable C
ost for Manufa
ctured Pro
ducts
Transport
ation Cost
Emission
Cost
Base scenario- Cost minimization
Scenario 8 - CO2 emission minimization
Some managerial insights
Cost minimization versus CO2 emissions minimization

© 2008 A. Chaabane, A. Ramudhin, M. Paquet 30
Thank you
Questions ?
References1. A. Ramudhin, A. Chaabane, M. Kharoune, and M. Paquet. “Carbon Market Sensitive
Green Supply Chain Network Design”. In Proceeding of the IEEE International conference on Industrial Engineering and Engineering Management (IEEM), Singapore, December 8-11, 2008.
2. A. Chaabane, A. Ramudhin, M. Kharoune, and M. Paquet. “Trade-offs Model for Carbon Market Sensitive Green Supply Chain Network Design”. In Proceeding of the Sixth Annual International Symposium On supply Chain Management, Calgary, Alberta, Canada, October 15th – 17th 2008.
3. A. Chaabane, M.A. Benkaddour, A. Ramudhin, and M. Paquet, “ An integrated logistics model for environmental conscious supply chain network design”, In Proceeding of the Fourteenth Americas Conference on Information Systems, Toronto, Ontario, Canada, August 14th -17th 2008.
For more information:E-mail: [email protected]
View
publication statsV
iew publication stats