carbon markets and biogas strategy in indonesia
TRANSCRIPT

Carbon Markets and Biogas Strategy in Indonesia
R. Sean Fitzpatrick
Advisors: Marc Deshusses, Tatjana Vujic
Masters Project
Duke Nicholas School of the Environment
April 2020

2
Executive Summary
In Indonesia, the world’s 4th most populated country, over 40% of the population continue to
lack access to reliable energy sources. These ca. 28 million households then rely on the
harvest and combustion of firewood to meet their daily cooking needs, contributing to
deforestation, eutrophication, and respiratory diseases from breathing smoke in poorly
ventilated households, one of the nation’s leading causes of premature death. One promising
energy alternative to address these issues is biogas. Produced by the anaerobic digestion of
organic matter (kitchen/farm waste, livestock dung) in a digestion chamber, biogas is a clean
and renewable energy that can be produced at no cost by the households. Several programs
have been initiated to disseminate this technology in Indonesia, however they have
continuously failed to meet their distribution and compliance goals. Two national biogas
programs initiated by the clients Su-re.co (Bali) and Hivos (Jakarta) using different digester
models were investigated to determine the flaws and successes of each through water boiling
tests, household air quality measurements, financial analyses, and conversations with end
users. Recommendations were made to increase success through design changes, monitoring
enhancements, and tailored sizing/model selection and financing strategies. A final
recommendation for the most scalable and sustainable programs and digester designs was
delivered to the Indonesia Domestic Biogas Program (IDBP) to allow a fully market-based
solution to scale Indonesia’s biogas strategy.
The following key recommendations were delivered to the clients and IDBP:
1. Applications from potential biogas users should include the number of livestock and
number of hours spent cooking per day so that the gas production model can be used
to select the appropriate size digester for the family.
2. Digester recipients should complete the baseline survey designed for biogas here, and
the user surveys should be completed on follow up visits within one year of
installation. These data should be stored in a shared database
3. Su-re.co should focus on finalizing and installing a 2 m3 PVC bag-style design
instead of the current 1 m3 capacity in order to have the desired impacts on
deforestation, health from indoor air pollution, and ERs from firewood
4. Hivos should bridge the financial gap between cost and subsidy + WTP by focusing
on a 3.5 m3 PE tank digester design

3
5. The two recommended designs should be incorporated into Hivos’ Gold Standard
registration under VPA-3, together representing 90% of the market
6. Traditional monitoring should be modernized through the use of remote flow rate
meters and gas consumption ER models, such as the one presented here

4
Introduction
Approximately 40% of the global population continues to use solid-state fuels (firewood,
charcoal, dung, agricultural residues) for their daily cooking and water boiling needs. In some
developing countries, chopping down trees for firewood can account for up to 54% of
deforestation. Additionally, households using solid fuels typically cook over open fires and
have little to no air ventilation. The combustion of solid fuels releases fine particulate matter
(PM2.5/10) and carbon monoxide (CO) into the household, which are then inhaled by its
inhabitants. Fine particulate matter (hereby PM2.5) is small and light enough to float in the
air and bypass the nose and throat directly to the lungs when inhaled. These fine particles
lodge themselves in the lungs causing health impacts ranging from coughing, wheezing, and
shortness of breath to more serious conditions like heart disease and lung cancer. Carbon
monoxide is an odorless, tasteless gas that can cause headaches, dizziness, vomiting, and
nausea (CDC). More research is needed looking at the long-term health effects of exposure to
low levels of CO, though exposure to moderate and high CO levels has been shown to
increase the risk of heart disease (CDC).
Due to the traditional delegation of household tasks, these exposure risks are typically placed
mostly heavily on women and children who spend the most time inside the household and
cooking. The World Health Organization reported in 2012 that household air pollution
(HAP), also referred to as indoor air pollution (IAP), from cooking and heating causes an
estimated 4.3 million premature deaths per year (WHO, 2012). Of these deaths, the 71% of
the burden is in Southeast Asia and the Western Pacific. Indoor air pollution related deaths
occur from several causes including 27% from pneumonia (half of which are children under
5), 18% from stroke, 27% from ischaemic heart disease, 20% from chronic obstructive
pulmonary disease (COPD), and 8% from lung cancer (WHO, 2017).
In addition to the negative impacts on health and deforestation, the combustion of traditional
solid-state fuels contributes to climate change through the release of CO2, methane, and other
greenhouse gases (GHGs), and also poses a significant economic burden on households in
either the form of time spent by women collecting firewood/other solid fuels or costs incurred
from the purchase of these fuels when they are not readily available. The McKinsey Global
Institute reported that the majority of women’s unpaid work hours in developing countries
are spent on fuel collection and cooking. In terms of climate change impact, the combustion

5
of unsustainably harvested wood fuel alone accounts for roughly 2% of global GHG
emissions (Muthia, 2015).
The combination of all these environmental, health, and socioeconomic risks incurred from
solid-state fuel use has led to the development of numerous ‘clean’ or ‘improved’ cook stove
interventions. These intervention projects, traditionally funded through large grants from
governments or non-governmental organizations (NGOs), distribute improved cook stoves to
households (mostly in rural areas) that would otherwise use open fires with solid fuels for
cooking. These programs have been implemented across the developing world in Latin
America, Africa, and Asia. The type of cook stoves delivered range from biogas, LPG, or
electricity powered stoves to simply ‘improved’ wood burning stoves designed to minimize
the amount of fuel required by maximizing thermal efficiency and funnel smoke through a
chimney.
A recent development in the field of cook stove interventions is the application of carbon
market financing to subsidize the cost of clean cook stove distribution. These markets allow
for emissions reductions created by switching from solid fuel use to be quantified and sold as
carbon credits to other entities seeking to offset a portion of their emissions. Successful
carbon financed cook stove intervention projects have been established in Kenya, Uganda,
Nigeria, China, India, Vietnam, Guatemala, Honduras, and Mexico, among others (Muthia,
2015). Further development in this field has the potential to vastly increase the scale of future
intervention projects. By achieving sufficient economies of scale, net carbon financing over
the technology’s life cycle could exceed the cost of the technology. This would encourage
entrepreneurs to start new projects and investors to finance them in search of a return.
Sustainable and profitable growth would also minimize the risk of projects failing due to
removal of funding or subsidies.
Most ‘clean’ cook stove interventions simply replace traditional open fire cook stoves to
‘improved’ models designed to funnel smoke and particulate matter from the household
through a chimney and minimize the amount of fuel needed by maximizing heat transfer
efficiency. However, these models still rely on the use of the same solid fuel sources
(firewood, charcoal, animal dung, or agricultural waste) as used previously. Thus, while
‘improved’ cook stoves do reduce the amount of fuel burned, they still produce significant

6
amounts of GHG emissions and continue to contribute to deforestation. Furthermore, the use
of solid fuels continues to present the risk of particulate matter formation. Even if most
smoke and particulate matter is released through the chimney, their release will never be
100% efficient. One study found that while one type of improved wood burning stove
(ceramic) did significantly reduce daily average suspended particulate matter concentration in
Kenya, it only reduced concentrations by 48% (Ezzati et al, 2000). The WHO’s air quality
guidelines assume that an average of 25% of total emissions enter the room despite the
presence of a chimney (WHO, 2014). Indeed, the only improved cook stoves that meet the
health guidelines for indoor air pollution set by the WHO are those that use electricity or
liquid fuels (LPG, ethanol, or biogas). Future cook stove interventions should therefore be
improved to eliminate the use of solid fuels.
Biogas as a Cookstove Intervention
A study by the Clean Cooking Alliance (CCA) in which ten risk factors were evaluated
among various fuel types found that the only fuel source with a low impact rating among all
factors was biogas (Clean Cooking Alliance, 2013). It had the lowest total particulate matter
formation (0.077 kg eq) with 2x less than sugarcane ethanol and LPG (~0.15 kg eq), 4x less
than kerosene (0.31 kg eq), and over 60x less than firewood (4.72 kg eq). Biogas fuel also
had the lowest global climate change potential (10.5 kg CO2 eq), with 9.5x less than
sugarcane ethanol (95.7 kg CO2 eq), 18x less than kerosene (181 kg CO2 eq), 30x less than
LPG (~300 kg CO2 eq), and over 500x less than firewood (539 kg CO2 eq). Biogas was also
the only fuel source with zero eutrophication potential and zero fossil fuel depletion. It
depletes more water than firewood, but significantly less water than LPG/kerosene (~30x
less), and sugarcane ethanol (88x less). Biogas also had the lowest terrestrial acidification
potential and photochemical oxidant formation potential among the examined fuel sources. In
the category of black carbon and short-lived climate pollutants, biogas had the third lowest
impact behind LPG from NG (not from crude oil) and ethanol from sugarcane, due to the
methane component of biogas (Clean Cooking Alliance, 2013).
Biogas stoves also offer additional co-benefits to those provided by other intervention
technologies. The conversion of manure management from open field or riverine disposal to
a closed system digester reduces nutrient release decreasing eutrophication potential. Instead,

7
the nutrients available from the waste are bacterially processed and recycled as a rich bio-
slurry. This natural fertilizer can be applied to crops or sold to other community members.
Fertilizer production produces cost savings for households that normally purchase artificial
nutrients, and a potential source of income for households with a surplus. Reduced use of
chemical nutrients will also decrease eutrophication impacts. Bedi et al. found that biogas
installation at households in East Java led to a 45% reduction in household expenditure on
energy, a 6-7 kg reduction in LPG consumption, an 85% reduction in time spent collecting
firewood, and a 67% reduction in total firewood use (Bedi et al, 2017).
The greatest barrier to success in biogas stove intervention projects is initial cost of biogas
digester construction and installation. Costs range from $300-1,000 depending on the type of
digester, which could represent 25 – 50% of the smallholder farm’s annual income ($1,967 in
constant 2009 international dollar) (Schenck, 2018). The majority of this cost is traditionally
financed through loans, which could take over a decade to pay back in the absence of other
subsidies (Bedi et al., 2017).
Despite their high cost, biogas technologies are desirable to households due to values such as
reduced need for firewood and time foraging, faster/smokeless cooking, production of bio-
slurry fertilizer, and improved hygiene/odor from efficient waste management (Bedi et al.,
2017). Reported compliance in biogas interventions is relatively high, ranging from 60%
(BIRU) to 96% (Bedi et al., 2017). In the case of East Java, 47% of households reported they
were “very satisfied” with their biogas digester and 52% reported “rather satisfied” (Bedi et
al., 2017).
Focus should continue to be given to Southeast Asia, specifically Indonesia, due to the high
potential for adaptation. Biogas is seen as a promising renewable energy solution in the
region due to the large numbers of small family farms without access to grid power. In recent
years the social stigma on biogas has faded in Southeast Asia and it has grown to be more
culturally accepted as can be seen by the success of programs in Vietnam, Thailand, and
Malaysia. While Indonesia has a promising start in biogas, it has much to do to catch up to its
neighbors. For example, 250,000 digesters have been installed in Vietnam compared to only
23,000 in Indonesia, despite Indonesia having an over 2.5x larger population. Eutrophication
from agricultural waste and chemical nutrients is a significant problem in Indonesia that can

8
create toxic algal blooms and hypoxic dead zones that can be a serious risk to human and
environmental health. Additionally, Indonesia has existing physical and social infrastructure
from the previously subsidized BIRU program. This creates an opportunity for a successful
business model to restart momentum in the sector and expand the program to a competitive
level.
Biogas Strategy in Indonesia
Indonesiaistheworld’slargestarchipelagoconsistingofmorethan17,000islands
uniquelysituatedwithinthecoraltriangleofSoutheastAsia.Intermsofpopulation,
Indonesiaistheworld’s4thlargestcountrywith264millionpeoplein2017(theUnited
Stateshadapopulationof325.7millioninthesameyear),yetbylandareaIndonesiais
onlythe16thlargest.Indonesiacontainssignificantreservesoffossilfuels(coal,oil,and
gas),andhaslongreliedoncoalastheirprimarysourceofdomesticpowerproduction
aswellasamainsourceofexportincomewith80%ofcoalproductionexported.This
reliancemakesIndonesiatheworld’slargestcoalexporterandtheworld’s5thlargest
coalproducer,despitethefactthatitcontainsonlyafractionofglobalcoalreserves
(2.2%)(Zhangetal,2013).
Fossilfuelbasedenergyproductioniscontrolledbyfewdominantmarketplayersthat
maintainconsiderablepoliticalpowerduetotheimportantrevenuestreamstheyoffer
tothegovernment(upto14%oftotalgovernmentincome)(Silaenetal,2019).
Indonesiacontinuestorelyonfossilfuelsasacombinationofdevelopmentand
populationexpansionrapidlydrivesupdomesticenergydemand.Forexample,as
recentlyas2015thegovernmentofIndonesiaallocatedIDR73.1trillion($5.4billion
USD)forfossilfuelbasedelectricitysubsidiesandIDR23.6trillion($1.7billionUSD)in
subsidiesforliquefiedpetroleumgas(LPG)(Bößneretal,2019).
ThisfossilfueldependencehasledIndonesiatobetheworld’s8thlargestemitterof
greenhousegases(Zhangetal,2013).EnergyaccessacrossIndonesiaisvariablewith
manyruralareasunabletoobtainsubsidizedgasandoilproducts.Assuch,40%ofthe
populationcontinuestorelyonsolidfuels(mainlyfirewoodandcharcoal)fortheir
cooking,heating,andlightingneeds(Zhangetal,2013).In2006,itwasestimatedthat

9
over135,000tonsofsolidfuelswereburnedinIndonesia,representingasignificant
impactondeforestation,greenhousegasemissions,andpublichealth(Nesetal,2009).
TheWorldBankestimatesthattheproportionofIndonesiansrelyingonsolidfuels
couldfallfrom40%to25%by2040ifpolicy-basedsolutions(suchasrebateprograms)
areemployedtopromotecleanandsustainablealternatives(Zhangetal,2013).
In2016,IndonesiaratifiedtheParisAgreementandlisteditsNationallyDetermined
Contribution(NDC)asanemissionsreductiontargetof29%(41%withinternational
help)by2030.Furthermore,Indonesia’sNationalEnergyPlan(NEP)of2017seta
targetfor23%oftotalenergyproductiontobecomprisedofrenewableenergysources
by2025(currentlythereisonlya7%shareofrenewables)(Silaenetal,2019).
However,acombinationofcontinuedinvestmentinfossilfuelindustryand
infrastructure,theeconomicsignificanceoffossilfuelproduction,andthepolitical
powerofthedominantenergycompaniesmakeithighlyunlikelythatIndonesiawill
meetitsNDCorNEPtargetswithoutsignificantintervention.
AnothersignificantindustryinIndonesiaisagriculture,accountingfor14%ofthe
nation’sgrossdomesticproduct(GDP)(FAO,2018).Highannualrainfallallowsfor
steadyriceproduction(theprimarystaplefoodcrop)makingIndonesiatheworld’s
thirdlargestriceproducer.Indonesiaremainsanetimporterofgrains(mainlywheat),
andhasprimaryexportcashcropsofpalmoilandrubber.Agriculturallandconstitutes
approximately32%ofthetotallandarea(increasedfrom25%in2005),andthe
agriculturalsectoristhenation’ssecondlargestemployerwithapproximately33%of
theworkforceemployedinagriculturaljobs(FAO,2018).Somewhatuniqueto
Indonesia,thesectorisdominatedbysmallholderswithapproximately93%ofall
farmersconsistingofsmallfamilyfarms(FAO,2018).Thesesmallholderfarmsproduce
themajorityofbothstaplecrops(rice,corn,cassava)andcashcropssuchascoffee,tea,
spices,palmoil,rubber,andfruitsandvegetables(FAO,2018).
Theaveragesmallholderfarmconsistsofsmalllandplots(average0.6hectares)
maintainedby5to6familymembers.Approximately89%offamilyfarmsareheaded
bymen,withwomentypicallyupholdingthedutiesofcooking,collectingfirewood,and
caringforchildren.ThedecentralizedarchipelagicnatureofIndonesiameansthatthe

10
majorityofthesefarmsarelocatedinruralareaswithlimitedaccesstoenergy
resourcesandalternativeworkopportunities.Assuch,theaverageannualhousehold
incomeofsmallfamilyfarmersisonly$1,967USDcreatingapovertyrateof18%
amongsmallholderfarmers,whichishigherthanthenationalaverageof11%(FAO,
2018).Intotal,itisestimatedthatthereare25millionhouseholds(57%ofall
households)thatareconsideredfamilyfarms(Nesetal,2009),ofwhichatleast13.3
million(in2003)weremarginalfarmsteadswithlessthan0.5hectaresofagricultural
land(Zhangetal,2013).
DuetosuchalargeproportionofIndonesianhouseholdsconsistingofruralsmallholder
farmsthattraditionallyrelyonfirewoodforfuel,biogashasoftenbeenproposedasan
interventiontechnologytoenableuniversalenergyaccessinIndonesia.Onesuch
exampleisthegovernmentoftheNetherlands,whichallocated500millioneurosto
promoterenewableenergyindevelopingcountriesbetween2008-2011.They
identifiedIndonesiaasoneoftheprimarytargetsforthedisseminationofthiseffort,
withaspecificfocusondomesticbiogasenergy.In2008,theDirectorateGeneralfor
ElectricityandEnergyUtilization(DGEEU)oftheGovernmentofIndonesiathen
requestedtheEnvironmentandWaterDepartment(DMW)oftheNetherlandsMinistry
ofForeignAffairs(DGIS)andtheRoyalNetherlandsEmbassy(RNE)inJakarta,
Indonesiatocompleteafeasibilitystudythatoutlinesthepotentialforanationalbiogas
strategyinIndonesia.TheDGISandRNEtogetherwiththegovernmentofthe
NetherlandscontractedtheSNVNetherlandsDevelopmentOrganization,anon-profit
internationaldevelopmentfirmwithpriorexperienceworkinginAsianandAfrican
countries,tocompletethefeasibilitystudyandprovideadditionalcontextforbiogasin
Indonesia(Nesetal,2009).
Threetypesofbiogasdigesterwereexaminedinthestudy.Thefirstdesign,originating
fromIndia,iscalledafloatingdrumandconsistsofabrickdigestionchambercapped
withasteeldruminwhichtocollectthebiogas.Thisdesignrequiresahighinitial
investmentandthesteeldrumhasbeenfoundtobecomesusceptibletocorrosion,
shorteningthelifespanoftheunit.Theseconddesign,originatingfromChina,iscalleda
fixeddomedigesterandisconstructedentirelyofbrickinwhichgascollectiontakes

11
placewithinthesamechamberasanaerobicdigestion.Thisdesignisthemostdifficult
andcostlytoconstructbutcouldpotentiallyhavethelongestlifespanestimatedat
approximately15years.Thethirddesign,calledtheplasticbagdigester,wasdeveloped
inTaiwaninordertodecreasecapitalcostsofthedigester.Inthisdesignanaerobic
digestionoccurswithinacylindricalbagmadefromsomeversionofplastic(e.g.PE,
LDPE,PVC),andgasstorageoccursinaseparateplasticbag.Plasticbagdigestersare
theleastcostlytoconstruct,arerelativelysimple,andmakeitpossibletoincreasegas
pressurebyplacingweightsonthebag.However,thisdesignalsohastheshortest
lifespan(rangingfrom2-5yearsdependingonconditions),andispronetoleakagedue
tomaterialweakeningduringtransportationordamagebyrodentsorotheranimals
(Nesetal,2009).
SNVNetherlandsconductedconsultationswithstakeholdersandhouseholdswhichhad
eitherpreviouslyinstalledabiogasdigesterorwereeligibletoreceiveinordertoelicit
thespecificadvantagesanddisadvantagesofbiogasthatarevaluedinIndonesia.Valued
advantagesincludedreductionoffoulsmellsfrommanureduetoproperwaste
management,convenience,andhavingacleanandsafefuelforcookingthatalsoleads
toacleancookingenvironment,cleancookingutensils,andcleanclothes(Nesetal,
2009).Theyalsomentionedthebenefitofsavingmoneyfrompurchasingotherfuels,
savingtimecomparedtocookingwithfirewoodorkerosene/LPGaswellascollecting
firewood,andtheproductionofbio-slurry(Nesetal,2009).Bio-slurryisthetermgiven
tothedigester’seffluent,akatheby-productofanaerobicallytreatingorganicwastein
thedigester.Thebio-slurryhashighamountsoforganicnutrientsandbio-activators
makingitanexcellentsoilconditionerthatalsoaddshumusandenhancesthesoil’s
capacitytoretainwater(Zhangetal,2013).Asbio-slurryisfullyfermenteditisalso
odorless,doesnotattractflies,andisfreeofpathogensthatcouldcausediseaseto
humansorplants(Zhangetal,2013).Applicationofbio-slurrytofieldshasfurthermore
beenshowntoincreasecropproductionrelativetoartificialfertilizers(qualitative
observation),andtobeaneffectivenaturalpesticideandherbicidewithonestudy
showingareductioninweedgrowthbyupto50%(Zhangetal,2013).Thebio-slurry
producedoffersadualbenefittofarmersbyprovidingthemafreeorganicfertilizerthat
caneitherbeappliedtotheirowncrops(thusreducingtheirexpendituresonchemical

12
nutrients)ortraded/soldtootherfarmersinexchangeforgoodsandservices(thus
providinganadditionalsourceofrealorvirtualincome).Disadvantagesofbiogas
identifiedbystakeholderswereshortageorunsteadysupplyofmanuretofeedthe
digester,inadequatebiogasproduction,leakagethroughvariouspartsofthesystem,
andlimitedlifespanoftheunit(dependingonthetypeofdigesterused)(Nesetal,
2009).
TheSNVNetherlandsfeasibilitystudyconcludedthattherewassignificantpotentialfor
biogasstrategyimplementationinIndonesiawithcapacityforatleastonemillionunits
tobeinstalled(Nesetal,2009).Theyfurtherconcludedthatsmallholderfarmerswho
investedinabiogasdigesterwouldreceiveanattractivefinancialrateofreturn(FIRR)
whencombinedwithagovernmentsubsidy.Anotherimportantdevelopmentthatwas
notincludedinthestudybySNVNetherlandsbutshouldstillbeconsideredisthata
BalineseNGOcalledSu-re.coisintheprocessofdevelopinganenhancedversionofthe
plasticbagdigesterusingPVC(Silaenetal,2019).UseofPVCmaterialinthebag-style
designallowsforacompromisebetweencostanddurability.PVCismoreresistantto
weather,transport,andanimalinduceddamageandisthereforelesslikelytoform
leaks.ItispredictedthatthePVCdigesterswillhaveafunctionallifespanof5years,and
theyaredesignedsuchthatonlythebagitselfwillneedtobereplaced(Silaenetal,
2019).InitialcostestimatesforPVCbagdigesterswerelistedat$414USD(Silaenetal,
2019),howeverSu-re.coisworkingtoreducethecostevenfurtherbyproducinglarger
quantitiesatatimetoreacheconomiesofscale(Su-re.co,personalcommunication).
InresponsetoSNVNetherland’sstudy,thegovernmentoftheNetherlandsdecidedto
financeabiogasstrategyprojectinIndonesia.TermedBiogasRumah(BIRU),meaning
biogasforthehousehold,BIRUsetthegoalofinstalling100,000digestersby2020
throughpartnershipwiththeinternationaldevelopmentfirmHivos(alsobasedinthe
Netherlands),whichultimatelycreated(andlaterdelegatedmanagementresponsibility
to)theIndonesianNGOYayasanRumahEnergi(YRE)(Nesetal,2009).Thegovernment
ofIndonesiaagreedtoprovideasubsidyof$200USD(approximatelyIDR2.75million)
towardseachbiogasdigesterthatwasinstalled.Provisionofwhichwasessentialto
meetingthefinancetargetssetbytheprogram.BIRUhadasuccessfulstart,andby

13
2016theprogramhadsuccessfullycompletedover20,000installationsacrossnine
provincesofIndonesia(Tayloretal,2019).However,in2017thegovernmentof
Indonesiachangeditstuneonbiogasstrategyandhaltedthe$200USDsubsidyentirely
(Hivos,personalconversation).Theremovalofthisfinancingcausedtheprogramto
crashandtherehavebeenonlybeenrelativelyfewbiogasdigesterinstallationssince
thistime(Hivos,personalconversation).
Recent reports in the literature suggest that there are some limitations with the fixed
dome digesters employed by Hivos. Reports indicate that alternating wet and dry seasons
in Indonesia can lead to the frequent formation of cracks in the dome, causing users to
stop using their digester (Taylor et al, 2019; Silaen et al, 2019; Bößner et al, 2019). These
papers also tout the ability of Su-re.co’s new PVC bag-style digester to overcome issues
with cracking while providing a more affordable cost-effective option.
Project Objectives
1. Work with clients Su-re.co (Bali) and Hivos (Jakarta) to identify past problems
and new developments in Indonesia’s biogas sector. Identify the cause of recent
reports on cracking, the seriousness of the problem, and if Su-re.co’s model is
really the solution 2. Add to existing knowledge on biogas by collecting data on flow rates, thermal
efficiencies, particulate matter emissions, etc. 3. Use Gold Standard methodologies to enhance capacity for modeling emissions
reductions (ERs) 4. Conduct financial analyses on different digester models; identify other ways to
increase value for clients 5. Synthesize data and financial analyses to select the most appropriate digester
model(s) to recommend for inclusion in the Gold Standard and focused expansion
in Indonesia

14
Methodologies
Field work was conducted between February 1 – March 31, 2020 in Bali and Jakarta,
Indonesia. Grant funding for this research was provided by the Energy Access Group at
Duke University. The database of the Indonesia Domestic Biogas Program (IDBP) was
analyzed to determine the distribution of livestock and people in recipient households to
make assumptions about the target market. The percent of currently functioning and non-
functioning digesters was calculated to identify trends among digester failure and non-
compliance. At each client organization, initial analyses of operations were conducted by
examining financial documents, technical papers, and business plans. Recommendations
and improvements to general operations were made as appropriate.
To compare the potential of different biogas digester models, the Clean Cooking Alliance
(CCA) methodology, ‘Water Boiling Test’ (WBT), was chosen. In the WBT, the stove is
started at full power and the time taken to bring 2.5 L of water to the local boiling
temperature (LBT; 99° C at sea level) is recorded. Once the LBT is reached, stove power
is reduced to bring the water to a ‘simmer’ for 45 minutes while maintaining water
temperature within 3° C of the LBT.
Water temperature is monitored with a thermometer and the volume of water remaining
at the end of the test is also recorded. The WBT was originally designed to test improved
wood burning stoves, and while modifications have been included to account for newer
stove types such as LPG and kerosene, there are no established guidelines for applying
the WBT to biogas (there is only one previous biogas stove test listed with the CCA
(CleanCookingCatalog,2020)). The following three modifications were made to the
WBT to adapt for biogas cookstoves in this project. Firstly, fuel consumption
measurement (typically done by mass) was conducted with a biogas flow rate meter that
yielded cumulative gas input in cubic meters. A flow meter was temporarily installed on
systems that did not already have one. Secondly, an initial volume of 1.25 L was chosen
instead of 2.5 L due to the relatively low power of certain biogas digester models. Lastly,
the WBT typically calls for a second boiling phase succeeding the first to observe
differences in boiling times when the stove is already in use (the ‘hot start’). The hot start

15
may be omitted if it is shown that there is no significant difference with the ‘cold start’.
While this is not the case here (when tested the hot start was actually longer to boil due to
limited gas supply), the hot start was omitted from the protocol due to the similarities of
biogas stoves to LPG, which do not have a significant difference among tests due to the
low heat absorption capacity of the gas stove (compared to a ceramic wood stove, for
example).
To observe stove impacts on indoor air pollution, custom air quality meters were
deployed throughout the ~1 h WBT as well as 20 minutes before the test as a baseline.
The air quality meters were designed and provided by Michael Bergin at the Duke Pratt
School of Engineering.
To estimate the financial impact of different digester models the net present value (NPV)
and financial internal rate of return (FIRR) were calculated using excel. One of the most
important next steps is the development of remote monitoring flow meters. In
anticipation of this, models were created and tested to estimate emissions reductions from
fuel displacement and waste management as a function of total gas consumed by the end
user.
Results and Recommendations
Database Analysis
Analyzing Hivos’ database with entries from over 24,000 established digesters it was found
that overall 63.6% of fixed dome digesters are listed as currently functioning while 36.4% are
listed as non-functioning. While this non-functioning figure is lower than indicated in the
literature, it is still significantly high. However, among those non-functioning only 21.5% are
listed as a ‘technical’ issue while 78.5% are listed as ‘non-technical’. Technical issues are
design issues or digester failure such as the reported cracking, while non-technical issues are
due to social factors such as the farmer selling the cattle, moving houses, or simply ceasing to
feed and use the digester. Thus, the majority of non-compliance among established digesters
should not be attributed to cracking but instead to social issues which should be addressed in
project design. In Bali, a previous program attempting to increase biogas use gifted cattle to

16
farmers along with digesters. Due to the lack of ownership, the majority of farmers then sold
the cattle as investments. This failed program led Bali to have the highest percentage of non-
functioning digesters in Indonesia (73.2% non-functioning) with 90.8% listed as non-
technical reasons. This inflated statistic in Bali may be partially responsible for the recent
literature reports claiming such high non-compliance and frequency of cracking.
The database was also used to understand the distribution of number of cattle and persons in
the market. Figure 1 shows that the majority of households eligible to receive a biogas
digester have 2 – 4 cattle with a mode of 3 cattle. Together, 90% of all households had 8
cattle or less.
Figure 1: Distribution of cattle ownership in IDBP database
Figure 2 shows that the majority of biogas recipient households in Indonesia have
between 3 – 5 household members with 4 people being the most common. This differs
slightly from literature reports that most smallholder farms have 5 – 6 household
members.
0
5
10
15
20
25
1 2 3 4 5 6 7 8 9 10
10->15
15->20
>20
Percent
NumberofCattle

17
Figure 2: Distribution of people in each household in IDBP database
Su-re.co
Su-re.co operates on the islands of Bali and Flores with their main office in Canggu, Bali.
Their business model includes selling coffee and cacao products from beans produced by
partner farmers. Twenty-five percent of these local sales are then used to subsidize the
distribution of their biogas digesters. Despite this business wing, Su-re.co is a non-profit
organization that finances the majority of operations through grant funding and donations.
Su-re.co is the first biogas organization to incorporate a flow meter of any kind to their
digesters, although their current model is limited in that it does not store nor transmit any
data. Su-re.co has been involved in the biogas sector since 2015, a young program with only
24 deployed digesters. However, their digester design is simple and easy to deploy with a
cost roughly half of fixed dome digesters. This allows Su-re.co to donate the digesters at no
cost to the end-users. Su-re.co’s goal is to become the ‘IKEA’ of biogas, meaning they can
send their digester as a kit that can be installed on site by the end-users themselves. Currently
all of the deployed digesters are a small 1 m3 capacity.
One of the first observations from evaluating Su-re.co’s operations was that they had no
method of recording farmer data such as fuel consumption, number of household users,
0
5
10
15
20
25
30
35
40
1 2 3 4 5 6 7 8 9 10 >10
Percent
NumberofPeople

18
compliance, etc. To address this, baseline and end-user surveys designed for improved wood
burning stoves as part of the CCA Kitchen Performance Test were modified to function
specifically for biogas stove interventions. An online database was also created to allow Su-
re.co to store the collected data. This will allow the client to quantify and track specific
reductions in alternative fuel use before and after receiving a digester.
Water Boiling Test- PVC Bag-Style Digester
The first WBT’s were conducted from February 10 - 14, 2020 on established Su-re.co
digesters in Petang, a mountainous region common for small-scale coffee farmers. The 1 m3
digesters produced a medium flame initially raising the water temperature. However, after 10
minutes the rate of temperature increase slowed, and after 20 minutes the size of the flame
was visibly smaller. The water failed to reach the LBT of 96.67° C with a maximum
temperature of 92° C achieved between 20 – 25 minutes. Since the WBT was failed, the stove
was continued running until the flame went out completely between 55 – 60 minutes. Figure
3 shows cumulative flow (m3) of biogas, where the curved nature indicates decreasing flow
over time due to the lack of a pressure regulation system in the bag-style design. Figure 4
shows incremental flow (m3) over time as flow rate began high but quickly decreased.
Figure 3: Cumulative flow (m3) over time for bag-style digester.
0.15
0.2
0.25
0.3
0.35
0.4
0 10 20 30 40 50 60 70
CumulativeFlow
Time(minutes)
19
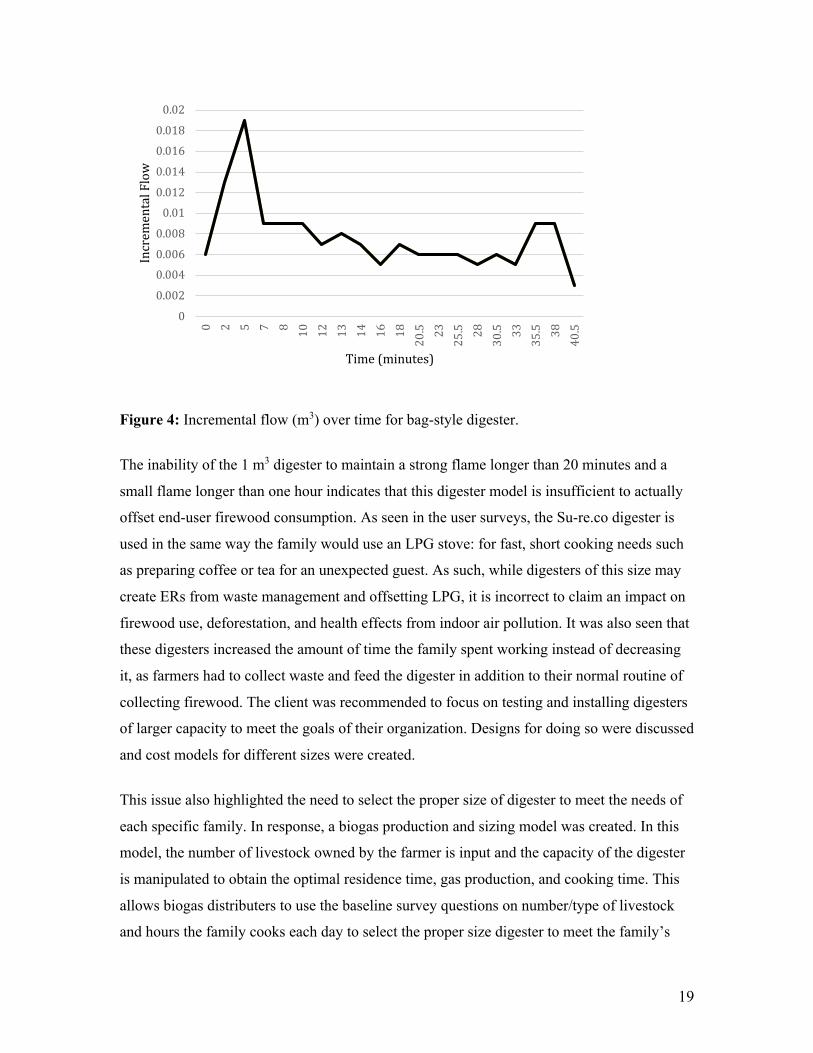
Figure 4: Incremental flow (m3) over time for bag-style digester.
The inability of the 1 m3 digester to maintain a strong flame longer than 20 minutes and a
small flame longer than one hour indicates that this digester model is insufficient to actually
offset end-user firewood consumption. As seen in the user surveys, the Su-re.co digester is
used in the same way the family would use an LPG stove: for fast, short cooking needs such
as preparing coffee or tea for an unexpected guest. As such, while digesters of this size may
create ERs from waste management and offsetting LPG, it is incorrect to claim an impact on
firewood use, deforestation, and health effects from indoor air pollution. It was also seen that
these digesters increased the amount of time the family spent working instead of decreasing
it, as farmers had to collect waste and feed the digester in addition to their normal routine of
collecting firewood. The client was recommended to focus on testing and installing digesters
of larger capacity to meet the goals of their organization. Designs for doing so were discussed
and cost models for different sizes were created.
This issue also highlighted the need to select the proper size of digester to meet the needs of
each specific family. In response, a biogas production and sizing model was created. In this
model, the number of livestock owned by the farmer is input and the capacity of the digester
is manipulated to obtain the optimal residence time, gas production, and cooking time. This
allows biogas distributers to use the baseline survey questions on number/type of livestock
and hours the family cooks each day to select the proper size digester to meet the family’s
0
0.002
0.004
0.006
0.008
0.01
0.012
0.014
0.016
0.018
0.02
0 2 5 7 8 10 12 13 14 16 1820.5 23
25.5 28
30.5 33
35.5 38
40.5
IncrementalFlow
Time(minutes)

20
needs. This model was used to identify potential gas production for different digester sizes
and number of cattle, summarized in Table 1. Overall a capacity of 3.5 m3 was identified as
the most ideal size as it is the smallest capable of accommodating up to 8 cows while also
producing enough gas for daily use (Table 1).
Table 1: Theoretical quantity of gas produced (m3/d) and hours of stove use per day
depending on number of cattle for three different digester capacities.
2 m3 3 m3 3.5 m3
# Cows Q (m3/d) h use/day Q (m3/d) h use/day Q (m3/d) h use/day
8
1.86 5.3
7
1.86 5.3
6
1.59 4.6 1.61 4.6
5
1.38 3.9 1.42 4.1
4 1.06 3.0 1.21 3.5 1.27 3.6
3 0.812 2.3 0.985 2.8 0.964 2.8
2 0.656 1.9 0.712 2.0 0.730 2.1
1 0.417 1.2
Hivos and Yayasan Rumah Energi
Yayasan Rumah Energi (YRE) is the operating arm of Hivos SEA’s biogas program. While
Hivos’ Jakarta office currently manages and funds YRE, the ultimate goal is for YRE to
become financially self-sustaining through carbon market funding, marketization of bio-
slurry, and private sector biofuel sales. Since the Indonesia Domestic Biogas Program began
in 2012, all of Hivos’ 24,772 biogas installations have been larger sized fixed domes between
4 – 12 m3. However, they are now testing a smaller 2 m3 design made from a recycled PE
water tank in order to lower costs and appeal to more users. Since the government pulled
their 3 million IDR subsidy in 2017 YRE has amassed a list of ~1,000 households that are

21
waiting to receive a digester because they are not willing to pay the difference. The farmers
have a willingness to pay (WTP) of 3 million IDR, and YRE provides a subsidy of 4 million,
leaving a gap between available finance and the system’s 10 million IDR cost. Thus, Hivos
wants to find an effective and appropriately sized model for less than 7 million IDR ($450
USD).
Under the TPDDTEC Gold Standard Methodology carbon offsets from biogas digester use
are calculated through a series of complex equations with data collected through strenuous
yearlong surveys and data collection. In an attempt to simplify these calculations, a
TPDDTEC ER calculator model was produced in which the number of household members
and livestock are input, and the output is tCO2e reduced. However, the model created in this
project was found to be less conservative than traditional heavy data driven methods. This
illuminates the need to identify alternative methods for ER calculations that are conservative
and based on real data but are more cost and time effective to implement.
Water Boiling Test- Fixed Dome Digester
Fixed dome digesters constructed by YRE were tested between March 16 – 30, 2020 in the
villages of Depok and Bogor outside of Jakarta. Unlike the bag-style digesters, users of fixed
domes reported 100% displacement of firewood and LPG stove use. Fixed dome digesters
also successfully completed the WBT with an average time to boil of 8 minutes 45 seconds.
The linear nature of cumulative flow in Figure 5 shows how the fixed dome’s displacement
chamber is able to adequately maintain stable pressure of gas at the stove over time. Figure 6,
showing incremental flow over time, shows that flow rate did start off high before decreasing
like with the bag-style design. However, after the initial decrease pressure stabilized and
remained fairly level throughout the rest of the test. Figure 7 combines the incremental flow
rate graphs from both the bag-style and fixed dome digesters to show that the fixed dome not
only started off with higher pressure than the bag-style digester but also maintained a higher
pressure than capable by the bag throughout the test.

22
Figure 5: Cumulative flow (m3) over time for fixed dome digester.
Figure 6: Incremental flow (m3) over time for fixed dome digester.
0.1
0.15
0.2
0.25
0.3
0.35
0 10 20 30 40 50
CumulativeFlow
Time(minutes)
0
0.005
0.01
0.015
0.02
0.025
0.03
0 2 5 7 8 10 12 13 14 16 1820.5 23
25.5 28
30.5 33
35.5 38
40.5 43
45.5 48
50.5
IncrementalFlow
Time(minutes)

23
Figure 7: Incremental flow (m3) over time for both the fixed dome (grey) and bag-style
(black) digesters.
WBT- PM, CE, and hc
There was no significant difference in particulate matter (PM) emissions between baseline
measurements and measurements while operating the stove in the WBT (Table 1). However,
PM emissions were higher while the stove was operating than in the baseline, indicating that
biogas does contribute somewhat to PM formation.
Table 2: Mean values of PM 1, 2.5, and 10 (μg/m3) in baseline measurements and while the
stove was running in the water boiling test (WBT).
PM1 PM2.5 PM10
Baseline 9.30 13.46 14.44
WBT 10.18 14.30 15.45
Combustion efficiency (CE) of the bag-style digester was calculated at 49.6%, while CE of
the fixed dome digester was 44.1%. This result is counterintuitive as increased flow rate
(pressure) typically increases CE, however the results are within the margin of error.
0
0.005
0.01
0.015
0.02
0.025
0.03
0 2 5 7 8 10 12 13 14 16 1820.5 23
25.5 28
30.5 33
35.5 38
40.5 43
45.5 48
50.5
IncrementalFlow
Time(minutes)

24
Thermal efficiency (hc), calculated with the equation below, was found to be 29.4% for the
PVC bag-style digester and 36.5% for the fixed dome digester. For comparison, LPG stoves
typically have an hc of 40 – 50%, increasing as pressure increases. As biogas digesters deliver
fuel to the stove at a lower pressure than LPG, this result makes sense.
Digester Model Recommendations
To bridge the gap between the 7 million IDR subsidy + farmer WTP and the 10 million IDR
cost of Hivos’ 4 m3 fixed dome model, it was proposed that a 3.5 m3 model should be
constructed with a PE tank in the same design as the new 2 m3 mini-digester model in testing.
The lower materials cost and simplified installation of this design brings the total cost down
to 6.5 million IDR ($420 USD), within the available finance limit.
To accommodate farmers with only one cow as well as provide a lower cost option the
second recommended model was the 2 m3 PVC bag-style digester by Su-re.co. With a total
cost of 3.2 million IDR ($205 USD), this model could be given for free to farmers who have
no WTP, and potentially sold at a profit to households in the private market.
Together these two models cover all farmers with 8 or less cows, representing 90% of the
available market in Indonesia (Table 1).
Financial Analysis of Recommended Models
The 3.5 m3 PE digester design proposed for Hivos was found to have an FIRR of 23% with a
payback period of approximately 6 years, becoming cashflow positive in year 7 (Figure 8).
The NPV of the PE digester (incorporating savings on fuel and fertilizer plus returns from
carbon finance) was found to be 19.2 million IDR. This analysis indicates that the 3.5 m3 PE
digester is a worthwhile investment with an NPV greater than initial cost.

25
Figure 8: Cashflow over time for the fixed dome digester.
The 2 m3 PVC bag-style digester was found to have an FIRR of 8% with a payback period of
15 years and an NPV of 1.34 million IDR (Figure 9). While the FIRR of this model is
positive, the NPV is less than the initial cost and furthermore it has yet to be proven how long
this model will actually function before needing to be replaced. More information is needed
on longevity and additional cost reductions would help bolster investment potential. This
model still offers relative advantages due to its low cost and ability to be easily transported.
Figure 9: Cashflow over time for the PVC bag-style digester.
-10.00
-5.00
0.00
5.00
10.00
15.00
1 2 3 4 5 6 7 8 9 10 11 12 13 14 15 16
Cashflow
Year
-5.00
-4.00
-3.00
-2.00
-1.00
0.00
1.00
2.00
1 2 3 4 5 6 7 8 9 10 11 12 13 14 15 16 17
Cashflow
Year

26
Memorandum of Understanding
The collaboration between Hivos and Su-re.co is being made official through a Memorandum
of Understanding (MoU) that was completed and sent to be signed March 31, 2020. The
MoU states that Su-re.co’s 2 m3 bag-style digester will be included in Hivos’ upcoming
submission of the Voluntary Program Activities (VPA-3) document if certain conditions are
met. Firstly, Su-re.co must finalize testing on their 2 m3 design and work to install a
minimum of 100 digesters. Secondly, Su-re.co must maintain and update the database created
in this project recording baseline and project fuel consumption, hours stove use per day,
number of people and livestock in the household, etc. Operating status of the digester should
also be included with a mandatory confirmation check between 3 – 6 months after
installation. During this time Hivos will continue their work to modify the original Gold
Standard Project Design Document to include digesters of less than 4 m3. Once these
thresholds are reached, the clients will jointly finalize the VPA-3 for submission to the Gold
Standard.
Remote Monitoring
To enhance the ability to accurately and efficiently monitor digester usage and quantify
emissions reductions a strong focus on the development of remote flow rate monitors was
recommended. If implemented, this measure could save the clients over $10,000 per year on
monitoring costs while increasing data access. In anticipation of this transition, a model was
developed to translate quantity of biogas used to quantity of firewood displaced and quantity
of waste that is efficiently treated to produce the biogas. Firewood displacement is calculated
using net calorific values and waste management using a regression of gas production vs.
volatile solid input (R2 = 0.9921). Methane conversion factors and physical leakages are also
accounted. The final output is tCO2e offset by the exact amount of biogas used by each
household from waste management (ERwm) and firewood (ERbio). The equations developed
for use in the formula are:
´ ERwm (tCo2e)= (VS * 0.13 (m3 CH4 * kgVS-1) * 0.662 (kgCH4 * m3CH4-1)
* MCF *GWPCH4) * (0.001 ton * kg-1) * (1 – (Pl + n))

27
´ ERbio (tCo2e)= (G (m3) * 3.47 kg * m-3) * EF (tCO2 * TJ-1) * NCV (TJ * ton-1)
* (0.001 ton * kg-1) * (1 – (Pl + n))
The model was run using monitoring data collected by YRE from 2016 – 2018 to compare
the model results with those of the yearlong field surveys. Survey data showed an average
daily stove use time of 2.74 h. With a flow rate between 0.35 – 0.40 m3 * h-1, daily biogas
consumption can be approximated at 1.0 m3. Since the field surveys estimate ERs on an
annual basis, 365 m3 biogas consumed was entered into the model. The results showed that
the model appropriately predicts the expected outcome within a 10% margin of error.
Moreover, the model was found to be more conservative than the field results, reducing the
likelihood of overestimating ERs. The model estimated ERs from firewood displacement at
0.852 tCO2e (1.16% different from survey findings of 0.862 tCO2e), and ERs from waste
management at 1.42 tCO2e (11.0% different from survey findings of 1.586). Overall, the
model estimated ERs of 2.27 tCO2e, only a 7.4% difference from the survey findings of
2.448 tCO2e.
These results show that remote monitoring of gas consumption can be combined with this
model to accurately and efficiently estimate ERs without the expense of yearlong field
surveys. In addition to simplifying monitoring this strategy could also play an important role
in incentivizing continued use of the digester by offering rebates for surpassing certain
‘milestones’ of biogas use (e.g. payment discount or cash back for every 100 m3 biogas
used).
Key Recommendations
1. Applications from potential biogas users should include the number of livestock and
number of hours spent cooking per day so that the gas production model can be used
to select the appropriate size digester for the family.
2. Digester recipients should complete the baseline survey designed for biogas here, and
the user surveys should be completed on follow up visits within one year of
installation. These data should be stored in a shared database

28
3. Su-re.co should focus on finalizing and installing a 2 m3 PVC bag-style design
instead of the current 1 m3 capacity in order to have the desired impacts on
deforestation, health from indoor air pollution, and ERs from firewood
4. Hivos should bridge the financial gap between cost and subsidy + WTP by focusing
on a 3.5 m3 PE tank digester design
5. The two recommended designs should be incorporated into Hivos’ Gold Standard
registration under VPA-3, together representing 90% of the market
6. Traditional monitoring should be modernized through the use of remote flow rate
meters and gas consumption ER models, such as the one presented here
Next Steps
1. Sign and return MoU; modify PDD to allow smaller capacity digesters
2. Finalize designs for 2 m3 PVC bag-style and 3.5 m3 PE tank digesters. Work towards
installing 100 digesters of each recommended model
3. After 100 digester threshold, jointly complete and file VPA-3
4. Begin remote flow meter development. Submit proposal for new methodology to
Gold Standard
5. Sponsor research to increase stove combustion and thermal efficiencies
6. Develop additional biogas appliances (e.g. rice cooker, lamps, water heater, etc.) to
increase demand and WTP
7. Grow private sector business model and establish additional revenue streams to
increase client self-sufficiency

29
References Bedi, A. S., Sparrow, R., & Tasciotti, L. (2017). The impact of a household biogas
programme on energy use and expenditure in East Java. Energy Economics, 68,
66–76. https://doi.org/10.1016/j.eneco.2017.09.006
Bößner, S., Devisscher, T., Suljada, T., Ismail, C. J., Sari, A., & Mondamina, N. W.
(2019). Barriers and opportunities to bioenergy transitions: An integrated, multi-
level perspective analysis of biogas uptake in Bali. Biomass and Bioenergy, 122,
457–465. https://doi.org/10.1016/j.biombioe.2019.01.002
Clean Cooking Alliance. (2013). Ingredients for Sustainable Cookstove Interventions:
Lessons Learned from the Indian National Programme for Improved Cookstoves
(NPIC). Clean Cooking Alliance.
http://cleancookingalliance.org/resources/320.html
Clean Cooking Catalog. (n.d.). Clean Cooking Catalog. Retrieved April 23, 2020, from
http://catalog.cleancookstoves.org/test-results
Ezzati, M., Mbinda, B., & Kammen, D. (2000, January 15). Comparison of Emissions
and Residential Exposure from Traditional and Improved Cookstoves in Kenya |
Environmental Science & Technology.
https://pubs.acs.org/doi/full/10.1021/es9905795
FAO. (2018). Indonesia- Small Family Farms Country Factsheet (I8881EN/1/03.18).
Food and Agriculture Organization of the United Nations.
Muthia, R. (2015). Clean Cookstoves and Fuels: A Catalog of Carbon Offset Projects
and Advisory Service Providers - 2015 (2nd Edition). Clean Cooking Alliance.
http://cleancookingalliance.org/resources/381.html

30
Nes, W. J. van, Tumiwa, F., & Setyadi, I. (2009). Feasibility of a national programme on
domestic biogas in Indonesia. SNV - Netherlands Development Organisation.
Schenck, L. (2018). Small Family Farming in Indonesia—A country specific outlook |
FAO. http://www.fao.org/family-farming/detail/en/c/1111082/
Silaen, M., Taylor, R., Bößner, S., Anger-Kraavi, A., Chewpreecha, U., Badinotti, A., &
Takama, T. (2019). Lessons from Bali for small-scale biogas development in
Indonesia. Environmental Innovation and Societal Transitions.
https://doi.org/10.1016/j.eist.2019.09.003
Taylor, R., Devisscher, T., & Takama, T. (2019). Risks, barriers and responses to
Indonesia’s biogas development. https://www.sei.org/publications/risks-barriers-
and-responses-to-indonesias-biogas-development/
Zhang, Y., Tuntivate, V., Aristanti, C., & Wu, Y. (2013). Indonesia—Toward universal
access to clean cooking (No. 79279; pp. 1–90). The World Bank.
http://documents.worldbank.org/curated/en/105441468044144806/Indonesia-
Toward-universal-access-to-clean-cooking