carbon sequestration and irish forest ecosystems -final...carbon sequestration and irish forest...
TRANSCRIPT
Carbon Sequestrationand Irish Forest Ecosystems
Edited by Kevin G. Black and Edward P. Farrell

COFORD, National Council for Forest Research and DevelopmentArena HouseArena RoadSandyford Dublin 18IrelandTel: + 353 1 2130725Fax: + 353 1 2130611© COFORD 2006
First published in 2006 by COFORD, National Council for Forest Research and Development, Dublin, Ireland.
All rights reserved. No part of this publication may be reproduced, or stored in a retrieval system or transmitted in any form or by any means,electronic, electrostatic, magnetic tape, mechanical, photocopying recording or otherwise, without prior permission in writing from COFORD.
ISBN 1 902696 48 4
Title: Carbon sequestration and Irish forest ecosystems.Editors: Kevin G. Black and Edward P. Farrell
Citation: Black, K.G. and Farrell, E.P. (eds). 2006. Carbon sequestration and Irish forest ecosystems. COFORD, Dublin.
The views and opinions expressed in this publication belong to the authors alone and do not necessarily reflect those of COFORD.
Foreword
Ireland’s rapidly expanding economy has, over the period since 1990, pushed emissions of greenhouse gasesto well over the level the country signed up to in the Kyoto Protocol. Government policies to counteract thistrend are rightly focused on reducing consumption of fossil fuels, changes in agricultural practices and a rangeof other measures, including the use of wood energy.
Along with reductions in emissions arising the areas outlined forests have a well defined role in mitigatingclimate change, as a land use that sequesters and stores atmospheric carbon dioxide, the main greenhouse gas,as a provider of energy efficient wood materials, and as a source of clean, renewable wood fuel.
Carbon sequestration was the focus of the work funded by COFORD in the CARBiFOR project, carriedat University College Dublin, and reported here. Using a range of approaches, the team has done valuablework in updating estimates of carbon uptake in the main forest type – Sitka spruce, across a range of ageclasses. Innovative and challenging research has also been undertaken on ecosystem level uptakes and fluxesof greenhouse gases - work that has been linked to international efforts in gaining a deeper understanding ofhow forest ecosystems interact with the global climate. New information and insights have also been gainedon forest soils and their carbon dynamics.
Linking research to policy development is a key task of nationally funded R&D programmes. CARBiFORhas been of great value in this arena: in providing input to guide the development of afforestation policy and,of course, in the climate change area itself, including the emissions trading scheme. The work has beeninstrumental in providing estimates of annual sequestration rates over the period 2008-2012. WithoutCARBiFOR, estimates of changes in forest carbon stocks would be on a far weaker footing, which wouldhave direct economic consequences for Ireland in terms of purchases of carbon credits.
Expertise development is another important task of national R&D funding. CARBiFOR has proven to anexcellent investment from this perspective - not only have team members achieved post-graduatequalifications and published extensively, but they have also been part of the team that has developed thenational forest carbon reporting system to an international standard. They have also been active in developingland use reporting processes under the Intergovernmental Panel on Climate Change.
Forests have an important role to play in future climate change polices. At the global level the main needis to reduce tropical deforestation, and the greenhouse gases that arise when these forests are converted tofood production. How forests adopt to climate change is another important area for the future – as is the rolethat forests may have in helping adaptation strategies, such as flood control.
Continued national investment is required in researching climate change mitigation and adaptation byforest ecosystems, and in building reporting systems that will add to the work described in this importantreport.
David Nevins Eugene HendrickChairman Director
i
Brollach
Mar gheall ar fhorbairt ghasta gheilleagar na hÉireann thar an tréimhse ó 1990, tá astuithe de gháis cheapthateasa á mbrú go maith thar an leibhéal ar shínigh an tír dó i bPrótacal Kyoto. Mar is cóir, tá polasaithe anRialtais leis an treocht seo a chealú dírithe ar thomhailt na mbreoslaí iontaise a laghdú, athruithe a dhéanamhar chleachtais talmhaíochta agus raon bearta eile, lena n-áirítear fuinneamh adhmaid a úsáid.
Chomh maith le laghduithe ar astuithe ag teacht ó na rudaí thuasluaite, tá ról soiléir ag foraoisí maidir lehathrú aeráide a mhaolú, cionn is gur úsáid thalaimh iad a leithlisíonn agus a stórálann dé-ocsaíd charbóinatmasféarach, an príomhghás ceaptha teasa, a chuireann ábhair adhmaid atá tíosach ar fhuinneamh ar fáil,agus atá ina foinse breosla adhmaid, breosla atá glan inathnuaite.
Bhí leithlisiú carbóin mar fhócas ag an obair a mhaoinigh COFORD sa tionscadal CARBiFOR, a rinneadhag Coláiste Ollscoile Bhaile Átha Cliath, agus a thuairiscítear anseo. Ag úsáid réimse leathan modhanna oibre,tá obair luachmhar déanta ag an fhoireann le meastacháin ar thógáil charbóin a nuashonrú sa phríomhchineálforaoise – is é sin an sprús Sitceach, thar réimse d’aicmí aoise. Tá taighde dúshlánach nuálaíoch déanta chomhmaith ar thógáil agus floscanna de gháis theach ghloine ar leibhéal an éiceachórais - obair atá nasctha lehiarrachtaí idirnáisiúnta chun tuiscint níos doimhne a bhaint amach faoin dóigh a mbíonn éiceachóraisfhoraoise ag idirghníomhú leis an aeráid dhomhanda. Fuarthas eolas agus léargais úra chomh maith faoi ithirfhoraoise agus an dinimic charbóin a bhaineann léi.
Ar cheann de na tascanna is tábhachtaí atá ag na cláir thaighde agus forbartha a mhaoinítear go náisiúnta,tá an taighde a nascadh le forbairt pholasaí. Bhí CARBiFOR an-luachmhar maidir leis seo: ag solátharionchuir leis an pholasaí coilltithe a stiúradh, agus ar ndóigh, i limistéar athraithe aeráide é féin, lena n-áirítearscéim trádála na n-astuithe. Bhí an obair seo ina shiocair le meastacháin a chur ar fáil de rátaí bliantúlaleithlisithe thar an tréimhse 2008-2012. Murach CARBiFOR, bheadh bunús i bhfad níos laige faoimheastacháin d’athruithe ar stoic charbóin fhoraoise, rud a mbeadh torthaí díreacha eacnamaíocha acud’Éirinn maidir le sochair charbóin a cheannach.
Feidhm thábhachtach eile atá ag an mhaoiniú náisiúnta ar thaighde agus fhorbairt ná scileanna a fhorbairt.Chruthaigh CARBiFOR gur infheistíocht den scoth a bhí ann ar an dóigh seo – ní hamháin gur ghnóthaighbaill den fhoireann cáilíochtaí iarchéime agus go bhfuil cuid mhór foilsithe acu, bhí siad ina gcuid denfhoireann a d’fhorbair córas tuairiscithe carbóin na bhforaoisí náisiúnta go caighdeán idirnáisiúnta. Bhí siadgníomhach fosta i bpróisis thuairiscithe úsáid thalún a fhorbairt faoin Phainéal Idir-rialtais ar Athrú Aeráide.
Tá ról tábhachtach le himirt ag foraoisí i bpolasaithe amach anseo maidir le hathrú aeráide. Ar an leibhéaldomhanda, is é an gá is mó ná dífhoraoisiú trópaiceach a laghdú, chomh maith leis na gáis ceaptha teasa adhéantar nuair a thiontaítear na foraoisí seo chun bia a tháirgeadh. Rudaí tábhachtacha eile don am le teachtná an dóigh a gcuireann foraoisí iad féin in oiriúint don athrú aeráide, agus an ról a thiocfaí a bheith ag foraoisíi straitéisí oiriúnaithe, amhail tuilte a smachtú.
Tá gá le hinfheistíocht náisiúnta leanúnach a dhéanamh i dtaighde ar mhaolú athraithe aeráide agus oiriúnúag éiceachórais fhoraoise, agus i gcórais thuairiscithe a thógáil a chuirfidh leis an obair a ndéantar cur síos airsa tuairisc thábhachtach seo.
David Nevins Eugene HendrickCathaoirleach Stiúrthóir
ii
Contents
FOREWORD . . . . . . . . . . . . . . . . . . . . . . . . . . . . . . . . . . . . . . . . . . . . . . . . . . . . . . . . . . . . . . . . . . . . . . . . . . . . . . . . .i
BROLLACH . . . . . . . . . . . . . . . . . . . . . . . . . . . . . . . . . . . . . . . . . . . . . . . . . . . . . . . . . . . . . . . . . . . . . . . . . . . . . . . . .ii
EXECUTIVE SUMMARY . . . . . . . . . . . . . . . . . . . . . . . . . . . . . . . . . . . . . . . . . . . . . . . . . . . . . . . . . . . . . . . . . . . . . .v
ACHOIMRE FHEIDHMEANNACH . . . . . . . . . . . . . . . . . . . . . . . . . . . . . . . . . . . . . . . . . . . . . . . . . . . . . . . . . . . . .vi
LIST OF ABBREVIATIONS AND TERMS . . . . . . . . . . . . . . . . . . . . . . . . . . . . . . . . . . . . . . . . . . . . . . . . . . . . . . .vii
CHAPTER 1: INTRODUCTION . . . . . . . . . . . . . . . . . . . . . . . . . . . . . . . . . . . . . . . . . . . . . . . . . . . . . . . . . . . . . . . . .1Kenneth A. Byrne and Kevin G. Black
CHAPTER 2: SOIL CARBON FLUXES . . . . . . . . . . . . . . . . . . . . . . . . . . . . . . . . . . . . . . . . . . . . . . . . . . . . . . . . . . .7Gustavo Saiz, Kenneth A. Byrne and Edward P. Farrell
CHAPTER 3: SOIL STOCKS AND SOIL PROCESSES . . . . . . . . . . . . . . . . . . . . . . . . . . . . . . . . . . . . . . . . . . . . .19Brian Reidy, Jens Dyckmans, Olaf Schmidt and Tom Bolger
CHAPTER 4: BIOMASS EXPANSION FACTORS AND FOREST BIOMASS C STORES . . . . . . . . . . . . . . . . .29Brian Tobin, Kevin G. Black, Maarten Nieuwenhuis and John Gardiner
CHAPTER 5: ECOSYSTEM PROCESSES . . . . . . . . . . . . . . . . . . . . . . . . . . . . . . . . . . . . . . . . . . . . . . . . . . . . . . .41Kevin G. Black, Brian Tobin and Bruce Osborne
CHAPTER 6: RELATED STUDIES . . . . . . . . . . . . . . . . . . . . . . . . . . . . . . . . . . . . . . . . . . . . . . . . . . . . . . . . . . . . . .55
A) BIOMASS STOCKS IN YOUNG SITKA SPRUCE AND LODGEPOLE PINE STANDS . . . . . . . . . .55Brian Tobin and Carly Green
B) A COMPARISON OF CO2 FLUXES FROM THREE IRISH LAND-USE CATEGORIES: ARABLE,GRASSLAND AND FORESTRY . . . . . . . . . . . . . . . . . . . . . . . . . . . . . . . . . . . . . . . . . . . . . . . . . . . . . . .57Kevin G. Black, Phill Davis, Mike Jones and Bruce Osborne
C) CONTINENTAL-SCALE δ13C AND δ18O ISOTOPE SIGNATURES OF FOREST ECOSYSTEMS:RESULTS FROM A EUROPEAN NETWORK . . . . . . . . . . . . . . . . . . . . . . . . . . . . . . . . . . . . . . . . . . . .58Deborah Hemming and Kevin G. Black
CHAPTER 7: IMPLICATIONS FOR NATIONAL REPORTING . . . . . . . . . . . . . . . . . . . . . . . . . . . . . . . . . . . . . . .61Kevin G. Black, Kenneth A. Byrne and Gerhardt Gallagher
REFERENCES . . . . . . . . . . . . . . . . . . . . . . . . . . . . . . . . . . . . . . . . . . . . . . . . . . . . . . . . . . . . . . . . . . . . . . . . . . . . . .67
iii

Acknowledgements
The CARBiFor team would like to thank John O’Sullivan and John O’Brien, Coillte Portlaoise, for theirassistance in the selection of sites and the setting up of the flux tower site. Thanks are also extended toCOFORD for funding this project.
iv
Executive Summary
Under the agreed terms of the Kyoto Protocol, carbon sequestration by forests may be used to offsetgreenhouse gas emissions. In the Irish context, carbon sequestration which is eligible for Kyotocompliance purposes refers to afforestation activities since 1990. The primary objective of theCARBiFOR project was to provide data to enable the level of such offsets to be determined. It provideddata on carbon (C) stocks and sequestration rates, spanning the entire life cycle of the main forest type inIreland, for national reporting.
Based on inventory, eddy covariance and other physiological methods, the average C sequestrationrate over the entire life cycle of a selected chronosequence (10 to 50 year old stands) was estimated to be4 to 8 t C ha-1 yr-1. This value is higher than a previously reported average estimate of 3.36 t C ha-1 yr-1
(Kilbride et al. 1999). The higher average sequestration rate reported in this study was due to the use ofimproved biomass models, particularly for younger Sitka spruce stands. Afforested wet mineral soils alsorepresent a significant C sink of 0.05 to 1 t C ha-1 yr-1. However, changes in soil C stocks may be moredifficult to measure in highly organic soils, such as peats, because of the high background soil C.
The information available from the CARBiFOR project has now been used to improve theCARBWARE model to report national forest C stock changes. The new estimated annual C sequestrationsrates for Irish forests are equivalent to 1.56 to 2.39 Mt CO2 yr-1 for the first commitment period 2008-2012 (assuming an annual afforestation rate of 14000 ha), which is higher than the previously reportedCARBWARE values for the same period (1.54 Mt yr-1, ICF/Byrne Ó Cléirigh report 2004). Assuming abusiness-as-usual scenario, it is estimated that the contribution of Article 3.3 forests for this period mayaccount for ~ 20% of the required reduction in national emissions for Ireland to meet its Kyoto target. TheCARBWARE model is constantly being improved as new research information and national inventorydata become available.
Although these results are useful for providing a baseline for the carbon sequestration potential of thedominant forest species in Ireland, more information on C stocks and fluxes for different soil types andassociated species is required. Furthermore, the potential for integrating the work reported here as well asfuture work with the ongoing National Forest Inventory, in order to improve the national C accountingsystem, should be explored and implemented.
More work is required to facilitate the development of comprehensive C balance models that can beused to simulate the effect of stand age, disturbance and climate change scenarios on forest C fluxes. Thedevelopment of these models would be aimed at end users, such as forest managers and policy makers,to aid in management decisions, reporting procedures to the UNFCCC and climate change riskassessments. Beyond changes associated with stand age, there is a need to incorporate an analysis of theeffects of disturbances, particularly those related to management practices (e.g. thinning) and land-usechange, such as the transition from grassland to forest.
v
Achoimre Fheidhmeannach
Faoi théarmaí a aontaíodh de réir Phrótacal Kyoto, is féidir leithlisiú carbóin ag foraoisí a úsáid chunastuithe de ghás ceaptha teasa a chúiteamh. I gcomhthéacs na hÉireann, is é an leithlisiú carbóin atáincháilithe chun críche cloí le Kyoto ná gníomhaíochtaí coilltithe ó 1990. Ba í príomhchuspóirthionscadal CARBiFOR ná sonraí a chur ar fáil le leibhéal an chúitimh den sórt sin a chinntiú. Chuir sésonraí ar fáil faoi stoic charbóin (C) agus rátaí leithlisithe, a mhaireann thar thimthriall iomlán saoil anphríomhchineáil fhoraoise in Éirinn, faoi choinne tuairiscithe náisiúnta.
Bunaithe ar fhardal, comhathraitheas guairneáin agus modhanna fiseolaíochta eile, measadh gurbh égnáthráta leithlisithe carbóin thar thimthriall iomlán de chróinisheicheamh áirithe (clampaí 10 go 50bliain) ná 4 go dtí 8 t C ha-1 yr-1. Tá an luach seo níos airde ná an meánmheastachán a tuairiscíodh roimheseo de 3.36 t C ha-1 yr-1 (Kilbride et al. 1999). Bhí an meánráta leithlisithe ní b’airde a tuairiscíodh sastaidéar seo le cur síos d’úsáid samhlacha bithmhaise níos fearr, go háirithe do chlampaí níos óige desprús Sitceach. Is féidir le hithir fhliuch mhianra bheith ina ndoirteal substaintiúil carbóin de 0.05 go 1 tC ha-1 yr-1. Bíodh sin mar atá, is féidir le hathruithe i stoic charbóin ithreach a bheith níos deacra athomhas in ithir an-orgánach, mar mhóin, mar gheall ar an leibhéal ard carbóin sa chúlra san ithir féin.
Tá úsáid bainte as an tionscadal CARBiFOR anois leis an tsamhail CARBWARE a fheabhsú lehathruithe stoic C i bhforaoisí náisiúnta a thuairisciú. Is ionann na rátaí bliantúla measta leithlisithe Cd’fhoraoisí na hÉireann ná 1.56 go 2.39 Mt CO2 yr-1 don chéad tréimhse thiomantais 2008-2012 (agglacadh leis go bhfuil ráta bliantúil coilltithe de 14000 heicteár ann). Tá sé seo níos airde ná na luachaCARBWARE a tuairiscíodh roimhe seo don tréimhse chéanna (1.54 Mt yr-1, ICF/Byrne Ó Cléirigh -tuairisc 2004). Ag glacadh leis nach dtarlóidh mórathrú ar bith, meastar gurb ionann foraoisí Alt 3.3 ná20% den laghdú ar astuithe a bheadh de dhíth le sprioc na hÉireann faoi Kyoto a bhaint amach. Tá múnlaCARBWARE á fheabhsú go leanúnach de réir mar a chuirtear níos mó faisnéise agus sonraí fardailnáisiúnta ar fáil.
Cé go bhfuil na torthaí seo úsáideach sa dóigh is go gcuireann siad bunlíne ar fáil faoi acmhainnleithlisithe carbóin na príomhspéiceas foraoise in Éirinn, tá níos mó faisnéise de dhíth ar stoic agus arfhloisc charbóin do chineálacha difriúla ithreach agus na speicis a bhaineann leo. Lena chois sin, ba chóirna féidearthachtaí atá ann a fhiosrú agus a chur i bhfeidhm leis an obair a thuairiscítear anseo agus obairsan am le teacht a chomhlánú leis an Fhardal leanúnach Náisiúnta Foraoise, d’fhonn córas cuntasaíochtanáisiúnta carbóin a fheabhsú.
Tá tuilleadh oibre de dhíth chun forbairt samhlacha cuimsitheacha de chothramaíocht charbóin aéascú, samhlacha arbh fhéidir a úsáid le héifeachtaí aois an chlampa, cur isteach agus cásanna athraitheaeráide ar fhloscanna carbóin fhoraoise a ionsamhlú. Bheadh forbairt na samhlacha seo bunaithe arúsáideoirí deiridh, leithéidí bainisteoirí foraoise agus lucht déanta polasaithe, le cuidiú leo ina gcinntíbainistíochta, modhanna oibre tuairiscithe leis an UNFCCC agus le measúnuithe riosca athraithe aeráide.Taobh amuigh d’athruithe a bhaineann le haois an chlampa, tá gá le hanailís ar éifeachtaí cur isteach aionchorprú, go háirithe iad siúd a bhaineann le nósanna bainistíochta agus athrú ar úsáid talaimh (m.sh.caolú), amhail an t-athrú ó thalamh féaraigh go foraois.
vi

a annum
ABEF above-ground biomass expansion factor
BEF biomass expansion factor
cm centimetre (10-2 m)
C Carbon
CAI current annual increment
CF carbon fraction
COP Conference of the Parties
D basic wood density
Da above-ground annual litter fall
Db below-ground detritus
d day
dbh diameter at breast height (1.3 m)
F-disturb disturbance related-changes
GHG green house gas
GPP gross primary productivity (or forest photosynthesis)
h height
ha hectare
IPCC International Panel and Climate Change
LULUCF Land-Use, Land-Use Change and Forestry
MDV mean diurnal variation
m metre
mg milligram (10-3 g)
NBP net biome productivity
NEP net ecosystem productivity
NPP net primary productivity
ppmv parts per million by volume
Pg Petagram (1015 g)
r2 coefficient of determination
R respiration
RH heterotrophic respiration
RA autotrophic respitation
RTOT total soil respiration
R:S root to shoot ratio
SEE standard error of estimate
SOM soil organic matter
TBCA total below-ground carbon allocation
Tg Teragram (1012 g equivalent to a ton (t))
UNFCCC United Nations Framework Convention on Climate Change
w/v weigh to volume
w/w weight to weight
y year
YC yield class (index representing potential maximum mean annual increment)
∆AGB annual change in above-ground dead plant material
∆B annual change in living biomass
∆C change in carbon stock
∆e ecosystem isotope discrimination
‰ parts per thousand
δ13C 13C isotope discrimination relative to 14C
vii
List of abbreviations and terms

viii
CLIMATE CHANGE AND POLICY
Weather and climate are intimately linked to life onEarth. They are essential for food production andhealth as well as being closely linked to ecosystemfunctioning and sustainability, infrastructure, andproperty. Many consider the prospect of human-induced climate change to be one of the foremostenvironmental issues facing the Earth. There isgrowing scientific evidence that human activitiesare altering the climate (IPCC 2001) and this hasbeen attributed to increasing atmospheric levels ofthe so-called greenhouse gases (GHG) because oftheir ability to absorb and re-emit infrared radiationand so raise the temperature near the Earth’ssurface. The principal greenhouse gases are carbondioxide (CO2), methane (CH4) and nitrous oxide(N2O), and since 1750 their atmosphericconcentrations have increased by 31, 151 and 17%respectively. About 75% of human-induced CO2emissions are derived from fossil fuel burning withthe remainder due to land-use change, particularlydeforestation. CH4 is mainly produced in anaerobicenvironments such as wetland soils, rice paddies,landfills and the ruminant gut. The principalemitters of N2O are agricultural soils, cattle feedlots and the chemical industry. A properunderstanding of the cycling of greenhouse gases atglobal, regional and national level is a vitalprerequisite to attempts to mitigate, respond to andpredict the effects of climate change.
The United Nations Framework Convention onClimate Change (UNFCCC), agreed at the EarthSummit in Rio de Janeiro in 1992, was the firstmajor attempt to deal with climate change. While itdid not set targets for the reduction of greenhousegas emissions, Parties to it (including Ireland) arerequired to develop, publish, update and makeavailable national inventories of GHG emission bysources and removals by sinks. Forests are one
sector for which an inventory is required. This wasfollowed in 1997 by the Kyoto Protocol. Its mainfeatures are as follows:• 1990 is the base year against which all
emission reductions are calculated.• Developed countries (so-called Annex I)
committed to reduce annual GHG emissions to5.2% below 1990 levels by the firstcommitment period of 2008-2012.
• The European Union committed itself to areduction of 8%. This burden is shared betweenmember states and under this agreementIreland is committed to limiting its GHGemissions to 13% above 1990 levels by 2008-2012.
• The Protocol could only enter into force whenratified by at least 55% of Annex I countries,which cumulatively represent at least 55% ofglobal GHG emissions.
• The Protocol made provision for the use ofcarbon (C) sequestration by land-use, land-usechange and forestry (LULUCF) as a means tooffset GHG emissions.
The principal articles of the Kyoto Protocol thatrefer to forestry are 3.3 and 3.4. Article 3.3 refers tonet changes in greenhouse gas emissions bysources and removals by sinks resulting from directhuman-induced afforestation, reforestation anddeforestation which have taken place since 1990;Article 3.4 refers to additional human-inducedactivities in the agriculture, land-use change andforestry sectors. The rules for the implementationof the Kyoto Protocol were agreed at the SeventhConference of the Parties (COP7) at Marrakesh inNovember 2001. Under this agreement, there is nolimit to the amount of credits a Party may accruefrom Article 3.3 while limits have been placed onthe amount of credits which can be obtained fromforest management under Article 3.4; for Irelandthis limit is set at 50,000 t C yr-1 during the first
Carbon sequestration and Irish forest ecosystems 1
Chapter 1
INTRODUCTION
Kenneth A. Byrne and Kevin G. Black
commitment period, i.e. 2008-2012. Furthermoreall developed countries are required to account forC stock changes in:• above-ground biomass, • below-ground biomass, • litter, • deadwood and • soil organic carbon.
THE DYNAMICS OF FORESTCARBON STORES
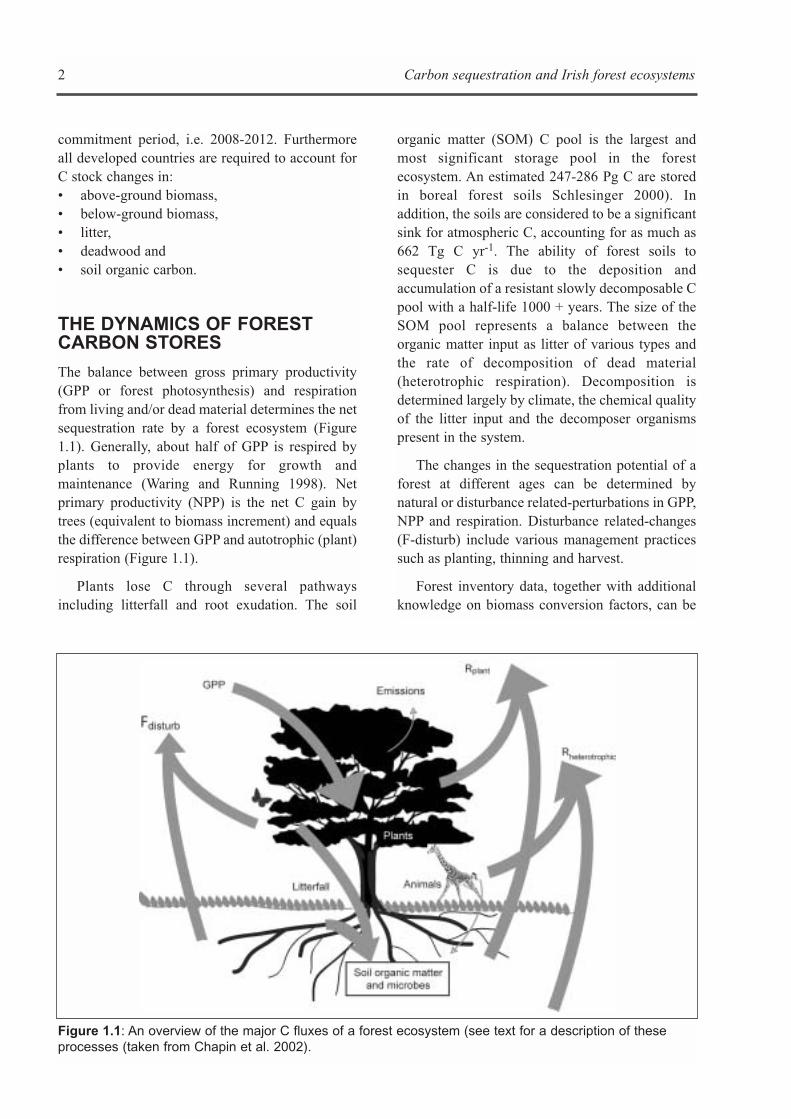
The balance between gross primary productivity(GPP or forest photosynthesis) and respirationfrom living and/or dead material determines the netsequestration rate by a forest ecosystem (Figure1.1). Generally, about half of GPP is respired byplants to provide energy for growth andmaintenance (Waring and Running 1998). Netprimary productivity (NPP) is the net C gain bytrees (equivalent to biomass increment) and equalsthe difference between GPP and autotrophic (plant)respiration (Figure 1.1).
Plants lose C through several pathwaysincluding litterfall and root exudation. The soil
organic matter (SOM) C pool is the largest andmost significant storage pool in the forestecosystem. An estimated 247-286 Pg C are storedin boreal forest soils Schlesinger 2000). Inaddition, the soils are considered to be a significantsink for atmospheric C, accounting for as much as662 Tg C yr-1. The ability of forest soils tosequester C is due to the deposition andaccumulation of a resistant slowly decomposable Cpool with a half-life 1000 + years. The size of theSOM pool represents a balance between theorganic matter input as litter of various types andthe rate of decomposition of dead material(heterotrophic respiration). Decomposition isdetermined largely by climate, the chemical qualityof the litter input and the decomposer organismspresent in the system.
The changes in the sequestration potential of aforest at different ages can be determined bynatural or disturbance related-perturbations in GPP,NPP and respiration. Disturbance related-changes(F-disturb) include various management practicessuch as planting, thinning and harvest.
Forest inventory data, together with additionalknowledge on biomass conversion factors, can be
2 Carbon sequestration and Irish forest ecosystems
Figure 1.1: An overview of the major C fluxes of a forest ecosystem (see text for a description of theseprocesses (taken from Chapin et al. 2002).
used to estimate NPP and this forms the frameworkfor estimating C sequestration rates for nationalreporting. However, additional information onrespiratory, soil stock changes and disturbancerelated changes are required to compile anecosystem C sequestration balance. The innovativeapproach adopted by CARBiFOR was to assess Csequestration rates using both inventory andecosystem-based methodologies.
DEVELOPMENT OF A CARBONACCOUNTING SYSTEM
Estimation of the extent to which forests sequesterC in the mid to long term is hindered by a highdegree of spatial heterogeneity and temporalvariability. Therefore, carbon accountingprocedures rely heavily on the establishment ofnational forest inventory programmes, which cancapture the change in C stocks over time. Guidanceon the development of inventories is provided bythe Revised 1996 Intergovernmental Panel onClimate Change Guidelines for NationalGreenhouse Gas Inventories (Houghton et al.1997) and the Intergovernmental Panel on ClimateChange Good Practice Guidance for Land-use,Land-Use Change and Forestry (Penman et al.2003). These guidelines have raised a demand forcountry-specific biomass and growth data, andmeasurements of inputs and losses from forestsoils, which can be used to calculate the potentialof forests to mitigate the anthropogenic increase ofatmospheric CO2 concentrations. It is alsoimportant that these inventory methods, may besuitable for C accounting reports, but thesemethods should be cross-validated using a ‘full Caccounting’ procedure to estimate C flux lossesassociated with disturbance and land-use change,which can not be determined using conventionalbiomass or soil C stock estimates. From a ‘fullcarbon accounting’ perspective, ecosystem fluxmeasurements by eddy covariance (Aubinet et al.2002) can be used to verify, at a stand or localscale, reported changes in carbon stocks byproviding data that can be compared with theactivities, emission factors or default values used tocompile carbon budgets for a particular LULUCFcategory.
AIMS AND OBJECTIVES
The primary objective of the CARBiFOR projectwas to provide data to determine carbon stocks andsequestration rates spanning the entire life cycle ofthe major forest type (i.e. Sitka spruce) in Ireland.The project cluster was designed to provideimproved estimates, based on micrometeorologicaland inventory methods, of above- and below-ground, litter, deadwood and soil carbon stocks,and sequestration rates for first rotation Sitkaspruce stand on wet mineral soils. Each workinggroup had specific objectives and these aredescribed in the succeeding chapters.
The specific aims of the CARBiFOR projectwere:• To account for post 1990 afforestation
activities in terms of the location and quantityof carbon sequestered or emitted for the majorIrish forest type (Article 3.3)
• Provide the basis for estimating thecontribution of the Land-use Change andForestry Sectors to Ireland’s net greenhousegas emissions in the first and subsequentcommitment periods of the Protocol
• Improve the basis of ‘annual’ inventoryreporting for Land-use Change and ForestrySectors by enabling verification of estimatesand establishment of criteria, standards andacceptable confidence bounds
• Collect better information about the carbonstocks in live biomass and litter associated withthe major forest type in Ireland and its CO2sequestration or emission time course.
THE CHRONOSEQUENCE
The core sites representing the Sitka sprucechronosequence (reconstructed historical agedistribution) were located in different Coillteforests in the Portlaoise area (Table 1.1). Selectedstands (9 to 45 year old trees) are representative ofthe typical yield class (18-24) for Sitka sprucegrowing on wet mineral soils in Ireland (Table 1.2).An additional 14 year old-stand, with a yield classof 24 was used for eddy covariance measurementsand validation of inventory-based estimates. Agrassland site was also selected to represent a non-
Carbon sequestration and Irish forest ecosystems 3
forested site, to assess changes in C sequestrationassociated with land-use change.
Additional sites were selected for individualaspects of the project and these are highlighted inthe working group chapters. A grassland site (G0)was also selected to represent an non-forestedstand, to assess changes in C sequestrationassociated with land-use change.
Site D14 was selected as the main site, where allmeasurements were made and ecosystem modelswere parameterised with measured values.Measurements at this site included eddycovariance, inventory surveys, soil C, soilrespiration, litterfall, biomass data and isotopetracer studies.
The soils in these sites are wet mineral gleys(Table 1.3), with a clay content of ca. 30-50%,
4 Carbon sequestration and Irish forest ecosystems
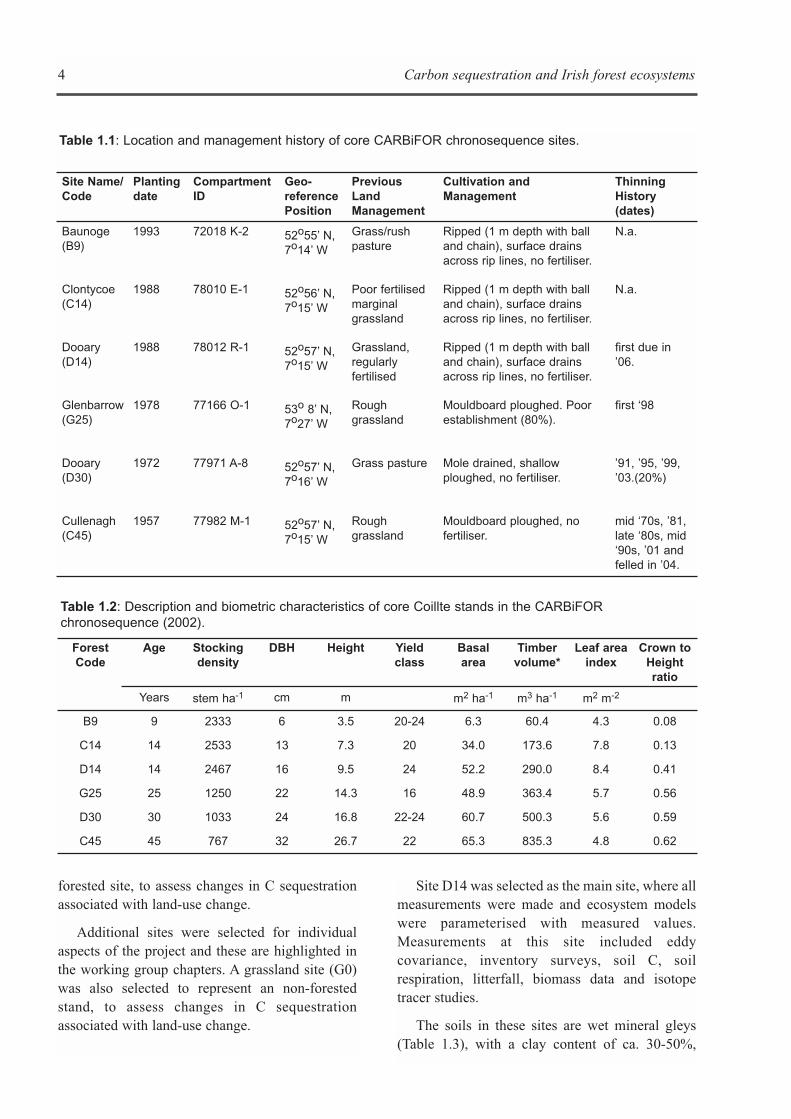
Table 1.2: Description and biometric characteristics of core Coillte stands in the CARBiFORchronosequence (2002).
ForestCode
Age Stockingdensity
DBH Height Yieldclass
Basalarea
Timbervolume*
Leaf areaindex
Crown toHeightratio
Years stem ha-1 cm m m2 ha-1 m3 ha-1 m2 m-2
B9 9 2333 6 3.5 20-24 6.3 60.4 4.3 0.08
C14 14 2533 13 7.3 20 34.0 173.6 7.8 0.13
D14 14 2467 16 9.5 24 52.2 290.0 8.4 0.41
G25 25 1250 22 14.3 16 48.9 363.4 5.7 0.56
D30 30 1033 24 16.8 22-24 60.7 500.3 5.6 0.59
C45 45 767 32 26.7 22 65.3 835.3 4.8 0.62
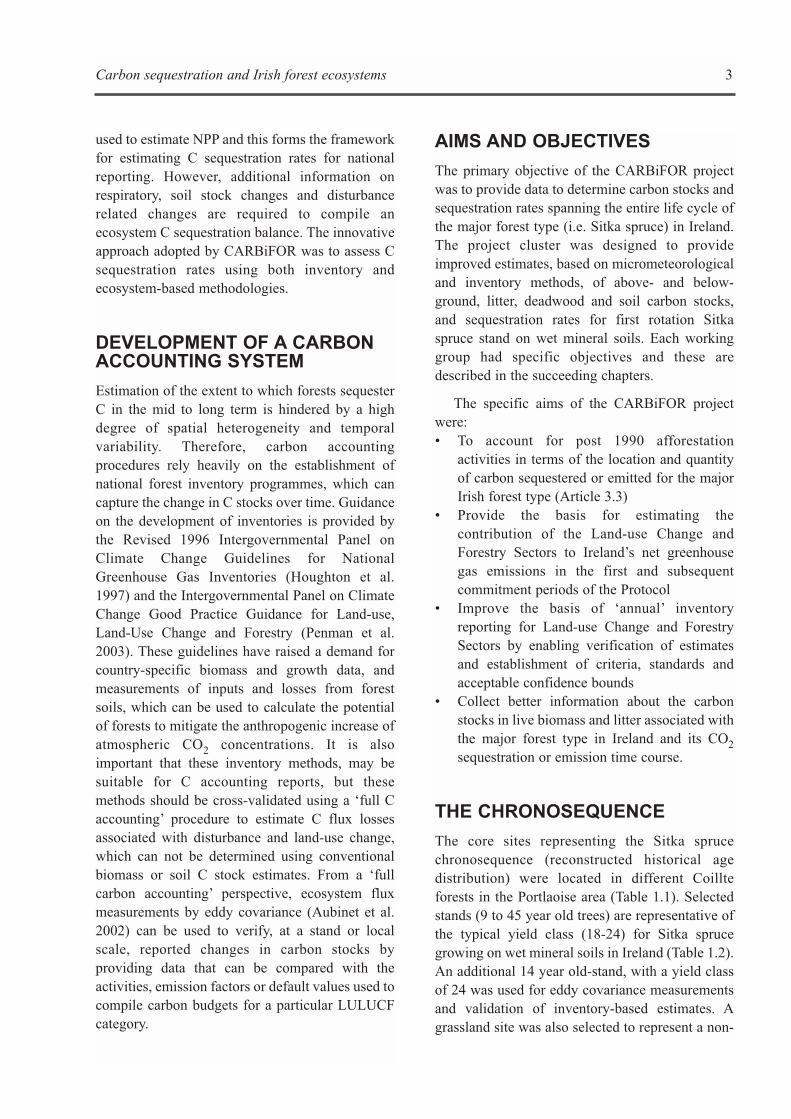
Table 1.1: Location and management history of core CARBiFOR chronosequence sites.
Site Name/Code
Planting date
CompartmentID
Geo-referencePosition
Previous LandManagement
Cultivation andManagement
ThinningHistory (dates)
Baunoge (B9)
1993 72018 K-2 52o55’ N, 7o14’ W
Grass/rushpasture
Ripped (1 m depth with balland chain), surface drainsacross rip lines, no fertiliser.
N.a.
Clontycoe (C14)
1988 78010 E-1 52o56’ N, 7o15’ W
Poor fertilisedmarginalgrassland
Ripped (1 m depth with balland chain), surface drainsacross rip lines, no fertiliser.
N.a.
Dooary (D14)
1988 78012 R-1 52o57’ N, 7o15’ W
Grassland,regularlyfertilised
Ripped (1 m depth with balland chain), surface drainsacross rip lines, no fertiliser.
first due in’06.
Glenbarrow (G25)
1978 77166 O-1 53o 8’ N, 7o27’ W
Roughgrassland
Mouldboard ploughed. Poorestablishment (80%).
first ‘98
Dooary (D30)
1972 77971 A-8 52o57’ N, 7o16’ W
Grass pasture Mole drained, shallowploughed, no fertiliser.
’91, ’95, ’99,’03.(20%)
Cullenagh (C45)
1957 77982 M-1 52o57’ N, 7o15’ W
Roughgrassland
Mouldboard ploughed, nofertiliser.
mid ‘70s, ’81,late ‘80s, mid‘90s, ’01 andfelled in ’04.
except for the C45 site where there was a moresandy soil. An additional 47 year old stand, with ahigher clay content, was selected at the Dooaryforest (D47) for C analysis. However, the stand wasfelled before any biometric measurements wererecorded.
THE CARBIFOR TEAM
The CARBiFOR project (Carbon Sequestration inIrish Forest Ecosystems, October 2001 – June2005) was co-ordinated by Prof. Edward P. Farrelland organised into four working groups as follows:
Working Group 1: Ecosystem Processes
Prof. Bruce Osborne, Department of Botany, UCD
Dr Kevin Black, Department of Botany, UCD
Collaborators:
Dr Deborah Hemming, Weisman Institute, Israel;and CarboEurope, C isotope studies
Prof. M Jones, Trinity College, Grassland andagricultural GHG fluxes
Working Group 2: Soil Carbon Fluxes
Prof. Edward Farrell, Forest Ecosystem ResearchGroup, Department of Environmental ResourceManagement, UCD
Dr Kenneth Byrne, Forest Ecosystem ResearchGroup, Department of Environmental Resource
Management, UCD (now at University CollegeCork)
Dr Gustavo Saiz, Forest Ecosystem ResearchGroup, Department of Environmental ResourceManagement, UCD
Working Group 3: Soil Carbon Stocks
Prof. Tom Bolger, Department of Zoology, UCD
Brian Reidy, Department of Zoology, UCD
Dr Olaf Schmidt, Department of EnvironmentalResource Management, UCD
Dr Jens Dyckmans, Department of EnvironmentalResource Management, UCD
Working Group 4: Biomass Carbon Stocksand Expansion Factors
Prof. Maarten Nieuwenhuis, Department of CropScience, Horticulture and Forestry, UCD
Dr Brian Tobin, Department of Crop Science,Horticulture and Forestry, UCD
Prof. John Gardiner, Department of Crop Science,Horticulture and Forestry, UCD
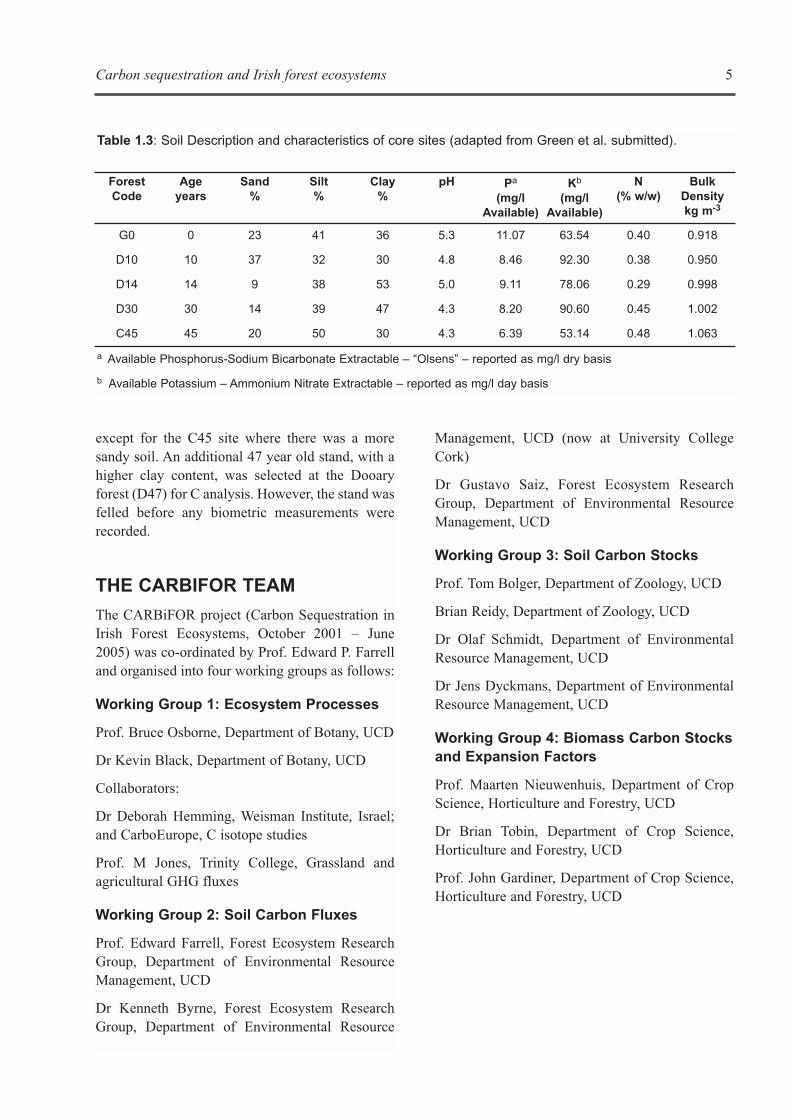
Table 1.3: Soil Description and characteristics of core sites (adapted from Green et al. submitted).
ForestCode
Ageyears
Sand%
Silt %
Clay%
pH Pa
(mg/lAvailable)
Kb
(mg/lAvailable)
N(% w/w)
BulkDensitykg m-3
G0 0 23 41 36 5.3 11.07 63.54 0.40 0.918
D10 10 37 32 30 4.8 8.46 92.30 0.38 0.950
D14 14 9 38 53 5.0 9.11 78.06 0.29 0.998
D30 30 14 39 47 4.3 8.20 90.60 0.45 1.002
C45 45 20 50 30 4.3 6.39 53.14 0.48 1.063
a Available Phosphorus-Sodium Bicarbonate Extractable – “Olsens” – reported as mg/l dry basis
b Available Potassium – Ammonium Nitrate Extractable – reported as mg/l day basis
Carbon sequestration and Irish forest ecosystems 5

6 Carbon sequestration and Irish forest ecosystems
Carbon sequestration and Irish forest ecosystems 7
OBJECTIVES
The aim of Working Group 2 was the study of soilrespiration over the Sitka spruce (Picea sitchensis(Bong.) Carr.) chronosequence in Co Laois (seeTables 1.1 and 1.2). The research focused on thequantification and understanding of the factors thatdrive C emissions from soils, which are essentialfor the understanding of forest ecosystem Cbalance as a whole.
The specific objectives of the study were to:• Investigate the influence of climatic variables
on soil respiration;• Investigate the effect of stand age on soil
respiration;• Estimate mean annual soil respiration rates for
each stand age;• Estimate fine root biomass;• Estimate of heterotrophic and autotrophic soil
respiration rates;• Quantify the temporal variability of soil
respiration;• Quantify the spatial variability of soil
respiration.
Supplementary objectives were: • Provision of data to Working Group 1 for the
construction of empirical and mechanisticmodels to be used to derive net ecosystemproductivity, net primary productivity andgross primary productivity.
• Provision of soil respiration and fine rootbiomass data to Working Group 3 forcalibration of the CENTURY model.
RATIONALE FOR THE STUDY
An ecosystem acts as a C source when grossprimary productivity surpasses autotrophic andheterotrophic respiration (see Figure 1.1; Klopatek
2002). Soil respiration is the primary path by whichCO2 fixed by land plants returns to the atmosphere(Raich and Schlesinger 1992, Rustad et al. 2000,Schlesinger and Andrews 2000). In forests, totalecosystem respiration (i.e. loss of CO2) tends to bedominated by soil respiration (Valentini et al.2000).
The production of CO2 in the soil profile isprimarily the result of autotrophic respiration bylive roots (allowing their growth and maintenance),associated mycorrhizae, and heterotrophicrespiration by microbes oxidizing plant detritus,root exudates and humified organic matter (Booneet al. 1998, Buchmann 2000, Hanson et al. 2000).
The factors that control heterotrophic andautotrophic respiration determine the contributionof each component to the total soil respiration.Temperature, together with soil moisture content, isthe main factor controlling soil respiration (Raichand Schlesinger 1992, Kirschbaum 1995, Davidsonet al. 1998, Fang and Moncrieff 2001). Moderate,low or high soil water contents may limit soilrespiration. These environmental factors affect rootrespiration and soil organic matter decompositiondifferently. Research has shown that thecontribution of autotrophic and heterotrophicrespiration to total soil respiration varies seasonally(Hanson et al. 2000).
In addition to temperature and moisture, rootrespiration is strongly influenced by plantphotosynthetic activity (Högberg et al. 2001,Kuzyakov and Cheng 2001). This light-dependantprocess may co-vary with temperature, which insome field studies may have been the factorresponsible for the different temperature sensitivityvalues reported for autotrophic and heterotrophicrespiration (Bååth and Wallander 2003). Roots notonly make a direct contribution to heterotrophicrespiration, but also affect the respiratory activity
Chapter 2
SOIL CARBON FLUXES
Gustavo Saiz, Kenneth A. Byrne and Edward P. Farrell
of heterotrophic organisms by exuding C-richsubstances and by altering the soil physical andchemical environment (Kuzyakov and Cheng2001).
An important area of research is aimed atfocusing on the impact of forest age on soil CO2efflux (Irvine and Law 2002). Stand soil respirationis dependant upon both the amount of fine rootsand quality of soil C pools. Soil respiration can beexpected to differ according to the structure andage of the stand (Klopatek 2002). It is thereforeimportant to understand the processes thatdetermine total soil respiration in order to predicthow each component may react to alterations of thesoil environment (Kirschbaum 1995, Boone et al.1998, Ohashi et al. 2000, Fierer et al. 2003).
High spatial and temporal variation of soilrespiration has been reported for a number ofecosystems (Thierron and Laudelout 1996,Davidson et al. 1998, Epron et al. 1999b). Anunderstanding of this variability is a vitalcomponent of efforts to understand and quantifythe C balance in forest ecosystems.
METHODS
Site Characteristics
The selected study sites were first rotation Sitkaspruce plantations established on formerunmanaged grassland (afforestation sites). Thestands were characterised by a nearly absoluteabsence of understory or herbaceous vegetationafter reaching canopy closure. The stands made upa chronosequence ranging from 10 to 47 years(Table 2.1), with the oldest stand being mature for
harvest. Three sites per stand age were used, givingan overall total of twelve sites. All the stands werewithin 5 km of each other.
For each stand age, one site was used to studytotal and heterotrophic soil respiration (hereafterreferred to as core sites). For each stand age twoadditional sites were used to study total respiration(hereafter referred to as reference sites). The coresites were common to all CARBiFOR workinggroups and facilitated collaboration betweenworking groups (Tables 1.1, 1.2 and 1.3). The twoadditional sites per stand age had the samecharacteristics for forest management, tree age, soiltype, and tree establishment as their core site.
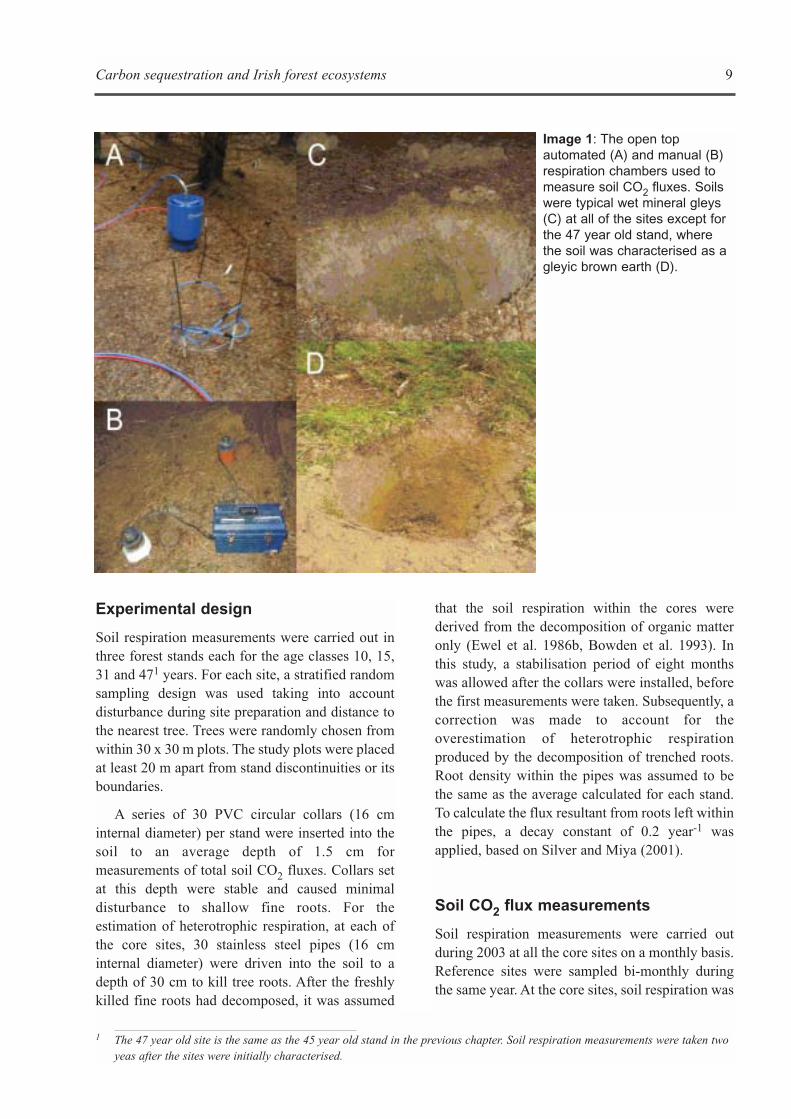
Soil types were classified as low humic(mineral) gleys in the 10, 15, and 31 year oldstands, and as gleyic brown earth in the 47 year oldstands, which seemed to have better drainage dueto their location on sloping terrain (Image 1).
The younger sites (10 and 15 years old stands)had been established along ripped lines 1 m deepand 2 m apart. There were surface drains across theripped lines at 50 m intervals. Prior to theestablishment of the 31 and 47 year old stands thesites were ploughed at 1.7 m intervals, followingthe contour lines of the slope. In these two olderplantations, 3-4 regular thinnings had already takenplace (Table 1.1). Neither fertilisation nor drainageworks had been carried out since tree establishmentin any of the stands. All the plots selected for thepresent study had reached canopy closure. Since nothinning had been carried out in either the 10 or 15year old plantations, their stand densities werehigher when compared to the older stands (Table2.1).
8 Carbon sequestration and Irish forest ecosystems
Table 2.1: Characteristics of the Sitka spruce stands over which measurement of total and heterotrophicsoil respiration took place (core sites). pH, nitrogen and phosphorous (pooled samples) measured for A1soil horizon (n=15).
Site Age (years)
StemDensity
(trees ha-1)
Basal Area(m2 ha-1)
YieldClass
pH Nitrogen(g kg-1)
Phosphorous (mg l-1
available)
Dooary 1 10 2300 5.3 16-20 4.52 0.627 11.2
Dooary 2 15 2366 34.4 20-24 4.77 0.418 11.4
Dooary 3 31 1083 54.0 16-20 4.07 0.599 9.4
Cullenagh 47 730 57.0 16-20 4.01 nd 8.8
Experimental design
Soil respiration measurements were carried out inthree forest stands each for the age classes 10, 15,31 and 471 years. For each site, a stratified randomsampling design was used taking into accountdisturbance during site preparation and distance tothe nearest tree. Trees were randomly chosen fromwithin 30 x 30 m plots. The study plots were placedat least 20 m apart from stand discontinuities or itsboundaries.
A series of 30 PVC circular collars (16 cminternal diameter) per stand were inserted into thesoil to an average depth of 1.5 cm formeasurements of total soil CO2 fluxes. Collars setat this depth were stable and caused minimaldisturbance to shallow fine roots. For theestimation of heterotrophic respiration, at each ofthe core sites, 30 stainless steel pipes (16 cminternal diameter) were driven into the soil to adepth of 30 cm to kill tree roots. After the freshlykilled fine roots had decomposed, it was assumed
that the soil respiration within the cores werederived from the decomposition of organic matteronly (Ewel et al. 1986b, Bowden et al. 1993). Inthis study, a stabilisation period of eight monthswas allowed after the collars were installed, beforethe first measurements were taken. Subsequently, acorrection was made to account for theoverestimation of heterotrophic respirationproduced by the decomposition of trenched roots.Root density within the pipes was assumed to bethe same as the average calculated for each stand.To calculate the flux resultant from roots left withinthe pipes, a decay constant of 0.2 year-1 wasapplied, based on Silver and Miya (2001).
Soil CO2 flux measurements
Soil respiration measurements were carried outduring 2003 at all the core sites on a monthly basis.Reference sites were sampled bi-monthly duringthe same year. At the core sites, soil respiration was
Carbon sequestration and Irish forest ecosystems 9
Image 1: The open topautomated (A) and manual (B)respiration chambers used tomeasure soil CO2 fluxes. Soilswere typical wet mineral gleys(C) at all of the sites except forthe 47 year old stand, wherethe soil was characterised as agleyic brown earth (D).
1 The 47 year old site is the same as the 45 year old stand in the previous chapter. Soil respiration measurements were taken twoyeas after the sites were initially characterised.
measured at each paired sampling point using twoportable infrared gas analysers connected to soilrespiration chambers having a headspace volumeof 2250 cm3 (EGM-4 and SRC-1; PP Systems,Hitchin, UK). The system was calibrated beforeeach sampling day against CO2 with a nominalconcentration of 409 ppmv. Measurements of total(RTOT) and heterotrophic (RH) respiration werecarried out simultaneously.
Whilst the importance of diurnal variation insoil CO2 efflux has been recognised in agriculturalresearch (Parkin and Kaspari 2003), this variationis less important in heavily shaded forested areas(Davidson et al. 2000). Furthermore, it has beenpreviously suggested that there are no significantdiurnal changes in soil respiration under closedcanopies (Epron et al. 1999a). In order to minimisethe influence of any diurnal variation in soilrespiration, measurements were made between 10am and 4 pm. On two occasions, 24 hoursmeasurements were carried out. The averagevalues obtained for the hours 10 am to 4 pm did notdiffer significantly from the other 18 hours periodin both days where the 24 hours measurementswere taken.
Continuous total soil respiration was alsomeasured, using an automated open-top chambersystem based on the design of Fang and Moncrieff(1998), with a parallel 4-way solenoid controlsystem and data logger (Goulden and Crill 1997).Continuous chamber respiration measurementswere taken every half hour for 120 days to assessthe sampling resolution of the soil respirationmodel (Black et al. 2005).
Soil temperature and moisturemeasurements
Soil temperature at 2, 6 and 10 cm depths wasmeasured adjacent to each collar (220 Ktemperature meter, Jenway, Essex, UK). Inaddition, soil temperature was continuouslymonitored in the 15 year old stand using soiltemperature probes that were vertically insertedinto the soil to different depths, from ground levelto 30 cm (Campbell Scientific Ltd., Shepshed,UK). The system was set up to record 30 minuteaverage temperatures. Site-specific temperatures
for each of the core and reference sites wereestimated by means of linear regressionsperformed between the temperature taken at thetime of measurements in the different stands andthe ones simultaneously recorded by the automaticsystem. Given the physical proximity among all thestands, regressions were highly correlated (data notshown).
Soil moisture content in the top 6 cm of everycollar was determined using a moisture probe(ThetaProbe ML2x, Delta-T Devices, Cambridge,UK). A soil-specific calibration of the instrumentbased on the relationship between the measureddielectric constant of the soil and its volumetricmoisture content was performed to theoreticallyachieve an accuracy of ±1% (Delta-T Devices soil-specific calibration protocol).
Relationships between soiltemperature and soil respiration
A two parametric exponential function was used todescribe the relationships between soil CO2 fluxesand soil temperature. The formula is:
y = a e b T
where y is the measured soil CO2 efflux rate, Tis the measured soil temperature, a and b are thefitted parameters obtained using non-linearregressions with SigmaPlot V.8.02 software.
Q10 is an index used to explain the sensitivity ofsoil respiration to temperature. The Q10 valueswere calculated as:
Q10 = e 10 b (1)
Standard error for Q10 was calculated asQ10· 10· s.e.(b).
Root biomass
In May 2003, between 7 and 15 soil cores per standwere taken using a root auger (4 cm radius) up to adepth of 30 cm. Soil samples were immediatelystored at 4ºC and processed within four days oftheir collection. For this, fine roots were washedand sieved to separate them from soil mineralparticles. Roots were sorted into three diameterclasses (<1 mm, 1-2 mm and 2-5 mm). Finally,
10 Carbon sequestration and Irish forest ecosystems
washed roots were weighed after being oven-driedat 70º for 48 hours to determine fine root biomass.The carbon content and nitrogen concentration ofroots <1 mm were determined in a Vario El-III C/Nanalyzer.
Statistical analysis
Based on results of tests on normal distribution ofrespiration rates or other parameters (Kolmogorov-Smirnov test) either parametric t-test or the non-parametric Mann-Witney test was used to identifydifferences between sites. Correlation analyseswere used to examine relationships between soilrespiration rates and soil temperature and soilmoisture. The SPSS 12.0 software package (SPSSInc., United States) was used for all statisticalanalyses.
RESULTS
Influence of soil temperature and soilwater content on soil respiration
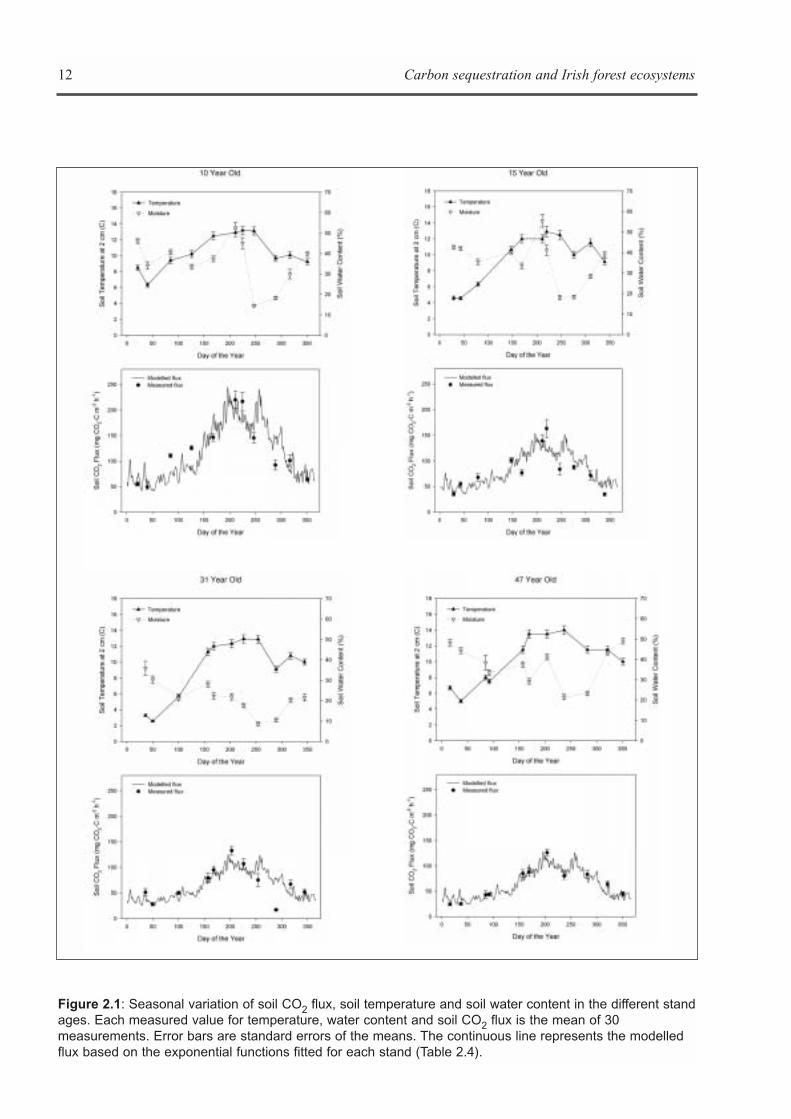
Consistently for all stand ages, maximum soiltemperatures coincided with minimum soil watercontents during the summer (Figure 2.1). Incontrast, minimum soil temperatures occurredwhen soil water contents were highest, except forstands located on a flat terrain (10 and 15 year old),where there was a peak in soil moisture after aperiod of sustained rainfall in late July. Nosignificant differences in mean annual soiltemperature rates taken at a depth of 2 cm werefound among stands (P>0.05). Volumetric soilmoisture contents determined in the top 6 cm of thesoil profiles averaged about 36%, and showed nosignificant differences between three of the fourstands over the course of the year (P>0.05).However, there was an exception with the 31 yearold stand, where soil water content wassignificantly lower in comparison to the rest of thestands. Soil temperature and soil volumetric watercontent were not significantly different withinstands of the same age (P>0.05).
In all stand ages, total soil respiration (RTOT)showed pronounced seasonal variations, whichparalleled changes in soil temperature (Figure 2.1).
RTOT values were at their lowest during winter timewith a minimum CO2 flux rate of 24.3 ± 3.1 mg Cm-2 h-1 measured in the 47 year old stand. Bycontrast, values of soil respiration peaked in lateJuly or early August in all the stands, with themaximum rate recorded of 220.2 ± 16.7 mg C m-2
h-1 in the 10 year old stand. Subsequently, soilrespiration rates followed a steady decreasetowards the end of the year, with the exception ofsites where low soil moisture content during latesummer acted as a limiting factor for soil CO2efflux. In such cases, there was a drop in RTOT,reaching a rate as low as 17.3 ± 2.5 mg C m-2 h-1 atthe 31 year old stand (Figure 2.1). The limitation ofsoil respiration rates due to low values of soilmoisture was obvious in all plantations when thesoil water content approached 20%, and lasted untilthe soil water deficit was replenished by rainfall.
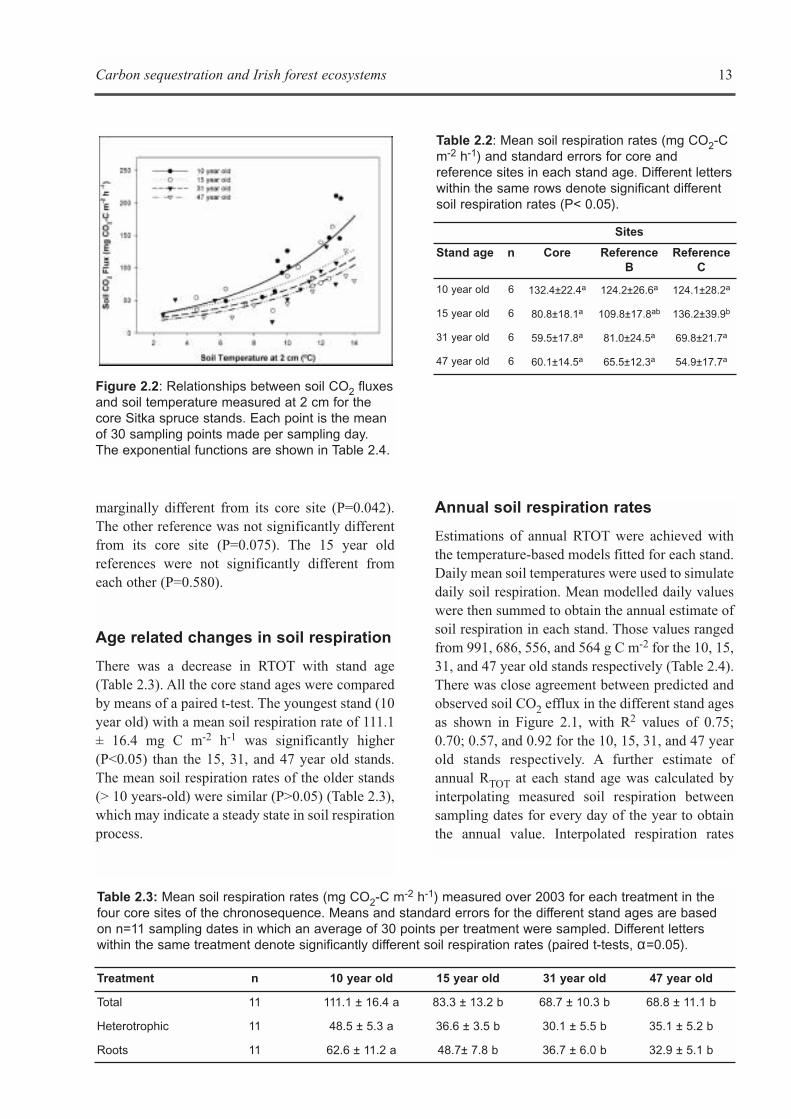
For each stand age, an exponential model wasfitted with soil respiration rates and soiltemperatures at depths of 2, 6 and 10 cm. Thetemperature depth used in the regressions was 2 cmbecause it produced the best fit for the modelsamong all depths (Figure 2.2). Models fitted for thecore sites explained more of the annual variation inthose stands where moisture deficits were minimal(e.g. 10, 15 and 47 year old stands). Q10 basedestimates explained 79% of the annual variation ofRTOT in the 47 year old stand, but only 56% in the31 year old stand (Table 2.4). The estimated Q10values ranged from 3.5 (15 year old) to 4.6 (10 yearold). The average Q10 value was calculated bypooling the core stands together was 3.8. Q10values calculated for 6 and 10 cm depth wereslightly higher and had lower regression fits (datanot shown).
Spatial heterogeneity in similar agedstands
Soil respiration rates measured at the core siteswere compared to the ones obtained at theirreference stand ages by means of paired t-tests(SPSS Inc., USA), (Table 2.2). There were nosignificant differences (P>0.05) among core sitesand their correspondent references in the 10, 31,and 47 year old stands. In the 15 year old stands,while the references sites had higher respirationrates than the core site, only one of them was
Carbon sequestration and Irish forest ecosystems 11
12 Carbon sequestration and Irish forest ecosystems
Figure 2.1: Seasonal variation of soil CO2 flux, soil temperature and soil water content in the different standages. Each measured value for temperature, water content and soil CO2 flux is the mean of 30measurements. Error bars are standard errors of the means. The continuous line represents the modelledflux based on the exponential functions fitted for each stand (Table 2.4).
marginally different from its core site (P=0.042).The other reference was not significantly differentfrom its core site (P=0.075). The 15 year oldreferences were not significantly different fromeach other (P=0.580).
Age related changes in soil respiration
There was a decrease in RTOT with stand age(Table 2.3). All the core stand ages were comparedby means of a paired t-test. The youngest stand (10year old) with a mean soil respiration rate of 111.1± 16.4 mg C m-2 h-1 was significantly higher(P<0.05) than the 15, 31, and 47 year old stands.The mean soil respiration rates of the older stands(> 10 years-old) were similar (P>0.05) (Table 2.3),which may indicate a steady state in soil respirationprocess.
Annual soil respiration rates
Estimations of annual RTOT were achieved withthe temperature-based models fitted for each stand.Daily mean soil temperatures were used to simulatedaily soil respiration. Mean modelled daily valueswere then summed to obtain the annual estimate ofsoil respiration in each stand. Those values rangedfrom 991, 686, 556, and 564 g C m-2 for the 10, 15,31, and 47 year old stands respectively (Table 2.4).There was close agreement between predicted andobserved soil CO2 efflux in the different stand agesas shown in Figure 2.1, with R2 values of 0.75;0.70; 0.57, and 0.92 for the 10, 15, 31, and 47 yearold stands respectively. A further estimate ofannual RTOT at each stand age was calculated byinterpolating measured soil respiration betweensampling dates for every day of the year to obtainthe annual value. Interpolated respiration rates
Carbon sequestration and Irish forest ecosystems 13
Table 2.3: Mean soil respiration rates (mg CO2-C m-2 h-1) measured over 2003 for each treatment in thefour core sites of the chronosequence. Means and standard errors for the different stand ages are basedon n=11 sampling dates in which an average of 30 points per treatment were sampled. Different letterswithin the same treatment denote significantly different soil respiration rates (paired t-tests, α=0.05).
Treatment n 10 year old 15 year old 31 year old 47 year old
Total 11 111.1 ± 16.4 a 83.3 ± 13.2 b 68.7 ± 10.3 b 68.8 ± 11.1 b
Heterotrophic 11 48.5 ± 5.3 a 36.6 ± 3.5 b 30.1 ± 5.5 b 35.1 ± 5.2 b
Roots 11 62.6 ± 11.2 a 48.7± 7.8 b 36.7 ± 6.0 b 32.9 ± 5.1 b
Figure 2.2: Relationships between soil CO2 fluxesand soil temperature measured at 2 cm for thecore Sitka spruce stands. Each point is the meanof 30 sampling points made per sampling day.The exponential functions are shown in Table 2.4.
Table 2.2: Mean soil respiration rates (mg CO2-Cm-2 h-1) and standard errors for core andreference sites in each stand age. Different letterswithin the same rows denote significant differentsoil respiration rates (P< 0.05).
Sites
Stand age n Core Reference B
ReferenceC
10 year old 6 132.4±22.4a 124.2±26.6a 124.1±28.2a
15 year old 6 80.8±18.1a 109.8±17.8ab 136.2±39.9b
31 year old 6 59.5±17.8a 81.0±24.5a 69.8±21.7a
47 year old 6 60.1±14.5a 65.5±12.3a 54.9±17.7a
produced similar results as the modelled ones(Table 2.4). These interpolated annual values were1013, 692, 559, and 577 g C m-2 for the 10, 15, 31,and 47 year old stands respectively (Table 2.4).
Fine root biomass
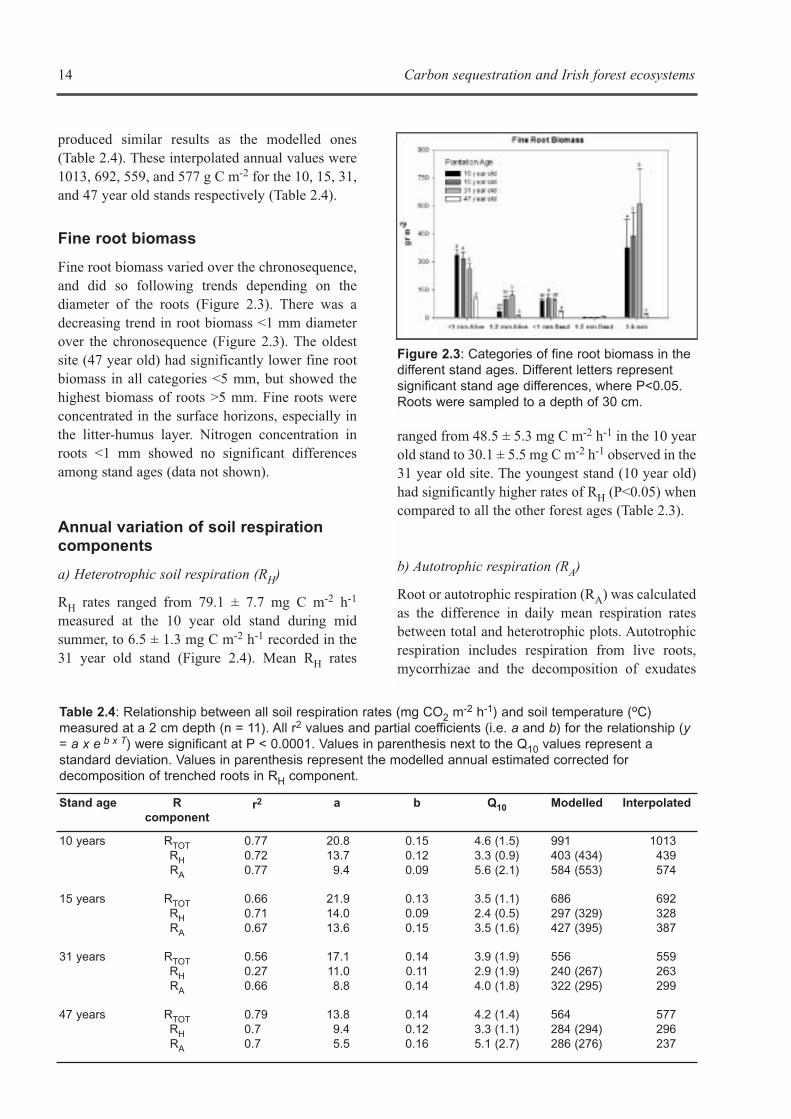
Fine root biomass varied over the chronosequence,and did so following trends depending on thediameter of the roots (Figure 2.3). There was adecreasing trend in root biomass <1 mm diameterover the chronosequence (Figure 2.3). The oldestsite (47 year old) had significantly lower fine rootbiomass in all categories <5 mm, but showed thehighest biomass of roots >5 mm. Fine roots wereconcentrated in the surface horizons, especially inthe litter-humus layer. Nitrogen concentration inroots <1 mm showed no significant differencesamong stand ages (data not shown).
Annual variation of soil respirationcomponents
a) Heterotrophic soil respiration (RH)
RH rates ranged from 79.1 ± 7.7 mg C m-2 h-1
measured at the 10 year old stand during midsummer, to 6.5 ± 1.3 mg C m-2 h-1 recorded in the31 year old stand (Figure 2.4). Mean RH rates
ranged from 48.5 ± 5.3 mg C m-2 h-1 in the 10 yearold stand to 30.1 ± 5.5 mg C m-2 h-1 observed in the31 year old site. The youngest stand (10 year old)had significantly higher rates of RH (P<0.05) whencompared to all the other forest ages (Table 2.3).
b) Autotrophic respiration (RA)
Root or autotrophic respiration (RA) was calculatedas the difference in daily mean respiration ratesbetween total and heterotrophic plots. Autotrophicrespiration includes respiration from live roots,mycorrhizae and the decomposition of exudates
14 Carbon sequestration and Irish forest ecosystems
Table 2.4: Relationship between all soil respiration rates (mg CO2 m-2 h-1) and soil temperature (oC)measured at a 2 cm depth (n = 11). All r2 values and partial coefficients (i.e. a and b) for the relationship (y= a x e b x T) were significant at P < 0.0001. Values in parenthesis next to the Q10 values represent astandard deviation. Values in parenthesis represent the modelled annual estimated corrected fordecomposition of trenched roots in RH component.
Stand age Rcomponent
r2 a b Q10 Modelled Interpolated
10 years RTOTRHRA
0.770.720.77
20.813.7
9.4
0.150.120.09
4.6 (1.5)3.3 (0.9)5.6 (2.1)
991403 (434)584 (553)
1013439574
15 years RTOTRHRA
0.660.710.67
21.914.013.6
0.130.090.15
3.5 (1.1)2.4 (0.5)3.5 (1.6)
686297 (329)427 (395)
692328387
31 years RTOTRHRA
0.560.270.66
17.111.08.8
0.140.110.14
3.9 (1.9)2.9 (1.9)4.0 (1.8)
556 240 (267)322 (295)
559263299
47 years RTOTRHRA
0.790.70.7
13.89.45.5
0.140.120.16
4.2 (1.4)3.3 (1.1)5.1 (2.7)
564284 (294)286 (276)
577296237
Figure 2.3: Categories of fine root biomass in thedifferent stand ages. Different letters representsignificant stand age differences, where P<0.05.Roots were sampled to a depth of 30 cm.
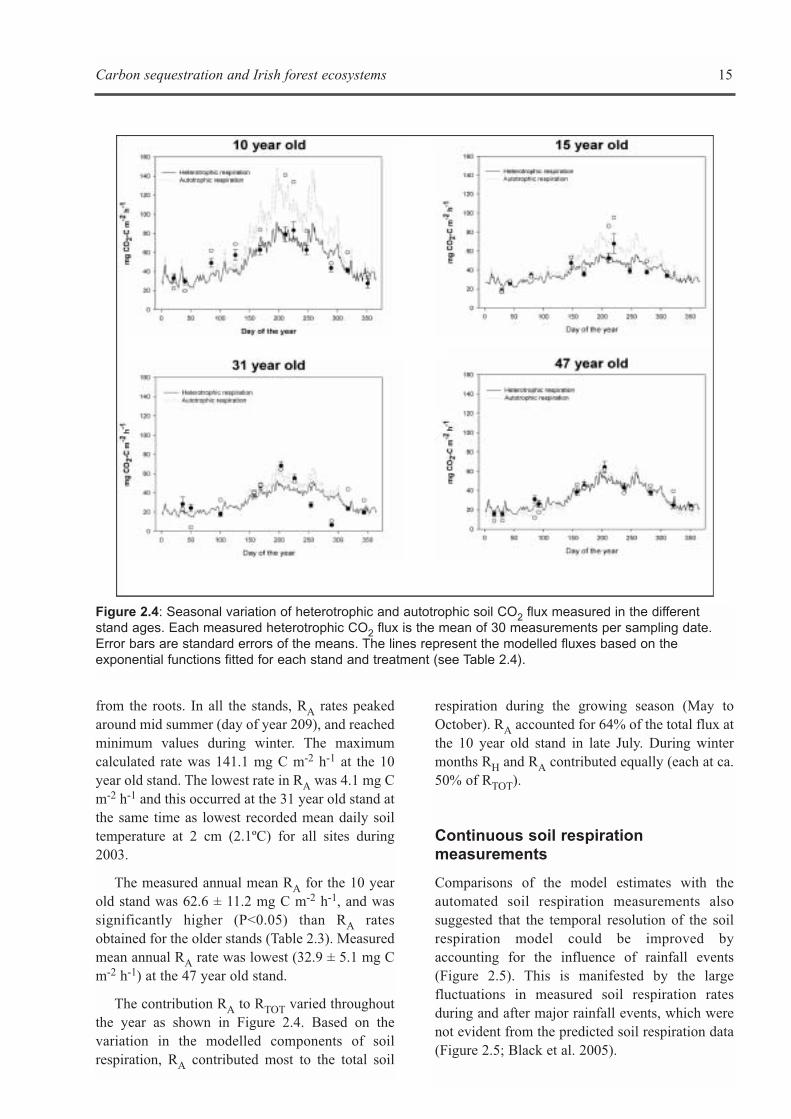
from the roots. In all the stands, RA rates peakedaround mid summer (day of year 209), and reachedminimum values during winter. The maximumcalculated rate was 141.1 mg C m-2 h-1 at the 10year old stand. The lowest rate in RA was 4.1 mg Cm-2 h-1 and this occurred at the 31 year old stand atthe same time as lowest recorded mean daily soiltemperature at 2 cm (2.1ºC) for all sites during2003.
The measured annual mean RA for the 10 yearold stand was 62.6 ± 11.2 mg C m-2 h-1, and wassignificantly higher (P<0.05) than RA ratesobtained for the older stands (Table 2.3). Measuredmean annual RA rate was lowest (32.9 ± 5.1 mg Cm-2 h-1) at the 47 year old stand.
The contribution RA to RTOT varied throughoutthe year as shown in Figure 2.4. Based on thevariation in the modelled components of soilrespiration, RA contributed most to the total soil
respiration during the growing season (May toOctober). RA accounted for 64% of the total flux atthe 10 year old stand in late July. During wintermonths RH and RA contributed equally (each at ca.50% of RTOT).
Continuous soil respirationmeasurements
Comparisons of the model estimates with theautomated soil respiration measurements alsosuggested that the temporal resolution of the soilrespiration model could be improved byaccounting for the influence of rainfall events(Figure 2.5). This is manifested by the largefluctuations in measured soil respiration ratesduring and after major rainfall events, which werenot evident from the predicted soil respiration data(Figure 2.5; Black et al. 2005).
Carbon sequestration and Irish forest ecosystems 15
Figure 2.4: Seasonal variation of heterotrophic and autotrophic soil CO2 flux measured in the differentstand ages. Each measured heterotrophic CO2 flux is the mean of 30 measurements per sampling date.Error bars are standard errors of the means. The lines represent the modelled fluxes based on theexponential functions fitted for each stand and treatment (see Table 2.4).
CONCLUSIONS
The results show that afforestation with Sitkaspruce on former semi-managed grassland leads toa high soil efflux for the first 10 years followed bya decline at canopy closure and maturation. Soilrespiration rates reach steady state in the laterstages prior to felling.
Annual soil respiration rates were modelled bymeans of temperature derived functions. Totalannual soil respiration rates were 991, 686, 556,and 564 g C m-2 for the 10, 15, 31, and 47 year oldstands respectively. Our reported values areconsiderabley higher than those reported for
afforested blanket peats, (Byrne and Farrell 2005),where soil CO2 emissions varied from 170 to 260 gC m-2 for 3 to 39 year old Sitka spruce stands.Clearly the variation in CO2 emissions from forestson different soils requires further investigation.
Autotrophic respiration showed a decreasingtrend with stand age, which is explained by adecrease in fine root biomass <1 mm diameter overthe chronosequence. This difference was notexplained by fine root nitrogen concentrations.Heterotrophic respiration paralleled soil organiccarbon inputs (litter and fine root) over thechronosequence (see Chapter 3). Heterotrophicrespiration decreased with stand age, but slightly
16 Carbon sequestration and Irish forest ecosystems
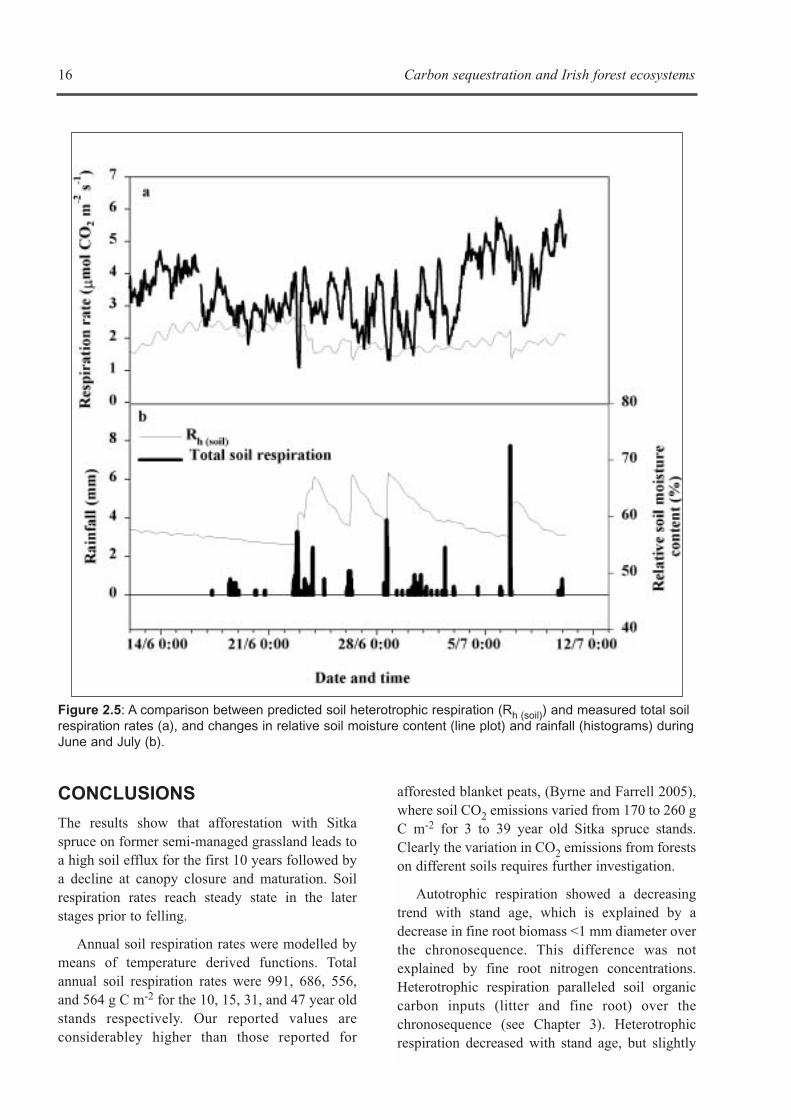
Figure 2.5: A comparison between predicted soil heterotrophic respiration (Rh (soil)) and measured total soilrespiration rates (a), and changes in relative soil moisture content (line plot) and rainfall (histograms) duringJune and July (b).
increased again in the oldest stand (47 year old) asa result of accumulated above-ground litter androot inputs. Soil carbon effluxes in the older standsreached a steady state, as was evident from thesimilar respiration rates in the 31 and 47 year oldstands.
Higher soil respiration rates in the youngeststand may be a result of both the larger availabilityof soil organic matter, and the greater activity of itsroot system compared to the more mature stands.The relative contribution of root respiration (RA) tototal CO2 efflux decreased with stand age. Thedecrease in the relative contribution of autotrophicrespiration to total soil CO2 efflux from 59.3% inthe youngest stands to 49.7% in the oldest standwas explained by the higher activity of the rootsystem in younger stands.
The results show that the use of models topredict annual mean soil respiration in forestecosystems may underestimate soil respirationrates of young afforested ecosystems if a stand agefactor is not included. Whilst the proportion ofheterotrophic to total soil respiration (Figures 2.2and 2.3) appears to be consistent with previousreports (Hanson et al. 2000) and the heterotrophicsoil model estimates appear to be as robust as thosereported by Ehman et al. (2002) and Curtis et al.(2002), there is a need to develop mechanisticprocess-based models. Based on the observationthat soil temperature and moisture only accountedfor 61% of the observed variation in soil respirationin the current study (Black et al. 2005), empiricalmodels may fail to fully capture temporalvariability in respiration. In addition, the sharpdecrease in soil C efflux during and after rainfallevents highlights the importance of accounting fortransport processes through the soil profile, such asthe diffusion of CO2 out of, and O2 into, the soilcolumn (Fang and Moncrieff 1999, Moncrieff andFang 1999).
Site productivity may confound the effects ofstand age on soil respiration and may influence thetime for a young spruce plantation to change froma carbon source to a carbon sink by means ofreducing soil respiration and increasing carbonstorage in biomass. However, other issues such asenhancement of N2O emissions may require furthercareful evaluation when establishing plantations
with the objective of sequestering carbon. Furtherresearch over longer periods and on differentecosystems is required to validate and assess theimportance of stand age on afforestation sites.
Carbon sequestration and Irish forest ecosystems 17

18 Carbon sequestration and Irish forest ecosystems
Carbon sequestration and Irish forest ecosystems 19
A) SOIL C STOCKS
Introduction
The soil carbon pool is the largest and mostsignificant carbon storage pool in the forestecosystem. An estimated 247-286 Pg C are storedin the soil of boreal forests (Schlesinger 1984,1991). In addition, the system is considered to be asignificant sink for atmospheric C, accounting foras much as 662 Tg C yr-1 (Apps et al. 1993). Theability of forest soils to sequester C is due to thedeposition and accumulation of a resistant slowlydecomposable C pool with a half-life 1000 + years.In CARBiFOR this pool was estimated to representapproximately 65% of the soil organic matter(SOM) in the sites studied.
The size of the soil organic matter poolrepresents a balance between the organic matterinput as litter of various types and the rate ofdecomposition. Litterfall is positively correlatedwith NPP (Vilà et al. 2004) while the rate ofdecomposition is determined largely by climate,the chemical quality of the litter input and thedecomposer organisms present in the system.However, there is one important additional factor:soil texture. All other things being equal, soils witha high clay content are known to contain moreSOM. This arises because of the physicalinteractions between the clay particles and theSOM, which provide a high degree of protectionfor the organic matter (McInerney and Bolger2000).
Objectives
Litter inputs and soil carbon stocks were estimatedby Working Group 3. An attempt was then made touse these figures to model sequestration in aparticular forest type.
The specific objectives were:• To measure the temporal variation, quantity
and quality of litter input within the stands thatmake up the chronosequence
• To measure the carbon stocks in the soils of thechronosequence and to partition the stocks intomicrobial, structural and passive pools.
• Integrate the results of this work package andthose of the other Working Groups into theCENTURY model to describe the 15 year oldsite.
• Use basic soil carbon data from other forestedsites to test validity of the model predictions.
Methods
The soil is described as being associated with theRaheenduff Imperfectly Drained Phase accordingto Soils of County Laois, from the national soilsurvey of Ireland. Coillte surveys of the forestedarea indicates that 90% of the soil is gley with 10%brown earth/podsol mixture. Mean sand, silt andclay contents of the sites in the chronosequence are22%, 36% and 42% respectively, pH is 4.6 andbulk density is 1.018 kg m-3 (Carly Green pers.comm.) These figures mirror those described in thenational soil survey.
Litter input was measured every month usinglitterfall collectors at each site in thechronosequence. The collectors were plastic binswith a 350 cm diameter opening and 10 wereplaced in each site. In the case of grassland (G0),estimates were made using the harvest technique ofSims et al. (1978). The same technique was used toestimate the increase in grass litter due to canopyclosure in the 10 year old site.
The carbon, nitrogen and lignin contents of thelitter inputs were measured twice at each site of thechronosequence. The carbon and nitrogen
CHAPTER 3
SOIL STOCKS AND SOIL PROCESSES
Brian Reidy, Jens Dyckmans, Olaf Schmidt and Tom Bolger
20 Carbon sequestration and Irish forest ecosystems
concentrations were measured using a CHNanalyser. The lignin content was estimatedfollowing the methods of Allen (1989).
Total C content of the soils at each site wasestimated for each of the organic and upper mineralhorizons based on loss on ignition, which wascalibrated using a CHN analysis. Sub-samples offresh soil were removed and microbial biomass Cestimated using the chloroform fumigationtechnique (Vance et al. 1987). Light and heavyfractions were separated following the methods ofCompton and Boone (2002). The light fraction isbelieved to be representative of the slow pool plusthe microbial biomass, while the heavy material isprimarily the resistant/passive pool. Woody debrislarger than 1 cm in diameter was removed and thesoil was then sieved through a 5.6 mm mesh anddried at 80°C. The sub-sample was then floated ina solution of sodium meta-tungstate, 10 g per litreof water (which has a density of 1.75). Theresulting heavy and light material were dried,weighed, ground and mixed thoroughly and thecarbon and nitrogen content was estimated using aCHN analyser. The total stock was estimated bymultiplying the carbon and nitrogen concentrationsby the weight of the samples (which was areabased).
The CENTURY Model was originallydeveloped for grassland systems in North Americaand has been developed and used extensively inrecent years to model forest systems. An analysisof the applicability of the CENTURY model,
version 4, to predict the carbon stocks of the standsunder our site conditions was carried out. Tomeasure SOM pools equivalent to those used in theCENTURY model, the heavy and light fractionsmentioned above were used according toChristiansen (1992). An analysis of theapplicability of the model was performed to predictthe carbon stocks of forests under the conditionsprevalent in Ireland and the results tested againstmeasured stocks in a variety of sites.
Results
Litter inputs
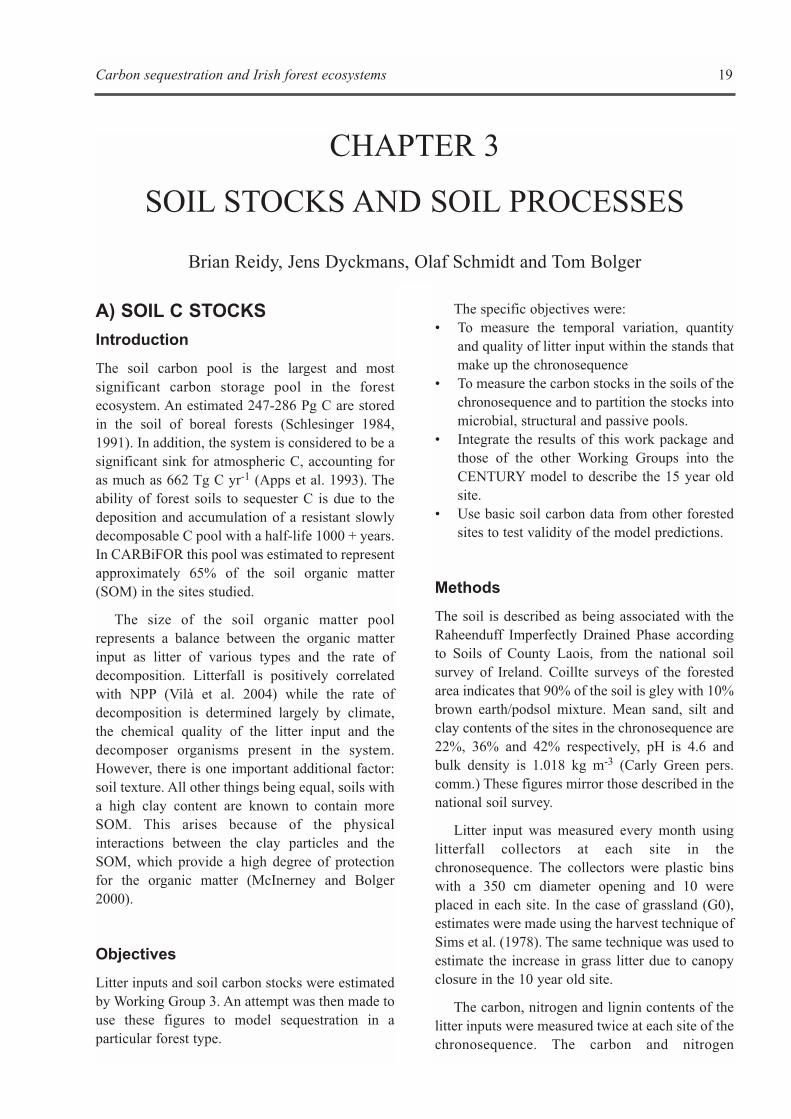
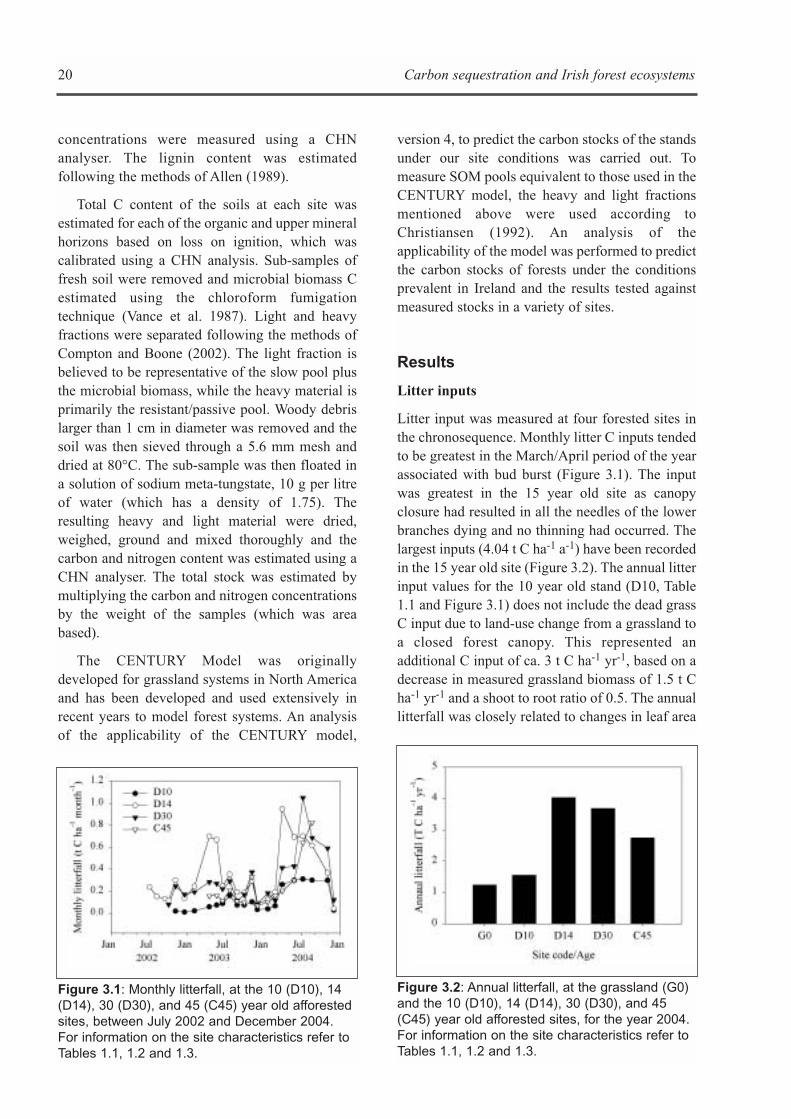
Litter input was measured at four forested sites inthe chronosequence. Monthly litter C inputs tendedto be greatest in the March/April period of the yearassociated with bud burst (Figure 3.1). The inputwas greatest in the 15 year old site as canopyclosure had resulted in all the needles of the lowerbranches dying and no thinning had occurred. Thelargest inputs (4.04 t C ha-1 a-1) have been recordedin the 15 year old site (Figure 3.2). The annual litterinput values for the 10 year old stand (D10, Table1.1 and Figure 3.1) does not include the dead grassC input due to land-use change from a grassland toa closed forest canopy. This represented anadditional C input of ca. 3 t C ha-1 yr-1, based on adecrease in measured grassland biomass of 1.5 t Cha-1 yr-1 and a shoot to root ratio of 0.5. The annuallitterfall was closely related to changes in leaf area
Figure 3.1: Monthly litterfall, at the 10 (D10), 14(D14), 30 (D30), and 45 (C45) year old afforestedsites, between July 2002 and December 2004.For information on the site characteristics refer toTables 1.1, 1.2 and 1.3.
Figure 3.2: Annual litterfall, at the grassland (G0)and the 10 (D10), 14 (D14), 30 (D30), and 45(C45) year old afforested sites, for the year 2004.For information on the site characteristics refer toTables 1.1, 1.2 and 1.3.
index and net primary production (NPP) over thechronosequence (see Table 1.2, and Chapters 5 and6).
The carbon, nitrogen and lignin contents of thelitter inputs for the four afforested sites did not varysignificantly (Table 3.1). The grassland litter (G0)was seen to be more decomposable due to its lowlignin content which was ~25% as distinct from>40% in spruce needles.
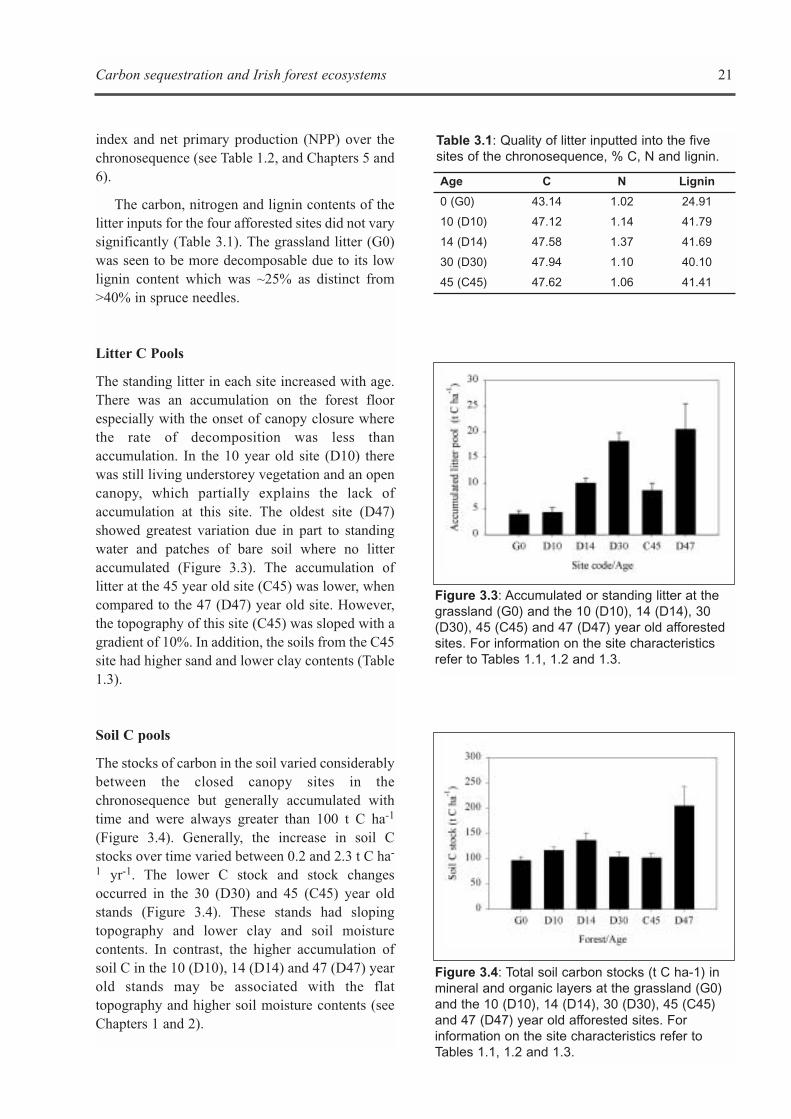
Litter C Pools
The standing litter in each site increased with age.There was an accumulation on the forest floorespecially with the onset of canopy closure wherethe rate of decomposition was less thanaccumulation. In the 10 year old site (D10) therewas still living understorey vegetation and an opencanopy, which partially explains the lack ofaccumulation at this site. The oldest site (D47)showed greatest variation due in part to standingwater and patches of bare soil where no litteraccumulated (Figure 3.3). The accumulation oflitter at the 45 year old site (C45) was lower, whencompared to the 47 (D47) year old site. However,the topography of this site (C45) was sloped with agradient of 10%. In addition, the soils from the C45site had higher sand and lower clay contents (Table1.3).
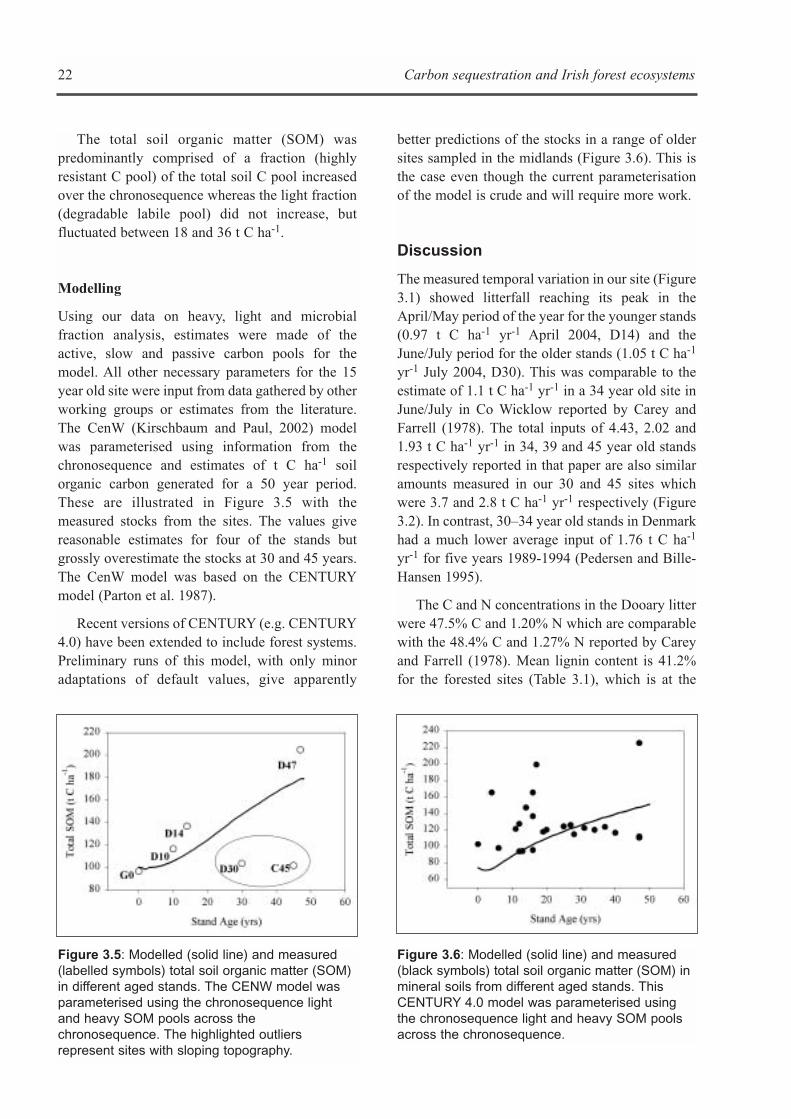
Soil C pools
The stocks of carbon in the soil varied considerablybetween the closed canopy sites in thechronosequence but generally accumulated withtime and were always greater than 100 t C ha-1
(Figure 3.4). Generally, the increase in soil Cstocks over time varied between 0.2 and 2.3 t C ha-
1 yr-1. The lower C stock and stock changesoccurred in the 30 (D30) and 45 (C45) year oldstands (Figure 3.4). These stands had slopingtopography and lower clay and soil moisturecontents. In contrast, the higher accumulation ofsoil C in the 10 (D10), 14 (D14) and 47 (D47) yearold stands may be associated with the flattopography and higher soil moisture contents (seeChapters 1 and 2).
Carbon sequestration and Irish forest ecosystems 21
Figure 3.3: Accumulated or standing litter at thegrassland (G0) and the 10 (D10), 14 (D14), 30(D30), 45 (C45) and 47 (D47) year old afforestedsites. For information on the site characteristicsrefer to Tables 1.1, 1.2 and 1.3.
Table 3.1: Quality of litter inputted into the fivesites of the chronosequence, % C, N and lignin.
Age C N Lignin
0 (G0) 43.14 1.02 24.91
10 (D10) 47.12 1.14 41.79
14 (D14) 47.58 1.37 41.69
30 (D30) 47.94 1.10 40.10
45 (C45) 47.62 1.06 41.41
Figure 3.4: Total soil carbon stocks (t C ha-1) inmineral and organic layers at the grassland (G0)and the 10 (D10), 14 (D14), 30 (D30), 45 (C45)and 47 (D47) year old afforested sites. Forinformation on the site characteristics refer toTables 1.1, 1.2 and 1.3.
22 Carbon sequestration and Irish forest ecosystems
The total soil organic matter (SOM) waspredominantly comprised of a fraction (highlyresistant C pool) of the total soil C pool increasedover the chronosequence whereas the light fraction(degradable labile pool) did not increase, butfluctuated between 18 and 36 t C ha-1.
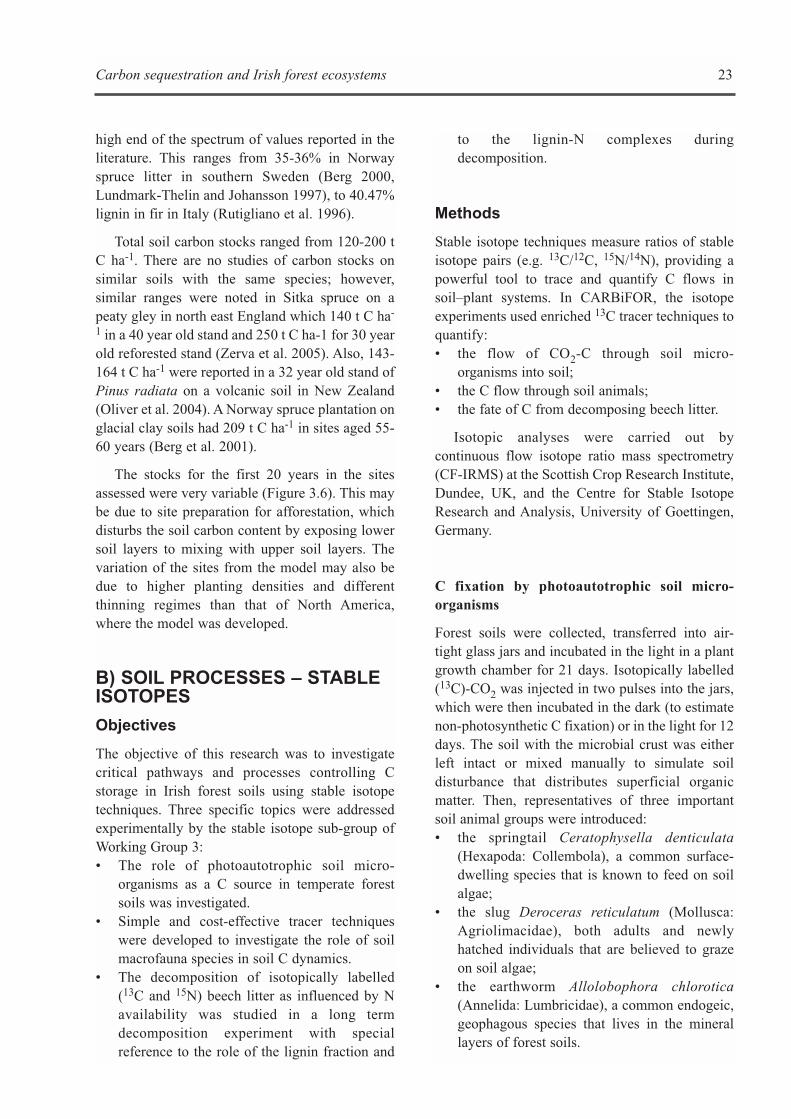
Modelling
Using our data on heavy, light and microbialfraction analysis, estimates were made of theactive, slow and passive carbon pools for themodel. All other necessary parameters for the 15year old site were input from data gathered by otherworking groups or estimates from the literature.The CenW (Kirschbaum and Paul, 2002) modelwas parameterised using information from thechronosequence and estimates of t C ha-1 soilorganic carbon generated for a 50 year period.These are illustrated in Figure 3.5 with themeasured stocks from the sites. The values givereasonable estimates for four of the stands butgrossly overestimate the stocks at 30 and 45 years.The CenW model was based on the CENTURYmodel (Parton et al. 1987).
Recent versions of CENTURY (e.g. CENTURY4.0) have been extended to include forest systems.Preliminary runs of this model, with only minoradaptations of default values, give apparently
better predictions of the stocks in a range of oldersites sampled in the midlands (Figure 3.6). This isthe case even though the current parameterisationof the model is crude and will require more work.
Discussion
The measured temporal variation in our site (Figure3.1) showed litterfall reaching its peak in theApril/May period of the year for the younger stands(0.97 t C ha-1 yr-1 April 2004, D14) and theJune/July period for the older stands (1.05 t C ha-1
yr-1 July 2004, D30). This was comparable to theestimate of 1.1 t C ha-1 yr-1 in a 34 year old site inJune/July in Co Wicklow reported by Carey andFarrell (1978). The total inputs of 4.43, 2.02 and1.93 t C ha-1 yr-1 in 34, 39 and 45 year old standsrespectively reported in that paper are also similaramounts measured in our 30 and 45 sites whichwere 3.7 and 2.8 t C ha-1 yr-1 respectively (Figure3.2). In contrast, 30–34 year old stands in Denmarkhad a much lower average input of 1.76 t C ha-1
yr-1 for five years 1989-1994 (Pedersen and Bille-Hansen 1995).
The C and N concentrations in the Dooary litterwere 47.5% C and 1.20% N which are comparablewith the 48.4% C and 1.27% N reported by Careyand Farrell (1978). Mean lignin content is 41.2%for the forested sites (Table 3.1), which is at the
Figure 3.6: Modelled (solid line) and measured(black symbols) total soil organic matter (SOM) inmineral soils from different aged stands. ThisCENTURY 4.0 model was parameterised usingthe chronosequence light and heavy SOM poolsacross the chronosequence.
Figure 3.5: Modelled (solid line) and measured(labelled symbols) total soil organic matter (SOM)in different aged stands. The CENW model wasparameterised using the chronosequence lightand heavy SOM pools across thechronosequence. The highlighted outliersrepresent sites with sloping topography.
high end of the spectrum of values reported in theliterature. This ranges from 35-36% in Norwayspruce litter in southern Sweden (Berg 2000,Lundmark-Thelin and Johansson 1997), to 40.47%lignin in fir in Italy (Rutigliano et al. 1996).
Total soil carbon stocks ranged from 120-200 tC ha-1. There are no studies of carbon stocks onsimilar soils with the same species; however,similar ranges were noted in Sitka spruce on apeaty gley in north east England which 140 t C ha-
1 in a 40 year old stand and 250 t C ha-1 for 30 yearold reforested stand (Zerva et al. 2005). Also, 143-164 t C ha-1 were reported in a 32 year old stand ofPinus radiata on a volcanic soil in New Zealand(Oliver et al. 2004). A Norway spruce plantation onglacial clay soils had 209 t C ha-1 in sites aged 55-60 years (Berg et al. 2001).
The stocks for the first 20 years in the sitesassessed were very variable (Figure 3.6). This maybe due to site preparation for afforestation, whichdisturbs the soil carbon content by exposing lowersoil layers to mixing with upper soil layers. Thevariation of the sites from the model may also bedue to higher planting densities and differentthinning regimes than that of North America,where the model was developed.
B) SOIL PROCESSES – STABLEISOTOPES
Objectives
The objective of this research was to investigatecritical pathways and processes controlling Cstorage in Irish forest soils using stable isotopetechniques. Three specific topics were addressedexperimentally by the stable isotope sub-group ofWorking Group 3:• The role of photoautotrophic soil micro-
organisms as a C source in temperate forestsoils was investigated.
• Simple and cost-effective tracer techniqueswere developed to investigate the role of soilmacrofauna species in soil C dynamics.
• The decomposition of isotopically labelled(13C and 15N) beech litter as influenced by Navailability was studied in a long termdecomposition experiment with specialreference to the role of the lignin fraction and
Carbon sequestration and Irish forest ecosystems 23
to the lignin-N complexes duringdecomposition.
Methods
Stable isotope techniques measure ratios of stableisotope pairs (e.g. 13C/12C, 15N/14N), providing apowerful tool to trace and quantify C flows insoil–plant systems. In CARBiFOR, the isotopeexperiments used enriched 13C tracer techniques toquantify:• the flow of CO2-C through soil micro-
organisms into soil; • the C flow through soil animals; • the fate of C from decomposing beech litter.
Isotopic analyses were carried out bycontinuous flow isotope ratio mass spectrometry(CF-IRMS) at the Scottish Crop Research Institute,Dundee, UK, and the Centre for Stable IsotopeResearch and Analysis, University of Goettingen,Germany.
C fixation by photoautotrophic soil micro-organisms
Forest soils were collected, transferred into air-tight glass jars and incubated in the light in a plantgrowth chamber for 21 days. Isotopically labelled(13C)-CO2 was injected in two pulses into the jars,which were then incubated in the dark (to estimatenon-photosynthetic C fixation) or in the light for 12days. The soil with the microbial crust was eitherleft intact or mixed manually to simulate soildisturbance that distributes superficial organicmatter. Then, representatives of three importantsoil animal groups were introduced:• the springtail Ceratophysella denticulata
(Hexapoda: Collembola), a common surface-dwelling species that is known to feed on soilalgae;
• the slug Deroceras reticulatum (Mollusca:Agriolimacidae), both adults and newlyhatched individuals that are believed to grazeon soil algae;
• the earthworm Allolobophora chlorotica(Annelida: Lumbricidae), a common endogeic,geophagous species that lives in the minerallayers of forest soils.
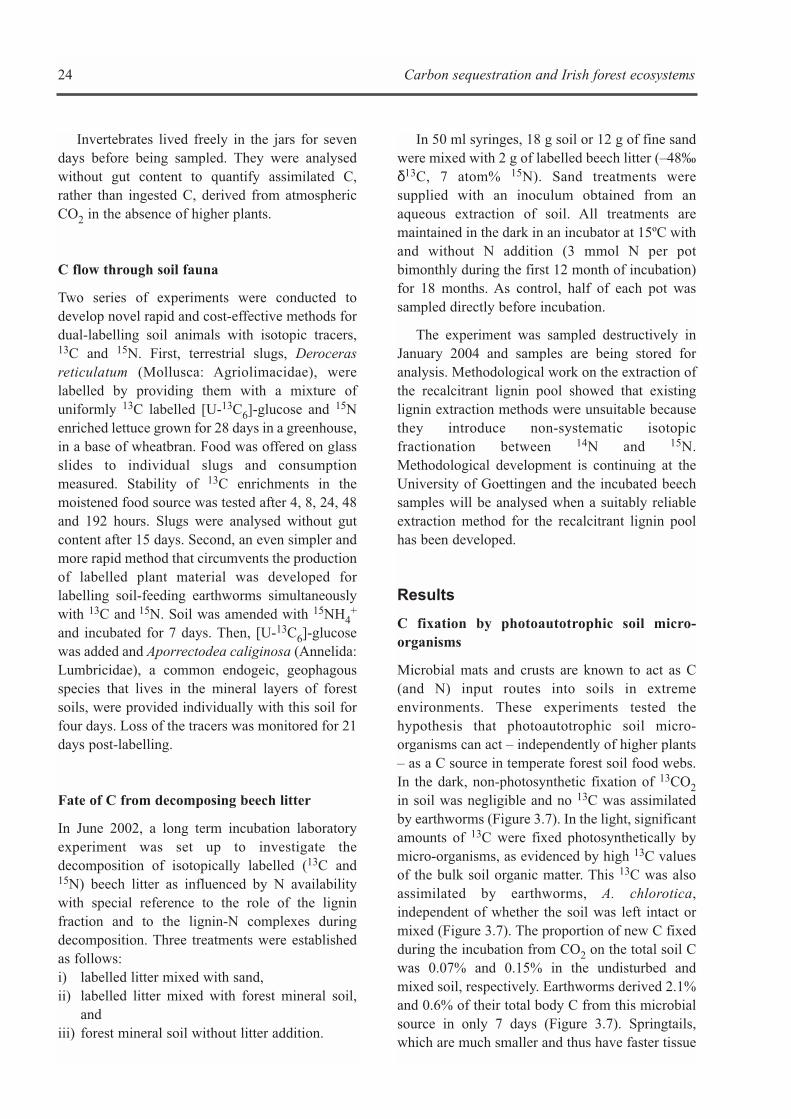
Invertebrates lived freely in the jars for sevendays before being sampled. They were analysedwithout gut content to quantify assimilated C,rather than ingested C, derived from atmosphericCO2 in the absence of higher plants.
C flow through soil fauna
Two series of experiments were conducted todevelop novel rapid and cost-effective methods fordual-labelling soil animals with isotopic tracers,13C and 15N. First, terrestrial slugs, Derocerasreticulatum (Mollusca: Agriolimacidae), werelabelled by providing them with a mixture ofuniformly 13C labelled [U-13C6]-glucose and 15Nenriched lettuce grown for 28 days in a greenhouse,in a base of wheatbran. Food was offered on glassslides to individual slugs and consumptionmeasured. Stability of 13C enrichments in themoistened food source was tested after 4, 8, 24, 48and 192 hours. Slugs were analysed without gutcontent after 15 days. Second, an even simpler andmore rapid method that circumvents the productionof labelled plant material was developed forlabelling soil-feeding earthworms simultaneouslywith 13C and 15N. Soil was amended with 15NH4
+
and incubated for 7 days. Then, [U-13C6]-glucosewas added and Aporrectodea caliginosa (Annelida:Lumbricidae), a common endogeic, geophagousspecies that lives in the mineral layers of forestsoils, were provided individually with this soil forfour days. Loss of the tracers was monitored for 21days post-labelling.
Fate of C from decomposing beech litter
In June 2002, a long term incubation laboratoryexperiment was set up to investigate thedecomposition of isotopically labelled (13C and15N) beech litter as influenced by N availabilitywith special reference to the role of the ligninfraction and to the lignin-N complexes duringdecomposition. Three treatments were establishedas follows:i) labelled litter mixed with sand,ii) labelled litter mixed with forest mineral soil,
andiii) forest mineral soil without litter addition.
24 Carbon sequestration and Irish forest ecosystems
In 50 ml syringes, 18 g soil or 12 g of fine sandwere mixed with 2 g of labelled beech litter (–48‰δ13C, 7 atom% 15N). Sand treatments weresupplied with an inoculum obtained from anaqueous extraction of soil. All treatments aremaintained in the dark in an incubator at 15ºC withand without N addition (3 mmol N per potbimonthly during the first 12 month of incubation)for 18 months. As control, half of each pot wassampled directly before incubation.
The experiment was sampled destructively inJanuary 2004 and samples are being stored foranalysis. Methodological work on the extraction ofthe recalcitrant lignin pool showed that existinglignin extraction methods were unsuitable becausethey introduce non-systematic isotopicfractionation between 14N and 15N.Methodological development is continuing at theUniversity of Goettingen and the incubated beechsamples will be analysed when a suitably reliableextraction method for the recalcitrant lignin poolhas been developed.
Results
C fixation by photoautotrophic soil micro-organisms
Microbial mats and crusts are known to act as C(and N) input routes into soils in extremeenvironments. These experiments tested thehypothesis that photoautotrophic soil micro-organisms can act – independently of higher plants– as a C source in temperate forest soil food webs.In the dark, non-photosynthetic fixation of 13CO2in soil was negligible and no 13C was assimilatedby earthworms (Figure 3.7). In the light, significantamounts of 13C were fixed photosynthetically bymicro-organisms, as evidenced by high 13C valuesof the bulk soil organic matter. This 13C was alsoassimilated by earthworms, A. chlorotica,independent of whether the soil was left intact ormixed (Figure 3.7). The proportion of new C fixedduring the incubation from CO2 on the total soil Cwas 0.07% and 0.15% in the undisturbed andmixed soil, respectively. Earthworms derived 2.1%and 0.6% of their total body C from this microbialsource in only 7 days (Figure 3.7). Springtails,which are much smaller and thus have faster tissue
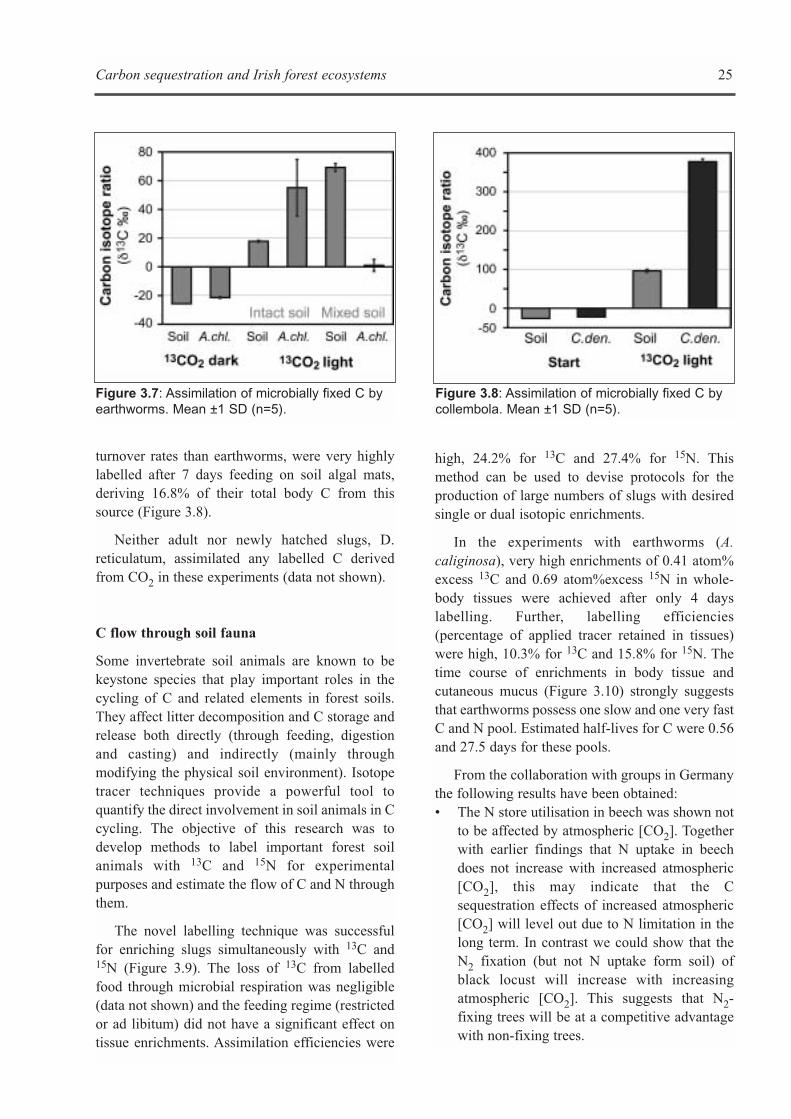
Carbon sequestration and Irish forest ecosystems 25
turnover rates than earthworms, were very highlylabelled after 7 days feeding on soil algal mats,deriving 16.8% of their total body C from thissource (Figure 3.8).
Neither adult nor newly hatched slugs, D.reticulatum, assimilated any labelled C derivedfrom CO2 in these experiments (data not shown).
C flow through soil fauna
Some invertebrate soil animals are known to bekeystone species that play important roles in thecycling of C and related elements in forest soils.They affect litter decomposition and C storage andrelease both directly (through feeding, digestionand casting) and indirectly (mainly throughmodifying the physical soil environment). Isotopetracer techniques provide a powerful tool toquantify the direct involvement in soil animals in Ccycling. The objective of this research was todevelop methods to label important forest soilanimals with 13C and 15N for experimentalpurposes and estimate the flow of C and N throughthem.
The novel labelling technique was successfulfor enriching slugs simultaneously with 13C and15N (Figure 3.9). The loss of 13C from labelledfood through microbial respiration was negligible(data not shown) and the feeding regime (restrictedor ad libitum) did not have a significant effect ontissue enrichments. Assimilation efficiencies were
high, 24.2% for 13C and 27.4% for 15N. Thismethod can be used to devise protocols for theproduction of large numbers of slugs with desiredsingle or dual isotopic enrichments.
In the experiments with earthworms (A.caliginosa), very high enrichments of 0.41 atom%excess 13C and 0.69 atom%excess 15N in whole-body tissues were achieved after only 4 dayslabelling. Further, labelling efficiencies(percentage of applied tracer retained in tissues)were high, 10.3% for 13C and 15.8% for 15N. Thetime course of enrichments in body tissue andcutaneous mucus (Figure 3.10) strongly suggeststhat earthworms possess one slow and one very fastC and N pool. Estimated half-lives for C were 0.56and 27.5 days for these pools.
From the collaboration with groups in Germanythe following results have been obtained:• The N store utilisation in beech was shown not
to be affected by atmospheric [CO2]. Togetherwith earlier findings that N uptake in beechdoes not increase with increased atmospheric[CO2], this may indicate that the Csequestration effects of increased atmospheric[CO2] will level out due to N limitation in thelong term. In contrast we could show that theN2 fixation (but not N uptake form soil) ofblack locust will increase with increasingatmospheric [CO2]. This suggests that N2-fixing trees will be at a competitive advantagewith non-fixing trees.
Figure 3.8: Assimilation of microbially fixed C bycollembola. Mean ±1 SD (n=5).
Figure 3.7: Assimilation of microbially fixed C byearthworms. Mean ±1 SD (n=5).
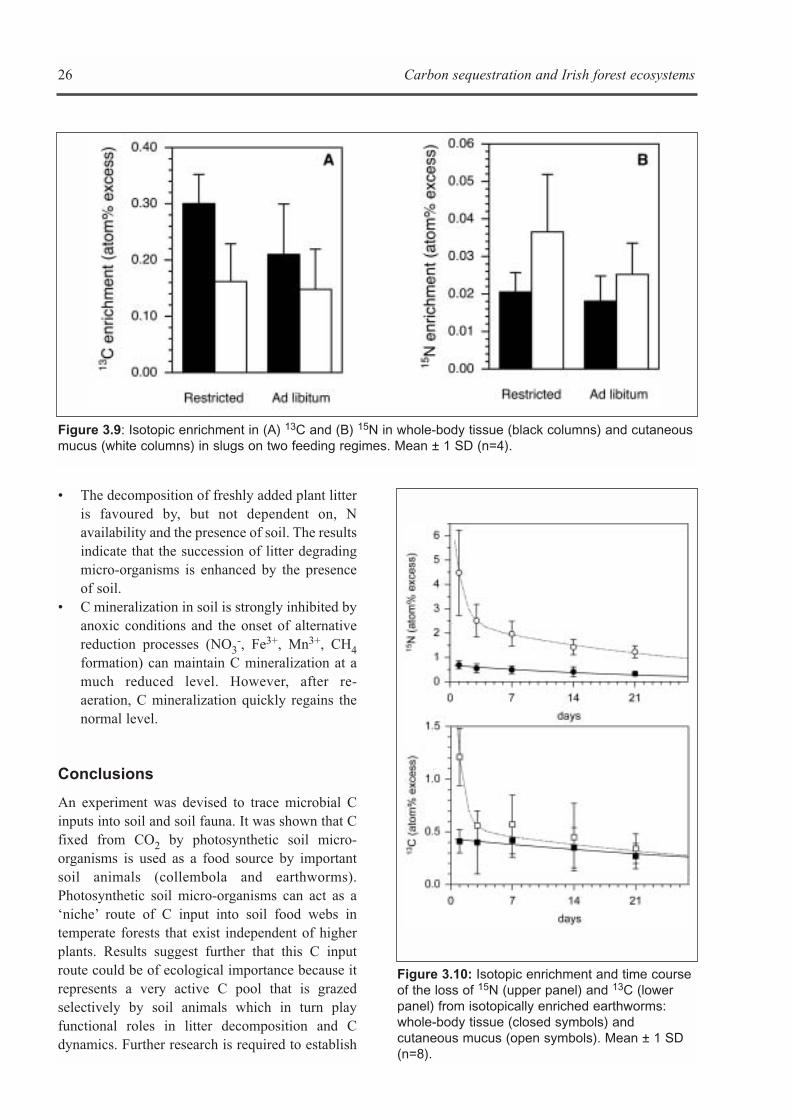
26 Carbon sequestration and Irish forest ecosystems
• The decomposition of freshly added plant litteris favoured by, but not dependent on, Navailability and the presence of soil. The resultsindicate that the succession of litter degradingmicro-organisms is enhanced by the presenceof soil.
• C mineralization in soil is strongly inhibited byanoxic conditions and the onset of alternativereduction processes (NO3
-, Fe3+, Mn3+, CH4formation) can maintain C mineralization at amuch reduced level. However, after re-aeration, C mineralization quickly regains thenormal level.
Conclusions
An experiment was devised to trace microbial Cinputs into soil and soil fauna. It was shown that Cfixed from CO2 by photosynthetic soil micro-organisms is used as a food source by importantsoil animals (collembola and earthworms).Photosynthetic soil micro-organisms can act as a‘niche’ route of C input into soil food webs intemperate forests that exist independent of higherplants. Results suggest further that this C inputroute could be of ecological importance because itrepresents a very active C pool that is grazedselectively by soil animals which in turn playfunctional roles in litter decomposition and Cdynamics. Further research is required to establish
Figure 3.9: Isotopic enrichment in (A) 13C and (B) 15N in whole-body tissue (black columns) and cutaneousmucus (white columns) in slugs on two feeding regimes. Mean ± 1 SD (n=4).
Figure 3.10: Isotopic enrichment and time courseof the loss of 15N (upper panel) and 13C (lowerpanel) from isotopically enriched earthworms:whole-body tissue (closed symbols) andcutaneous mucus (open symbols). Mean ± 1 SD(n=8).
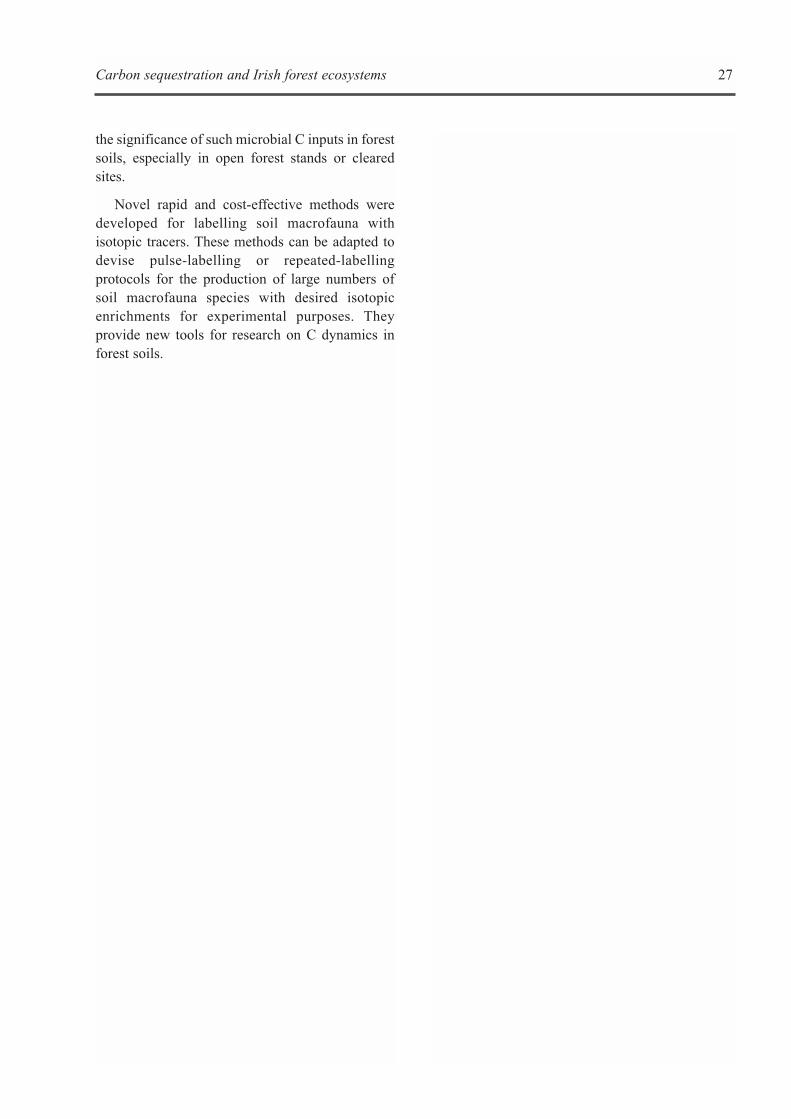
the significance of such microbial C inputs in forestsoils, especially in open forest stands or clearedsites.
Novel rapid and cost-effective methods weredeveloped for labelling soil macrofauna withisotopic tracers. These methods can be adapted todevise pulse-labelling or repeated-labellingprotocols for the production of large numbers ofsoil macrofauna species with desired isotopicenrichments for experimental purposes. Theyprovide new tools for research on C dynamics inforest soils.
Carbon sequestration and Irish forest ecosystems 27

28 Carbon sequestration and Irish forest ecosystems
Carbon sequestration and Irish forest ecosystems 29
INTRODUCTION
There are many uncertainties in estimates of forestbiomass C pools, such as the amount of forestbiomass (Schroeder et al. 1997, Brown et al. 1999),the appropriate biomass expansion factors (BEFs,Brown 2002), and values for biomass density andcarbon fraction (Lowe et al. 2000). Studies on thesink capacity of Irish forests are limited. It isestimated that the average rate of carbonsequestration by Irish forests is approximately 3.36t C ha-1 yr-1 (Kilbride et al. 1999), based on themodel developed by Dewar and Cannell (1992).However, this estimate of the sink capacity of Irishforests is based on a single biomass expansionfactor (BEF) value of 1.3 t t-1 for all species, ageand yield classes (Kilbride et al. 1999) and ignoresthe below-ground component. Since the allocationof biomass between different forest components isdependent on stand density, forest species andnutritional status, current national estimates of sinkcapacity would be improved using classified ageand species-specific BEF values that include thebelow-ground fraction.
In addition to their importance for compiling Cinventories in forests, biomass estimations arerelevant for studying biogeochemical cycles andunderstanding variations in structural andfunctional attributes of forest ecosystems across awide range of environmental conditions andsilvicultural practices. Whilst many ecologicalstudies have used allometric algorithms to predictforest biomass (Cannell 1984, Kauppi et al. 1992,Brown et al. 1999, Schroeder et al. 1997, Nelson etal. 1999), the accuracy of estimating standingbiomass through the development of empiricalmodels is reduced due to numerous factors. First,few universal species-specific allometric equationshave been developed that are applicable at differentregional scales or appropriate for different
environmental conditions. Secondly, since mostmodels are parameterised using national inventorydata, estimates are generally limited to older ageclasses. Consequently, the application of models toyounger stands can lead to large errors whenpredicting forest biomass. The prediction of Cstorage by younger forests, in particular, isimportant with regard to Article 3.3 of the KyotoProtocol where potential mitigation of carbondioxide emissions only includes afforested sitesplanted since 1990.
In accordance with the IPCC good practiceguidance, assessments of the biomass carbon (C)pool in forests can be calculated from nationalforest inventory timber volume data using biomassexpansion factors (BEF) and root-to-shoot ratios(R:S). Generally, BEFs are multiplication factors,which are used to expand merchantable growingstock biomass to account for non-merchantablebiomass components (needles, branches, bark,stump, roots; Brown 2002, Schoene, 2002). Ormore practically, when used with conversionfactors, BEFs and root to shoot ratios (R:S) convertreadily available estimates of merchantablestemwood volumes (from forest inventories) tototal biomass carbon values that can then be used toestimate carbon budgets (Fukuda et al. 2003). Forthe purposes of C reporting, however, the IPCCdefined basic equation (Penman et al. 2003) is:
Carbon mass (Mg C ha-1) = [V * D * ABEF]*(1+R:S) * CF
(2)
where V is the merchantable stemwood volume(m3 ha-1), D is the stemwood basic density (Mg m-
3), ABEF is the above-ground biomass expansionfactor (t t-1), R:S is the ratio of below-ground toabove-ground biomass and CF is the carbonfraction of dry biomass (Mg C Mg-1 dry mass)
Chapter 4
BIOMASS EXPANSION FACTORS ANDFOREST BIOMASS C STORES
Brian Tobin, Kevin G. Black, Maarten Nieuwenhuis and John Gardiner
By definition, ABEF may not be suitable forcalculation of C storage in forest ecosystemsbecause of the exclusion of younger trees (dbh<7cm). To incorporate the younger stands of achronosequence into current ABEF estimates,ABEF has to be redefined as the ratio of above-ground biomass to growing stem volume(Schroeder et al. 1997). In this study, we proposethat below-ground biomass should also be includedin the BEF calculations to enable the determinationof total biomass from growing stem biomass. Thismethod could potentially result in a smaller error inestimation of C increment because of largevariations in R:S as stands develop. We do,however, also report on ABEF, based on timber andtotal stem values, for comparison purposes.
Because BEF, R:S and D are known to varywith forest type, growing conditions, forestmanagement, crop density, age and climate, there isa need for the determination of conversioncoefficients and factors specific to Irish conditions.
OBJECTIVES
The objectives of this Working Group were toassess biomass C stocks in the major Irish foresttype (i.e. managed monocultures of Sitka spruce)planted on mineral soils (the predominant soil typeafforested since 1990, so-called “Kyoto forests”),and estimate a series of nationally pertinent BEFsand to quantify the changes in BEF over a rotationunder normal commercial stand development. Thisnew information can be used to greatly improvecurrent biomass and C-store estimates for Irishforests and to assist in national carbon accountingprocesses. Specific objectives were:• Determination of the above- and below-ground
biomass of an age sequence of Sitka sprucestands;
• Estimation of basic stemwood density for Sitkaspruce;
• Estimation of the carbon content in drybiomass, which is common over all treecompartments;
• Development of allometric functions for totalbiomass and biomass components, which canbe used to estimate C stock changes based oninventory data;
• Estimation of the coarse wood debris C pool
30 Carbon sequestration and Irish forest ecosystems
due to harvest residue. These include brash,stumps, roots and un-removed timber.
METHODS
A chronosequence, consisting of five even-agedmonospecies stands (9, 14, 25, 30 and 45 years old,(see Table 1.1), representing the typicalcommercial rotation of Sitka spruce in Irish forestconditions was identified (Table 4.1). Stands onmineral soils were chosen, as this best representsthe majority of better quality sites supporting post-1990 plantations of Sitka spruce in Ireland.Accordingly, six stands were located in themidlands of Ireland, in Co Laois, each on a wetsurface-water mineral gley soil. Efforts were madeto standardise the site conditions as far as possible(i.e. stands growing under homogenousenvironmental and management conditions) interms of topography, exposure and drainage.
Tree sampling and harvest
A total of 37 trees were harvested from across thechronosequence and destructively sampled.Sample trees were cut at ground level, and theirdbh and height were measured. They were dividedinto their component parts (roots, stem, deadbranches and live branches). The point along thestem where it was deemed that live branchespredominated (i.e. where >75% of the whorl’sbranches were alive/photosynthetically active) wasmarked, and all branches originating from the stembelow this point were considered dead. Thesecomponents were weighed in the field with aportable spring balance (precision 0.1 kg, seeImage 2). To determine moisture content of the treecomponents sub-samples were taken from thecomponents and dried to constant weight at 70oC,and fresh to dry weight ratios were used tocalculate the dry weight of each tree component(Mund et al. 2002). Values in Table 4.2 aredisplayed as a percentage of the wet weight. Sub-samples of branches were dried and separated intobranch-wood and needles, and the subsequent dryweight ratios of needles to branch-wood were usedto separate the dry weight of the foliage into its twoconstituent fractions.
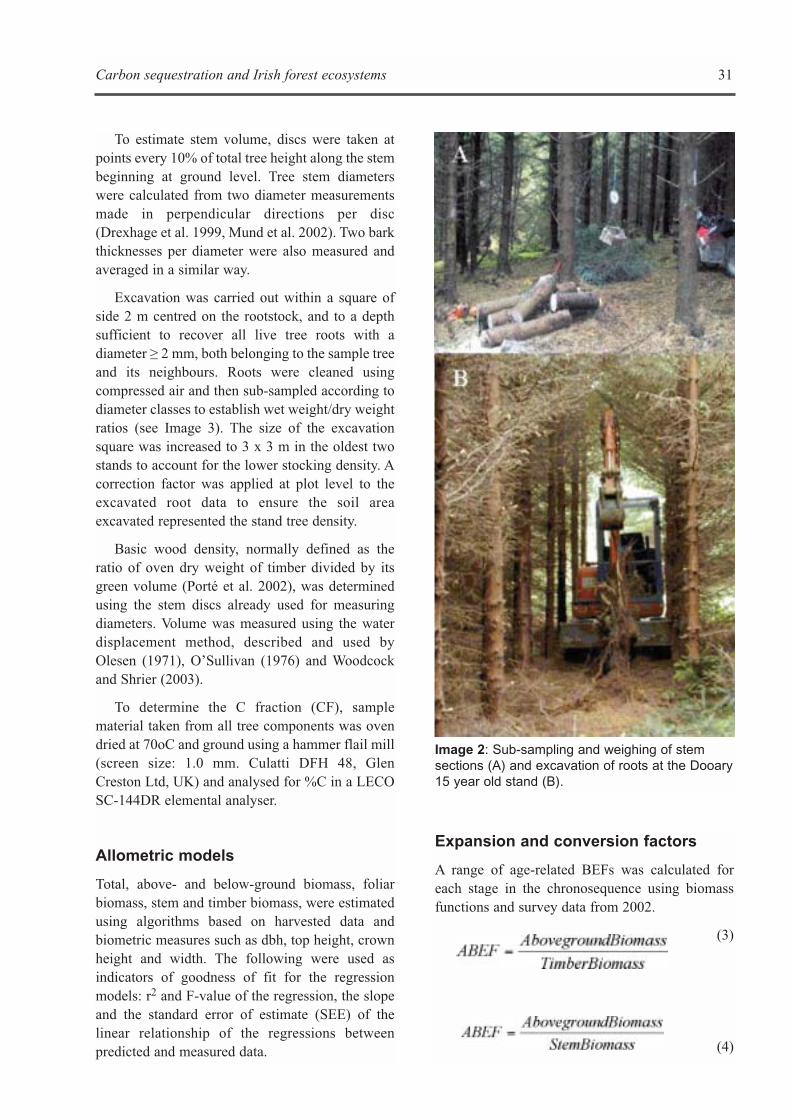
To estimate stem volume, discs were taken atpoints every 10% of total tree height along the stembeginning at ground level. Tree stem diameterswere calculated from two diameter measurementsmade in perpendicular directions per disc(Drexhage et al. 1999, Mund et al. 2002). Two barkthicknesses per diameter were also measured andaveraged in a similar way.
Excavation was carried out within a square ofside 2 m centred on the rootstock, and to a depthsufficient to recover all live tree roots with adiameter ≥ 2 mm, both belonging to the sample treeand its neighbours. Roots were cleaned usingcompressed air and then sub-sampled according todiameter classes to establish wet weight/dry weightratios (see Image 3). The size of the excavationsquare was increased to 3 x 3 m in the oldest twostands to account for the lower stocking density. Acorrection factor was applied at plot level to theexcavated root data to ensure the soil areaexcavated represented the stand tree density.
Basic wood density, normally defined as theratio of oven dry weight of timber divided by itsgreen volume (Porté et al. 2002), was determinedusing the stem discs already used for measuringdiameters. Volume was measured using the waterdisplacement method, described and used byOlesen (1971), O’Sullivan (1976) and Woodcockand Shrier (2003).
To determine the C fraction (CF), samplematerial taken from all tree components was ovendried at 70oC and ground using a hammer flail mill(screen size: 1.0 mm. Culatti DFH 48, GlenCreston Ltd, UK) and analysed for %C in a LECOSC-144DR elemental analyser.
Allometric models
Total, above- and below-ground biomass, foliarbiomass, stem and timber biomass, were estimatedusing algorithms based on harvested data andbiometric measures such as dbh, top height, crownheight and width. The following were used asindicators of goodness of fit for the regressionmodels: r2 and F-value of the regression, the slopeand the standard error of estimate (SEE) of thelinear relationship of the regressions betweenpredicted and measured data.
Carbon sequestration and Irish forest ecosystems 31
Image 2: Sub-sampling and weighing of stemsections (A) and excavation of roots at the Dooary15 year old stand (B).
Expansion and conversion factors
A range of age-related BEFs was calculated foreach stage in the chronosequence using biomassfunctions and survey data from 2002.
(3)
(4)
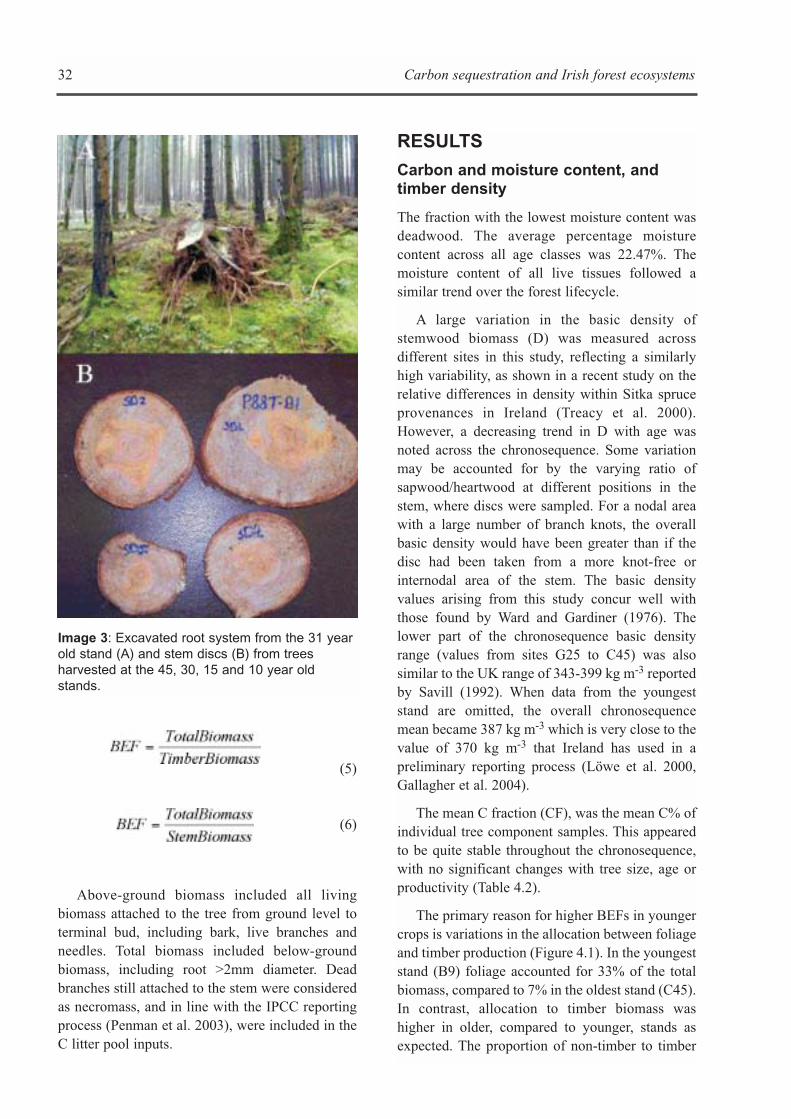
32 Carbon sequestration and Irish forest ecosystems
(5)
(6)
Above-ground biomass included all livingbiomass attached to the tree from ground level toterminal bud, including bark, live branches andneedles. Total biomass included below-groundbiomass, including root >2mm diameter. Deadbranches still attached to the stem were consideredas necromass, and in line with the IPCC reportingprocess (Penman et al. 2003), were included in theC litter pool inputs.
RESULTS
Carbon and moisture content, andtimber density
The fraction with the lowest moisture content wasdeadwood. The average percentage moisturecontent across all age classes was 22.47%. Themoisture content of all live tissues followed asimilar trend over the forest lifecycle.
A large variation in the basic density ofstemwood biomass (D) was measured acrossdifferent sites in this study, reflecting a similarlyhigh variability, as shown in a recent study on therelative differences in density within Sitka spruceprovenances in Ireland (Treacy et al. 2000).However, a decreasing trend in D with age wasnoted across the chronosequence. Some variationmay be accounted for by the varying ratio ofsapwood/heartwood at different positions in thestem, where discs were sampled. For a nodal areawith a large number of branch knots, the overallbasic density would have been greater than if thedisc had been taken from a more knot-free orinternodal area of the stem. The basic densityvalues arising from this study concur well withthose found by Ward and Gardiner (1976). Thelower part of the chronosequence basic densityrange (values from sites G25 to C45) was alsosimilar to the UK range of 343-399 kg m-3 reportedby Savill (1992). When data from the youngeststand are omitted, the overall chronosequencemean became 387 kg m-3 which is very close to thevalue of 370 kg m-3 that Ireland has used in apreliminary reporting process (Löwe et al. 2000,Gallagher et al. 2004).
The mean C fraction (CF), was the mean C% ofindividual tree component samples. This appearedto be quite stable throughout the chronosequence,with no significant changes with tree size, age orproductivity (Table 4.2).
The primary reason for higher BEFs in youngercrops is variations in the allocation between foliageand timber production (Figure 4.1). In the youngeststand (B9) foliage accounted for 33% of the totalbiomass, compared to 7% in the oldest stand (C45).In contrast, allocation to timber biomass washigher in older, compared to younger, stands asexpected. The proportion of non-timber to timber
Image 3: Excavated root system from the 31 yearold stand (A) and stem discs (B) from treesharvested at the 45, 30, 15 and 10 year oldstands.
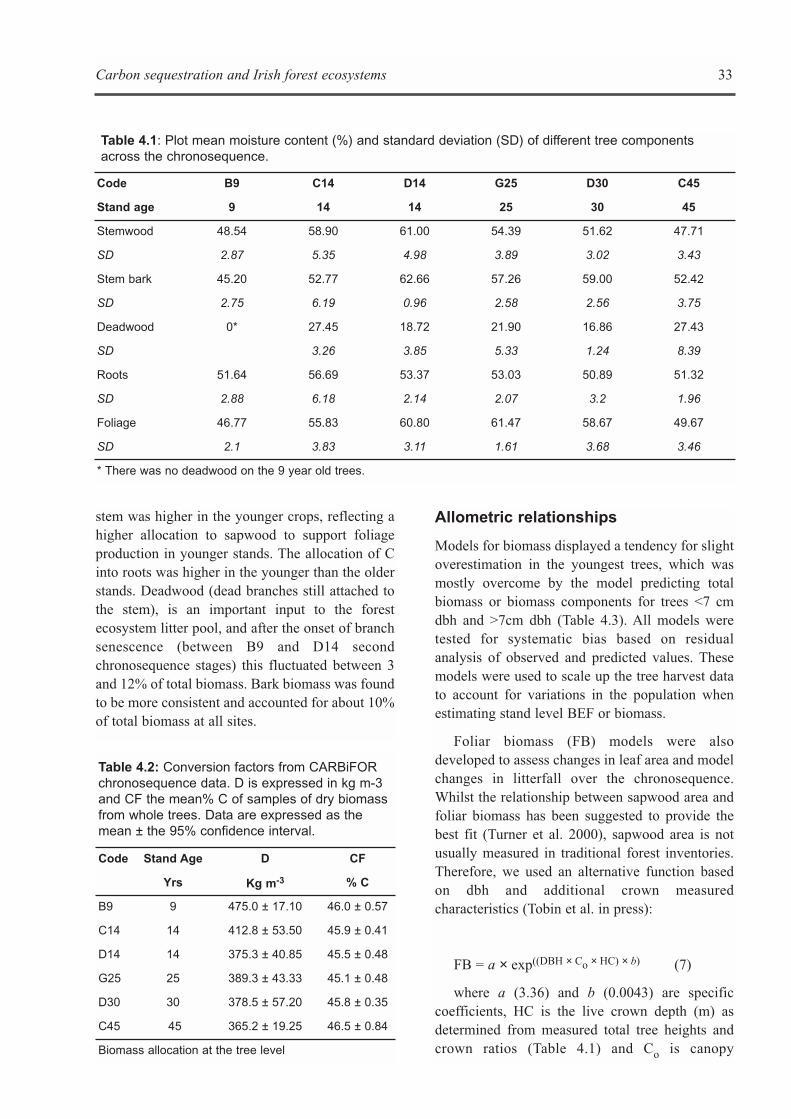
Carbon sequestration and Irish forest ecosystems 33
stem was higher in the younger crops, reflecting ahigher allocation to sapwood to support foliageproduction in younger stands. The allocation of Cinto roots was higher in the younger than the olderstands. Deadwood (dead branches still attached tothe stem), is an important input to the forestecosystem litter pool, and after the onset of branchsenescence (between B9 and D14 secondchronosequence stages) this fluctuated between 3and 12% of total biomass. Bark biomass was foundto be more consistent and accounted for about 10%of total biomass at all sites.
Table 4.2: Conversion factors from CARBiFORchronosequence data. D is expressed in kg m-3and CF the mean% C of samples of dry biomassfrom whole trees. Data are expressed as themean ± the 95% confidence interval.
Code Stand Age D CF
Yrs Kg m-3 % C
B9 9 475.0 ± 17.10 46.0 ± 0.57
C14 14 412.8 ± 53.50 45.9 ± 0.41
D14 14 375.3 ± 40.85 45.5 ± 0.48
G25 25 389.3 ± 43.33 45.1 ± 0.48
D30 30 378.5 ± 57.20 45.8 ± 0.35
C45 45 365.2 ± 19.25 46.5 ± 0.84
Biomass allocation at the tree level
Allometric relationships
Models for biomass displayed a tendency for slightoverestimation in the youngest trees, which wasmostly overcome by the model predicting totalbiomass or biomass components for trees <7 cmdbh and >7cm dbh (Table 4.3). All models weretested for systematic bias based on residualanalysis of observed and predicted values. Thesemodels were used to scale up the tree harvest datato account for variations in the population whenestimating stand level BEF or biomass.
Foliar biomass (FB) models were alsodeveloped to assess changes in leaf area and modelchanges in litterfall over the chronosequence.Whilst the relationship between sapwood area andfoliar biomass has been suggested to provide thebest fit (Turner et al. 2000), sapwood area is notusually measured in traditional forest inventories.Therefore, we used an alternative function basedon dbh and additional crown measuredcharacteristics (Tobin et al. in press):
FB = a × exp((DBH × Co × HC) × b) (7)
where a (3.36) and b (0.0043) are specificcoefficients, HC is the live crown depth (m) asdetermined from measured total tree heights andcrown ratios (Table 4.1) and Co is canopy
Table 4.1: Plot mean moisture content (%) and standard deviation (SD) of different tree componentsacross the chronosequence.
Code B9 C14 D14 G25 D30 C45
Stand age 9 14 14 25 30 45
Stemwood 48.54 58.90 61.00 54.39 51.62 47.71
SD 2.87 5.35 4.98 3.89 3.02 3.43
Stem bark 45.20 52.77 62.66 57.26 59.00 52.42
SD 2.75 6.19 0.96 2.58 2.56 3.75
Deadwood 0* 27.45 18.72 21.90 16.86 27.43
SD 3.26 3.85 5.33 1.24 8.39
Roots 51.64 56.69 53.37 53.03 50.89 51.32
SD 2.88 6.18 2.14 2.07 3.2 1.96
Foliage 46.77 55.83 60.80 61.47 58.67 49.67
SD 2.1 3.83 3.11 1.61 3.68 3.46
* There was no deadwood on the 9 year old trees.
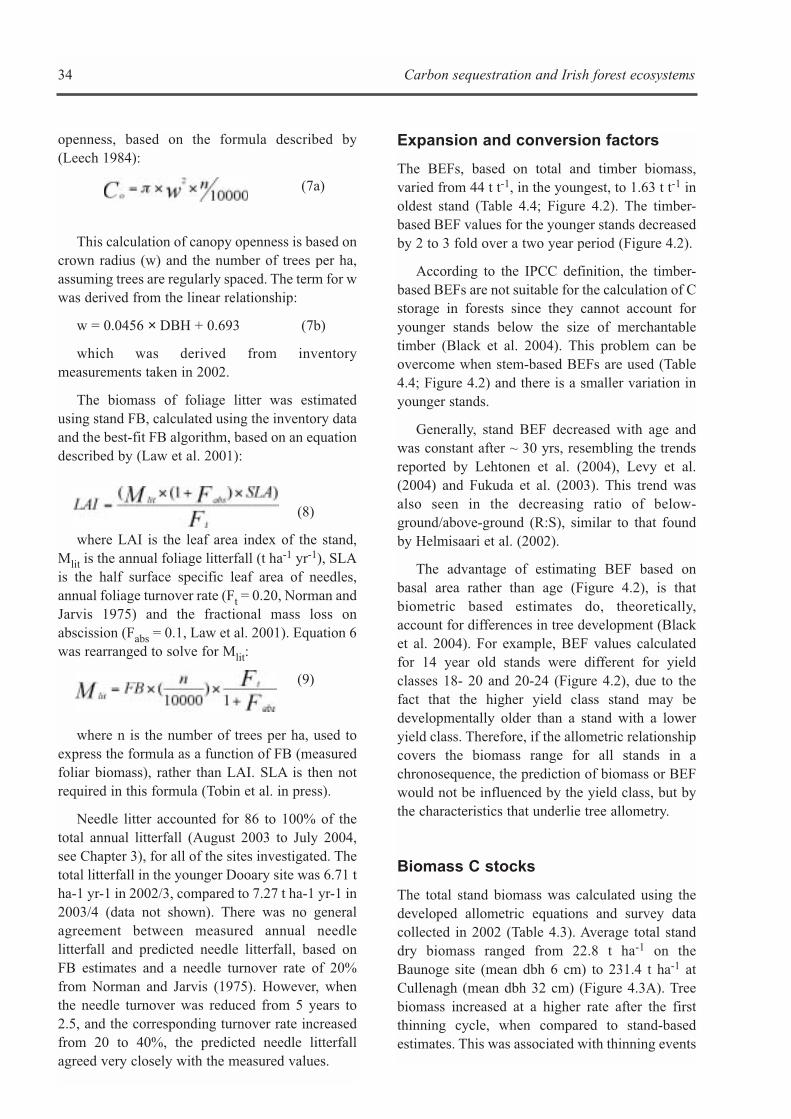
openness, based on the formula described by(Leech 1984):
(7a)
This calculation of canopy openness is based oncrown radius (w) and the number of trees per ha,assuming trees are regularly spaced. The term for wwas derived from the linear relationship:
w = 0.0456 × DBH + 0.693 (7b)
which was derived from inventorymeasurements taken in 2002.
The biomass of foliage litter was estimatedusing stand FB, calculated using the inventory dataand the best-fit FB algorithm, based on an equationdescribed by (Law et al. 2001):
(8)
where LAI is the leaf area index of the stand,Mlit is the annual foliage litterfall (t ha-1 yr-1), SLAis the half surface specific leaf area of needles,annual foliage turnover rate (Ft = 0.20, Norman andJarvis 1975) and the fractional mass loss onabscission (Fabs = 0.1, Law et al. 2001). Equation 6was rearranged to solve for Mlit:
(9)
where n is the number of trees per ha, used toexpress the formula as a function of FB (measuredfoliar biomass), rather than LAI. SLA is then notrequired in this formula (Tobin et al. in press).
Needle litter accounted for 86 to 100% of thetotal annual litterfall (August 2003 to July 2004,see Chapter 3), for all of the sites investigated. Thetotal litterfall in the younger Dooary site was 6.71 tha-1 yr-1 in 2002/3, compared to 7.27 t ha-1 yr-1 in2003/4 (data not shown). There was no generalagreement between measured annual needlelitterfall and predicted needle litterfall, based onFB estimates and a needle turnover rate of 20%from Norman and Jarvis (1975). However, whenthe needle turnover was reduced from 5 years to2.5, and the corresponding turnover rate increasedfrom 20 to 40%, the predicted needle litterfallagreed very closely with the measured values.
34 Carbon sequestration and Irish forest ecosystems
Expansion and conversion factors
The BEFs, based on total and timber biomass,varied from 44 t t-1, in the youngest, to 1.63 t t-1 inoldest stand (Table 4.4; Figure 4.2). The timber-based BEF values for the younger stands decreasedby 2 to 3 fold over a two year period (Figure 4.2).
According to the IPCC definition, the timber-based BEFs are not suitable for the calculation of Cstorage in forests since they cannot account foryounger stands below the size of merchantabletimber (Black et al. 2004). This problem can beovercome when stem-based BEFs are used (Table4.4; Figure 4.2) and there is a smaller variation inyounger stands.
Generally, stand BEF decreased with age andwas constant after ~ 30 yrs, resembling the trendsreported by Lehtonen et al. (2004), Levy et al.(2004) and Fukuda et al. (2003). This trend wasalso seen in the decreasing ratio of below-ground/above-ground (R:S), similar to that foundby Helmisaari et al. (2002).
The advantage of estimating BEF based onbasal area rather than age (Figure 4.2), is thatbiometric based estimates do, theoretically,account for differences in tree development (Blacket al. 2004). For example, BEF values calculatedfor 14 year old stands were different for yieldclasses 18- 20 and 20-24 (Figure 4.2), due to thefact that the higher yield class stand may bedevelopmentally older than a stand with a loweryield class. Therefore, if the allometric relationshipcovers the biomass range for all stands in achronosequence, the prediction of biomass or BEFwould not be influenced by the yield class, but bythe characteristics that underlie tree allometry.
Biomass C stocks
The total stand biomass was calculated using thedeveloped allometric equations and survey datacollected in 2002 (Table 4.3). Average total standdry biomass ranged from 22.8 t ha-1 on theBaunoge site (mean dbh 6 cm) to 231.4 t ha-1 atCullenagh (mean dbh 32 cm) (Figure 4.3A). Treebiomass increased at a higher rate after the firstthinning cycle, when compared to stand-basedestimates. This was associated with thinning events
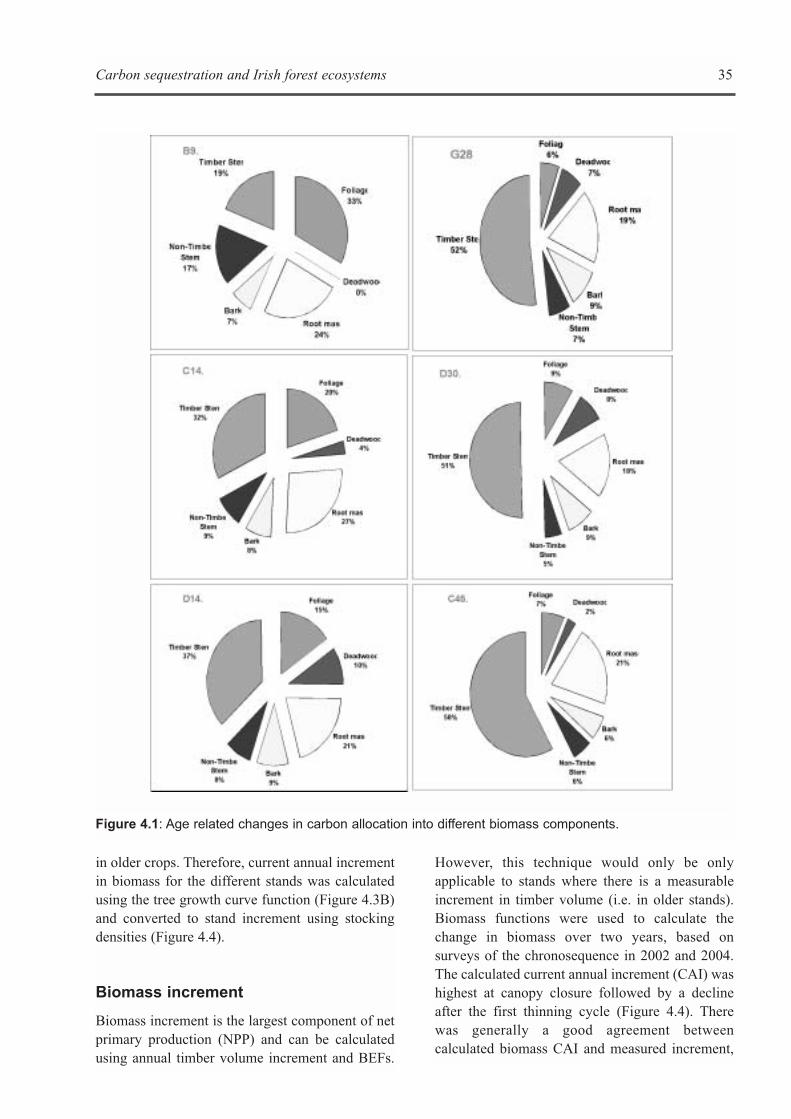
Carbon sequestration and Irish forest ecosystems 35
Figure 4.1: Age related changes in carbon allocation into different biomass components.
in older crops. Therefore, current annual incrementin biomass for the different stands was calculatedusing the tree growth curve function (Figure 4.3B)and converted to stand increment using stockingdensities (Figure 4.4).
Biomass increment
Biomass increment is the largest component of netprimary production (NPP) and can be calculatedusing annual timber volume increment and BEFs.
However, this technique would only be onlyapplicable to stands where there is a measurableincrement in timber volume (i.e. in older stands).Biomass functions were used to calculate thechange in biomass over two years, based onsurveys of the chronosequence in 2002 and 2004.The calculated current annual increment (CAI) washighest at canopy closure followed by a declineafter the first thinning cycle (Figure 4.4). Therewas generally a good agreement betweencalculated biomass CAI and measured increment,
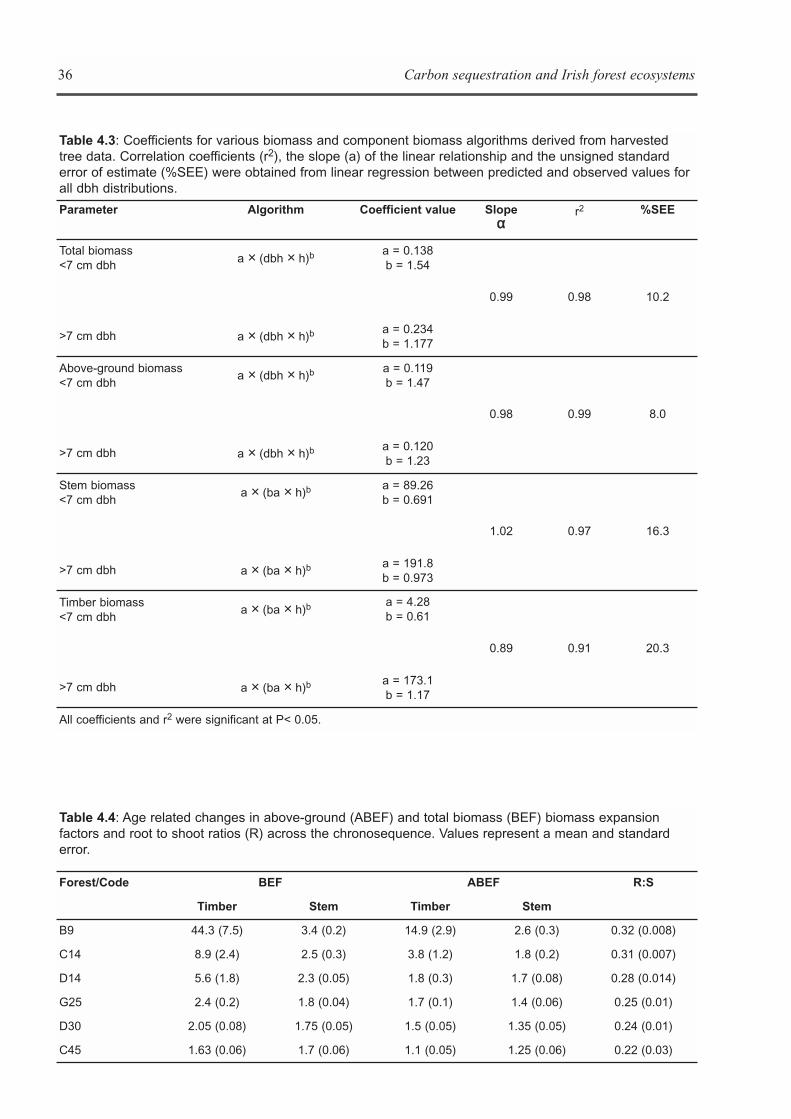
36 Carbon sequestration and Irish forest ecosystems
Table 4.3: Coefficients for various biomass and component biomass algorithms derived from harvestedtree data. Correlation coefficients (r2), the slope (a) of the linear relationship and the unsigned standarderror of estimate (%SEE) were obtained from linear regression between predicted and observed values forall dbh distributions.
Parameter Algorithm Coefficient value Slopeαα
r2 %SEE
Total biomass<7 cm dbh
a × (dbh × h)b a = 0.138b = 1.54
0.99 0.98 10.2
>7 cm dbh a × (dbh × h)b a = 0.234b = 1.177
Above-ground biomass<7 cm dbh
a × (dbh × h)b a = 0.119b = 1.47
0.98 0.99 8.0
>7 cm dbh a × (dbh × h)b a = 0.120b = 1.23
Stem biomass<7 cm dbh
a × (ba × h)b a = 89.26b = 0.691
1.02 0.97 16.3
>7 cm dbh a × (ba × h)b a = 191.8b = 0.973
Timber biomass<7 cm dbh
a × (ba × h)b a = 4.28b = 0.61
0.89 0.91 20.3
>7 cm dbh a × (ba × h)b a = 173.1b = 1.17
All coefficients and r2 were significant at P< 0.05.
Table 4.4: Age related changes in above-ground (ABEF) and total biomass (BEF) biomass expansionfactors and root to shoot ratios (R) across the chronosequence. Values represent a mean and standarderror.
Forest/Code BEF ABEF R:S
Timber Stem Timber Stem
B9 44.3 (7.5) 3.4 (0.2) 14.9 (2.9) 2.6 (0.3) 0.32 (0.008)
C14 8.9 (2.4) 2.5 (0.3) 3.8 (1.2) 1.8 (0.2) 0.31 (0.007)
D14 5.6 (1.8) 2.3 (0.05) 1.8 (0.3) 1.7 (0.08) 0.28 (0.014)
G25 2.4 (0.2) 1.8 (0.04) 1.7 (0.1) 1.4 (0.06) 0.25 (0.01)
D30 2.05 (0.08) 1.75 (0.05) 1.5 (0.05) 1.35 (0.05) 0.24 (0.01)
C45 1.63 (0.06) 1.7 (0.06) 1.1 (0.05) 1.25 (0.06) 0.22 (0.03)
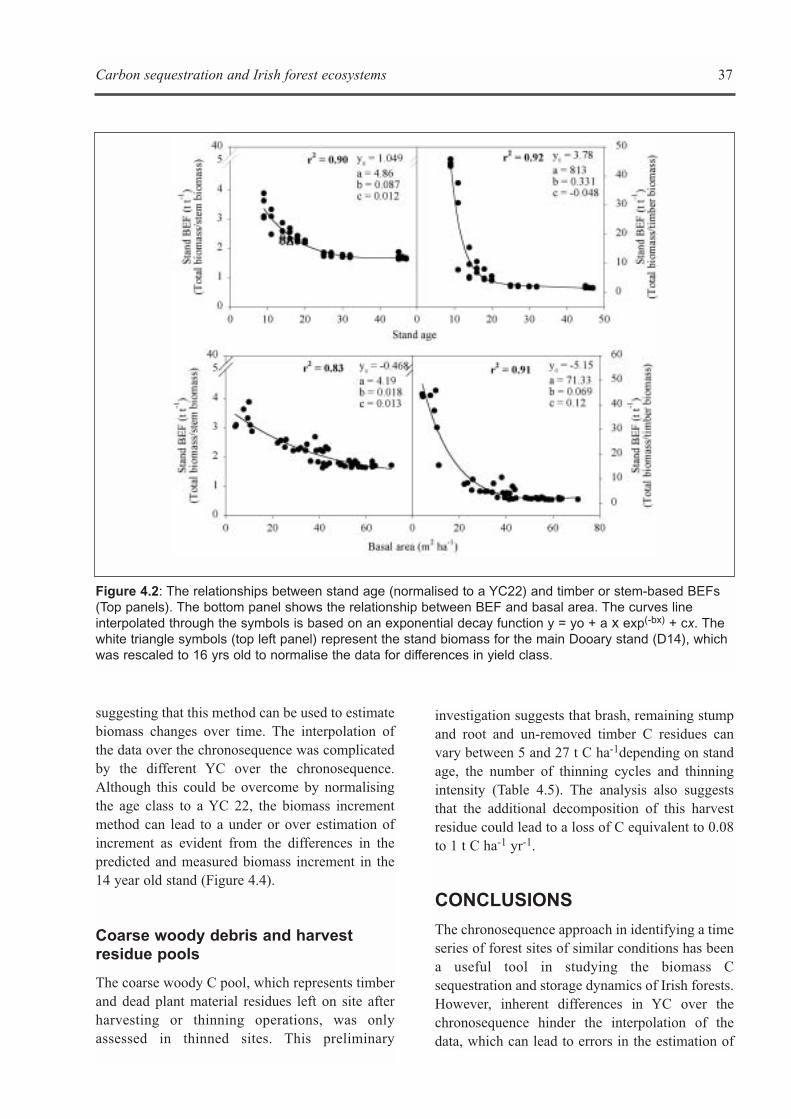
Carbon sequestration and Irish forest ecosystems 37
suggesting that this method can be used to estimatebiomass changes over time. The interpolation ofthe data over the chronosequence was complicatedby the different YC over the chronosequence.Although this could be overcome by normalisingthe age class to a YC 22, the biomass incrementmethod can lead to a under or over estimation ofincrement as evident from the differences in thepredicted and measured biomass increment in the14 year old stand (Figure 4.4).
Coarse woody debris and harvestresidue pools
The coarse woody C pool, which represents timberand dead plant material residues left on site afterharvesting or thinning operations, was onlyassessed in thinned sites. This preliminary
Figure 4.2: The relationships between stand age (normalised to a YC22) and timber or stem-based BEFs(Top panels). The bottom panel shows the relationship between BEF and basal area. The curves lineinterpolated through the symbols is based on an exponential decay function y = yo + a x exp(-bx) + cx. Thewhite triangle symbols (top left panel) represent the stand biomass for the main Dooary stand (D14), whichwas rescaled to 16 yrs old to normalise the data for differences in yield class.
investigation suggests that brash, remaining stumpand root and un-removed timber C residues canvary between 5 and 27 t C ha-1depending on standage, the number of thinning cycles and thinningintensity (Table 4.5). The analysis also suggeststhat the additional decomposition of this harvestresidue could lead to a loss of C equivalent to 0.08to 1 t C ha-1 yr-1.
CONCLUSIONS
The chronosequence approach in identifying a timeseries of forest sites of similar conditions has beena useful tool in studying the biomass Csequestration and storage dynamics of Irish forests.However, inherent differences in YC over thechronosequence hinder the interpolation of thedata, which can lead to errors in the estimation of
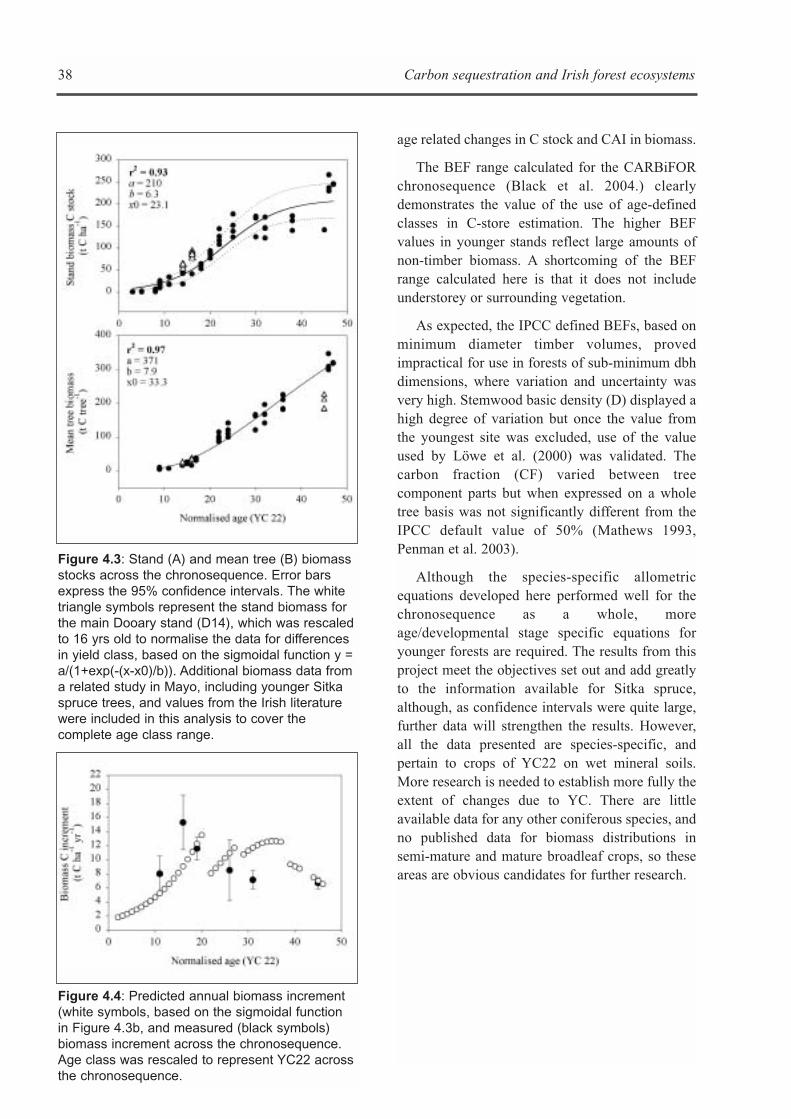
38 Carbon sequestration and Irish forest ecosystems
age related changes in C stock and CAI in biomass.
The BEF range calculated for the CARBiFORchronosequence (Black et al. 2004.) clearlydemonstrates the value of the use of age-definedclasses in C-store estimation. The higher BEFvalues in younger stands reflect large amounts ofnon-timber biomass. A shortcoming of the BEFrange calculated here is that it does not includeunderstorey or surrounding vegetation.
As expected, the IPCC defined BEFs, based onminimum diameter timber volumes, provedimpractical for use in forests of sub-minimum dbhdimensions, where variation and uncertainty wasvery high. Stemwood basic density (D) displayed ahigh degree of variation but once the value fromthe youngest site was excluded, use of the valueused by Löwe et al. (2000) was validated. Thecarbon fraction (CF) varied between treecomponent parts but when expressed on a wholetree basis was not significantly different from theIPCC default value of 50% (Mathews 1993,Penman et al. 2003).
Although the species-specific allometricequations developed here performed well for thechronosequence as a whole, moreage/developmental stage specific equations foryounger forests are required. The results from thisproject meet the objectives set out and add greatlyto the information available for Sitka spruce,although, as confidence intervals were quite large,further data will strengthen the results. However,all the data presented are species-specific, andpertain to crops of YC22 on wet mineral soils.More research is needed to establish more fully theextent of changes due to YC. There are littleavailable data for any other coniferous species, andno published data for biomass distributions insemi-mature and mature broadleaf crops, so theseareas are obvious candidates for further research.
Figure 4.3: Stand (A) and mean tree (B) biomassstocks across the chronosequence. Error barsexpress the 95% confidence intervals. The whitetriangle symbols represent the stand biomass forthe main Dooary stand (D14), which was rescaledto 16 yrs old to normalise the data for differencesin yield class, based on the sigmoidal function y =a/(1+exp(-(x-x0)/b)). Additional biomass data froma related study in Mayo, including younger Sitkaspruce trees, and values from the Irish literaturewere included in this analysis to cover thecomplete age class range.
Figure 4.4: Predicted annual biomass increment(white symbols, based on the sigmoidal functionin Figure 4.3b, and measured (black symbols)biomass increment across the chronosequence.Age class was rescaled to represent YC22 acrossthe chronosequence.
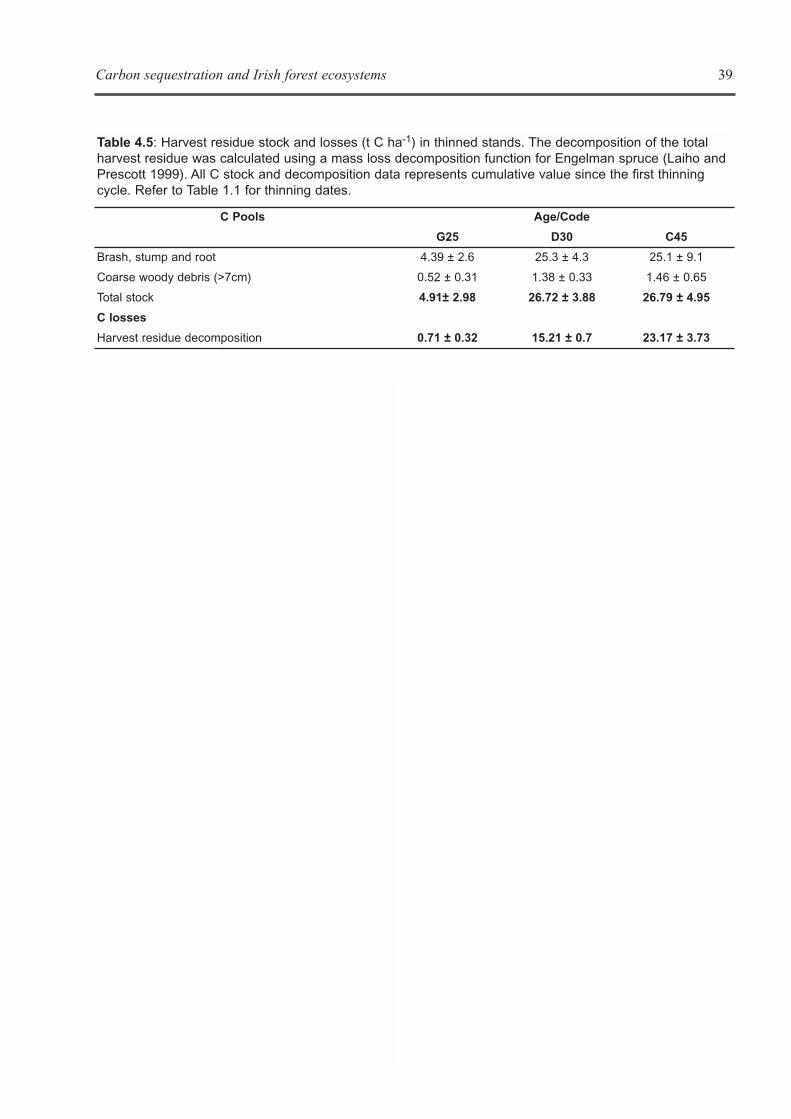
Carbon sequestration and Irish forest ecosystems 39
Table 4.5: Harvest residue stock and losses (t C ha-1) in thinned stands. The decomposition of the totalharvest residue was calculated using a mass loss decomposition function for Engelman spruce (Laiho andPrescott 1999). All C stock and decomposition data represents cumulative value since the first thinningcycle. Refer to Table 1.1 for thinning dates.
C Pools Age/Code
G25 D30 C45
Brash, stump and root 4.39 ± 2.6 25.3 ± 4.3 25.1 ± 9.1
Coarse woody debris (>7cm) 0.52 ± 0.31 1.38 ± 0.33 1.46 ± 0.65
Total stock 4.91± 2.98 26.72 ± 3.88 26.79 ± 4.95
C losses
Harvest residue decomposition 0.71 ± 0.32 15.21 ± 0.7 23.17 ± 3.73

40 Carbon sequestration and Irish forest ecosystems
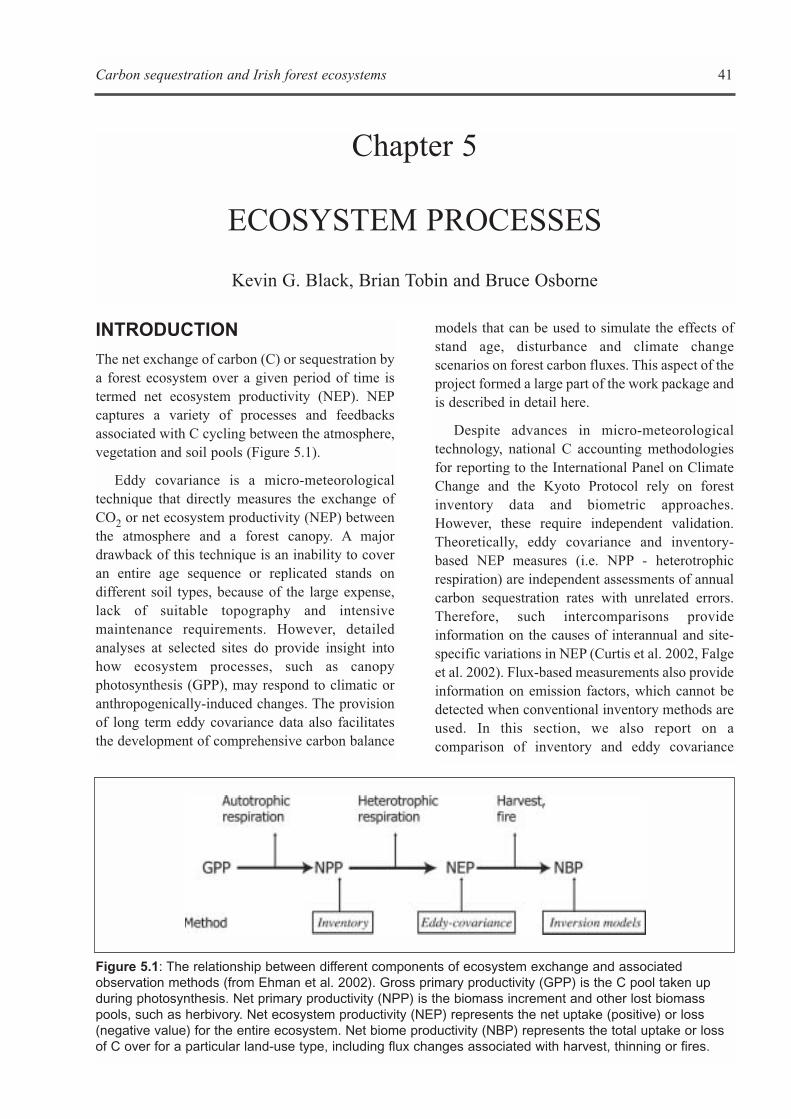
Carbon sequestration and Irish forest ecosystems 41
INTRODUCTION
The net exchange of carbon (C) or sequestration bya forest ecosystem over a given period of time istermed net ecosystem productivity (NEP). NEPcaptures a variety of processes and feedbacksassociated with C cycling between the atmosphere,vegetation and soil pools (Figure 5.1).
Eddy covariance is a micro-meteorologicaltechnique that directly measures the exchange ofCO2 or net ecosystem productivity (NEP) betweenthe atmosphere and a forest canopy. A majordrawback of this technique is an inability to coveran entire age sequence or replicated stands ondifferent soil types, because of the large expense,lack of suitable topography and intensivemaintenance requirements. However, detailedanalyses at selected sites do provide insight intohow ecosystem processes, such as canopyphotosynthesis (GPP), may respond to climatic oranthropogenically-induced changes. The provisionof long term eddy covariance data also facilitatesthe development of comprehensive carbon balance
models that can be used to simulate the effects ofstand age, disturbance and climate changescenarios on forest carbon fluxes. This aspect of theproject formed a large part of the work package andis described in detail here.
Despite advances in micro-meteorologicaltechnology, national C accounting methodologiesfor reporting to the International Panel on ClimateChange and the Kyoto Protocol rely on forestinventory data and biometric approaches.However, these require independent validation.Theoretically, eddy covariance and inventory-based NEP measures (i.e. NPP - heterotrophicrespiration) are independent assessments of annualcarbon sequestration rates with unrelated errors.Therefore, such intercomparisons provideinformation on the causes of interannual and site-specific variations in NEP (Curtis et al. 2002, Falgeet al. 2002). Flux-based measurements also provideinformation on emission factors, which cannot bedetected when conventional inventory methods areused. In this section, we also report on acomparison of inventory and eddy covariance
Chapter 5
ECOSYSTEM PROCESSES
Kevin G. Black, Brian Tobin and Bruce Osborne
Figure 5.1: The relationship between different components of ecosystem exchange and associatedobservation methods (from Ehman et al. 2002). Gross primary productivity (GPP) is the C pool taken upduring photosynthesis. Net primary productivity (NPP) is the biomass increment and other lost biomasspools, such as herbivory. Net ecosystem productivity (NEP) represents the net uptake (positive) or loss(negative value) for the entire ecosystem. Net biome productivity (NBP) represents the total uptake or lossof C over for a particular land-use type, including flux changes associated with harvest, thinning or fires.
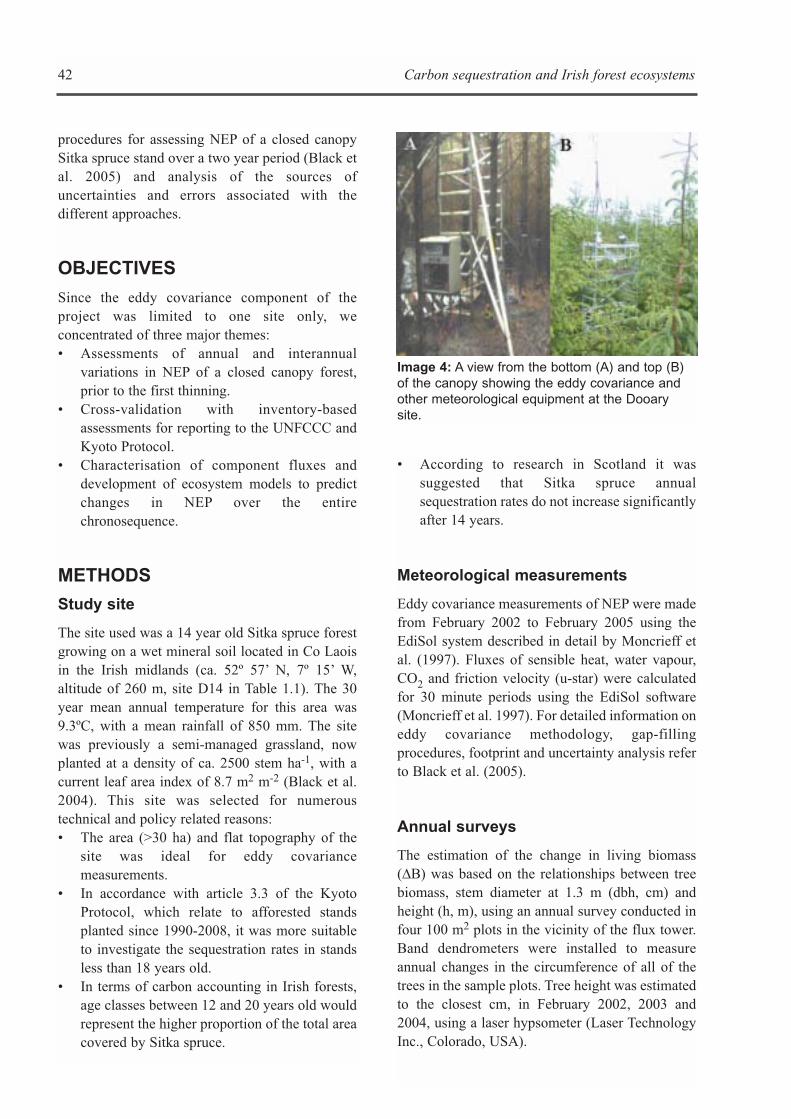
procedures for assessing NEP of a closed canopySitka spruce stand over a two year period (Black etal. 2005) and analysis of the sources ofuncertainties and errors associated with thedifferent approaches.
OBJECTIVES
Since the eddy covariance component of theproject was limited to one site only, weconcentrated of three major themes:• Assessments of annual and interannual
variations in NEP of a closed canopy forest,prior to the first thinning.
• Cross-validation with inventory-basedassessments for reporting to the UNFCCC andKyoto Protocol.
• Characterisation of component fluxes anddevelopment of ecosystem models to predictchanges in NEP over the entirechronosequence.
METHODS
Study site
The site used was a 14 year old Sitka spruce forestgrowing on a wet mineral soil located in Co Laoisin the Irish midlands (ca. 52º 57’ N, 7º 15’ W,altitude of 260 m, site D14 in Table 1.1). The 30year mean annual temperature for this area was9.3ºC, with a mean rainfall of 850 mm. The sitewas previously a semi-managed grassland, nowplanted at a density of ca. 2500 stem ha-1, with acurrent leaf area index of 8.7 m2 m-2 (Black et al.2004). This site was selected for numeroustechnical and policy related reasons:• The area (>30 ha) and flat topography of the
site was ideal for eddy covariancemeasurements.
• In accordance with article 3.3 of the KyotoProtocol, which relate to afforested standsplanted since 1990-2008, it was more suitableto investigate the sequestration rates in standsless than 18 years old.
• In terms of carbon accounting in Irish forests,age classes between 12 and 20 years old wouldrepresent the higher proportion of the total areacovered by Sitka spruce.
42 Carbon sequestration and Irish forest ecosystems
• According to research in Scotland it wassuggested that Sitka spruce annualsequestration rates do not increase significantlyafter 14 years.
Meteorological measurements
Eddy covariance measurements of NEP were madefrom February 2002 to February 2005 using theEdiSol system described in detail by Moncrieff etal. (1997). Fluxes of sensible heat, water vapour,CO2 and friction velocity (u-star) were calculatedfor 30 minute periods using the EdiSol software(Moncrieff et al. 1997). For detailed information oneddy covariance methodology, gap-fillingprocedures, footprint and uncertainty analysis referto Black et al. (2005).
Annual surveys
The estimation of the change in living biomass(∆B) was based on the relationships between treebiomass, stem diameter at 1.3 m (dbh, cm) andheight (h, m), using an annual survey conducted infour 100 m2 plots in the vicinity of the flux tower.Band dendrometers were installed to measureannual changes in the circumference of all of thetrees in the sample plots. Tree height was estimatedto the closest cm, in February 2002, 2003 and2004, using a laser hypsometer (Laser TechnologyInc., Colorado, USA).
Image 4: A view from the bottom (A) and top (B)of the canopy showing the eddy covariance andother meteorological equipment at the Dooarysite.
Development of biomass models andestimation of NPP
Biomass, dbh, and tree height data were used toderive total living and dead above-ground andbelow-ground biomass (phytomass and necromass,Equation 10) and total phytomass functions(Equation 11) for individual trees across the entirechronosequence (Black et al. 2005).
Total dead and living biomass = 0.1403 (dbh ×h)1.23 (r2 = 0.97) (10)
Total living biomass = 0.2667 (dbh × h)1.13 (r2 = 0.98) (11)
The change in living biomass (∆B) was basedon the relationship between dbh, height and totalliving biomass only (i.e. phytomass, Equation 11),to account for potential changes in standing deadbiomass (∆AGD) over time. The total and livingbiomass models were validated against anindependent Sitka spruce data set (Black et al. 2004and biomass data presented in Chapter 4) to assessthe model error associated with the estimation ofstand biomass. The % standard error of estimate(SEE) of the regression line (measured versuspredicted) was used to estimate the uncertaintyrange associated with the biomass estimates (Blacket al. 2004, 2005; see Tables 5.1 and 5.2).
Above-ground litterfall (Da) was collectedevery month over the two year period from ten 25-litre plastic buckets, randomly located within one30 x 30 m plot. Litter was separated into green leaf,dead leaf, bud scale and woody components priorto oven drying to a constant mass. The green leafand bud scale components of litterfall (Da) wereused in the NPP estimates (see Tab1e 5.1).
Below-ground detritus production (Db) wasdetermined as the product of fine root biomass andthe annual fine root turnover ratio (see Chapter 2).The change in annual soil and associated litter C(∆Csoil) content was estimated as the meandifference in soil C content of the non-unforestedgrassland (time zero) and 15 year old (flux towersite) sites in the selected chronosequence (seeChapter 3). A total of 15 soil cores (10 cm diameter
Carbon sequestration and Irish forest ecosystems 43
with a penetration depth of 30 cm) were collectedover an area of 900 m2 during the 2003/4 seasonfor C and N analysis using a C-N analyser (LecoCSN-1000, Leco Corp., St Joseph, MI, USA).
Uncertainty analysis for inventoryestimates
Potential uncertainties associated with thesampling, model and measurement errors of theinventory procedures were examined. Samplingerrors, in this case, represent the variability in theestimate due to measuring a subset of thepopulation. Model errors, such as those associatedwith allometric functions or respiration models,were estimated using %SEE from regressionanalysis of observed and predicted values (seeTable 5.2). The only measurement errors assessedwere the tolerances for dbh, using dendrometers (1mm), and height (0.05 m). The total standard errorsfor the inventory methods (σNEPeco or σNEP∆C)were estimated as:
σ2 NEPeco = σ2 ∆B + σ2Da + σ2Db + σ2RH (soil) +σ2RH (AGD) (12)
or
σ2 NEP∆C = σ2∆Cb + σ2∆Cdead + σ2∆Csoil (13)
Ecosystem models
A carbon, energy, nitrogen, water (CENW) modelwas used to estimate NEP over the entirechronosequence, based on parameters derived fromthe survey, harvest and physiological experiments.The model was validated against biomass, volumeand eddy covariance data collected between 2002and 2004.
RESULTS
Eddy covariance measurements andquality control
The site provided a fetch (representative area ofmeasurement) of 590 m in the SW direction and1420 m in the S direction, which were thedominant wind directions over the 2002 to 2005measurement period. The fetch was 250 m in the N
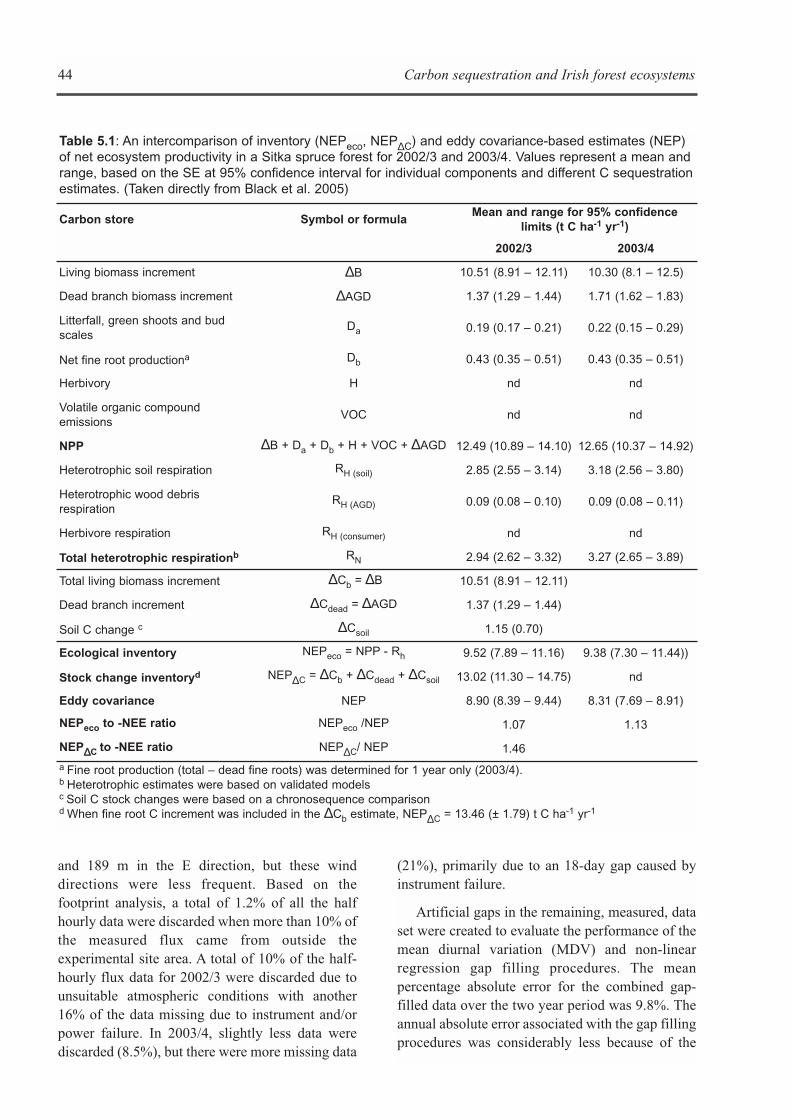
44 Carbon sequestration and Irish forest ecosystems
Table 5.1: An intercomparison of inventory (NEPeco, NEP∆C) and eddy covariance-based estimates (NEP)of net ecosystem productivity in a Sitka spruce forest for 2002/3 and 2003/4. Values represent a mean andrange, based on the SE at 95% confidence interval for individual components and different C sequestrationestimates. (Taken directly from Black et al. 2005)
Carbon store Symbol or formulaMean and range for 95% confidence
limits (t C ha-1 yr-1)
2002/3 2003/4
Living biomass increment ∆B 10.51 (8.91 – 12.11) 10.30 (8.1 – 12.5)
Dead branch biomass increment ∆AGD 1.37 (1.29 – 1.44) 1.71 (1.62 – 1.83)
Litterfall, green shoots and budscales
Da 0.19 (0.17 – 0.21) 0.22 (0.15 – 0.29)
Net fine root productiona Db 0.43 (0.35 – 0.51) 0.43 (0.35 – 0.51)
Herbivory H nd nd
Volatile organic compoundemissions
VOC nd nd
NPP ∆B + Da + Db + H + VOC + ∆AGD 12.49 (10.89 – 14.10) 12.65 (10.37 – 14.92)
Heterotrophic soil respiration RH (soil) 2.85 (2.55 – 3.14) 3.18 (2.56 – 3.80)
Heterotrophic wood debrisrespiration
RH (AGD) 0.09 (0.08 – 0.10) 0.09 (0.08 – 0.11)
Herbivore respiration RH (consumer) nd nd
Total heterotrophic respirationb RN 2.94 (2.62 – 3.32) 3.27 (2.65 – 3.89)
Total living biomass increment ∆Cb = ∆B 10.51 (8.91 – 12.11)
Dead branch increment ∆Cdead = ∆AGD 1.37 (1.29 – 1.44)
Soil C change c ∆Csoil 1.15 (0.70)
Ecological inventory NEPeco = NPP - Rh 9.52 (7.89 – 11.16) 9.38 (7.30 – 11.44))
Stock change inventoryd NEP∆C = ∆Cb + ∆Cdead + ∆Csoil 13.02 (11.30 – 14.75) nd
Eddy covariance NEP 8.90 (8.39 – 9.44) 8.31 (7.69 – 8.91)
NEPeco to -NEE ratio NEPeco /NEP 1.07 1.13
NEP∆∆C to -NEE ratio NEP∆C/ NEP 1.46
a Fine root production (total – dead fine roots) was determined for 1 year only (2003/4). b Heterotrophic estimates were based on validated modelsc Soil C stock changes were based on a chronosequence comparisond When fine root C increment was included in the ∆Cb estimate, NEP∆C = 13.46 (± 1.79) t C ha-1 yr-1
and 189 m in the E direction, but these winddirections were less frequent. Based on thefootprint analysis, a total of 1.2% of all the halfhourly data were discarded when more than 10% ofthe measured flux came from outside theexperimental site area. A total of 10% of the half-hourly flux data for 2002/3 were discarded due tounsuitable atmospheric conditions with another16% of the data missing due to instrument and/orpower failure. In 2003/4, slightly less data werediscarded (8.5%), but there were more missing data
(21%), primarily due to an 18-day gap caused byinstrument failure.
Artificial gaps in the remaining, measured, dataset were created to evaluate the performance of themean diurnal variation (MDV) and non-linearregression gap filling procedures. The meanpercentage absolute error for the combined gap-filled data over the two year period was 9.8%. Theannual absolute error associated with the gap fillingprocedures was considerably less because of the
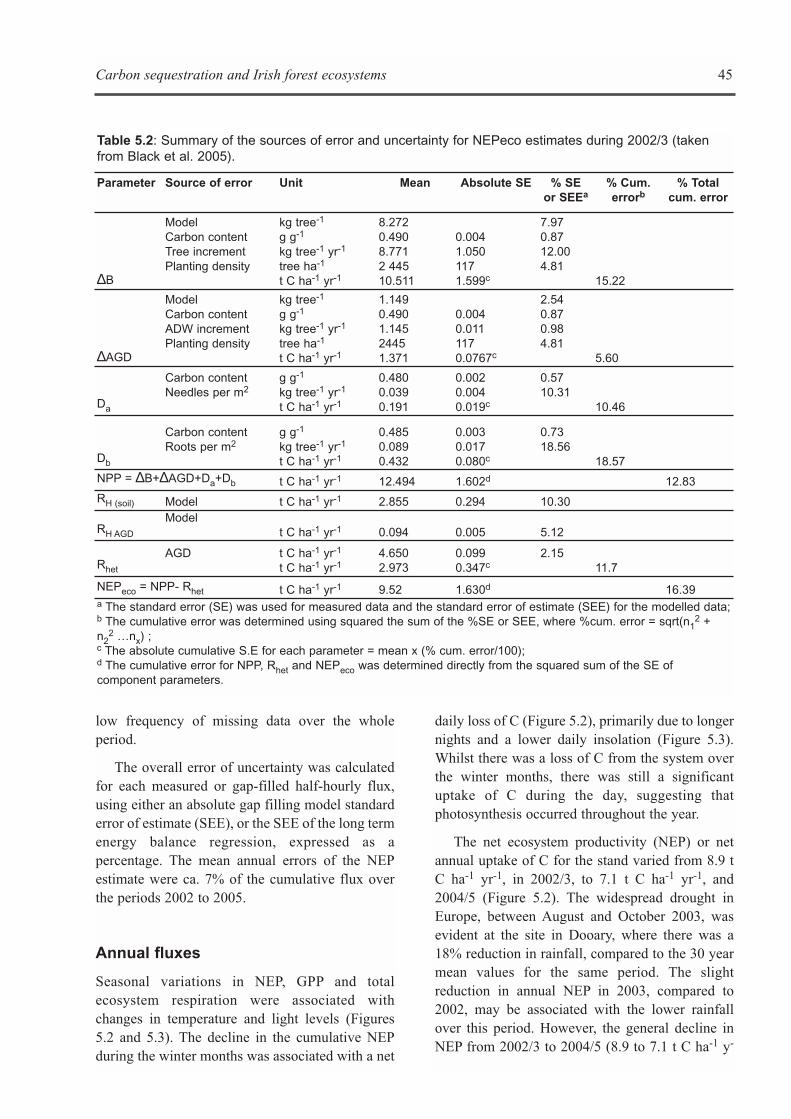
Carbon sequestration and Irish forest ecosystems 45
low frequency of missing data over the wholeperiod.
The overall error of uncertainty was calculatedfor each measured or gap-filled half-hourly flux,using either an absolute gap filling model standarderror of estimate (SEE), or the SEE of the long termenergy balance regression, expressed as apercentage. The mean annual errors of the NEPestimate were ca. 7% of the cumulative flux overthe periods 2002 to 2005.
Annual fluxes
Seasonal variations in NEP, GPP and totalecosystem respiration were associated withchanges in temperature and light levels (Figures5.2 and 5.3). The decline in the cumulative NEPduring the winter months was associated with a net
daily loss of C (Figure 5.2), primarily due to longernights and a lower daily insolation (Figure 5.3).Whilst there was a loss of C from the system overthe winter months, there was still a significantuptake of C during the day, suggesting thatphotosynthesis occurred throughout the year.
The net ecosystem productivity (NEP) or netannual uptake of C for the stand varied from 8.9 tC ha-1 yr-1, in 2002/3, to 7.1 t C ha-1 yr-1, and2004/5 (Figure 5.2). The widespread drought inEurope, between August and October 2003, wasevident at the site in Dooary, where there was a18% reduction in rainfall, compared to the 30 yearmean values for the same period. The slightreduction in annual NEP in 2003, compared to2002, may be associated with the lower rainfallover this period. However, the general decline inNEP from 2002/3 to 2004/5 (8.9 to 7.1 t C ha-1 y-
Table 5.2: Summary of the sources of error and uncertainty for NEPeco estimates during 2002/3 (takenfrom Black et al. 2005).
Parameter Source of error Unit Mean Absolute SE % SE or SEEa
% Cum.errorb
% Totalcum. error
∆B
ModelCarbon contentTree incrementPlanting density
kg tree-1
g g-1
kg tree-1 yr-1
tree ha-1
t C ha-1 yr-1
8.2720.4908.7712 44510.511
0.0041.0501171.599c
7.970.8712.004.81
15.22
∆AGD
ModelCarbon contentADW incrementPlanting density
kg tree-1
g g-1
kg tree-1 yr-1
tree ha-1
t C ha-1 yr-1
1.1490.4901.14524451.371
0.0040.0111170.0767c
2.540.870.984.81
5.60
Da
Carbon contentNeedles per m2
g g-1
kg tree-1 yr-1
t C ha-1 yr-1
0.4800.0390.191
0.0020.0040.019c
0.5710.31
10.46
Db
Carbon contentRoots per m2
g g-1
kg tree-1 yr-1
t C ha-1 yr-1
0.4850.0890.432
0.0030.0170.080c
0.7318.56
18.57
NPP = ∆B+∆AGD+Da+Db t C ha-1 yr-1 12.494 1.602d 12.83
RH (soil) Model t C ha-1 yr-1 2.855 0.294 10.30
RH AGD
Model t C ha-1 yr-1 0.094 0.005 5.12
Rhet
AGD t C ha-1 yr-1
t C ha-1 yr-14.6502.973
0.099 0.347c
2.15 11.7
NEPeco = NPP- Rhet t C ha-1 yr-1 9.52 1.630d 16.39a The standard error (SE) was used for measured data and the standard error of estimate (SEE) for the modelled data; b The cumulative error was determined using squared the sum of the %SE or SEE, where %cum. error = sqrt(n1
2 +n2
2 …nx) ; c The absolute cumulative S.E for each parameter = mean x (% cum. error/100); d The cumulative error for NPP, Rhet and NEPeco was determined directly from the squared sum of the SE ofcomponent parameters.
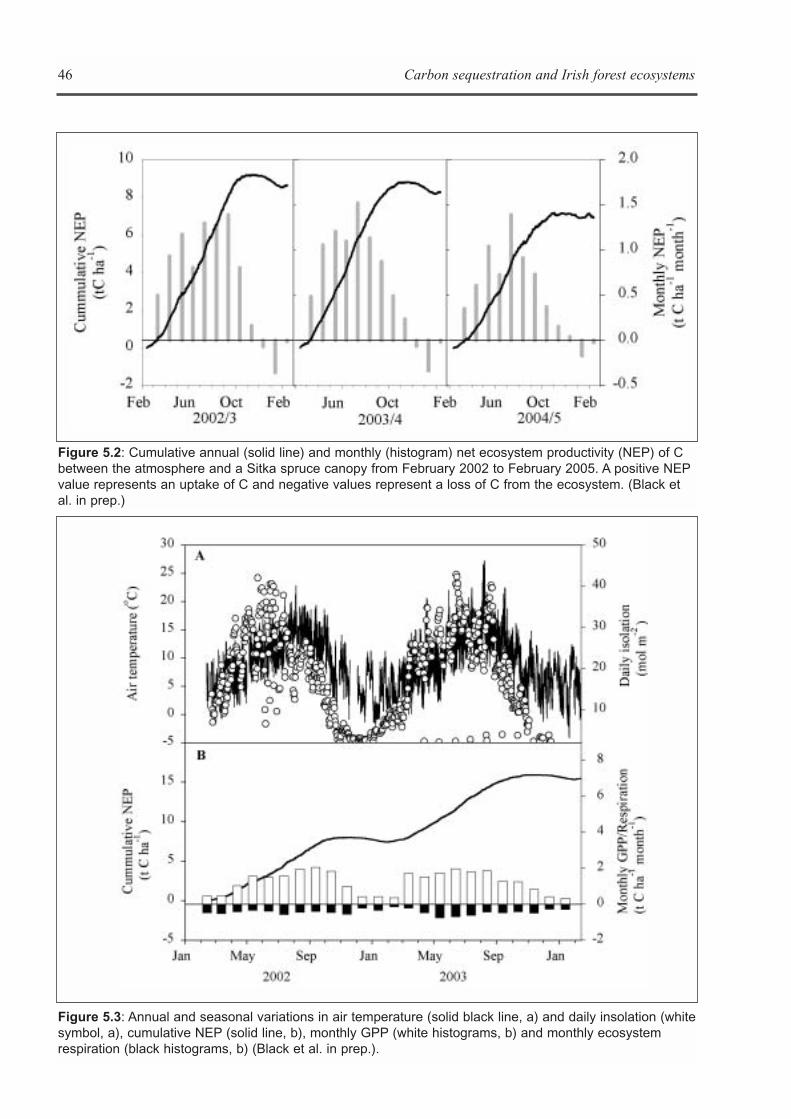
46 Carbon sequestration and Irish forest ecosystems
Figure 5.3: Annual and seasonal variations in air temperature (solid black line, a) and daily insolation (whitesymbol, a), cumulative NEP (solid line, b), monthly GPP (white histograms, b) and monthly ecosystemrespiration (black histograms, b) (Black et al. in prep.).
Figure 5.2: Cumulative annual (solid line) and monthly (histogram) net ecosystem productivity (NEP) of Cbetween the atmosphere and a Sitka spruce canopy from February 2002 to February 2005. A positive NEPvalue represents an uptake of C and negative values represent a loss of C from the ecosystem. (Black etal. in prep.)
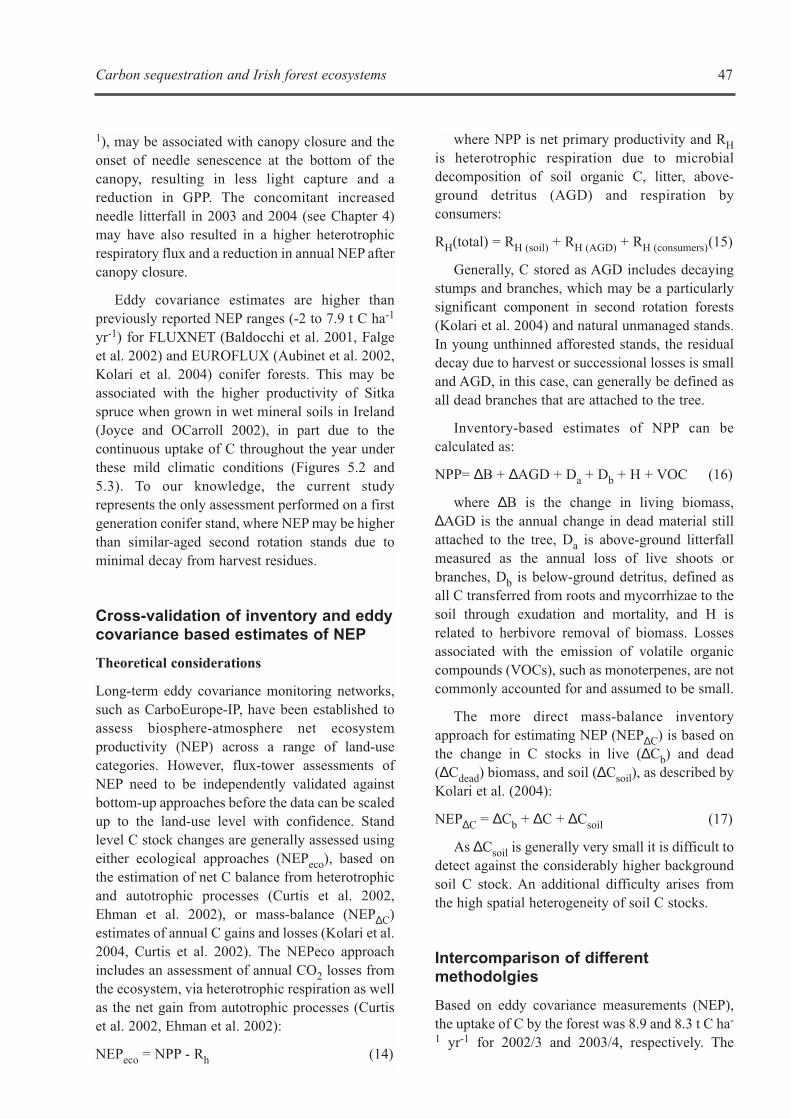
1), may be associated with canopy closure and theonset of needle senescence at the bottom of thecanopy, resulting in less light capture and areduction in GPP. The concomitant increasedneedle litterfall in 2003 and 2004 (see Chapter 4)may have also resulted in a higher heterotrophicrespiratory flux and a reduction in annual NEP aftercanopy closure.
Eddy covariance estimates are higher thanpreviously reported NEP ranges (-2 to 7.9 t C ha-1
yr-1) for FLUXNET (Baldocchi et al. 2001, Falgeet al. 2002) and EUROFLUX (Aubinet et al. 2002,Kolari et al. 2004) conifer forests. This may beassociated with the higher productivity of Sitkaspruce when grown in wet mineral soils in Ireland(Joyce and OCarroll 2002), in part due to thecontinuous uptake of C throughout the year underthese mild climatic conditions (Figures 5.2 and5.3). To our knowledge, the current studyrepresents the only assessment performed on a firstgeneration conifer stand, where NEP may be higherthan similar-aged second rotation stands due tominimal decay from harvest residues.
Cross-validation of inventory and eddycovariance based estimates of NEP
Theoretical considerations
Long-term eddy covariance monitoring networks,such as CarboEurope-IP, have been established toassess biosphere-atmosphere net ecosystemproductivity (NEP) across a range of land-usecategories. However, flux-tower assessments ofNEP need to be independently validated againstbottom-up approaches before the data can be scaledup to the land-use level with confidence. Standlevel C stock changes are generally assessed usingeither ecological approaches (NEPeco), based onthe estimation of net C balance from heterotrophicand autotrophic processes (Curtis et al. 2002,Ehman et al. 2002), or mass-balance (NEP∆C)estimates of annual C gains and losses (Kolari et al.2004, Curtis et al. 2002). The NEPeco approachincludes an assessment of annual CO2 losses fromthe ecosystem, via heterotrophic respiration as wellas the net gain from autotrophic processes (Curtiset al. 2002, Ehman et al. 2002):
NEPeco = NPP - Rh (14)
Carbon sequestration and Irish forest ecosystems 47
where NPP is net primary productivity and RHis heterotrophic respiration due to microbialdecomposition of soil organic C, litter, above-ground detritus (AGD) and respiration byconsumers:
RH(total) = RH (soil) + RH (AGD) + RH (consumers)(15)
Generally, C stored as AGD includes decayingstumps and branches, which may be a particularlysignificant component in second rotation forests(Kolari et al. 2004) and natural unmanaged stands.In young unthinned afforested stands, the residualdecay due to harvest or successional losses is smalland AGD, in this case, can generally be defined asall dead branches that are attached to the tree.
Inventory-based estimates of NPP can becalculated as:
NPP= ∆B + ∆AGD + Da + Db + H + VOC (16)
where ∆B is the change in living biomass,∆AGD is the annual change in dead material stillattached to the tree, Da is above-ground litterfallmeasured as the annual loss of live shoots orbranches, Db is below-ground detritus, defined asall C transferred from roots and mycorrhizae to thesoil through exudation and mortality, and H isrelated to herbivore removal of biomass. Lossesassociated with the emission of volatile organiccompounds (VOCs), such as monoterpenes, are notcommonly accounted for and assumed to be small.
The more direct mass-balance inventoryapproach for estimating NEP (NEP∆C) is based onthe change in C stocks in live (∆Cb) and dead(∆Cdead) biomass, and soil (∆Csoil), as described byKolari et al. (2004):
NEP∆C = ∆Cb + ∆C + ∆Csoil (17)
As ∆Csoil is generally very small it is difficult todetect against the considerably higher backgroundsoil C stock. An additional difficulty arises fromthe high spatial heterogeneity of soil C stocks.
Intercomparison of differentmethodolgies
Based on eddy covariance measurements (NEP),the uptake of C by the forest was 8.9 and 8.3 t C ha-
1 yr-1 for 2002/3 and 2003/4, respectively. The
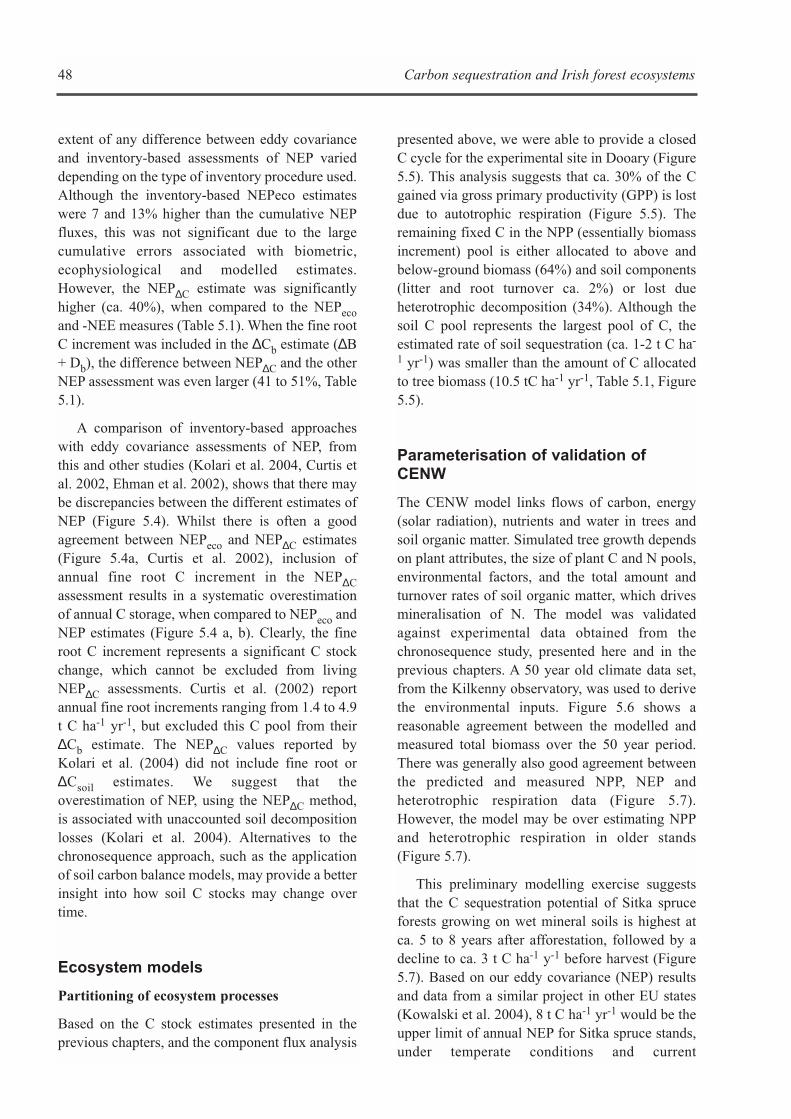
extent of any difference between eddy covarianceand inventory-based assessments of NEP varieddepending on the type of inventory procedure used.Although the inventory-based NEPeco estimateswere 7 and 13% higher than the cumulative NEPfluxes, this was not significant due to the largecumulative errors associated with biometric,ecophysiological and modelled estimates.However, the NEP∆C estimate was significantlyhigher (ca. 40%), when compared to the NEPecoand -NEE measures (Table 5.1). When the fine rootC increment was included in the ∆Cb estimate (∆B+ Db), the difference between NEP∆C and the otherNEP assessment was even larger (41 to 51%, Table5.1).
A comparison of inventory-based approacheswith eddy covariance assessments of NEP, fromthis and other studies (Kolari et al. 2004, Curtis etal. 2002, Ehman et al. 2002), shows that there maybe discrepancies between the different estimates ofNEP (Figure 5.4). Whilst there is often a goodagreement between NEPeco and NEP∆C estimates(Figure 5.4a, Curtis et al. 2002), inclusion ofannual fine root C increment in the NEP∆Cassessment results in a systematic overestimationof annual C storage, when compared to NEPeco andNEP estimates (Figure 5.4 a, b). Clearly, the fineroot C increment represents a significant C stockchange, which cannot be excluded from livingNEP∆C assessments. Curtis et al. (2002) reportannual fine root increments ranging from 1.4 to 4.9t C ha-1 yr-1, but excluded this C pool from their∆Cb estimate. The NEP∆C values reported byKolari et al. (2004) did not include fine root or∆Csoil estimates. We suggest that theoverestimation of NEP, using the NEP∆C method,is associated with unaccounted soil decompositionlosses (Kolari et al. 2004). Alternatives to thechronosequence approach, such as the applicationof soil carbon balance models, may provide a betterinsight into how soil C stocks may change overtime.
Ecosystem models
Partitioning of ecosystem processes
Based on the C stock estimates presented in theprevious chapters, and the component flux analysis
48 Carbon sequestration and Irish forest ecosystems
presented above, we were able to provide a closedC cycle for the experimental site in Dooary (Figure5.5). This analysis suggests that ca. 30% of the Cgained via gross primary productivity (GPP) is lostdue to autotrophic respiration (Figure 5.5). Theremaining fixed C in the NPP (essentially biomassincrement) pool is either allocated to above andbelow-ground biomass (64%) and soil components(litter and root turnover ca. 2%) or lost dueheterotrophic decomposition (34%). Although thesoil C pool represents the largest pool of C, theestimated rate of soil sequestration (ca. 1-2 t C ha-
1 yr-1) was smaller than the amount of C allocatedto tree biomass (10.5 tC ha-1 yr-1, Table 5.1, Figure5.5).
Parameterisation of validation ofCENW
The CENW model links flows of carbon, energy(solar radiation), nutrients and water in trees andsoil organic matter. Simulated tree growth dependson plant attributes, the size of plant C and N pools,environmental factors, and the total amount andturnover rates of soil organic matter, which drivesmineralisation of N. The model was validatedagainst experimental data obtained from thechronosequence study, presented here and in theprevious chapters. A 50 year old climate data set,from the Kilkenny observatory, was used to derivethe environmental inputs. Figure 5.6 shows areasonable agreement between the modelled andmeasured total biomass over the 50 year period.There was generally also good agreement betweenthe predicted and measured NPP, NEP andheterotrophic respiration data (Figure 5.7).However, the model may be over estimating NPPand heterotrophic respiration in older stands(Figure 5.7).
This preliminary modelling exercise suggeststhat the C sequestration potential of Sitka spruceforests growing on wet mineral soils is highest atca. 5 to 8 years after afforestation, followed by adecline to ca. 3 t C ha-1 y-1 before harvest (Figure5.7). Based on our eddy covariance (NEP) resultsand data from a similar project in other EU states(Kowalski et al. 2004), 8 t C ha-1 yr-1 would be theupper limit of annual NEP for Sitka spruce stands,under temperate conditions and current

Carbon sequestration and Irish forest ecosystems 49
Figure 5.4: Different inventory-based estimates of NEP compared to eddy covariance (-NEE) measures forvarious forest sites across Europe and the U.S.A. The solid and dashed lines represent the linearrelationships between NEPeco and -NEE (a), NEP∆C and -NEE (a & b), and NEP∆C+fine roots and -NEE (b).The dotted line represents the 1:1 slope of the relationship. Different numbered symbols represent datafrom different sites. Sites 1 to 5 are deciduous forests in the U.S.A. (Curtis et al. 2002) Walker Branch,Tennnesse (1), Morgan Monroe State Forest, Indiana (2), Harvard Forest, Massachusetts (3), University ofMichigan Biological Station, Michigan (4), and Willow Creek, Wisconsin (5). Site 6 is a Sitka spruce forestin Co Laois, Ireland, based on 2002/3 (6a) and 2003/4 (6b) data. Site 7 is also for Morgan Monroe StateForest, Indiana (see 2), but based on different estimates for 1998 (7a) and 1999 (7b) reported by Ehman etal. (2002). Sites 8a, 8b and 8c are 0(a), 12(b) and 75(c) year old second rotation Norway Spruce stands inSouthern Finland (Kolari et al. 2004). The error bars represent SE of -NEE, NEPeco and NEP∆C means forsites 6 and 7. The errors associated with NEPeco and NEP∆C for site 7 were determined from the literature,using the same procedure outlined in Table 5.2.
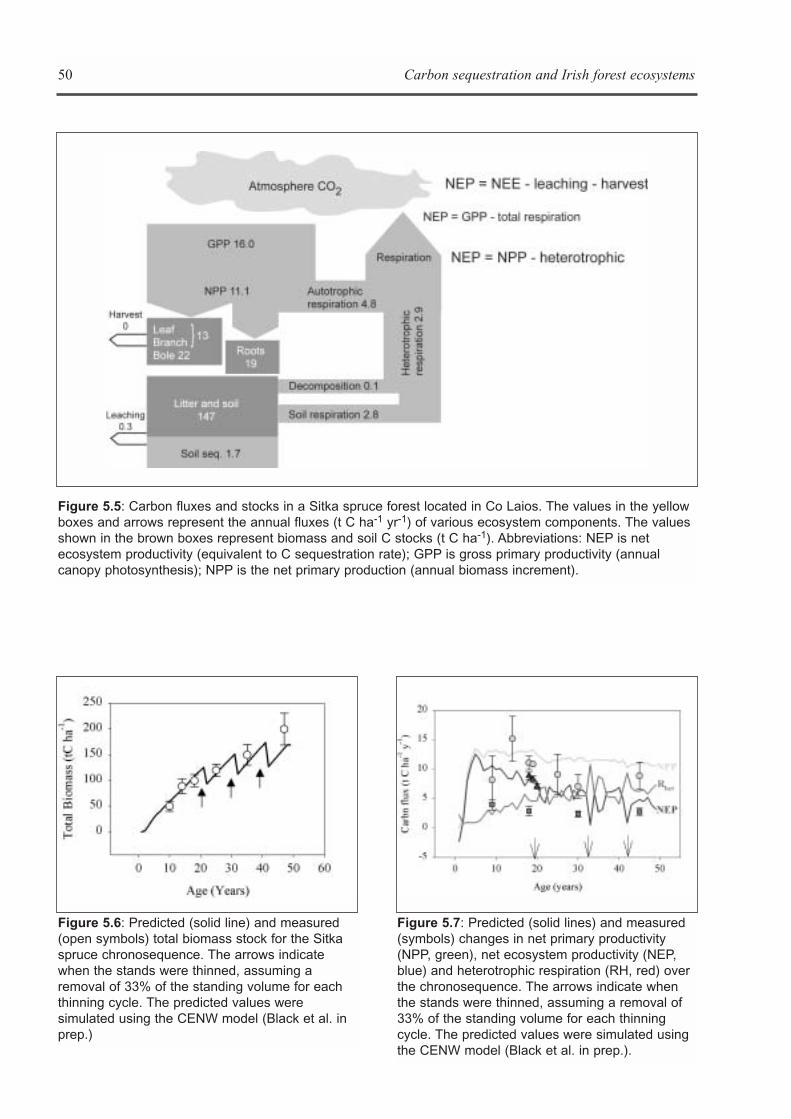
50 Carbon sequestration and Irish forest ecosystems
Figure 5.5: Carbon fluxes and stocks in a Sitka spruce forest located in Co Laios. The values in the yellowboxes and arrows represent the annual fluxes (t C ha-1 yr-1) of various ecosystem components. The valuesshown in the brown boxes represent biomass and soil C stocks (t C ha-1). Abbreviations: NEP is netecosystem productivity (equivalent to C sequestration rate); GPP is gross primary productivity (annualcanopy photosynthesis); NPP is the net primary production (annual biomass increment).
Figure 5.6: Predicted (solid line) and measured(open symbols) total biomass stock for the Sitkaspruce chronosequence. The arrows indicatewhen the stands were thinned, assuming aremoval of 33% of the standing volume for eachthinning cycle. The predicted values weresimulated using the CENW model (Black et al. inprep.)
Figure 5.7: Predicted (solid lines) and measured(symbols) changes in net primary productivity(NPP, green), net ecosystem productivity (NEP,blue) and heterotrophic respiration (RH, red) overthe chronosequence. The arrows indicate whenthe stands were thinned, assuming a removal of33% of the standing volume for each thinningcycle. The predicted values were simulated usingthe CENW model (Black et al. in prep.).
Carbon sequestration and Irish forest ecosystems 51
management regimes. Although the CENW modelpredicts that NEP may be higher in younger stands,this needs to be validated with eddy covariancemeasurements.
It is also evident from this analysis that both theC stocks and sequestration rates (NEP) are stronglyinfluenced by management events, such as thinning(Figures 5.6 and 5.7). Clearly the influence ofthinning and land-use change on C sequestration inSitka spruce forests requires further examination.
INTEGRATION OFCHORONSEQUENCE DATA
We were able to compile a closed C balance forsome sites within the chronosequence, based oncollected and modelled data from the differentworking groups (Chapters 2, 3, 4). Figure 5.8shows the completed C cycles over the differentaged stands.
• Gross primary productivity (GPP, gross uptakeof CO2) was estimated using the MAESTRAmodel, which was validated against the eddycovariance data from the flux tower site (15years, Figure 5.8). GPP was not estimated forthe grass vegetation in the younger stands.
• Heterotrophic respiration (RH) for each site wasobtained from the modelled soils data (seeChapter 2) and decomposition data from theharvest residue in older stands (see Chapter 4).
RH = RH (soil) + RH(cwd) (18)
Autotrophic respiration (RA, respiration by thetree) was estimated using the soil autotrophicrespiration modelled data (RA (soil), Chapter 2) andthe above-ground (foliage and stem growth andmaintenance respiration, (RA (foliage and stem),based on the outputs from the MAESTRA model.
RA = RA (soil) + RA (foliage and stem) (19)
Therefore RTOT = RH + RA (20)(herbivory and VOC production was assumedto be negligible)
• The increment in biomass into the foliage (Fol),stem (Stem) and root ((Root), coarse and fineroots) was obtained from harvested tree data(see Chapters 2 and 4). The change in biomassin the grassland component of the open forest
canopy (10 year old site) was estimated frommonthly biomass samples in 2003 (see Chapter3).
• The input of litter (Litter) and accumulation ofC in soils (Soil) was obtained from the resultsshown in Chapter 3. The theoretical increase oftotal below-ground C allocation (TBCA) wascalculated based on the estimation as describedby Davidson et al. 2000:
TBCA = Fs + Rh(cwd) + Fe – (Litter + HR)+ (soil+ Root) (21)
where Fs is soil respiration, Fe is leaching andrun off (assumed to be negligible), Litter isannual litter fall (Chapter 3), HR is the harvestresidue including stumps, roots and brash(annual mean after 20 yrs, see Chapter 4), Rootis the annual coarse and fine root biomassincrement (Chapters 2 and 4) and soil is theannual soil C storage based on the difference insoil C between the current year and G0 (thenon-forested site).
The net ecosystem productivity or annual Csequestration rate (NEP), which excludes harvestremovals, was calculated as:
NEP = NPP – Rh (22)where NPP is net primary productivity orannual increment of the Fol, Stem and Rootbiomass components. The calculated NEP wasvalidated against the measured NEP (mNEP)for 2003.
The chronosequence approach, together withmodelling and flux measurements (Figure 5.8),shows that afforested stands are a C sink at 10years, and possibly earlier, followed by a furtherincrease to a maximum of ~ 8 t C ha-1 yr-1 beforethe first thinning cycle. The lower NEP and GPP inyounger crops, prior to canopy closure, isassociated with a lower leaf area index and reducedlight capture together with a higher respiratoryloss, such as those associated with autotrophicrespiration and decomposition of grasslandvegetation in the 10 yr-old forest. The higheraccumulation of soil C in younger stands isassociated with a higher input of C, from litter andnon-forest vegetation, and a relatively lower C lossvia heterotrophic respiration from soils. This isconsistent with the decrease in the ratio of TBCA to
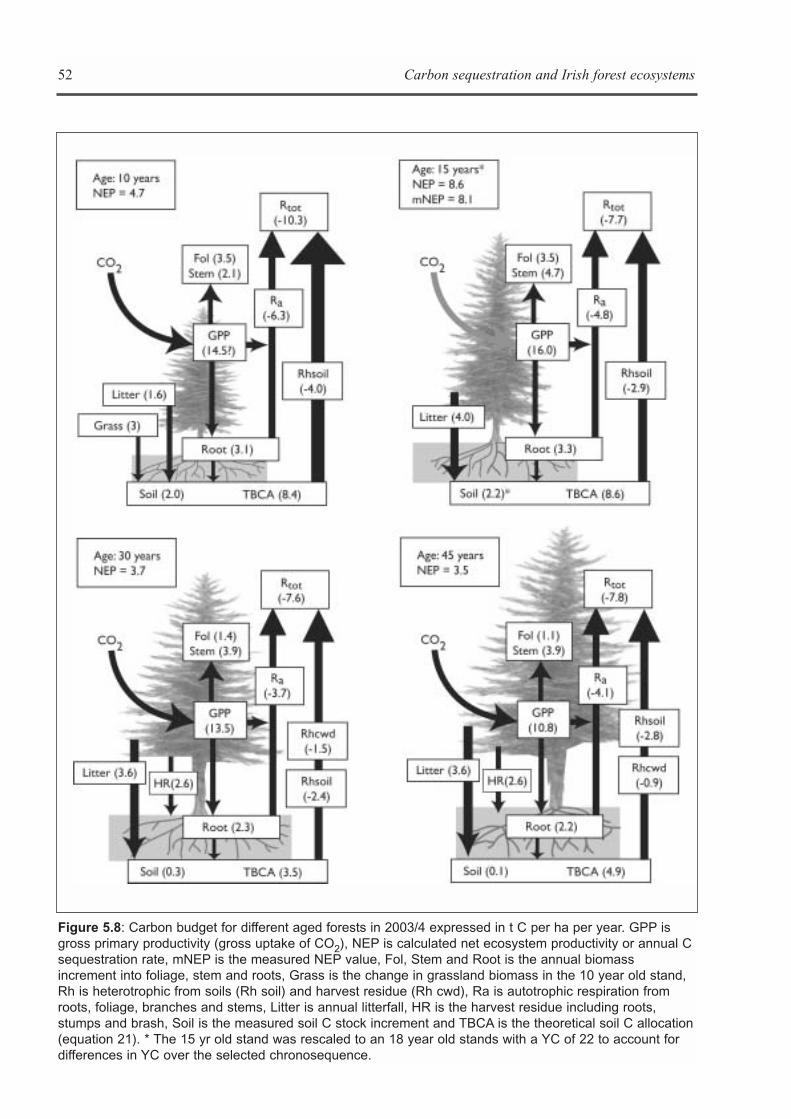
52 Carbon sequestration and Irish forest ecosystems
Figure 5.8: Carbon budget for different aged forests in 2003/4 expressed in t C per ha per year. GPP isgross primary productivity (gross uptake of CO2), NEP is calculated net ecosystem productivity or annual Csequestration rate, mNEP is the measured NEP value, Fol, Stem and Root is the annual biomassincrement into foliage, stem and roots, Grass is the change in grassland biomass in the 10 year old stand,Rh is heterotrophic from soils (Rh soil) and harvest residue (Rh cwd), Ra is autotrophic respiration fromroots, foliage, branches and stems, Litter is annual litterfall, HR is the harvest residue including roots,stumps and brash, Soil is the measured soil C stock increment and TBCA is the theoretical soil C allocation(equation 21). * The 15 yr old stand was rescaled to an 18 year old stands with a YC of 22 to account fordifferences in YC over the selected chronosequence.
Rh from 2.1, in the young stand, to 1.3 in the oldeststand. The decomposition losses are increased dueto thinning residues, which result in an additional Csource of ~1 t C ha-1 yr-1. The higher turnover anddecomposition of litter and root exudates in theolder stands in the chronosequence may, however,be associated with lower soil moisture content onsloped stands. Alternatively more soil C can be lostdue to erosion and runoff in sloped stands.
NEP declined from ~8 t C ha-1 yr-1, at closedcanopy, to ~ 3.5 t C ha-1 yr-1 in older, thinnedstands. These findings are consistent with theresults from other studies which show the NEP ofSitka spruce stands in the UK varies from ~ 7 t Cha-1 yr-1 at canopy closure to ~ 3 t C ha-1 yr-1 inolder stands (Kowalski et al. 2004). The age relateddecline in NEP in older stands is due to two majorfactors: a) a decrease in GPP, and b) an increase inmaintenance respiration. A reduction in GPP inolder stands is due to thinning, which effectivelyreduces the leaf area index and light capture by thestand. Light capture is further reduced by anincreased allocation of C into non-photosynthetictissue, such as timber. It has also been suggestedthat hydraulic constants also limit GPP in olderstands. The increase in maintenance respiration, acomponent of autotrophic respiration, is due to ahigher allocation of biomass in to non-photosynthetic tissue.
CONCLUSIONS
Given CARBiFOR’s emphasis on thechronosequence approach, it was possible todetermine the changes in biomass and soil carbonstocks over time and to relate these to the observedfluxes measured by eddy covariance for a dominantafforested soil type. Although these results areuseful for providing a baseline for carbonsequestration potential for the dominant forestspecies in Ireland, Sitka spruce, when grown onwet mineral soils, more information on carbonstocks and fluxes for stands on different soil types,as well as other forest species is required. Clearly,a critical evaluation of biomass and soil carbonstocks both for different species and for standsgrown on a range of soils is required forcountrywide reporting to the IPCC on LULUCF. Inaddition, validated estimates for biomass
Carbon sequestration and Irish forest ecosystems 53
increment, particularly for younger forests (age 3to 20 years) are also required. Given the emphasison young forests for reporting sequestrationchanges for the first commitment period, moreanalysis on afforested sites covering the periodfrom planting to the first thinning cycle is required.
The provision of one eddy covariance tower aswell as a short-term commitment to funding was amajor limitation to the ecosystem component of theCARBiFOR project because this prevented acomprehensive characterisation of water andcarbon dioxide fluxes over the chronosequence. Asinitially proposed, future investigations wouldrequire the use of at least two towers: a fixed towerused as a reference, and a second system employedto “roam” among different sites, in order to provideadequate spatial coverage of CO2 and water fluxedacross a chronosequence. The provision of longterm eddy covariance data would also facilitate thedevelopment of comprehensive carbon balancemodels that can be used to simulate the effect ofstand age, disturbance and climate changescenarios on forest carbon fluxes. Beyond changesassociated with stand age, there is a need toincorporate an analysis of the effect of disturbance,particularly those related to management practices(e.g. thinning) and land-use change, such as thetransition from grassland to forest.
Whilst standardised carbon inventorymethodologies have been developed by the IPCC(see Houghton et al. 1997), there is a clear need forstudies to reflect national circumstances. Inventorymethods, based on species and region-specificbiomass models, may be suitable for carbonaccounting reports for the first commitment period.However, it is envisaged that ‘full carbonaccounting’ would be required beyond the firstcommitment period to estimate flux lossesassociated with disturbance and land-use change,which can not be determined using conventionalbiomass or soil carbon stock estimates.

54 Carbon sequestration and Irish forest ecosystems
INTRODUCTION
A study was conducted in Co Mayo to investigatethe biomass stocks of trees, which had yet to reachmerchantable timber volume, i.e. trees of dbh <7cm. Such trees are often omitted from nationalforest inventories as they are not yet of significancefrom the forest industry perspective. However,with the carbon (C) reporting requirements underArticle 3.3 of the Kyoto Protocol they have gainedincreased significance as areas afforested post-1990 should be reported during the firstcommitment period (2008-2012). Given thatIreland experiences significant afforestation rates,a potentially large proportion of land eligible forreporting under Article 3.3 may consist of such“small trees”. The objective of this study was todevelop specific biomass functions for trees lessthan merchantable timber volume <7 cm dbh,which related tree height to total dry biomass. Two
species of commercial importance were included inthe study, lodgepole pine (P. contorta spp.contorta) and Sitka spruce. C stock estimates ofboth above- and below-ground tree componentswere investigated. Results from this study will beincluded in Green et al. (in prep.).
METHODS
Five commercial plantations of young (i.e. lessthan merchantable timber volume) Sitka spruceand lodgepole pine, planted in intimate mixtures onblanket peat in Co Mayo, were selected, rangingfrom 3 to 12 years. Three plots were randomlylocated at each site and an inventory of height anddbh (where tree height exceeded 1.3 m) wasundertaken. Fifteen trees from each species wereselected for destructive sampling from the range offive sampling sites. A tree closest to the tree of
Carbon sequestration and Irish forest ecosystems 55
Chapter 6
RELATED STUDIES
BACKGROUND
National and international collaboration with other research groups working on C sequestration issues was animportant component of the CARBiFOR project. Members of the group also participated in COST actiongroups, such as E21, and European Commission: Programme on Environment and Sustainable Development(CarboInvent Project). Collaboration with Prof. John Grace from Edinburgh University, who reviewed theproject in 2003, was also established. Prof. Grace also heads the Forest group of the CarboEurope Project.Some aspects of the work was subsequently integrated into the CarboEurope project as an associate site. Thiscollaboration involved the sharing of eddy covariance data across aproximately 50 sites over Europe.
The EPA-funded CC (Celtic Carbon) flux network, shared between UCD, TCD and UCC, was establishedto investigate C fluxes over grassland, bogs and cereal crops in Ireland. Collaboration with this networkfacilitated a comparison of ecosystem fluxes over various land-use types.
This chapter briefly outlines the major developments, resulting from the above-mentioned collaborations,which were not initially proposed at the outset of the project.
A) Biomass stocks in young Sitka spruce andlodgepole pine standsBrian Tobin and Carly Green
mean height and two others, one standard deviationeither side of the mean, were selected from eachspecies within each site.
The above-ground portions of the sample treeswere separated into their component parts (stemand foliage, i.e. branches and needles) and sampledaccording to the methodology described in Greenet al. (2005 in press). Roots were excavated from asquare measuring 2 x 2 m, to a diameter of 2 mmand to the maximum depth at which they occurred(after Tobin and Nieuwenhuis, submitted).
The dry biomass of each tree was determinedand, with the measured tree height, was used todevelop biomass functions of the form:
LN (DB) = αLN(h) + β (23)where:DB = dry biomass (kg), h = tree height (m) andα and β are parameters.
Correction factors (cf) for converting log-transformed predicted values back to arithmeticunits were calculated as the antilog of one half ofthe sample variance (Sprugel 1983).
Total tree (above-and below-ground) C stockswere developed for each site within thechronosequence using the site inventory andbiomass functions developed.
RESULTS
The height of sampled trees varied between 0.67and 4.18 m for Sitka spruce and between 0.62 and3.85 m for lodgepole across the five stands. Theaverage percentage biomass of each componentwas similar for each species, save for the root andstemwood components (Table 6.1). Rootsrepresented 6% more for Sitka spruce thanlodgepole pine and stemwood represented 4%
Table 6.1: Percentage distribution of small treecomponent biomass.
Biomass component Sitka spruce Lodgepole pine
Foliage 46 48
Roots 34 28
Stem 20 24
greater in lodgepole pine than Sitka spruce.
A strong relationship was established betweentree height and biomass, regardless of tree age, forboth species investigated. Furthermore it wasfound that the slopes and intercepts of equations fortotal biomass (TB), above-ground biomass (AGB)and below-ground biomass (BGB) were notsignificantly different between the two coniferspecies studied, therefore the sample tree data setswere combined to develop one general equation forthe two species (Table 6.2).
The tree C stocks were estimated to range from0.6 tC ha-1 to 17.6 tC ha-1 across the five sites.
DISCUSSION
A combination of national forest inventory (NFI)commitment to measuring small tree variables (i.e.such as height) and the development of species-specific allometric relationships will ensure animproved level of understanding of the importanceof small trees in the national C budget, especiallyfor countries with large-scale afforestationactivities since 1990 for reporting to the KyotoProtocol during the first commitment period.
For countries like Ireland, with policy initiativesstimulating significant annual land-use change toforestry (i.e. afforestation), accounting for suchlands under Article 3.3 may prove very importantto offsetting the liability of not reaching itsemissions target under the Kyoto Protocol.
In recognition of this, Ireland’s new NFIincorporates the measurement of height for smalltrees (less than 7 cm dbh). This information, incombination with the development of nationallyspecific tree (above- and below-ground) data formajor tree species in Ireland will result in goodpractice estimates of C stocks (Penman et al. 2003)
Table 6.2: Equations for combined species of theform ln(y) = αln(x)- β.
To estimate: αα ββ SEE cf R2
Total Biomass 2.7935 0.3562 0.0476 1.0011 0.926
Above-ground 2.8037 0.7180 0.0540 1.0015 0.912
Below-ground 2.9914 1.6696 0.0732 1.0027 0.876
56 Carbon sequestration and Irish forest ecosystems
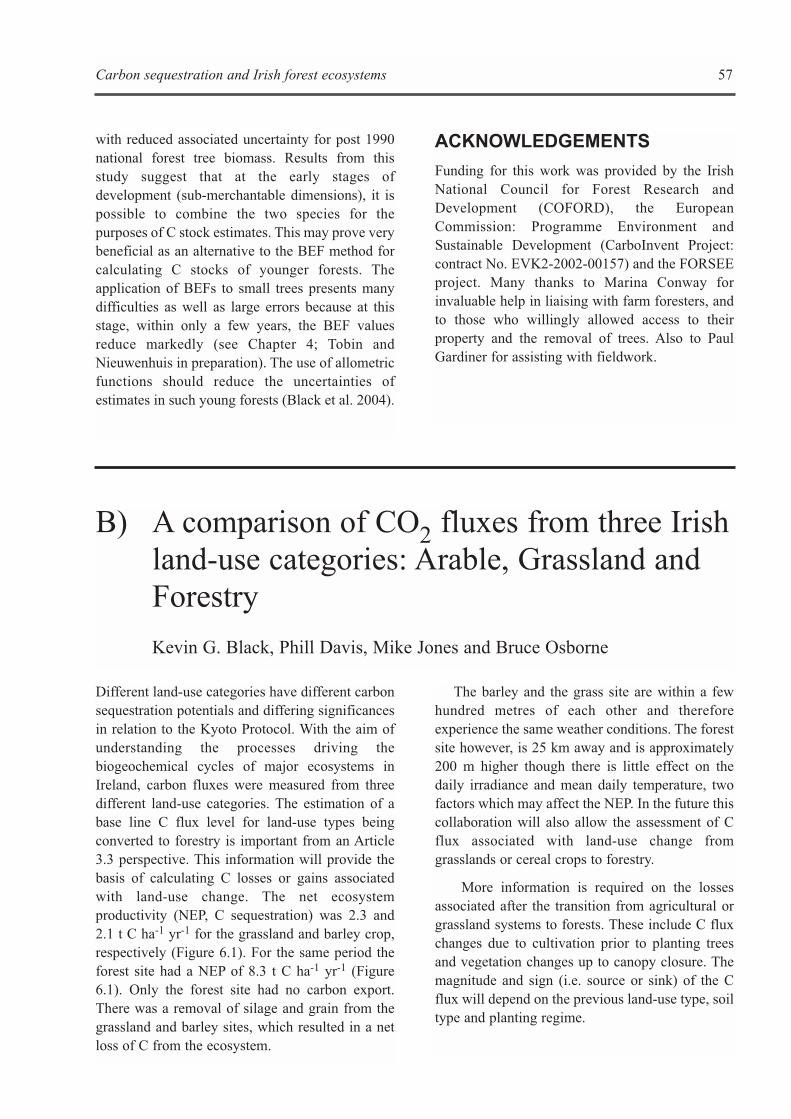
with reduced associated uncertainty for post 1990national forest tree biomass. Results from thisstudy suggest that at the early stages ofdevelopment (sub-merchantable dimensions), it ispossible to combine the two species for thepurposes of C stock estimates. This may prove verybeneficial as an alternative to the BEF method forcalculating C stocks of younger forests. Theapplication of BEFs to small trees presents manydifficulties as well as large errors because at thisstage, within only a few years, the BEF valuesreduce markedly (see Chapter 4; Tobin andNieuwenhuis in preparation). The use of allometricfunctions should reduce the uncertainties ofestimates in such young forests (Black et al. 2004).
ACKNOWLEDGEMENTS
Funding for this work was provided by the IrishNational Council for Forest Research andDevelopment (COFORD), the EuropeanCommission: Programme Environment andSustainable Development (CarboInvent Project:contract No. EVK2-2002-00157) and the FORSEEproject. Many thanks to Marina Conway forinvaluable help in liaising with farm foresters, andto those who willingly allowed access to theirproperty and the removal of trees. Also to PaulGardiner for assisting with fieldwork.
Carbon sequestration and Irish forest ecosystems 57
B) A comparison of CO2 fluxes from three Irishland-use categories: Arable, Grassland andForestry
Kevin G. Black, Phill Davis, Mike Jones and Bruce Osborne
Different land-use categories have different carbonsequestration potentials and differing significancesin relation to the Kyoto Protocol. With the aim ofunderstanding the processes driving thebiogeochemical cycles of major ecosystems inIreland, carbon fluxes were measured from threedifferent land-use categories. The estimation of abase line C flux level for land-use types beingconverted to forestry is important from an Article3.3 perspective. This information will provide thebasis of calculating C losses or gains associatedwith land-use change. The net ecosystemproductivity (NEP, C sequestration) was 2.3 and2.1 t C ha-1 yr-1 for the grassland and barley crop,respectively (Figure 6.1). For the same period theforest site had a NEP of 8.3 t C ha-1 yr-1 (Figure6.1). Only the forest site had no carbon export.There was a removal of silage and grain from thegrassland and barley sites, which resulted in a netloss of C from the ecosystem.
The barley and the grass site are within a fewhundred metres of each other and thereforeexperience the same weather conditions. The forestsite however, is 25 km away and is approximately200 m higher though there is little effect on thedaily irradiance and mean daily temperature, twofactors which may affect the NEP. In the future thiscollaboration will also allow the assessment of Cflux associated with land-use change fromgrasslands or cereal crops to forestry.
More information is required on the lossesassociated after the transition from agricultural orgrassland systems to forests. These include C fluxchanges due to cultivation prior to planting treesand vegetation changes up to canopy closure. Themagnitude and sign (i.e. source or sink) of the Cflux will depend on the previous land-use type, soiltype and planting regime.
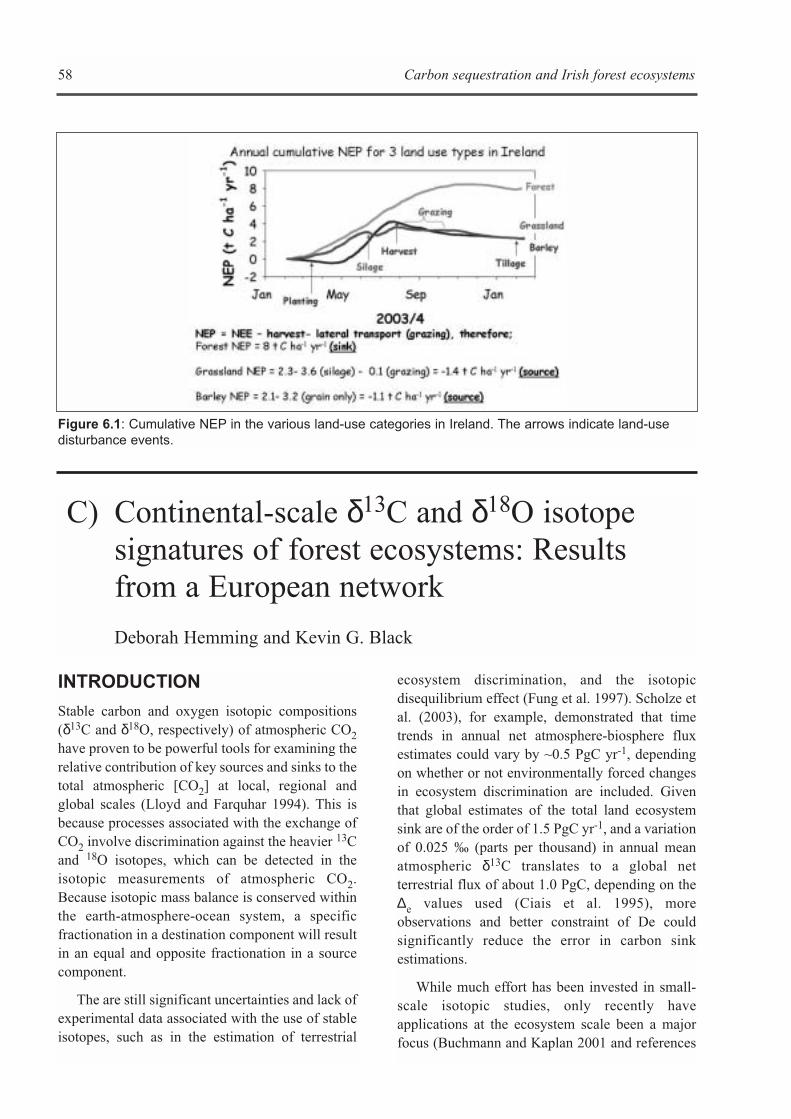
INTRODUCTION
Stable carbon and oxygen isotopic compositions(δ13C and δ18O, respectively) of atmospheric CO2have proven to be powerful tools for examining therelative contribution of key sources and sinks to thetotal atmospheric [CO2] at local, regional andglobal scales (Lloyd and Farquhar 1994). This isbecause processes associated with the exchange ofCO2 involve discrimination against the heavier 13Cand 18O isotopes, which can be detected in theisotopic measurements of atmospheric CO2.Because isotopic mass balance is conserved withinthe earth-atmosphere-ocean system, a specificfractionation in a destination component will resultin an equal and opposite fractionation in a sourcecomponent.
The are still significant uncertainties and lack ofexperimental data associated with the use of stableisotopes, such as in the estimation of terrestrial
ecosystem discrimination, and the isotopicdisequilibrium effect (Fung et al. 1997). Scholze etal. (2003), for example, demonstrated that timetrends in annual net atmosphere-biosphere fluxestimates could vary by ~0.5 PgC yr-1, dependingon whether or not environmentally forced changesin ecosystem discrimination are included. Giventhat global estimates of the total land ecosystemsink are of the order of 1.5 PgC yr-1, and a variationof 0.025 ‰ (parts per thousand) in annual meanatmospheric δ13C translates to a global netterrestrial flux of about 1.0 PgC, depending on the∆e values used (Ciais et al. 1995), moreobservations and better constraint of De couldsignificantly reduce the error in carbon sinkestimations.
While much effort has been invested in small-scale isotopic studies, only recently haveapplications at the ecosystem scale been a majorfocus (Buchmann and Kaplan 2001 and references
58 Carbon sequestration and Irish forest ecosystems
Figure 6.1: Cumulative NEP in the various land-use categories in Ireland. The arrows indicate land-usedisturbance events.
C) Continental-scale δ13C and δ18O isotopesignatures of forest ecosystems: Resultsfrom a European network
Deborah Hemming and Kevin G. Black
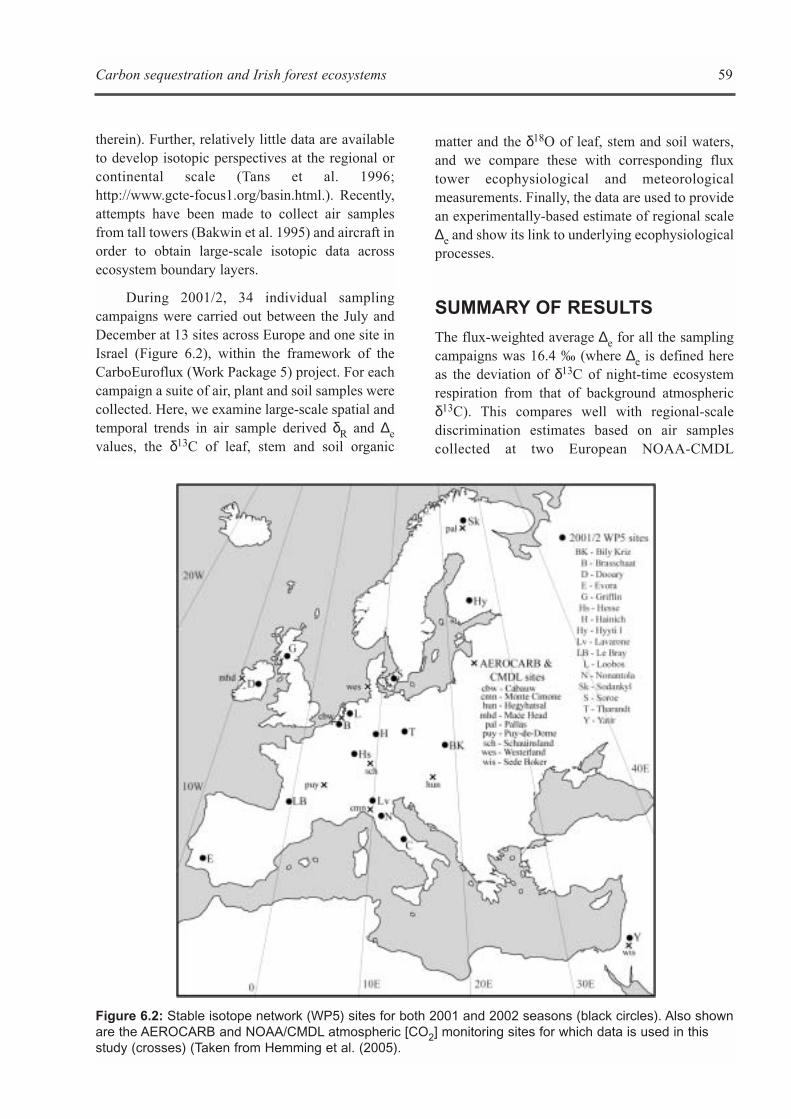
therein). Further, relatively little data are availableto develop isotopic perspectives at the regional orcontinental scale (Tans et al. 1996;http://www.gcte-focus1.org/basin.html.). Recently,attempts have been made to collect air samplesfrom tall towers (Bakwin et al. 1995) and aircraft inorder to obtain large-scale isotopic data acrossecosystem boundary layers.
During 2001/2, 34 individual samplingcampaigns were carried out between the July andDecember at 13 sites across Europe and one site inIsrael (Figure 6.2), within the framework of theCarboEuroflux (Work Package 5) project. For eachcampaign a suite of air, plant and soil samples werecollected. Here, we examine large-scale spatial andtemporal trends in air sample derived δR and ∆evalues, the δ13C of leaf, stem and soil organic
matter and the δ18O of leaf, stem and soil waters,and we compare these with corresponding fluxtower ecophysiological and meteorologicalmeasurements. Finally, the data are used to providean experimentally-based estimate of regional scale∆e and show its link to underlying ecophysiologicalprocesses.
SUMMARY OF RESULTS
The flux-weighted average ∆e for all the samplingcampaigns was 16.4 ‰ (where ∆e is defined hereas the deviation of δ13C of night-time ecosystemrespiration from that of background atmosphericδ13C). This compares well with regional-scalediscrimination estimates based on air samplescollected at two European NOAA-CMDL
Carbon sequestration and Irish forest ecosystems 59
Figure 6.2: Stable isotope network (WP5) sites for both 2001 and 2002 seasons (black circles). Also shownare the AEROCARB and NOAA/CMDL atmospheric [CO2] monitoring sites for which data is used in thisstudy (crosses) (Taken from Hemming et al. (2005).
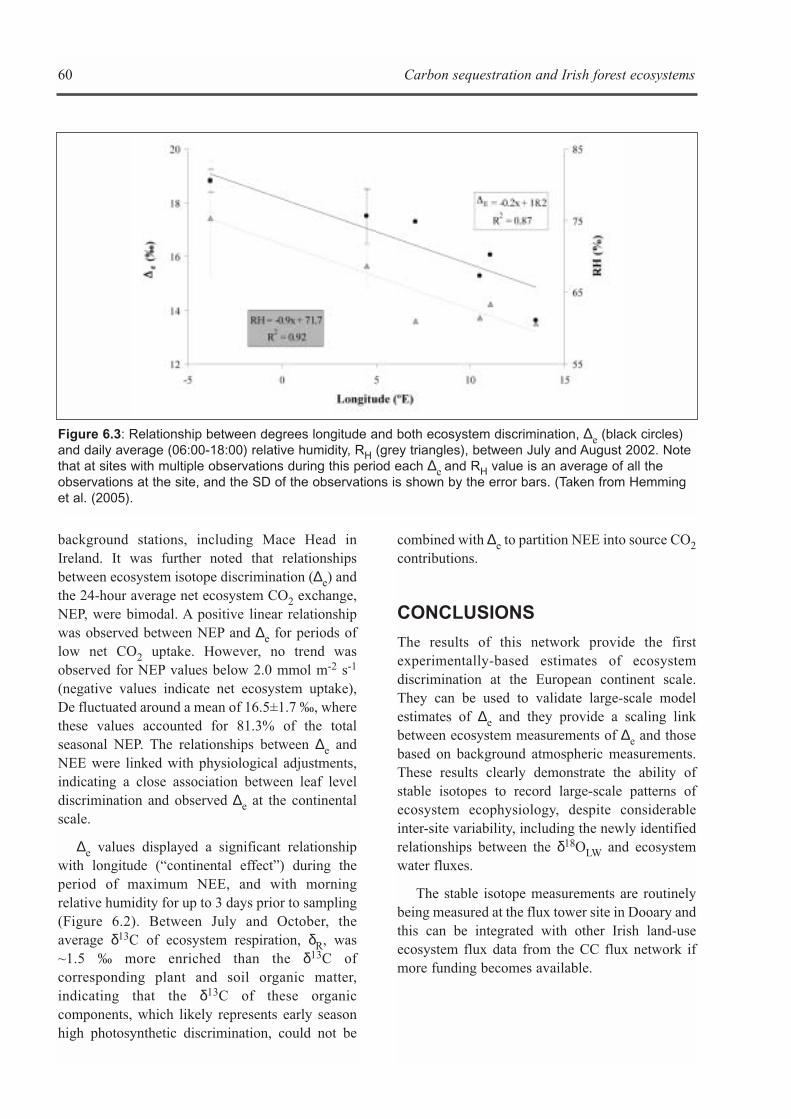
background stations, including Mace Head inIreland. It was further noted that relationshipsbetween ecosystem isotope discrimination (∆e) andthe 24-hour average net ecosystem CO2 exchange,NEP, were bimodal. A positive linear relationshipwas observed between NEP and ∆e for periods oflow net CO2 uptake. However, no trend wasobserved for NEP values below 2.0 mmol m-2 s-1
(negative values indicate net ecosystem uptake),De fluctuated around a mean of 16.5±1.7 ‰, wherethese values accounted for 81.3% of the totalseasonal NEP. The relationships between ∆e andNEE were linked with physiological adjustments,indicating a close association between leaf leveldiscrimination and observed ∆e at the continentalscale.
∆e values displayed a significant relationshipwith longitude (“continental effect”) during theperiod of maximum NEE, and with morningrelative humidity for up to 3 days prior to sampling(Figure 6.2). Between July and October, theaverage δ13C of ecosystem respiration, δR, was~1.5 ‰ more enriched than the δ13C ofcorresponding plant and soil organic matter,indicating that the δ13C of these organiccomponents, which likely represents early seasonhigh photosynthetic discrimination, could not be
combined with ∆e to partition NEE into source CO2contributions.
CONCLUSIONS
The results of this network provide the firstexperimentally-based estimates of ecosystemdiscrimination at the European continent scale.They can be used to validate large-scale modelestimates of ∆e and they provide a scaling linkbetween ecosystem measurements of ∆e and thosebased on background atmospheric measurements.These results clearly demonstrate the ability ofstable isotopes to record large-scale patterns ofecosystem ecophysiology, despite considerableinter-site variability, including the newly identifiedrelationships between the δ18OLW and ecosystemwater fluxes.
The stable isotope measurements are routinelybeing measured at the flux tower site in Dooary andthis can be integrated with other Irish land-useecosystem flux data from the CC flux network ifmore funding becomes available.
60 Carbon sequestration and Irish forest ecosystems
Figure 6.3: Relationship between degrees longitude and both ecosystem discrimination, ∆e (black circles)and daily average (06:00-18:00) relative humidity, RH (grey triangles), between July and August 2002. Notethat at sites with multiple observations during this period each ∆e and RH value is an average of all theobservations at the site, and the SD of the observations is shown by the error bars. (Taken from Hemminget al. (2005).
A) SUMMARY OF MAJORFINDINGS
Based on inventory and other physiologicalmethods, the average C sequestration rate over theentire life cycle of the selected chronosequencewas estimated to be 4 to 8 t C ha-1 yr-1. This valueis higher than a previously reported averageestimate of approximately 3.36 t C ha-1 yr-1
(Kilbride et al. 1999), based on the modeldeveloped by Dewar and Cannell (1992). Thehigher average sequestration rate reported in thisstudy was due to the inclusion of soil C stocks andthe use of improved biomass models. Our resultssuggest that the BEF value used to calculate carbonstocks for Irish forests was underestimated in thereport by Kilbride et al. (1999), particularly foryounger Sitka spruce stands. The use of the singleBEF value of 1.3 may result in an ~ 2 to 40-foldunderestimation of current carbon stocks for sitesafforested since 1990.
The chronosequence approach can be used todetermine the changes in biomass and soil carbonstocks over time. Afforested wet mineral soilsrepresent a significant C sink of 0.05 to 1 t C ha-1
yr-1. However, changes in soil C stocks may bemore difficult to measure in highly organic soils,such as peats or podsols, because of the highbackground soil C. In a study of the effect ofafforestation on soil CO2 emissions in blanket peat,Byrne and Farrell (2005) found that soil CO2emissions were ~1.7 t C ha yr-1 in a three year oldcrop of Sitka spruce. CO2 emissions were ~1.0-1.4t C ha yr-1 in lodgepole pine and 2.6 t C ha yr-1 in39 year old Sitka spruce. In peaty gley soilsafforested with Sitka spruce, the soil C decreasefrom 250 t C ha-1 in grassland site to 150 t ha-1 ina similar site afforested 40 years previously,
suggesting that peaty soils may be a source of C(Zerva et al. 2005).
The soil water properties and soil type may bean important determinant of organic matterdecomposition rates in forest soils. In wet mineralsoils, decomposition may be lower due to theinhibition of respiration at high soil water contents.In contrast, more C may be lost via decompositionprocesses in dry or well-drained gley soils with asloping topography.
The estimated annual NEP values (8 t C ha-1 yr-
1) for the 14 year old Dooary site is similar, butslightly higher, than reported values for a Sitkaspruce stand of a similar age, but grown on apodsol in Scotland (Kowalski et al. 2004). It isevident from our results and reports from a similarproject in Scotland (Kowalski et al. 2004), that 8 tC ha-1 yr-1 would be the upper limit of annual NEPfor Sitka spruce stands, under current climaticconditions and management regimes.
Inter annual variations in NEP, for the 14 yearold Dooary stand, were associated with changes intemperature and light levels. The lower NEP duringthe winter months was primarily due to the shortday length, and lower temperature to a smallerextent.
Changes in the potential sequestration rates inyounger or older stands are associated withdifferences in leaf area index (LAI), absorption oflight by the canopy and changes in the conversionefficiency of absorbed light into fixed C.Therefore, changes in current management,planting and thinning practices may potentiallyincrease C sequestration of afforested stands. It hasbeen reported that increasing rotation length doesincrease the C sequestration in European forests(Kaipainen et al. 2004).
Carbon sequestration and Irish forest ecosystems 61
Chapter 7
IMPLICATIONS FORNATIONAL REPORTING
Kevin G. Black, Kenneth A. Byrne and Gerhardt Gallagher
Beyond changes with stand age, there is a needto incorporate an analysis of the effect ofdisturbance, particularly those related tomanagement practices (e.g. thinning), and land-usechange such as a transition from grassland toforest.
It has been shown that C losses associated withclearfelling may be equivalent to the sum of Csequestered over the first 20 years of the secondforest cycle following replanting (Kowalski et al.2004). These losses may be minimised by partialclearfelling and replanting, continuous coverforestry or minimum soil disturbance followingclearfelling.
The provision of long term eddy covariancedata on different age class and forest types wouldfacilitate the development of comprehensivecarbon balance models that can be used to simulatethe effect of stand age, disturbance and climatechange scenarios on forest carbon fluxes, to aid inmanagement decisions and reporting procedures tothe UNFCCC and climate change risk assessment.More importantly, direct flux methods can be usedas a tool to validate outputs from flux and growthmodels and provide better estimates on inter annualvariability of ecosystem carbon balance, onceinstalled on a more permanent basis.
Collaboration with CarboEurope on ecosystemisotope discrimination studies show that isotopemixing model approaches do provide thepossibility to estimate total land-use fluxes using atop–down approach. However, more work in thisarea is required to assess temporal and spatialvariation in ecosystem discrimination.
B) CONTRIBUTION TONATIONAL REPORTING TO THEUNFCCC AND KYOTOPROTOCOL
The requirement for reporting on greenhouse gasemissions by sources and removals in the land-usechange and forestry sector as outlined in the IPCCGood Practice Guidance for Land-use, Land-useChange and Forestry (IPCC GPG) means that thecurrent accounting procedures need to be modified.In the past, the CARBWARE model, developed byGallagher and Hendrick (Gallagher et al. 2004),
has been used to express carbon storage from 1990on in terms of biomass over ground annually byspecies for each year for UNFCCC reporting andby total biomass for conifer and broadleavedspecies by age category for the Kyoto reportingperiod 2008-2012.
CARBWARE is a forest model which uses thespecies and age categories identified by FIPS forthe base year 1995 and grows them forward andbackward to give total forest stock for any one yearusing yield models and data for afforestation,reforestation and felling. It also identifiesafforestation going back to 1983 and can provideannual or accumulated forest tree biomass in twospecies and two age classes using estimates ofvolume increment. These data are converted tocarbon, taking into account species carbon content,basic density and a biomass expansion factor tocovert timber volume to total tree biomass. In thepast conservative BEF values (1.7) were used toconvert timber volume increment to biomassincrement for Article 3.3 reporting. Theinformation available from the CARBiFOR hasnow been used to improve the CARBWAREmodel.
These improvements include: • Development of CAI growth models, which
replace the BEF based estimates of biomass Cstock changes.
• Reporting C stock changes in five differentpools as outlined by the IPCC good practiceguidance (see Chapter 1).
Methodology
National afforestated area since 1990
The area of new forests, planted since 1990, wasobtained from FIPS and Forest service plantingrecords. These area estimates are currently beingverified using IFORIS data, which will greatlyimprove the uncertainty in our estimates. Future Csequestration rates were calculated using threeafforestation rates (i.e. 3000, 14000 and 20000 haper annum).
Whilst this model does not utilize NationalForest Inventory data, it is envisaged that thisinformation will provide valuable information ofthe age, yield class, species and soil type
62 Carbon sequestration and Irish forest ecosystems
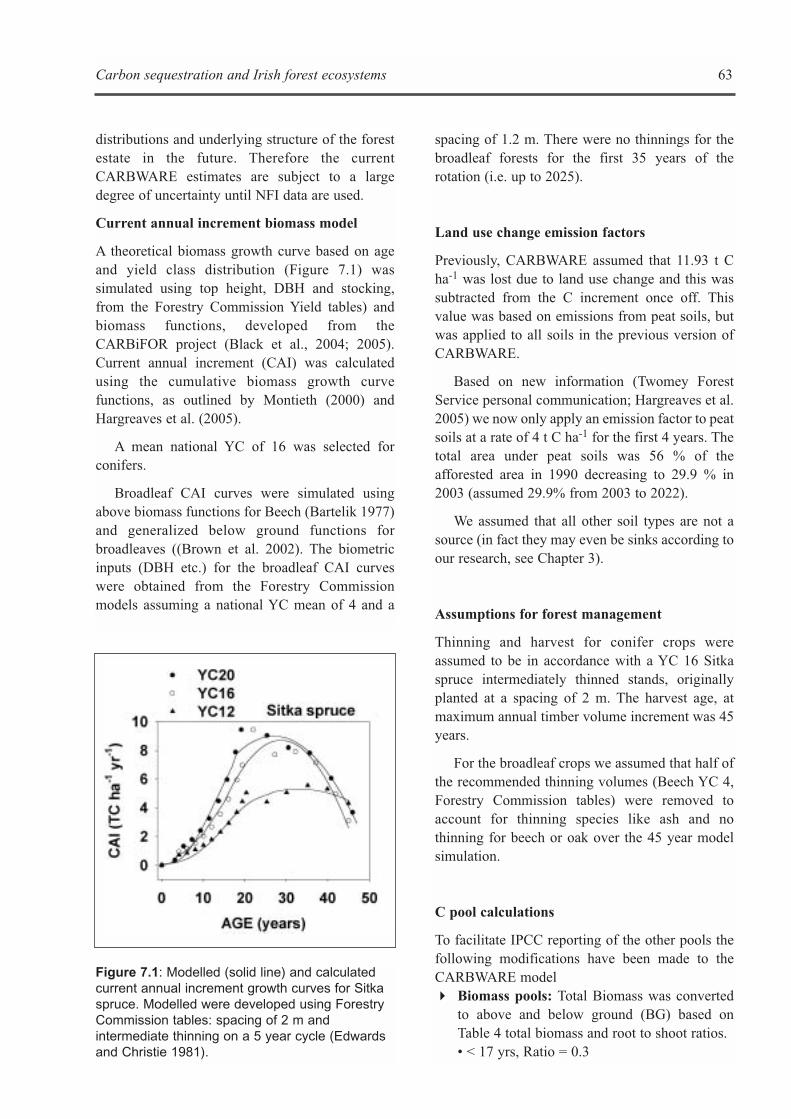
distributions and underlying structure of the forestestate in the future. Therefore the currentCARBWARE estimates are subject to a largedegree of uncertainty until NFI data are used.
Current annual increment biomass model
A theoretical biomass growth curve based on ageand yield class distribution (Figure 7.1) wassimulated using top height, DBH and stocking,from the Forestry Commission Yield tables) andbiomass functions, developed from theCARBiFOR project (Black et al., 2004; 2005).Current annual increment (CAI) was calculatedusing the cumulative biomass growth curvefunctions, as outlined by Montieth (2000) andHargreaves et al. (2005).
A mean national YC of 16 was selected forconifers.
Broadleaf CAI curves were simulated usingabove biomass functions for Beech (Bartelik 1977)and generalized below ground functions forbroadleaves ((Brown et al. 2002). The biometricinputs (DBH etc.) for the broadleaf CAI curveswere obtained from the Forestry Commissionmodels assuming a national YC mean of 4 and a
spacing of 1.2 m. There were no thinnings for thebroadleaf forests for the first 35 years of therotation (i.e. up to 2025).
Land use change emission factors
Previously, CARBWARE assumed that 11.93 t Cha-1 was lost due to land use change and this wassubtracted from the C increment once off. Thisvalue was based on emissions from peat soils, butwas applied to all soils in the previous version ofCARBWARE.
Based on new information (Twomey ForestService personal communication; Hargreaves et al.2005) we now only apply an emission factor to peatsoils at a rate of 4 t C ha-1 for the first 4 years. Thetotal area under peat soils was 56 % of theafforested area in 1990 decreasing to 29.9 % in2003 (assumed 29.9% from 2003 to 2022).
We assumed that all other soil types are not asource (in fact they may even be sinks according toour research, see Chapter 3).
Assumptions for forest management
Thinning and harvest for conifer crops wereassumed to be in accordance with a YC 16 Sitkaspruce intermediately thinned stands, originallyplanted at a spacing of 2 m. The harvest age, atmaximum annual timber volume increment was 45years.
For the broadleaf crops we assumed that half ofthe recommended thinning volumes (Beech YC 4,Forestry Commission tables) were removed toaccount for thinning species like ash and nothinning for beech or oak over the 45 year modelsimulation.
C pool calculations
To facilitate IPCC reporting of the other pools thefollowing modifications have been made to theCARBWARE model� Biomass pools: Total Biomass was converted
to above and below ground (BG) based onTable 4 total biomass and root to shoot ratios.• < 17 yrs, Ratio = 0.3
Carbon sequestration and Irish forest ecosystems 63
Figure 7.1: Modelled (solid line) and calculatedcurrent annual increment growth curves for Sitkaspruce. Modelled were developed using ForestryCommission tables: spacing of 2 m andintermediate thinning on a 5 year cycle (Edwardsand Christie 1981).
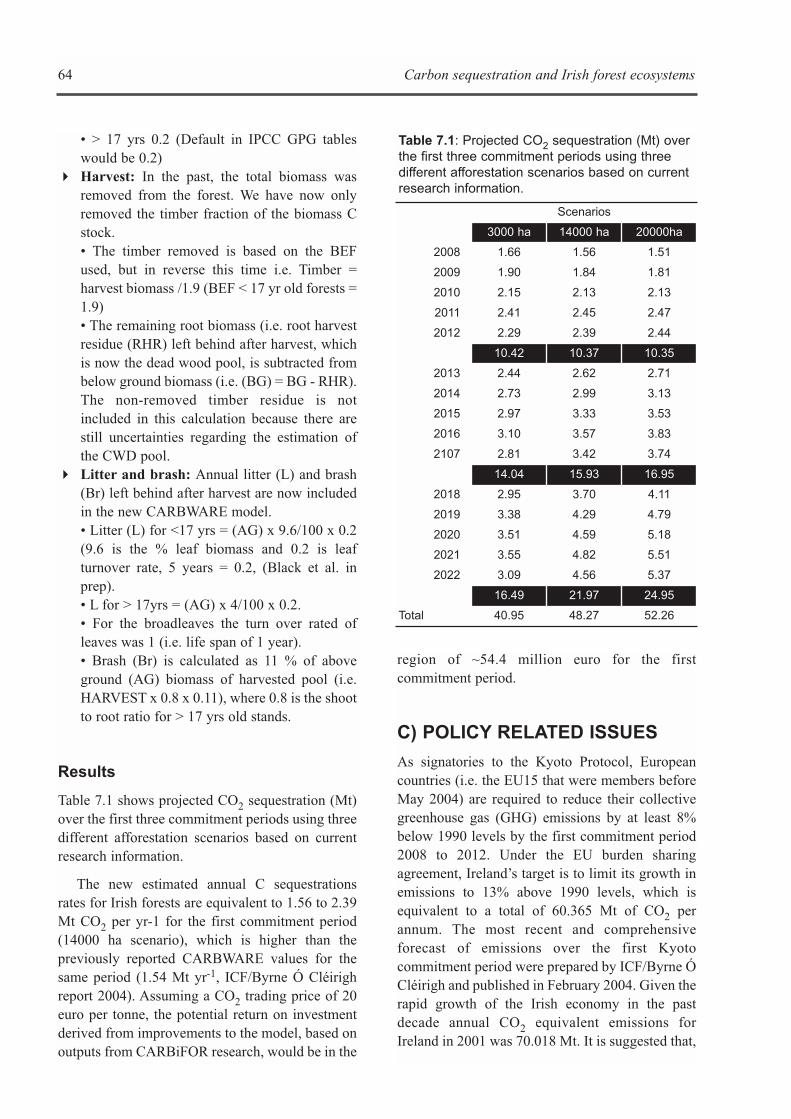
• > 17 yrs 0.2 (Default in IPCC GPG tableswould be 0.2)
� Harvest: In the past, the total biomass wasremoved from the forest. We have now onlyremoved the timber fraction of the biomass Cstock. • The timber removed is based on the BEFused, but in reverse this time i.e. Timber =harvest biomass /1.9 (BEF < 17 yr old forests =1.9)• The remaining root biomass (i.e. root harvestresidue (RHR) left behind after harvest, whichis now the dead wood pool, is subtracted frombelow ground biomass (i.e. (BG) = BG - RHR).The non-removed timber residue is notincluded in this calculation because there arestill uncertainties regarding the estimation ofthe CWD pool.
� Litter and brash: Annual litter (L) and brash(Br) left behind after harvest are now includedin the new CARBWARE model. • Litter (L) for <17 yrs = (AG) x 9.6/100 x 0.2(9.6 is the % leaf biomass and 0.2 is leafturnover rate, 5 years = 0.2, (Black et al. inprep).• L for > 17yrs = (AG) x 4/100 x 0.2. • For the broadleaves the turn over rated ofleaves was 1 (i.e. life span of 1 year).• Brash (Br) is calculated as 11 % of aboveground (AG) biomass of harvested pool (i.e.HARVEST x 0.8 x 0.11), where 0.8 is the shootto root ratio for > 17 yrs old stands.
Results
Table 7.1 shows projected CO2 sequestration (Mt)over the first three commitment periods using threedifferent afforestation scenarios based on currentresearch information.
The new estimated annual C sequestrationsrates for Irish forests are equivalent to 1.56 to 2.39Mt CO2 per yr-1 for the first commitment period(14000 ha scenario), which is higher than thepreviously reported CARBWARE values for thesame period (1.54 Mt yr-1, ICF/Byrne Ó Cléirighreport 2004). Assuming a CO2 trading price of 20euro per tonne, the potential return on investmentderived from improvements to the model, based onoutputs from CARBiFOR research, would be in the
region of ~54.4 million euro for the firstcommitment period.
C) POLICY RELATED ISSUES
As signatories to the Kyoto Protocol, Europeancountries (i.e. the EU15 that were members beforeMay 2004) are required to reduce their collectivegreenhouse gas (GHG) emissions by at least 8%below 1990 levels by the first commitment period2008 to 2012. Under the EU burden sharingagreement, Ireland’s target is to limit its growth inemissions to 13% above 1990 levels, which isequivalent to a total of 60.365 Mt of CO2 perannum. The most recent and comprehensiveforecast of emissions over the first Kyotocommitment period were prepared by ICF/Byrne ÓCléirigh and published in February 2004. Given therapid growth of the Irish economy in the pastdecade annual CO2 equivalent emissions forIreland in 2001 was 70.018 Mt. It is suggested that,
64 Carbon sequestration and Irish forest ecosystems
Table 7.1: Projected CO2 sequestration (Mt) overthe first three commitment periods using threedifferent afforestation scenarios based on currentresearch information.
Scenarios
3000 ha 14000 ha 20000ha
2008 1.66 1.56 1.51
2009 1.90 1.84 1.81
2010 2.15 2.13 2.13
2011 2.41 2.45 2.47
2012 2.29 2.39 2.44
10.42 10.37 10.35
2013 2.44 2.62 2.71
2014 2.73 2.99 3.13
2015 2.97 3.33 3.53
2016 3.10 3.57 3.83
2107 2.81 3.42 3.74
14.04 15.93 16.95
2018 2.95 3.70 4.11
2019 3.38 4.29 4.79
2020 3.51 4.59 5.18
2021 3.55 4.82 5.51
2022 3.09 4.56 5.37
16.49 21.97 24.95
Total 40.95 48.27 52.26
in the absence of emissions trading and offsets bythe forestry sector in terms of Article 3.3, the Kyototarget can be overshot by ~ 9 Mt yr-1. Under theagreed terms of the protocol carbon sequestrationby forests may be used to offset greenhouse gasemissions. For the first commitment period carbonsequestration by these ‘Kyoto’ (Article 3.3) forestsinclude deforestation, reforestation andafforestation activities since 1990. Assuming thebusiness-as-usual scenario and an annualafforestation rate of 14000 ha (average Csequestration rate of 2.06 Mt yr-1 for the firstcommitment period), it is estimated that thecontribution of Article 3.3 forests may account for~ 20% of the required reduction in nationalemissions for Ireland to meet its Kyoto target.
It should be noted that the CARBWAREmodel is continuously being improved, basedon new research information and NFI data.It is possible that the approach andparameters used in CARBWARE may havechanged by the time this report is published.
D) FUTURE DIRECTIONS
Given CARBiFORs emphasis on thechronosequence approach, it was be possible todetermine the changes in biomass and soil carbonstocks over time and to relate those to the observedfluxes measured by eddy covariance for a dominantafforested soil type. Although these results areuseful for providing a baseline for carbonsequestration potential for the dominant forestspecies in Ireland, i.e. Sitka spruce planted on wetmineral soils, more information on carbon stocksand fluxes for different soil types, and otherassociated species is required. Clearly, a criticalevaluation of biomass and soil carbon stocks fordifferent species and other soils is required for thereporting to the UNFCCC and Kyoto Protocol onLULUCF. In addition, validated estimates forbiomass increment, particularly for younger forests(age 3 to 20 years) are required. Given theemphasis on young forests for reportingsequestration changes for the first commitmentperiod, future projects should focus on afforestedsites from planting to the first thinning cycle.Furthermore, the potential for integrating the workreported here as well as future work with the
ongoing National Forest Inventory in order toimprove the national C accounting system shouldbe explored and implemented.
The provision of one eddy covariance tower aswell as a short-term commitment to funding was amajor limitation to the CARBiFOR project becausethis could not provide enough information tocharacterise the fluxes of water and carbon dioxideover the chronosequence. As initially proposed, itwill be important to have at least two towers: afixed tower used as a reference, and a secondsystem employed to “roam” among different sites,to provide for spatial coverage. In addition futurework on CO2 fluxes would be greatly strengthenedby the inclusion of automated chamber systems forcontinuous measurement of soil CO2 fluxes andresources to study fine root and soil C processes.Also, with regard to flux measurements, attentionwill need to be given to sampling, at least for shortperiods, of duplicate age classes on different soilsto characterise stand spatial variability. This aspectalso calls for extended funding as well as a secondeddy system and tower. The provision of additionaland long term eddy covariance data would alsofacilitate the development of comprehensivecarbon balance models that can be used to simulatethe effect of stand age, disturbance and climatechange scenarios on forest carbon fluxes. Thedevelopment of these models would be aimed atend users, such as forest managers and policymakers, to aid in management decisions andreporting procedures to the UNFCCC and climatechange risk assessment. Beyond changesassociated with stand age, there is a need toincorporate an analysis of the effect of disturbance,particularly those related to management practices(e.g. thinning), and land-use change such as thetransition from grassland to forest.
CARBiFOR has not only opened the door to thepotential of Irish forests to sequester C but has alsohighlighted the information gaps that remain.Much remains to be done before we have acomprehensive understanding of the role of Irishforests in mitigating GHG emissions. Future effortsshould not only focus on C sequestration in soilsand biomass but also on the role of forest biomassas a renewable energy source and its relationship toforest productivity and C sequestration.
Carbon sequestration and Irish forest ecosystems 65

66 Carbon sequestration and Irish forest ecosystems
Allen, S.E. 1989. Chemical Analysis of EcologicalMaterials (2nd edition). Blackwell ScientificPublications.
Apps, M. L., W. A. Kurz, R. J. Luxmoore, L. O.Nilsson, R. A. Sedjo, R. Schmidt, L. G.Simpson, and T. S. Vinson. 1993. Borealforests and tundra. Water, Air, and SoilPollution 70: 39-53.
Aubinet, M., Heinesch, B. and Longdoz, B. 2002.Estimation of the carbon sequestration by aheterogeneous forest: night flux corrections,heterogeneity of the site and inter-annualvariability. Global Change Biology 8: 1053-1071.
Bååth, E. and Wallander, H. 2003. Soil andrhizosphere micro-organisms have the sameQ10 for respiration in a model system. GlobalChange Biology 9, 1788-1791.
Bakwin, P.S., Tans, P.P., Zhao, C.L., Ussler, W. andQuesnell, E. 1995. Measurements of carbon-dioxide on a very tall tower. Tellus B 47(5):535-549.
Baldocchi, D., Falge, E., Gu, L., Olson, R.,Hollinger, D., Running. S,, Bernhofer, C.,Davis, K., Fuentes, J., Goldstein, A., Katul, G.,Law, B., Lee, X., Mahli, Y., Meyers, T.,Munger, W., Oechel, W., Paw, U.KT.,Pilegaard, K., Schmidt, H.P., Valentini, R.,Verma, S., Vesala, T., Wilson, K. and Wofsy, S.2001. FLUXNET: a new tool to study thetemporal and spatial variability of ecosystem-scale carbon dioxide, water vapour and energyflux densities. American MeteorologicalSociety Bulletin 82: 2415-2434.
Bartelink, H.H., Allometric relationship forbiomass and leaf area of beech (Fagussylvatica L). Annals of Forest Science 1997.54: 39-50.
Berg, B. 2000. Litter decomposition and organicmatter turnover in northern forest soils. ForestEcology and Management 133, 13-22.
Berg, B., McClaugherty, C., De Santo, A.V. andJohnson, D. 2001. Humus build-up in borealforest: effects of litter fall and its Nconcentration. Canadian Journal of ForestryResearch 31, 988-998.
Bhupinderpal-Singh, M., Nordgen, A., OttossonLöfvenius, M., Högberg, M.N., Ter-Mikaelian,M.T. and Korzukhin, M.D. 1997. Biomassequations for sixty-five North American treespecies. Forest Ecology and Management 97:1-24.
Black, K., Bolger, T., Davis, P., Nieuwenhuis, M.,Reidy, B., Saiz, G., Tobin, B. and Osborne, B.2005. Inventory and eddy covariance basedestimates of annual carbon sequestration in aSitka spruce (Picea sitchensis (Bong.) Carr.)Forest Ecosystem. Journal of European ForestResearch 1612-4669 (Paper) 1612-4677(Online) DOI: 10.1007/s10342-005-0092-4
Black, K., Tobin, B., Siaz, G., Byrne, K.A. andOsborne, B. 2004. Allometric regressions foran improved estimate of biomass expansionfactors for Ireland based on a Sitka sprucechronosequence. Irish Forestry 61:50-65.
Boone, R.D., Nadelhoffer, K.J., Canary, J.D. andKaye, J.P. 1998. Roots exert a strong influenceon the temperature sensitivity of soilrespiration. Nature 396, 570-572.
Bowden, R.D., Nadelhoffer, K.J., Boone, R.D.,Melillo, J.M. and Garrison, J.B. 1993.Contributions of above-ground litter, below-ground litter, and root respiration to total soilrespiration in a temperate mixed hardwoodforest. Canadian Journal Forest Research 23,1402-1407.
Brown, S. and Lugo, A.E. 1992. Above-groundbiomass estimates for tropical moist forests ofthe Brazilian Amazon. Interciencia 17: 8-18.
Brown, S., Gillespie, A.J.R. and Lugo, A.E. 1989.Biomass estimation methods for tropicalforests with applications to forest inventorydata. Forest Science 35: 881-902.
Carbon sequestration and Irish forest ecosystems 67
REFERENCES
Brown, S.L., Schroeder, P. and Kern, J.S. 1999.Spatial distribution of biomass in forests of theeastern USA. Forest Ecology and Management123: 81-90.
Brown, S. 2002. Measuring carbon in forests:current status and future challenges.Environmental Pollution 116:363-372.
Breymeyer, A.I., Berg, B., Gower, S.T. andJohnson, D. 1996. Carbon budget: temperateconiferous forests. In: Breyermeyer, A.I., Hall,D.O., Melillo, J.M. and Ågren, G.I. (eds).Global change: Effects on Coniferous Forestsand Grasslands. Wiley, New York, pp 41-67.
Byrne, K.A. and Perks, M. 2000. Possibilities forcarbon sequestration in Irish Forests.Biotechnology, Agronomy, Society and theEnvironment 4:300-302.
Byrne, K.A. and Farrell, E.P. 2005. The effect ofafforestation on soil carbon dioxide emissionsin blanket peatland in Ireland. Forestry 78(3):217-227. Doi:10.1093/forestry/cpi020
Byrne Ó Cléirigh. 2004. Determining the share ofnational greenhouse gas emissions foremissions trading in Ireland. Department ofEnvironment, Heritage and Local Government.www.boc.ie/Products_GHG_2.htm
Buchmann, N. 2000. Biotic and abiotic factorscontrolling soil respiration rates in Picea abiesstands. Soil Biol. Biochem. 32, 1625-1635.
Buchmann, N. and Kaplan, J.O. 2001. Carbonisotope discrimination of terrestrial ecosystems- How well do observed and modelled resultsmatch? In: Schulze, E.D., Heimann, M.,Harrison, S., Holland, E., Lloyd, J., Prentice,I.C. and Schimel, D.S. (eds). GlobalBiogeochemical Cycles in the Climate System.Academic Press, 253-266.
Ciais, P., Tans, P.P., White, J.W.C., Trolier, M.,Francey, R.J., Berry, J.A., Randall, D.R.,Sellers, P.J., Collatz, J.G. and Schimel, D.S.1995. Partitioning of ocean and land uptake ofCO2 as inferred by δ13C measurements fromthe NOAA Climate Monitoring andDiagnostics Laboratory Global Air SamplingNetwork. Journal of Geophysical Research 100(D3): 5051-5070.
Cannell, M.G.R. 1984. Woody biomass for foreststands. Forest Ecology and Management 8:299-312.
Carey, M.L. and Farrell, E.P. 1978. Productionaccumulation and nutrient content of Sitkaspruce litterfall. Irish Forestry 35, 35-44.
Chapin, S.S., Matson, P.A., Mooney, H.A., 2002.In: Principles of Terrestrial EcosystemEcology, pp. 97-122, Springer, New York.
Christensen, B.T. 1992. Physical fractionation ofsoil and organic matter in primary particle sizeand density separates. In: Stewart, B.A (ed).Advances in Soil Science, Volume 20, 1-90.
Compton, J.E. and Boone, R.D. 2002. Soil nitrogentransformations and the role of light fractionorganic matter in forest soils. Soil Biology andBiochemistry 34, 933-943.
Curtis, P.S., Hansen, P.J., Bolstad, P., Barford, C.,Randolph, G, Schmidt, H.P. and Wilson, K.B.2002. Biometric and eddy-covariance basedestimates of annual carbon storage in fiveeastern North American deciduous forests.Agricultural and Forest Meteorology 113: 3-19.
Davidson, E.A., Belk, E. and Boone, R.D. 1998.Soil water content and temperature asindependent or confounded factors controllingsoil respiration in a temperate mixed hardwoodforest. Global Change Biology 4, 217-227.
Davidson, E.A., Verchot, L.V., Cattânio, J.H.,Ackerman, I.L. and Carvalho, J.E.M. 2000.Effects of soil water content on soil respirationin forests and cattle pastures of easternAmazonia. Biogeochemistry 48, 53-69.
Dickson, R.E. 1989. Carbon and nitrogenallocation in trees. Annals Forest Science46:631-647.
Dewar, R.C. and Cannell, M.G.R. 1992. Carbonsequestration in the trees, products and soils offorest plantations: an analysis using UKexamples. Tree Physiology 8: 239-258.
Drexhage, M., Huber, F. and Colin, F. 1999.Comparison of radial increment and volumegrowth in stems and roots of Quercus petrea.Plant and Soil 217:101-110.
68 Carbon sequestration and Irish forest ecosystems
Edwards, P.N. and Christie, J.M. 1981. Yieldmodels for forest management. ForestryCommission Booklet no. 48. HSMO, London.
Epron, D., Farque, L., Lucot, É. and Badot, P-M.1999a. Soil CO2 efflux in a beech forest:dependence on soil temperature and soil watercontent. Annals of Forest Science 56, 221-226.
Epron, D., Farque, L., Lucot, É. and Badot, P-M.1999b. Soil CO2 efflux in a beech forest: thecontribution of root respiration. Annals ofForest Science 56, 289-295.
Ewel, K.C., Cropper, W.P. and Gholz, H.L. 1986b.Soil CO2 evolution in Florida slash pineplantations. II. Importance of root respiration.Canadian Journal of Forest Research 17, 330-333.
Ehman, J.L., Schmidt, H.P., Grimmond, C.S.B.,Randolph, J.C., Hanson, P.J., Wayson, C.A. andCropley, F.D. 2002. An initial intercomparisonof micrometeorological and ecologicalinventory estimates of carbon exchange in amid-latitude deciduous forest. Global ChangeBiology 8: 575-589.
Falge, E., Baldocchi, D., Tenhunen, J,, Aubinet,M., Bakwin, P., Berbigier, P., Bernhofer, C.,Burba, G., Clement, R., Davis, K.J.,Guomundsson, J., Hollinger, D., Katul, G.,Kowalski, A., Law, B.E., Malhi, Y., Meyers, T.,Monson, R.K., Munger, J.W., Oechel, W., Paw,UK-T., Pilegaard, K., Rannik, U., Rebmann,C., Suyker, A., Valentini, R., Wilson, K. andWofsy, S. 2002. Seasonality of ecosystemrespiration and gross primary production asderived from FLUXNET measurements.Agricultural and Forest Meteorology 113: 53-74.
Fang C, Moncrieff JB, 1998. Soil CO2 efflux andits spatial variation in a Florida slash pineplantation. Plant Soil 205 (2): 135-146.
Fang C, Moncrieff JB. 1999. A model for soil CO2production and transport 1: Modeldevelopment. Agriculture Forest Meteorology95 (4): 225-236
Fang, C. and Moncrieff, J.B. 2001. Thedependence of soil CO2 efflux on temperature.Soil Biology and Biochemistry 33, 155-165.
Fierer, N., Allen, A.S., Schimel, J.P. and Holden,P.A. 2003. Controls on microbial CO2production: a comparison of surface andsubsurface soil horizons. Global ChangeBiology 9, 1322-1332.
Fukuda, M., Iehara, T. and Matsumoto, M. 2003.Carbon stock estimates for sugi and hinokiforests in Japan. Forest Ecology andManagement 184:1-16.
Fung, I., Field, C.B., Berry, J.A 1997. Carbon-13exchanges between the atmosphere andbiosphere. Global Biogeochemical Cycles 11,507-533.
Gallagher, G., Hendrick, E. and Byrne, K.A. 2004.Preliminary estimates of carbon stock changesin managed forests in the republic of Irelandover the period 1990-2000. Irish Forestry61(1): 35-49.
Green, C. pers. comm. School of Biology andEnvironmental Science, University CollegeDublin, Belfield, Dublin 4
Green, C., Tobin, B., O’Shea, M., Farrell, E.P. andByrne, K.A. 2005. Above- and below-groundbiomass measurements in an unthinned standof Sitka spruce (Picea sitchensis (Bong.)Carr.). Paper accepted by European Journal ofForest Research. (Published on line: DOI:10.1007/s10342-005-0093-3).
Green, C., Saiz, G., Avitabile, V., Farrell, E.P. andByrne, K.A. 2005. Soil and forest floor organiccarbon stocks in a chronosequence of Sitkaspruce. Forest Ecology and Management (inpress).
Goulden, M.L., Munger, J.W., Fan, W., Daube,B.C. and Wofsey, S.C. 1996. Measurements ofcarbon sequestration by long term eddycovariance: methods and a critical evaluationof accuracy. Global Change Biology 2: 169-182.
Goulden, M.L. and Crill, P.M. 1997. Automatedmeasurements of CO2 exchange at mosssurface of a black spruce forest. TreePhysiology 17: 537-542.
Hanson, P.J., Edwards, N.T., Garten, C.T. andAndrews, J.A. 2000. Separating root and soil
Carbon sequestration and Irish forest ecosystems 69
microbial contributions to soil respiration: Areview of methods and observations.Biogeochemistry 48, 115-146.
Hargreaves, K.J., Milne, R. and Cannell, M.G.R.2005. Carbon balance of afforested peatland inScotland. Foresty 76: 299-317.
Hemming, D., Yakir, D., Black, K., Buchmann, N.,Burlet, R., Cescatti, A., Clement, R., Gross, P.,Granier, A., Grünwald, T., Havrankova, K.,Janous, D., Janssens, I.A., Knohl, A., Östne, B.,Kowalski, A., Laurila, T., Marcolla, B.,Matteucci, G., Moncrieff, J., Moors, E.J.,Osborne, B., Santos Pereira, J., Pihlatie, M.,Pilegaard, K., Ponti, C., Rosova, Z., Rossi, F.,Scartazz, A. and Vesal, T. 2005. Pan-Europeanδ13C values of air and organic matter fromforest ecosystems. Global Change Biology 11:1065-1073.
Högberg, P., Nordgren, A. and Buchmann, N.2001. Large-scale forest girdling shows thatcurrent photosynthesis drives soil respiration.Nature 411, 789-792.
Houghton, J.T., Meira Filho, L.G., Lim, B.,Treanton, K., Mamaty, I., Bonduki, Y., Griggs,D.J. and Callander, B.A. 1997. Revised 1996Intergovernmental Panel on Climate ChangeGuidelines for National Greenhouse GasInventories. IPCC/OECD/IEA, Paris, France.
Helmisaari, H.-S., Makkonen, K., Kellomäki, S.,Valtonen, E. and Mälkönen, E. 2002. Below-and above-ground biomass, production andnitrogen use in Scots pine stands in easternFinland. Forest Ecology and Management165:317-326.
Hanson, P.J., Edwards, N.T., Garten, C.T. andAndrews, J.A. 2000. Separating root and soilmicrobial contributions to soil respiration: Areview of methods and observations.Biogeochemistry 48, 115-146.
Irvine, J. and Law, B.E. 2002. Contrasting soilrespiration in young and old-growth ponderosapine forests. Global Change Biology 8, 1183-1194.
IPCC. 2001. Climate Change (2001): TheScientific Basis. Contribution of WorkingGroup I to the Third Assessment Report of the
Intergovernmental Panel on Climate Change.Cambridge University Press, Cambridge,United Kingdom and New York. 881pp.
Joyce, P.M. and OCarroll, N. 2002. Sitka spruce inIreland. COFORD, Dublin.
Kaipainen, T., Laiski, J., Pussinen, A. andKarjalainen, T. 2004. Managing carbon sinksby changing rotation length in Europeanforests. Environmental Science and Policy7:205-219.
Kilbride, C.M., Byrne, K.A. and Gardiner, J.J.1999. Carbon sequestration and Irish forests.COFORD, Dublin, 37p.
Kirschbaum, M.U.F. 1995. The temperaturedependence of soil organic matterdecomposition, and the effect of globalwarming on soil organic C storage. SoilBiology and Biochemistry 27, 753-760.
Kirschbaum, M.U.F. and Paul K.I. 2002.Modelling C and N dynamics in forest soilswith a modified version of the CENTURYmodel. Soil Biology and Biochemistry 34, 341-354.
Klopatek, J.M. 2002. Below-ground carbon poolsand processes in different age stands ofDouglas-fir. Tree Physiology 22, 197-204.
Kolari, P., Pumpanen, J., Rannik, Ü., Ilvesniemi,H., Hari, P. and Berninger, F. 2004. Carbonbalance of different aged Scots pine forests inSouthern Finland. Global Change Biology 10:1-14 DOI 10.111/j.1529-8817.2003.00797.x
Kowalski, A., Loustau, D., Berbinger, P., Manca,G., Tedeschi, V., Borgetti, M., Valentini, R.,Kolari, P., Berninger, F., Rannik, E., Hari, P.,Rayment, M., Mencuccini, M. and Grace, J.20045. Paired comparisons between disturbedand regenerating stands in four managedforests in Europe. Global Change Biology 10:1707-1723.
Kauppi, P.E., Meilikainen, K. and Kuusela, K.1992. Biomass and carbon budget of Europeanforests, 1971-1990. Science 250: 70-78.
Kuzyakv, Y. and Cheng, W. 2001. Photosynthesiscontrols of rhizosphere respiration and organic
70 Carbon sequestration and Irish forest ecosystems
matter decomposition. Soil BiologyBiochemistry 33, 1915-1925.
Laiho, T. and Prescott, M.J. 1999. The contributionof coarse woody debris to C, N and P cycling inthree Rocky Mountain coniferous forests.Canadian Journal of Forest Research 29:1592-1603.
Law, B.E., Van Tuyl, S., Cescatti, A. andBaldocchi, D.D. 2001. Estimation of leaf areaindex in open-canopy Ponderosa pine forests atdifferent successional stages and managementregimes in Oregon. Agricultural and ForestMeteorology 108:1-14.
Lehtonen, A., Mäkipää, R., Heikkinen, J.,Sievänen, R. and Liski, J. 2004. Biomassexpansion factors (BEFs) for Scots pine,Norway spruce and birch according to standage for boreal forests. Forest Ecology andManagement 188:211-224.
Leech, J.W. 1984. Estimating crown width fromdiameter at breast height for open-grownradiata pine trees in South Australia. AustralianForest Research 14:333-337.
Levy, P.E., Hale, S.E. and Nicoll, B.C. 2004.Biomass expansion factors and root:shootratios for coniferous tree species in GreatBritain. Forestry 77:421-430.
Lloyd, J. and Farquhar, G.D. 1994. 13Cdiscrimination by the terrestrial biosphere.Oecologia 99, 201-215.
Löwe, H., Seufert, G. and Raes, F. 2000.Comparison of methods used within memberstates for estimating CO2 emissions and sinksaccording to UNFCCC and EU MonitoringMechanism: forest and other wooded land.Biotechnology, Agronomy, Society and theEnvironment 4:315-319.
Lundmark-Thelin, A. and Johansson, M-B. 1997.Influence of mechanical site preparation ondecomposition and nutrient dynamics ofNorway spruce (Picea abies (L.) Karst.) needlelitter and slash needles. Forest Ecology andManagement 96, 101-110.
McInerney, M. and Bolger, T. 2000. Temperature,wetting cycles and soil texture effects on
carbon and nitrogen dynamics in stabilizedearthworm casts. Soil Biology andBiochemistry 32, 335-349
Mathews, G. 1993. The carbon content of trees.Forestry Commission Technical Paper 4,Wrecclesham, UK.
Moncrieff JB, Fang C. 1999 A model for soil CO2production and transport 2: Application to aFlorida Pinus elliotte plantation. AgriculturalForest Meteorology 95 (4): 237-256.
Moncrieff, J.B., Massheder, J.M., de Bruin, H.,Elders, J., Friborg, T., Heusinkveld, B., Kabat,P., Scott, S., Sogaard, H. and Verhoef, A. 1997.A system to measure surface fluxes ofmomentum sensible heat, water vapour andcarbon dioxide. Journal of Hydrology 188-189:589-611.
Montieth, J.L. 2000. Fundamental equations forgrowth in uniform stands of vegetation.Agricultural Forest Meteorology 104: 5-11.
Mund, M., Kummetz, E., Hein, M., Bauer, G.A.and Schulze, E-D. 2002. Growth and carbonstocks of a spruce forest chronosequence incentral Europe. Forest Ecology andManagement 171:275-296.
Nelson, B.W., Mesquita, R., Pereira, L.G., Aquinode Souza, S., Batista, G. and Couto, L. 1999.Allometric regressions for improved estimateof secondary forest biomass in the centralAmazon. Forest Ecology and Management117: 149-167.
Norman, J.M. and Jarvis, P.G. 1975.Photosynthesis in Sitka spruce (Piceasitchensis (Bong.) Carr.): V. Radiationpenetration theory and a test case. Journal ofApplied Ecology 12, 839-878.
Olesen, P.O. 1971. The water displacement method- a fast and accurate method of determining thegreen volume of wood samples. In: Forest TreeImprovement 3. Akademisk Forlag,Copenhagen, pp. 5-16.
O'Sullivan, P. 1976. The influence of initialspacement and thinning regime upon wooddensity in Sitka spruce (Picea sitchensis(Bong.) Carr.). In: Department of Crop
Carbon sequestration and Irish forest ecosystems 71
Science, Horticulture and Forestry. UniversityCollege Dublin, Dublin.
Oliver, G.R., Beets, P.N., Garrett, L.G., Pearce,S.H., Kimberly, M.O., Ford-Robertson, J.B.and Robertson, K.A. 2004. Variation in soilcarbon in pine plantations and implications formonitoring soil carbon stocks in relation toland-use change and forest site management inNew Zealand. Forest Ecology andManagement 203, 283-295.
Ohashi, M., Gyokusen, K. and Sato, A. 2000.Contribution of root respiration to total soilrespiration in a Japanese cedar (Cryptomeriajaponica D. Don) artificial forest. EcologicalResearch 15, 323-333.
Parton, W.J., Schimel, D.S., Cole, C.V. and Ojima,D.S. 1987. Analysis of factors controlling soilorganic matter levels in Great PlainsGrasslands. Soil Science Society of AmericaJournal 51, 1173-1179.
Parkin, T.B. and Kaspari, T.C. 2003. Temperaturecontrols on diurnal carbon dioxide flux:Implications for estimating soil carbon loss.American Journal for the Society. Soil Science67, 1763-1772.
Penman, J., Gytarsky, M., Hiraishi, T., Krug, T.,Kruger, D., Pipatti, R., Buendia, L., Miya, K.,Ngara, T., Tanabe, K. and Wagner, F. (eds).2003. Intergovernmental Panel on ClimateChange Good Practice Guidance for Land-Use, Land-Use Change and Forestry. IPCCNational Greenhouse Gases InventoryProgramme. 312pp.
Pedersen, L.B. and BilleHansen, J. 1995. Effects ofnitrogen load to the forest floor in Sitka sprucestands (Picea sitchensis) as affected bydifference in deposition and spruce aphidinfestations. Water Air Soil Polution 85, 1173-1178.
Porté, A., Trichet, P., Bert, D. and Loustau, D.2002. Allometric relationships for branch andtree woody biomass of Maritime pine (Pinuspinaster Aút.). Forest Ecology andManagement 158:71-83.
Raich, J.W. and Schlesinger, W.H. 1992. Theglobal carbon dioxide flux in soil respiration
and its relationship to vegetation and climate.Tellus 44B, 81-89.
Rutigliano, F.A., De Santo, A.V., Berg, B., Alfani,A. and Fioretto, A. 1996. Lignin decompositionin decaying leaves of Fagus sylvatica L. andneedles of Abies alba Mill. Soil Biology andBiochemistry 28, 101-106.
Rustad, L.E., Huntington, T.G. and Boone, R.D.2000. Controls on soil respiration: Implicationsfor climate change. Biogeochemistry 48, 1-6.
Schlesinger, M.E. 1984. Climate model simulationsof CO2-induced climatic change. In: Saltzman,B. (ed). Advances in Geophysics, AcademicPress, New York, 141-235, 1984
Schlesinger, M.E. 1991. Revised projection offuture greenhouse warming. Nature 350, 219-221.
Schlesinger, M.E. and Andrews, J.A. 2000. Soilrespiration and the global carbon cycle.Biogeochemistry 48, 7-20.
Silver, W.L. and Miya, R.K. 2001. Global patternsin root decomposition: comparisons of climateand litter quality effects. Oecologia 129, 407-419.
Sims, P.L., Singh, J.S. and Lauenroth, W.K. 1978.The structure and function of ten WesternNorth American grasslands. Journal of Ecology66, 251-285.
Savill, P.S. 1992. The silviculture of trees used inBritish forestry. CAB International,Wallingford, Oxon, UK.
Schoene, D. 2002. Terminology in assessing andreporting forest carbon change. In: Secondexpert meeting on harmonizing forest-relateddefinitions for use by various stakeholders.FAO, Rome.
Scholze, M., Kaplan, J.O., Knorr, W. and Heimann,M. 2003. Climate and interannual variability ofthe atmosphere-biosphere 13CO2 flux.Geophysical Research Letters 30(2): 69(1-4).
Schroeder, P., Brown, S., Mo, J., Birdsley, R. andCieszewski, C. 1997. Biomass estimation fortemperate broadleaf forests of the United Statesusing inventory data. Forest Science 43: 424-434.
72 Carbon sequestration and Irish forest ecosystems
Sprugel, D.G. 1983. Correcting for bias in log-transformed allometric equations. Ecology64:209-210.
Tans, P.P., Bakwin, P.S. and Guenther, D.W. 1996.A feasible global carbon cycle observingsystem: A plan to decipher today's carbon cyclebased on observations. Global Change Biology2(3): 309-318.
Thierron, V. and Laudelout, H. 1996. Contributionof root respiration to total CO2 efflux from thesoil of a deciduous forest. Canadian Journal ofForest Research 26, 1142-1148.
Tobin, B. and Nieuwenhuis, M. 2005. BiomassExpansion Factors for Sitka spruce (Piceasitchensis (Bong.) Carr.) in Ireland. Submittedto European Journal of Forest Research (inpress, accepted September 2005).
Treacy, M., Evertsen, J.A. and Ní Dhubháin, Á.2000. A comparison of mechanical andphysical wood properties of a range of Sitkaspruce provenances. COFORD, Dublin.
Turner, D.P., Acker, S.A., Means, J.E. and Garmen,S.L. 2000. Assessing alternative allometricalgorithms for estimating leaf area of Douglas-fir trees and stands. Forest Ecology andManagement 126:61-76.
Vance, E.D., Brooks, P.C. and Jenkinson, D.S.1987. An extraction method for measuring soilmicrobial.
Valentini, R., Matteucci, G. and Dolman, A.J.2000. Respiration as the main determinant ofcarbon balance in European forests. Nature404, 861-864.
Ward, D. and Gardiner, J.J. 1976. The influence oftracheid length and density in Sitka spruce.Irish Forestry 33:39-56.
Waring, R.H. and Schlesinger, W.H. 1985. ForestEcosystems: Concepts and Management.Academic Press Inc. Ltd., London, UK. 340 p.
Woodcock, D.W. and Shrier, A.D. 2003. Doescanopy position affect wood specific gravity intemperate forest trees? Annals of Botany91:529-537.
Zerva, A., Ball, T., Smith, K.A. and Mencuccini,M. 2005. Soil carbon dynamics in a Sitkaspruce (Picea sitchensis (Bong.) Carr.)chronosequence on a peaty gley. ForestEcology and Management 25, 227-240.
PUBLICATIONS and OUTPUTS
Peer-reviewed journals
Black, K., Tobin, B., Saiz, G., Byrne, K. andOsborne, B. 2004. Improved estimates ofbiomass expansion factors for Sitka spruce.Irish Forestry 61: 50-64.
Black, K., Bolger, T., Davis, P., Nieuwenhuis, M.,Reidy, B., Saiz, G., Tobin, B. and Osborne, B.2005. Inventory and eddy covariance basedestimates of annual carbon sequestration in aSitka spruce forest ecosystem. EuropeanJournal of Forest Research 1612-4669 (Paper)1612-4677 (Online) DOI: 10.1007/s10342-005-0092-4
Green, C., Tobin, B., O’Shea, M., Farrell, E.P. andByrne, K.A. 2005. Above- and below-groundbiomass measurements in an unthinned standof Sitka spruce (Picea sitchensis (Bong.)Carr.). European Journal of Forest Research(in press Published on line: DOI:10.1007/s10342-005-0093-3.)
Green, C., Saiz, G., Avitabile, V., Farrell, E.P. andByrne, K.A. (in review). Soil and Forest FloorOrganic Carbon Stocks in a Chronosequence ofSitka spruce. Submitted Forest Ecology andManagement June 2005.
Hemming, D., Yakir, D., Black, K., Buchmann, N.,Burlet, R., Cescatti, A., Clement, R., Gross, P.,Granier, A., Grünwald, T., Havrankova, K.,Janous, D., Janssens, I.A., Knohl, A., Östne, B.,Kowalski, A., Laurila, T., Marcolla, B.,Matteucci, G., Moncrieff, J., Moors, E.J.,Osborne, B., Santos Pereira, J., Pihlatie, M.,Pilegaard, K., Ponti, C., Rosova, Z., Rossi, F.,Scartazz, A. and Vesal, T. 2005. Pan-Europeanδ13C values of air and organic matter fromforest ecosystems. Global Change Biology 11:1065-1073
Carbon sequestration and Irish forest ecosystems 73
Dyckmans, J. and Schmidt, O. 2004. Dual 13C, 15Nlabelling of terrestrial slugs (Derocerasreticulatum). Isotopes in Environmental andHealth Studies 40, 233–237.
Dyckmans, J., Scrimgeour, C.M. and Schmidt, O.2005. A simple and rapid method for labellingearthworms with 15N and 13C. Soil Biology andBiochemistry 37, 989–993.
Schmidt, O., Curry, J.P., Dyckmans, J., Rota, E.and Scrimgeour, C.M. 2004. Dual stableisotope analysis (δ13C and δ15N) of soilinvertebrates and their food sources.Pedobiologia 48, 171–180.
Schmidt, O., Dyckmans, J. and Scrimgeour, C.M.2003. Isotopic labelling of earthworms:Comments on the paper by Whalen and Janzen(2002). Soil Biology and Biochemistry 35,875–876.
Schmidt, O., Dyckmans, J. and Black, K. 2003.Bodenalgen als C-Quelle für Bodentiere (Soilalgae as a carbon source for soil animals).Mitteilungen der Deutschen BodenkundlichenGesellschaft 102: 397-398.
Tobin, B., Black, K., Osborne, B., Reidy, B.,Bolger, T. and Nieuwenhuis, M. 2005.Assessment of allometric algorithms forestimating leaf biomass, leaf area index andlitter fall in different aged Sitka spruce forests.Submitted to Forestry, September 2005.
Proceedings, posters and conferences
Black, K., Bolger, T., Davis, P., Nieuwenhuis, M.,Reidy, B., Saiz, G., Tobin, B., and Osborne, B.2004. Abstract: Inventory and eddy covariancebased estimates of annual carbonsequestration in a Sitka spruce forestecosystem. In Proceedings of: Final PlenaryMeeting COST E21 Contribution of Forest andForestry to the Mitigation of GreenhouseEffects 7-9 October 2004, University CollegeDublin, Ireland. p12.
Black, K. and Osborne, B. 2004. Seasonal and age-related changes in GPP and NPP in managedforest ecosystems. Paper presented at the 14thIrish Environmental Researchers Colloquium.
Environ 2004, 4-6 January, University ofLimerick.
Black, K., O’Sullivan, O., Farrell, E.P., Saiz, G.,Byrne, K., Schmidt, O., Dyckmans, J., Tobin,B., Gardiner, J., Nieuwenhuis, M., Dolan, S.,Reidy, B., Bolger, T. and Osborne, B. 2004.Irish Forests - A Dynamic Carbon Store. ForestResearch and Development In Ireland 2004 -Underpinning Industry Development, 20-21September 2004, Tullamore Court Hotel,Tullamore, Co Offaly.
Byrne, K. and Black, K. 2003. CarbonSequestration in Irish Forests. COFORDConnects (Environment No. 3). Council forForest Research and Development, Irelandpp1-7. COFORD, Dublin.
Byrne, K.A., Saiz, G., Blujdea, V., Black, K.,Osborne, B., O’Sullivan, O., Schmidt, O.,Dyckmans, J., Tobin, B., Gardiner, J.J.,Nieuwenhuis, M., Dolan, S., Reidy, B., Bolger,T. and Farrell, E.P. 2004. Soil Carbon – TheForgotten Pool. Forest Research andDevelopment In Ireland 2004 - UnderpinningIndustry Development, 20-21 September 2004,Tullamore Court Hotel, Tullamore, Co Offaly.
Davis, P., Black, K., Clifton-Brown, J., Burke, J.,Williams, M., Jones, M. and Osborne, B. 2004.Grassland carbon dioxide fluxes: comparisonswith an arable and forest ecosystem. Cost 627:Propagation of uncertainties in therepresentation of processes underlying netecosystem exchange (NEE) in grasslandecosystem models. Aberdeen, UK. 9–10December.
Davis, P., Black, K., Clifton-Brown, J., Kumar, S.,McCourt, A., Williams, M., Jones, M. andOsborne, B. 2004. A comparison of CO2 fluxesfrom three Irish land-use categories, arable,grassland and forestry. 1st CarboEurope-IPIntegrated Project Meeting, Spoleto, Italy, 19-22 January, 2004 – Posters.
Dyckmans, J. and Schmidt, O. 2004a. A simple andrapid method for labelling earthworms with15N and 13C. EuroSoil 2004, Freiburg,Germany, 4–12 September. Book of Abstractsp. 349 (Poster).
74 Carbon sequestration and Irish forest ecosystems
Dyckmans, J. and Schmidt, O. 2004b. A simple andrapid method for labelling soil animals with15N and 13C. XIVth International Colloquiumon Soil Zoology and Ecology, Rouen, France,30 August – 3 September. Book of Abstracts p.150 (Poster).
Dyckmans, J., Black, K.G., Schrader, S.,Scrimgeour, C.M. and Schmidt, O. 2004. Soilalgae as a carbon source for soil animals.XIVth International Colloquium on SoilZoology and Ecology, Rouen, France, 30August – 3 September. Book of Abstracts p 157(Oral presentation).
Dyckmans, J., Black, K.G., Schrader, S.,Scrimgeour, C.M. and Schmidt, O. 2005.Photoautotrophic microflora as a carbonsource for invertebrate animals in temperatesoils. Irish Plant Scientists’ AssociationMeeting (IPSAM), 30 March to 1 April,Dublin. p12 (Oral presentation).
Reidy, B. and Bolger, T. 2004. Carbonsequestration in Irish forest soil. ForestResearch and Development In Ireland 2004 -Underpinning Industry Development, 20-21September 2004, Tullamore Court Hotel,Tullamore, Co Offaly - Posters.
Reidy, B. and Bolger, T. 2004. Carbonsequestration in Irish forest soil. Final PlenaryMeeting COST E21 Contribution of Forest andForestry to the Mitigation of GreenhouseEffects 7-9 October 2004, University CollegeDublin, Ireland – Posters.
Saiz, G., Byrne, K.A. and Farrell. E.P. 2004.Spatial variation and partitioning of soilrespiration in Sitka spruce plantations inIreland. COST E21. Contribution of Forest andForestry to the Mitigation of the GreenhouseEffect. Final Plenary Meeting. 7-9 October.Dublin, Ireland.
Saiz, G., Byrne, K., Farrell, E. and Blujdea, V.2004. Fine root biomass and turnover in Sitkaspruce plantations in Ireland. COST E21.Contribution of Forest and Forestry to theMitigation of the Greenhouse Effect. FinalPlenary Meeting. 7-9 October. Dublin, Ireland- Poster.
Saiz, G., Byrne, K.A. and Farrell, E.P. 2004.Factors controlling soil CO2 fluxes in forestecosystems. Paper presented at the 14th IrishEnvironmental Researchers Colloquium.Environ 2004. 30 January - 1 February. NUILimerick.
Tobin, B. and Nieuwenhuis, M. 2004. Abstract:The use of BEFs for Sitka spruce in Ireland. InProceedings of: Final Plenary Meeting ofCOST E21 Contribution of Forest and Forestryto the Mitigation of Greenhouse Effects 7-9October 2004, University College Dublin,Ireland. p9.
Tobin, B. and Nieuwenhuis, M. 2004. Age relatedBEFs for Irish Sitka spruce. Poster presented atForest Research and Development in Ireland2004 - Underpinning Industry Development,20-21 September 2004, Tullamore Court Hotel,Tullamore, Co Offaly. Proceedings in press.
Tobin, B. and Nieuwenhuis, M. 2004. Abstract:Equations for below-ground biomass of Sitkaspruce in Ireland. In: Proceedings of: WoodyRoot Processes under a ChangingEnvironment, COST E38, 27-29 October 2004,Thessaloniki, Greece. p32.
Tobin, B. Trees, CO2 and Climate Change. Radiointerview with Anna Livia FM, 15 November2004.
Tobin, B. and Nieuwenhuis, M. 2005. Cleaner Air– What can forests do? Local Planet 1 (1): 28-29.
Tobin B. and Nieuwenhuis, M. 2005. Below-ground biomass of a Sitka sprucechronosequence in Ireland. Poster presented atWoody Root Processes – Impact of DifferentSpecies, COST E38, 5-9 June 2005, Tartu,Estonia. Proceedings, p53.
Carbon sequestration and Irish forest ecosystems 75

76 Carbon sequestration and Irish forest ecosystems