carbonaceous aerosol...
TRANSCRIPT

Carbonaceous Aerosol Carbonaceous Aerosol MeasurementsMeasurements
Lynn Mazzoleni, Ph.D.Lynn Mazzoleni, [email protected]@atmos.colostate.edu

Presentation OverviewPresentation Overview
Carbonaceous Aerosol SamplingCarbonaceous Aerosol SamplingSemiSemi--Volatile Organic CompoundsVolatile Organic CompoundsSampling ArtifactsSampling Artifacts
ThermoThermo--optical Methods of OC/EC Analysisoptical Methods of OC/EC AnalysisImproveImproveSunsetSunset
HiHi--volume Sample Collectionvolume Sample Collection

Aerosol Measurements & PurposeAerosol Measurements & Purpose
To monitor exposure: To monitor exposure: Who?Who?To determine specific causes of health effects: To determine specific causes of health effects: What?What?To monitor compliance: To monitor compliance: Where?Where?To develop reliable source attribution: To develop reliable source attribution: Why?Why?To monitor visibility impairmentTo monitor visibility impairmentTo establish program evaluationTo establish program evaluationTo provide information for scientific understanding: To provide information for scientific understanding: But really But really why?why?
http://www.epa.gov/oar/oaqps/peg_caa/pegcaain.html


Carbonaceous AerosolCarbonaceous Aerosol
What is aerosol? Aerosol = Particulate Matter?Aerosol is defined as a complex mixture of gases, liquids, and matter.
Carbon content PM2.5
Location dependent75% in Yosemite NP30% in Urban
Annual IMPROVE Report 1999

Annual IMPROVE Report 1999

Filter Collection
Collection challengesSubstrate
Method driven requirements high purity quartz
Phase Transitions Evaporation, Condensation, or Sublimation
Quartz filter collectionQuartz filter collectionRequired for OC/EC determinationRequired for OC/EC determinationNeutral surfaceNeutral surfaceHigh particle collection efficiency (High particle collection efficiency (appxappx. 100%) . 100%) BET surface BET surface
BET refers to the area not in equilibrium with the gas phaseBET refers to the area not in equilibrium with the gas phaseBET is BET is BrunauerBrunauer, Emmett, and Teller , Emmett, and Teller
Equation to determine the physical adsorption of a gas by a soliEquation to determine the physical adsorption of a gas by a solid surface d surface (JACS 1938)(JACS 1938)
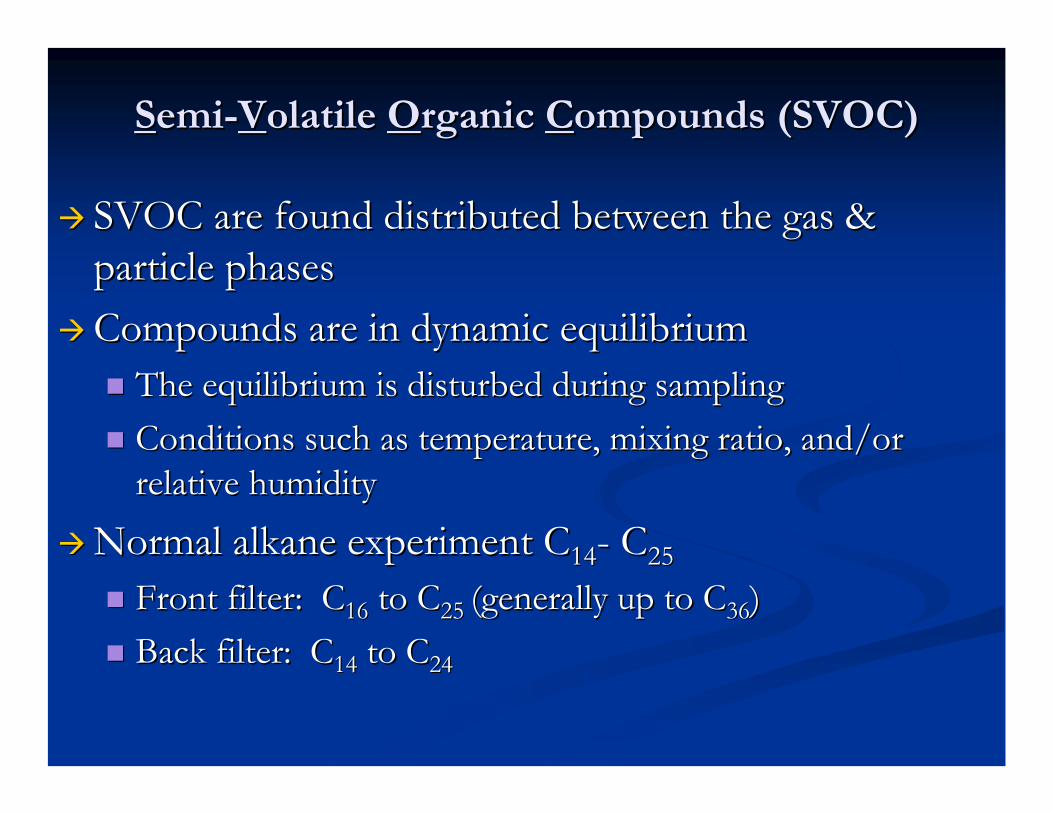
SSemiemi--VVolatile olatile OOrganic rganic CCompounds (SVOC)ompounds (SVOC)
SVOC are found distributed between the gas & SVOC are found distributed between the gas & particle phasesparticle phasesCompounds are in dynamic equilibriumCompounds are in dynamic equilibrium
The equilibrium is disturbed during samplingThe equilibrium is disturbed during samplingConditions such as temperature, mixing ratio, and/or Conditions such as temperature, mixing ratio, and/or relative humidityrelative humidity
Normal Normal alkanealkane experiment Cexperiment C1414-- CC2525
Front filter: CFront filter: C1616 to Cto C25 25 (generally up to C(generally up to C3636))Back filter: CBack filter: C1414 to Cto C2424

SVOC DistributionsSVOC Distributions
Gas Phase
Particle Phase
Gas Phase
Particle Phase

Positive ArtifactPositive Artifact
Positive artifact is the adsorption artifactPositive artifact is the adsorption artifactLeads to overestimation of organic aerosol mass Leads to overestimation of organic aerosol mass concentrationconcentration
Artifact gradually decreases with increasing Artifact gradually decreases with increasing particulate load on the filter. particulate load on the filter.
High artifact with short sampling periods &/or low High artifact with short sampling periods &/or low particulate organic mass. particulate organic mass.
Complicated correction methodsComplicated correction methodsBlank subtractBlank subtract
PrePre--baked only or prebaked only or pre--baked with ambient air equilibrium?baked with ambient air equilibrium?Dual filter strategy??Dual filter strategy??

Negative ArtifactNegative Artifact
Negative artifact is the desorption artifactNegative artifact is the desorption artifactLeads to underestimation of organic aerosol mass Leads to underestimation of organic aerosol mass concentrationconcentrationLess significant than positive artifactsLess significant than positive artifacts1010ooC temperature increase induces a threefold change in C temperature increase induces a threefold change in partitioning coefficientpartitioning coefficient
Substantial negative artifact may occur when gas Substantial negative artifact may occur when gas phase species are removed upstream of the filter phase species are removed upstream of the filter using a denuder in the sampling line to minimize the using a denuder in the sampling line to minimize the positive artifactpositive artifact
ReRe--establish the gasestablish the gas--particle equilibriumparticle equilibrium

Correction MethodsCorrection Methods
Field blanks: place the preField blanks: place the pre--baked filter into the sampler and baked filter into the sampler and turn the sampler on for a few minutesturn the sampler on for a few minutes
But, the filter may not be in equilibrium for several hoursBut, the filter may not be in equilibrium for several hoursAlternative: allow filter to come to equilibrium during the entiAlternative: allow filter to come to equilibrium during the entire re sampling period without particle depositionsampling period without particle deposition
Dual filter strategy: two quartz filters (QQ) in tandemDual filter strategy: two quartz filters (QQ) in tandemBut, this increases the pressure drop & doubles the analysesBut, this increases the pressure drop & doubles the analysesAssumption: both filters have attained the identical equilibriumAssumption: both filters have attained the identical equilibrium with with the gas phasethe gas phase
Dual filter strategy: quartz behind Teflon (TQ) in tandemDual filter strategy: quartz behind Teflon (TQ) in tandemSignificantly more OC can be found on the backup filter when Significantly more OC can be found on the backup filter when compared to the QQcompared to the QQ

Simultaneous Characterization of ArtifactsSimultaneous Characterization of Artifacts
Sampler 1 Sampler 2 Sampler 3
BYU Organic Sampling System (BOSS), Eatough et al., 1993
1
2
3
1
2
3
1
2
3

Reaction ArtifactReaction Artifact
Chemical reaction of sampled species with gas phase Chemical reaction of sampled species with gas phase componentscomponents
Oxidation by Ozone or Hydroxyl radicalsOxidation by Ozone or Hydroxyl radicals
Positive or negative depending upon the reaction products Positive or negative depending upon the reaction products which may be more or less volatile than their precursorswhich may be more or less volatile than their precursorsCompounds with Compounds with alkenealkene bonds are very susceptible to bonds are very susceptible to oxidation by ozoneoxidation by ozone
RR'
O OO
H HR
R'H
H
R
O
HR'H
O
OH
OH
R'HO
OH
OHR'
O
H
+
+ HOOH
O3 H2O
H2O

Elemental CarbonElemental Carbon
Strong light absorption Strong light absorption (Visibility & RT)(Visibility & RT)Graphitic Raman spectrum Graphitic Raman spectrum (Structure)(Structure)Insoluble in polar and nonInsoluble in polar and non--polar solvents (Health)polar solvents (Health)Thermally refractory (Many Thermally refractory (Many fractions for source fractions for source apportionment. )apportionment. )
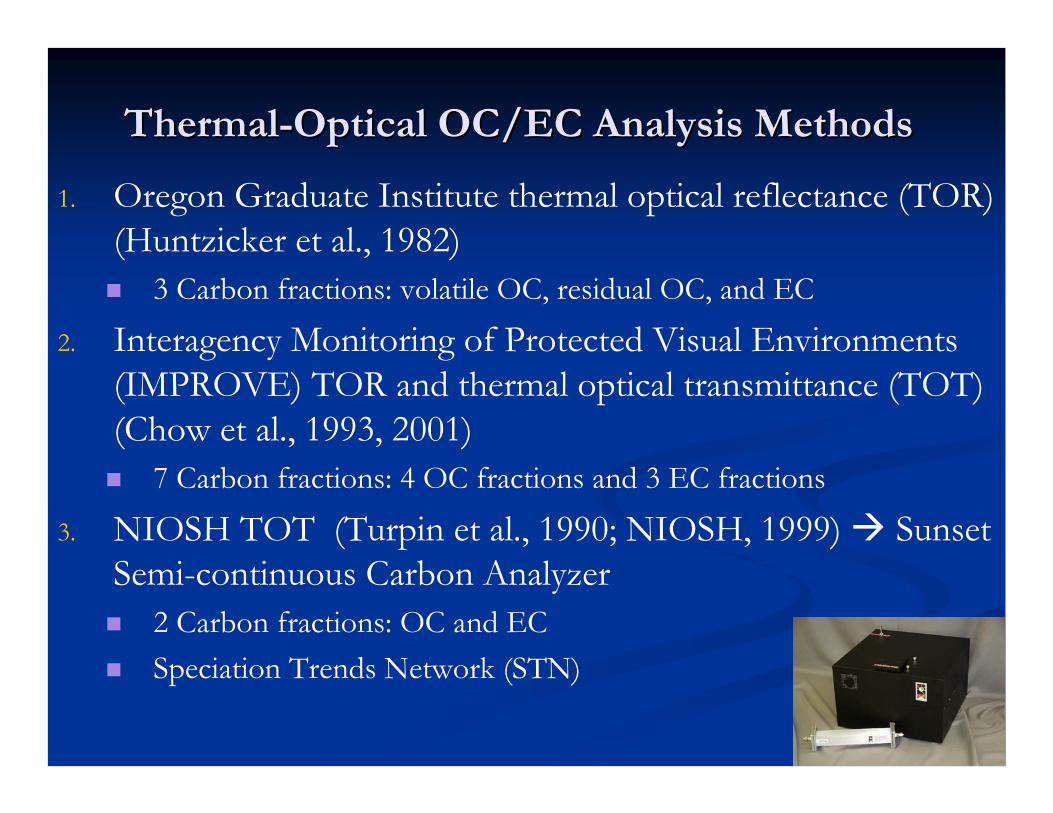
ThermalThermal--Optical OC/EC Analysis MethodsOptical OC/EC Analysis Methods
1. Oregon Graduate Institute thermal optical reflectance (TOR) (Huntzicker et al., 1982)
3 Carbon fractions: volatile OC, residual OC, and EC
2. Interagency Monitoring of Protected Visual Environments (IMPROVE) TOR and thermal optical transmittance (TOT) (Chow et al., 1993, 2001)
7 Carbon fractions: 4 OC fractions and 3 EC fractions
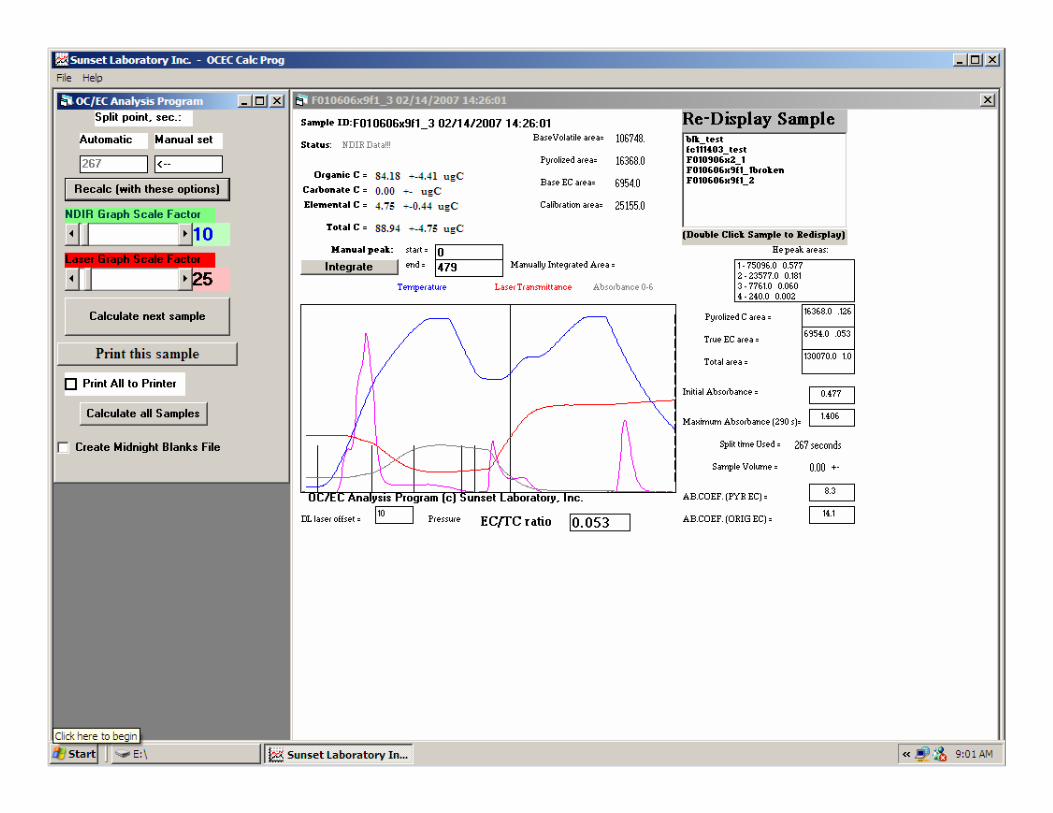
3. NIOSH TOT (Turpin et al., 1990; NIOSH, 1999) Sunset Semi-continuous Carbon Analyzer
2 Carbon fractions: OC and ECSpeciation Trends Network (STN)
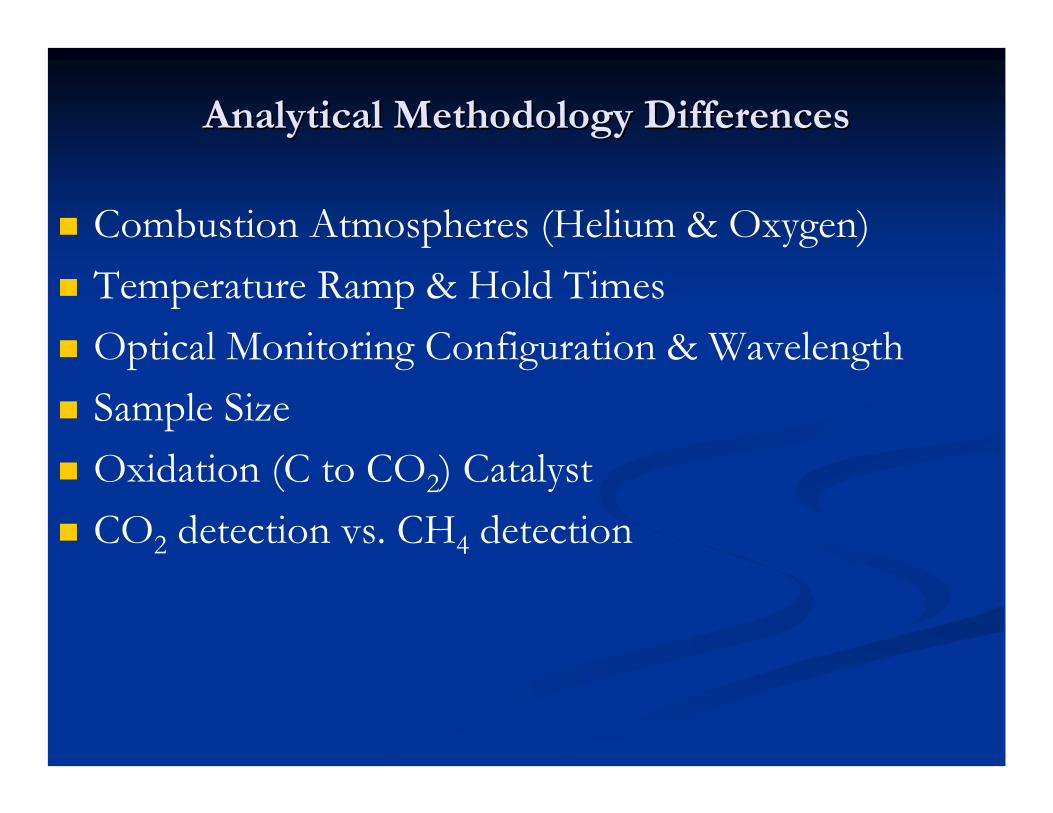
Analytical Methodology DifferencesAnalytical Methodology Differences
Combustion Atmospheres (Helium & Oxygen)Temperature Ramp & Hold TimesOptical Monitoring Configuration & WavelengthSample SizeOxidation (C to CO2) CatalystCO2 detection vs. CH4 detection
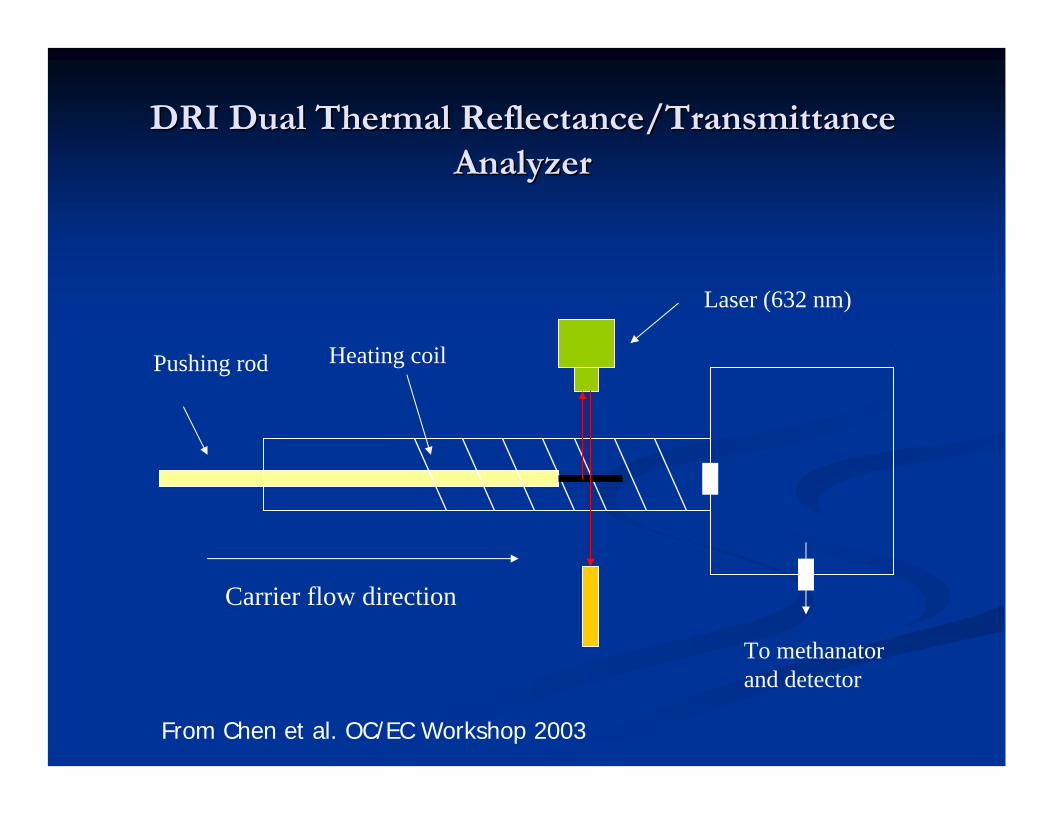
DRI Dual Thermal Reflectance/Transmittance DRI Dual Thermal Reflectance/Transmittance AnalyzerAnalyzer
To methanatorand detector
Carrier flow direction
Pushing rod Heating coil
Laser (632 nm)
From Chen et al. OC/EC Workshop 2003

Carbon Carbon ThermogramsThermograms from Gasoline & Diesel Vehicle Emission Source from Gasoline & Diesel Vehicle Emission Source Samples (IMPROVE)Samples (IMPROVE)
From Watson et al., 1994
Gasoline Vehicle Diesel Vehicle

IMPROVEIMPROVEcarbon thermogramcarbon thermogram
STNSTNcarbon carbon
thermogramthermogram
200
220
240
260
280
300
320
340
360
380
400
0 200 400 600 800 1000 1200 1400Process Time (sec)
FID
resp
onse
(cou
nts)
0
500
1000
1500
2000
2500
3000
Lase
r Ref
lect
ance
, Las
er T
rans
mitt
ance
, Te
mpe
ratu
re (º
C)
FIDLaser ReflectanceLaser TransmittanceFilter Temperature
OC/EC split
Sample ID: Q20204
0
100
200
300
400
500
600
700
800
900
1000
0 200 400 600 800 1000 1200 1400Process Time (sec)
Tem
pera
ture
(ºC
)
FID_8
SOTmp
LaserT
LaserR
He
ECT
ECR
Sample from Hong Kong Sample from Hong Kong urban site on 04/17/01 with urban site on 04/17/01 with 9.9 9.9 ±± 0.8 ug/m0.8 ug/m33 OCOCand and 7.8 7.8 ±± 0.8 ug/m0.8 ug/m33 ECEC

HiHi--Volume Aerosol Sample Volume Aerosol Sample CollectionCollection
Developed in 1948Developed in 1948Large volume of air is pulled through filter (~1000 Large volume of air is pulled through filter (~1000 L/min)L/min)Efficient collection of particles Efficient collection of particles
0.3 to 100 0.3 to 100 μμmmImpaction inlets are available for size selective Impaction inlets are available for size selective collectioncollection
Fine PM (2.5 Fine PM (2.5 μμm and less)m and less)Coarse PM (2.5 Coarse PM (2.5 μμm to 10 m to 10 μμm)m)

Review & DiscussionReview & Discussion
Variable organic content in fine PMVariable organic content in fine PMQuartz filter challengesQuartz filter challenges
Gas phase equilibriumGas phase equilibriumPositive (adsorption) artifactPositive (adsorption) artifactNegative (desorption) artifactNegative (desorption) artifactReaction artifactReaction artifact
SemiSemi--volatile organic compoundsvolatile organic compoundsThermalThermal--optical OC/EC analysis methodsoptical OC/EC analysis methods
OGI, DRI, SunsetOGI, DRI, SunsetIMPROVE & STN ProtocolsIMPROVE & STN Protocols

Carbonaceous Aerosol Measurements Carbonaceous Aerosol Measurements Part IIPart II

Review of Part IReview of Part I
Variable organic content in fine PM (<2.5 Variable organic content in fine PM (<2.5 μμm)m)Quartz filter sampling challengesQuartz filter sampling challenges
Gas phase equilibrium with Quartz surface (BET)Gas phase equilibrium with Quartz surface (BET)Positive artifactPositive artifactNegative artifactNegative artifactReaction artifactReaction artifact
SemiSemi--volatile organic compoundsvolatile organic compoundsThermalThermal--optical OC/EC analysis methodsoptical OC/EC analysis methods
OGI, DRI, SunsetOGI, DRI, SunsetIMPROVE & STN ProtocolsIMPROVE & STN Protocols

IMPROVEIMPROVEcarbon thermogramcarbon thermogram
STNSTNcarbon carbon
thermogramthermogram
200
220
240
260
280
300
320
340
360
380
400
0 200 400 600 800 1000 1200 1400Process Time (sec)
FID
resp
onse
(cou
nts)
0
500
1000
1500
2000
2500
3000
Lase
r Ref
lect
ance
, Las
er T
rans
mitt
ance
, Te
mpe
ratu
re (º
C)
FIDLaser ReflectanceLaser TransmittanceFilter Temperature
OC/EC split
Sample ID: Q20204
0
100
200
300
400
500
600
700
800
900
1000
0 200 400 600 800 1000 1200 1400Process Time (sec)
Tem
pera
ture
(ºC
)
FID_8
SOTmp
LaserT
LaserR
He
ECT
ECR
Urban Site: Hong KongUrban Site: Hong Kong9.9 9.9 ±± 0.8 ug/m0.8 ug/m33 OCOCand and 7.8 7.8 ±± 0.8 ug/m0.8 ug/m33 ECEC
Notice the temperature profilesNotice the temperature profilesIMPROVE OC up to 550IMPROVE OC up to 550ººCCSTN OC up to 850STN OC up to 850ººCC

Presentation OutlinePresentation Outline
Emission SourcesEmission SourcesSource Apportionment ModelsSource Apportionment ModelsGas Chromatography/Mass Spectrometry Gas Chromatography/Mass Spectrometry FundamentalsFundamentalsMolecular MarkersMolecular MarkersTrace Organic Marker Compound StructuresTrace Organic Marker Compound StructuresAlkane Carbon Preference IndexAlkane Carbon Preference Index

Where does the carbon come from?Where does the carbon come from?
Anthropogenic emission sourcesAnthropogenic emission sourcesGasoline & diesel vehicles: Cars, trucks, ships, trainsGasoline & diesel vehicles: Cars, trucks, ships, trainsBiomass Combustion: Residential woodstoves, fireplaces, campfirBiomass Combustion: Residential woodstoves, fireplaces, campfires, es, wildland fires (prescribed or wildfire)wildland fires (prescribed or wildfire)Cooking: Restaurants, backyard barbeque, household cookingCooking: Restaurants, backyard barbeque, household cookingIndustrial processes: Coal combustion, oil refinement, other cheIndustrial processes: Coal combustion, oil refinement, other chemical mical & manufacturing& manufacturingMechanical abrasions: brake & tire wearMechanical abrasions: brake & tire wearAgriculture & waste treatmentAgriculture & waste treatmentMunicipal waste reductionMunicipal waste reduction
Biogenic emission sourcesBiogenic emission sourcesVegetation, microbes, fungiVegetation, microbes, fungiotherother

CombustionCombustion
Stoichiometry of idealized complete combustion can be represented as
CxHy + (x + y/4) (O2 + 3.78 N2) x CO2 + y/2 H2O + 3.78 (x + y/4) N2 + heatIn reality, combustion is not so simple
fuel contains species other than C and H (S, N, H, metals, etc...)Combustion is usually incomplete
Products of incomplete combustion include condensable organic species
Soot can be generated by pyrolysis of aromatic or aliphatic compounds
CO + CO C + CO2

Source ApportionmentSource Apportionment
Receptor based: UNMIX, PCA, PMFReceptor based: UNMIX, PCA, PMFEmission source based: Emission source based: KleemanKleeman @@ UC DavisUC DavisSourceSource--receptor based: Chemical mass balance (CMB) receptor based: Chemical mass balance (CMB) modelingmodeling
Friedlander, 1973Friedlander, 1973EPA Chemical Mass Balance Model, Version 8.0 (Watson EPA Chemical Mass Balance Model, Version 8.0 (Watson et al., 1997)et al., 1997)

Chemical Mass Balance Receptor ModelChemical Mass Balance Receptor Model
CCjj = atmospheric concentration of compound= atmospheric concentration of compoundFFijij = source composition= source compositionSSii = source contribution= source contribution
Model AssumptionsModel AssumptionsCompositions of source emissions are constantCompositions of source emissions are constantChemical species do not react with each otherChemical species do not react with each otherAll sources with potential for significant contribution to the rAll sources with potential for significant contribution to the receptor eceptor have been identifiedhave been identifiedSource contributions are linearly independent of each otherSource contributions are linearly independent of each otherMeasurement errors are random, uncorrelated, & normally Measurement errors are random, uncorrelated, & normally distributeddistributed
iij
J
jj SFC
1=∑=

Source Emission Tests & SamplingSource Emission Tests & Sampling

Source Emission Tests & SamplingSource Emission Tests & Sampling

Trace Organic Component AnalysesTrace Organic Component Analyses
collection
extraction
Analysis by GC-MS
Toluene
Dichloromethane
Acetone
Methanol
Sample Prep/Clean-up
Extract Concentration
Analyte Derivatization

Chromatography is a separation method that relies on differencesChromatography is a separation method that relies on differences in in partitioning behavior between a flowing mobile phase and a statipartitioning behavior between a flowing mobile phase and a stationary onary phase to separate components in a mixturephase to separate components in a mixtureGas chromatography is the separation of gaseous componentsGas chromatography is the separation of gaseous componentsMass spectrometry separates ions by massMass spectrometry separates ions by mass--toto--charge ratio (charge ratio (m/zm/z) in a ) in a crossed electrical & magnetic fieldcrossed electrical & magnetic field
Gas Chromatography/Mass Spectrometry (GC/MS)Gas Chromatography/Mass Spectrometry (GC/MS)
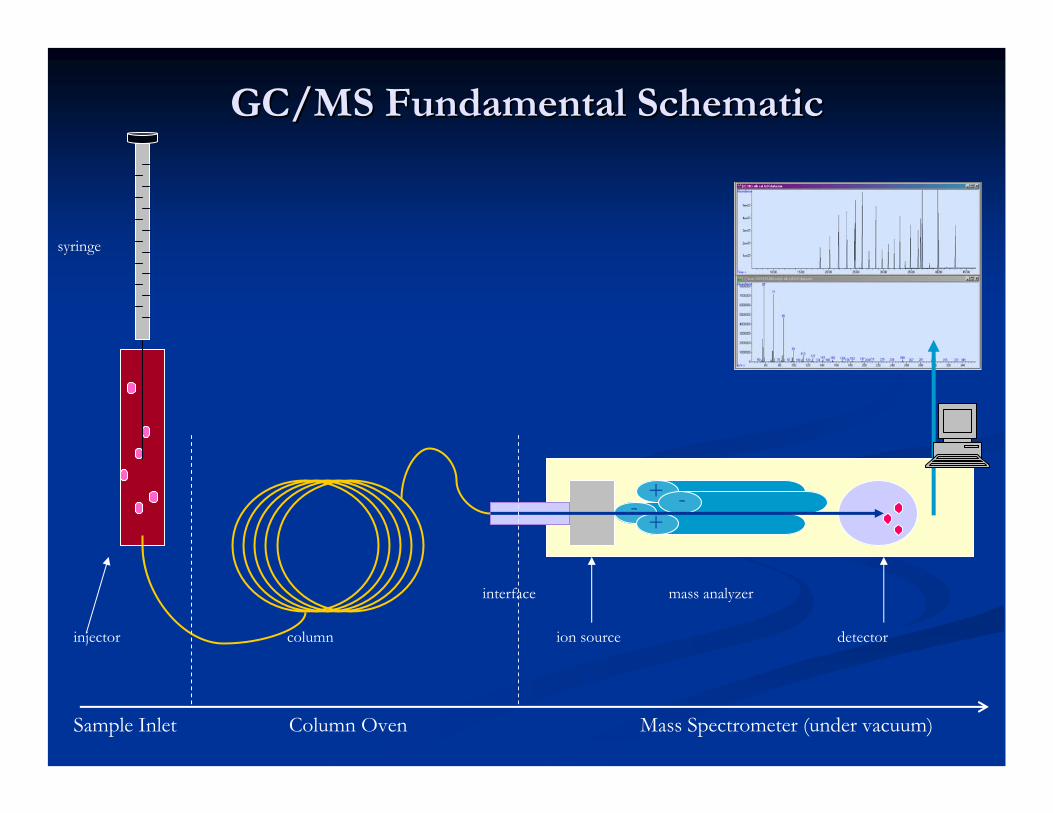
GC/MS Fundamental SchematicGC/MS Fundamental Schematic
columninjector
interface
ion source
mass analyzer
detector
Column Oven Mass Spectrometer (under vacuum)Sample Inlet
++
- -
syringe

Chemical Formula: C4H9•
Exact Mass: 57.07
Chemical Formula: C5H11•
Exact Mass: 71.09
Chemical Formula: C6H13•
Exact Mass: 85.1
Chemical Formula: C7H15•
Exact Mass: 99.12

GC/MS Data QuantitationGC/MS Data Quantitation
All analytical methods require calibrationAll analytical methods require calibrationA calibration curve is relationship between the instrument respoA calibration curve is relationship between the instrument response nse and the concentration of analyte.and the concentration of analyte.Internal standard calibration: includes a reference compound whiInternal standard calibration: includes a reference compound which is ch is introduced to all standards and samples at a fixed amount. introduced to all standards and samples at a fixed amount.
IS
X
IS
X
CC
mAA
=
AX = peak area of analyteAIS = peak area of internal standardCX = concentration of analyteCIS = concentration of internal standardm = slope

Biomarkers/Molecular Organic TracersBiomarkers/Molecular Organic Tracers
Biomarkers are organic indicator compounds that can Biomarkers are organic indicator compounds that can be used as tracers for geological, environmental, or be used as tracers for geological, environmental, or metabolic processes. metabolic processes. Molecular tracers in aerosol are indicator compounds Molecular tracers in aerosol are indicator compounds that can be traced to individual emission sources. that can be traced to individual emission sources.
CharacteristicCharacteristicUnreactiveUnreactivePrimary originPrimary originLow volatilityLow volatility
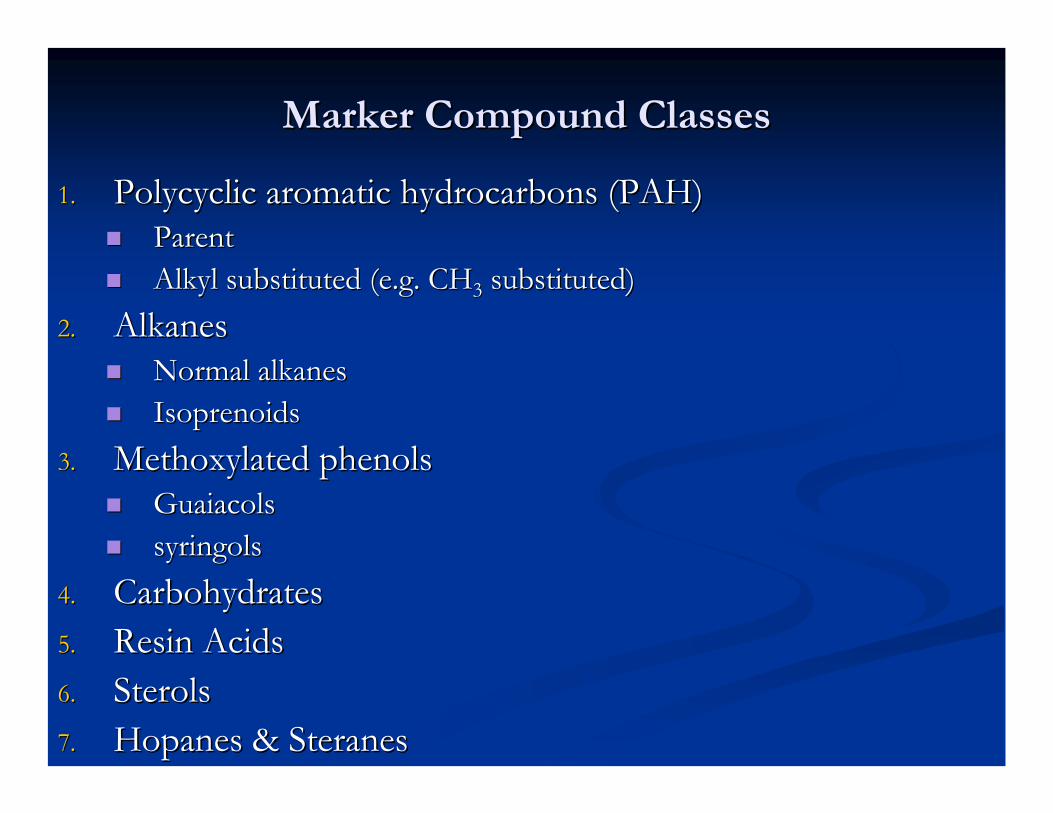
Marker Compound ClassesMarker Compound Classes
1.1. Polycyclic aromatic hydrocarbons (PAH)Polycyclic aromatic hydrocarbons (PAH)ParentParentAlkyl substituted (e.g. CHAlkyl substituted (e.g. CH33 substituted)substituted)
2.2. AlkanesAlkanesNormal alkanesNormal alkanesIsoprenoidsIsoprenoids
3.3. Methoxylated phenolsMethoxylated phenolsGuaiacolsGuaiacolssyringolssyringols
4.4. CarbohydratesCarbohydrates5.5. Resin Acids Resin Acids 6.6. SterolsSterols7.7. Hopanes & SteranesHopanes & Steranes

Marker PAH Marker PAH
Benzo(ghi)perylene
Coronene
ReteneBenzo(k)fluoranthene
Indeno(1,2,3-cd)pyrene
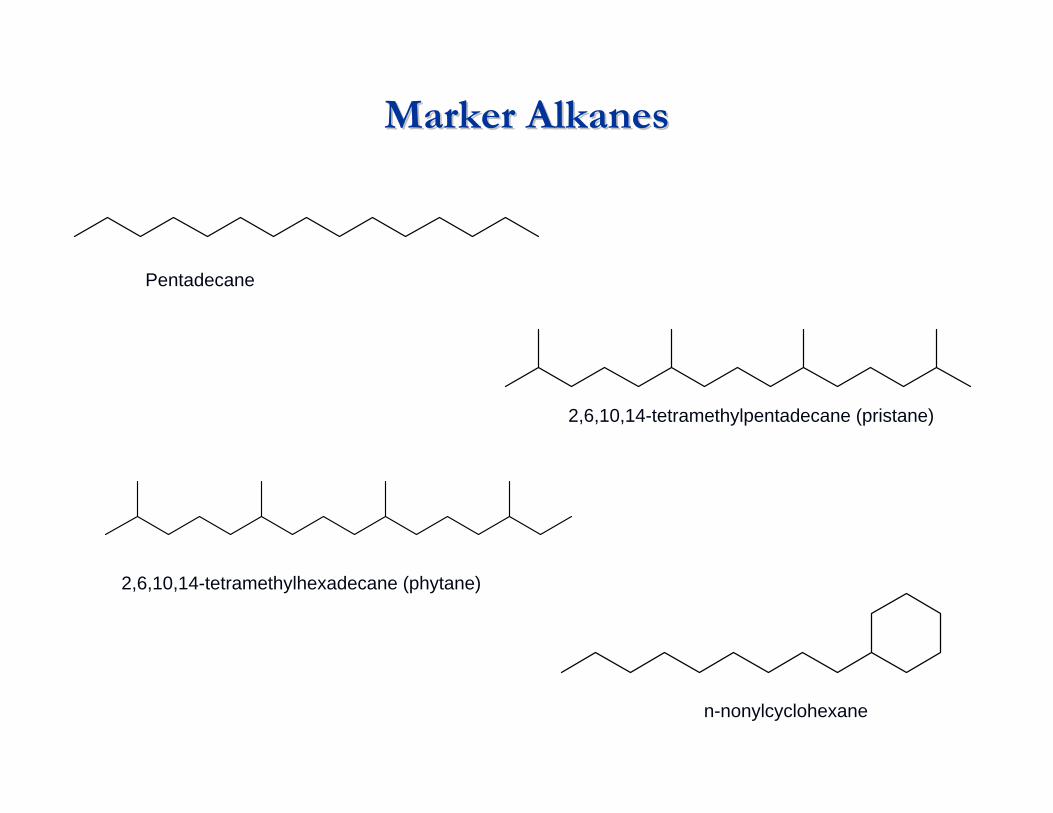
Marker AlkanesMarker Alkanes
Pentadecane
2,6,10,14-tetramethylpentadecane (pristane)
2,6,10,14-tetramethylhexadecane (phytane)
n-nonylcyclohexane

Marker Methoxylated PhenolsMarker Methoxylated Phenols
OHO
CH3
Guaiacol
OHOO
CH3 CH3
Syringol

Carbohydrate MarkersCarbohydrate Markers
OOHO
CH2OH
OH
OHOHO
CH2OH
OHOO
HO
CH2OH
OH OH
O
HO
O
OHHO HO
O
HO
O
OHHO
OH
O
HO
O
cellulose
Levoglucosan Galactosan Mannosan
combustion
n

Resin AcidsResin Acids
CO2H
Pimaric acid
Dehydroabietic acid
CH3
CH3CH3
CH3HO
O
CO2H
Abietic acid

Marker SterolsMarker Sterols
CH3
H
CH3
CH3
CH3
HO
b-sitosterol
CH3
CH3
H
CH3
CH3
CH3
HO cholesterol

Marker Hopanes & SteranesMarker Hopanes & Steranes
HCH3
CH3CH3
CH3
CH3CH3
CH3
17a(H),21b(H)-30-NorhopaneCH3
CH3
H
CH3
CH3
20R,14a(H),17a(H)-cholestane

Alkane CPIAlkane CPI
Homologous aliphatic compounds have strong Homologous aliphatic compounds have strong carboncarbon--number predominance due to biosynthesis number predominance due to biosynthesis processes in higher order flora. processes in higher order flora. Combustion processes do not have a carbon number Combustion processes do not have a carbon number predominancepredominanceCPI = sum of odd carbonCPI = sum of odd carbon--number homologues / sum number homologues / sum of even carbonof even carbon--number homologues (range Cnumber homologues (range C1010-- CC3535))CPICPI’’s range between 1.0 and 2.0 in urban areas & s range between 1.0 and 2.0 in urban areas & greater than 2.0 in rural areasgreater than 2.0 in rural areas

Alkane CPI MeasurementsAlkane CPI Measurements
Simoneit & Mazurek, 1982291.8Pasadena, CASimoneit & Mazurek, 1982296.4Mt. Lassen Area 2 (CA)Simoneit & Mazurek, 1982293.1Mt. Lassen Area 1 (CA)Simoneit & Mazurek, 1982292.2Lake Tahoe Area (CA)
Zheng et al., 2000311.3Hong Kong 2Zheng et al., 2000291.4Hong Kong 1
Simoneit et al., 1991311.1Guangzhou ChinaSimoneit et al., 1991311.6Guiyang ChinaSimoneit et al., 1991291.6Beijing China
ReferenceCmaxCPILocation

Review & DiscussionReview & Discussion
Anthropogenic emission sources include: gasoline & diesel vehiclAnthropogenic emission sources include: gasoline & diesel vehicles, es, biomass combustion, cooking, industrial processes, mechanical biomass combustion, cooking, industrial processes, mechanical abrasions, agriculture & waste treatmentabrasions, agriculture & waste treatmentSource apportionment models include: receptor based, emissions bSource apportionment models include: receptor based, emissions based, ased, & source& source--receptor based.receptor based.GC: separation of gaseous components by volatility & stationary GC: separation of gaseous components by volatility & stationary phase phase interactions.interactions.MS: separation of ions by massMS: separation of ions by mass--toto--charge ratio to provide a charge ratio to provide a ““fingerprintfingerprint””for identification & quantificationfor identification & quantificationMolecular markers for source apportionment should be characterisMolecular markers for source apportionment should be characteristic, tic, unreactiveunreactive, & low volatility. , & low volatility. Alkane CPI: the sum of odd numbered alkanes divided by the sum oAlkane CPI: the sum of odd numbered alkanes divided by the sum of f even numbered alkaneseven numbered alkanes
Indication of biogenic inputIndication of biogenic input

Additional Reading RecommendationsAdditional Reading Recommendations
Chapter 4: Chapter 4: ““Organic Chemistry of AerosolOrganic Chemistry of Aerosol”” inin Carbonaceous Carbonaceous AerosolAerosol, , AndrasAndras GelencserGelencser 20042004Simoneit, BRT. Simoneit, BRT. ““A Review of Current Applications of Mass A Review of Current Applications of Mass Spectrometry for Biomarker/Molecular Tracer Elucidations,Spectrometry for Biomarker/Molecular Tracer Elucidations,””Mass Spectrometry Reviews,Mass Spectrometry Reviews, vol. 24, pp. 719vol. 24, pp. 719--765, 2005. 765, 2005. Simoneit, BRT & MA Simoneit, BRT & MA MazurekMazurek. . ““Organic Matter of the Organic Matter of the TroposphereTroposphere--II. Natural Background of Biogenic Lipid Matter II. Natural Background of Biogenic Lipid Matter in Aerosols Over the Rural Western United States.in Aerosols Over the Rural Western United States.””Atmospheric EnvironmentAtmospheric Environment vol. 16, pp. 2139vol. 16, pp. 2139--2159, 1982.2159, 1982.