carbothermic synthesis of ~820-µm un kernels
TRANSCRIPT

ORNL/TM-2015/301
Carbothermic Synthesis of ~820-µm UN Kernels: Investigation of Process Variables
T. B. Lindemer C. M. Silva J. J. Henry J. W. McMurray S. L. Voit J. L. Collins R. D. Hunt June, 2015
Approved for public release; distribution is unlimited

DOCUMENT AVAILABILITY Reports produced after January 1, 1996, are generally available free via US Department of Energy (DOE) SciTech Connect. Website http://www.osti.gov/scitech/ Reports produced before January 1, 1996, may be purchased by members of the public from the following source: National Technical Information Service 5285 Port Royal Road Springfield, VA 22161 Telephone 703-605-6000 (1-800-553-6847) TDD 703-487-4639 Fax 703-605-6900 E-mail [email protected] Website http://www.ntis.gov/help/ordermethods.aspx Reports are available to DOE employees, DOE contractors, Energy Technology Data Exchange representatives, and International Nuclear Information System representatives from the following source: Office of Scientific and Technical Information PO Box 62 Oak Ridge, TN 37831 Telephone 865-576-8401 Fax 865-576-5728 E-mail [email protected] Website http://www.osti.gov/contact.html
This report was prepared as an account of work sponsored by an agency of the United States Government. Neither the United States Government nor any agency thereof, nor any of their employees, makes any warranty, express or implied, or assumes any legal liability or responsibility for the accuracy, completeness, or usefulness of any information, apparatus, product, or process disclosed, or represents that its use would not infringe privately owned rights. Reference herein to any specific commercial product, process, or service by trade name, trademark, manufacturer, or otherwise, does not necessarily constitute or imply its endorsement, recommendation, or favoring by the United States Government or any agency thereof. The views and opinions of authors expressed herein do not necessarily state or reflect those of the United States Government or any agency thereof.

ORNL/TM-2015/301
Fuel Cycle Research and Development – Advanced LWR Fuels
CARBOTHERMIC SYNTHESIS OF ~820-µm UN KERNELS: INVESTIGATION OF PROCESS VARIABLES
T. B. Lindemer C. M. Silva J. J. Henry
J. W. McMurray S. L. Voit
J. L. Collins R. D. Hunt
June, 2015
Prepared by OAK RIDGE NATIONAL LABORATORY
Oak Ridge, TN 37831-6283 managed by
UT-BATTELLE, LLC for the
US DEPARTMENT OF ENERGY under contract DE-AC05-00OR22725


iii
CONTENTS
Page CONTENTS ......................................................................................................................................... iii LIST OF FIGURES .............................................................................................................................. iv LIST OF TABLES ............................................................................................................................... vi ABSTRACT .......................................................................................................................................... 1 1. .............................................................................................................................. INTRODUCTION 1 2. ............................................................................ GENERAL DESCRIPTION OF EXPERIMENTS 2 3. .......................................................................... EXPERIMENTAL RESULTS AND DISCUSSION 3
3.1 CALCINING ............................................................................................................................... 3 3.2 CONVERSION TO UO2:2UC .................................................................................................... 7
3.2.1 Thermodynamic Applications to CO Removal .............................................................. 7 3.2.2 Characteristics of UO2:2UC Kernels .............................................................................. 9
3.3 CONVERSION OF UO2:2UC KERNELS TO UC1-XNX KERNELS ....................................... 14 3.4 INTEGRATED PROCESSING OF UC1-xNx KERNELS ......................................................... 15 3.5 HCN STRIPPING OF [UC] TO INCREASE [UN] CONTENT .............................................. 16 3.6 ROUTINE KERNEL PRODUCTION AND CHARACTERIZATIONS ................................. 21
4. ................................................................................................................. GENERAL DISCUSSION 24 5. ................................................................................................................................ CONCLUSIONS 29 REFERENCES .................................................................................................................................... 32 APPENDIX........................................................................................................................................................33

iv
LIST OF FIGURES
Figure Page Fig. 1. Original mass spectrometer (MS) signals vs time during calcining of ~190 mg of ~1800-µm-dia. air-dried microspheres with C/U=2.65 in a 10 ml/min flow of Ar-4%H2 at 3.3 K/min ramp rate in the Netzcsh STA. Each curve is identified with its mass number; the signals for mass numbers 6 and 29 were near zero. The apparent backgrounds for 17, 18, and 28 were subtracted before processing in subsequent figures.
4
Fig. 2. The lower three curves are the MS CO2 signals for calcining in either Ar, Ar-4%H2 or H2 in the Netzsch STA with attached mass spectrometer. The upper curve shows O/U reduction during calcining in Ar of air-dried microspheres in flowing gas with initial C/U = 2.65, as derived from integration of the CO2 MS signal in Ar (solid line).
5
Fig. 3. Weight loss (%) during calcing of air-dried microspheres in flowing gas with initial C/U = 2.65 in either Ar, Ar-4%H2 or H2 in the Netzsch STA with attached mass spectrometer. 5
Fig. 4. The mass 18 MS signals for H2O evolution during calcing of air-dried microspheres in flowing gas with initial C/U = 2.65 in either Ar, Ar-4%H2, or H2 in the Netzsch STA with attached mass spectrometer. Also shown is the signal for NH3, mass 16 and 17, in Ar, lowest dotted curve.
6
Fig. 5. Total minimum liters of inert gas per gram of U needed for conversion of UO2:2C microspheres to UO2:2UC. (A) Isothermal conversion at temperature. (B) Conversion at 1 K/min from 1673 K to any higher temperature. (C) Conversion at 1 K/min from 1773 K to any higher temperature.
8
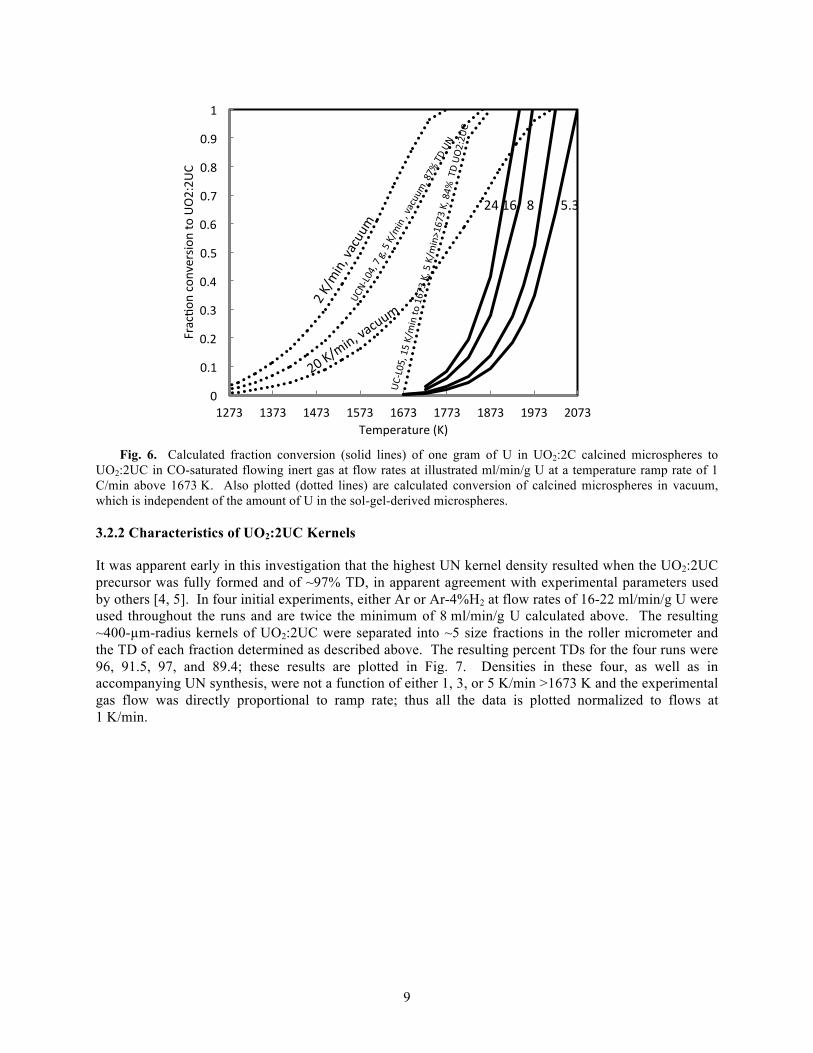
Fig. 6. Calculated fraction conversion (solid lines) of one gram of U in UO2:2C calcined microspheres to UO2:2UC in CO-saturated flowing inert gas at flow rates at illustrated ml/min/g U at a temperature ramp rate of 1 C/min above 1673 K. Also plotted (dotted lines) are calculated conversion of calcined microspheres in vacuum, which is independent of the amount of U in the sol-gel-derived microspheres.
9
Fig. 7. Experimental percent densities and calculated percent conversion vs gas flow rates used during UO2:2UC and UN synthesis, and normalized to 1 K/min temperature ramp rate used from 1673 to 2023 K. Dotted lines are UO2:2UC, dashed lines are data for UC1-xNx made from C/U = 2.65 microspheres, and solid lines are carbonitride made from C/U = 2.15 microspheres. All UN data resulted from N2 substitution for Ar at 1948 K, per ref. [5]. The diamond point in each density range is the average for the majority of the specimen and the range includes densities from the small tails of the size distribution. Line A plots the fraction conversion to UO2:2UC by 2023 K vs flow rate. Line B is analogous for 1948 K, where N2 was introduced, and the density data suggest that higher density results with >90% conversion to UO2:2UC.
10
Fig. 8. The XRD pattern of the sample synthesized using 3 h holding at 2023 K and consecutive cooling in Ar-4%H2 (UC-L01). Red, green, and pink patterns present the experimental, fit, and the residue, respectively. Red, black, and blue tick marks represent peak locations for UO2, UC, and LaB6 660b internal standard, respectively. c2 of the fit is 3.0.
11
Fig. 9. BSE SEM micrographs of UC/UO2 samples synthesized using different experimental conditions: (a-b) 3 h holding at 2023 K and consecutive cooling in Ar-4%H2 (UC-L01); (c-d) heating at 2023 K with no holding time and consecutive cooling in Ar-4%H2 (UC-L03), (e-f) heating at 2023 K with no holding time in Ar and cooling under vacuum (UC-L05).
12
Fig. 10. BSE SEM images and the corresponding EDS elemental maps of a typical kernel from the sample synthesized at 2023 K in flowing Ar-4%H2 without any holding time followed by cooling in the same environment (UC-L04).
13

v
Fig. 11. BSE SEM images and EDS elemental maps of a kernel from the sample synthesized by heat treating up to 2023 K in Ar without any holding time followed by cooling in Ar (UC-L06).
14
Fig. 12. Plot of log(pHCN [0.1 MPa]) for the UC-UN-carbon system at 0.1 MPa of N2-4%H2. (A) 2 C + N2 + H2 → 2 HCN. (B) [UC] + N2 + 0.5 H2 → [UN] + HCN at given x. 17
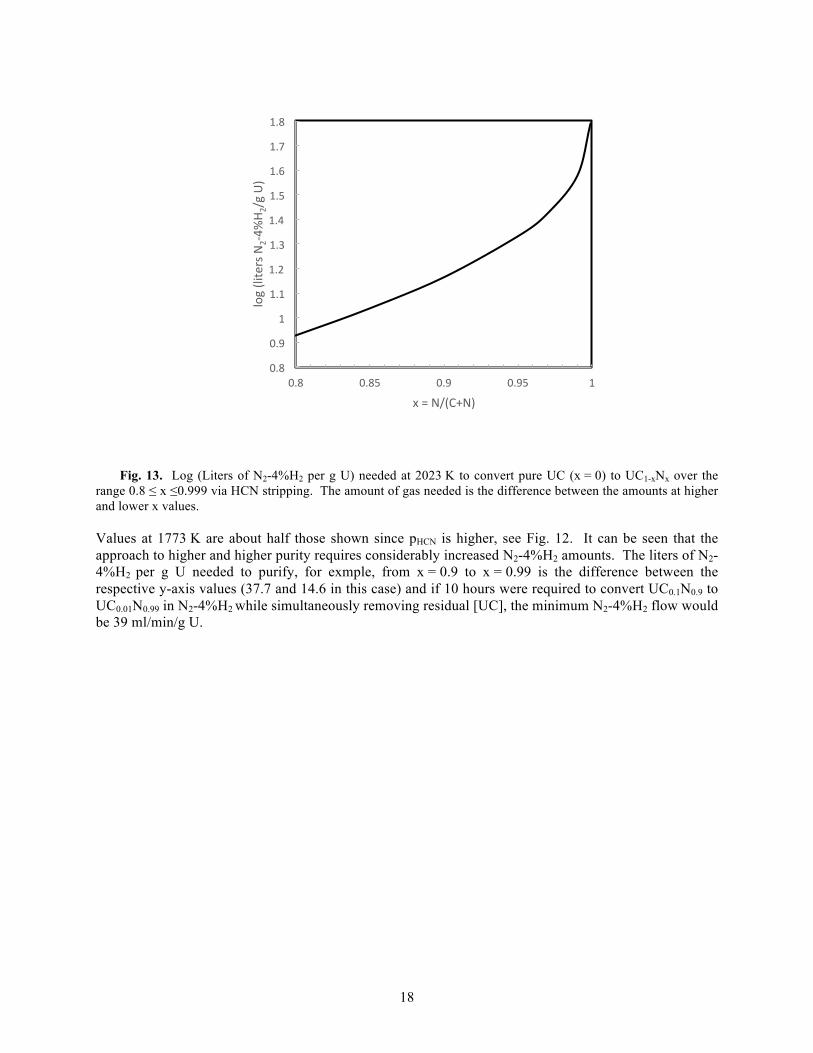
Fig. 13. Log (Liters of N2-4%H2 per g U) needed at 2023 K to convert pure UC (x = 0) to UC1-xNx over the range 0.8 ≤ x ≤0.999 via HCN stripping. The amount of gas needed is the difference between the amounts at higher and lower x values.
18
Fig. 14. The full profile fit of the XRD pattern of UC0.09N0.91 (lattice parameter = 0.48979(1) nm). Red, green, and pink patterns represent the experimental, fit, and the residue, respectively.
20
Fig. 15. Typical 810-µm-dia. UC0.15N0.85 kernels using the process parameters developed in this study. (FCM-UN10, Bin 6, 87% TD, nitriding in N2 at ~2175 K) 21
Fig. 16. Typical 840-µm-dia. UC0.04N0.96 kernels using the process parameters developed in this study. (UCN-L13, Bin 7, 86% TD, nitriding in N2-4%H2 at 2023 K) 22
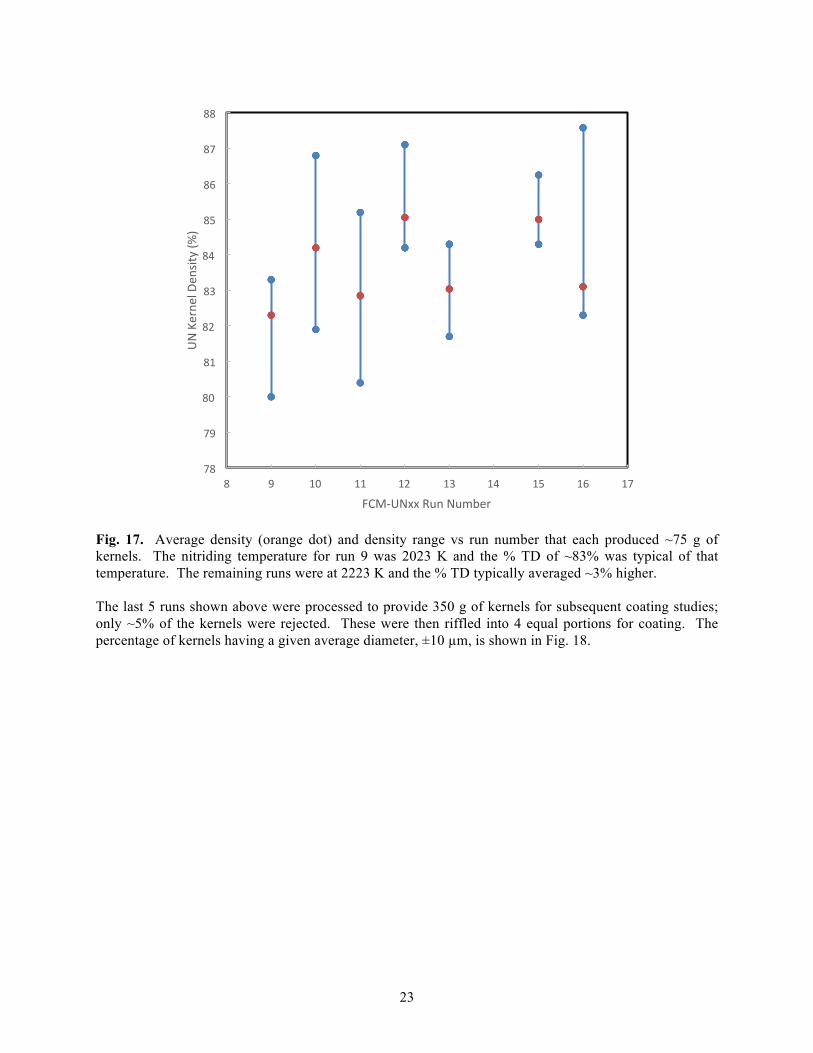
Fig. 17. Average density (orange dot) and density range vs run number that each produced ~75 g of kernels. The nitriding temperature for run 9 was 2023 K and the % TD of ~83% was typical of that temperature. The remaining runs were at 2223 K and the % TD typically averaged ~3% higher.
23
Fig. 18. Distribution of kernel diameters in 350 g of material combined from the last five runs shown in Fig. 17. 24
Fig. 19. The calculated behavior of pCO vs temperature and oxygen content in the two-phase region UO2 and UC1-yOy. The lower composition boundary occurs where the three-phase region that includes C appears, and the upper boundary where U appears, as illustrated on the figure. The Stoops and Hamme [29] pCO values at three temperatures are calculated from Eq 7, see text.
26
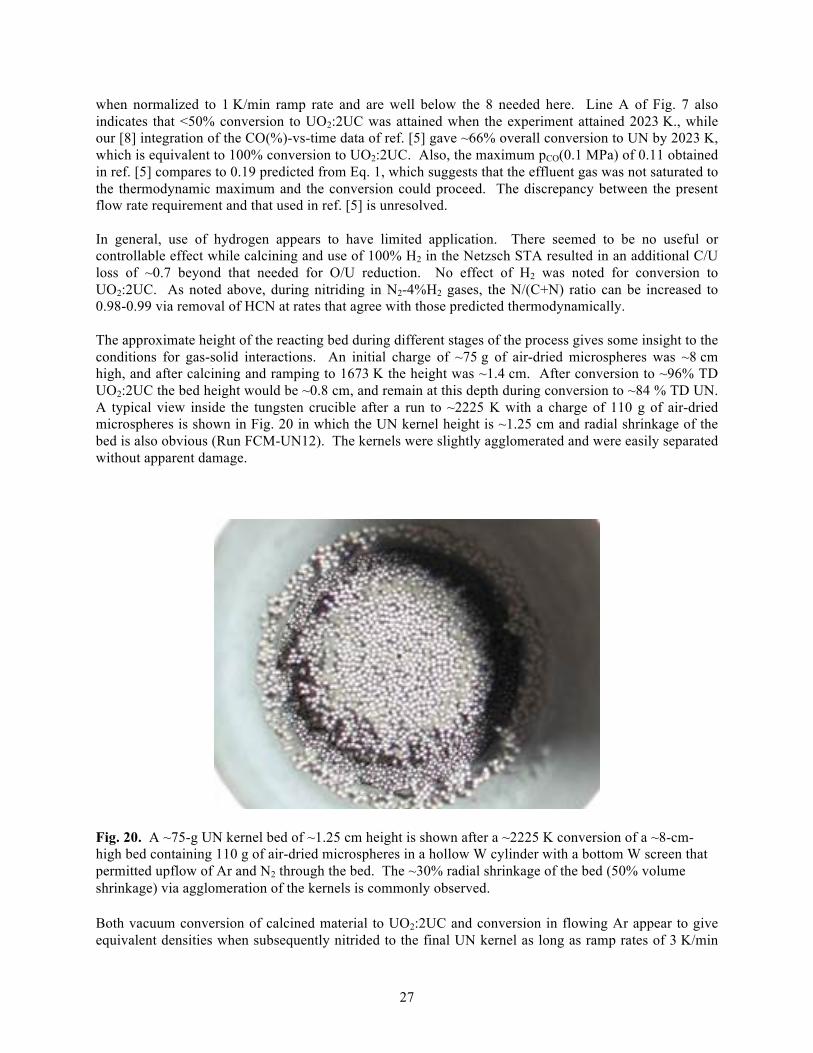
Fig. 20. A ~75-g UN kernel bed of ~1.25 cm height is shown after a ~2225 K conversion of a ~8-cm-high bed containing 110 g of air-dried microspheres in a hollow W cylinder with a bottom W screen that permitted upflow of Ar and N2 through the bed. The ~30% radial shrinkage of the bed (50% volume shrinkage) via agglomeration of the kernels is commonly observed.
27
Fig. 21. Percent theoretical density of nitride kernels and pellets vs final processing temperature. For UN microspheres: (A) present study; (B) Shoup [4]; (C) Mukerjee et al [6]; (D) Ledergerber et al [5]; (E) Odeychuk [12], For pellets: (F) Arai et al, U0.8 Pu0.2N [15]; (G1 and G2) Tennery et al, UN [14]; (H1 and H2), Metroka, UN [32] .
29

vi
LIST OF TABLES
Table Page Table 1. Process variables affecting density of UO2:2UC precursor 11 Table 2. Amounts of N2-4%H2 per mol U at 2023 K vs [UN] content 19

1
ABSTRACT
This report details the continued investigation of process variables involved in converting sol-gel-derived, urainia-carbon microspheres to ~820-µm-dia. UN fuel kernels in flow-through, vertical refractory-metal crucibles at temperatures up to 2123 K. Experiments included calcining of air-dried UO3-H2O-C microspheres in Ar and H2-containing gases, conversion of the resulting UO2-C kernels to dense UO2:2UC in the same gases and vacuum, and its conversion in N2 to in UC1-xNx. The thermodynamics of the relevant reactions were applied extensively to interpret and control the process variables. Producing the precursor UO2:2UC kernel of ~96% theoretical density was required, but its subsequent conversion to UC1-xNx at 2123 K was not accompanied by sintering and resulted in ~83-86% of theoretical density. Decreasing the UC1-xNx kernel carbide component via HCN evolution was shown to be quantitatively consistent with present and past experiments and the only useful application of H2 in the entire process.
1. INTRODUCTION
This paper reports a study of the many experimental parameters involved in conversion of gel-derived urania-carbon microspheres to UN fuel kernels. The technical basis for the needed fabrication of accident-tolerant UN fuel has been summarized earlier [1, 2]and publications since 1975 report synthesis of UN kernels [3-13]. A common theme is the experimental difficulty in approaching theoretical density for the very refractory UN, which melts at 3035 K at 0.1 MPa N2 [13], as was also noted for UN pellets [14] and (U,Pu)N pellets[15] fabricated from powder. Most studies used isothermal conversion to UN, sometimes followed by attempts to increase the kernel density with higher temperatures and N2-free atmospheres. Another common theme was conversion first to a UO2:2UC kernel either in flowing inert gas or vacuum (also used for making UO2-UC-UC2 fuel kernels at 1823 K [16] and 2163 K [17, 18]), followed by conversion to UN in flowing N2. Sometimes H2 was also a gas component. Ledergerber et al [5] reported the sole use of gas flowing through the microspheres at a known rate in a vertical Mo crucible, while the others exposed the reactant bed at less efficient modes of gas exchange. Generally, maximum batch sizes contained <60 g U content. Here the primary experiments are an extension of those in ref. [[5] and were conducted in vertical Mo and W crucibles in which gas flows up through the bed of microspheres at temperatures up to 2023 K. The programmatic objective was production of dense UN kernels for irradiation experiments. The experiments permitted a detailed investigation of non-isothermal carbothermic conversion to UO2:2UC during a 1-5 K/min temperature ramp at different flow rates, followed by conversion to UN at 1948-2123 K and sintering up to ~2373 K. Several other allied experimental results are also reported.

2
2. GENERAL DESCRIPTION OF EXPERIMENTS
The internal gelation process was used to produce hydrated uranium trioxide microspheres containing Cabot Mogul L carbon black adequately dispersed throughout the gel spheres as described in ref. [9]. Cabot Mogul L is the fluffy form of Cabot’s Black Pearl L. It has a density of 0.2403 g/cm3, a surface area of 138 m2/g, and an average particle size of 24 nm. In solution it tends to form large aggregates which are best dispersed in basic solution with a dispersing agent. In these experiments, the carbon and dispersing agent (Tamol SN) were added to the chilled basic hexamethylenetetramine (HMTA)/urea solution and sonified for 5 min with a Hielscher UP200S ultrasonic probe. It was subsequently chilled in an ice bath prior to mixing it with the chilled acid deficient uranyl nitrate solution to make the broth. Care was given to minimize the chance of the carbon reagglomerization, flocculation, and settling in the broth before gel spheres were formed. The air-dried microspheres retain both H2O and NH3 with an approximate ratio of 15/1 [19], have a C/U ratio of 2.65, and a density of ~1.6 g/cm3, equivalent to ~40% of theoretical density. A few experiments were performed with similar air-dried microspheres having C/U ratios of 2.15 and 2.3.
Major equipment, supplies, and methods are described next. All gases were ultrapure grade. The graphite furnace was capable of 2473 K (Astro furnace, Thermal Technologies). It was fitted initially with a vertical Mo crucible similar to that used in ref. [5] with a ~100 cm3 working volume (3.76 cm inside dia. × 8.64 cm high) that held a maximum of ~120 g of air-dried microspheres on a Mo screen. A 2273 K nitriding run indicated melting of the Mo screen and a review of published phase diagrams revealed a ~2200 K Mo-N eutectic and a W-N peritectic involving liquids [20]. Thus, a hollow W cylinder of similar dimensions positioned on a W screen above a carbon base was used subsequently, nitriding experiments were limited to <2300 K to avoid the known W-N peritectic, and Ar was used for UN kernel sintering experiments up to 2375 K, with no further indication of liquids. Ultra high purity gases were introduced into the crucible bottom through either a ~4.5-cm-dia. Mo or, later, W screen. Optical and thermocouple methods confirmed the bed temperature, and flow rates as high as 2.5 l/min, beyond those used here, cooled the bed by less than 5 K from set point above 1775 K. Geometrical densities of input microspheres and product kernels were determined from their weights and radii obtained from stereoscopic images, ref. [11]. The product from each 25 to 110 g run was separated by a roller micrometer into ~5 fractions that differed by ~30 µm in diameter. Geometrical density of each fraction was determined from average kernel weight and stereoscopic measurement of kernel diameters; 794 (±10) µm iron spheres were used to calibrate this procedure and gave 96.7% theoretical density. Subsequent porosimetric measurements of density confirmed those measured optically. Crystalline chemical phases were identified using X-ray diffraction (XRD) and subsequent analysis [11]. The value of x in UC1-xNx was determined from the lattice parameter, p (nm), via the relation x = -759.314+3223.5 p - 3412.4 p2. The latter equation was obtained by fitting 40 (x, p) data pairs, 31 from UC to UN from ref. [21], and 9 in the composition range ~0.3 ≤ x ≤ ~0.87 reported in ref. [22]. This relation gives UN1.001 at 0.4890 nm. (A similar equation from ref. [5] was inaccurate for x < ~0.5, while the one from ref. [22] only fitted those ~30 data pairs.) A typical experiment when using the Mo crucible in the Astro furnace is described next. Calcining from ambient to ~975 K was performed at 3 K/min, then the calcined material was ramped at 5 K/min to 1673 K where the CO partial pressure was high enough to permit conversion to UO2:2UC, all in known flows of either Ar or Ar-4%H2. From 1673 to 2023 K ramp rates were constant at either 1, 3, or 5 K/min, with either N2 or N2-4%H2 introduced at 1948 K and the ramp continued to as high as 2123 K where the final conversion to UN was accomplished in ~20 h (i.e, overnight). The UN kernels were cooled at 5 K/min in either Ar or Ar-4%H2 to prevent formation of the sesquinitride. Specific gas flows used will be described in the experimental section. Also, some experiments terminated when UO2:2UC was formed

3
by 2123 K so that the characteristics of this UN precursor could be determined. In several experiments the calcined microspheres were taken in vacuum from 900 K to 2123 K to form UO2:2UC. In all phases of this study the thermodynamics of the relevant conversion reactions were used to interpret and guide the temperature, gas flow rate, and mass-balance parameters necessary to remove gaseous products (CO2, CO and HCN) at different stages of the process.
3. EXPERIMENTAL RESULTS AND DISCUSSION
The experimental program gave information on calcining, the conversion of calcined material to the UO2:2UC intermediate, its subsequent conversion to UC1-xNx, the conversion of calcined material directly to UC1-xNx, increasing the value of x in flowing N2–4% H2 via removal of HCN, and the size distribution of the resulting kernels. Each subject area is reported and discussed in its own section.
3.1 CALCINING
Our previous studies of calcining [8, 9] were augmented by again detecting the mass signals from released gases with a mass spectrometer (MS) attached to a Netzsch simultaneous thermal analyzer (STA) (Model STA 449 F1 Jupiter) while ramping at 3.3 K/min. A 400 to 1700 K blank run confirmed that the weight change was accurate within < ~0.25 mg. Initial sample weights of air-dried microspheres were 115 to 190 mg with initial C/U = 2.65 and gas flow rates were ~120 ml/min/g U. Typical data for a run in Ar-4%H2 are illustrated in Fig. 1 and similar plots were made for runs in Ar and 100% H2. It was assumed that the non-zero signals for masses 17, 18, and 28 above 900 K were background and were subtracted. Possible contributions to each mass number from the presence of CO, CO2, H2O, NH3, and their fragments are shown in Appendix 1. Comparison of the data from the three runs led to the conclusion that the MS signal for H2O was primarily mass 18, those for NH3 were mass 16 and 17, and those for CO plus CO2 were mass 6 and 12 (both minor), 28 and 44. The results of the present analysis are shown in Figs. 2-4; all mass curves have been scaled for illustrative purposes and cannot be compared quantitatively. In Fig. 2, the CO2 peaks 2 in Ar over the 450-650 K range confirm the deduction in ref. [9] that the O/U is gradually reduced from 3 by carbon and concludes at 2 by 873 K; integration of the CO2 trace over temperature permits calculation of the O/U-vs-T behavior shown in Fig. 2. Figure 3 illustrates that when calcining in Ar-4%H2, the hydrogen primarily finishes reducing the O/U to 2 starting at ~773 K and finishes ~50 K earlier than in Ar alone, while H2 reduction begins at ~650 K and terminates ~175 K lower than in Ar, at ~750 K. Similarly, the CO2 traces (which are not quantitative) for the three different calcining gases illustrate that O/U reduction by carbon begins at 475 K, but its participation terminates at lower temperature with increasing H2 content. The H2O evolution illustrated in Fig. 4 shows a corresponding behavior with increasing H2 content. However, the additional 2.4% weight loss in 100% H2 shown in Fig. 3 is equivalent to an additional C/U loss of ~0.7, must result from another mechanism for loss of carbon, and cannot be tolerated in the kernel-making process. The O/U reduction to produce only CO instead of CO2 is not indicated by the MS signals and would only account for an extra ~1.7% weight loss. Even so, some of this may occur via the upper water gas shift reaction CO + H2O = CO2 + H2, which does occur in the present 583-723 K temperature range; for this reaction, the use of 100% H2 significantly decreases the CO2/CO ratio relative to that in either Ar or Ar-4%H2 and the ratio of the MS mass signals 44/28 does decrease as predicted. Another loss of carbon via CH4 may occur via the Sabatier reaction CO2 + 4 H2 = CH4 + 2 H2O, which is favored in the 575-675 K range. Both of these reactions normally require a catalyst. There is also the reaction 2 H2 + C = CH4. All three of these reactions are especially thermodynamically favorable in the presence of 100% H2 and produce either CO/CO2 ratios or CH4 pressures that could account for carbon loss beyond that from CO2. On the other hand, use of 100% H2 during calcining of kg-sized batches to ultimatelly produce oxycarbide kernels

4
generally were calculated here to give good carbon balance for the process and suggests that the above reactions, if operable, were minimal [17, 18].
Fig. 1. Original mass spectrometer (MS) signals vs time during calcining of ~190 mg of ~1800-µm-dia. air-
dried microspheres with C/U=2.65 in a 10 ml/min flow of Ar-4%H2 at 3.3 K/min ramp rate in the Netzcsh STA. Each curve is identified with its mass number; the signals for mass numbers 6 and 29 were near zero. The apparent backgrounds for 17, 18, and 28 were subtracted before processing in subsequent figures.
The weight losses observed in the experiment in Ar were used to deduce a possibly more detailed composition of the air-dried microspheres. Reduction of O/U from 3 to 2 produces 0.5 mols of CO2 per mol U and a weight loss of 6.13%. The rest of the weight loss was equivalent to removal of ~2.3 mols of H2O + NH3 per mol U. As noted above, the probable H2O/NH3 ratio was 15 and the C/U was 2.65. Thus the overall composition of the air-dried microspheres is consistent with UO3:2.16H2O:0.14NH3:2.65C and an initial weight of ~360 g/mol U. Note that experiments with the initial C/U=2.65 lead to a calcined kernel that is UO2:2.15C, which is converted to UO2:2.15UC. For convenience, in this document the former is called UO2:2C and the latter UO2:2UC. Nitriding then produces UC0.15N0.85.
0.0E+00
2.0E-‐11
4.0E-‐11
6.0E-‐11
8.0E-‐11
1.0E-‐10
1.2E-‐10
273 373 473 573 673 773 873 973
Mass S
pectrometer (M
S) Signal
Temperature (K)
28 18 17 16
44 12

5
Fig. 2. The lower three curves are the MS CO2 signals for calcining in either Ar, Ar-4%H2 or H2 in the Netzsch
STA with attached mass spectrometer. The upper curve shows O/U reduction during calcining in Ar of air-dried microspheres in flowing gas with initial C/U = 2.65, as derived from integration of the CO2 MS signal in Ar (solid line).
Fig. 3. Weight loss (%) during calcing of air-dried microspheres in flowing gas with initial C/U = 2.65 in either
Ar, Ar-4%H2 or H2 in the Netzsch STA with attached mass spectrometer.
0.00
0.50
1.00
1.50
2.00
2.50
3.00
273 373 473 573 673 773 873 973
CO2 M
S Signal O/U
in Ar
Temperature (K)
in Ar4%H2
in Ar in H2
O/U
-‐20
-‐15
-‐10
-‐5
0
273 373 473 573 673 773 873 973
Weight Loss (%)
Temperature (K)
H2

6
Fig. 4. The mass 18 MS signals for H2O evolution during calcing of air-dried microspheres in flowing gas with initial C/U = 2.65 in either Ar, Ar-4%H2, or H2 in the Netzsch STA with attached mass spectrometer. Also shown is the signal for NH3, mass 16 and 17, in Ar, lowest dotted curve.
A few insights were obtained for the calcining process from subsequent conversion to UN. When a ramp of 5 K/min instead of 3 K/min was used, the calcined kernels contained defects, such a pin holes, and the resulting UN kernels were cracked. This implies that sufficient time is needed for the ~160 ml of H2O and CO2 that is formed per ml of air-dried microspheres to diffuse from the microsphere to prevent physical damage via a rapid increase in internal pressure. XRD of the calcined microspheres showed that UO2 was the sole uranium-bearing phase. Continued heating of the UO2-C microspheres to 1570 K in the Netzsch STA resulted in <1% additional weight loss and no CO and CO2 evolution. Subsequent conversion to UO2:2UC commenced at 1570 K with accompanying CO evolution since pCO(0.1 MPa) > 0.0004 was sufficient for the sweep gas to remove the CO conversion product. When calcining was continued to 1273 K, the density of the UO2:2C kernel was 30% of theoretical [8], and when continued to 1673 K was 45-50% of theoretical, which indicated sintering of the UO2:2C kernel. XRD of the final UC1-xNx kernel gave XRD composition results consistent with 0.5 CO2 evolved during calcining in Ar. Two runs (L16 and L20) with 25 g of air-dried material were calcined in Ar and then converted in N2 at 2023 K. Calcining of one mol UO3 with 0.5 mols C should give UO2 and 0.5 mol CO2 and decrease the initial C/U = 2.65 to 2.15. Subsequent nitriding removed 2 mols CO and the excess of 0.15 would be expected to appear as 1-x amount of solid-solution [UC], in which [UC] and [UN] represent these components in the ideal solid solution of UC1-xNx. The lattice parameters of the UC1-xNx product were equivalent to 1-x values of 0.14 and 0.16, which average to the expected 0.15. Another run (L22) started with C/U = 2.3 material, was calcined in Ar, and converted at 2023 K in N2. XRD analysis indicated UC0.05N0.95 and 12.0 wt% UO2, in good agreement with mass-balance calculations giving 13.3 wt% UO2 upon assuming that 0.5 CO2 was evolved during calcining. In a run using C/U = 2.15 material (UN-21) and calcining in sufficient Ar-4%H2 to reduce the O/U with the H2 content, followed by conversion in N2, resulted in x = 0.95, which is equivalent to C/U = 2.05 after calcining, while O/U reduction entirely by C would have given C/U = 1.65 and XRD evidence of UO2. The H2 thus provided 80% of the O/U reduction. Conversely, in another experiment (UN-25) with C/U = 2.65 initially and calcining in Ar-4%H2 and nitriding in N2 gave x = 0.83, which indicates C/U = 2.17 after calcining, i.e., only 0.02/0.5 or 4% of the O/U reduction was accomplished by H2. It appears from these experiments that reduction of
0.0
0.1
0.2
0.3
0.4
0.5
0.6
0.7
0.8
0.9
273 373 473 573 673 773 873 973
H 2O and
NH 3 M
S sig
nals
Temperature (K)
in Ar4%H2 in H2
NH3

7
O/U in Ar-4%H2 during calcining is not controllable. If reduction by 100% H2 were controllable, the O/U reduction from 3 to 2 by H2 flowing through a vertical bed of air-dried microspheres requires a minimum of one mol H2 per mol U. Figure 4 illustrates that most of the reduction occurs over 600 to 800 K, which is traversed in 67 minutes at the recommended 3 K/min. It follows that, for H2 to accomplish all the reduction, a minimum flow of 1.4 ml H2/min/g U is needed.
3.2 CONVERSION TO UO2:2UC
3.2.1 Thermodynamic Applications to CO Removal
The literature [4, 5] suggests that carbothermic conversion of calcined material to a UO2:2UC kernel was nearly completed before N2 was introduced near the final nitriding temperature. The present work substantiated this view, found that insight into this part of the overall process was useful, and thus the thermodynamics of the T-pCO relationship was applied to the present experiments. The rate of conversion is primarily dependent on removal of CO by flowing inert gas as long as the kernel does not sinter sufficiently to result in rate control by slower processes within the kernel. This condition applies for low-density calcined microspheres [6, 8] below ~1900 K. This rate, in turn, is fundamentally dependent on the mols of CO produced per mol of U, which is calculated here for both isothermal and non-isothermal experimental temperatures. The relevant reaction is
UO2 + 3 C → UC + 2 CO Reaction (1)
in which the CO pressure at temperature is represented [8] by
log(pCO, [0.1 MPa]) = −19,346/T (K) + 8.83. (1)
Since pCO is subatmospheric at temperatures commonly used for carbothermic conversion, the absolute minimum mols of inert gas needed to remove one mol of CO at a given temperature is the inverse of pCO. When converting the UO2:2C microsphere, 2/3 of Reaction 1 produces 4/3 mol CO. In inert gas flowing at a given rate (ml/min), the inverse of pCO can be multiplied by the factor (4/3)22,460/238 to give an experimentally useful value for ml/min/g U. These values for isothermal conversion are shown as line A in Fig. 5. For a sample converted over a temperature range at a constant ramp rate (K/min), values of pCO for Reaction 1 were summed over equally-spaced temperatures to give the mols of CO released during the temperature ramp. To do this, the mean-value theorem (MVT) was applied to calculate average pCO(MVT) values over a given temperature range. (The integration of pCO = exp(A/T+B) over temperature cannot be accomplished in closed form and numerical integration using the trapezoidal method over 10 K increments is typical.) For the present experimental temperatures, the pCO MVT values for Eq. 1 at any given T above 1673 K are represented by
log(pCO MVT [0.1 MPa]) = -9.346 + 0.00395 T (K). (2)
Application of Eq. 2 is illustrated for conversion of UO2:2C from 1673 to 2023 K, for which pCO MVT = 0.0444 at 2023 K. The inverse is 22.52, and multiplying by 4/3 gives 30.03 mols of inert gas/mol U, or 2.82 l/g U. The log of the latter value at 2023 K and other temperatures is shown in curve (B) in Fig. 5. Furthermore, at a ramp rate of 1 K/min over the 350 K range, the minimum flow rate needed for conversion by 2023 K is 2.82 l/350 or 8.08 ml/min/g U. A ramp rate of 5 K/min would require five times this flow or 40.4 ml/min/g U. (Consequently, here all experimental flow rates are divided by the temperature ramp rate to normalize the flow rate given in the subsequent figures to the equivalent of 1 K/min.) Equation 2 also predicts a doubling of calculated flow for each 70 K lowering of

8
the conversion temperature below 2023 K. Experimental values have to be higher than these minimum flows so that the equilibrium pCO at any temperature is not attained, which would stop Reaction 1. Finally, as a further example, curve (C) illustrates the minimum flow needed when ramping from 1773 K to any other temperature.
Fig. 5. Total minimum liters of inert gas per gram of U needed for conversion of UO2:2C microspheres to
UO2:2UC. (A) Isothermal conversion at temperature. (B) Conversion at 1 K/min from 1673 K to any higher temperature. (C) Conversion at 1 K/min from 1773 K to any higher temperature.
Fig. 6 illustrates a different application of Eq. 1 for conversion of one gram of U in calcined UO2:2C microspheres to give the UO2:2UC product. Equation 1 was used to calculate the pCO in 5 K increments from 1673 K to higher temperatures and this value was used to calculate the mols CO removed at a given flow rate, and these mols of CO were summed over temperature until complete conversion to UO2:2UC was attained. All calculations were made at a ramp rate of 1 K/min. If higher ramp rates were used, flow rates would have to be increased proportionately to give results identical to those shown in Fig. 6 since a given total amount of flowing gas is needed to remove a given amount of CO. These curves and similar calculations were especially useful in establishing the experimental parameters and interpreting the results.
-‐1.0
-‐0.5
0.0
0.5
1.0
1.5
2.0
1673 1773 1873 1973 2073 2173 Temperature (K)
log(liters o
f ine
rt gas per gU)
9
Fig. 6. Calculated fraction conversion (solid lines) of one gram of U in UO2:2C calcined microspheres to
UO2:2UC in CO-saturated flowing inert gas at flow rates at illustrated ml/min/g U at a temperature ramp rate of 1 C/min above 1673 K. Also plotted (dotted lines) are calculated conversion of calcined microspheres in vacuum, which is independent of the amount of U in the sol-gel-derived microspheres.
3.2.2 Characteristics of UO2:2UC Kernels
It was apparent early in this investigation that the highest UN kernel density resulted when the UO2:2UC precursor was fully formed and of ~97% TD, in apparent agreement with experimental parameters used by others [4, 5]. In four initial experiments, either Ar or Ar-4%H2 at flow rates of 16-22 ml/min/g U were used throughout the runs and are twice the minimum of 8 ml/min/g U calculated above. The resulting ~400-µm-radius kernels of UO2:2UC were separated into ~5 size fractions in the roller micrometer and the TD of each fraction determined as described above. The resulting percent TDs for the four runs were 96, 91.5, 97, and 89.4; these results are plotted in Fig. 7. Densities in these four, as well as in accompanying UN synthesis, were not a function of either 1, 3, or 5 K/min >1673 K and the experimental gas flow was directly proportional to ramp rate; thus all the data is plotted normalized to flows at 1 K/min.
0
0.1
0.2
0.3
0.4
0.5
0.6
0.7
0.8
0.9
1
1273 1373 1473 1573 1673 1773 1873 1973 2073
FracRo
n conversio
n to UO2:2U
C
Temperature (K)
24 16 8 5.3

10
Fig. 7. Experimental percent densities and calculated percent conversion vs gas flow rates used during
UO2:2UC and UN synthesis, and normalized to 1 K/min temperature ramp rate used from 1673 to 2023 K. Dotted lines are UO2:2UC, dashed lines are data for UC1-xNx made from C/U = 2.65 microspheres, and solid lines are carbonitride made from C/U = 2.15 microspheres. All UN data resulted from N2 substitution for Ar at 1948 K, per ref. [5]. The diamond point in each density range is the average for the majority of the specimen and the range includes densities from the small tails of the size distribution. Line A plots the fraction conversion to UO2:2UC by 2023 K vs flow rate. Line B is analogous for 1948 K, where N2 was introduced, and the density data suggest that higher density results with >90% conversion to UO2:2UC..
Subsequently, a series of six experiments investigated the formation of this precursor and the parameters are given in Table 1. In these and other experiments it was noted that a 10 to 15 K/min ramp of calcined material from 973 to 1673 K generally resulted in a lower density of UO2:2UC and thus ramp rates of 3-5 K/min were used subsequently. The best densities were obtained in UC-L01* with a 3 h hold at 2023 K and in UC-L06 where Ar was used with a 1 K/min ramp rate and no hold at 2023 K, the latter being 5% TD higher than when Ar-4%H2 was used, UC-L05. Generally, a hold of at least an hour at the final temperature is recommended before N2 is introduced. *Experiment numbers such as UC-L01, UCN-L10, and FCM-UN06 are included throughout this document to ensure accurate referral to the original data files for each experiment.
40
50
60
70
80
90
100
0 5 10 15 20 25
Theo
re&cal Den
sity (T
D, %) o
r % con
version to UO
2:2UC
ml (Ar or Ar-‐4%H2 )/min/g U (with flow rates normalized to 1 K/min T ramp)
solid, UN, C/U=2.15 dash, UN, C/U=2.65 dots, UO2:2UC, C/U=2.65
A B
N2 a
t 1673 K

11
Table 1 Process Variables Affecting Density of UO 2:2UC Precursor
Run # Gas ramp rate (K/min) from 1673 to 2023 K TD (%) comments
UC-L01 A4H 5
96 30 µm UO2 outer layer UC-L02 A4H ended at 1673 K 46 no conversion of UO2 + 2.15 C UC-L03 A4H 3
89 40-50 µm UO2 outer layer
UC-L04 A4H 1
92 30 µm UO2 outer layer UC-L05 Ar 5 in vacuum 84 30-40 µm UO2 outer layer UC-L06 Ar 1
97 25 µm UC outer layer
Initial C/U = 2.65; flow rate 16 ml/min/g U; ramp rate 3 K/min to 973 K; from 973 to 1673 K, 5 K/min for UC-L01, 15 K/min otherwise; A4H represents Ar-4%H2; UC-L01 held 3 h at 2023 K, no hold for remainder, cooled in same gas at 10-20 K/min
The UO2:2UC kernels were characterized further by XRD and ceramography in a scanning electron microscope (SEM) using backscatter electron imaging (BSE). The XRD of UC-L01, Fig. 8, revealed UO2 and UC. XRD of a few of the other kernels revealed small amounts of UC2.
Fig. 8. The XRD pattern of the sample synthesized using 3 h holding at 2023 K and consecutive cooling in Ar-
4%H2 (UC-L01). Red, green, and pink patterns present the experimental, fit, and the residue, respectively. Red, black, and blue tick marks represent peak locations for UO2, UC, and LaB6 660b internal standard, respectively. χ2 of the fit is 3.0.
Samples observed in the SEM micrographs in Fig.9 were synthesized by heat treating up to 2023 K in flowing Ar-4%H2 with a 3 h holding time (UC-L01) and without any holding time (UC-L03) indicated

12
the presence of a low contrast UO2 (the effective atomic number of UO2 is lower compared to that of UC) layer at the kernels surfaces. Another sample synthesized heating in Ar up to 2023 K without any holding time followed by cooling in vacuum (UC-L05) also showed the similar characteristics. Kernels of all these samples consist of interchangeable grains of UO2 and UC in their bulk part.
Fig. 9. BSE SEM micrographs of UC/UO2 samples synthesized using different experimental conditions: (a-b)
3 h holding at 2023 K and consecutive cooling in Ar-4%H2 (UC-L01); (c-d) heating at 2023 K with no holding time and consecutive cooling in Ar-4%H2 (UC-L03), (e-f) heating at 2023 K with no holding time in Ar and cooling under vacuum (UC-L05).
The SEM micrographs and elemental maps shown in Fig. 10 are from a typical kernel of the sample synthesized at 2023 K in Ar-4%H2 without any holding time. This sample was cooled to room temperature also in flowing Ar-4%H2. The presence UO2 and UC grains in the bulk area of the kernel (the upper left BSE SEM image) can be confirmed using the corresponding EDS elemental maps. High-contrast areas in the BSE SEM image correspond to low oxygen concentrations confirming that these grains are of UC. The low-contrast UO2 grains show high oxygen concentrations as expected. As in the other samples discussed earlier (Fig. 9), this sample also contained a ~30-µm layer of UO2 at the kernel surface; such a UO2 layer was a common observation on oxide-carbide fuel kernels such as those used for the AGR-1 irradiation [16-18, 23-25]. The BSE SEM image (at the lower left) and the corresponding EDS maps obtained from an area close to the kernel surface also confirm this observation.

13
Fig. 10. BSE SEM images and the corresponding EDS elemental maps of a typical kernel from the sample
synthesized at 2023 K in flowing Ar-4%H2 without any holding time followed by cooling in the same environment (UC-L04).
The sample UC-L05 synthesized at 2023 K in flowing Ar without any holding time at that temperature and cooling under the same gas flow showed the presence of UO2, UC, and UC2 according to XRD. Also, the thin layer on kernel surfaces of this sample was of high-contrast in the BSE SEM image (top BSE SEM micrographs in Fig. 11). The EDS elemental maps obtained on an area close to a typical kernel surface also showed that high-contrast layer consists of low oxygen levels. Thus, it is shown that the majority of thin layer on the kernels in this sample consists of UCx chemical phase.

14
Fig. 11. BSE SEM images and EDS elemental maps of a kernel from the sample synthesized by heat treating
up to 2023 K in Ar without any holding time followed by cooling in Ar (UC-L06).
Quantitative ceramography was used to analyze the phase content of UC-L06 kernels. The overall kernel carbide content should be ~60 volume %, and the UO2 ~40%. In the kernels of Fig. 11, ceramography revealed an outer skin of UCx that was ~25 µm thick and an interior that was a UO2-UC mixture. The average radius of the kernels was ~427 µm and thus the surface layer was ~17% of the kernel volume. The interior thus contains 43 volume % UC and 40 volume % UO2, i.e., ~52% of the interior should be UC, while manual quantitative ceramography of the interior (point count) gave 58%.
3.3 CONVERSION OF UO2:2UC KERNELS TO UC1-XNX KERNELS
The conversion of the near-TD intermediate UO2:2UC kernels of the previous section to UC1-xNx is examined next (experiment identification appears in parentheses). Ten grams of the 97% TD UO2:2UC produced in Ar (UC-L06) was treated (UCN-L17) in N2 at a flow of 11 ml/min/g U in the Mo crucible at 2023 K for 20 h. This treatment resulted in 82% TD nitride with x = 0.95 and no UO2. Multiplying the 97% TD UO2:2UC by the ratio of the molar volumes of UN (17.4 ml/mol U) to UO2:2UC (20.44 ml/mol U) gives 82.6% TD UN and is consistent with the experimental 82% TD. Similarly, ~84% TD UO2:2UC kernels produced in vacuum (UC-L05) were nitrided (UCN-L19). The kernels were heated in Ar to 1948 K followed by heating them to 2023 K at 1 K/min in N2-4%H2 at 22 ml/min/g U. They were then held at that temperature for 20 h and subsequently cooled to ambient temperature in Ar-4%H2 at 5 C/min. The TD of this material was 74.7% (±2), vs a predicted 71.5% without sintering. A further indication of negligible sintering was that the average radius of the kernels before and after conversion was unchanged within 0.5%. XRD indicated an x value of 0.95 with no UO2.

15
The above results reveal that conversion of near-TD UO2:2UC to a UN kernel is clearly not accompanied by sintering at 2023 K in 20 h.
3.4 INTEGRATED PROCESSING OF UC1-xNx KERNELS
The remaining 12 experiments started with either 25, 50, or 75 g of air-dried microspheres and ended with UC1-xNx. Calcining was performed at the standard ramp rate of 3 K/min to 973 K, the ramp rate increased to 5 K/min to 1673 K in either Ar or Ar-4%H2, where conversion to UO2:2UC commenced. Then the ramp rates were set at either 1, 3, or 5 K/min from 1673 to 2023 K. From 1673 to 1948 K the same gases were used. As explained above, the experimental flow rates shown in Fig. 7 were normalized to a ramp rate of 1 K/min, e.g., 10 cc/min at 1 K/min was equivalent to 50 cc/min at 5 K/min, since there was no apparent effect on kernel density (as long as the normalized 8 ml/min/g U was exceeded during the ramp to 2023 K). At 1948 K either N2 or N2-4%H2 were substituted, the ramp continued, and the kernels held for 18-20 h at 2073 K. The usual flow rate for N2-containing gas was ~25 ml/min/g U, which is twice that needed for 100% conversion of oxycarbide to UN in 120 minutes at 2023 K at pCO(0.1 MPa) of 0.1. In a few experiments 125 ml/min/g U were used. The range of flows during conversion to nitride had no apparent effect on final kernel density. There are some obvious outliers in Fig. 7 that need comment. There is an almost 50% range in TD below the normalized flow rate of 8 ml/min/g U and line A suggests that ~30-40% of the UO2-carbon microsphere remained unconverted to UO2:2UC by 2023 K and was the cause of the lower density. The ~50% TD at 24 resulted from introducing N2 at 1673 K; line B suggests that all UC1-xNx was formed before ~1950 K. Lastly, the two >90% TD results shown in the upper right may have been enhanced by the 5-30% UO2 content revealed by XRD. Another long series of experiments are summarized here. Experiments FCM-UN01 to 08 using a new batch of air-dried C/U = 2.65 material resulted in UO2:2UC and UN kernel densities lower than those reported above when converted at 2023 K, but nitriding at 2123 K gave better densities. (Subsequent experiments with the original C/U = 2.65 microspheres gave TD values equivalent to those obtained before, indicating that the difference between microsphere batches is real and not because of changes in furnace variables.) Initial sample weights were 25 g except for 100 g in FCM-UN06 and all were calcined in Ar at the standard 3 K/min to 973 K. Conversion to UO2:2UC in Ar from 1673 to 2023 K at an optimum ramp rate of 1 K/min, with no hold, gave only 87% TD UO2:2UC (FCM–UN02), about 10% lower than with previous air-dried material. (If this material were converted to UN, the % TD would be 74%.) Conversion in vacuum at 3 K/min to 2023 K followed by a 16 h nitriding gave 80% TD nitride kernel (FCM-UN07), with a calculated 92% TD UO2:2UC precursor. Conversion to UO2:2UC in vacuum at 5 K/min to 2123 K and a 10 hr hold, then nitriding for 10 h at 2023 K gave 70% TD UN (FCM-UN08). Conversion of 100 g in vacuum at 10 K/min to 2023 K followed by a 16 h nitriding gave 66% TD UN (FCM-UN06). These latter three experiments gave UN densities reasonably consistent with the 74% calculated above. The three experiments also indicate a decrease in UN density with increasing ramp rate. In experiments at 2123 K, conversion in Ar at 5 K/min to 2123 K, a 10 h hold, then nitriding for 1 h gave 85% TD UN, one of the best UN densities obtained (FCM-UN04). In an attempt to preserve the calcined UO2:2.15C kernel to temperature, after calcining the Ar flow was stopped (to prevent removal of CO), a 10 K/min ramp rate above 973 K used to 2123 K, and nitriding commenced immediately for ~12 h, which resulted in 75% TD UN (FCM-UN05). One run at a final temperature of 2273 K ramped in Ar at 3 K/min and nitriding was commenced overnight (FCM-UN03); crucible-component melts and very poor quality UN kernels resulted, but selected best kernels exhibited 88% TD. As noted above, Mo-N and W-N liquids can occur at ~2200 K and nitriding was not performed subsequently above 2123 K. However, ~20 UN kernels from FCM-UN08 were held for 2 h at ~2275 K in Ar in the W crucible with no crucible damage, but TD increased by only 2.6%. Similarly, kernels made from the original C/U = 2.65

16
air-dried microspheres at 2023 K with ~83% TD (UCN-L21) were heated at ~2273 K in N2-4%H2 for 4 h to give a slight increase to ~86% TD. Finally, 850-1000-µm-dia., air-dried microspheres with an initial C/U=2.65 were converted under optimum conditions to produce 420-µm-dia. kernels with ~78% TD and N/(N+C)=0.76 which suggests that the conversion and sintering results are not a function of final kernel diameter.
3.5 HCN STRIPPING OF [UC] TO INCREASE [UN] CONTENT
Here the thermodynamic calculations are extended to explore the efficacy of HCN in removing carbon in order to increase the value of x. The authors [8, 26] published thermodynamic arguments demonstrating that HCN was the dominant hydrocarbon present during carbothermic conversion of UO2-C mixtures in N2-H2 gases to produce UC1-xNx. Values of pHCN at given x values are shown in Fig. 12 and show the rapid drop in pHCN as x increases to pure UN. As noted earlier, [UC] and [UN] represent these components in the ideal solid solution of UC1-xNx, with activities of 1-x and x, respectively. The relevant equilibrium for increasing the [UN] content by flowing N2-H2 mixtures past the microspheres to remove carbon in [UC] via HCN gas is
[UC] + N2 + 0.5 H2 = [UN] + HCN Reaction (2)
for which the equilibrium constant is, with standard thermodynamic data [20, 27, 28] in the 1700-2300 K range,
Keq = pHCN x/({1-x} pN2 √pH2) = exp(7833/T-6.93) (3) and thus
pHCN (0.1 MPa) = ({1-x}/x) pN2 √pH2 exp(7833/T-6.93). (4)

17
Fig. 12. Plot of log(pHCN [0.1 MPa]) for the UC-UN-carbon system at 0.1 MPa of N2-4%H2.
(A) 2 C + N2 + H2 → 2 HCN. (B) [UC] + N2 + 0.5 H2 → [UN] + HCN at given x.
The maximum removal of HCN occurs when the flowing N2-H2 gas is saturated with HCN. This minimum required mols HCN per mol U at a given x is the inverse of Eq. (4). For N2-4%H2 the reciprocal pressure term is 5.2 and the above equation simplifies to 5.2 x/(1-x) exp(-7833/T+6.93). To obtain the total mols N2-4%H2 per mol U between any two values of x, integration of the term x/(1-x) gives 1-x-ln(1-x) and its combination with the thermodynamic terms gives
mols N2-4%H2 /mol U = 5.2 (1-x-ln[1-x]) exp(-7833/T+6.93) (5).
Integration from x = 0.01 to 0.999 at 2023 K and unit conversion to liters per gram of U leads to Fig. 13 and Table 2.
-6
-5
-4
-3
-2
-1
0
4.0 4.5 5.0 5.5 6.0 6.5
log(
p HC
N [0
.1 M
Pa])
10,000/T (K)
2000 1800 1600 1400 T (oC)
A
x in UC1-xNx
0.3 0.5
0.8 0.9
0.99
B
at pN2 =0.96, pH2=0.04 (0.1MPa)
18
Fig. 13. Log (Liters of N2-4%H2 per g U) needed at 2023 K to convert pure UC (x = 0) to UC1-xNx over the range 0.8 ≤ x ≤0.999 via HCN stripping. The amount of gas needed is the difference between the amounts at higher and lower x values.
Values at 1773 K are about half those shown since pHCN is higher, see Fig. 12. It can be seen that the approach to higher and higher purity requires considerably increased N2-4%H2 amounts. The liters of N2-4%H2 per g U needed to purify, for exmple, from x = 0.9 to x = 0.99 is the difference between the respective y-axis values (37.7 and 14.6 in this case) and if 10 hours were required to convert UC0.1N0.9 to UC0.01N0.99 in N2-4%H2 while simultaneously removing residual [UC], the minimum N2-4%H2 flow would be 39 ml/min/g U.
0.8
0.9
1
1.1
1.2
1.3
1.4
1.5
1.6
1.7
1.8
0.8 0.85 0.9 0.95 1
log (liters N
2-‐4%
H 2/g U)
x = N/(C+N)

19
Table 2 Amounts of N2-4%H2 per mole U at 2023 K vs x in UC1-xNx.
x mole N2-4%H2 per mol U liters per g of U 0.01 0.006 0.001 0.10 0.594 0.056 0.20 2.567 0.242 0.30 6.285 0.592 0.40 12.3 1.2 0.50 21.4 2.0 0.60 35.1 3.3 0.65 44.3 4.2 0.70 55.9 5.3 0.75 70.6 6.6 0.80 89.8 8.4 0.85 116.1 10.9 0.90 155.5 14.6 0.95 226.9 21.4 0.97 281.3 26.5 0.99 400.9 37.7
0.999 655.3 61.7 It was demonstrated during the present calculations that given usual carbothermic conversion parameters pCO was always at least an order of magnitude higher than pHCN at all x values. Consequently, increasing the values of x by removing HCN from the processing bed is likely much less effective than removing the CO during conversion of the oxycarbide kernel to carbonitride. In the present experiments with 25 g of air-dried material (~18 g U) and, a N2-4%H2 flow of 80 ml/min/g for ~20 h, the 96 liters/g U for the run produced x = 0.98. From the above table, this was sufficient gas to increase the typical initial x value of ~0.85 to 0.98. In experiments with 25 g of C/U = 2.65 near the end of this study (FCM-UN03) N2-4%H2 was used during overnight nitriding at 2273 K and resulted in the typically sharp XRD carbonitride pattern shown in Fig. 14.

20
Fig. 14. The full profile fit of the XRD pattern of UC0.09N0.91 (lattice parameter = 0.48979(1) nm). Red, green,
and pink patterns represent the experimental, fit, and the residue, respectively.
Another set of ORNL experiments at Los Alamos National Laboratory (LANL) led to similar conclusions. 2073 K conversion of ~200 mg of monolayers of microspheres with C/U of 2.675 was performed in open W trays in 10 h at 0.5 l/min of N2-7%H2 in a W furnace. Given the initial C/U values, without HCN effects these should have been converted to give x values of approximately 0.8, but all ended with x = ~0.99. If HCN were removing carbon to give x = 0.99, a minimum of ~(0.2g)(37.7 l/g) or ~8 liters of gas flowing past the specimens would be needed. Since 300 liters flowed through the furnace, it is plausible that HCN led to the high-purity UN. The present calculations were also used to analyze the results of Ledergerber et al [5], who converted 50 g of microspheres (~35 g U) at 0.5 l/min of N2-5%H2 for 3 to 11 h. The best [UN] content was x = 0.97 or less. It is estimated that a minimum of ~800 liters of N2-5%H2 would have to pass thru the kernels to get that x value, whereas only a total of 90 to 330 liters was used. Furthermore, in some of the other experiments x values were as low as 0.85. It appears that high x values were obtained by control of initial C/U ratios in the sol-gel microspheres, not from HCN stripping of carbon content. The results of Mukerjee et al [6]were also consistent. After converting microspheres having C/U as high as 2.2, inferring an x value of 0.8, the x values of kernels were increased at 1673 K in 60 ml N2-8%H2/min/g UN for 3 h and resulted in x values of ~0.89 to 0.98. Mass balance calculations for 50 g of carbonitride show that increasing the value of x from 0.9 to 0.98 would require removing ~0.016 mols of HCN and Table 2 shows the needed flow at 2023 K is ~(30 – 15) or 15 l N2-4%H2/g U for a total of 750 l. As noted above, at 1673 K this would be at least halved, and with 8% H2, the pHCN is increased by √2 and the needed flow is thus reduced by another factor of 0.7 to give about 260 l needed, while ~540 l was used. Thus, HCN stripping of the excess [UC] content seems plausible. The CH4 suggested in ref. [6] for

21
increasing x has a partial pressure about an order of magnitude less than does HCN at a given x and 1673 K and is thus likely to be less effective.
3.6 ROUTINE KERNEL PRODUCTION AND CHARACTERIZATION
The process recommended from the present work was used routinely for UN kernels of ~83 to 86% TD and is as follows:
• Calcine in flowing Ar flowing at ~2 ml/g U from ambient at 3 K/min to 973 K • Ramp at 5 K/min from 973 to 1673 K in above Ar flow • Ramp at 1 K/min from 1673 to 2023-2123 K in Ar flowing at 10-15 ml/min/g U. For
ramp rates up to 5 K/min, increase Ar flow proportionally. Hold at final temperature for one hour.
• Alternatively, after calcining, ramp at 3 K/min in vacuum to 2023-2123 K • At 2023-2123 K, substitute N2 flowing at 5-10 ml/min/g U and nitride 10 h. To increase
N/(N+C) to ~0.98, use N2-H2 mixtures at flow rates and total times given in Section 3.5. • At 2023-2123 K, substitute Ar flowing at 5 ml/min/g U for 30 min. • Cool to ambient temperature in above Ar flow at maximum furnace ramp rate.
Use of the above process in the resulted in uniform kernels typified by Figs. 15 and 16.
Fig. 15. Typical 810-µm-dia. UC0.15N0.85 kernels using the process parameters developed in this study. (FCM-
UN10, Bin 6, 87% TD, nitriding in N2 at ~2175 K)

22
Fig. 16. Typical 840-µm-dia. UC0.04N0.96 kernels using the process parameters developed in this study. (UCN-
L13, Bin 7, 86% TD, nitriding in N2-4%H2 at 2023 K)
Having developed a standard method of kernel fabrication, several runs were made and characterized to provide ~350 g of nitride kernels for later coating studies. In a given run, the crucible was completely filled with 110 to 130 g of air-dried microspheres with C/U = 2.65 to produce ~75 g of kernels. The density characteristics of each run were determined and the run-to-run reproducibility is shown in Fig. 17.
23
Fig. 17. Average density (orange dot) and density range vs run number that each produced ~75 g of kernels. The nitriding temperature for run 9 was 2023 K and the % TD of ~83% was typical of that temperature. The remaining runs were at 2223 K and the % TD typically averaged ~3% higher. The last 5 runs shown above were processed to provide 350 g of kernels for subsequent coating studies; only ~5% of the kernels were rejected. These were then riffled into 4 equal portions for coating. The percentage of kernels having a given average diameter, ±10 µm, is shown in Fig. 18.
78
79
80
81
82
83
84
85
86
87
88
8 9 10 11 12 13 14 15 16 17
UN Kerne
l Den
sity (%
)
FCM-‐UNxx Run Number

24
Fig. 18. Distribution of kernel diameters in 350 g of material combined from the last five runs shown in Fig. 17.
4. GENERAL DISCUSSION
Several observations concerning calcining result from the present work. A ramp rate of 3 K/min continues to be recommended. When using Ar, all evidence indicates 0.5 mols CO2/mol U result in the O/U reduction from 3 to 2; the resulting minimum C/UO2 ratio needs to be 2 to permit later UN synthesis. With initial C/U = 2.15 and 2.3 material, calcining in Ar-4%H2 as well as Ar generally led to UO2 in the final nitride kernel even though the hydrogen also reduced the O/U, and the proportion of H2 reduction relative to that for carbon was not reproducible. Using up to twice the minimum recommended Ar-4%H2 flow of 35 ml Ar-4%H2/min/g U still led to UO2 content. Consequently, it appears an initial C/U>2.5 is to be recommended and 2.65 was used here. When C/U = 2.65 microspheres were calcined and stored to be used later in smaller batches, subsequent room-temperature re-oxidation above O/U = 2 occurred and led to insufficient C/U for conversion to nitride; this approach was abandoned. Subsequent conversion of the calcined kernels to UO2:2UC was accomplished in either Ar or Ar-4%H2 while ramping the temperature at either 1, 3, or 5 K/min in the 1673-2023 K range. The resulting 89-97% TD values are shown in Fig. 7 and were obtained at a normalized flow rate of ~15 to 19 ml/min/g U. There was no apparent dependence on the temperature ramp rate or the presence of 4% hydrogen, but the highest density was obtained in pure Ar alone. Lines A and B in Fig. 7 and indicate ~80% conversion to UO2:2UC by 1948 K and complete conversion at 2023 K. The UC2 phase, with a molar volume of 23.2 ml/mol U, should be eliminated by complete conversion to UO2 and UC (24.64 ml/mol and 18.34 ml/mol respectively) so that UN kernel (17.60 ml/mol) density is maximized. The results of the present conversion of the calcined kernels to UO2:2UC were compared to those for preparing oxycarbide kernels of ~375 µm diameter for the Advanced Gas Reactor irradiations. The fuel had the approximate composition O/U=1.52, C/U=0.36, equivalent to 3UO2:UC if the carbide phase were all UC and 4UO2:UC1.9 if the carbide phase were all dicarbide [17, 18, 24]. Ramping at 40 K/min to the
0
5
10
15
20
25
30
35
800 820 840 860 880
Percen
tage of U
N Kerne
ls in Size
Range
Average UN Kernel Diameter (±10 µm)

25
final conversion temperature was much greater than the 1 to 5 K/min used here and the final density of 11 g/ml or ~97% TD was not attained until ~2165 K, while that % TD was attained by 1823 K by Stinton et al [16], and here by ~2025 K with a kernel volume 10 times larger and a 66% carbide content. Generally, the present work suggests that slower ramp rates result in better densities, even during ramping of calcined UO2:2.15C from 873 to 1673 K. The origin of the 30- to 40-µm-thick oxide layer observed in UC-L01, 03, 04, and 05, Table 1, was considered. This layer on a 828-µm-dia. kernel represents about 20 to 25% of the volume of the kernel. If this volume were to result from carbon oxidation or hydrocarbon stripping of the surface layer during conversion of the C/U = 2.65 kernel, the resulting kernel C/U would be 1.61 to 1.72 (2.65 minus 0.5 for calcining, times 0.75 to 0.8). Subsequent conversion to UN would give ~20% UO2 amounts easily detectable by XRD and the carbon balance of the overall process would be poor. Neither is the case, with carbon balance when making UN being excellent. Therefore, the oxide layer is suggested to result from the gel-forming process, where most of the carbon content of the layer is apparently rejected from the surface to the interior of the kernel. Note that calcining would result in a carbon-free oxide surface layer even if the C/U value was as high as 0.5 initially. The carbide phase in the UO2:2UC precursor may substitute solid-solution oxygen directly to give UC1-yOy [29] and the effects and utility of increasing y were considered. Increasing the y value lowers the amount of UO2 with its higher molar volume in favor of the oxycarbide with its lower molar volume and may have the effect of increasing the resulting UN by a few percent. To this end, the practicality of increasing y during processing was considered. Thermodynamic calculations using the latest methodology [30] and U-Pu-C-O data base [31] provided the pCO -y-T behavior at 1800, 2000, and 2200 K. Least-squares methods fitted the 39 (pCO, y , T) values to give the numerical values in Eq. (6),
log(pCO [0.1 MPa]) = 19.157 - 33468/T(K) - 24.62*y (6) and this equation was used to plot Fig. 19. (Figure 19 also plots calculated pCO values from Stoops and Hamme [29] from their equation
log10(pCO [0.1 MPa]) = 13.63 -36690/T(K) (7) at y=0.25, which they reported was the boundary of the three-phase U + UO2 + UC0.75O0.25 region. They also reported that the lattice parameter decreased linearly from that for UC by only 0.0008 nm at the maximum oxygen content.) Since free carbon is completely consumed in making the oxycarbide precursor, it would appear from Fig. 19 that y in the present process is at least ~0.15 and the precursor that was considered to be UO2:2.15C may have been UO2:4.08UC0.85O0.15. Whether the value of y could be increased further by removing CO in flowing Ar via the reaction
2 UO2 + [UC] = 3 [UO] + CO, Reaction (3) in which [UC] and [UO] represent the solid-solution components of the oxycarbide, was considered using the methodology of Section 3.5. Generally, the mols of Ar needed to remove one mol of CO is the reciprocal of pCO, and is multiplied by 22.4/238 or 0.103 to obtain the total amount of Ar in liters per gram of U. Integration of the reciprocal between two y values to obtain the amount is
Liters Ar/g U = (0.103/56.67) exp(-44.1 + 77043/T(K) + 56.67y) (8) in which the numerical values are those in Eq. (6) times ln(10). These calculations led to the conclusion that increasing the value of y from 0.15 to 0.20 in a full crucible to produce ~85 g of precursor at a usual Ar flow of 16 ml/min/g U would take about 2 h at ~2200 K, and each increase of

26
0.01 in y would take 70% longer (or require 70% larger flow) than the previous increase, all of which is impractical. Even in the unlikely event that the pCO values were ten times higher than calculated, the initial y value would be about 0.2, and increasing it beyond 0.24 would also be impractical. Therefore, future experiments to increase y are proposed to be performed in vacuum at temperature after the precursor was formed.
Fig. 19. The calculated behavior of pCO vs temperature and oxygen content in the two-phase region UO2 and UC1-yOy. The lower composition boundary occurs where the three-phase region that includes C appears, and the upper boundary where U appears, as illustrated on the figure. The Stoops and Hamme [29] pCO values at three temperatures are calculated from Eq 7, see text. Nitriding the UO2:2UC intermediate at 2023 K in the ~0.3 cm-high bed is summarized next. A narrow range of UN kernel density was accomplished only when all of the calcined UO2:2C was converted to the UO2:2UC precursor, which occurred above the normalized flow rate of ~8 ml/min/g U at a ramp rate of 1 K/min, as shown in Fig. 7. At 2023 K nitriding was accomplished in ~20 h, i.e., overnight for convenience, and gave about 83% TD kernels for many different experimental conditions. The usual flow rate for N2-containing gas was ~25 ml/min/g U, which is twice that needed [5] for 100% conversion of oxycarbide to UN in 120 minutes at 2023 K at pCO(0.1 MPa) of 0.1. Carbon balance was excellent when using Ar and Ar-4%H2 from the initial C/U = 2.65 of the air-dried microspheres to the final C/(C+N) = 0.15 of the carbonitride. Additionally, if N2-4%H2 mixtures were used to attain x = ~0.99 via using HCN to remove the excess carbide component, then Fig. 13 illustrates the higher total flow needed, and also illustrates the extreme flows needed if x = 0.999 were desired. This minimum recommended flow rate and other factors were compared to those used by Ledergerber et al [5]. They obtained ~96% TD UC0.15N0.85 containing 2.7% UO2 with a 30-60 g sample when using 1000 ml Ar-7%H2/hr/g U and a ramp rate of 5 K/min. These conditions are equivalent to 3.3 ml/min/g U
27
when normalized to 1 K/min ramp rate and are well below the 8 needed here. Line A of Fig. 7 also indicates that <50% conversion to UO2:2UC was attained when the experiment attained 2023 K., while our [8] integration of the CO(%)-vs-time data of ref. [5] gave ~66% overall conversion to UN by 2023 K, which is equivalent to 100% conversion to UO2:2UC. Also, the maximum pCO(0.1 MPa) of 0.11 obtained in ref. [5] compares to 0.19 predicted from Eq. 1, which suggests that the effluent gas was not saturated to the thermodynamic maximum and the conversion could proceed. The discrepancy between the present flow rate requirement and that used in ref. [5] is unresolved. In general, use of hydrogen appears to have limited application. There seemed to be no useful or controllable effect while calcining and use of 100% H2 in the Netzsch STA resulted in an additional C/U loss of ~0.7 beyond that needed for O/U reduction. No effect of H2 was noted for conversion to UO2:2UC. As noted above, during nitriding in N2-4%H2 gases, the N/(C+N) ratio can be increased to 0.98-0.99 via removal of HCN at rates that agree with those predicted thermodynamically. The approximate height of the reacting bed during different stages of the process gives some insight to the conditions for gas-solid interactions. An initial charge of ~75 g of air-dried microspheres was ~8 cm high, and after calcining and ramping to 1673 K the height was ~1.4 cm. After conversion to ~96% TD UO2:2UC the bed height would be ~0.8 cm, and remain at this depth during conversion to ~84 % TD UN. A typical view inside the tungsten crucible after a run to ~2225 K with a charge of 110 g of air-dried microspheres is shown in Fig. 20 in which the UN kernel height is ~1.25 cm and radial shrinkage of the bed is also obvious (Run FCM-UN12). The kernels were slightly agglomerated and were easily separated without apparent damage.
Fig. 20. A ~75-g UN kernel bed of ~1.25 cm height is shown after a ~2225 K conversion of a ~8-cm-high bed containing 110 g of air-dried microspheres in a hollow W cylinder with a bottom W screen that permitted upflow of Ar and N2 through the bed. The ~30% radial shrinkage of the bed (50% volume shrinkage) via agglomeration of the kernels is commonly observed.
Both vacuum conversion of calcined material to UO2:2UC and conversion in flowing Ar appear to give equivalent densities when subsequently nitrided to the final UN kernel as long as ramp rates of 3 K/min

28
or less are used to the final temperature. Vacuum conversion could be used to prepare large quantities of UO2:2UC for subsequent conversion to UN in the upflow crucible. Crucible bed density would be ~12 g U/ml, including 50% sphere packing fraction, vs ~0.6 g U/ml when starting with air-dried microspheres. Conversely, conversion in Ar requires flows that are directly proportional to both U content and temperature ramp rate. Even if UO2:2UC were prepared in flowing Ar, subsequent treatment in vacuum may decrease the UO2 content and increase the [O] content of the oxycarbide, as noted above, which has the potential of ~92% TD UN even without nitride sintering. The UN kernel density obtained here, ~83% TD for a ~820-µm-dia. kernel, is compared with those from previous studies. Figure 21 compares the present results with those from the literature in which an extensive range of high temperatures was used. The present results are shown as line A. Ledergerber et al [5]line D, obtained 97% TD at 2023 K for a 770-µm-dia. kernel and ~45% TD at 1823 K. Odeychuk [12], curve E, converted 600-650-µm-dia. UO2 kernels to 536-580-µm-dia. carbonitride kernels in a bed of carbon and a N2-H2 atmosphere, and followed that with exposure to 75%H2-25%N2 in a carbon-free atmosphere to decrease the C/(C+N) to ~0.02 and to obtain the densities shown in Fig. 16. Shoup [4] obtained 87% TD at 1773 K with a kernel diameter of 150 µm. Mukerjee [6] started with a 2200-µm-dia. gel that was washed and dried and obtained 97% TD at 1973 K and 2 kPa N2, but the final diameter was not given. Tennery et al [14]sintered UN pellets, which were made from powder made by the hydride-nitride process, at N2 pressures near the U(l)-UN boundary to obtain the densities shown as line G1, while sintering at 0.15 MPa N2 gave densities shown as line G2. Arai et al [15], line E, made (U,Pu)N pellets from powders derived by a carbothermic process and studied the processing parameters that resulted in the densities shown. Metroka [31] made pellets from UN powder supplied by Tennery [14]and sintered in 33% Ar, 67% N2 above 1773 K at 0.1 MPa to give the results shown as line H1. He also used hot isostatic pressing of encapsulated UN at 104 MPa, lower line H2, and 207 MPa, upper line H2. All these studies illustrate that there are several processing factors that affect final density.

29
Fig. 21. Percent theoretical density of nitride kernels and pellets vs final processing temperature. For UN
microspheres: (A) present study; (B) Shoup [4]; (C) Mukerjee et al [6]; (D) Ledergerber et al [5]; (E) Odeychuk [12], For pellets: (F) Arai et al, U0.8 Pu0.2N [15]; (G1 and G2) Tennery et al, UN [14]; (H1 and H2), Metroka, UN [32] .
Liquid-assisted sintering of UN kernels may be recommended for future study. The experimentally observed melting temperature of UN (K) is represented by 3035(pN2 [0.1 MPa])0.0283 from 10-13 to 7.5 0.1 MPa values [13] and may give some basis for liquid-assisted sintering at practical T and pN2 values. As illustrated above, Tennery [14] used N2 pressures for which the above relationship suggests liquid existence in the 1940 to 2500 K range for sintering UN pellets up to 2373 K and was able to increase density by ~5% more than when sintering at atmospheric pressure.
5. CONCLUSIONS
The results of this investigation can be summarized as follows: Calcining of ~100 mg of air-dried microspheres in the Netzsch STA thermal analyzer coupled with a mass spectrometer revealed that C along with Ar-4%H2 simultaneously reduce the O/U from 3 to 2 by 873 K. However, the proportion of each during calcining was not controllable with the 25 to 100 g samples used to make UN kernels. Thus, a C/U molar ratio slightly above 2.5 is recommended, of which 0.5 C/U is used for O/U reduction and 2 C/U for carbothermic conversion to UN. Calcining in 100% H2 in the Netzsch STA resulted in an additional C/U loss of 0.7, possibly caused by CH4 loss and a much higher CO/CO2 ratio, and although this effect may also apply to kernel production, it was apparently not
74
76
78
80
82
84
86
88
90
92
94
96
98
100
1600 1800 2000 2200 2400 2600 2800
Theo
reRcal Den
sity (TD, %) o
f Nitride
Final Temperature (K)
A B
C
D
E
F
G1
G2
H1
H2

30
observed in production of AGR kernels [17, 18]. It was also noted that calcining with a temperature ramp rate above ~3 K/min resulted in UN kernel defects. Formation of the intermediate UO2:2UC of near-theoretical density in either flowing argon or in vacuum was required before N2 was introduced for conversion to UN. Extensive thermodynamic calculations guided, and were consistent with, subsequent experiments at different Ar flow rates and temperature ramp rates. Conversion of calcined material to UO2:2UC in vacuum gave results comparable with those in flowing Ar at ramp rates of 3 K/min or less and would appear to be more easily scalable to large-scale production, and possibly a decrease in the UO2/oxycarbide ratio and might result in higher UN kernel density. It was deduced that the outer oxide layer commonly observed possibly has its origin in the 1.5 M NH4OH washing process used to remove the HMTA, urea, and NH4NO3 from the gel spheres after they are formed, aged, and washed with trichloroethylene to remove the silicone oil. In future preparation, four washes will be used rather than six. Subsequent conversion of UO2:2UC in N2 to UC1-xNx of ~820 µm diameter was not accompanied by sintering up to 2123 K. The resulting density was consistent with that expected from the difference in molar volumes, with no change in diameter before and after conversion. Heating the kernel to ~2325 K in Ar for 0.5 h may have increased the density by a few percent. In general, production of UN kernels requires long times. Calcining to UO2:2C requires ~3.5 h, ramping to 1673 K requires ~2.5 h, conversion of UO2:2C to UO2:2UC at 1 K/min and coincident sintering to ~96% TD another ~10 h, conversion of UO2:2UC to ~86% TD carbonitride ~10 h, and cooling to room temperature ~2 h, for a total of ~28 h. Present attempts to speed up the process generally resulted in lower carbonitride density. The present experiments with initial C/U = 2.65 had ~0.15 C/U in excess of that needed for the conversion process and this excess resulted in a final N/(C+N) of ~0.85. This ratio was increased to at least ~0.98 by subsequent treatment in N2-4%H2, which removed the excess carbon content via HCN formation. However, higher purity UN would likely require impractical times and gas flows as shown in Fig. 13. Thermodynamic calculations provided the flow and temperature parameters for the process.

31
6. ACKNOWLEDGMENTS
The aid and technical insight of K. Terrani, L. Snead, and T. Besmann at ORNL is gratefully acknowledged. J. L. Collins and G. Helmreich provided useful feedback on the manuscript. The work presented in this paper was supported by the Advanced Fuels Campaign of the Fuel Cycle R&D program in the Office of Nuclear Energy, US Department of Energy.

32
REFERENCES
[1] K. A. Terrani, J. Kiggans, Y. Katoh, K. Shimoda, F. C. Montgomery, B. L. Armstrong, C. M. Parish, T. Hinoki, J. D. Hunn, L. L. Snead, J. Nucl. Mater., 426 (1) (2012) 268-76. [2] K. A. Terrani, L. L. Snead, J. C. Gehin, J. Nucl. Mater., 427 (1) (2012) 209-24. [3] L. V. Triggiani, Preparing microspheres of actinide nitrides from carbon containing oxide sols: Google Patents; 1975. [4] R. D. SHOUP, J. Am. Ceram. Soc., 60 (7-‐8) (1977) 332-5. [5] G. Ledergerber, Z. Kopajtic, F. Ingold, R. Stratton, J. Nucl. Mater., 188 (1992) 28-35. [6] S. Mukerjee, J. Dehadraya, V. Vaidya, D. Sood, J. Nucl. Mater., 185 (1) (1991) 39-49. [7] S. Mukerjee, J. Dehadraya, V. Vaidya, D. Sood, J. Nucl. Mater., 210 (1) (1994) 107-14. [8] T. Lindemer, S. L. Voit, C. M. Silva, T. M. Besmann, R. D. Hunt, J. Nucl. Mater., 448 (1) (2014) 404-11. [9] R. D. Hunt, T. B. Lindemer, M. Z. Hu, G. D. d. Cul, J. L. Collins, Radiochim. Acta, 95 (4) (2007) 225-32. [10] R. Hunt, C. Silva, T. Lindemer, J. Johnson, J. Collins, J. Nucl. Mater., 448 (1) (2014) 399-403. [11] C. M. Silva, T. B. Lindemer, S. R. Voit, R. D. Hunt, T. M. Besmann, K. A. Terrani, L. L. Snead, J. Nucl. Mater., 454 (1) (2014) 405-12. [12] M. Odeychuk, The advanced nitride fuel for fast reactors, IAEA Technical Meeting, Obninsk, Russia; 2011. [13] S. Hayes, J. Thomas, K. Peddicord, J. Nucl. Mater., 171 (2) (1990) 300-18. [14] V. Tennery, T. Godfrey, R. Potter, J. Am. Ceram. Soc., 54 (7) (1971) 327-31. [15] Y. Arai, S. Fukushima, K. Shiozawa, M. Handa, J. Nucl. Mater., 168 (3) (1989) 280-9. [16] D. P. Stinton, W. J. Lackey, R. Spence, J. Am. Ceram. Soc., 65 (7) (1982) 321-4. [17] M. A. Ebner, C. M. Barns, UCO Kernel Fabrication Development for the Advanced Gas Reactor Program, Idaho: Idaho National Laboratory 2007. [18] M. A. Ebner, Chemistry Improvement for the Production of LEU UCO Fuel Using Manufacturing Scale Equipment – FY2004 Final Report, Idaho: Idaho National Laboratory; 2004. [19] M. H. Lloyd, K. Bischoff, K. Peng, H.-U. Nissen, R. Wessicken, Journal of Inorganic and Nuclear Chemistry, 38 (6) (1976) 1141-7. [20] C. W. Bale, E. Bélisle, Fact-Web suite of interactive programs, www.factsage.com. [21] M. B. Sears, Journal of Inorganic and Nuclear Chemistry, 32 (9) (1970) 2971-84. [22] E. Cordfunke, J. Nucl. Mater., 56 (3) (1975) 319-26. [23] A. K. Kercher, J. D. Hunn, Results from ORNL Characterization of Nominal 350 µm LEUCO Kernels from the BWXT G73D-20-69302 Composite: Oak Ridge National Laboratory (ORNL); 2005. [24] J. D. Hunn, A. K. Kercher, P. A. Menchhofer, J. R. Price, Results from ORNL Characterization of Nominal 350µm NUCO Kernels from the BWXT 59344 batch: Oak Ridge National Laboratory (ORNL); 2005. [25] J. D. Hunn, Results from ORNL Characterization of Nominal 350µm NUCO Kernels from the BWXT 69300 Composite: Oak Ridge National Laboratory (ORNL); 2004. [26] T. Lindemer, J. Am. Ceram. Soc., 55 (12) (1972) 601-5. [27] D. R. Stull, H. Prophet, JANAF thermochemical tables: DTIC Document; 1971. [28] T. M. Besmann, D. Shin, T. B. Lindemer, J. Nucl. Mater., 427 (1) (2012) 162-8. [29] R. F. Stoops, J. V. Hamme, J. Am. Ceram. Soc., 47 (2) (1964) 59-62. [30] M. Hillert, J. Alloys Compd., 320 (2) (2001) 161-76. [31] C. Guéneau, N. Dupin, B. Sundman, C. Martial, J.-C. Dumas, S. Gossé, S. Chatain, F. De Bruycker, D. Manara, R. J. Konings, J. Nucl. Mater., 419 (1) (2011) 145-67. [32] R. R. Metroka, Fabrication of Uranium Mononitride Compacts, National Aeronautics and Space Administration Report; 1970.

33
Appendix. Original Netzsch STA and Mass Spectrometer Data
Mass Number Key Probable Additional Mass
(m/e) fragments Parent Molecule(s) Number (m/e) 6 C++ CO 12 28 29
C++ CO2 12 28 44 12 C+ CO 28 29 C+ CO2 28 29 44
16 O+ O2 32 34 O+ H2O 17 18 CH4+ CH4 12 13 14 15 NH2+ NH3 14 15 17
17 OH+ H2O 16 18 NH3+ NH3 14 15 16
18 H2O+ H2O 16 17 28 N2+ N2 7 14 29 C2H4+ CxHy 12 13 14 24 CO+ CO 6 12 29 CO+ CO2 6 12 29 44
44 CO2+ CO2 6 12 28 29

34
115.7 mg air-dried C/U=2.65 in 10 ml Ar per min ramped at 3.3 K/min
Mass Spectrometer Signal (times 1011) for mass to charge ratio
T (K) 16 17 18 6 12 28 29 44 Weight loss (mg) 309 0.17 0.77 2.88 0.22 0.05 2.02 0.05 0.13 -0.10 314 0.17 0.79 2.97 0.22 0.05 1.99 0.05 0.13 -0.06 331 0.19 1.04 3.69 0.25 0.05 1.95 0.05 0.13 -0.06 352 0.25 1.86 6.36 0.33 0.06 1.92 0.05 0.14 -0.26 372 0.37 3.26 10.71 0.47 0.06 1.87 0.07 0.15 -0.78 390 0.49 4.68 15.22 0.62 0.07 1.84 0.12 0.16 -1.62 407 0.56 5.69 18.33 0.76 0.07 1.84 0.22 0.19 -2.75 424 0.59 4.59 14.23 0.81 0.09 1.85 0.23 0.22 -3.74 441 0.86 3.58 9.52 1.22 0.12 1.91 0.19 0.31 -4.41 457 1.81 3.69 7.06 2.13 0.18 2.04 0.18 0.52 -5.03 474 3.51 4.31 5.89 3.24 0.27 2.28 0.18 0.91 -5.75 491 5.03 5.09 5.35 4.43 0.41 2.70 0.17 1.56 -6.69 507 5.14 5.89 5.09 5.54 0.52 2.87 0.13 2.15 -7.86 524 5.88 7.29 5.49 6.85 0.55 2.73 0.11 2.22 -9.09 541 6.24 8.66 6.74 7.82 0.52 2.58 0.10 1.96 -10.45 558 5.08 8.19 7.77 6.96 0.49 2.52 0.09 1.73 -11.80 574 3.10 5.61 7.34 4.28 0.37 2.27 0.08 1.28 -12.85 591 1.77 3.29 6.08 2.11 0.24 2.00 0.06 0.87 -13.48 608 1.35 2.16 4.87 1.26 0.21 1.88 0.06 0.78 -13.88 624 1.32 1.70 4.18 1.02 0.22 1.88 0.05 0.85 -14.21 641 1.11 1.39 3.64 0.81 0.19 1.87 0.05 0.77 -14.48 658 0.76 1.17 3.26 0.64 0.16 1.82 0.05 0.63 -14.68 674 0.55 1.04 3.04 0.56 0.15 1.79 0.05 0.59 -14.84 691 0.50 0.97 2.88 0.53 0.15 1.78 0.05 0.59 -14.99 708 0.52 0.91 2.73 0.54 0.16 1.78 0.05 0.63 -15.14 724 0.57 0.88 2.58 0.58 0.17 1.79 0.05 0.69 -15.30 741 0.68 0.86 2.46 0.62 0.18 1.84 0.05 0.76 -15.47 758 0.88 0.83 2.35 0.65 0.21 1.92 0.05 0.86 -15.65 774 1.08 0.80 2.32 0.70 0.25 2.19 0.05 1.09 -15.89 791 1.12 0.75 2.35 0.71 0.28 2.51 0.05 1.25 -16.19 808 0.98 0.69 2.39 0.65 0.29 2.51 0.05 1.31 -16.50 825 0.67 0.65 2.34 0.94 0.47 2.66 0.06 2.21 -16.92 841 0.28 0.65 2.38 1.58 0.85 3.23 0.06 4.03 -17.71 858 0.21 0.65 2.40 2.42 1.32 3.56 0.06 6.31 -18.97 875 0.20 0.61 2.29 1.18 0.63 2.26 0.05 2.85 -20.05 891 0.19 0.58 2.21 0.30 0.12 1.47 0.04 0.44 -20.18 908 0.19 0.57 2.19 0.25 0.09 1.40 0.04 0.29 -20.21 925 0.18 0.56 2.16 0.23 0.08 1.37 0.04 0.26 -20.24 941 0.18 0.56 2.15 0.23 0.08 1.37 0.04 0.25 -20.24 958 0.18 0.55 2.12 0.23 0.08 1.36 0.04 0.25 -20.24

35
167 mg air-dried C/U=2.65 in 10 ml Ar4%H2 per min ramped at 3.3 K/min
Mass Spectrometer Signal (times 1011) for mass to charge ratio
T (K) 16 17 18 6 12 28 29 44 Weight loss (mg) 318 0.17 0.21 0.88 0.02 0.03 4.76 0.06 0.03 -3.00 323 0.17 0.23 0.94 0.02 0.03 4.61 0.06 0.03 -2.96 341 0.19 0.36 1.35 0.02 0.03 4.64 0.06 0.03 -2.97 363 0.25 0.96 3.28 0.02 0.03 4.66 0.06 0.03 -3.22 382 0.37 2.12 6.89 0.02 0.03 4.59 0.07 0.04 -3.93 399 0.49 3.18 10.09 0.02 0.03 4.49 0.11 0.05 -5.08 416 0.56 3.68 11.58 0.02 0.04 4.48 0.16 0.06 -6.52 433 0.59 2.93 8.94 0.02 0.05 4.54 0.16 0.10 -7.72 450 0.86 2.41 6.41 0.02 0.08 4.67 0.15 0.20 -8.63 467 1.81 2.67 4.67 0.02 0.16 4.90 0.14 0.48 -9.55 483 3.51 3.83 3.81 0.02 0.31 5.39 0.15 1.04 -10.78 500 5.03 4.99 3.53 0.02 0.46 5.76 0.14 1.60 -12.46 516 5.14 5.02 3.28 0.02 0.46 5.64 0.11 1.64 -14.17 533 5.88 6.08 4.20 0.02 0.44 5.53 0.10 1.52 -15.85 550 6.24 6.79 5.46 0.02 0.43 5.54 0.09 1.43 -17.71 567 5.08 5.86 5.67 0.02 0.37 5.41 0.08 1.16 -19.46 584 3.10 3.86 4.74 0.02 0.25 5.20 0.07 0.76 -20.67 600 1.77 2.32 3.58 0.02 0.19 5.06 0.07 0.61 -21.40 617 1.35 1.70 2.83 0.02 0.19 5.05 0.07 0.65 -21.94 633 1.32 1.54 2.51 0.02 0.22 5.15 0.07 0.78 -22.46 650 1.11 1.37 2.50 0.02 0.21 5.29 0.07 0.72 -22.96 667 0.76 1.14 2.57 0.02 0.17 5.31 0.07 0.56 -23.37 683 0.55 1.06 2.69 0.02 0.11 5.03 0.06 0.35 -23.65 700 0.50 1.12 2.95 0.02 0.09 4.95 0.06 0.28 -23.88 717 0.52 1.26 3.37 0.02 0.09 4.92 0.07 0.28 -24.14 733 0.57 1.37 3.67 0.02 0.10 4.96 0.06 0.32 -24.45 750 0.68 1.53 4.05 0.02 0.14 4.99 0.07 0.47 -24.84 767 0.88 1.99 5.24 0.02 0.18 5.08 0.07 0.64 -25.44 783 1.08 2.58 6.88 0.02 0.21 5.19 0.07 0.77 -26.28 800 1.12 3.13 8.79 0.02 0.23 5.25 0.07 0.81 -27.36 817 0.98 3.61 10.64 0.02 0.20 5.18 0.07 0.70 -28.61 833 0.67 3.21 9.80 0.02 0.12 5.00 0.07 0.38 -29.78 850 0.28 1.20 3.71 0.02 0.05 4.98 0.07 0.06 -30.02 867 0.21 0.88 2.82 0.02 0.04 4.96 0.06 0.04 -30.07 884 0.20 0.83 2.70 0.02 0.04 4.97 0.06 0.04 -30.10 900 0.19 0.81 2.65 0.02 0.04 4.99 0.06 0.04 -30.14 917 0.19 0.80 2.64 0.02 0.03 4.96 0.06 0.04 -30.17 934 0.18 0.78 2.59 0.02 0.03 4.96 0.06 0.04 -30.19 950 0.18 0.77 2.58 0.02 0.03 4.99 0.06 0.04 -30.21 967 0.18 0.77 2.59 0.02 0.04 4.99 0.06 0.04 -30.23

36
190.5 mg air-dried C/U=2.65 in 10 ml H2 per min ramped at 3.3 K/min, final wt 155.6 mg
Mass Spectrometer Signal (times 1011) for mass to charge ratio
T (K) 16 17 18 6 12 28 29 44 Weight loss (mg) 297.11 0.52 0.27 0.69 0.00 0.02 17.17 0.57 0.06 0.04 305.15 0.52 0.30 0.76 0.00 0.02 17.05 0.55 0.06 0.04 323.17 0.52 0.45 1.23 0.00 0.02 16.67 0.54 0.06 -0.04 342.22 0.54 0.86 2.53 0.00 0.02 16.06 0.52 0.07 -0.35 360.20 0.59 1.51 4.66 0.00 0.03 15.30 0.50 0.07 -1.01 377.59 0.64 2.22 6.95 0.00 0.03 14.70 0.49 0.08 -2.01 394.46 0.69 3.03 9.50 0.00 0.03 14.01 0.47 0.09 -3.43 411.41 0.73 3.58 11.24 0.00 0.03 13.52 0.45 0.11 -5.34 428.47 0.86 3.83 11.74 0.00 0.04 13.44 0.46 0.14 -6.90 445.18 1.24 3.32 8.75 0.00 0.07 13.93 0.49 0.24 -8.00 461.85 2.11 3.58 6.81 0.00 0.14 14.62 0.56 0.50 -9.13 478.68 3.32 4.26 5.40 0.00 0.26 15.27 0.61 1.00 -10.47 495.48 4.61 5.16 4.62 0.00 0.41 15.74 0.61 1.75 -12.13 512.00 5.31 5.57 4.13 0.00 0.54 15.79 0.57 2.37 -13.97 528.60 5.54 5.74 3.94 0.00 0.60 15.56 0.54 2.60 -15.76 545.31 5.87 6.28 4.68 0.00 0.61 15.12 0.52 2.59 -17.63 562.10 6.05 6.76 5.71 0.00 0.62 14.78 0.48 2.59 -19.77 578.87 5.50 6.49 6.22 0.00 0.54 14.50 0.47 2.27 -21.69 595.55 4.02 5.10 5.85 0.00 0.38 14.39 0.47 1.63 -22.82 612.25 2.82 3.94 5.46 0.00 0.29 14.28 0.47 1.24 -23.49 628.93 2.33 3.47 5.46 0.00 0.27 14.16 0.46 1.20 -24.16 645.63 2.14 3.37 5.93 0.00 0.30 13.99 0.45 1.33 -25.01 662.30 1.86 3.28 6.70 0.00 0.32 14.12 0.45 1.45 -26.04 678.93 1.33 3.02 7.15 0.00 0.23 13.74 0.45 1.04 -26.86 695.60 1.10 3.05 7.69 0.00 0.16 13.34 0.44 0.73 -27.48 712.40 1.18 3.49 9.03 0.00 0.18 12.96 0.42 0.80 -28.37 729.18 1.57 4.60 11.96 0.00 0.25 12.47 0.40 1.12 -30.16 745.50 1.44 4.69 12.53 0.00 0.21 12.40 0.39 0.92 -36.65 762.22 0.87 4.35 12.66 0.00 0.10 12.45 0.38 0.28 -37.21 779.01 0.51 2.50 7.16 0.00 0.06 12.99 0.40 0.11 -37.36 795.74 0.40 2.06 5.90 0.00 0.04 12.92 0.40 0.06 -37.44 812.46 0.35 1.87 5.37 0.00 0.03 12.82 0.41 0.04 -37.50 829.14 0.32 1.77 5.12 0.00 0.03 12.71 0.41 0.03 -37.55 845.85 0.31 1.73 5.00 0.00 0.03 12.62 0.41 0.03 -37.60 862.57 0.30 1.69 4.90 0.00 0.03 12.45 0.40 0.03 -37.64 879.27 0.29 1.65 4.81 0.00 0.02 12.24 0.41 0.02 -37.69 895.95 0.28 1.63 4.74 0.00 0.02 12.16 0.40 0.02 -37.72 912.62 0.28 1.61 4.70 0.00 0.02 12.14 0.40 0.02 -37.76 929.29 0.28 1.59 4.63 0.00 0.02 12.04 0.40 0.02 -37.80 945.98 0.28 1.56 4.56 0.00 0.02 11.95 0.39 0.02 -37.84 962.67 0.28 1.54 4.49 0.00 0.02 11.79 0.39 0.02 -37.87