card fraud booklet 7 // 42 page: 8 // 42 card fraud card payments in south africa continue to be a...
TRANSCRIPT

PAGE: 1 // 42
www.sabric.co.za
2017
Protect your card and
information at all times
B O O K L E T
C A R DF R A U D
PAGE: 3 // 42 PAGE: 4 // 42
www.sabric.co.za CARD FRAUD
05
15
08
23
09 25
07
21 Executive Summary
Payments Association of South Africa (PASA)
ATMCrime
Qualification of Information
National Overview of Debit Card Fraud (2010-2017)
Card Fraud in the UK
National Overview of Credit Card Fraud (2010-2017)
Description of Fraud Types
Credit Card Fraud Distribution
Credit Card Gross Fraud Loss in South Africa
Geographical Distribution of Credit Card Fraud
Lost And/Or Stolen Card Fraud
Not Received Issued Card Fraud (NRI)
False Application Card Fraud
Counterfeit Card Fraud
Account Takeover Card Fraud
Card Not Present Card Fraud (CNP)
Debit Card Fraud Distribution
Debit Card Gross Fraud Loss In South Africa
Geographical Distribution of Debit Card Fraud
Overview of ATM Transactions (Cash Withdrawals) for Credit
Card Fraud (2017)
Overview of ATM Transactions (Cash Withdrawals) for Debit
Card Fraud (2017)
Table ofContents

PAGE: 5 // 42 PAGE: 6 // 42
www.sabric.co.za CARD FRAUD
Provinces mostly affected by card fraud (credit and debit cards) are
Executive Summary 46.6%
72.1%
GP
KZN
The banking industry’s grossfraud losses using South African(SA) issued credit cards increasedby 1.0%, from R434.0m in 2016 to R436.7m in 2017.
Gross fraud losses due to fraud perpetrated with SA-issued debit cards decreased by 8.5%, from R373.9m in 2016 to R342.2m in 2017.
of all credit card fraud losses occurred in South Africa.
of all debit card fraud losses occurred in South Africa.
+1.0% -8.5%
2016/2017 Credit Card Debit Card
Overall Gross Fraud Loss
Lost and/or stolen
Counterfeit
CNP (Card Not Present)
Gauteng
KwaZulu-Natal
WCWestern Cape
Trends per fraud type in respect of credit and debit card fraud are as follows:
Cards fraudulently obtained by criminals were used to
conduct cash withdrawals at ATMs. Almost half (49.1%)
of all fraudulent debit card transactions were related to
ATMs, while 4.6% of credit card transactions were attributed to
ATM withdrawals.

PAGE: 7 // 42 PAGE: 8 // 42
www.sabric.co.za CARD FRAUD
Card payments in South Africa continue to be a predominant part of the National Payments System in an evolving payments ecosystem. The drive to replace magstripe cards with more secure and improved EMV chip and PIN capable cards continues, with nearly all credit cards being issued with them, as well as the majority of debit cards in the domestic market.
The percentage of card-present transactions which are EMV compliant has increased from 90.19% to 90.89% in Africa and the Middle East. This is currently only bettered by certain European zones that continue to take the lead in card-present EMV transactions. The United States has made significant progress with the implementation of chip cards, boasting an increase from 18.61% to 41.21% card-present EMV transactions in 2017.
In the Africa and Middle East region, EMV chip card deployment and adoption rates have increased from 184 million cards in 2016 to 219 million cards in 2017. This equates to an adoption rate increase from 68.7% in 2016 to 74.8% in 2017. The adoption rates are still way ahead of the average worldwide EMV chip card adoption rate of 54.6%.
Even though the statistics are encouraging, card fraud remains a concern with periodic data breaches, especially in the card-not-present environment. The South African industry has however seen continued efforts to ensure the effectiveness and robustness of 3D Secure for e-commerce transactions. In addition, the market is considering the benefits that 3D Secure 2.0 would offer in securing transactions, as this
The credit and debit card fraud information utilised in this report was provided by African Bank, alBaraka Bank, Bank of Athens, Barclays Africa Group, Bidvest, Capitec Bank, First National Bank, Investec, Mercantile Bank, Nedbank, Postbank, ubank, Sasfin, Standard Bank of South Africa as well as Amex, Diners Club and Virgin.
The statistics used in the report cover the period from 01 January to 31 December 2017. For the comparative analysis, the above-mentioned period was compared to similar periods from 2010, with a specific focus on 2016 and 2017.
Qualificationof Information
PASAPayments Association of South Africa
The information set used was as follows: All credit and debit card gross fraud losses reported to SABRIC as at the 12th of March 2018. All calculations are based on the date that the fraudulent transaction occurred.
All fraud losses mentioned in this booklet refer to gross fraud losses and do not relate to the net losses suffered by the banking industry. Fraud loss figures are rounded to the nearest R1 million, unless otherwise stated and therefore, the sum of the separate losses (for example per loss category/fraud types/provinces) may differ from the rounded loss reflected.
provides significantly more transactional data richness for users.
As the world of payments continues to embrace digital platforms and channels, new security technologies will play a critical role in mitigating risk. An increasing number of players worldwide are adopting the practice of “tokenisation” where a “token” is issued to a user to process transactions rather than the actual card details. This not only augments e-commerce security and reduces fraud risk, but provides additional opportunities such as foundational innovation capabilities for digital payments.
Contactless payments have continued to grow in South Africa with several merchants deploying contactless acceptance devices, complimented by the issuance of an ever-increasing number of contactless enabled cards. This technology has further seen cross-pollination into tokenised contactless mobile payments with the increasing number of contactless enabled mobile devices.
With the drive to explore further payment opportunities to enable a frictionless customer experience and minimise cost for payment players alike, QR Code payments have continued to become a popular payment alternative. Standardised international specifications for QR Codes are being developed to enhance the security of these transactions.The South African payments industry will continue to pursue safe, secure and relevant payment systems in this ever-changing global marketplace by utilising joint initiatives an aligned to international best practices.

PAGE: 9 // 42 PAGE: 10 // 42
www.sabric.co.za CARD FRAUD
Gross fraud losses on SA-issued creditcards increased by 1.0%, from R434.0m in 2016 to R436.7m in 2017.
The graphs below represent the industry’s gross fraud losses on SA-issued credit cards, regardless of the physical location of the fraudulent transaction.
Increase of gross fraud losses due on
SA-Issued credit cards
+1.0%
Gross fraud loss on SA-issued credit cards (All countries 2010 to 2017)
Credit Card FraudOverview of Credit Card Fraud (2010 - 2017)
0 100 200 300 400 500
2017
2016
2015
2014
2013
2012
2011
2010 R209.0
R372.0
R329.9
R379.6
R463.4
R403.3
R434.0
R436.7
Percentage distribution per fraud type onSA-issued credit cards during 2017
Lost&StolenNRI FalseApp
5.9%0.2%1.3%
19.1%0.6%
72.9%
Counterfeit TakeOverCNP
All Figures in (R) Millions
Credit card gross fraud losses on SA-issued credit cards (2010 to 2017), divided between merchant locations inside and outside South Africa
Credit Card Fraud Distribution
SA-issued credit card gross fraud losses per fraud type, all countries
All Figures in (R) Millions
Transactions outside South Africa Transactions in South Africa
Fraud Type 2010 2011 2012 2013 2014 2015 2016 2017
Lost and/or Stolen R26.1m R15.9m R9.7m R8.5m R10.7m R12.8m R17.8m R25.7m
NRI (Not Received Issued) R1.7m R1.2m <R1.0m <R1.0m <R1.0m R1.0m R3.2m <R1.0m
False Application Fraud R2.4m R15.5m R19.4m R13.9m R93.5m R8.7m R4.4m R5.5m
Counterfeit R97.1m R158.2m R85.1m R116.2m R117.1m R129.2m R108.9m R83.6m
Account Takeover <R1.0m <R1.0m R1.5m R2.4m <R1.0m R1.8m R3.1m R2.5m
CNP (Card Not Present) R81.2m R179.7m R211.8m R238.0m R240.6m R249.6m R296.4m R318.4m
0
50
100
150
200
250
20172016201520142013201220112010
R125.7
R230.9
R161.3R168.6
R83.3
R146.3
R233.3R225.4
R238.0
R141.0
R176.8
R226.6R214.2
R219.8
R203.5
R233.2
All Figures in (R) Millions

PAGE: 11 // 42 PAGE: 12 // 42
www.sabric.co.za CARD FRAUD
United States
In 2016, 50.6% of all credit card gross fraud losses occurred at merchants outside the borders of South Africa. This percentage increased to 53.4% in 2017. The remaining 46.6% of transactions occurred at merchants in South Africa.
CNP fraud was the leading contributor to the gross fraud losses on SA-issued credit cards in 2017, with 72.9% of the overall credit card gross fraud loss (R436.7m) attributed to CNP fraud. CNP credit card gross fraud losses increased by 7.4% from R296.4m in
2016 to R318.4m in 2017. A total of R200.0m (85.8%) of the overall gross fraud losses (R233.2m) occurring outside South Africa can be attributed to CNP credit card fraud.
Counterfeit credit card fraud decreased by 23.2% when compared to 2016. The losses associated with counterfeit credit card fraud decreased from R108.9 in 2016 to R83.6m in 2017. Although the gross fraud losses decreased, 19.1% of the total gross fraud loss can still be attributed to counterfeit card fraud.
Fraudulent spend using lost and/or stolen credit cards increased by 44.5% during 2017 and amounted to R25.7m in total. Lost and/or stolen cards are mainly used in South Africa with only 23.9% of the losses related to transactions outside South Africa. SA-issued credit cards were used in other African countries in 2017 to the value of R11.8m. The top 10 African countries that were targeted are reflected to theright.
Gross credit card fraud losses that occurred at merchants outside the borders of SA in 2017.
Gross credit card fraud losses that occurred at merchants inside of SA in 2017.
53.4% 46.6%
Most fraudulent CNPtransactions are purchases
related to the travel industry.
Credit Card FraudOverview of Credit Card Fraud (2010 - 2017) Country Number of
transactionsGross fraud
lossLost and/or
Stolen Counterfeit CNP
KENYA 254 R 2 943 694 3 85 166
ETHIOPIA 232 R 2 075 865 14 - 218
ZIMBABWE 233 R 1 670 759 10 57 163
ZAMBIA 183 R 1 427 516 55 87 41
MOZAMBIQUE 219 R 972 674 5 145 69
MAURITIUS 193 R 927 719 10 5 178
NAMIBIA 101 R 375 258 28 2 71
MALAWI 56 R 327 379 9 1 46
BOTSWANA 78 R 221 365 26 4 48
CAMEROON 38 R 168 553 1 28 9
SA-issued credit card gross fraud losses per fraud type, top 10 African countries
Five cross border countries (excluding African countries) with the highest recorded financial losses due to CNP and Counterfeit fraud on SA-issued credit cards, during 2017 were:
CounterfeitCNP
Indonesia
United Kingdom
India
United Arab Emirates
Malta
Ireland
China

PAGE: 13 // 42 PAGE: 14 // 42
www.sabric.co.za CARD FRAUD
Geographical Distribution of credit card fraud
Provincial geographical distribution of credit card gross fraud losses
Provincial geographical distribution during 2017
Lost and/or stolen credit card gross fraud losses accounted for 9.6% of the total credit card gross fraud losses inside South Africa during 2017. The gross fraud losses associated with lost and/or stolen credit cards increased by 32.5% from R14.8m (2016) to R19.6m (2017). Criminals mostly steal, swop and set up card entrapment devices at ATMs and then shoulder surf the victim to obtain their PIN. The cards are then used to withdraw cash from an ATM. An increase has been seen where the ATM transaction is followed by a high value transaction at a merchant.
Decreases were observed for NRI (Not Received Issued) and account takeovers for 2017. Measures put in place during 2017 to mitigate this risk are yielding positive results. The gross fraud loss associated with counterfeit credit cards used inside SouthAfrica decreased by 26.2%, from R78.5min 2016 to R57.9m in 2017. Despite thedecrease, counterfeit card fraud remainsthe second biggest contributor (28.5%) tothe overall gross fraud loss on SA-issuedcredit cards used in South Africa. Themajority (69.2%) of fraudulent losses oncounterfeit cards still occur inside South Africa.
Gross fraud loss for CNP fraud increased by 6.7%, from R110.9m in 2016 to R118.3m in 2017. CNP comprises 58.2% of the total gross fraud loss (R203.5m) inside South Africa.
Credit Card Gross Fraud Loss in South Africa
SA-issued credit card gross fraud loss, inside SA by fraud type (2010 to 2017)
All Figures in (R) Millions
2010 2011 2012 2013 2014 2015 2016 2017
Eastern Cape R1.6m R2.0m R3.0m R2.5m R2.2m R3.8m R10.2m R9.0m
Free State R1.6m <R1.0m R1.3m <R1.0m <R1.0m <R1.0m R1.5m R1.7m
Gauteng R61.2 R99.3m R75.4m R65.3m R95.9m R91.6m R108.4m R99.0m
KwaZulu-Natal R7.9m R8.7m R7.9m R9.2m R12.1m R14.7m R23.0m R24.5m
Limpopo R2.2m R2.5m R2.1m R2.3m R3.8m R4.0m R4.3m R4.3m
Mpumalanga R2.1m R1.2m R1.7m R2.1m R2.6m R4.1m R6.4m R3.8m
Northern Cape <R1.0m <R1.0m <R1.0m <R1.0m <R1.0m <R1.0m <R1.0m <R1.0m
North West R1.6m R1.9m R1.5m R2.2m R2.0m R1.4m R3.3m R3.4m
Western Cape R15.4m R41.9m R39.6m R32.4m R39.7m R33.6m R31.5m R32.4m
All Figures in (R) Millions
Gauteng, Western Cape and KwaZulu-Natal
accounted for 86.3% of all credit card gross fraud
losses in South Africa. Credit card gross fraud losses in South Africa on SA-issued cardsused in South Africa, decreasedby 5.0% from R214.2m in 2016to *R203.5m in 2017.
86.3%Credit Card FraudOverview of Credit Card Fraud (2010 - 2017) Gauteng, Western Cape and KwaZulu-Natal accounted for
86.3% of all credit card gross fraud losses in South Africa, with the other 6 provinces accounting for the remaining 13.8%. The highest gross fraud loss was reported for Gauteng (55.6%) followed by the Western Cape (18.2%) and then KwaZulu-Natal with 13.7%.
Decreases occurred in the following provinces: • Eastern Cape (12.6% from R10.2m to R9.0m), • Gauteng (8.6% from R108.4m to R99.0m), • Mpumalanga (40.8% from R6.4m to R3.8m) and • Northern Cape (13.6% from R289 620 to R250 286).
The biggest increases were noted in the Free State (13.0%), followed by KwaZulu-Natal (6.2%) and North West (3.1%) when comparing 2016 and 2017.
Eastern CapeFree StateGautengKwaZulu-NatalLimpopo
5.0%1.0%
55.6%13.7%2.4%
2.1%0.1%1.9%
18.2%
MpumalangaNorthern CapeNorth WestWestern Cape
0
20
40
60
80
100
120
20172016201520142013201220112010
CNP
Account Takeover
Counterfeit
False Applications
NRI (Not Received Issued)
Lost / Stolen
*12% of the provincial distribution data could not be determined due the virtual nature of CNP which cannot be linked to a physical location in South Africa.

PAGE: 15 // 42 PAGE: 16 // 42
www.sabric.co.za CARD FRAUD
Gross fraud losses due to fraud perpetrated with SA-issued debit cards decreased by 8.5%, from R373.9m in 2016 to R342.2m in 2017.
The graph below depicts the industry’s total gross fraud losses on SA-issued debit cards, irrespective of the geographical location of the fraudulent transaction.
Decrease in gross fraud losses due to fraud
perpetrated with SA-issued debit cards.
-8.5%
Debit Card FraudOverview of Debit Card Fraud (2010 - 2017)
Gross fraud loss on SA-issued debit cards (All countries 2010 to 2017)
Percentage distribution per fraud type onSA-issued debit cards during 2017
0 100 200 300 400 500
2017
2016
2015
2014
2013
2012
2011
2010 R226.2
R422.1
R348.8
R320.5
R325.3
R 345.3
R373.9
R342.2
Lost&StolenNRI FalseApp
51.6%0.2%0.1%
19.1%0.3%
28.6%
Counterfeit TakeOverCNP
All Figures in (R) Millions
During 2017, 72.1% of debit card gross fraud losses occurred within South Africa compared to 78.6% in 2016. The remaining 27.9% of the losses which occurred outside South Africa showed an increase compared to the 21.4% reported in 2016.
SA-issued debit card gross fraud losses per fraud type, all countries
All Figures in (R) Millions
Fraud Type 2010 2011 2012 2013 2014 2015 2016 2017
Lost and/or Stolen R14.3m R17.9m R22.1m R57.1m R106.3m R134.3m R213.2m R176.6m
NRI (Not Received Issued) <R1.0m <R1.0m <R1.0m <R1.0m <R1.0m R1.6m <R1.0m <R1.0m
False Application Fraud <R1.0m <R1.0m <R1.0m <R1.0m <R1.0m <R1.0m <R1.0m <R1.0m
Counterfeit R202.5m R372.0m R292.3m R214.2m R155.9m R128.2m R96.3m R65.3m
Account Takeover <R1.0m <R1.0m <R1.0m <R1.0m <R1.0m R1.6m R2.6m <R1.0m
CNP (Card Not Present) R7.9m R28.9m R30.8m R47.9m R61.7m R78.9m R61.0m R98.0m
Debit card gross fraud losses on SA-issued debit cards (2010 to 2017) divided between merchant locations inside and outside South Africa
Debit Card Fraud Distribution
Debit card gross fraudlosses that occurred within
South Africa in 2017, compared to 78.6% in 2016..
72.1%
0
50
100
150
200
250
300
350
400
20172016201520142013201220112010
R191.0
R35.2
R364.9
R301.4
R230.0
R57.3 R47.4
R90.4
R228.7R244.2
R96.7 R101.0R80.1
R95.5
R293.8
R246.6
All Figures in (R) Millions
Transactions outside South Africa Transactions in South Africa

PAGE: 17 // 42 PAGE: 18 // 42
www.sabric.co.za CARD FRAUD
Debit Card FraudOverview of Debit Card Fraud (2010 - 2017)
A gross fraud loss of R176.6m was reported for lost and/or stolen debit card fraud in 2017. Of the total gross fraud loss for lost and/or stolen cards mentioned above, R173.6m (which is 98.3%) occurred in South Africa. Lost and/or stolen debit card fraud losses accounted for 51.6% of the losses and were the main contributor to fraud losses on SA-issued debit cards.
Debit card gross fraudlosses related to CNPincreased by 60.7% fromR61.0m to R98.0m if one
compares 2016 to 2017.CNP fraud contributed28.6% to the fraud losseson SA-issued debit cards in2017, with R68.0m of lossesoccurring outside SouthAfrica. There is a correlation between the rise in CNP fraud and the increase of fraud occurring outsideSouth Africa. It is expectedthat debit card CNP fraudwill continue to increase.
Gross losses for counterfeit debit card fraud decreased by 32.2% from R96.3m in 2016 to R65.3m in 2017. 63.0% of counterfeit
debit card transactions occurred within South Africa amounting to R41.1m. With CNP debit card fraud on the rise, counterfeit debit card fraud is now the third largest contributor to overall debit card gross fraud loss.
SA-issued debit cards were used in other African countries in 2017 to the value of R7.2m. The top 10 African countries that were targeted are displayed to the right:
Country Number of transactions
Gross fraud loss
Lost and/or Stolen Counterfeit CNP
ZIMBABWE 360 R 2 306 892 20 103 237
MOZAMBIQUE 448 R 1 820 675 10 361 77
ZAMBIA 203 R 1 405 777 11 169 23
KENYA 79 R 401 003 2 48 29
LESOTHO 140 R 267 528 12 109 2
NAMIBIA 223 R 197 728 215 3 5
MAURITIUS 80 R 196 430 3 2 75
ETHIOPIA 11 R 128 686 0 3 8
SWAZILAND 33 R 117 686 3 30
CAMEROON 49 R 85 021 0 29 20
SA-issued debit card gross fraud losses per fraud type, top 10 African countries
United Statesof losses were dueto lost and/or stolen debit card fraud.
Increase in debit card gross fraud lossesrelated to CNP.
51.1% +60.7%
The following five countries (excluding African countries) with the highest recorded financial losses due to CNP and Counterfeit card fraud using SA-issued debit cards during 2017 were:
CounterfeitCNP
Indonesia
United Kingdom
India
Luxembourg
Ireland
ChinaCyprus

PAGE: 19 // 42 PAGE: 20 // 42
www.sabric.co.za CARD FRAUD
Debit Card FraudOverview of Debit Card Fraud (2010 - 2017)
Gross fraud losses for lost and/or stolen debit cards decreased by 15.7% from R206.0m in 2016 to R173.6m in 2017. During 2017, 70.4%of the total fraud losses for debit cards inSouth Africa were attributed to lost and/or stolen debit card fraud losses. Criminals are using modus operandi like stealing, swopping and card entrapment accompanied by shoulder surfing, to obtain the card and PIN from a victim. This is the first year that we have seen a decrease for losses relating to lost and/or stolen debit card fraud since 2014.
Debit card gross fraud losses related to CNP increased by 66.9% in South Africa. CNP fraud contributed 12.2% to the total fraud losses on SA-issued debit cards in South Africa in 2017. Of the total gross fraud losses related to CNP during 2017 (R98.0m), 30.6% of the value of R30.0m occurred in South Africa.
Decreases were observed for NRI (Not Received Issued) in 2017. Measures implemented during 2017 to mitigate this risk are showing positive results.
Gross fraud losses associated with counterfeit debit card fraud in South Africa decreased by 38.2% from R66.5m in 2016 to R41.1m in 2017. The fraud losses related to counterfeit fraud have been consistently decreasing since 2011 and are currently at their lowest level since 2011.
Debit Card Fraud Loss in South Africa
SA-issued debit card gross fraud losses per fraud type (2010 to 2017)
Gross losses for debit cardfraud on SA-issued cards usedin South Africa decreased by16.1% from R293.8m in 2016to *R246.6m in 2017.
Geographical Distribution of debit card fraud
Provincial geographical distribution of debit card gross fraud losses
Provincial geographical distribution during 2017
2010 2011 2012 2013 2014 2015 2016 2017
Eastern Cape R15.1m R39.5m R23.7m R15.9m R15.4m R19.0m R25.3m R20.1m
Free State R4.7m R10.4m R9.5m R8.8m R8.6m R8.4m R11.4m R8.9m
Gauteng R59.5m R126.9m R125.2m R94.7m R92.3m R100.7m R112.8m R95.3m
KwaZulu-Natal R24.0m R50.1m R50.4m R33.7m R28.8m R33.2m R50.1m R38.6m
Limpopo R3.9m R8.1m R11.5m R11.6m R12.4m R13.2m R14.9m R16.7m
Mpumalanga R5.7m R12.5m R15.1m R12.0m R10.7m R14.1m R17.5m R13.6m
Northern Cape <R1.0m R1.3m R1.0m R1.3m R2.1m R2.3m R3.6m R2.5m
North West R4.1m R8.7m R14.1m R11.7m R13.6m R12.2m R18.1m R14.5m
Western Cape R9.7m R29.6m R31.2m R25.4m R28.5m R27.8m R26.8m R23.7M
All Figures in (R) Millions
Gauteng, KwaZulu-Natal, Western Cape and Eastern Cape accounted for 76.1%
of debit card gross fraud losses in South Africa.
76.1% Gauteng, KwaZulu-Natal, Western Cape and Eastern Cape accounted for 76.1% of debit card gross fraud losses in South Africa. Gauteng accounted for 40.6%, followed by KwaZulu-Natal 16.5%, Western Cape 10.1% and Eastern Cape 8.9%. The remaining provinces accounted for 23.9% of the gross fraud losses.
Except for Limpopo, all provinces showed a decrease during 2017.
Eastern CapeFree StateGautengKwaZulu-NatalLimpopo
8.9%3.8%
40.6%16.5%
7.1%
5.8%1.0%6.2%
10.1%
MpumalangaNorthern CapeNorth WestWestern Cape
0
50
100
150
200
250
300
350
20172016201520142013201220112010
CNP
Account Takeover
Counterfeit
False Applications
NRI (Not Received Issued)
Lost / Stolen
All Figures in (R) Millions
*5% of the provincial distribution data could not be determined due the virtual nature of CNP which cannot be linked to a physical location in South Africa.

PAGE: 21 // 42 PAGE: 22 // 42
www.sabric.co.za CARD FRAUD
Card Fraud in the UK
Lost and/or stolen card fraud increased by 30% with significant increases seen in the last two years. Total fraud losses of 15.61% can be attributed to lost and/or stolen cards. It is of interest to note that the UK is experiencing the same modus operandi as in South Africa where stolen cards are used for cash withdrawals. An increase of 32% was reported for ATM cash withdrawals from 2015 to 2016 and is described as follows; “the rise is due to an increase in distraction thefts and card entrapment at ATMs, with fraudsters obtaining both the
card and the PIN which enables them to commit fraud at cash machines.”
Card not present (CNP) fraud accounted for 69.9% of the total losses and an increase of 9% was reported when compared to 2015.
Counterfeit fraud accounted for 6% of the total losses and showed a 19% decrease. Figures in respect of fraud related to contactless cards were included in the report. A total of £6.9m was reported for 2016. This figure amounts to 1.1% of the total losses reported. Although figures are not yet available for South Africa, this could be an indication of what’s to come.
The same trends observed in the UK are being seen in South Africa. Gross fraud for CNP is increasing and is the main contributor to fraud losses. Lost and/or stolen card fraud is problematic in both countries with the compromise of PINs being the common denominator.*
According to Financial Fraud Action UK , gross fraud losses on UK cards increased by 9% from January to December 2016, when compared to the same period in 2015.
Card fraud losses on UK-issued cards (2010 to 2016)
0 100 200 300 400 500 600 700 800
2016
2015
2014
2013
2012
2011
2010 £365.0
£341.0
£388.0
£450.0
£479.0
£568.0
£618.0
Similar to the UK trend, a decrease in counterfeit fraud was observed in South Africa during 2017.
*SOURCE | https://www.financialfraudaction.org.uk/wp-content/uploads/2016/07/2016-Year-end-fraud-bulletin.pdf
All Figures in (£) Millions

PAGE: 23 // 42 PAGE: 24 // 42
www.sabric.co.za CARD FRAUD
ATM Crime
ATM ATM4.6% 49.1%Other Other95.4% 50.9%
Provincial geographical distribution on SA-issued credit cards during 2017
Provincial geographical distribution on SA-issued debit cards during 2017
Gross fraud loss on SA-issued credit cards - ATMcompared to other merchants (All countries 2017)
Gross fraud loss on SA-issued debit cards - ATMcompared to other merchants (All countries 2017)
Overview of 2017 ATMtransactions (cash withdrawals) for Credit Card FraudDuring 2017, R19.9m (4.6%) of gross fraud losses on all SA-issued credit cards were reported as cash withdrawals at ATMs. R11.9m can be attributed to counterfeit card fraud which accounts for the majority of losses, followed by lost and/or stolen cards which amounted to R4.9m. The bulk of counterfeit fraud transactions occurred in Indonesia.
In South Africa most of the transactions
occurred in Gauteng (47.4%) followed by
KwaZulu-Natal (6.3%) and Western Cape (6.0%).
47.4%
Overview of 2017 ATM trans-actions (cash withdrawals) for Debit Card Fraud
ATM transactions on debit cards are more widespread
across the different provinces, however most
of the transactions occurred in Gauteng
(35.1%) followed by KwaZulu-Natal (17.7%) and
Eastern Cape (11.0%).
35.1%During 2017, R167.8m (49.1%) of gross fraud losses on all SA-issued debit cards were reported as cash withdrawals at ATMs. Most losses were attributed lost and/or stolen cards and amounted to R138.8m. A total of 78.6% of lost and/or stolen cards were utilised to obtain cash from ATMs. A further R27.4m were the result of counterfeit cards used at ATMs. Most counterfeit fraud transactions, as with credit cards, occurred in Indonesia where fraudsters utilised card information obtained from skimming devices.
Eastern CapeFree StateGautengKwaZulu-NatalLimpopo
Eastern CapeFree StateGautengKwaZulu-NatalLimpopo
2.1%1.5%
47.4%6.3%1.5%
11.0%5.0%
35.1%17.1%4.9%
2.6%0.2%2.1%6.0%
6.7%1.4%7.2%8.0%
MpumalangaNorthern CapeNorth WestWestern Cape
MpumalangaNorthern CapeNorth WestWestern Cape

PAGE: 25 // 42 PAGE: 26 // 42
www.sabric.co.za CARD FRAUD
Description of Fraud TypesLost and/or stolen card fraud
Lost and/or stolen credit card fraud increased by 44.5% from R17.8m in 2016 to R25.7 in 2017 and accounted for 5.9% of the total gross fraud losses on credit cards. An increase has been observed since 2013. Most of these fraudulent transactions (76.1%) occurred inside South Africa.
The highest gross fraud losses reported on lost and/or stolen credit cards were because of fraudulent cash withdrawals and purchases at toll plazas, service stations, liquor stores and family clothing stores.
Lost and/or stolen card fraud Trend
Lost and/or stolen debit card fraud decreased by 17.2% from R213.2m in 2016 to R176.6m in 2017. This is the first year since 2009 that a decrease has been observed. Lost and/or stolen debit cards accounted for 51.6% of the total gross fraud losses on debit cards. Almost all (98.3%) of the gross fraud losses occurred inside South Africa.
The highest gross fraud losses for lost and/or stolen debit card fraud were cash withdrawals followed by purchases at toll plazas, liquor stores, grocery stores and clothing stores.
In many cases lost and/or stolen cards were obtained by interfering with customers while transacting at an ATM. Criminals distracted victims by offeringthem assistance during which the cardand PIN was obtained. The card was used repeatedly at ATMs until the daily cash withdrawal limit on the card had been reached after which, high value transactions were made at merchants.
Lost and/or stolen credit card fraud (2010 to 2017)
Lost and/or stolen debit card fraud (2010 to 2017)
0 5 10 15 20 25 30
2017
2016
2015
2014
2013
2012
2011
2010 R26.1
R15.9
R9.7
R8.5
R10.7
R12.8
R17.8
R25.7
0 50 100 150 200 250
2017
2016
2015
2014
2013
2012
2011
2010 R14.3
R17.9
R22.1
R57.1
R106.3
R134.3
R213.2
R176.6
Lost card fraud is a fraudulent transaction that
occurs on a valid issued card after the cardholder has lost his/her card, and
is no longer in possession of it. Stolen card fraud is
performed on a valid issued card that has been stolen from a legitimate owner.
Definition
All Figures in (R) Millions
All Figures in (R) Millions
CARD FRAUD

PAGE: 27 // 42 PAGE: 28 // 42
www.sabric.co.za CARD FRAUD
Description of Fraud TypesNot received issued card fraud (NRI)
Gross fraud losses for not received issued credit card fraud decreased by 76.4%, from R3.2m in 2016 to R761 763 in 2017. Gross losses for credit card fraud associated with NRI accounted for 0.2% of overall credit card losses. Mitigation measures implemented by the banks produced positive results in 2017. Banks continue to improve their processes in respect of card collections and PIN activations.
Not received issued debit card gross fraud losses decreased by 6.5%, from R618 216 in 2016 to R577 990 in 2017. Debit card gross fraud losses associated with NRI cards accounted for 0.2% of overall debit card fraud loss.
Not received issued card fraud (NRI) Trend
Not received issued credit card fraud (2010 to 2017)
Not received issued credit card fraud (2010 to 2017)
0.0 0.5 1.0 1.5 2.0 2.5 3.0 3.5
2017
2016
2015
2014
2013
2012
2011
2010 R1.7
R1.2
R0.6
R0.2
R0.1
R1.0
R3.2
R0.8
0.0 0.5 1.0 1.5 2.0
2017
2016
2015
2014
2013
2012
2011
2010 R0.4
R0.5
R0.2
R0.3
R0.3
R1.6
R0.6
R0.6
Not received issued card fraud relates to the
interception of a genuinely issued card before it reaches
the customer. Imposters then use intercepted cards
fraudulently.
Definition
Decrease of gross fraud losses for not received issued credit card fraud from 2016 to 2017.
Decrease of not received issued debit card gross fraud losses from 2016 to 2017.
-76.4%
-6.5%All Figures in (R) Millions
All Figures in (R) Millions
CARD FRAUD
PAGE: 29 // 42 PAGE: 30 // 42
www.sabric.co.za CARD FRAUD
Description of Fraud TypesFalse application card fraud
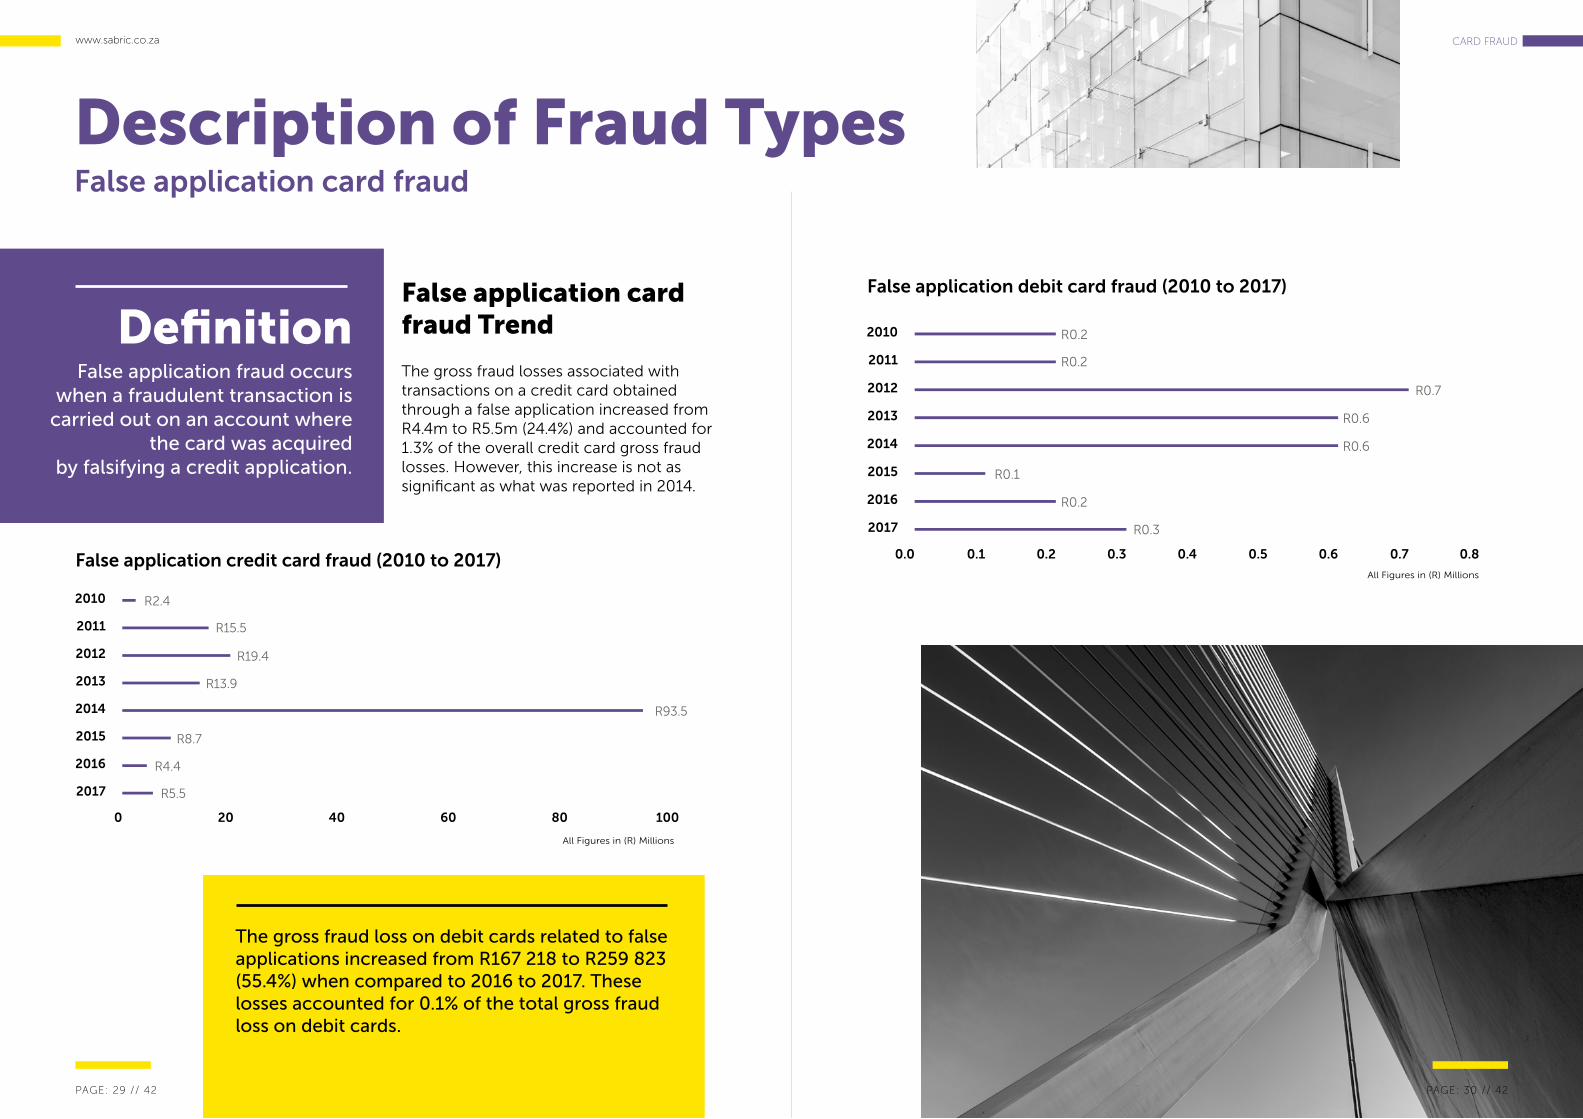
The gross fraud losses associated with transactions on a credit card obtained through a false application increased from R4.4m to R5.5m (24.4%) and accounted for 1.3% of the overall credit card gross fraud losses. However, this increase is not as significant as what was reported in 2014.
False application card fraud Trend
False application fraud occurs when a fraudulent transaction is
carried out on an account where the card was acquired
by falsifying a credit application.
Definition
False application credit card fraud (2010 to 2017)
False application debit card fraud (2010 to 2017)
0 20 40 60 80 100
2017
2016
2015
2014
2013
2012
2011
2010 R2.4
R15.5
R19.4
R13.9
R93.5
R8.7
R4.4
R5.5
0.0 0.1 0.2 0.3 0.4 0.5 0.6 0.7 0.8
2017
2016
2015
2014
2013
2012
2011
2010 R0.2
R0.2
R0.7
R0.6
R0.6
R0.1
R0.2
R0.3
All Figures in (R) Millions
All Figures in (R) Millions
The gross fraud loss on debit cards related to false applications increased from R167 218 to R259 823 (55.4%) when compared to 2016 to 2017. These losses accounted for 0.1% of the total gross fraud loss on debit cards.
PAGE: 30 // 42
PAGE: 31 // 42 PAGE: 32 // 42
www.sabric.co.za CARD FRAUD
Description of Fraud TypesCounterfeit card fraud
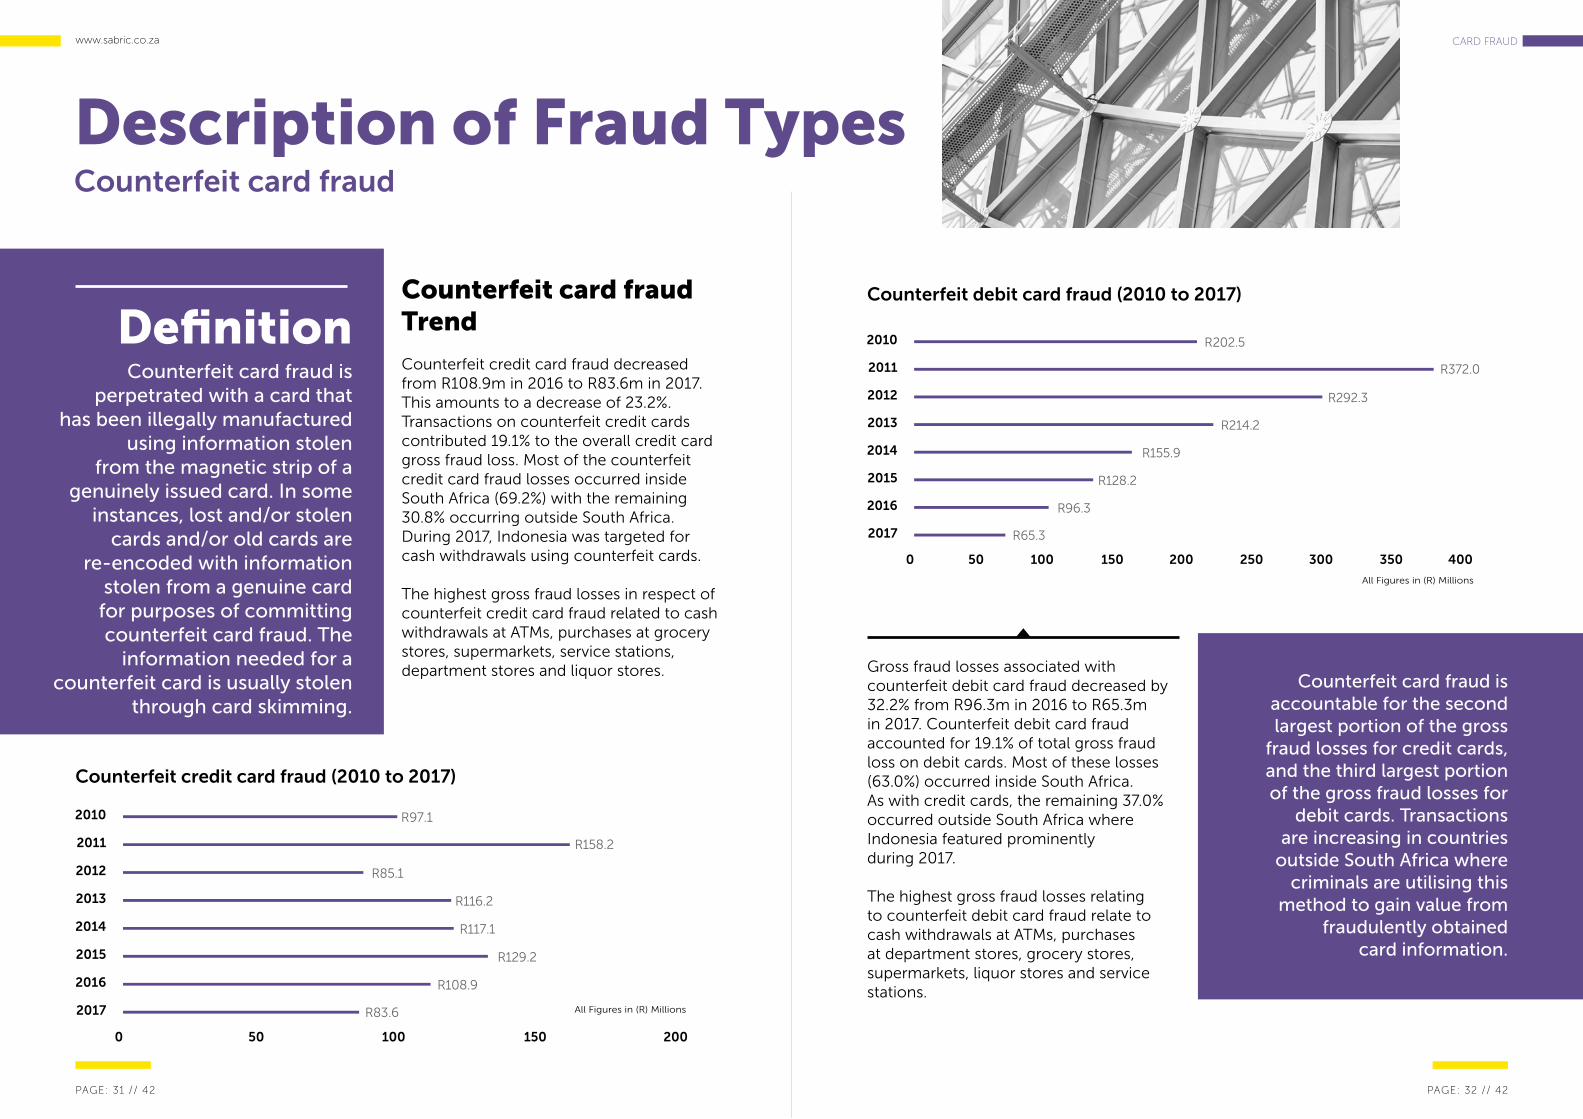
Counterfeit credit card fraud decreased from R108.9m in 2016 to R83.6m in 2017. This amounts to a decrease of 23.2%. Transactions on counterfeit credit cards contributed 19.1% to the overall credit card gross fraud loss. Most of the counterfeit credit card fraud losses occurred inside South Africa (69.2%) with the remaining 30.8% occurring outside South Africa. During 2017, Indonesia was targeted for cash withdrawals using counterfeit cards.
The highest gross fraud losses in respect of counterfeit credit card fraud related to cash withdrawals at ATMs, purchases at grocery stores, supermarkets, service stations, department stores and liquor stores.
Counterfeit card fraud Trend
Counterfeit card fraud is perpetrated with a card that
has been illegally manufactured using information stolen
from the magnetic strip of a genuinely issued card. In some
instances, lost and/or stolen cards and/or old cards are
re-encoded with information stolen from a genuine card
for purposes of committing counterfeit card fraud. The
information needed for a counterfeit card is usually stolen
through card skimming.
Definition
Counterfeit credit card fraud (2010 to 2017)
Counterfeit debit card fraud (2010 to 2017)
0 50 100 150 200
2017
2016
2015
2014
2013
2012
2011
2010 R97.1
R158.2
R85.1
R116.2
R117.1
R129.2
R108.9
R83.6
0 50 100 150 200 250 300 350 400
2017
2016
2015
2014
2013
2012
2011
2010 R202.5
R372.0
R292.3
R214.2
R155.9
R128.2
R96.3
R65.3
Gross fraud losses associated withcounterfeit debit card fraud decreased by32.2% from R96.3m in 2016 to R65.3min 2017. Counterfeit debit card fraudaccounted for 19.1% of total gross fraudloss on debit cards. Most of these losses(63.0%) occurred inside South Africa.As with credit cards, the remaining 37.0%occurred outside South Africa whereIndonesia featured prominently during 2017.
The highest gross fraud losses relating to counterfeit debit card fraud relate to cash withdrawals at ATMs, purchases at department stores, grocery stores, supermarkets, liquor stores and service stations.
Counterfeit card fraud isaccountable for the secondlargest portion of the gross
fraud losses for credit cards,and the third largest portionof the gross fraud losses for
debit cards. Transactions are increasing in countries
outside South Africa where criminals are utilising this
method to gain value from fraudulently obtained
card information.
All Figures in (R) Millions
All Figures in (R) Millions

PAGE: 33 // 42 PAGE: 34 // 42
www.sabric.co.za CARD FRAUD
Description of Fraud TypesCounterfeit card fraud
The first POS skimming devices were retrieved in South Africa in 2014. Criminals steal legitimate POS devices from merchants and then illegally convert them into skimming devices. In some instances, devices are swopped between different merchants to make it seem as if all devices are accounted for. A total of 40 POS skimming devices were recovered by the South African Police and bank investigators in 2017.
In 2017, 36 ATM mounted skimming devices were recovered by the banking industry and law enforcement officials.
Card skimming via Point of Sale (POS) devices The skimming of cards via
Point of Sale (POS) devices, ATM mounted devices and handheld devices to obtain card information remains a prevalent modus operandi.
POS skimming devices retrieved (2014 to 2017)
ATM Mounted Skimming Devices Retrieved (2010 to 2017)
0 10 20 30 40 50 60 70 80
2017
2016
2015
2014
2013
2012
2011
2010 36
53
43
44
71
59
15
36
Card skimming with ATM mounted devices
Provincial distribution of ATM Mounted Skimming Devices Retrieved in 2017
Provincial distribution of POS Skimming Devices Retrieved in 2017
During 2017 these devices were retrieved in Gauteng (27), Western Cape (10), KwaZulu-Natal (2) and Free State (1).
ATM mounted skimming devices were retrieved in Gauteng (14) and Free State (22).
GautengFree StateWestern CapeKwaZulu-Natal
271
102
GautengFree State
1422
0 10 20 30 40 50
2017
2016
2015
2014
2013
2012
2011
2010
49
30
30
40

PAGE: 35 // 42 PAGE: 36 // 42
www.sabric.co.za CARD FRAUD
Description of Fraud TypesCounterfeit card fraud
In 2017, 16 handheld skimming devices were recovered by the banking industry and law enforcement officials.
Handheld Skimming Devices Retrieved (2010 to 2017)
Card skimming with handheld devices
ATM mounted skimming devices were retrieved in Gauteng (7), KwaZulu-Natal (6), Free State (2) and Mpumalanga (1)
Provincial distribution of handheld skimming devices retrieved in 2017
GautengFree StateMpumalangaKwaZulu-Natal
7216
0 50 100 150 200 250
2017
2016
2015
2014
2013
2012
2011
2010 190
194
237
151
89
37
31
16

PAGE: 37 // 42 PAGE: 38 // 42
www.sabric.co.za CARD FRAUD
Description of Fraud TypesAccount takeover card fraud
Account takeover credit card fraud (2010 to 2017)
Account takeover debit card fraud (2010 to 2017)
0.0 0.5 1.0 1.5 2.0 2.5 3.0 3.5
2017
2016
2015
2014
2013
2012
2011
2010 R0.3
R0.9
R1.5
R2.4
R0.8
R1.8
R3.1
R2.5
0.0 0.5 1.0 0.5 2.0 2.5 3.0
2017
2016
2015
2014
2013
2012
2011
2010 R0.0
R0.0
R0.1
R0.1
R0.2
R1.6
R2.6
R0.9
All Figures in (R) Millions
All Figures in (R) Millions
CARD FRAUD
Account takeovercard fraud Trend
Account takeover fraudtakes place when an existingaccount is taken over bysomeone posing as thegenuine account holder,who then uses the accountfor their own benefit.
The common denominator for both Account Takeover fraud and False Application fraud is the fraudsters access to the personal information of their victims. This is done by obtaining personal or client-specific information, pretending to be the client and then applying for a replacement card which is then, once received, used fraudulently.
DefinitionCredit card gross fraud losses associated with account takeover fraud decreased 17.3% from R3.1.0m in 2016 to R2.5m in 2017. Account takeover fraud accounted for 0.6% of the overall credit card fraud losses.
Debit card gross fraud losses associated with account takeover fraud decreased 66.1% from R2.6m in 2016 to R869 349 in 2017. Account takeover fraud accounted for 0.3% of the overall debit card fraud losses.

PAGE: 39 // 42 PAGE: 40 // 42
www.sabric.co.za CARD FRAUD
Description of Fraud TypesCard not present card fraud (CNP)
Gross fraud losses for credit card CNP increased by 7.4% from R296.4m in 2016 to R318.4m in 2017.
The losses related to CNP fraud accounted for 72.9% of the total credit card gross fraud losses in
2017. The losses related to CNP fraud have been steadily increasing since 2011 and are currently
at their highest level. Most gross fraud losses are related to transactions outside of South Africa (62.8%), with the remaining 37.2% occurring at
South African merchants.
The highest gross fraud losses related to CNP credit card fraud are because of the purchase
of airlines tickets, travel agencies, hotels, direct marketing, and specialty retail stores.
Card not present card fraud (CNP) Trend
CNP credit card fraud (2010 to 2017)
0 50 100 150 200 250 300 350
2017
2016
2015
2014
2013
2012
2011
2010 R81.1
R179.7
R211.8
R238.0
R240.6
R249.6
R296.4
R318.4
CNP fraud is a fraudulent transaction where neither the card nor the cardholder is present while transactions are being made. These transactions occur when retailers are unable to check the card or the identity of the cardholder and are conducted under the following circumstances: orders for goods placed telephonically, purchases conducted via theinternet, purchases by mailorder or fax.
CNP fraud is generally carried out using fraudulently obtained card data and personal information and is sourced through various means such as discarded receipts, prior CNP purchases and phishing.
Definition
CNP debit card fraud (2010 to 2017)
0 20 40 60 80 100
2017
2016
2015
2014
2013
2012
2011
2010 R7.9
R28.9
R30.8
R47.9
R61.7
R78.9
R61.0
R98.0
Gross fraud loss associated with CNP fraud on debit cards increased by 60.7% from R61.0m in
2016 to R98.0m in 2017 and contributed to 28.6% of the total gross fraud losses on debit cards. Most of these transactions (69.4%) occurred
at merchants outside of South Africa, with the remaining 30.6% occurring at
South African merchants.
The highest gross losses relating to debit card CNP fraud is linked to the purchase of airlines tickets, speciality retail stores, direct marketing, security
brokers and business services.
An increase in CNP fraud has been observed in EMV compliant countries like the United Kingdom,
and South Africa has followed a similar pattern. Debit card CNP fraud is expected to further
increase as more CNP transactions are permitted using debit cards. CNP debit card fraud exceeded
counterfeit fraud losses in 2017 and is currently the second highest contributor to gross fraud losses.
All Figures in (R) Millions
All Figures in (R) Millions
Criminals source card data to perpetrateCNP fraud through various modusoperandi such as phishing, vishing,malware and data breaches.

PAGE: 41 // 42 PAGE: 42 // 42
www.sabric.co.za CARD FRAUD
THANK YOU
@SabricZA
SabricZA
@Sabric
011 847 3000www.sabric.co.za