cardiac calculations - csnlc.nhs.uk · pdf fileobjective the major objective of haemodynamic...
TRANSCRIPT
Cardiac Calculations
Lancashire & South Cumbria Cardiac Network
Lauren Butler
ObjectiveThe major objective of haemodynamicmonitoring is to evaluate the performance of the heart as a pumpA number of haemodynamic parameters can be calculated from the pressure data and cardiac output determinationsThese derived parameters serve as a basis for further evaluation of cardiac performance

Cardiac outputFor calculating cardiac output the Fickmethod is the most simpleIt depends upon the principle that, the rate at which oxygen is consumed is divided by the quantity of oxygen removed from the blood by the bodyThe result is the quantity of blood in which the oxygen was contained
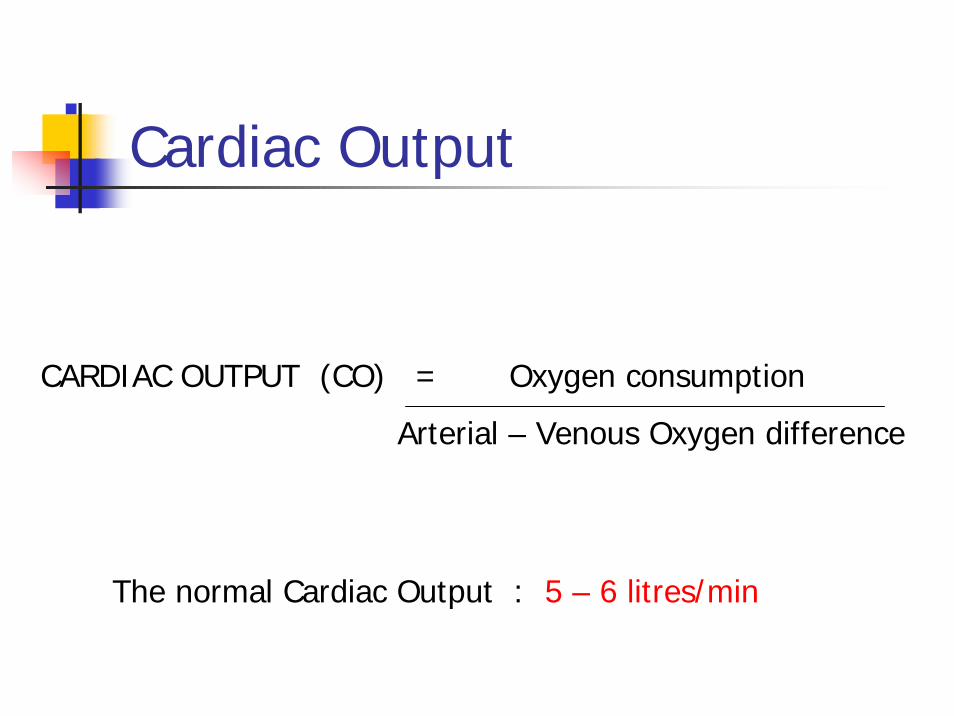
CARDIAC OUTPUT (CO) = Oxygen consumption
Arterial – Venous Oxygen difference
The normal Cardiac Output : 5 – 6 litres/min
Cardiac Output

Cardiac Index
Cardiac output varies from person to person depending on specific variablesmajor variable is body sizeA cardiac output of 4 l/min may be considered normal for a petite woman but could be inadequate for a large manFor this reason cardiac output data are often normalised. This is accomplished by dividing the cardiac output by the patients’ body surface area (BSA)Usually entering the height and weight of the patient into the cardiac output computer allows automatic calculation of the index
Cardiac Index
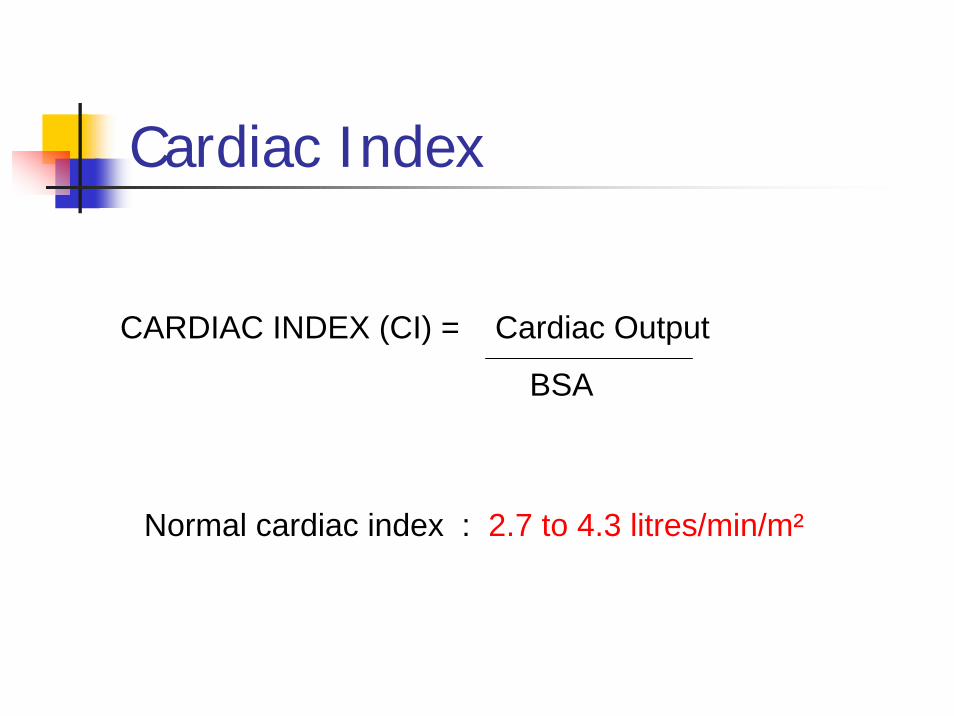
Normal cardiac index : 2.7 to 4.3 litres/min/m²
CARDIAC INDEX (CI) = Cardiac Output
BSA
Cardiac Index
Cardiac Index values between 1.8 and 2.2 l/min/m² indicate the onset of clinical hypoperfusionCardiac Index values below 1.8 may be associated with cardiogenic shock
Trans-pulmonary GradientMeasure of fall in pressure across the lung fieldsIndicates excessive pulmonary pressure have had a long lasting effect on the lungsUsed to assess for heart vs heart-lung transplantIf the TPG is greater than 12mmHg the pressures indicate heart-lung transplant is preferred
Trans-Pulmonary Gradient
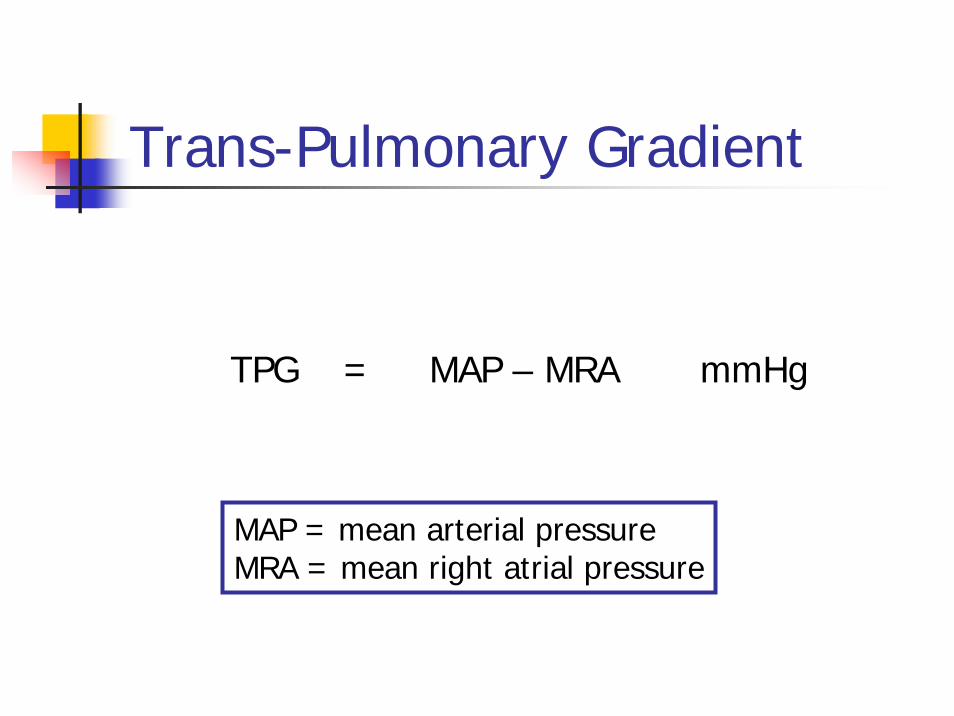
TPG = MAP – MRA mmHg
MAP = mean arterial pressureMRA = mean right atrial pressure
Systemic Vascular ResistanceSystemic vascular resistance is a measure of peripheral blood vessel resistance to blood flow and the arterioles are the major determinants of this resistanceResistance to flow is often referred to as afterloadSVR is the ratio of the pressure drop across the systemic vascular system to the total flow passing through the systemic circulation
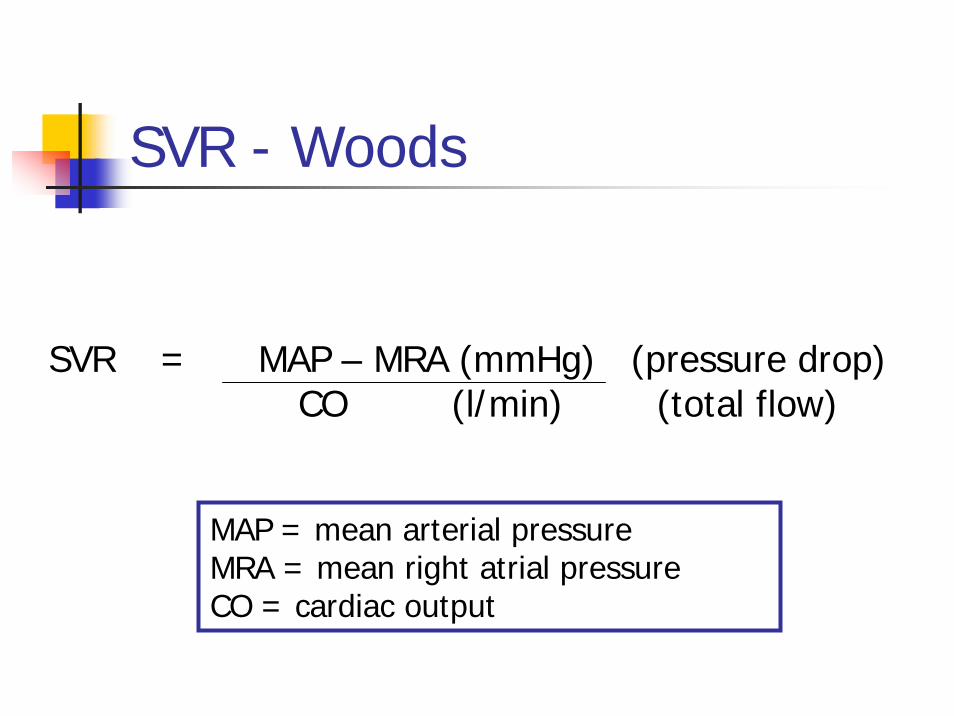
SVR - Woods
SVR = MAP – MRA (mmHg) (pressure drop)CO (l/min) (total flow)
MAP = mean arterial pressureMRA = mean right atrial pressureCO = cardiac output
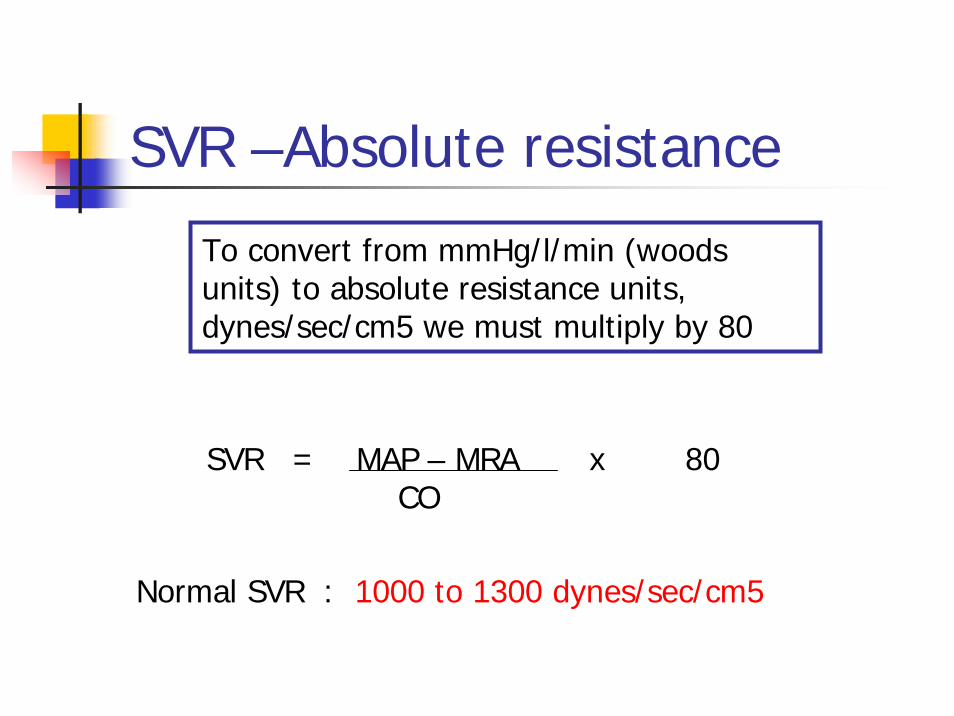
SVR –Absolute resistance
To convert from mmHg/l/min (woods units) to absolute resistance units, dynes/sec/cm5 we must multiply by 80
SVR = MAP – MRA x 80CO
Normal SVR : 1000 to 1300 dynes/sec/cm5
SVR
An abnormally high SVR would indicate peripheral vasoconstriction such as might occur in response to hypovolemiaAn abnormally low SVR would indicate peripheral vasodilation as might occur in septic shock
Pulmonary Vascular ResistancePulmonary vascular resistance is a measure of the pulmonary blood vessel resistance to blood flowCalculated based on the same principle used to calculate SVRPVR then is the ratio of the pressure drop across the pulmonary vascular system to the total flow passing through the pulmonary circulation
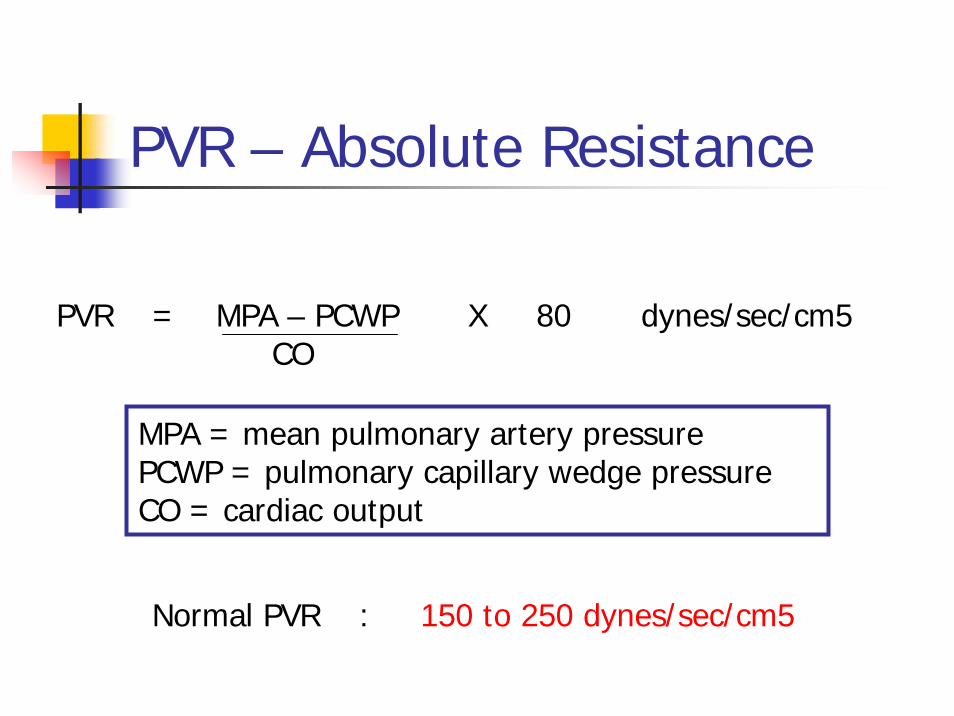
PVR – Absolute Resistance
PVR = MPA – PCWP X 80 dynes/sec/cm5 CO
MPA = mean pulmonary artery pressurePCWP = pulmonary capillary wedge pressureCO = cardiac output
Normal PVR : 150 to 250 dynes/sec/cm5
PVR
Note that a normal PVR is approximately one sixth of the normal SVRAn abnormally high PVR could be indicative of pulmonary hypertension, hypoxia, lung disease or pulmonary embolism
Intra-cardiac Shunt
During Cardiac Catheterisation, blood oxygen saturations are taken from the SVC and IVC through to pulmonary artery A step up in oxygen saturations of more than 10 % from one chamber/vessel to the next, indicates the presence and position of an intracardiac shunt
Shunt CalculationThe quantification of a left to right shunt can easily be calculated by obtaining blood oxygen saturationsMixed venous oxygen saturation is the average of SVC, IVC (and right atrialsaturations for VSD calculations)
Take into account volume returning from SVC & IVC!
Other saturations that are needed include Arterial, Pulmonary Artery and Pulmonary Venous (assumed 98%, if not measured)
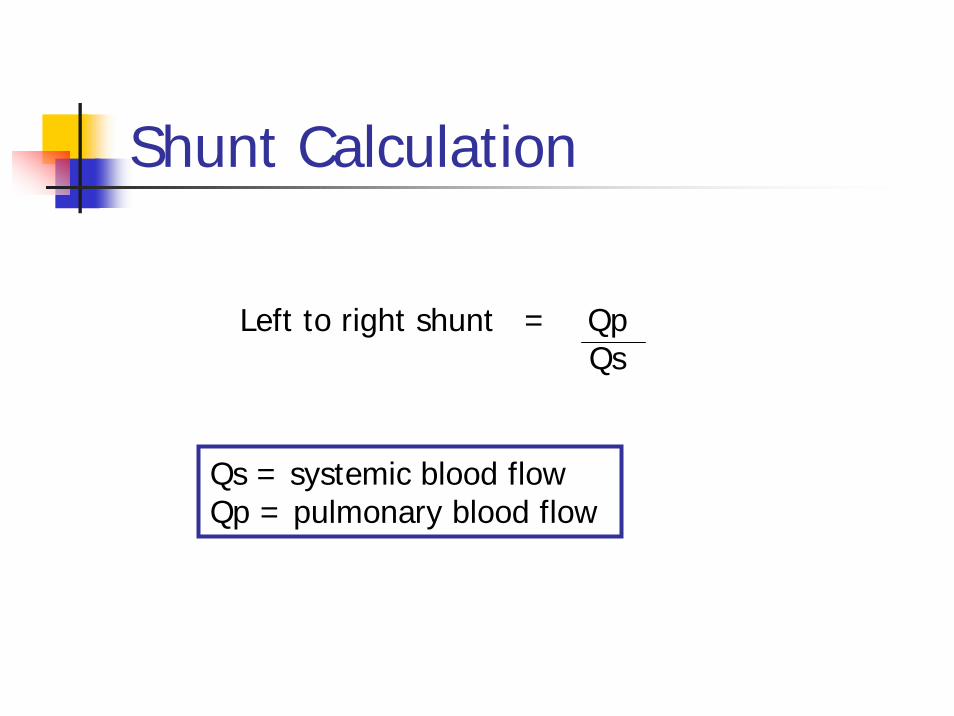
Shunt Calculation
Left to right shunt = QpQs
Qs = systemic blood flowQp = pulmonary blood flow
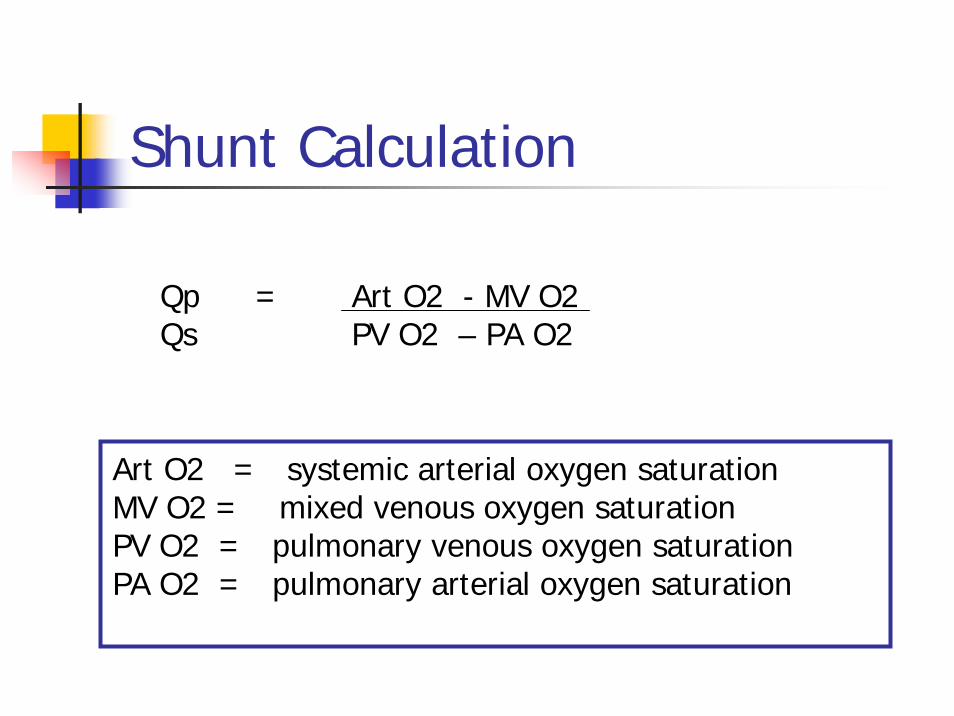
Shunt Calculation
Qp = Art O2 - MV O2Qs PV O2 – PA O2
Art O2 = systemic arterial oxygen saturationMV O2 = mixed venous oxygen saturationPV O2 = pulmonary venous oxygen saturation PA O2 = pulmonary arterial oxygen saturation
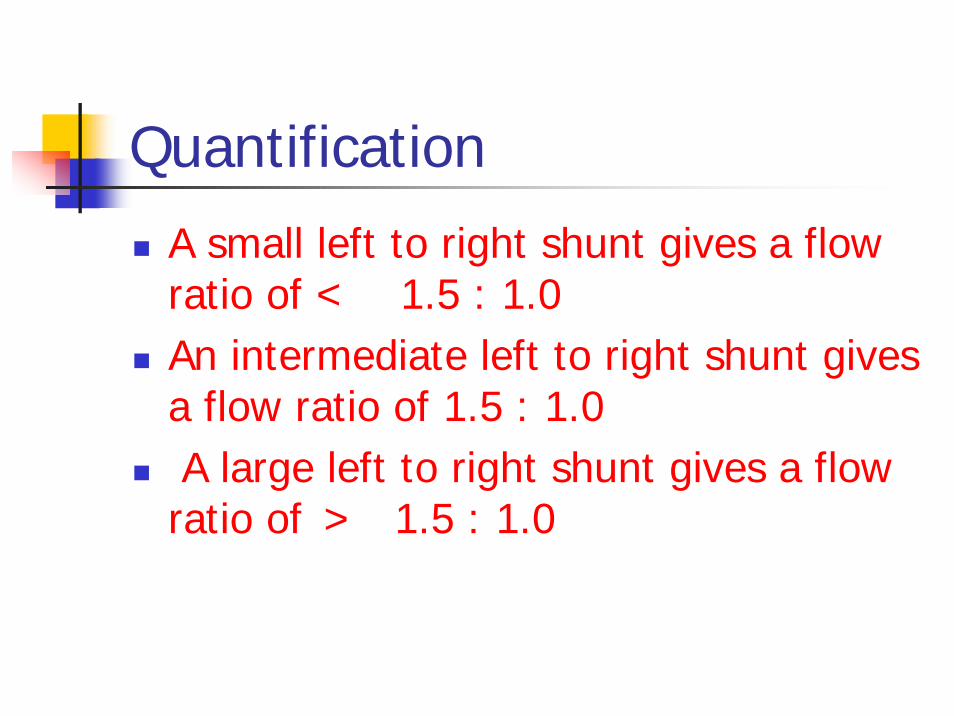
Quantification
A small left to right shunt gives a flow ratio of < 1.5 : 1.0An intermediate left to right shunt gives a flow ratio of 1.5 : 1.0A large left to right shunt gives a flow ratio of > 1.5 : 1.0