care home use of medicines study (chums) · pdf filecare home use of medicines study (chums)...
TRANSCRIPT
Care Home Use of Medicines Study (CHUMS)
Medication errors in nursing & residential care homes ‐ prevalence, consequences, causes and solutions
Report to the Patient Safety Research Portfolio, Dept of Health
Alldred DP Lim R
Barber N Raynor DK
Buckle P Savage I
Carpenter J Standage C
Dean‐Franklin B Wadsworth P
Dickinson R Woloshynowych M
Garfield S Zermansky AG
Jesson B
Authors competing interests: none
i
Care Home Use of Medicines Study (CHUMS)
Alldred DP, Barber N, Buckle P , Carpenter J, Dickinson R, Franklin BD, Garfield S,
Jesson B, Lim R, Raynor DK, Savage I, Standage C, Wadsworth P, Woloshynowych M,
Zermansky AG.
Background: This work was funded by the Department of Health as part of the Patient
Safety Research Portfolio with the aims of: establishing the prevalence, types and
underlying causes of medication errors, estimating the ensuing harm and developing
solutions to reduce the prevalence of error.
Methods: We chose residents at random in residential and nursing care homes in three
areas of England. Medication errors were in prescribing, monitoring, dispensing and
administering medicines, and were established by observation, interview and checking
records (in homes, pharmacies and practices). Causes of errors were suggested from
interviews and observation. Harm was estimated on a 0 (no harm) ‐ 10 (death) scale.
Results: We studied 256 patients in 55 homes. Patients were on a mean of 7.2 medicines
each and 69.5% of patients had at least one error.
The prevalence of errors was: prescribing 8.3%, monitoring 14.7% (for relevant medicines),
dispensing 9.8% and administration 8.4%; these figures represent the likelihood that each
act (prescribing a medicine, for example) will be an error. In terms of patients receiving
errors: 39.1% received a prescribing error, 18.4% (of those who needed it) a monitoring
error, 36.7% a dispensing error and 22.3% observed to receive an administration error.
Most errors had negligible consequences and we saw no cases of harm caused by errors,
however harm can develop over time, so we estimated the harm from the observed errors,
using a 0‐10 scale. The mean harm (and range) for each type of error was: prescribing 2.6
(0.2‐5.8), monitoring 3.7 (2.8‐5.2), dispensing 2.0 (0.2‐6.6) and administration 2.1 (0.1‐5.8).
ii
Discussion
The 58 interviews undertaken to understand what those involved thought were factors
contributing to error led to a number of findings. Examples for prescribing error included
not knowing the resident; prescribing without computerised notes or prescribing software
and poor communication between primary and secondary care. Methods for identifying
patients needing monitoring needed improvement and getting blood samples was
problematic. Dispensing errors were partly related to Monitored Dosage Systems (MDS)
that use cassettes (and were more likely to have labelling problems), and to the millions of
tablets repackaged weekly into MDS. Administration errors could result from poor
ordering of medicines and poorly trained staff. There is a trend that patients receiving
residential care may be more likely to receive administration errors. Staff giving medicines
had many distractions and the medicines trolleys were poorly designed.
General factors were the lack of any one person overseeing the whole system, the many,
often conflicting, records on medication, and the ways medicines are dispensed and
administered (care home staff spend 40‐50% of their time on medicines related activities).
Conclusions: There is an unacceptable prevalence of medication errors in care homes,
affecting some of the most vulnerable members of society. Action is required from all
concerned.
Implications for practice: Our suggestions include a preferred GP per home with a link to
their practice computer in the home. Monitoring errors require urgent attention.
Pharmacists should regularly review residents’ and their medication; they can also
rationalise regimes to help home staff work more safely. Several of the primary care
‘Connecting for Health’ IT developments due early 2009 should help communication
between GP, home and pharmacy (if pharmacy can see the medicines prescribed). Homes
need to monitor and reduce the times when a medicine is not given, and ensure staff are
competent to administer medicines. Pharmacists should identify and reduce their
dispensing errors. Homes and pharmacies often use MDS, but this requires large amounts
of resource. Research is needed on its effectiveness and alternatives. PCTs need to ensure
there is sufficient support for the special needs of these patients. Someone should be

iii
responsible for the safety of the whole medicines system in a care home; the under‐pinning
philosophy in the pharmacy White Paper (2008) suggests to us that this could be the
responsibility of a pharmacist.
iv
Executive Summary Introduction
The Care Homes Use of Medicines Study was designed firstly to establish the prevalence,
types and underlying causes of medication errors in residential and nursing homes, and
assess the ensuing harm. Secondly, we looked at the findings to develop solutions to
reduce the prevalence of error.
Method
In order to identify errors and understand why they occurred we adopted a broadly
ethnographic approach. Researchers visited homes, talked to the staff, reviewed the
medication of selected residents, observed medicines being given, and made observations
in the home. We also visited the surgeries of the residents’ GPs and reviewed records, as
well as some pharmacies; we also interviewed GPs and pharmacists.
Medication errors were defined as prescribing, monitoring, dispensing or administration
errors. Where errors of significance were noted they were pointed out or corrected. When
this occurred we estimated the harm that would have otherwise occurred on a 0 (no effect)
to 10 (death) scale. Our work was based on understanding how errors occur, and trying to
identify causative factors at the level of the individual, the team and working conditions,
and wider organisational factors. Once there was some information on errors the
ergonomists could then study areas in more depth.
We chose to study homes in the geographically spread, and demographically diverse areas
of West Yorkshire, Cambridgeshire and central London. Residents were included if they
were on one or more medicines and their GP agreed to take part. Residential and nursing
homes were chosen to represent a range of sizes and ownership. Within homes residents
were chosen at random. Consent was obtained from residents, but if unable to give consent
an assent process was used; the study received research ethics committee approval.
v
To understand the causes of errors interviews were conducted with the staff concerned.
Further ergonomics research was conducted, particularly in the area of the medicines
administration and records.
Results
The field work was carried out in 2006‐7; of those we approached we had agreement to take
part from 72% of homes, 67% of residents and 61% of general practices. We studied 256
elderly residents who lived in 55 residential and nursing care (usually mixed) homes.
Residents had a mean age of 85 and were on a mean of 7.2 (range 1‐22) medicines. Of the 55
homes 38 (69%) offered both residential and nursing care, a further 12 (22%) were
residential only. There was a mean of 3.8 GP practices per home (range 1‐14). The majority
of care homes were serviced by one pharmacy (mean 1.5, range 1‐4).
Seven out of ten residents were exposed to at least one medication error (178/256, 69.5%).
The odds of a person in residential care receiving a medication error was 1.31 (95% CI 0.93‐
1.84) times greater than one receiving nursing care. This increase was not statistically
significant after adjusting for age, sex and medication delivery system.
The prevalence of prescribing errors was 8.3% (95% CI 7.1‐9.7); 39.1% of residents had at
least one prescribing error (100/256). The commonest errors were ‘incomplete information’
(38%), ‘unnecessary drug’ (24%), ‘dose/strength error’ (14%) and ‘omission’ of a medicine
that should have been prescribed (12%).
The prevalence of medication administration errors (MAE) was 8.4% (95% CI 7.0‐10.0);
57/256 (22.3% 95% CI 17.3‐27.9) residents had at least one administration error. Nearly half
(49.1%) of all administration errors were ‘omissions’ and just over one fifth (21.4%) were
‘wrong dose’. There was no statistically significant difference in MAE by residents’
principal medicines delivery systems (MDS or not) (p=0.36). The odds of a MAE occurring
were higher in residential care residents than nursing care residents, however this just
failed to reach statistical significance at the 5% level (odds ratio 1.77 95% CI 0.96‐3.25
p=0.063 adjusted for age, sex and medication delivery system).
vi
The prevalence of dispensing errors was 9.8% (95% CI 8.5‐11.2); 94 residents (36.7% 95% CI
30.8‐42.9) had one or more errors each. Labelling errors were found in 7.3% of dispensed
items, content errors in 2.3% and clinical errors in 0.21%. There was a borderline
statistically significant difference in the odds of a dispensing error when analysing
individual errors by delivery system (p=0.056). This was driven by the higher odds of a
dispensing error with the cassette system (cassette vs. blister OR 2.53 95% CI 1.12‐5.72
p=0.022). Non‐MDS was similar to blister (OR 1.03 95% CI 0.57‐1.87). The higher proportion
of errors with the cassette system seemed to be predominantly a consequence of labelling
errors. As several dosage forms cannot be given in an MDS comparisons between MDS and
non‐MDS errors need caution as they do not compare like with like.
Some medicines require regular monitoring of the resident to check for side effects or to
ensure the medicine is working. The prevalence of monitoring errors for medicines that
required monitoring was 14.7% (32/218). Of the 147 residents who were prescribed a
medicine that required monitoring 27 (18.4%) had an error. The great majority of
monitoring errors (91%) resulted from a failure to request monitoring. There was
considerable variation between areas, with three‐quarters of monitoring errors occurring in
London.
We did not observe any residents harmed as a result of the above errors. Harm from
medication errors can develop over time, so the absence of harm in the present does not
mean harm will not develop in the future. We assessed the likely harm to result from the
errors on a 0 (no harm) ‐10 (death) scale. The overall harm for each type of error was rated
as low by the panel. Monitoring errors were associated with the greatest potential harm
with a mean score of 3.7 (range 2.8‐5.2); the corresponding figures were: prescribing errors,
mean 2.6 (range 0.2‐5.8); dispensing errors, mean 2.0 (range 0.2‐6.6) and administration
errors, mean 2.1 (range 0.1‐5.8).
Fifty‐nine interviews were conducted relating to 66 administration errors, 34 dispensing
errors and 8 monitoring errors. For each type of error several factors were raised which
represent that person’s view and experience, but which may not apply to all cases, and
may not be truly causal. Further ergonomics research was conducted, which identified 4
key areas of concern. The Medicines Administration Record (MAR Chart) was a
vii
contributory factor to a cluster of errors associated with discontinued items. Interruptions
of staff undertaking the drug round were common, and mostly came from other care home
staff. Drug trolleys were not designed to facilitate the efficient storage and administration
of both MDS and non‐MDS medication. Communication between the pharmacy and care
home (often by telephone or fax) contributed to a number of errors.
Discussion
For each prescribing, dispensing or administration event, there was a 8‐10% chance of an
error occurring, and for monitoring, a 15% chance. This is as high, or worse, than for people
living in their own homes or hospital, and generally care home residents have reduced
resilience to the harm that can result from medication errors.
Prescribing and monitoring errors were linked to the GP prescribing without having their
computerised notes and prescribing software to hand; sometimes on returning to the
practice they did not update notes. Some GPs were unfamiliar with the residents;
sometimes advice from secondary care was not integrated into the notes accurately. In
addition many residents (and some of their care staff) were unable to give an accurate
history. The harm scores for monitoring errors was higher than for other forms of error, and
failure to monitor residents was suggested as being linked to practice systems and software,
and to difficulty in getting blood taken from residents.
Medicines are dispensed to homes either as a community pharmacy would for a normal
ambulant patient, or they can be repackaged into monitored dosage systems (MDS). There
are two forms of MDS, blister packaging and cassettes; each is designed for solid dosage
forms (tablets etc) and involves the pharmacy opening the original packaging and
repackaging each tablet etc individually. Blister packs encase each tablet in a single blister
on a card which identifies when it should be given. Each dose of each tablet needs to be
popped out individually. Cassettes group all the doses needed for a certain day/time (eg
Monday breakfast) together in one compartment of a device. The repackaging of medicines
into MDS is a substantial, unfunded activity by pharmacies, and we estimate that millions
of tablets are ‘popped out’ of the manufacturers’ packaging in pharmacies every day, and
then repackaged in an MDS. Labelling was an issue, particularly of cassette MDS systems.
viii
Administration errors were suggested to be linked to the medication administration system,
poor design of the medicines trolley, distractions when administering medicines, lack of
care home staff knowledge about how some medicines had to be taken with respect to food,
lack of knowledge amongst some nurses/carers about how to administer medicines, as well
as not recognising the need for anticipating and avoiding ‘out of stock’ situations.
Some system‐wide issues were noticed which could contribute to error. First, generally no
one had ownership of the system or was in a position to show leadership in reducing error
across the interested parties in general practice, pharmacy and the homes themselves.
Second, it was hard to find out what the correct prescription was, as there could be
discrepancies between the several different sources of information. There needs to be much
improved communication, and an authoritative source needs to be accessible (such as the
Summary Care Record). Third, it can be very difficult for residents to leave the home to get
assessed or treated, and hence the local provision of resources that can visit the home
becomes important. Finally, the way in which MDS medicines are filled, and the way
medicines are given in the home, are very labour intensive. Some home owners estimated
40‐50% of staff time was spent on medicine related activities.
All research is subject to limitations. We could only work with those who chose to be part
of the study. The presence of observers may have affected the prevalence of administration
errors and observed behaviours. When interviewed about the causes of errors the accounts
given by the subjects will be influenced by many factors, as will their interpretation by the
research team. As there is little research into medication errors in care homes in the UK
there is a limited evidence base to inform policy making.
Conclusions
There is an urgent research agenda around the use of MDS, and the ways in which
medicines could be administered more safely and accurately in the home. Below we
suggest some ways forward, however we do not guarantee their effectiveness, and there is
need to study whether benefits are delivered, and how best to implement whole system
change.
ix
We make several suggestions to improve matters, based on our findings and current policy
– there is no great evidence base to work from of tested solutions. In our view each home
having a preferred GP provider, with the ability to electronically prescribe from the home,
would be of benefit. GPs need to review how they identify residents to be monitored and
ensure monitoring is carried out. Pharmacists should clinically review all residents and
their medications for appropriateness at at least 6 monthly intervals. However, to achieve
this, the historical human and financial under‐resourcing of the care home sector will need
to be addressed.
Homes need to seek ways to simplify the act of giving medicines, and ensure staff are
appropriately knowledgeable about medicines. They need to monitor and reduce the extent
of omission errors. Pharmacists need to be aware of the high rate of dispensing errors in
some areas and reduce them. They need to advise homes about medicines that should be
given at a special time in relation to meals. PCTs need to recognise the difficulties of getting
treatments and tests to residents in homes (where ambulant patients would normally
travel). All sides need to communicate with each other and set up relationships. In line
with the White Paper on pharmacy we recommend a pharmacist has responsibility for the
safe running of the whole system, involving all actors. Many of the communication issues
have the potential to be eased if the English IT strategy is delivered as planned. Electronic
transfer of prescriptions and other measures are planned to be available by early 2009 and
could have considerable benefits, provided pharmacists can access the relevant part of the
residents’ notes.
We have been very impressed with the care homes; this was a challenging study and yet we
had a high acceptance rate of 72%. We were impressed by the dedication of the staff and
their wish to solve problems related to medication. We take this as a promising sign of the
sector to engage in change to help one of society’s most vulnerable groups.
x
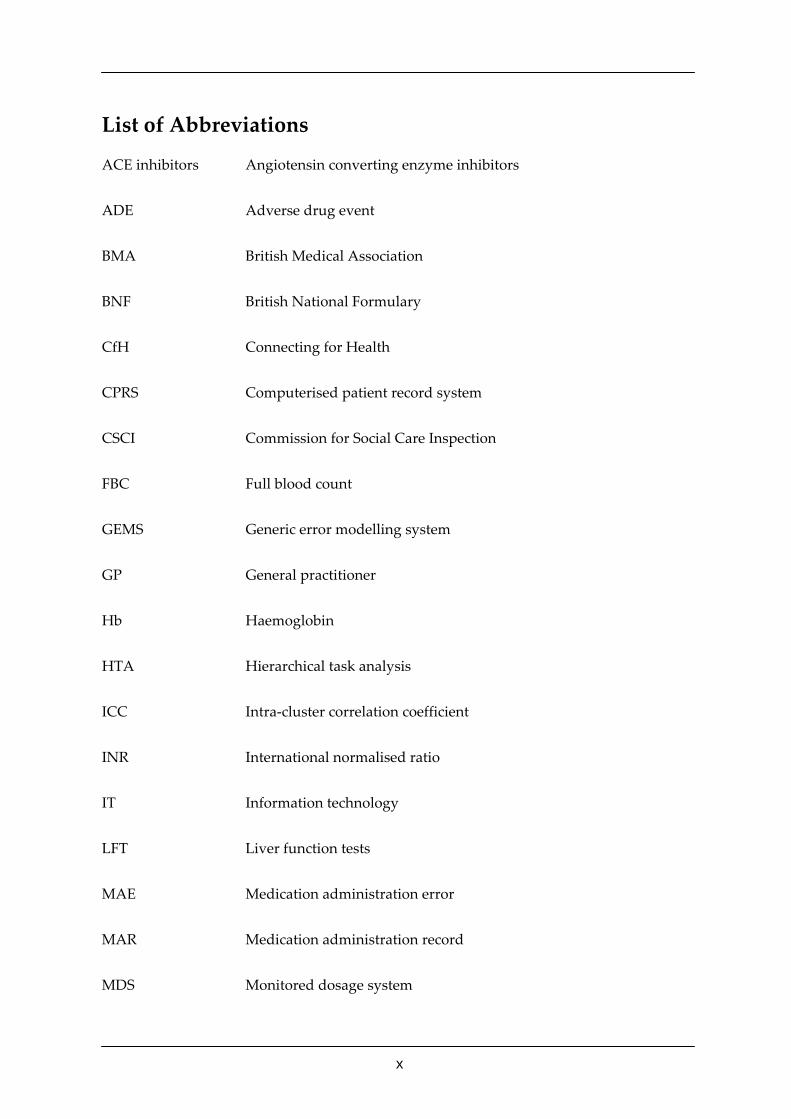
List of Abbreviations
ACE inhibitors Angiotensin converting enzyme inhibitors
ADE Adverse drug event
BMA British Medical Association
BNF British National Formulary
CfH Connecting for Health
CPRS Computerised patient record system
CSCI Commission for Social Care Inspection
FBC Full blood count
GEMS Generic error modelling system
GP General practitioner
Hb Haemoglobin
HTA Hierarchical task analysis
ICC Intra‐cluster correlation coefficient
INR International normalised ratio
IT Information technology
LFT Liver function tests
MAE Medication administration error
MAR Medication administration record
MDS Monitored dosage system
xi
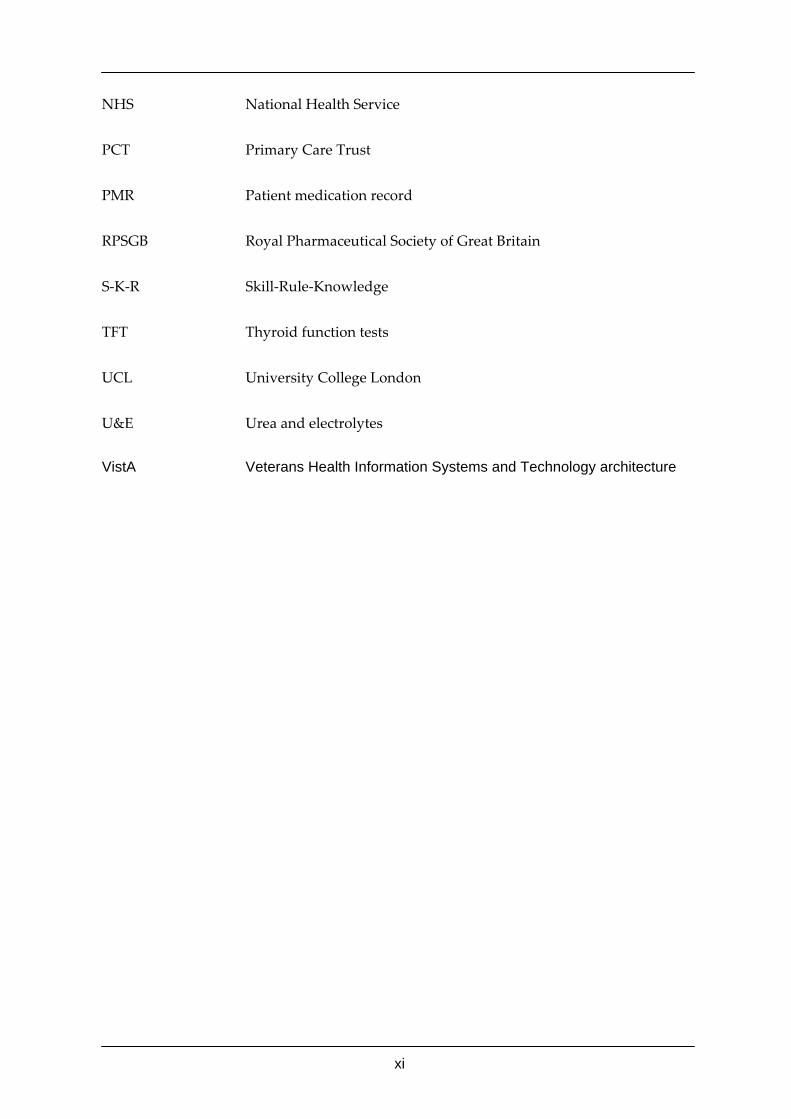
NHS National Health Service
PCT Primary Care Trust
PMR Patient medication record
RPSGB Royal Pharmaceutical Society of Great Britain
S‐K‐R Skill‐Rule‐Knowledge
TFT Thyroid function tests
UCL University College London
U&E Urea and electrolytes
VistA Veterans Health Information Systems and Technology architecture
xii
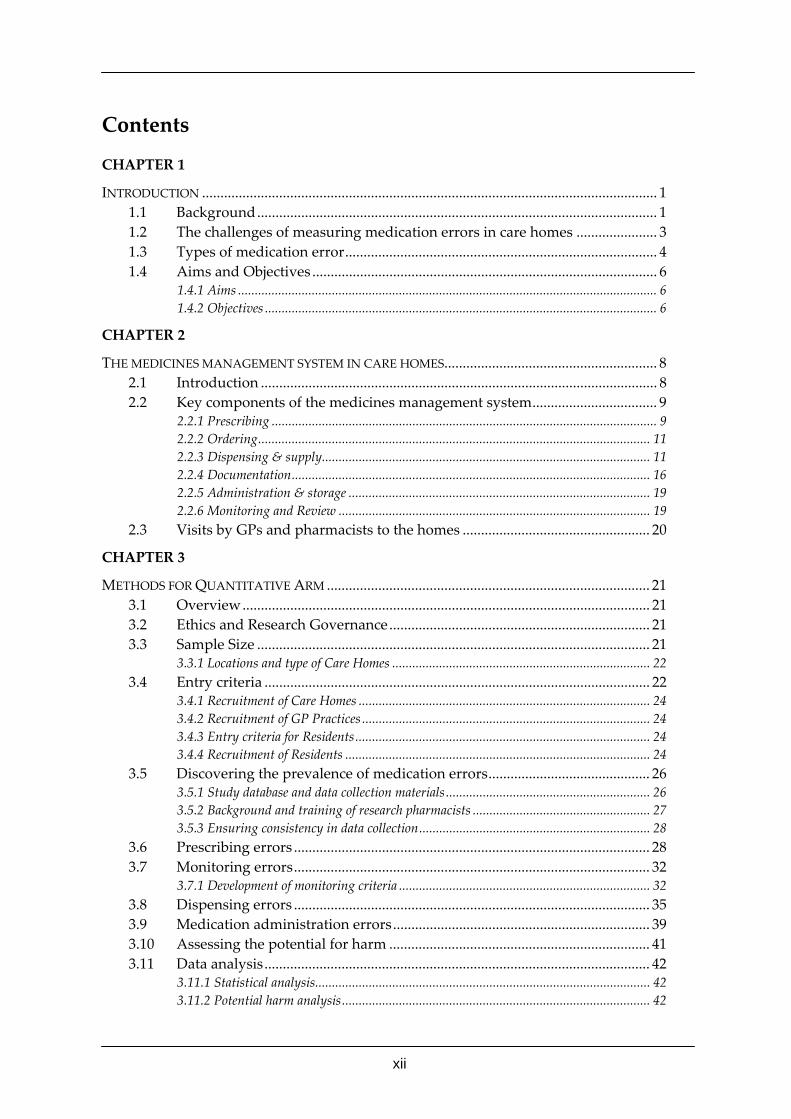
Contents
CHAPTER 1
INTRODUCTION ............................................................................................................................ 1 1.1 Background............................................................................................................. 1 1.2 The challenges of measuring medication errors in care homes ...................... 3 1.3 Types of medication error..................................................................................... 4 1.4 Aims and Objectives .............................................................................................. 6
1.4.1 Aims ............................................................................................................................. 6 1.4.2 Objectives ..................................................................................................................... 6
CHAPTER 2
THE MEDICINES MANAGEMENT SYSTEM IN CARE HOMES.......................................................... 8 2.1 Introduction ............................................................................................................ 8 2.2 Key components of the medicines management system.................................. 9
2.2.1 Prescribing ................................................................................................................... 9 2.2.2 Ordering..................................................................................................................... 11 2.2.3 Dispensing & supply.................................................................................................. 11 2.2.4 Documentation........................................................................................................... 16 2.2.5 Administration & storage .......................................................................................... 19 2.2.6 Monitoring and Review ............................................................................................. 19
2.3 Visits by GPs and pharmacists to the homes ................................................... 20
CHAPTER 3
METHODS FOR QUANTITATIVE ARM ........................................................................................ 21 3.1 Overview............................................................................................................... 21 3.2 Ethics and Research Governance....................................................................... 21 3.3 Sample Size ........................................................................................................... 21
3.3.1 Locations and type of Care Homes ............................................................................. 22 3.4 Entry criteria ......................................................................................................... 22
3.4.1 Recruitment of Care Homes ....................................................................................... 24 3.4.2 Recruitment of GP Practices ...................................................................................... 24 3.4.3 Entry criteria for Residents........................................................................................ 24 3.4.4 Recruitment of Residents ........................................................................................... 24
3.5 Discovering the prevalence of medication errors............................................ 26 3.5.1 Study database and data collection materials............................................................. 26 3.5.2 Background and training of research pharmacists ..................................................... 27 3.5.3 Ensuring consistency in data collection..................................................................... 28
3.6 Prescribing errors ................................................................................................. 28 3.7 Monitoring errors................................................................................................. 32
3.7.1 Development of monitoring criteria ........................................................................... 32 3.8 Dispensing errors ................................................................................................. 35 3.9 Medication administration errors...................................................................... 39 3.10 Assessing the potential for harm ....................................................................... 41 3.11 Data analysis......................................................................................................... 42
3.11.1 Statistical analysis.................................................................................................... 42 3.11.2 Potential harm analysis............................................................................................ 42
xiii
CHAPTER 4
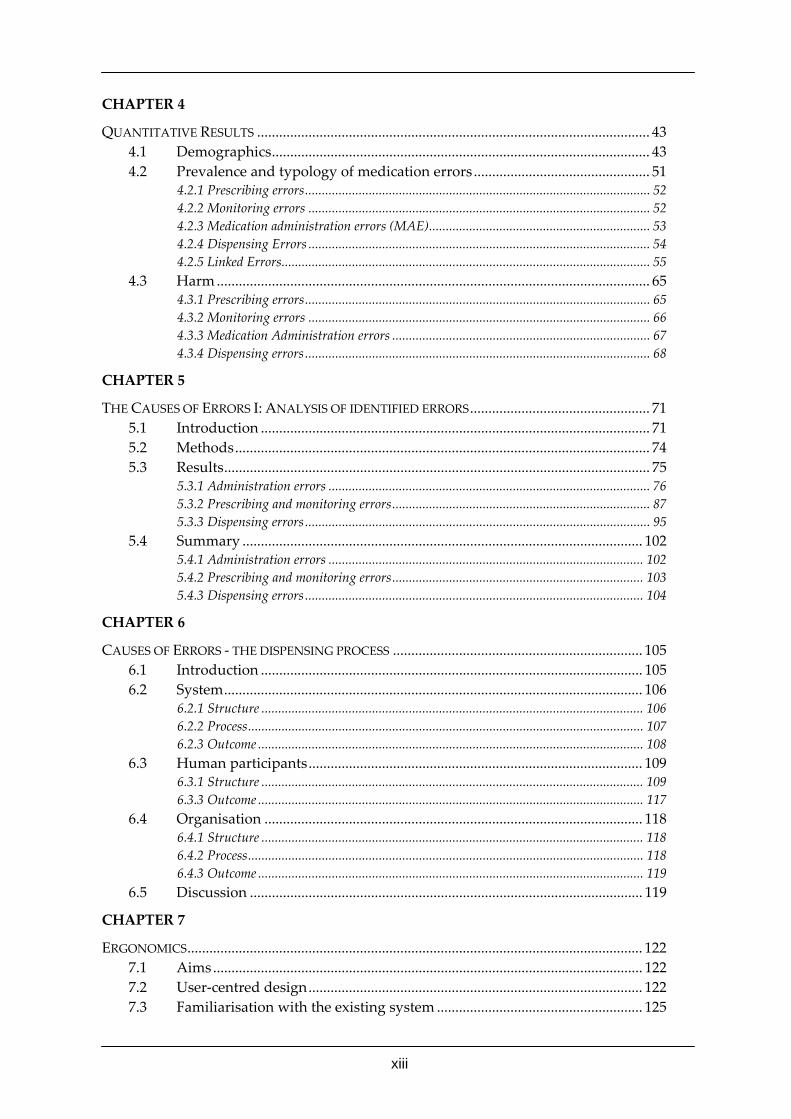
QUANTITATIVE RESULTS ........................................................................................................... 43 4.1 Demographics....................................................................................................... 43 4.2 Prevalence and typology of medication errors................................................ 51
4.2.1 Prescribing errors....................................................................................................... 52 4.2.2 Monitoring errors ...................................................................................................... 52 4.2.3 Medication administration errors (MAE).................................................................. 53 4.2.4 Dispensing Errors ...................................................................................................... 54 4.2.5 Linked Errors.............................................................................................................. 55
4.3 Harm...................................................................................................................... 65 4.3.1 Prescribing errors....................................................................................................... 65 4.3.2 Monitoring errors ...................................................................................................... 66 4.3.3 Medication Administration errors ............................................................................. 67 4.3.4 Dispensing errors....................................................................................................... 68
CHAPTER 5
THE CAUSES OF ERRORS I: ANALYSIS OF IDENTIFIED ERRORS................................................. 71 5.1 Introduction .......................................................................................................... 71 5.2 Methods................................................................................................................. 74 5.3 Results.................................................................................................................... 75
5.3.1 Administration errors ................................................................................................ 76 5.3.2 Prescribing and monitoring errors............................................................................. 87 5.3.3 Dispensing errors....................................................................................................... 95
5.4 Summary ............................................................................................................. 102 5.4.1 Administration errors .............................................................................................. 102 5.4.2 Prescribing and monitoring errors........................................................................... 103 5.4.3 Dispensing errors..................................................................................................... 104
CHAPTER 6
CAUSES OF ERRORS ‐ THE DISPENSING PROCESS .................................................................... 105 6.1 Introduction ........................................................................................................ 105 6.2 System.................................................................................................................. 106
6.2.1 Structure .................................................................................................................. 106 6.2.2 Process...................................................................................................................... 107 6.2.3 Outcome ................................................................................................................... 108
6.3 Human participants........................................................................................... 109 6.3.1 Structure .................................................................................................................. 109 6.3.3 Outcome ................................................................................................................... 117
6.4 Organisation ....................................................................................................... 118 6.4.1 Structure .................................................................................................................. 118 6.4.2 Process...................................................................................................................... 118 6.4.3 Outcome ................................................................................................................... 119
6.5 Discussion ........................................................................................................... 119
CHAPTER 7
ERGONOMICS............................................................................................................................ 122 7.1 Aims..................................................................................................................... 122 7.2 User‐centred design........................................................................................... 122 7.3 Familiarisation with the existing system ........................................................ 125
xiv
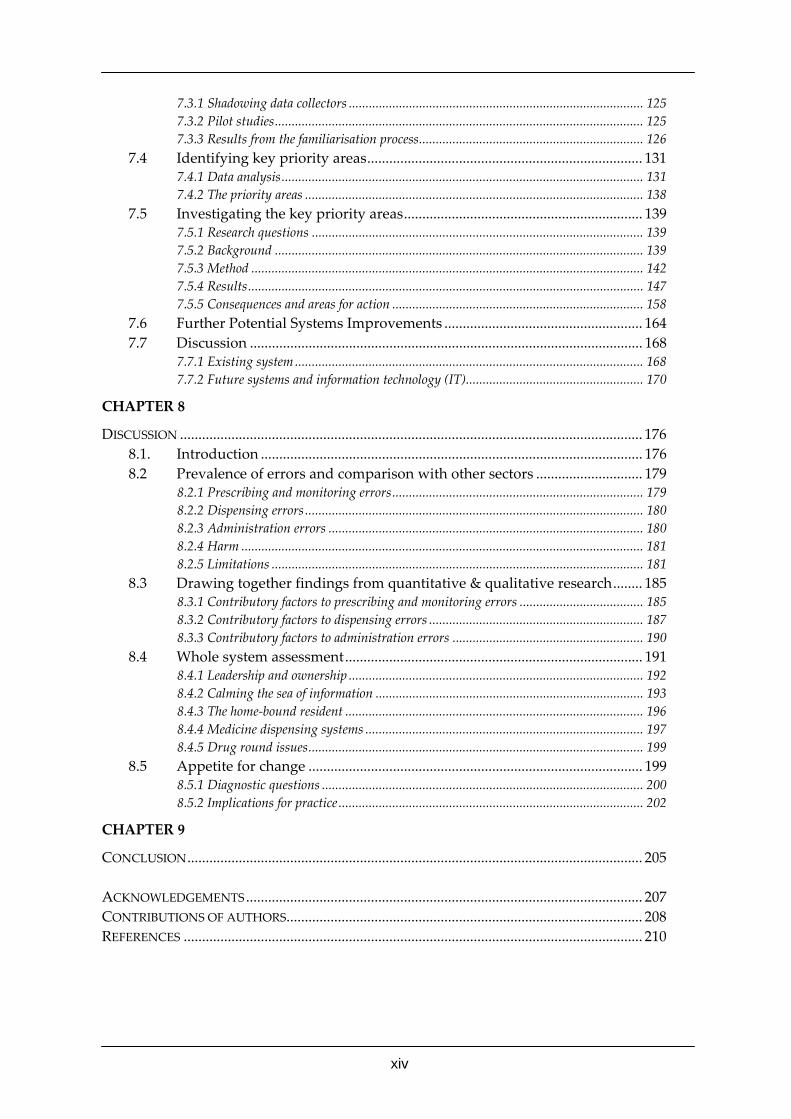
7.3.1 Shadowing data collectors ........................................................................................ 125 7.3.2 Pilot studies.............................................................................................................. 125 7.3.3 Results from the familiarisation process................................................................... 126
7.4 Identifying key priority areas........................................................................... 131 7.4.1 Data analysis............................................................................................................ 131 7.4.2 The priority areas ..................................................................................................... 138
7.5 Investigating the key priority areas................................................................. 139 7.5.1 Research questions ................................................................................................... 139 7.5.2 Background .............................................................................................................. 139 7.5.3 Method ..................................................................................................................... 142 7.5.4 Results...................................................................................................................... 147 7.5.5 Consequences and areas for action ........................................................................... 158
7.6 Further Potential Systems Improvements ...................................................... 164 7.7 Discussion ........................................................................................................... 168
7.7.1 Existing system........................................................................................................ 168 7.7.2 Future systems and information technology (IT)..................................................... 170
CHAPTER 8
DISCUSSION .............................................................................................................................. 176 8.1. Introduction ........................................................................................................ 176 8.2 Prevalence of errors and comparison with other sectors ............................. 179
8.2.1 Prescribing and monitoring errors........................................................................... 179 8.2.2 Dispensing errors..................................................................................................... 180 8.2.3 Administration errors .............................................................................................. 180 8.2.4 Harm ........................................................................................................................ 181 8.2.5 Limitations ............................................................................................................... 181
8.3 Drawing together findings from quantitative & qualitative research........ 185 8.3.1 Contributory factors to prescribing and monitoring errors ..................................... 185 8.3.2 Contributory factors to dispensing errors ................................................................ 187 8.3.3 Contributory factors to administration errors ......................................................... 190
8.4 Whole system assessment................................................................................. 191 8.4.1 Leadership and ownership ........................................................................................ 192 8.4.2 Calming the sea of information ................................................................................ 193 8.4.3 The home‐bound resident ......................................................................................... 196 8.4.4 Medicine dispensing systems ................................................................................... 197 8.4.5 Drug round issues.................................................................................................... 199
8.5 Appetite for change ........................................................................................... 199 8.5.1 Diagnostic questions ................................................................................................ 200 8.5.2 Implications for practice ........................................................................................... 202
CHAPTER 9
CONCLUSION............................................................................................................................ 205 ACKNOWLEDGEMENTS............................................................................................................ 207 CONTRIBUTIONS OF AUTHORS................................................................................................. 208 REFERENCES ............................................................................................................................. 210
xv
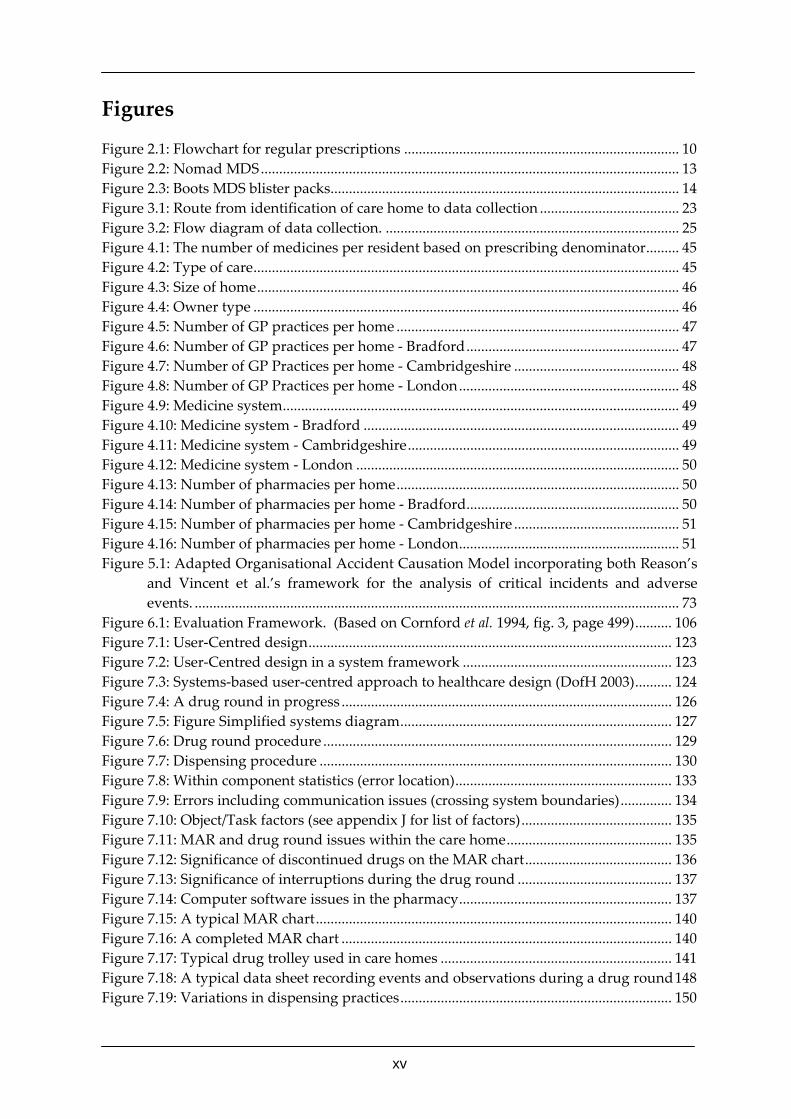
Figures
Figure 2.1: Flowchart for regular prescriptions ........................................................................... 10 Figure 2.2: Nomad MDS.................................................................................................................. 13 Figure 2.3: Boots MDS blister packs............................................................................................... 14 Figure 3.1: Route from identification of care home to data collection ...................................... 23 Figure 3.2: Flow diagram of data collection. ................................................................................ 25 Figure 4.1: The number of medicines per resident based on prescribing denominator......... 45 Figure 4.2: Type of care.................................................................................................................... 45 Figure 4.3: Size of home................................................................................................................... 46 Figure 4.4: Owner type .................................................................................................................... 46 Figure 4.5: Number of GP practices per home ............................................................................. 47 Figure 4.6: Number of GP practices per home ‐ Bradford.......................................................... 47 Figure 4.7: Number of GP Practices per home ‐ Cambridgeshire ............................................. 48 Figure 4.8: Number of GP Practices per home ‐ London............................................................ 48 Figure 4.9: Medicine system............................................................................................................ 49 Figure 4.10: Medicine system ‐ Bradford ...................................................................................... 49 Figure 4.11: Medicine system ‐ Cambridgeshire.......................................................................... 49 Figure 4.12: Medicine system ‐ London ........................................................................................ 50 Figure 4.13: Number of pharmacies per home............................................................................. 50 Figure 4.14: Number of pharmacies per home ‐ Bradford.......................................................... 50 Figure 4.15: Number of pharmacies per home ‐ Cambridgeshire ............................................. 51 Figure 4.16: Number of pharmacies per home ‐ London............................................................ 51 Figure 5.1: Adapted Organisational Accident Causation Model incorporating both Reason’s
and Vincent et al.’s framework for the analysis of critical incidents and adverse events. .................................................................................................................................... 73
Figure 6.1: Evaluation Framework. (Based on Cornford et al. 1994, fig. 3, page 499).......... 106 Figure 7.1: User‐Centred design................................................................................................... 123 Figure 7.2: User‐Centred design in a system framework ......................................................... 123 Figure 7.3: Systems‐based user‐centred approach to healthcare design (DofH 2003).......... 124 Figure 7.4: A drug round in progress .......................................................................................... 126 Figure 7.5: Figure Simplified systems diagram.......................................................................... 127 Figure 7.6: Drug round procedure ............................................................................................... 129 Figure 7.7: Dispensing procedure ................................................................................................ 130 Figure 7.8: Within component statistics (error location)........................................................... 133 Figure 7.9: Errors including communication issues (crossing system boundaries).............. 134 Figure 7.10: Object/Task factors (see appendix J for list of factors)......................................... 135 Figure 7.11: MAR and drug round issues within the care home............................................. 135 Figure 7.12: Significance of discontinued drugs on the MAR chart........................................ 136 Figure 7.13: Significance of interruptions during the drug round .......................................... 137 Figure 7.14: Computer software issues in the pharmacy.......................................................... 137 Figure 7.15: A typical MAR chart................................................................................................. 140 Figure 7.16: A completed MAR chart .......................................................................................... 140 Figure 7.17: Typical drug trolley used in care homes ............................................................... 141 Figure 7.18: A typical data sheet recording events and observations during a drug round148 Figure 7.19: Variations in dispensing practices.......................................................................... 150
xvi
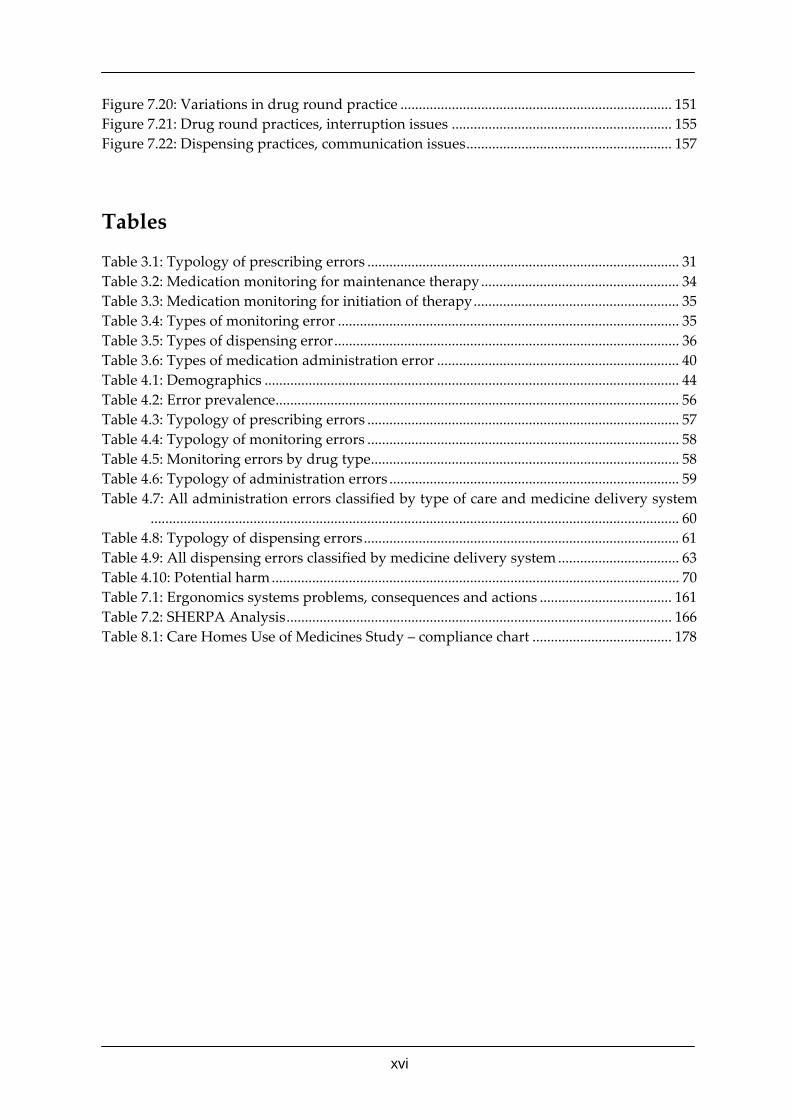
Figure 7.20: Variations in drug round practice .......................................................................... 151 Figure 7.21: Drug round practices, interruption issues ............................................................ 155 Figure 7.22: Dispensing practices, communication issues........................................................ 157
Tables
Table 3.1: Typology of prescribing errors ..................................................................................... 31 Table 3.2: Medication monitoring for maintenance therapy...................................................... 34 Table 3.3: Medication monitoring for initiation of therapy........................................................ 35 Table 3.4: Types of monitoring error ............................................................................................. 35 Table 3.5: Types of dispensing error.............................................................................................. 36 Table 3.6: Types of medication administration error .................................................................. 40 Table 4.1: Demographics ................................................................................................................. 44 Table 4.2: Error prevalence.............................................................................................................. 56 Table 4.3: Typology of prescribing errors ..................................................................................... 57 Table 4.4: Typology of monitoring errors ..................................................................................... 58 Table 4.5: Monitoring errors by drug type.................................................................................... 58 Table 4.6: Typology of administration errors ............................................................................... 59 Table 4.7: All administration errors classified by type of care and medicine delivery system
................................................................................................................................................ 60 Table 4.8: Typology of dispensing errors...................................................................................... 61 Table 4.9: All dispensing errors classified by medicine delivery system................................. 63 Table 4.10: Potential harm............................................................................................................... 70 Table 7.1: Ergonomics systems problems, consequences and actions .................................... 161 Table 7.2: SHERPA Analysis......................................................................................................... 166 Table 8.1: Care Homes Use of Medicines Study – compliance chart ...................................... 178
1
Chapter 1 Introduction
1.1 Background This study pulls together two policy streams – those of patient safety and of older people –
and links them with standards in care homes. A report documenting the extent of medical
error in the UK highlighted medication errors as a particular concern, and the government
committed to reducing such errors. 1,2 A report by the Chief Pharmaceutical Officer in 20043
included in detail the particular types of errors which can occur in the care home setting,
and noted that current GP repeat prescribing systems may make it difficult to ensure that
therapy is adequately monitored or reviewed. The specific needs of the elderly were
recognised in a National Service Framework for Older People;4 and an accompanying
report recognised the particular medication needs of older people, and the need for regular
review of therapy.5
In the field of patient safety it is likely that medication errors are the greatest cause of harm.
A systematic review found that 3.7% of hospital admissions (an admission rate similar to
that for cancer related illness), were as a result of preventable medicine‐related harm.6
Although work is emerging on the types of problems in primary care, there is little work on
error prevalence; what work there is often suffers from a poor definition of an error, and
use of methods such as spontaneous reporting, which miss the vast majority of errors.
The elderly are particularly at risk from medication errors. They have a high level of
morbidity, often with multiple health problems and hence are often prescribed several
medicines. In addition the presence of frailty, altered pharmacodynamics, changes in drug
distribution and susceptibility to renal and hepatic impairment all mean that these patients
are more susceptible to adverse drug events (ADEs). Evidence from the UK suggests that
19% of admissions of elderly people to hospital are as a result of therapeutic
misadventure.7,8
Nearly half a million older people in England live in care homes.9 These facilities house
some of the most frail, vulnerable and least visible members of our society. A survey of
2
these homes in Gloucestershire found a third of the residents were incontinent of urine or
faeces; one in five showed bouts of unconventional behaviour; 15% were chair‐fast or bed‐
fast.10 Residents in homes take significantly more medicines than those in the
community.11,12 Many residents have some degree of cognitive impairment which may
prevent them from being an actor in the detection of errors.13
The quality of care provided by homes is assessed by the Commission for Social Care
Inspection (CSCI) (previously the National Care Standards Commission [NCSC]) who
regulate and inspect care homes. Inspection is made against national minimum standards,
one of which (Standard 9) relates directly to medicines.14 In 2002/3 less than half (44%) of
the care homes currently met or exceeded its national standard for the safe handling and
administering of medicines.15 The NCSC’s report ‘The Management of Medication in Care
Services’,16 acknowledged concerns over prescribing and medicines use, and made
recommendations to improve practice. The main areas of concern were:
• wrong medication being given to residents;
• poor recording of medicines;
• inappropriate handling of medicines by unqualified staff;
• inappropriate storage of medicines.
A follow‐up report published in February 2006 found some slight improvement in overall
performance in care homes; however, this was with the exception of nursing homes.17
Nearly half of care homes for older people still did not meet the minimum medication
standard and the CSCI concluded that the failings were down to the homes themselves.
There is a wealth of research that illustrates inappropriate prescribing in nursing homes in
the UK and USA. While the largest and best studies have been conducted in the USA,18,19,20
given the different regulations, systems of care, databases, and medicines used, the results
cannot be directly compared. Few have been prospective studies of prescribing or drug
administration error. A US study of medication administration errors using direct
observation found an error rate of 22% (12% excluding “wrong time” errors) in nursing
homes.19 In the UK there is a body of literature expressing concern about prescribing in
care homes, however it is framed as ‘inappropriate’ prescribing, rather than prescribing
3
error.21 Although errors are a sub‐set of inappropriateness, we do not know the extent to
which the two literatures overlap. In addition, used alone, medication appropriateness
scales can produce many false judgements that prescribing is inappropriate, while missing
prescribing errors.22,23 Nevertheless, studies of prescribing in UK homes suggest
inappropriate prescribing occurs in between 50 and 90% of patients.11,24,25
In addition to the evidence of inappropriate prescribing in this vulnerable population, the
potential for error is increased due to the complex nature of the medicines management
systems in care homes, for example, many residents receive clinical intervention from
multiple sources; medicines may be dispensed from multiple sites; and medicines may be
dispensed in several formats with the use of monitored dosage systems (MDS) being
common. The processes for prescribing, ordering, dispensing, administering and recording
medicines vary between different homes, GP practices and pharmacies. Understanding the
medicines management systems and their variations is crucial when investigating errors
and, therefore, a detailed description of the systems in use in the care home setting is
presented in Chapter 2.
1.2 The challenges of measuring medication errors in care homes In the previous section we established that medication errors are a significant problem for
the elderly, and that studies of residents in care homes supported this. However the picture
of medication errors in care homes is very incomplete, particularly in the UK. In this
section we illustrate some of the challenges to be overcome in measuring the extent of
errors, and understanding why they happen. We explain the problems and give some
indication of the ways we tried to overcome them.
Conducting research in the care home setting is extremely complex with significant barriers
to recruitment and data collection to be overcome.26 For this study we needed the co‐
operation of the care home and the consent of all of the following
• individual care home staff
• GPs
• community pharmacists and
4
• residents (or assent).
The recruitment of care homes themselves can be difficult. There is great variation between
homes in their management style and their autonomy, quite often reflecting their
ownership. Some are independent and owner‐run, others are owned by local authorities,
others by voluntary organisations or charities, and many by large national public or private
companies. Furthermore, this study could have been seen to be particularly threatening to
the care homes.
Obtaining consent from vulnerable older adults is a complex and time‐consuming process.
Due to the high levels of cognitive impairment in this population, many residents are
unable to give informed consent and, therefore, assent is sought from next of kin.
As stated above, there is wide variation in medicine management systems in care homes
and this can make data collection problematic. There is a lack of uniformity of recording
health and medicine‐related information in care homes, both in terms of what is recorded
and where the data are held. Consequently, multiple data sources need to be accessed and
the mode of collection needs to be flexible in order to account for this variation.
1.3 Types of medication error Four main types of medication error can occur:
• prescribing
• monitoring (e.g. biochemical monitoring of therapy)
• dispensing
• administration (i.e. the administration or taking of the medicine incorrectly).
Multiple methodologies and a multidisciplinary approach have been taken in this study to
investigate such errors in the care home setting. The methodology and methods used in
previous studies of medication error in secondary care were adapted for the care home
context. Where no current methods exist, these were developed and validated as
appropriate.
5
Five main features of medication error were studied:
• prevalence;
• nature (typology);
• potential harm;
• causes; and
• potential solutions.
Data on these features were collected simultaneously; however, because of the different
methodologies and methods employed, they are presented in separate chapters to aid the
reader.
The prevalence, nature and potential harm of error were determined using quantitative
methods adapted from previous studies in secondary care and are presented in Chapters 3
and 4. The causes of error were investigated using qualitative methods and by applying
human error theory27,28 in Chapters 5 and 6. The question of how an error occurred is
addressed using Reason’s Generic Error Modelling System28 and Reason’s Organisational
Accident Model.28 The question of why an error occurred uses Vincent et al’s framework for
analysing risk and safety in clinical practice.29 In addition, the technology of monitored
dosage systems was investigated using an approach informed by a socio‐technical
perspective using Cornford’s framework.30 We will use these findings to gain
understanding of the underlying causes of errors and hence possible solutions.
Potential solutions were also developed by applying ergonomic methods to understand the
medicines management system and design factors that contribute to errors (Chapter 7). A
systems‐based user‐centred approach to healthcare design was used, as documented in the
‘Design for Patient Safety’ report published in 2003 by the Department of Health.31
Methods such as focus groups, semi‐structured interviews and observation were used to
ensure users of medicines were involved when generating solutions.
In the final chapters, the findings from the component studies are brought together and
discussed with regards to the implications for policy, practice and future research.
6
In summary, the prevalence, nature, causes and potential harm of medication error in the
UK care home setting is unknown. Identifying and understanding these aspects of
medication error will lead to the generation of potential solutions.
1.4 Aims and Objectives The aims and objectives of the project were proposed as:
1.4.1 Aims
• To establish the prevalence, types and underlying causes of medication errors, and the
ensuing harm
• To develop solutions to reduce the prevalence of error
1.4.2 Objectives
1. To investigate the prevalence of different types of medication error (prescribing,
monitoring, administration, dispensing) with sufficient precision to:
a) indicate their relative frequency
b) identify the areas of greatest concern
c) allow sample size calculations for further intervention studies.
2. To provide a typology of the errors.
3. To
a) identify the proportion of patients who:
i. have suffered an error of any kind,
ii. have been harmed by the errors,
iii. could have been harmed by the errors, had intervention not taken place
b) compare different methodologies for assessing harm as a result of the error.
4. To understand the underlying causes of errors.
5. To apply the principles of ergonomics to:
a) Analyse existing systems
b) Understand and map the medication pathway.

7
c) Understand and map the information pathways.
d) Generate, evaluate and prioritise solutions.
8
Chapter 2 The medicines management system in care homes
2.1 Introduction Care homes vary widely in their nature. They range from small homes providing
residential (personal) care only, to large establishments with residential and nursing care
provided on different floors or in separate units. They may be privately owned, part of a
chain, or belong to a voluntary organisation or local authority. The job titles, training,
qualifications (if any), skills and responsibilities of staff working in the homes vary. All of
these factors influence the way medicines are managed and there is no single prevalent
model. Regulations and guidelines relating to medicines management in care homes have
been produced by the Commission for Social Care Inspection (CSCI) and the Royal
Pharmaceutical Society of Great Britain (RPSGB).
Although these are generally based on accepted best practice, the extent of the evidence
base for their guidance is variable. They are listed below:
• CSCI:
o Handled with care: managing medication for residents of care homes32
o Professional advice: Medicines administration records (MAR) in care homes and
domiciliary care33
o Professional advice: Administration of medicines in care homes34
o Professional advice: Training care workers to safely administer medicines in care
homes35
• RPSGB:
o Practice Guidance: Advisory services to care homes36
o Practice Guidance for the provision of printed medication administration record
charts (MAR) by community pharmacists37
o The handling of medicines in social care38
9
o Fitness to Practice & Legal Affairs Directorate Fact Sheet 6. Monitored dosage
systems and compliance aids39
2.2 Key components of the medicines management system The key components of the process are:
• Ordering
• Prescribing
• Dispensing and supply
• Storage
• Administration of medicine to resident
• Monitoring of effect of medicines
A component running through each of these 6 aspects is the relevant documentation.
All aspects can vary. For example, homes do not all keep the same type of records, they
may use different terms for ‘records’, and keep them in different places in the home.
This chapter will help with an understanding of these various processes. A flow chart
depicting the processes relating to ‘Regular’ prescriptions, is shown in Figure 2.1
2.2.1 Prescribing
To allow for patient choice, and because many doctors may be reluctant to register large
numbers of care home residents (because of the workload they represent ‐ see Section 2.3),
many care homes have more than one general practice responsible for its residents. Most
(but not all) care homes have a relationship with a single pharmacy for dispensing repeat
(long‐term) prescriptions (called ‘repeats’ in this report). Because most residents take
several long ‐term medicines (Zermansky et al12 found the mean number was 7), there is
generally an arrangement with the GPs to provide repeat prescriptions every 28 days.
GP computer records have a repeat medication file which lists all current authorised
repeats, and the prescriptions are prepared by receptionists at the practice for the doctor to
sign.40 The process involves the receptionist identifying each drug requested by the home,
10
and then printing off the prescription forms. The only constraints on the receptionists are
that the drug needs to have been “authorised” on the computer system by a doctor as a
repeat, and that the patient’s review interval (set on the computer system) has not been
passed. It is therefore predicated on the prescriber(s) having authorised each item
accurately, since there is generally no detailed check by the doctor who actually signs the
prescription. It also requires that the GP computer system reflects accurately any change in
medication that has been authorised or started by other prescribers outside the practice,
who might include hospital departments, visiting psychiatrists, out‐of‐hours doctors. It
should be noted that the system described above applies equally for people living in their
own homes as for those in care homes.
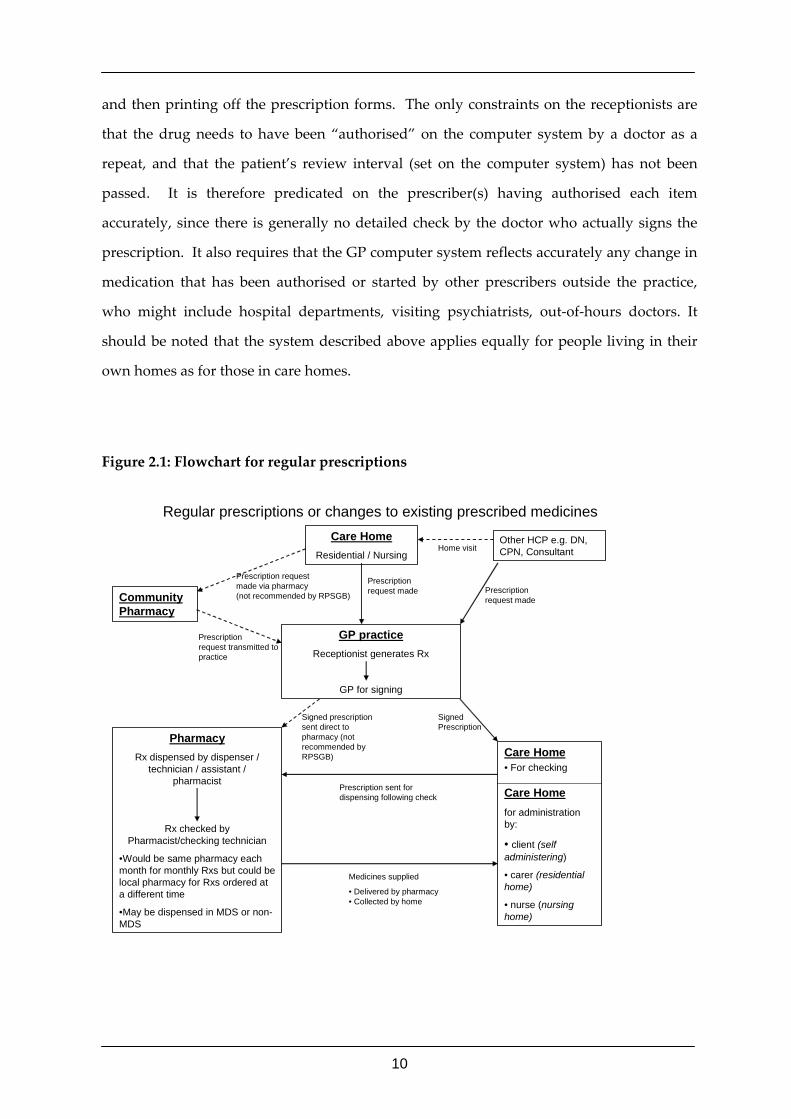
Figure 2.1: Flowchart for regular prescriptions
Regular prescriptions or changes to existing prescribed medicines
Care HomeResidential / Nursing
Other HCP e.g. DN, CPN, Consultant
Community Pharmacy
GP practiceReceptionist generates Rx
GP for signing
PharmacyRx dispensed by dispenser /
technician / assistant /pharmacist
Rx checked by Pharmacist/checking technician
•Would be same pharmacy each month for monthly Rxs but could be local pharmacy for Rxs ordered at a different time
•May be dispensed in MDS or non-MDS
Care Home• For checking
Care Homefor administration by:
• client (self administering)
• carer (residential home)
• nurse (nursing home)
Prescription request made
Prescription request made
Prescription request made via pharmacy(not recommended by RPSGB)
Prescriptionrequest transmitted to practice
Signed prescription sent direct to pharmacy (not recommended by RPSGB)
Signed Prescription
Prescription sent for dispensing following check
Medicines supplied
• Delivered by pharmacy• Collected by home
Home visit
11
2.2.2 Ordering
Requests for repeats are generally made by the care homes, though in some instances the
pharmacist makes the requests (this is not recommended in the RPSGB guidance).
Unfortunately pharmacists do not have access to GP computer records, and so their records
of patients’ current medication may not match those of the general practice. This is
especially true of medicines discontinued or in which there has been a change in frequency
of administration. Whilst medicines that are started are inevitably prescribed on a
prescription form that reaches the pharmacy, there is no such document as an
“unprescription”, so the pharmacy may not be aware of medicines that are stopped, even
those that have been stopped because of an adverse drug event. They must rely on the care
home informing them of such changes.
Repeat prescriptions are ordered in a number of ways:
• The Home orders the medicines direct from GP practice using the repeat slip (the
‘Right Hand Side’ of the prescription form – see 2.2.4 for explanation)
• The Home orders the medicines direct from GP practice using the MAR (Medication
Administration Record) sheets (See also 2.2.4)
• Pharmacy orders from the GP practice after visiting/consulting with the home
• Pharmacy orders from GP practice without contacting the home
2.2.3 Dispensing & supply
Homes usually use one pharmacy, although some will use one pharmacy for their monthly
repeat prescriptions and another more local one for acute/interim prescriptions.
The medicines are dispensed in one of two ways. Some pharmacists dispense in the
traditional way in individual packs, labelled with the recipient’s name and the dosage
details. Others dispense into monitored dosage systems (MDS)(see below for description). It
depends on the wishes of the care home manager or owner, and whether their local
community pharmacy offers an MDS service. Even if a home is using an MDS, it may still
receive any interim medication as non‐MDS in individual medicine bottles or packs ‐ this
will depend on the pharmacy it uses. MDS are discussed in detail below.
12
Dispensed medicines usually reach the home as follows:
• Pharmacist delivers personally
• Someone else from the pharmacy delivers
• Home staff collect from pharmacy
If there is an addition to a resident’s medication (between the monthly supply of existing
medicines):
• Home faxes script to usual pharmacy
• GP contacts usual pharmacy with script
• Request telephoned to usual pharmacy
• Prescription taken to nearest pharmacy
Monitored Dosage Systems (MDS)
The monitored dosage system or MDS is an approach to medicines dispensing and
administration designed to eliminate the need for the carer to determine which tablets to
administer at each dosage time during the day. They take the form of an oblong tray with a
grid of suitably sized depressions in its surface, each to contain one or more doses of
treatment for a particular time, and each sealable in the pharmacy. The grid is marked with
the days of the week and times of day, and each patient has one or more trays labelled with
their identification, which may also include a photograph. The original Monitored Dosage
System (MDS) was developed in 1975 in the US to reduce the time taken to give
medications in nursing homes by packaging them into blister cards.41 In 1981 the Scottish
Health Service Planning Council published a wide ranging report on pharmaceutical
services for the elderly and recommended the use of MDS in residential homes.42 In the
United Kingdom MDS first appeared in 1989, when Boots launched its Canadian‐developed
Manrex system, which was later renamed “Boots MDS”. In 1995 over 60 percent of care
homes in the UK used some form of MDS.41
MDS were intended to simplify the drug round for the home and to simplify the
administration process for untrained staff. Instead of selecting the tablets to be given from a
13
resident’s individual medicine bottle or box, after checking the drug chart, the carer only
needs to check the identity of the resident and give the tablets in the dispensing tray that
relates to the date and time of the dosage. The systems are designed to be filled in a
pharmacy by trained staff, then checked by the pharmacist, and labelled with patient and
medication details. Once sealed in the pharmacy, the doses should remain in the MDS until
they are administered to the patient.
Monitored dosage systems can vary:
• Number of days supply can be 28 days, 7 days or one calendar month
• Cassette MDS: multi‐dose i.e. several different medications can be in one
compartment e.g. Nomad ®, Dosett® , some Venalink®
• Blister MDS: single‐dose i.e. only one dose of medication per compartment e.g.
Manrex® , Pilpack® , some Venalink ®
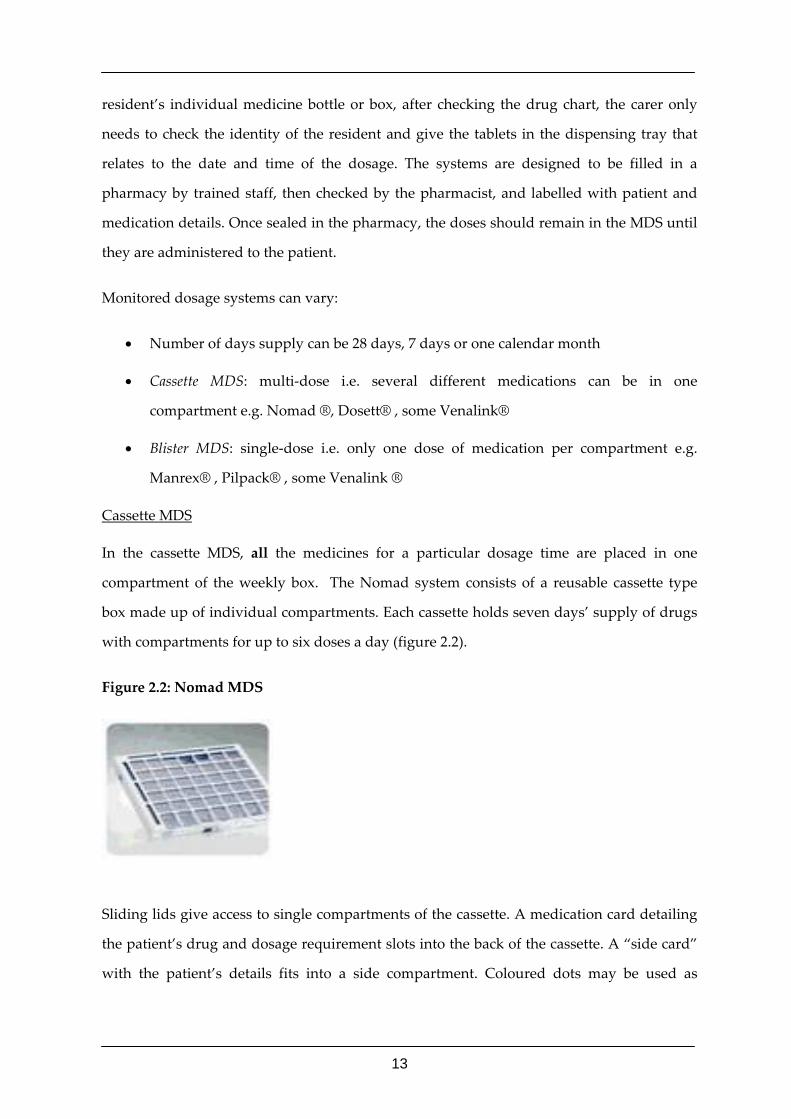
Cassette MDS
In the cassette MDS, all the medicines for a particular dosage time are placed in one
compartment of the weekly box. The Nomad system consists of a reusable cassette type
box made up of individual compartments. Each cassette holds seven days’ supply of drugs
with compartments for up to six doses a day (figure 2.2).
Figure 2.2: Nomad MDS
Sliding lids give access to single compartments of the cassette. A medication card detailing
the patient’s drug and dosage requirement slots into the back of the cassette. A “side card”
with the patient’s details fits into a side compartment. Coloured dots may be used as
14
reminders for additional medications, such as liquids and “as needed” medications, which
are not contained in the cassette.
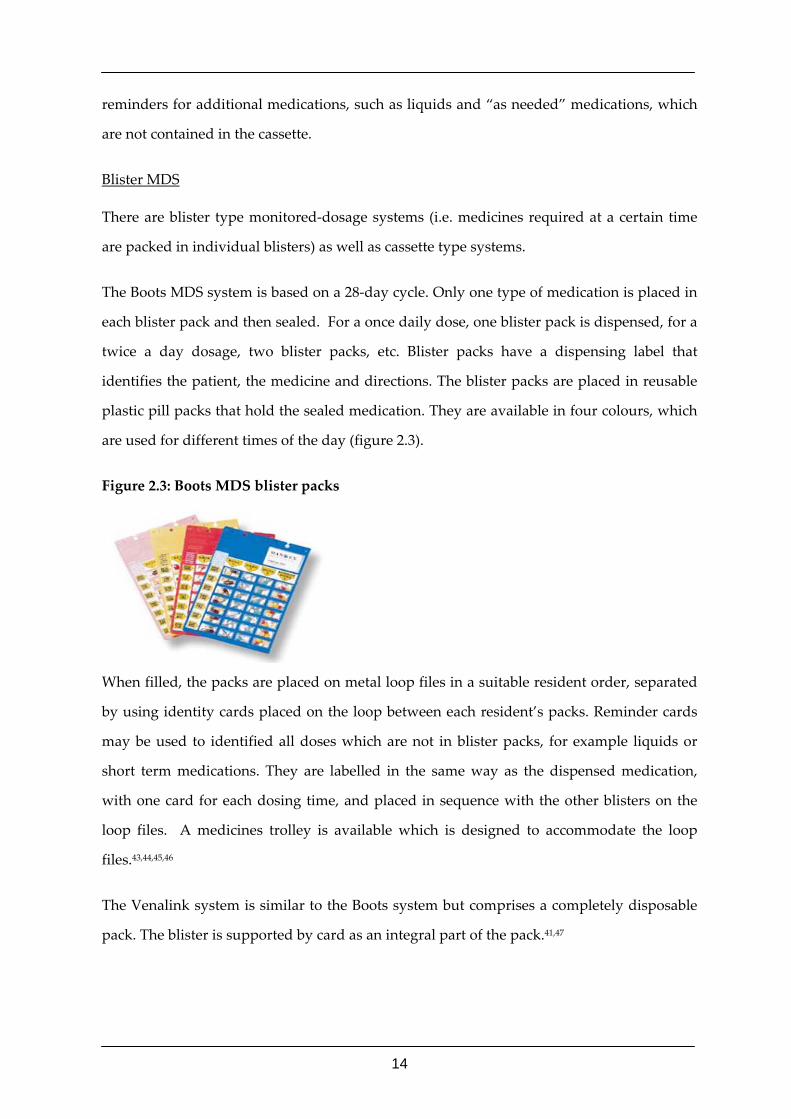
Blister MDS
There are blister type monitored‐dosage systems (i.e. medicines required at a certain time
are packed in individual blisters) as well as cassette type systems.
The Boots MDS system is based on a 28‐day cycle. Only one type of medication is placed in
each blister pack and then sealed. For a once daily dose, one blister pack is dispensed, for a
twice a day dosage, two blister packs, etc. Blister packs have a dispensing label that
identifies the patient, the medicine and directions. The blister packs are placed in reusable
plastic pill packs that hold the sealed medication. They are available in four colours, which
are used for different times of the day (figure 2.3).
Figure 2.3: Boots MDS blister packs
When filled, the packs are placed on metal loop files in a suitable resident order, separated
by using identity cards placed on the loop between each resident’s packs. Reminder cards
may be used to identified all doses which are not in blister packs, for example liquids or
short term medications. They are labelled in the same way as the dispensed medication,
with one card for each dosing time, and placed in sequence with the other blisters on the
loop files. A medicines trolley is available which is designed to accommodate the loop
files.43,44,45,46
The Venalink system is similar to the Boots system but comprises a completely disposable
pack. The blister is supported by card as an integral part of the pack.41,47
15
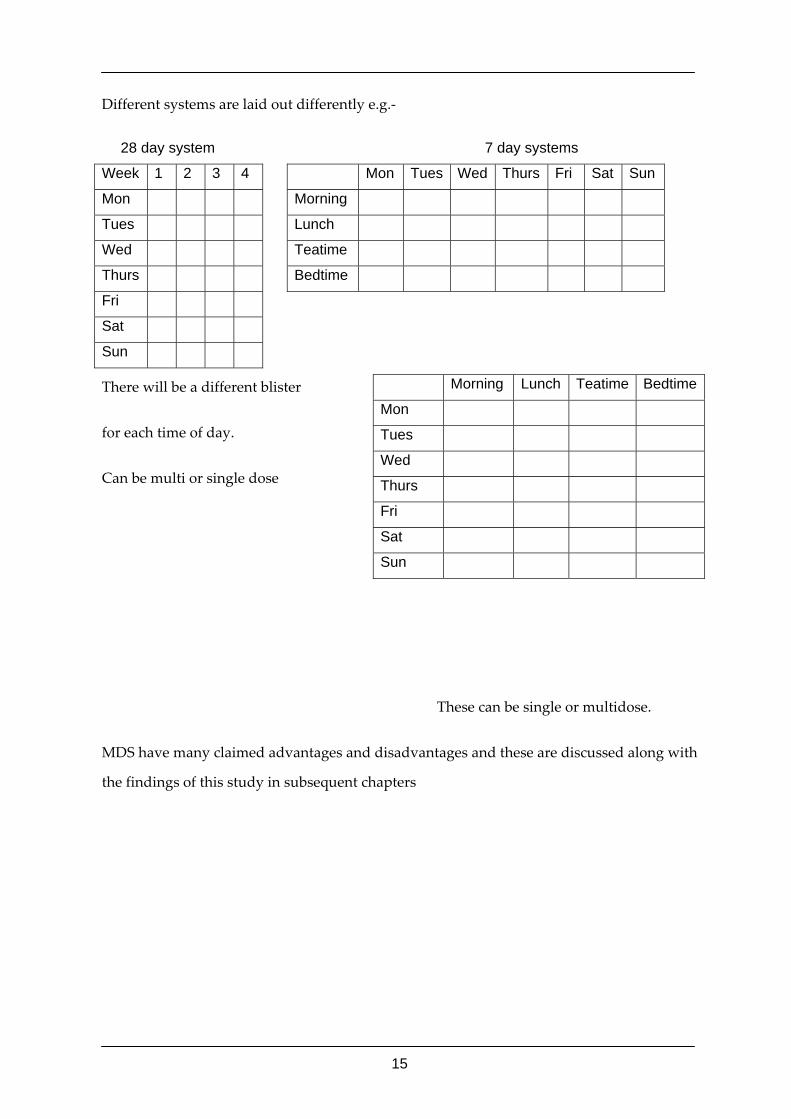
Different systems are laid out differently e.g.‐
28 day system 7 day systems
Week 1 2 3 4 Mon Tues Wed Thurs Fri Sat Sun
Mon Morning
Tues Lunch
Wed Teatime
Thurs Bedtime
Fri
Sat
Sun
There will be a different blister
for each time of day.
Can be multi or single dose
These can be single or multidose.
MDS have many claimed advantages and disadvantages and these are discussed along with
the findings of this study in subsequent chapters
Morning Lunch Teatime Bedtime
Mon
Tues
Wed
Thurs
Fri
Sat
Sun
16
2.2.4 Documentation
Medication Administration Records (MARs):
The principal record used in care homes which documents residents’ medicines information
is the Medication Administration Record or MAR. They are usually referred to as a ‘MAR
chart’ and they contain a list of the medicines administered to residents, which identifies
the appropriate medicines for the person giving them and allow them to record that
administration. A chart usually relates to a 28 day cycle for one resident. Once one chart is
completed, a new chart is produced for the next cycle. MAR charts are usually produced in
the pharmacy, when dispensing takes place into both casssette and blister MDS. However,
some homes prefer to use pre‐printed charts and hand‐writing each one individually.
The MAR chart is produced in triplicate in the Boots and Manrex systems (others may be in
duplicate or only on a single sheet). The top copy serves as the medication record in the
home, while the other copies are used for medication review and re‐ordering. They are a
fundamental part of the MDS and serve several important functions.41 As well as recording
the identity of each medication the resident is taking, they also enable the carer to record
each tablet given (or not given) in a readily visible way. They reduce the time spent by
home staff manually writing drug administration charts each month, reduce the potential
for transcription errors normally associated with handwritten documents and are an
important source of information when conducting medication reviews. The MAR sheet
provides an audit trail of all medicines administered to residents as well as what
medications are received by, or returned to, the pharmacy.41,48
There is RPSGB guidance relating to the provision of printed MAR charts for use by
community pharmacists.37 These acknowledge that MAR charts are official records. It also
says that care workers are highly dependent on the content and accuracy of printed MAR
charts. However, the MAR chart is not “the prescription”. MAR charts are purely records of
administration and do not act as a medication order as would occur in a hospital drug
chart. However, they play a pivotal role in the way medicines are managed in care homes.
17
• MARs may be computer generated by the community pharmacy, or can be
handwritten at the home by staff (copied from the dispensing label not the previous
MAR) or in some cases by the GP.
• MARs come in different formats but essentially the contents are the same.
• MARs most commonly last for 28 days, but can cover one calendar month or can be
on‐going for up to 3 months or occasionally even longer.
The MAR often doubles as a medication profile i.e. somewhere where all the medication
that the resident is on is recorded. For example, it should include medication that is self‐
administered or is administered by District Nurse, Community Psychiatric Nurses or GP,
but it sometimes doesn’t. However, there is sometimes a separate medication profile, as
well as other records of medication being administered or taken elsewhere.
When changes occur mid‐cycle these would be recorded on the MAR chart, and if
medicines are changed close to the end of the cycle, after the request has been put in for the
repeats, it is possible that the change may not be carried forward. The home must keep
MARs for at least 3 years, but sometimes they are not easily located. They could be rolled
up and put in a box to await sorting with many other previous MARs, or kept in with the
resident’s clinical or care history.
Repeat prescriptions for residents are usually produced by the GP practice computer. The
Right Hand Side (RHS) of the FP10 prescription may be kept as a record. It consists of a
tear‐off slip on which is printed a complete list of the patient’s repeat medication, with a
tick box next to each item for re‐ordering.
GP clinical record
The GP clinical record is now always computer based, though some practices may still use
paper‐based notes for some information. Because residents are inevitably seen away from
the practice, practices often print out summaries for doctors to take on visits. The doctors
should then subsequently write up their notes on computer when they return to base. A
few homes have a computer link to residents’ clinical records at the practice so
prescriptions may be generated in the home and signed by the GP during a visit.
18
Occasionally the pharmacy may have a computer terminal from which all the prescriptions
are generated.
The records in the home may be kept in different places e.g. communication book, repeat
prescription request slips/book, care plans, clinical records, admission information. The
clinical records may be locked away in the home and sometimes only the GP has a key.
• In the GP surgery records may be entirely on computer or partly in paper. Some GPs
may only record repeat prescriptions on the computer, using hard copy
prescriptions on a pad (called ‘FP10s’) for all acute medication and associated
medical notes; this may be in Lloyd George envelopes at the surgery or at the care
home or both.
Other documentation
There is a variety of other types of documentation relevant to the use of medicines in a care
home. There may be:
• Admissions information
• Hospital discharge letters
• Treatment Advice Notes from out‐patients
• Patient/client profiles
• Care records/nursing notes
• Shared care records (eg anticoagulant book)
Different homes use different terminology for these records and they vary in how much
information is stored in them
All homes have to keep a daily log of care. This may just refer to personal care but can also
include relevant medical information. It should include reference to sleep and bowel
activity where relevant, and this may be pertinent to the medication review. Different
floors/units in the same care home may have different ways of storing information and can
also use different systems for ordering, administering etc.
19
2.2.5 Administration & storage
Drugs are administered by trained care staff in residential homes and by registered nurses
in nursing homes. The method varies from home to home, though most have a drug trolley
and conduct a drug round at the appropriate intervals through the day. There are usually 3‐
4 drug rounds per day, although residents are most likely to have medicines given at the
morning and teatime drug rounds.
Each dose of each drug administered is generally recorded by the carer on the MAR chart. If
a dose is not given for any reason (eg not required, patient asleep, patient refused etc) a
code for the reason is recorded on the chart.
The drug round will generally be conducted by one member of the care staff, and can take
from 30 minutes to 2 hours or more. It often coincides with residents’ meal times, so that
some residents can have their medicines together in the dining room. However, some will
remain in their rooms where staff will visit them. Some homes have a ‘drug room’ instead
of a trolley.
2.2.6 Monitoring and Review
It is always important to review patients and their medicines at intervals, because the
medication regimen that is entirely appropriate now may be less appropriate as a result of
change in the patient’s physical and mental condition. Indeed the National Service
Framework for Care of the Elderly recommends that patients over 75 (and most care home
residents will fall into this age group) should have their medicines reviewed every six
months.4 It is important to review the medicines in the context of the patient’s medical
condition. In addition, some medicines need to have specific monitoring to check on
efficacy and identify adverse effects. Examples are the monitoring of blood pressure in
patients with hypertension, measuring thyroid function in patients on levothyroxine,
checking renal function in patients taking ACE inhibitors, checking INR in patients on
warfarin. Evaluating medication review generally was outside the scope of this study, and
has been reported elsewhere,26 but ensuring the monitoring of drugs with a risk profile
cannot and should not be separated from the process of drug prescribing. The institution of
20
a failsafe mechanism to ensure it takes place should be a vital part of the system, and is
properly the responsibility of the prescriber (i.e. the general practitioner)
2.3 Visits by GPs and pharmacists to the homes Care home patients present a major workload issue for general practitioners. They are frail,
sick, vulnerable and often unable to be advocates for their own health needs because of
mental infirmity and institutional dependency. Their care needs may be greater than those
of many older patients in their own homes, and virtually all their care needs to take place
on‐site. Furthermore, each attendance can be prolonged because the resident is slow
moving and may present communication difficulties because of speech, hearing and/or
mental impairment.
In addition, record keeping is problematic because of the need to ensure that changes in
treatment are recorded on the patient’s computer file “back at base”. Many (but not all)
practices allocate one doctor as the responsible doctor for each home, and some make
regular scheduled visits to ensure continuity and availability. On the other hand no‐one
works every day, and residents are seen by out‐of‐hours doctors and visiting specialists, so
maintaining concordance of drug records can be difficult.
Communication with community pharmacists is generally only by prescription, and
pharmacists are therefore limited in what they know about indications for and risks of
treatment. There is probably scope for devising protocols of medicines management that
ensure consistency of drug records between home, pharmacy and general practitioner
records.
21
Chapter 3 Methods for Quantitative Arm
3.1 Overview This chapter presents a description of the recruitment of care homes and GP practices, and
the consent or assent of residents. It describes how the research nurse and research
pharmacists who, following training:
• Collected ‘demographic’ data for each home and their systems for ordering,
prescribing and administering medicines
• Reviewed any relevant records at the care home, the pharmacy and at the GP
surgery
• Selected and undertook a clinical medication review of three or more consented or
assented residents in each home
• Observed at least one set of drug administrations (preferably two) to those residents
• Made a visual check of whether the medicines were dispensed correctly
This is then followed by a detailed description of data collection and synthesis.
The methods for the Qualitative arm of the study are given in Chapter 5 (Section 5.2) and
the Ergonomics arm in Chapter 7 (Sections 7.3 and 7.3.3)
3.2 Ethics and Research Governance Research Ethics approval was obtained from the Central Office for Research Ethics
Committees. Research Governance approval was obtained from participating Primary Care
Trusts (PCTs). Criminal Records Bureau clearance was also obtained for the researchers
working in the homes.
3.3 Sample Size The sample size was calculated to provide sufficient precision to allow a meaningful
estimate of the prevalence of medication errors, and to provide future researchers with
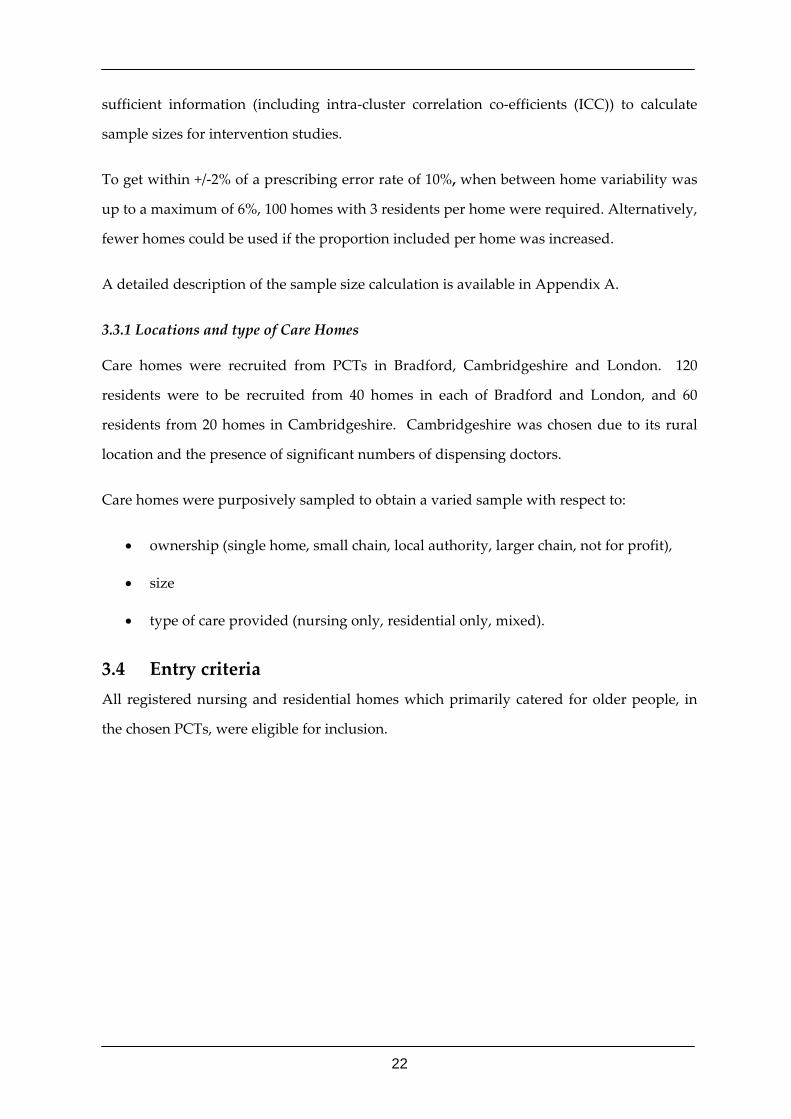
22
sufficient information (including intra‐cluster correlation co‐efficients (ICC)) to calculate
sample sizes for intervention studies.
To get within +/‐2% of a prescribing error rate of 10%, when between home variability was
up to a maximum of 6%, 100 homes with 3 residents per home were required. Alternatively,
fewer homes could be used if the proportion included per home was increased.
A detailed description of the sample size calculation is available in Appendix A.
3.3.1 Locations and type of Care Homes
Care homes were recruited from PCTs in Bradford, Cambridgeshire and London. 120
residents were to be recruited from 40 homes in each of Bradford and London, and 60
residents from 20 homes in Cambridgeshire. Cambridgeshire was chosen due to its rural
location and the presence of significant numbers of dispensing doctors.
Care homes were purposively sampled to obtain a varied sample with respect to:
• ownership (single home, small chain, local authority, larger chain, not for profit),
• size
• type of care provided (nursing only, residential only, mixed).
3.4 Entry criteria All registered nursing and residential homes which primarily catered for older people, in
the chosen PCTs, were eligible for inclusion.
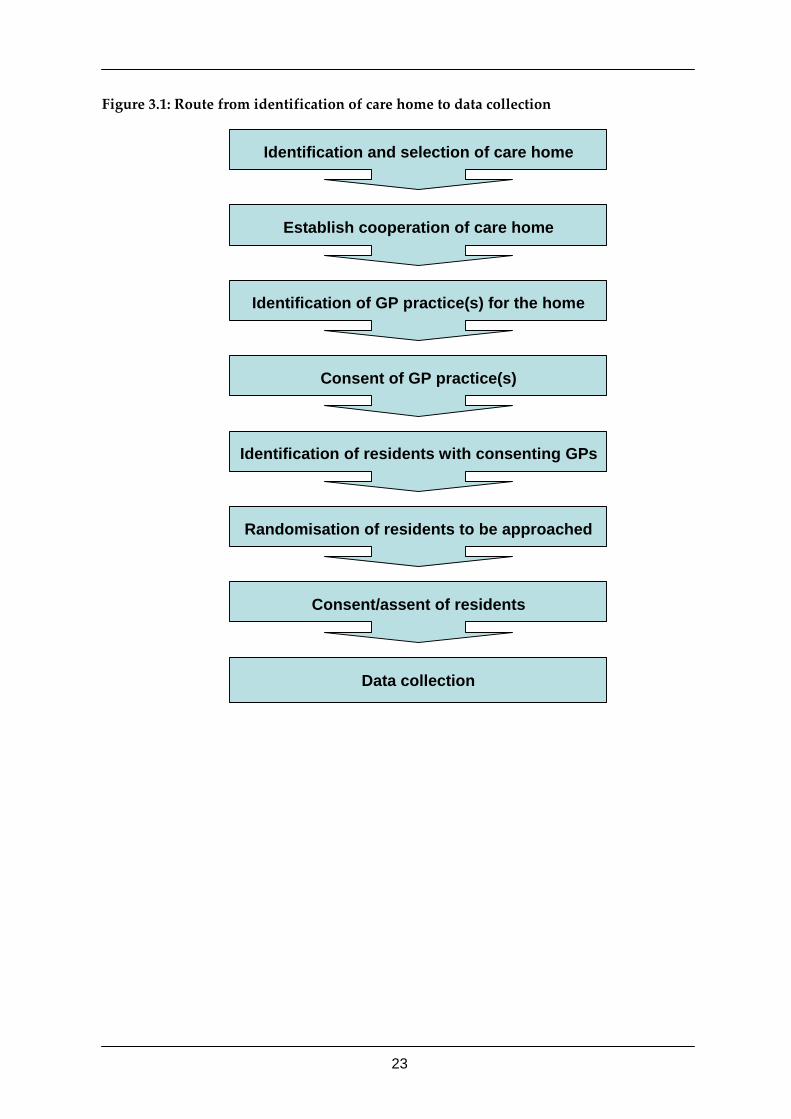
23
Figure 3.1: Route from identification of care home to data collection
Identification and selection of care home
Establish cooperation of care home
Identification of GP practice(s) for the home
Consent of GP practice(s)
Identification of residents with consenting GPs
Randomisation of residents to be approached
Consent/assent of residents
Data collection
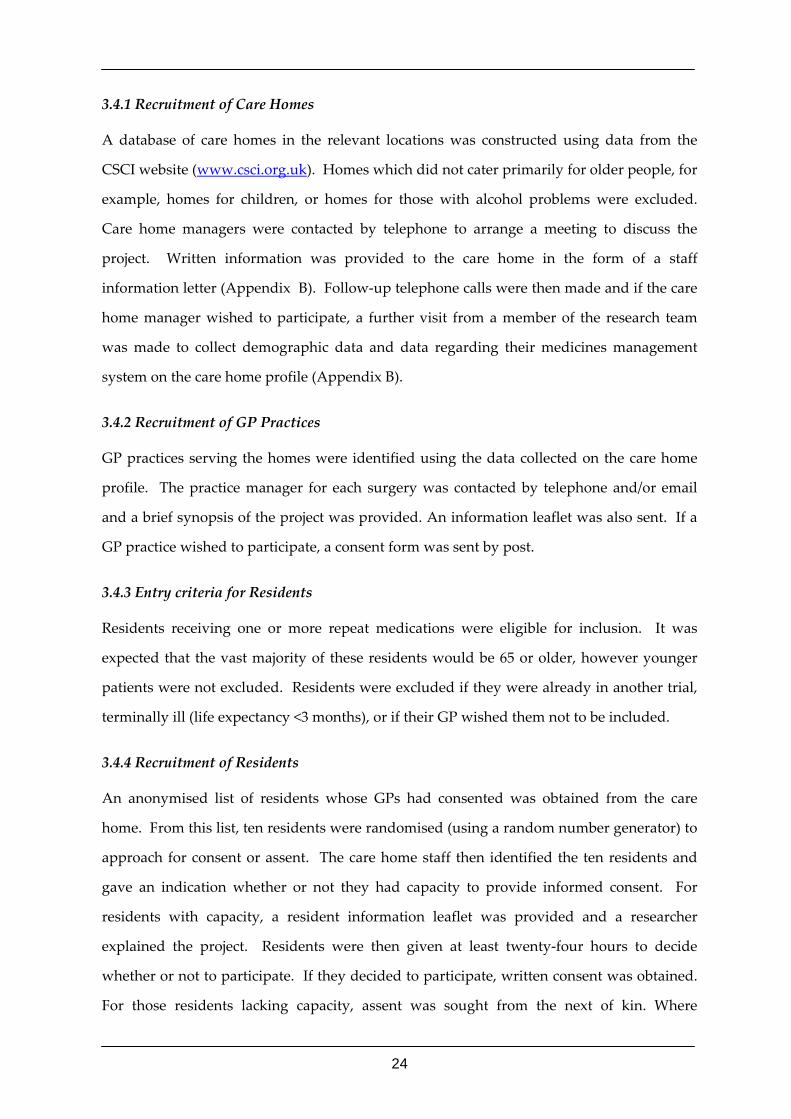
24
3.4.1 Recruitment of Care Homes
A database of care homes in the relevant locations was constructed using data from the
CSCI website (www.csci.org.uk). Homes which did not cater primarily for older people, for
example, homes for children, or homes for those with alcohol problems were excluded.
Care home managers were contacted by telephone to arrange a meeting to discuss the
project. Written information was provided to the care home in the form of a staff
information letter (Appendix B). Follow‐up telephone calls were then made and if the care
home manager wished to participate, a further visit from a member of the research team
was made to collect demographic data and data regarding their medicines management
system on the care home profile (Appendix B).
3.4.2 Recruitment of GP Practices
GP practices serving the homes were identified using the data collected on the care home
profile. The practice manager for each surgery was contacted by telephone and/or email
and a brief synopsis of the project was provided. An information leaflet was also sent. If a
GP practice wished to participate, a consent form was sent by post.
3.4.3 Entry criteria for Residents
Residents receiving one or more repeat medications were eligible for inclusion. It was
expected that the vast majority of these residents would be 65 or older, however younger
patients were not excluded. Residents were excluded if they were already in another trial,
terminally ill (life expectancy <3 months), or if their GP wished them not to be included.
3.4.4 Recruitment of Residents
An anonymised list of residents whose GPs had consented was obtained from the care
home. From this list, ten residents were randomised (using a random number generator) to
approach for consent or assent. The care home staff then identified the ten residents and
gave an indication whether or not they had capacity to provide informed consent. For
residents with capacity, a resident information leaflet was provided and a researcher
explained the project. Residents were then given at least twenty‐four hours to decide
whether or not to participate. If they decided to participate, written consent was obtained.
For those residents lacking capacity, assent was sought from the next of kin. Where
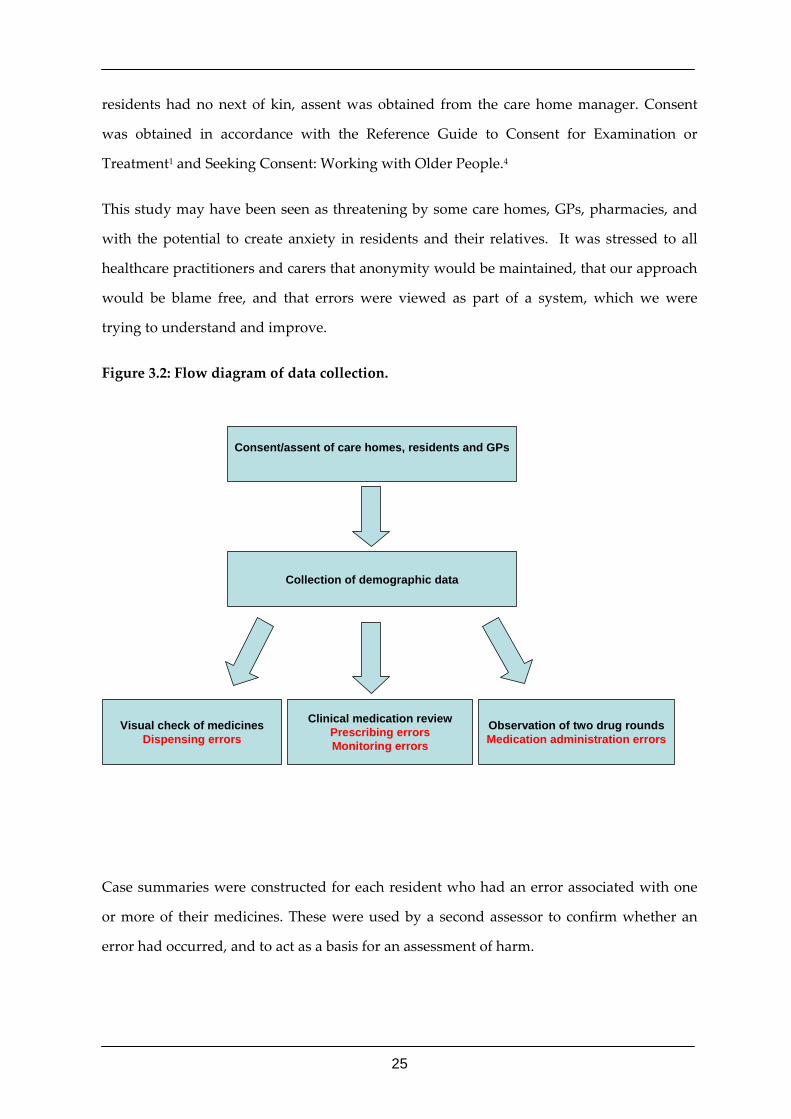
25
residents had no next of kin, assent was obtained from the care home manager. Consent
was obtained in accordance with the Reference Guide to Consent for Examination or
Treatment1 and Seeking Consent: Working with Older People.4
This study may have been seen as threatening by some care homes, GPs, pharmacies, and
with the potential to create anxiety in residents and their relatives. It was stressed to all
healthcare practitioners and carers that anonymity would be maintained, that our approach
would be blame free, and that errors were viewed as part of a system, which we were
trying to understand and improve.
Figure 3.2: Flow diagram of data collection.
Case summaries were constructed for each resident who had an error associated with one
or more of their medicines. These were used by a second assessor to confirm whether an
error had occurred, and to act as a basis for an assessment of harm.
Visual check of medicinesDispensing errors
Clinical medication reviewPrescribing errorsMonitoring errors
Observation of two drug roundsMedication administration errors
Collection of demographic data
Consent/assent of care homes, residents and GPs
26
In addition, a broadly ethnographic approach including a mixture of observation,
interviews (based round a formal structure) and field notes was taken to investigate the
causes of each error. Where possible, when an error was identified (defined below), the
research pharmacists interviewed care home staff, the GP and community pharmacists to
understand why an error had occurred. In addition to interviews relating to specific errors,
in‐depth interviews and the observation of the dispensing process was conducted in a small
selection of pharmacies. These data, along with more detailed methods, are presented in
Chapters 5 and 6.
3.5 Discovering the prevalence of medication errors The prevalence of four types of medication error was to be established:
• prescribing
• monitoring
• dispensing
• medication administration
Error definitions, data collection methods and denominators can all have a marked effect on
the reported prevalence of error.49 Consequently, in this next section, particular attention is
paid to these issues.
Spontaneous reporting was rejected because it can identify only a thousandth of the
errors.50 Retrospective reviews of documents and patient records alone were rejected as
they are often incomplete and, in this setting, they are sometimes completely missing.
3.5.1 Study database and data collection materials
An Access® database from a previous study of medication error in secondary care was
adapted for this study.51 Due to the differences between the hospital and care home
settings, significant amendments to the database were required to ensure it was appropriate
for this study. Some data were entered directly into the database when collected, however,
paper forms were also required for certain data (such as observations of the drug rounds)
and these data were then subsequently entered into the database (see individual sections on
types of errors below for more detail). Data collection forms were based on those used in
27
previous studies of medication error in secondary care.52,53,54,55 These forms were adapted to
the care home setting and revised following piloting.
3.5.2 Background and training of research pharmacists
The research pharmacists for London and Bradford had several years clinical experience,
including experience of conducting clinical medication reviews for care home residents.
The research pharmacist for Cambridgeshire had less experience in this area and, therefore,
received training and practical experience of medication review from members of the study
steering group and from the other two research pharmacists.
A two‐day training event was held for the 3 research pharmacists to encompass the
following:
• Aims and objectives of the study, researchers’ roles
• Context of care homes; establishing relationships; introduction to key stakeholders
• Ethical and research governance issues; recruitment and informed consent
• Nature of research; separating research and practice; qualitative and quantitative
methods
• Recording overview of home details and systems
• Error definitions, differences between error and an intervention, difference between
error and optimum practice, Human Error Theory
• Data collection forms, database and data management
• Observation of drug rounds and action on discovery of an error
• Medication review
• Qualitative interviewing
• Studying causes of error, being supportive to those being interviewed, being
constructive and positive
• Health and safety
28
3.5.3 Ensuring consistency in data collection
As this was a multisite study with three research pharmacists gathering and recording data,
it was essential to ensure consistency between areas. This was done by:
1. providing training on the method of data collection
2. using robust and objective definitions of error
3. providing a data collection manual, which was constantly updated in the light of
experience
4. using standardised data collection materials and database
5. frequent contact between the research pharmacists and other pharmacists and the
GP on the research team (who had experience of medication errors and care homes)
to resolve any problems.
In addition to this, a three monthly subgroup meeting was held with the three research
pharmacists and members of the study steering group to resolve any ambiguities; this
process was continuous and iterative.
3.6 Prescribing errors Definition: Prescribing errors were identified using the definition developed and validated
using the Delphi technique by Dean et al.56 This definition has been used in the Department
of Health report “Building a safer NHS for patients – improving medication safety”,3 and
has been successfully operationalised in several empirical studies.57,58,59,55
A clinically meaningful prescribing error was therefore defined as:
“A prescribing decision or prescription‐writing process that results in an unintentional, significant:
1. Reduction in the probability of treatment being timely and effective, or
2. Increase in the risk of harm, when compared to generally accepted practice”.
29
This definition includes omissions, as these are considered to be a decision not to prescribe
a drug which other doctors would normally prescribe in the circumstances. Prescribing
without taking into account the patient’s clinical status, failure to communicate essential
information and transcription errors were also considered prescribing errors. However,
failures to adhere to standards such as prescribing guidelines or the drug’s product license,
were not considered to be errors if this reflected accepted practice – a judgement that came
out clearly from a previous Delphi process with prescribers (Dean et al 2000).
Data collection: The approach was a tiered application of clinical judgement. The technique
of clinical medication review was used, in which the clinical pharmacists reviewed the
resident, the illness and the drug treatment during a consultation. This is a process
previously developed by research team members and studied in patients living in their own
home60 and in care homes.61
Clinical medication review involved evaluating the therapeutic efficacy of each drug and
the progress of the conditions being treated. The pharmacists identified inappropriate
doses, dose frequencies, formulations or routes. Actual and potential adverse drug events,
drug‐drug interactions and contra‐indicated medication were identified. Other issues, such
as compliance/adherence (if applicable), and the resident’s understanding of the condition
and its treatment were also considered when appropriate. The outcome of the review is
normally a decision about the continuation (or otherwise) of the treatment. Residents were
seen by appropriately trained clinical pharmacists, who reviewed their notes at both the GP
surgery and at the care home, as well as seeing the resident when possible.
Due to the complex medicines management systems, multiple data sources were accessed
when identifying prescribing errors (Appendix C). Prescribing error data were entered
directly into the study database.
For each resident, the clinical pharmacists provided a case history and summary of the
medicines prescribed, and described what they considered to be prescribing errors. The
cases were discussed with a second clinical pharmacist, to determine whether they
considered it a prescribing error; any disagreements between the pharmacists were
resolved during dedicated meetings of the study steering group. Prescribing errors were
30
classified as in Table 3.1 and were not mutually exclusive ie there could be more than one
prescribing error per item. If a prescribing error was linked to a dispensing or medication
administration error, this was recorded (“linked error”).
Denominator: The number of opportunities for error was the number of prescription items
written, plus any omissions.
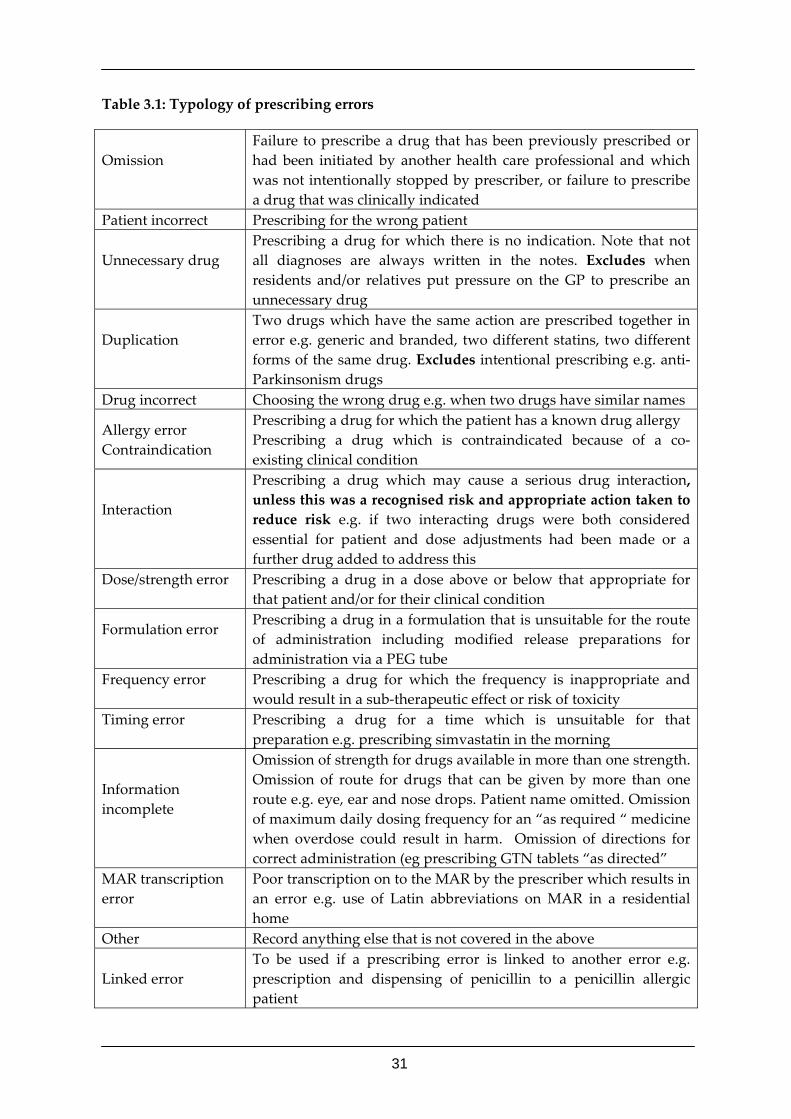
31
Table 3.1: Typology of prescribing errors
Omission
Failure to prescribe a drug that has been previously prescribed or had been initiated by another health care professional and which was not intentionally stopped by prescriber, or failure to prescribe a drug that was clinically indicated
Patient incorrect Prescribing for the wrong patient
Unnecessary drug
Prescribing a drug for which there is no indication. Note that not all diagnoses are always written in the notes. Excludes when residents and/or relatives put pressure on the GP to prescribe an unnecessary drug
Duplication
Two drugs which have the same action are prescribed together in error e.g. generic and branded, two different statins, two different forms of the same drug. Excludes intentional prescribing e.g. anti‐Parkinsonism drugs
Drug incorrect Choosing the wrong drug e.g. when two drugs have similar names
Allergy error Contraindication
Prescribing a drug for which the patient has a known drug allergy Prescribing a drug which is contraindicated because of a co‐existing clinical condition
Interaction
Prescribing a drug which may cause a serious drug interaction, unless this was a recognised risk and appropriate action taken to reduce risk e.g. if two interacting drugs were both considered essential for patient and dose adjustments had been made or a further drug added to address this
Dose/strength error
Prescribing a drug in a dose above or below that appropriate for that patient and/or for their clinical condition
Formulation error
Prescribing a drug in a formulation that is unsuitable for the route of administration including modified release preparations for administration via a PEG tube
Frequency error
Prescribing a drug for which the frequency is inappropriate and would result in a sub‐therapeutic effect or risk of toxicity
Timing error
Prescribing a drug for a time which is unsuitable for that preparation e.g. prescribing simvastatin in the morning
Information incomplete
Omission of strength for drugs available in more than one strength. Omission of route for drugs that can be given by more than one route e.g. eye, ear and nose drops. Patient name omitted. Omission of maximum daily dosing frequency for an “as required “ medicine when overdose could result in harm. Omission of directions for correct administration (eg prescribing GTN tablets “as directed”
MAR transcription error
Poor transcription on to the MAR by the prescriber which results in an error e.g. use of Latin abbreviations on MAR in a residential home
Other Record anything else that is not covered in the above
Linked error To be used if a prescribing error is linked to another error e.g. prescription and dispensing of penicillin to a penicillin allergic patient
32
3.7 Monitoring errors There is a paucity of evidence and often disagreement amongst health care professionals
regarding how often, if at all, a particular medicine should be monitored. Several national
and local guidelines exist for the monitoring of medication, however, they often differ in
their recommendations
• BNF;62
• North West Drug Information Letter;63
• London and South East Medicines Information Service and Croydon PCT;64
• Hinchingbrooke Hospital;65
Quality indicators for medication monitoring in vulnerable older people have been
published.66 However, specific monitoring criteria were limited to antidepressants,
diuretics, angiotensin converting enzyme inhibitors (ACE inhibitors) and warfarin; other
potentially harmful medicines were not included. Gurwitz et al67 conducted a study of
preventable adverse drug events in two US long‐term care facilities and identified
monitoring errors including inadequate laboratory monitoring, a delayed response or
failure to respond to signs or symptoms or laboratory evidence of drug toxicity. However,
criteria to identify monitoring errors for specific medicines were not reported.
Consequently, it was necessary to develop and validate a definition and criteria for a
monitoring error for this setting.
3.7.1 Development of monitoring criteria
The intention was to develop a definition and criteria that were pragmatic, easily
operationalised, and owned by practising GPs and clinical pharmacists. The intention was
to focus on the drugs most likely to be prescribed that had the potential for harm in the care
home setting. It was not intended to produce an exhaustive list of drugs that required
monitoring.
A literature search was conducted using MEDLINE (May 2006) and EMBASE (May 2006)
using the search terms “medication error”, “drug monitoring” and “monitoring error” to
identify whether criteria for determining medication monitoring errors had previously been
33
published, or whether a monitoring error had previously been defined. No generic
definition of a monitoring error was identified.
A definition of a monitoring error was therefore developed and agreed by the study
steering group. Criteria were initially developed by two clinical pharmacists on the study
steering group, using local and national guidelines for the monitoring of
pharmacotherapy.63,64,65,66 This took into account the drugs included in the above guidelines.
Sixteen drugs or groups of drugs were deemed to have properties which made monitoring
necessary in the primary care setting. The criteria were split into two sections:
a) monitoring following the initiation of therapy
b) monitoring of maintenance therapy
The criteria for each drug were then agreed by experienced practitioners and academics
from the study steering group. These comprised four clinical pharmacists, a pharmacist
lecturer in patient safety, two professors of pharmacy practice and one practising
GP/research fellow. To ensure external validity, the criteria were reviewed by a sample of
GPs (21) and clinical pharmacists with primary care experience (11) who were selected from
the Primary Care Pharmacy Network (5 pharmacists), from GP trainers (9 GPs) and from a
convenience sample (6 pharmacists, 12 GPs). The pharmacists and general practitioners
were e‐mailed the criteria in August 2006 and asked to indicate whether they agreed or
disagreed with each specific medication monitoring criterion and to give comments where
they disagreed. An overall consensus rate of 70% was deemed pragmatically sufficient to
accept each criterion.
The core definition of a monitoring error was agreed by the study steering group as:
“A monitoring error occurs when a prescribed medicine is not monitored in the way which
would be considered acceptable in routine general practice. It includes the absence of tests
being carried out at the frequency listed in the criteria, with tolerance of +50%. This means,
for example, that if a drug requires liver function tests at 3 monthly intervals, we would
class as an error if a test has not been conducted within 18 weeks. If a patient refused to
give consent for a test, then this would not constitute an error.”
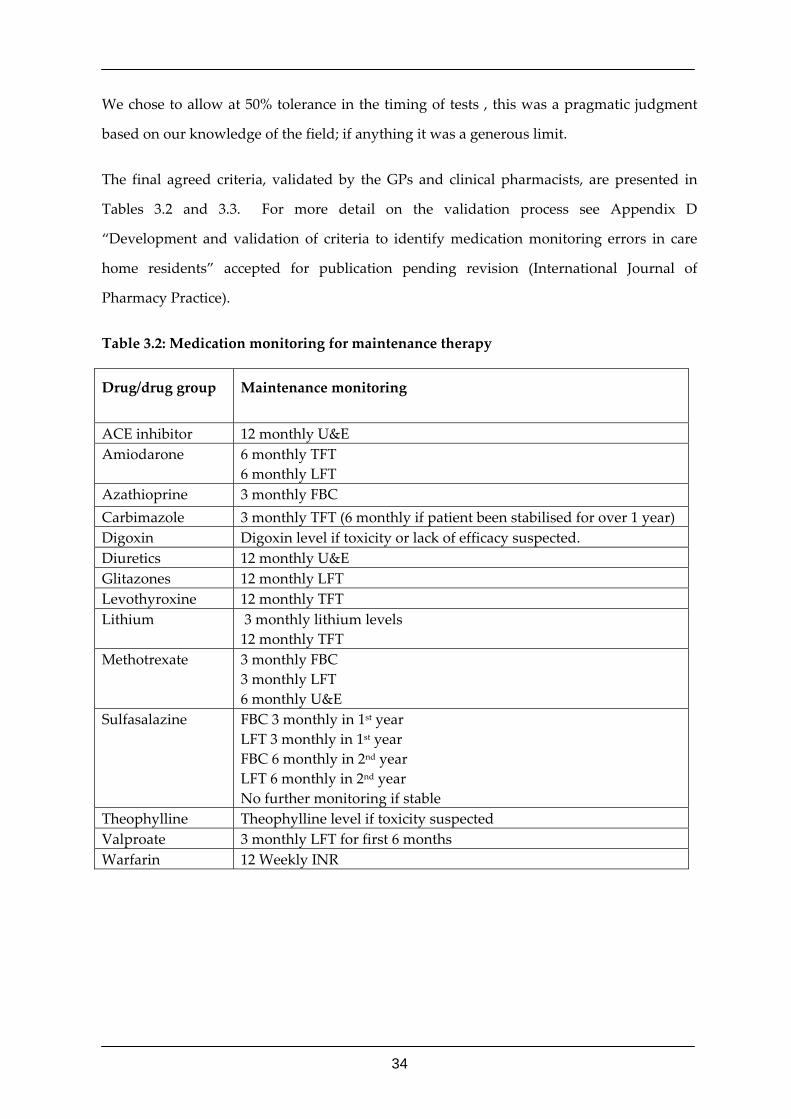
34
We chose to allow at 50% tolerance in the timing of tests , this was a pragmatic judgment
based on our knowledge of the field; if anything it was a generous limit.
The final agreed criteria, validated by the GPs and clinical pharmacists, are presented in
Tables 3.2 and 3.3. For more detail on the validation process see Appendix D
“Development and validation of criteria to identify medication monitoring errors in care
home residents” accepted for publication pending revision (International Journal of
Pharmacy Practice).
Table 3.2: Medication monitoring for maintenance therapy
Drug/drug group Maintenance monitoring
ACE inhibitor 12 monthly U&E Amiodarone
6 monthly TFT 6 monthly LFT
Azathioprine 3 monthly FBC Carbimazole 3 monthly TFT (6 monthly if patient been stabilised for over 1 year) Digoxin Digoxin level if toxicity or lack of efficacy suspected. Diuretics 12 monthly U&E Glitazones 12 monthly LFT Levothyroxine 12 monthly TFT Lithium
3 monthly lithium levels 12 monthly TFT
Methotrexate
3 monthly FBC 3 monthly LFT 6 monthly U&E
Sulfasalazine FBC 3 monthly in 1st year LFT 3 monthly in 1st year FBC 6 monthly in 2nd year LFT 6 monthly in 2nd year No further monitoring if stable
Theophylline Theophylline level if toxicity suspected Valproate 3 monthly LFT for first 6 months Warfarin 12 Weekly INR
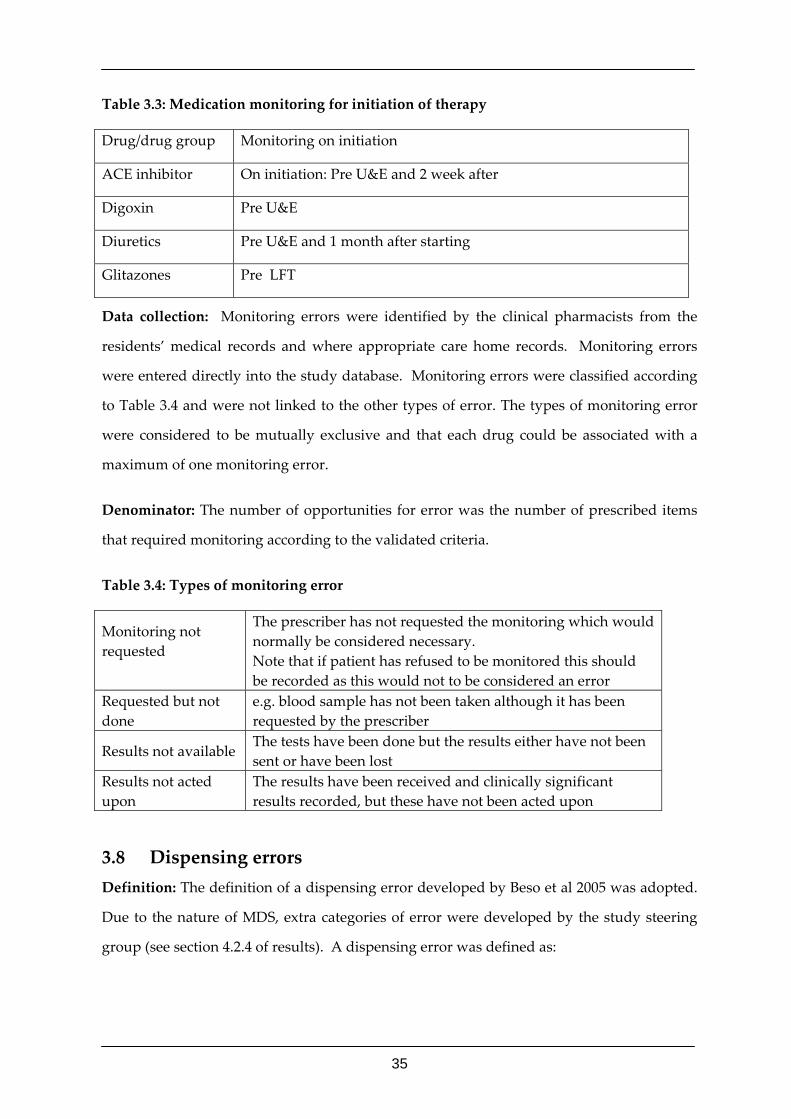
35
Table 3.3: Medication monitoring for initiation of therapy
Drug/drug group Monitoring on initiation
ACE inhibitor On initiation: Pre U&E and 2 week after
Digoxin Pre U&E
Diuretics Pre U&E and 1 month after starting
Glitazones Pre LFT
Data collection: Monitoring errors were identified by the clinical pharmacists from the
residents’ medical records and where appropriate care home records. Monitoring errors
were entered directly into the study database. Monitoring errors were classified according
to Table 3.4 and were not linked to the other types of error. The types of monitoring error
were considered to be mutually exclusive and that each drug could be associated with a
maximum of one monitoring error.
Denominator: The number of opportunities for error was the number of prescribed items
that required monitoring according to the validated criteria.
Table 3.4: Types of monitoring error
Monitoring not requested
The prescriber has not requested the monitoring which would normally be considered necessary. Note that if patient has refused to be monitored this should be recorded as this would not to be considered an error
Requested but not done
e.g. blood sample has not been taken although it has been requested by the prescriber
Results not available The tests have been done but the results either have not been sent or have been lost
Results not acted upon
The results have been received and clinically significant results recorded, but these have not been acted upon
3.8 Dispensing errors Definition: The definition of a dispensing error developed by Beso et al 2005 was adopted.
Due to the nature of MDS, extra categories of error were developed by the study steering
group (see section 4.2.4 of results). A dispensing error was defined as:
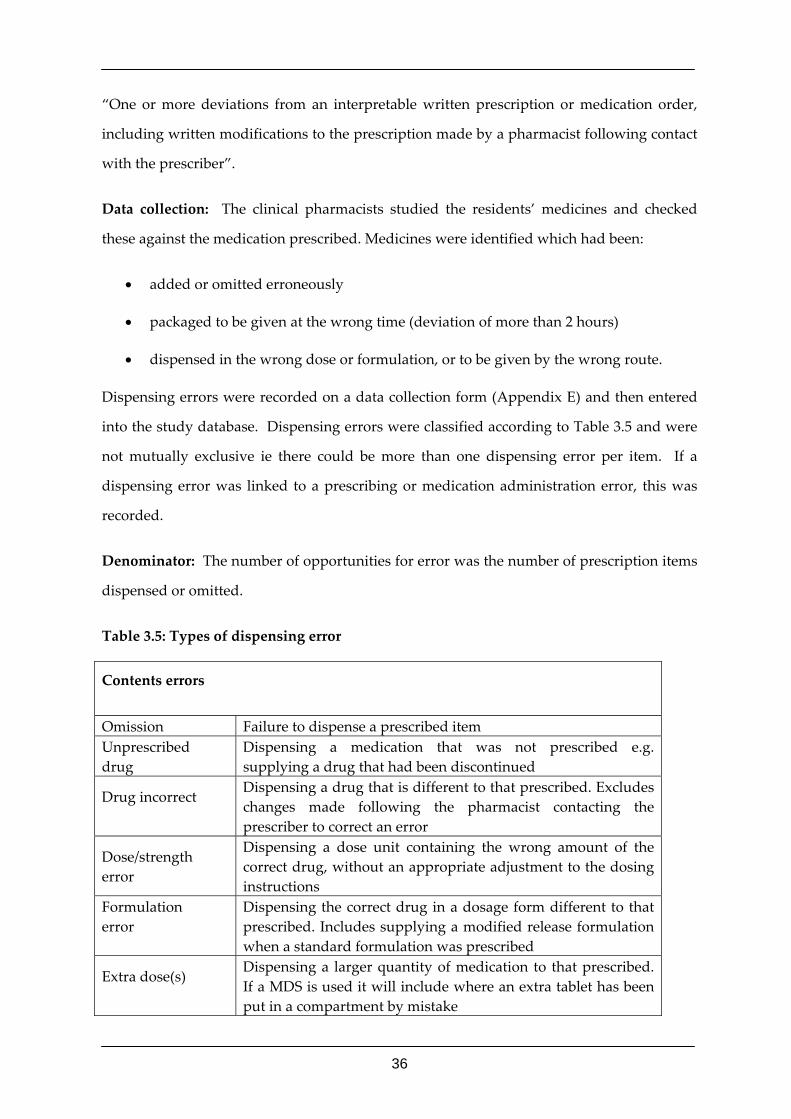
36
“One or more deviations from an interpretable written prescription or medication order,
including written modifications to the prescription made by a pharmacist following contact
with the prescriber”.
Data collection: The clinical pharmacists studied the residents’ medicines and checked
these against the medication prescribed. Medicines were identified which had been:
• added or omitted erroneously
• packaged to be given at the wrong time (deviation of more than 2 hours)
• dispensed in the wrong dose or formulation, or to be given by the wrong route.
Dispensing errors were recorded on a data collection form (Appendix E) and then entered
into the study database. Dispensing errors were classified according to Table 3.5 and were
not mutually exclusive ie there could be more than one dispensing error per item. If a
dispensing error was linked to a prescribing or medication administration error, this was
recorded.
Denominator: The number of opportunities for error was the number of prescription items
dispensed or omitted.
Table 3.5: Types of dispensing error
Contents errors
Omission Failure to dispense a prescribed item Unprescribed drug
Dispensing a medication that was not prescribed e.g. supplying a drug that had been discontinued
Drug incorrect
Dispensing a drug that is different to that prescribed. Excludes changes made following the pharmacist contacting the prescriber to correct an error
Dose/strength error
Dispensing a dose unit containing the wrong amount of the correct drug, without an appropriate adjustment to the dosing instructions
Formulation error
Dispensing the correct drug in a dosage form different to that prescribed. Includes supplying a modified release formulation when a standard formulation was prescribed
Extra dose(s)
Dispensing a larger quantity of medication to that prescribed. If a MDS is used it will include where an extra tablet has been put in a compartment by mistake
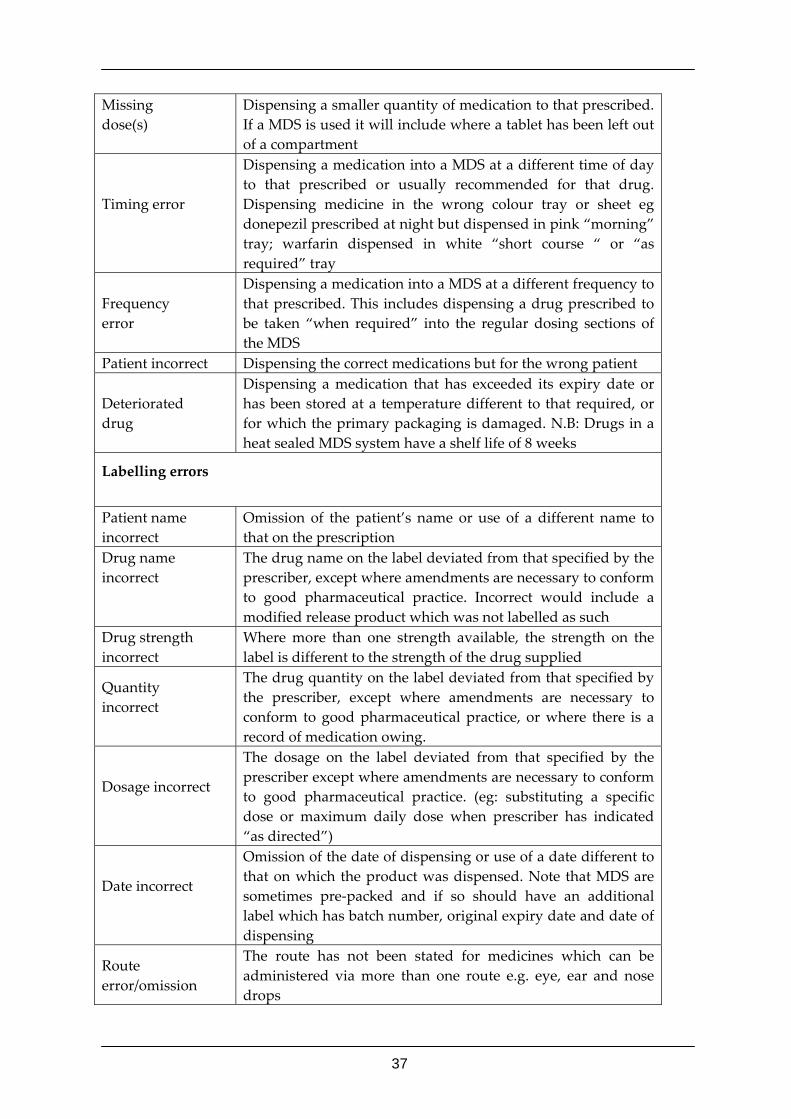
37
Missing dose(s)
Dispensing a smaller quantity of medication to that prescribed. If a MDS is used it will include where a tablet has been left out of a compartment
Timing error
Dispensing a medication into a MDS at a different time of day to that prescribed or usually recommended for that drug. Dispensing medicine in the wrong colour tray or sheet eg donepezil prescribed at night but dispensed in pink “morning” tray; warfarin dispensed in white “short course “ or “as required” tray
Frequency error
Dispensing a medication into a MDS at a different frequency to that prescribed. This includes dispensing a drug prescribed to be taken “when required” into the regular dosing sections of the MDS
Patient incorrect Dispensing the correct medications but for the wrong patient
Deteriorated drug
Dispensing a medication that has exceeded its expiry date or has been stored at a temperature different to that required, or for which the primary packaging is damaged. N.B: Drugs in a heat sealed MDS system have a shelf life of 8 weeks
Labelling errors
Patient name incorrect
Omission of the patient’s name or use of a different name to that on the prescription
Drug name incorrect
The drug name on the label deviated from that specified by the prescriber, except where amendments are necessary to conform to good pharmaceutical practice. Incorrect would include a modified release product which was not labelled as such
Drug strength incorrect
Where more than one strength available, the strength on the label is different to the strength of the drug supplied
Quantity incorrect
The drug quantity on the label deviated from that specified by the prescriber, except where amendments are necessary to conform to good pharmaceutical practice, or where there is a record of medication owing.
Dosage incorrect
The dosage on the label deviated from that specified by the prescriber except where amendments are necessary to conform to good pharmaceutical practice. (eg: substituting a specific dose or maximum daily dose when prescriber has indicated “as directed”)
Date incorrect
Omission of the date of dispensing or use of a date different to that on which the product was dispensed. Note that MDS are sometimes pre‐packed and if so should have an additional label which has batch number, original expiry date and date of dispensing
Route error/omission
The route has not been stated for medicines which can be administered via more than one route e.g. eye, ear and nose drops
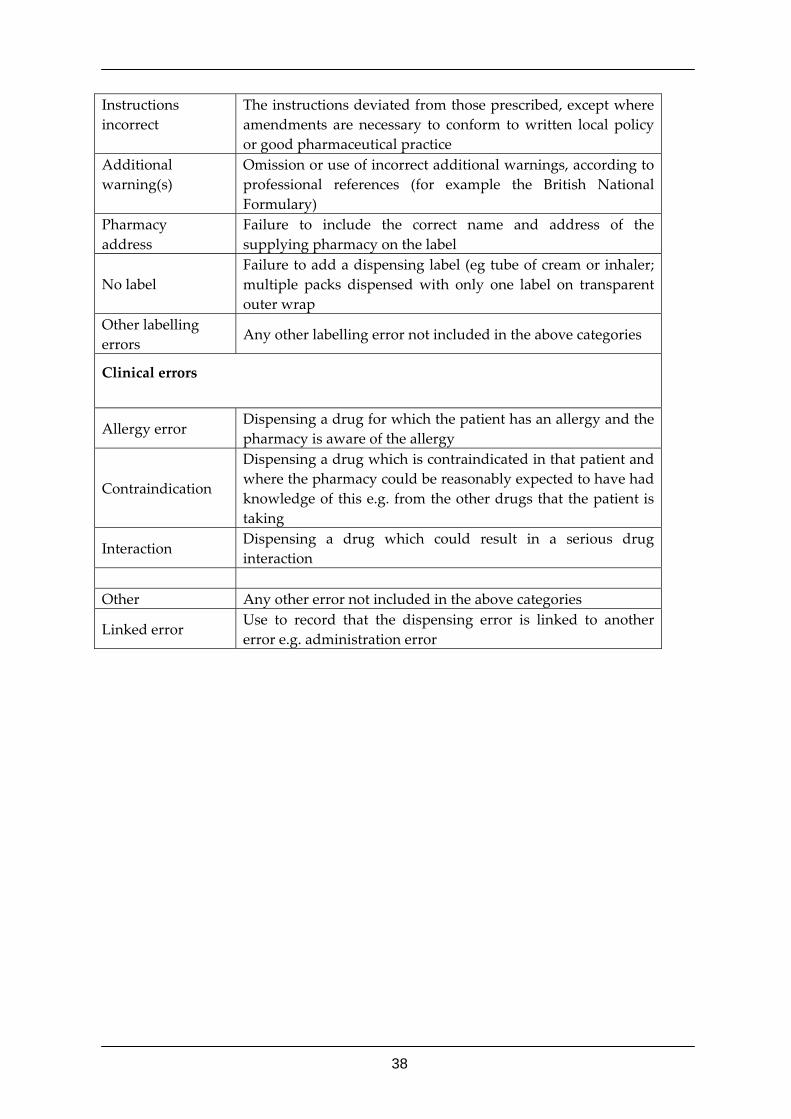
38
Instructions incorrect
The instructions deviated from those prescribed, except where amendments are necessary to conform to written local policy or good pharmaceutical practice
Additional warning(s)
Omission or use of incorrect additional warnings, according to professional references (for example the British National Formulary)
Pharmacy address
Failure to include the correct name and address of the supplying pharmacy on the label
No label Failure to add a dispensing label (eg tube of cream or inhaler; multiple packs dispensed with only one label on transparent outer wrap
Other labelling errors
Any other labelling error not included in the above categories
Clinical errors
Allergy error Dispensing a drug for which the patient has an allergy and the pharmacy is aware of the allergy
Contraindication
Dispensing a drug which is contraindicated in that patient and where the pharmacy could be reasonably expected to have had knowledge of this e.g. from the other drugs that the patient is taking
Interaction Dispensing a drug which could result in a serious drug interaction
Other Any other error not included in the above categories
Linked error Use to record that the dispensing error is linked to another error e.g. administration error
39
3.9 Medication administration errors Definition: A medication administration error was defined using previous work by Allan
and Barker68 (1990) and Dean and Barber69:
“Any deviation between the medication prescribed and that administered”.
Originally, timing of medication administration was not felt to be considered as a source of
error. However, on reflection it was agreed by the study steering group that some timing
errors were of clinical significance and therefore a list of medicines of which timing was
deemed important was established by the study steering group (see appendix F). Any
deviation in the correct timing of administration of these particular medicines was classified
as an error.
Data collection: Following informed, written consent from care home staff, the clinical
pharmacists observed two drug rounds per resident to identify and classify medication
administration errors (see appendix G for more details of this process). Medication
administration errors were recorded on a data collection form (Appendix H), classified
according to Table 3.6, and subsequently entered into the study database. Medication
administration errors were not mutually exclusive, i.e. there could be more than one
medication administration error per item. If a medication administration error was linked
to a prescribing or dispensing error, this was recorded.
Denominator: The number of opportunities for error was the number of doses given, plus
any doses that should have been given but were omitted.
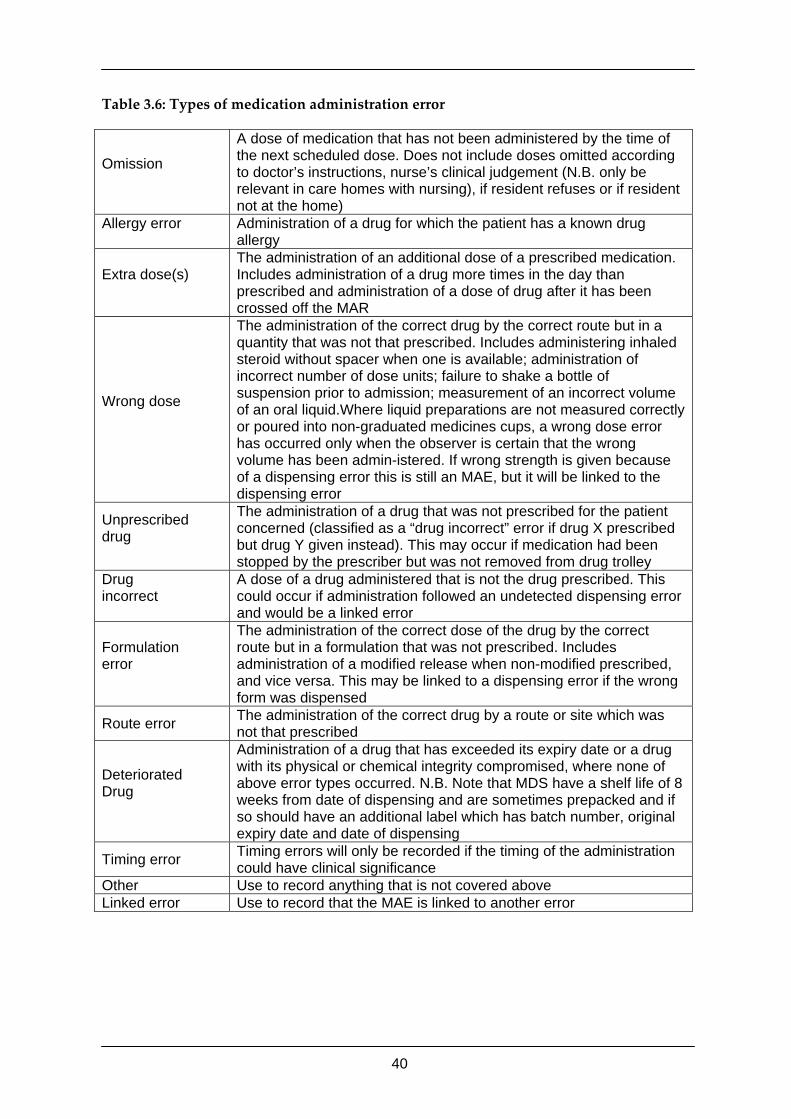
40
Table 3.6: Types of medication administration error
Omission
A dose of medication that has not been administered by the time of the next scheduled dose. Does not include doses omitted according to doctor’s instructions, nurse’s clinical judgement (N.B. only be relevant in care homes with nursing), if resident refuses or if resident not at the home)
Allergy error
Administration of a drug for which the patient has a known drug allergy
Extra dose(s)
The administration of an additional dose of a prescribed medication. Includes administration of a drug more times in the day than prescribed and administration of a dose of drug after it has been crossed off the MAR
Wrong dose
The administration of the correct drug by the correct route but in a quantity that was not that prescribed. Includes administering inhaled steroid without spacer when one is available; administration of incorrect number of dose units; failure to shake a bottle of suspension prior to admission; measurement of an incorrect volume of an oral liquid.Where liquid preparations are not measured correctly or poured into non-graduated medicines cups, a wrong dose error has occurred only when the observer is certain that the wrong volume has been admin-istered. If wrong strength is given because of a dispensing error this is still an MAE, but it will be linked to the dispensing error
Unprescribed drug
The administration of a drug that was not prescribed for the patient concerned (classified as a “drug incorrect” error if drug X prescribed but drug Y given instead). This may occur if medication had been stopped by the prescriber but was not removed from drug trolley
Drug incorrect
A dose of a drug administered that is not the drug prescribed. This could occur if administration followed an undetected dispensing error and would be a linked error
Formulation error
The administration of the correct dose of the drug by the correct route but in a formulation that was not prescribed. Includes administration of a modified release when non-modified prescribed, and vice versa. This may be linked to a dispensing error if the wrong form was dispensed
Route error The administration of the correct drug by a route or site which was not that prescribed
Deteriorated Drug
Administration of a drug that has exceeded its expiry date or a drug with its physical or chemical integrity compromised, where none of above error types occurred. N.B. Note that MDS have a shelf life of 8 weeks from date of dispensing and are sometimes prepacked and if so should have an additional label which has batch number, original expiry date and date of dispensing
Timing error Timing errors will only be recorded if the timing of the administration could have clinical significance
Other Use to record anything that is not covered above Linked error Use to record that the MAE is linked to another error
41
3.10 Assessing the potential for harm There is little consensus about how to define harm in prospective studies, such as this one,
in which the researchers intervened when they observed error. Hence we intended to
compare different methods. Two types of harm were of interest:
• whether the patient had suffered harm as a result of a medication error (often called
a preventable adverse drug event (ADE))
• whether the patient would be likely to suffer harm (a preventable ADE) in the
future, had we not observed the error and intervened to correct it.
The group of DW Bates in the USA use an ordinal scale of harm when assessing patients’
records which includes
• ‘no harm’
• ‘significant’
• ‘serious’
• ‘life threatening’
• ‘fatal’18
‘Significant’, for example, includes non‐urticarial rashes and drug induced falls without
fracture. For assessing the harm likely to have occurred if the researcher had not
intervened, Dean and Barber70 developed a valid, reliable measure of the harm likely to
result from an error, using a 0‐10 scale (“no effect” to “death”).
The case summaries were assessed for potential error by a panel of five experts using the
scale developed by Dean and Barber.70 The expert panel consisted of a clinical
pharmacologist, a consultant psychiatrist, a GP and two clinical pharmacists.
42
3.11 Data analysis
3.11.1 Statistical analysis
Statistical analysis was performed using the software R 2.3 (R project for statistical
computing, www.r‐project.org). Statistical ‘significance’ was pre‐defined at the 5% level.
Exact binomial confidence intervals were calculated for proportions. Chi‐square tests were
used to assess differences in error rates between areas. Generalised Estimating Equations
(library geepack, version 1.0‐10) were used to model patient level odds of errors, allowing
for clustering in homes and using an independence correlation structure. Multilevel models
were also used to model patient level odds of errors, using the MLwiN 2.03 software
(Multilevel models project, University of Bristol, http://www.cmm.bristol.ac.uk), fitting
variance components at the various levels.
3.11.2 Potential harm analysis
The scores from each assessor were transferred to an Excel® spreadsheet and mean scores
for each error were calculated. Overall means were calculated for each category of error
(prescribing, monitoring, dispensing and medication administration) along with standard
deviations and ranges.
43
Chapter 4 Quantitative Results
4.1 Demographics For each home we measured the prevalence on the day of inspection – a point prevalence
for that home. Taking all these point preferences together, we are estimating prevalence.
In this section we describe the residents and care homes involved in the study. 256 residents
were recruited from 55 care homes. Table 4.1 shows demographic data for these residents.
The majority of the residents were female (69.1%) and very elderly (mean age 85.2 years).
There were slightly more residential home residents (54.3%) than nursing home residents.
Figure 4.1 shows a frequency distribution of the number of medicines per resident based on
the prescribing denominator (the number of medicines prescribed plus any omissions). 220
(85.9%) of residents were dispensed their medicines in MDS. Nearly all (96.7%) of residents
in Bradford received their medicines in MDS, however, this figure was significantly lower
for London (76.9%) and Cambridgeshire (74.2%).
One hundred and eight care homes were approached and 79 (72.1%) agreed to participate.
Fifty five homes were included in the final sample. Figure 4.2 shows the type of care
provided by these homes. The majority (38, 69.1%) of the 55 care homes provided both
residential and nursing care with the corresponding figures for residential care only and
nursing care only being 12 (21.8%) and 5 (9.1%), respectively. The sample contained a good
spread of home size (Figure 4.3); the most common size of home had 20‐29 residents
representing 25.5% of the sample. Different owner–types were well represented (Figure
4.4). Small chains (34.5%), single homes (21.8%) and not for profit homes (27.3%) accounted
for 83.6% of the sample.
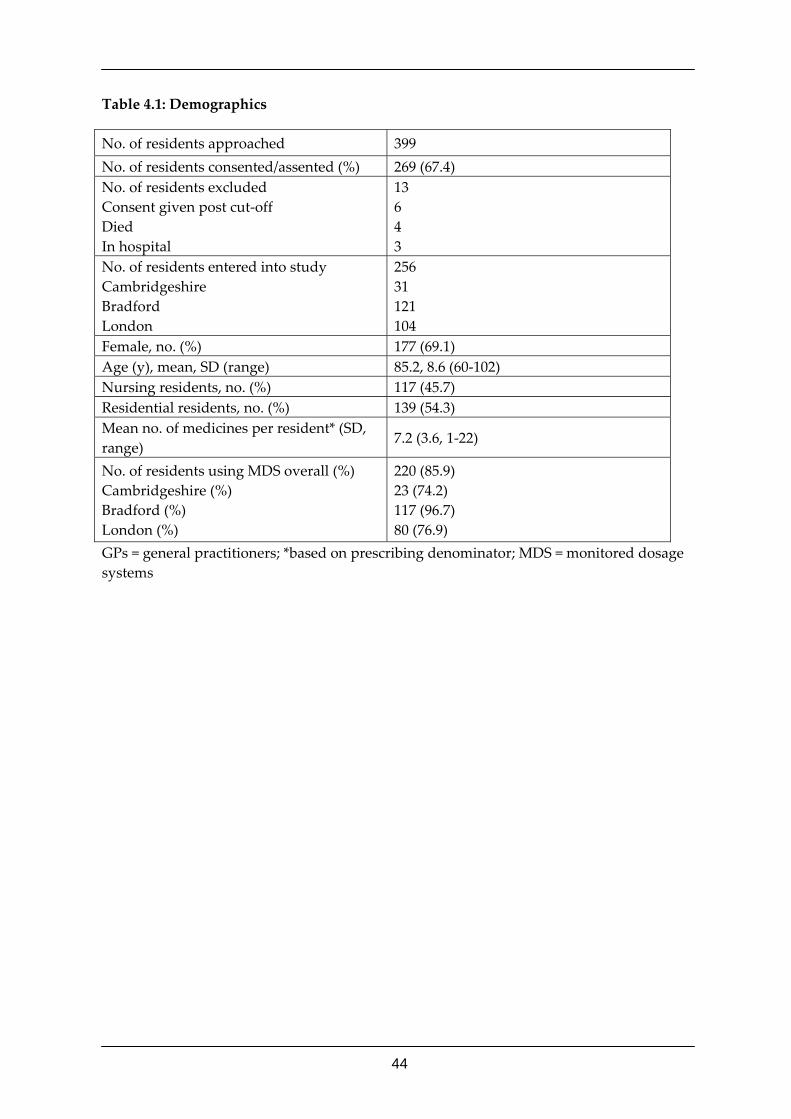
44
Table 4.1: Demographics
No. of residents approached 399 No. of residents consented/assented (%) 269 (67.4) No. of residents excluded Consent given post cut‐off Died In hospital
13 6 4 3
No. of residents entered into study Cambridgeshire Bradford London
256 31 121 104
Female, no. (%) 177 (69.1) Age (y), mean, SD (range) 85.2, 8.6 (60‐102) Nursing residents, no. (%) 117 (45.7) Residential residents, no. (%) 139 (54.3) Mean no. of medicines per resident* (SD, range)
7.2 (3.6, 1‐22)
No. of residents using MDS overall (%) Cambridgeshire (%) Bradford (%) London (%)
220 (85.9) 23 (74.2) 117 (96.7) 80 (76.9)
GPs = general practitioners; *based on prescribing denominator; MDS = monitored dosage systems
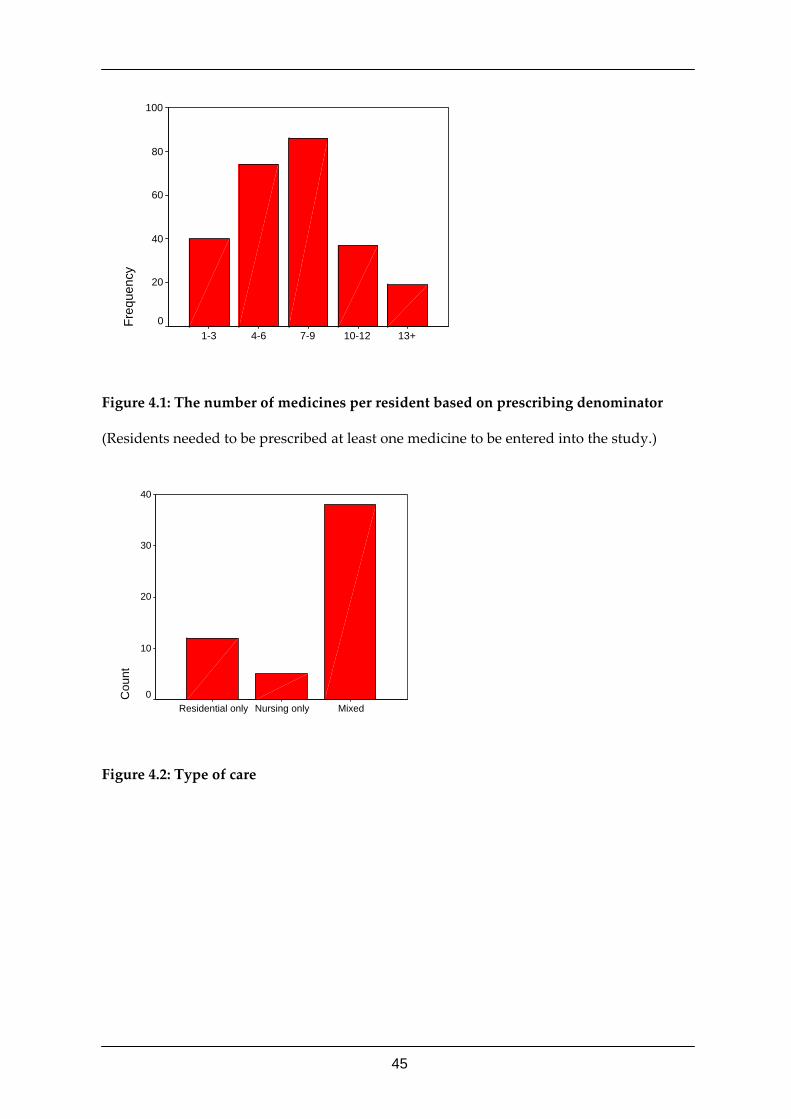
45
13+10-127-94-61-3
Freq
uenc
y100
80
60
40
20
0
Figure 4.1: The number of medicines per resident based on prescribing denominator
(Residents needed to be prescribed at least one medicine to be entered into the study.)
MixedNursing onlyResidential only
Cou
nt
40
30
20
10
0
Figure 4.2: Type of care
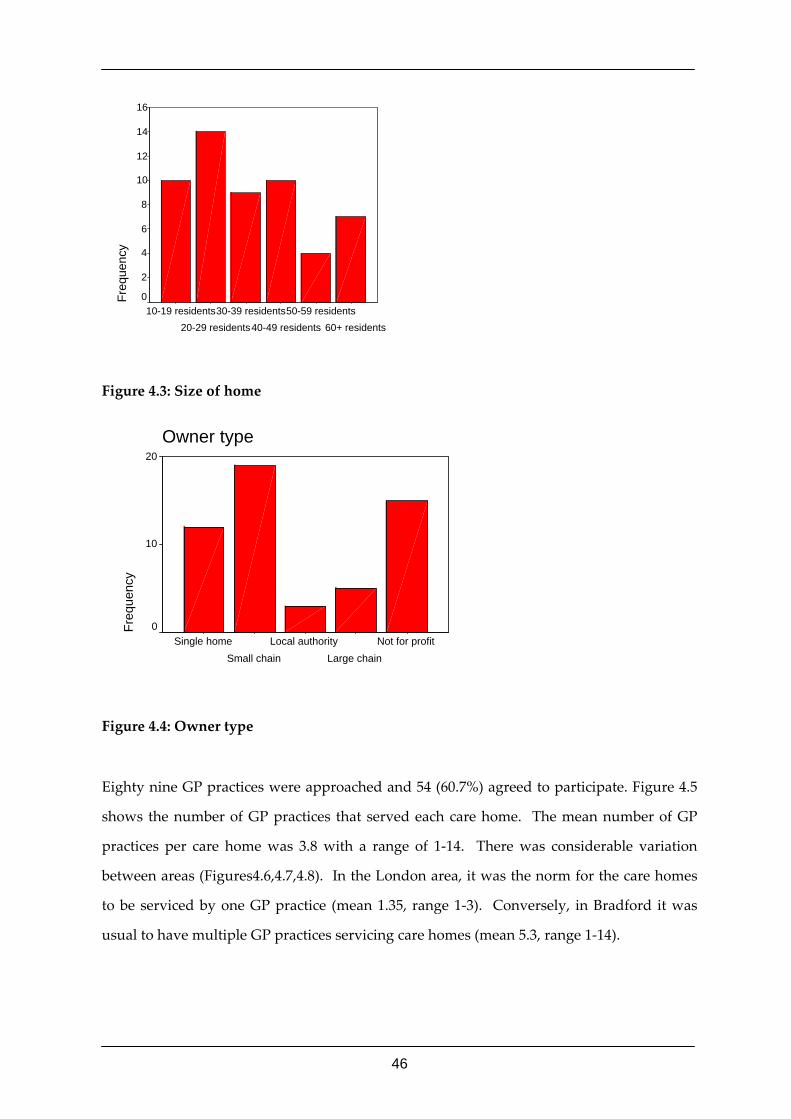
46
60+ residents50-59 residents
40-49 residents30-39 residents
20-29 residents10-19 residents
Freq
uenc
y16
14
12
10
8
6
4
2
0
Figure 4.3: Size of home
Owner type
Not for profitLarge chain
Local authoritySmall chain
Single home
Freq
uenc
y
20
10
0
Figure 4.4: Owner type
Eighty nine GP practices were approached and 54 (60.7%) agreed to participate. Figure 4.5
shows the number of GP practices that served each care home. The mean number of GP
practices per care home was 3.8 with a range of 1‐14. There was considerable variation
between areas (Figures4.6,4.7,4.8). In the London area, it was the norm for the care homes
to be serviced by one GP practice (mean 1.35, range 1‐3). Conversely, in Bradford it was
usual to have multiple GP practices servicing care homes (mean 5.3, range 1‐14).
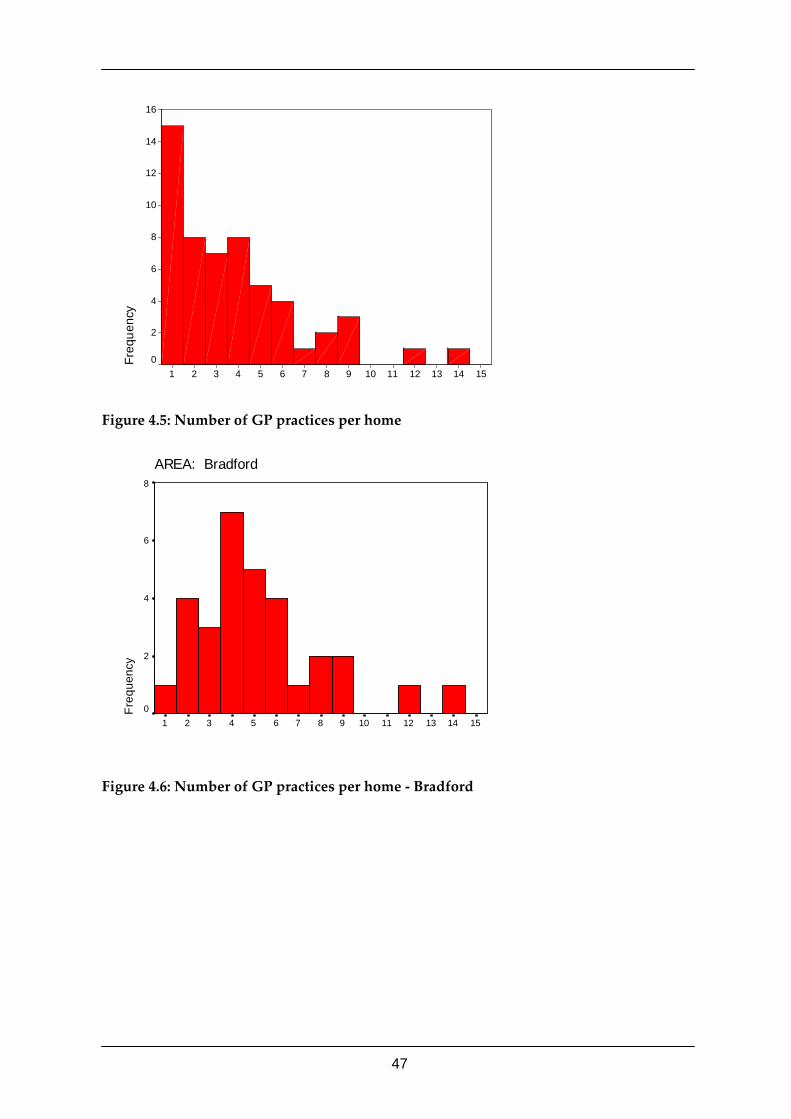
47
151413121110987654321
Freq
uenc
y16
14
12
10
8
6
4
2
0
Figure 4.5: Number of GP practices per home
151413121110987654321
AREA: Bradford
Freq
uenc
y
8
6
4
2
0
Figure 4.6: Number of GP practices per home ‐ Bradford
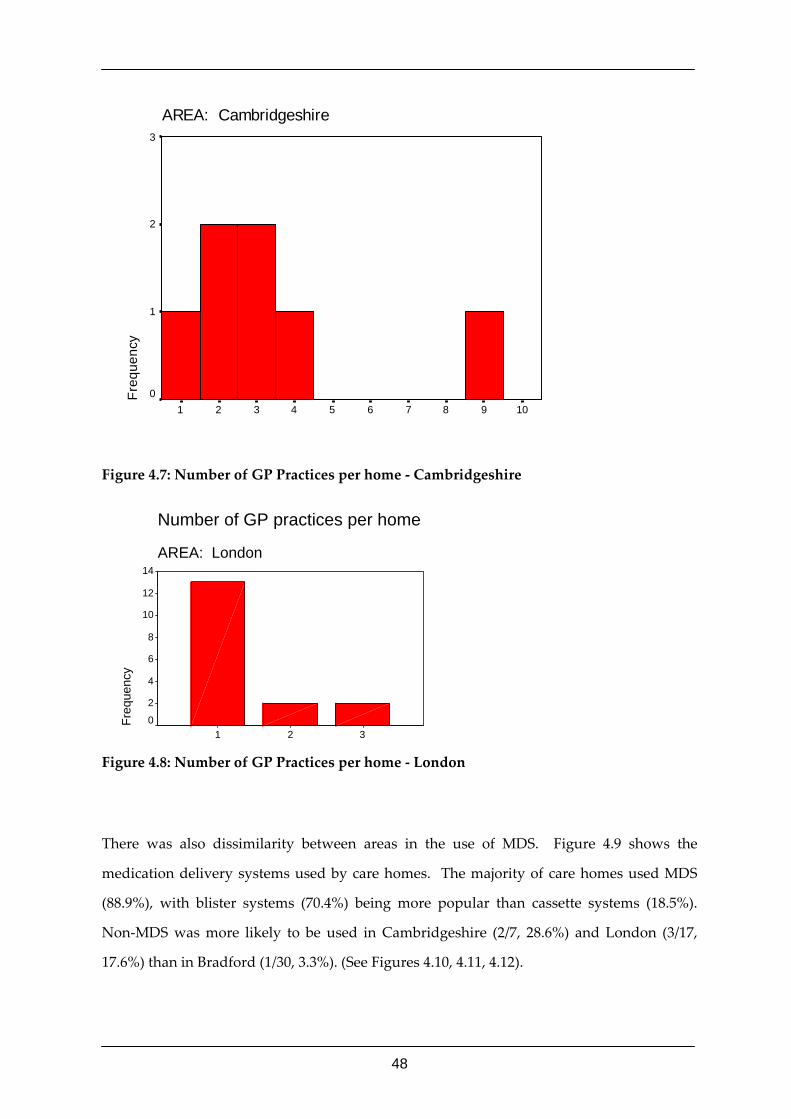
48
10987654321
AREA: CambridgeshireFr
eque
ncy
3
2
1
0
Figure 4.7: Number of GP Practices per home ‐ Cambridgeshire
Number of GP practices per home
AREA: London
321
Freq
uenc
y
14
12
10
8
6
4
2
0
Figure 4.8: Number of GP Practices per home ‐ London
There was also dissimilarity between areas in the use of MDS. Figure 4.9 shows the
medication delivery systems used by care homes. The majority of care homes used MDS
(88.9%), with blister systems (70.4%) being more popular than cassette systems (18.5%).
Non‐MDS was more likely to be used in Cambridgeshire (2/7, 28.6%) and London (3/17,
17.6%) than in Bradford (1/30, 3.3%). (See Figures 4.10, 4.11, 4.12).
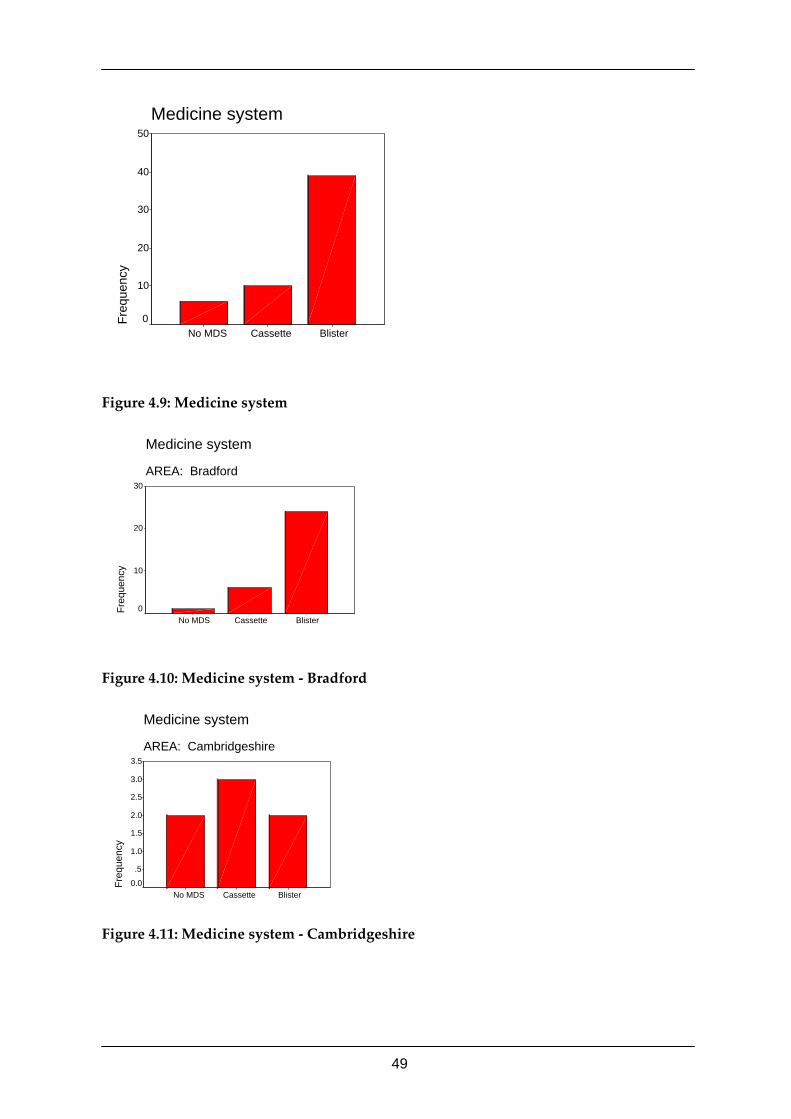
49
Medicine system
BlisterCassetteNo MDS
Freq
uenc
y50
40
30
20
10
0
Figure 4.9: Medicine system
Medicine system
AREA: Bradford
BlisterCassetteNo MDS
Freq
uenc
y
30
20
10
0
Figure 4.10: Medicine system ‐ Bradford
Medicine system
AREA: Cambridgeshire
BlisterCassetteNo MDS
Freq
uenc
y
3.5
3.0
2.5
2.0
1.5
1.0
.5
0.0
Figure 4.11: Medicine system ‐ Cambridgeshire
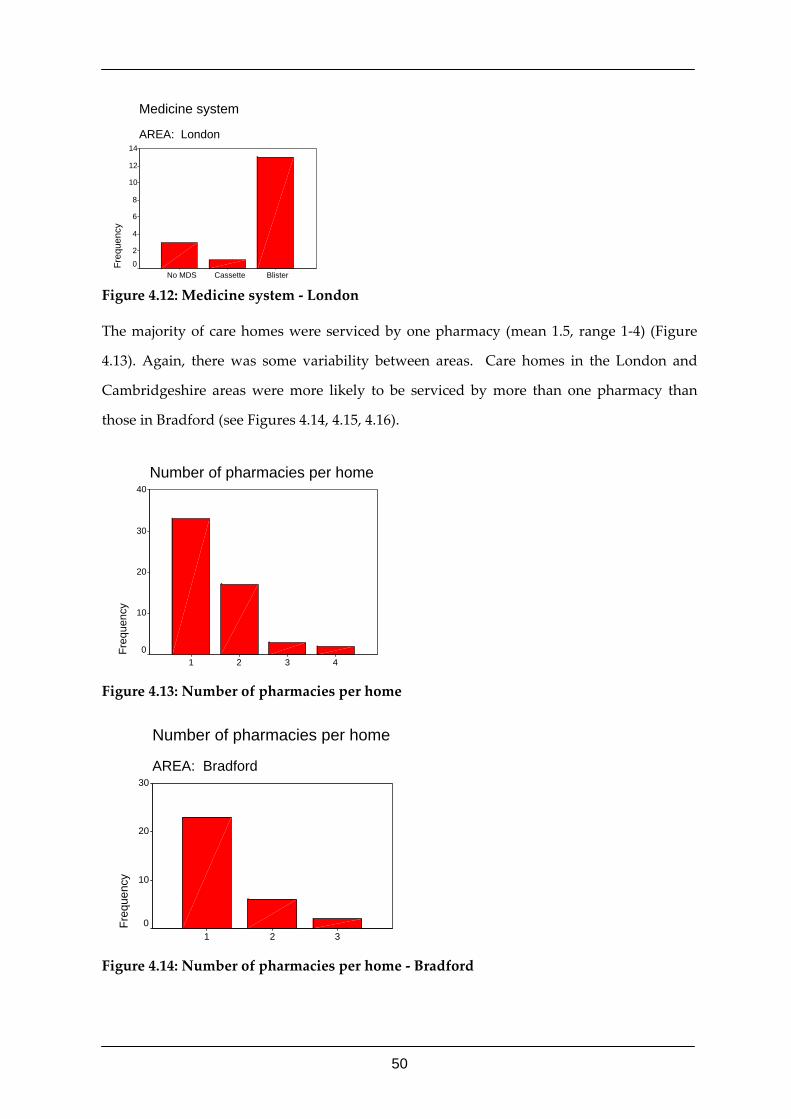
50
Medicine system
AREA: London
BlisterCassetteNo MDS
Freq
uenc
y
14
12
10
8
6
4
2
0
Figure 4.12: Medicine system ‐ London
The majority of care homes were serviced by one pharmacy (mean 1.5, range 1‐4) (Figure
4.13). Again, there was some variability between areas. Care homes in the London and
Cambridgeshire areas were more likely to be serviced by more than one pharmacy than
those in Bradford (see Figures 4.14, 4.15, 4.16).
Number of pharmacies per home
4321
Freq
uenc
y
40
30
20
10
0
Figure 4.13: Number of pharmacies per home
Number of pharmacies per home
AREA: Bradford
321
Freq
uenc
y
30
20
10
0
Figure 4.14: Number of pharmacies per home ‐ Bradford
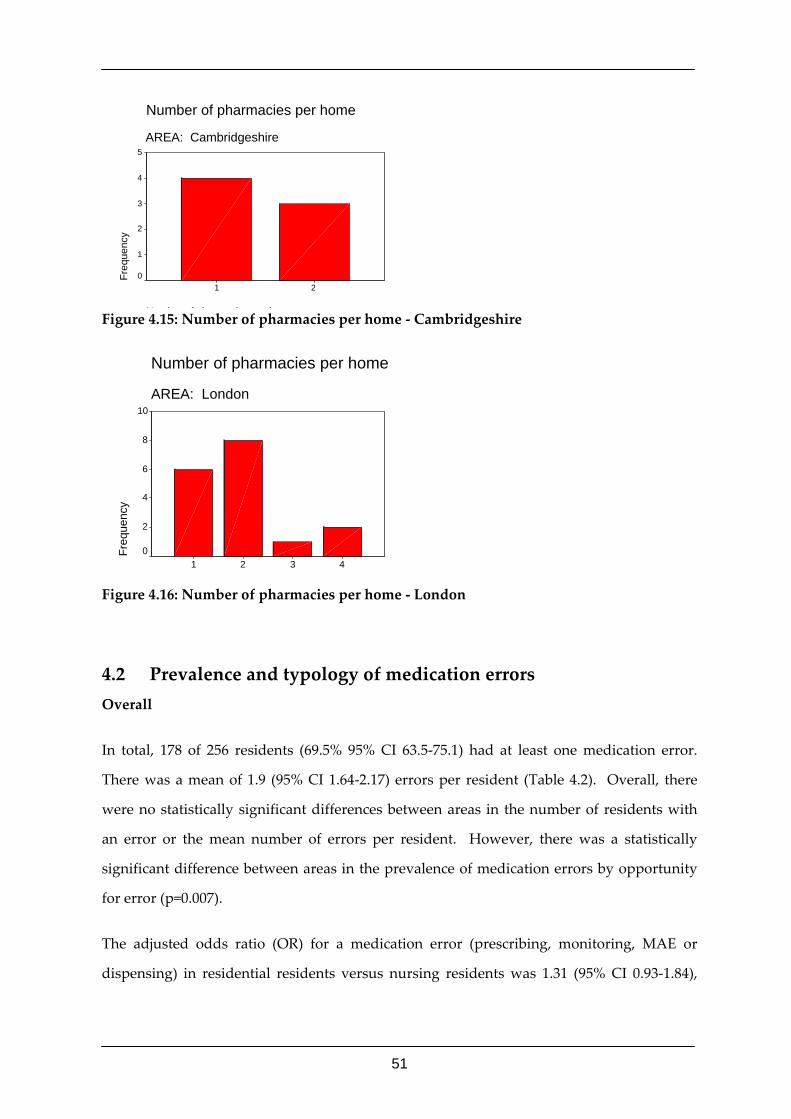
51
Number of pharmacies per home
AREA: Cambridgeshire
N b f h i h
21
Freq
uenc
y
5
4
3
2
1
0
Figure 4.15: Number of pharmacies per home ‐ Cambridgeshire
Number of pharmacies per home
AREA: London
4321
Freq
uenc
y
10
8
6
4
2
0
Figure 4.16: Number of pharmacies per home ‐ London
4.2 Prevalence and typology of medication errors Overall
In total, 178 of 256 residents (69.5% 95% CI 63.5‐75.1) had at least one medication error.
There was a mean of 1.9 (95% CI 1.64‐2.17) errors per resident (Table 4.2). Overall, there
were no statistically significant differences between areas in the number of residents with
an error or the mean number of errors per resident. However, there was a statistically
significant difference between areas in the prevalence of medication errors by opportunity
for error (p=0.007).
The adjusted odds ratio (OR) for a medication error (prescribing, monitoring, MAE or
dispensing) in residential residents versus nursing residents was 1.31 (95% CI 0.93‐1.84),
52
however, this was not statistically significant at the 5% level after adjusting for age, sex and
medication delivery system.
4.2.1 Prescribing errors
One hundred residents (39.1%, 95% CI 33.0‐45.3) had one or more prescribing errors,
totalling 153 prescribing errors (in one case, two prescribing errors were found in one
medicine). The mean number of prescribing errors per resident was 0.60 (95% CI 0.48‐0.71),
with Bradford, London and Cambridgeshire having 0.67, 0.57 and 0.42 prescribing errors
per resident, respectively; these differences were not statistically significant. The
prescribing error rate by opportunity for error was 8.3% (95% CI 7.1‐9.7), the breakdown by
areas was Bradford (9.8%), London (7.4%) and Cambridgeshire (6.1%); again no statistically
significant difference was found.
Table 4.3 shows the typology of prescribing errors. The most common type of prescribing
error, accounting for 87.6% of the total, were ‘information incomplete’ (37.9%); ‘unnecessary
drug’ (23.5%); ‘dose/strength error’ (14.4%) and ‘omission’ (11.8%).
4.2.2 Monitoring errors
27 residents (10.5% 95% CI 7.1‐15.0) had a total of 32 monitoring errors in 218 prescribed
items that required monitoring with the man number of monitoring errors per resident
being 0.13 (95% CI 0.08 – 0.17) and there being 14.7% (95% CI 10.3‐20.1) errors if looked at
by the number of drugs requiring monitoring (Table 2). This means that around 1 in 7 such
items is subject to error. In total, there were 147 residents who were prescribed a medicine
that required monitoring and 18.4% (27) of these had an error. There was considerable
variation between areas with 75% of monitoring errors occurring in London, resulting in
0.23 monitoring errors per resident in this area. This compares to a figure of 0.03 for both
Bradford and Cambridgeshire. Nearly one third (30.8%) of medicines deemed to require
monitoring in the London area were not being monitored. The higher rate of monitoring
errors in London was statistically significant.
The great majority of monitoring errors (90.6%) resulted from a failure to request
monitoring (Table 4.4). Monitoring errors by drug type is given in Table 4.5.
53
4.2.3 Medication administration errors (MAE)
57 (22.3% 95% CI 17.3‐27.9) residents had a total of 116 administration errors (Table 4.2). In
one case, two administration errors were found during the administration of one item. The
mean number of medication administration errors per resident was 0.45 (95% CI 0.32‐0.58).
Cambridgeshire had the lowest administration error rate per resident (0.23), followed by
Bradford (0.40) and London (0.58). However, there were no statistically significant
differences in medication administration errors between areas. The prevalence of
administration errors by opportunities for error was 8.4% (95% CI 7.0‐10.0) overall.
Nearly half [49.1%] of all administration errors were ‘omissions’ and just over one fifth
(21.4%) were ‘wrong dose’ (Table 4.6).
There was no statistically significant difference in MAE by residents’ principal delivery
systems (p=0.36).
The odds of a MAE occurring were higher in residential care residents than nursing care
residents, however this just failed to reach statistical significance at the 5% level (adjusted
OR 1.77 95% CI 0.96‐3.25 p=0.063) [adjusted for age, sex and medication delivery system].
Table 4.7 shows medication administration errors by type of care and medication delivery
system. The higher risk of administration errors in residential residents compared to
nursing residents was largely attributable to more ‘omissions’ (38 versus 19) and ‘wrong
doses’ (18 versus 7). Of the 81 medication administration errors occurring in non‐MDS, the
most common preparations were inhalers (34.6%), liquids (27.2%), solid oral dosage forms
(24.7%) and eye drops (11.1%).
There was a statistically significant difference in the odds of a MAE between delivery
systems when analysing individual errors (p=0.008; age and sex not significant). This was
driven by an increased odds of error in non‐MDS versus MDS. The OR of a non‐MDS error
(relative to blister) was 3.16 (95% CI 1.43‐6.95 p=0.0036). Comparing the two MDS systems,
there was no statistically significant difference (cassette vs. blister OR 1.27 95% CI 0.30‐5.34
p=0.74).
54
4.2.4 Dispensing Errors
94 residents (36.7% 95% CI 30.8‐42.9) had a total of 187 dispensing errors with a mean of
0.73 (95% CI 0.56‐0.90) dispensing errors per resident (Table 4.2). In 12 cases, 2 dispensing
errors were found in one dispensed item and in one case, three dispensing errors were
found in one dispensed item. The dispensing error rate by opportunity for error was 9.8%
(95% CI 8.5‐11.2).
Labelling errors were found in 7.3% of dispensed items, content errors in 2.3% and clinical
errors in 0.21% (Table 4.8).
There was a statistically significant difference between areas in the number of residents
with a dispensing error, with Bradford having the highest rate (p=0.004). Similarly, there
was a statistically significant difference between areas in the prevalence of dispensing
errors by opportunities for error, again with Bradford having the highest rate (p<0.001).
However, there was no statistically significant difference between areas in the mean
number of dispensing errors per resident (Table 4.2).
The most common labelling errors were ‘other labelling error’ (29.4%), ‘no label’ (16.6%)
and ‘instructions incorrect’ (13.4%). ‘Timing error’ (8.0%) and ‘deteriorated drug’ (5.4%)
were the most common content errors (Table 4.8).
There was a statistically significant difference in the odds of a dispensing error by residents’
principal delivery system (p=0.0053, adjusted for age and sex). This was due to those
residents receiving their medicines principally in a cassette having an increased risk of error
(cassette adjusted versus blister OR 2.88 95% CI 1.5‐5.55 p=0.0012). The adjusted OR for
non‐MDS was 1.31 (95% CI 0.48‐3.57 p=0.59).
Table 4.9 shows dispensing errors by medication delivery system. Of the 84 dispensing
errors occurring in non‐MDS, the most common preparations were solid oral dosage forms
(27.4%), liquids (25.0%), inhalers (21.4%) and creams (16.6%).
There was a borderline statistically significant difference in the odds of a dispensing error
when analysing individual errors by delivery system (p=0.056) but no significant effect of
sex or age. This was driven by the higher odds of a dispensing error with the cassette
55
system (cassette vs. blister OR 2.53 95% CI 1.12‐5.72 p=0.022). Non‐MDS was similar to
blister (OR 1.03 95% CI 0.57‐1.87).
4.2.5 Linked Errors
Seven prescribing errors were linked to administration errors and eight prescribing errors
were linked to dispensing errors. There were 15 administration errors linked to dispensing
errors.
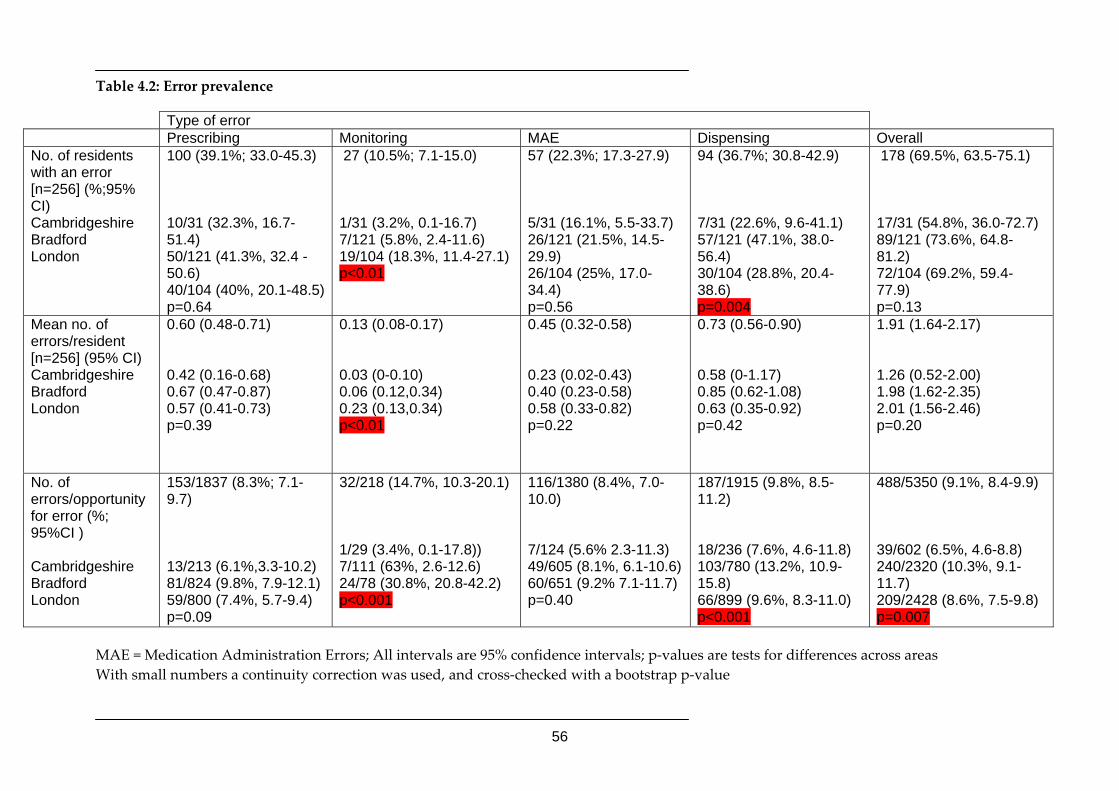
56
Table 4.2: Error prevalence
Type of error Prescribing Monitoring MAE Dispensing Overall No. of residents with an error [n=256] (%;95% CI) Cambridgeshire Bradford London
100 (39.1%; 33.0-45.3) 10/31 (32.3%, 16.7-51.4) 50/121 (41.3%, 32.4 -50.6) 40/104 (40%, 20.1-48.5) p=0.64
27 (10.5%; 7.1-15.0) 1/31 (3.2%, 0.1-16.7) 7/121 (5.8%, 2.4-11.6) 19/104 (18.3%, 11.4-27.1) p<0.01
57 (22.3%; 17.3-27.9) 5/31 (16.1%, 5.5-33.7) 26/121 (21.5%, 14.5-29.9) 26/104 (25%, 17.0-34.4) p=0.56
94 (36.7%; 30.8-42.9) 7/31 (22.6%, 9.6-41.1) 57/121 (47.1%, 38.0-56.4) 30/104 (28.8%, 20.4-38.6) p=0.004
178 (69.5%, 63.5-75.1) 17/31 (54.8%, 36.0-72.7) 89/121 (73.6%, 64.8-81.2) 72/104 (69.2%, 59.4-77.9) p=0.13
Mean no. of errors/resident [n=256] (95% CI) Cambridgeshire Bradford London
0.60 (0.48-0.71) 0.42 (0.16-0.68) 0.67 (0.47-0.87) 0.57 (0.41-0.73) p=0.39
0.13 (0.08-0.17) 0.03 (0-0.10) 0.06 (0.12,0.34) 0.23 (0.13,0.34) p<0.01
0.45 (0.32-0.58) 0.23 (0.02-0.43) 0.40 (0.23-0.58) 0.58 (0.33-0.82) p=0.22
0.73 (0.56-0.90) 0.58 (0-1.17) 0.85 (0.62-1.08) 0.63 (0.35-0.92) p=0.42
1.91 (1.64-2.17) 1.26 (0.52-2.00) 1.98 (1.62-2.35) 2.01 (1.56-2.46) p=0.20
No. of errors/opportunity for error (%; 95%CI ) Cambridgeshire Bradford London
153/1837 (8.3%; 7.1-9.7) 13/213 (6.1%,3.3-10.2) 81/824 (9.8%, 7.9-12.1) 59/800 (7.4%, 5.7-9.4) p=0.09
32/218 (14.7%, 10.3-20.1) 1/29 (3.4%, 0.1-17.8)) 7/111 (63%, 2.6-12.6) 24/78 (30.8%, 20.8-42.2) p<0.001
116/1380 (8.4%, 7.0-10.0) 7/124 (5.6% 2.3-11.3) 49/605 (8.1%, 6.1-10.6) 60/651 (9.2% 7.1-11.7) p=0.40
187/1915 (9.8%, 8.5-11.2) 18/236 (7.6%, 4.6-11.8) 103/780 (13.2%, 10.9-15.8) 66/899 (9.6%, 8.3-11.0) p<0.001
488/5350 (9.1%, 8.4-9.9) 39/602 (6.5%, 4.6-8.8) 240/2320 (10.3%, 9.1-11.7) 209/2428 (8.6%, 7.5-9.8) p=0.007
MAE = Medication Administration Errors; All intervals are 95% confidence intervals; p‐values are tests for differences across areas With small numbers a continuity correction was used, and cross‐checked with a bootstrap p‐value
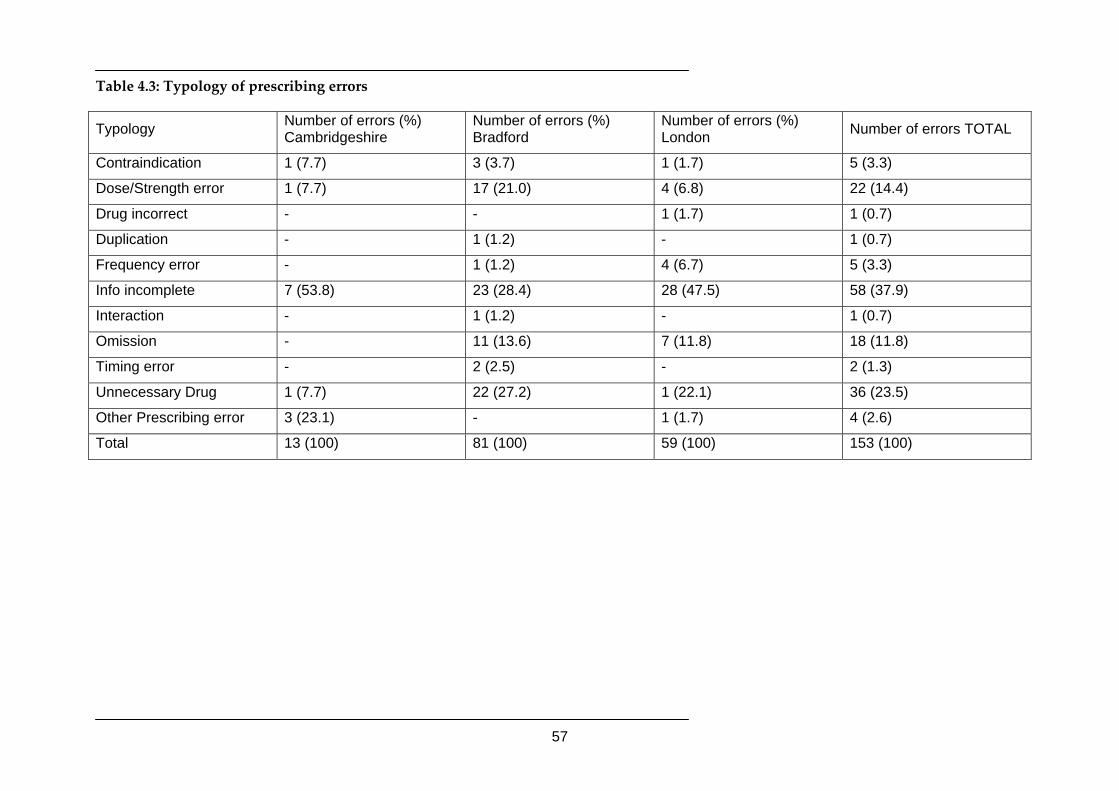
57
Table 4.3: Typology of prescribing errors
Typology Number of errors (%) Cambridgeshire
Number of errors (%) Bradford
Number of errors (%) London Number of errors TOTAL
Contraindication 1 (7.7) 3 (3.7) 1 (1.7) 5 (3.3)
Dose/Strength error 1 (7.7) 17 (21.0) 4 (6.8) 22 (14.4)
Drug incorrect - - 1 (1.7) 1 (0.7)
Duplication - 1 (1.2) - 1 (0.7)
Frequency error - 1 (1.2) 4 (6.7) 5 (3.3)
Info incomplete 7 (53.8) 23 (28.4) 28 (47.5) 58 (37.9)
Interaction - 1 (1.2) - 1 (0.7)
Omission - 11 (13.6) 7 (11.8) 18 (11.8)
Timing error - 2 (2.5) - 2 (1.3)
Unnecessary Drug 1 (7.7) 22 (27.2) 1 (22.1) 36 (23.5)
Other Prescribing error 3 (23.1) - 1 (1.7) 4 (2.6)
Total 13 (100) 81 (100) 59 (100) 153 (100)
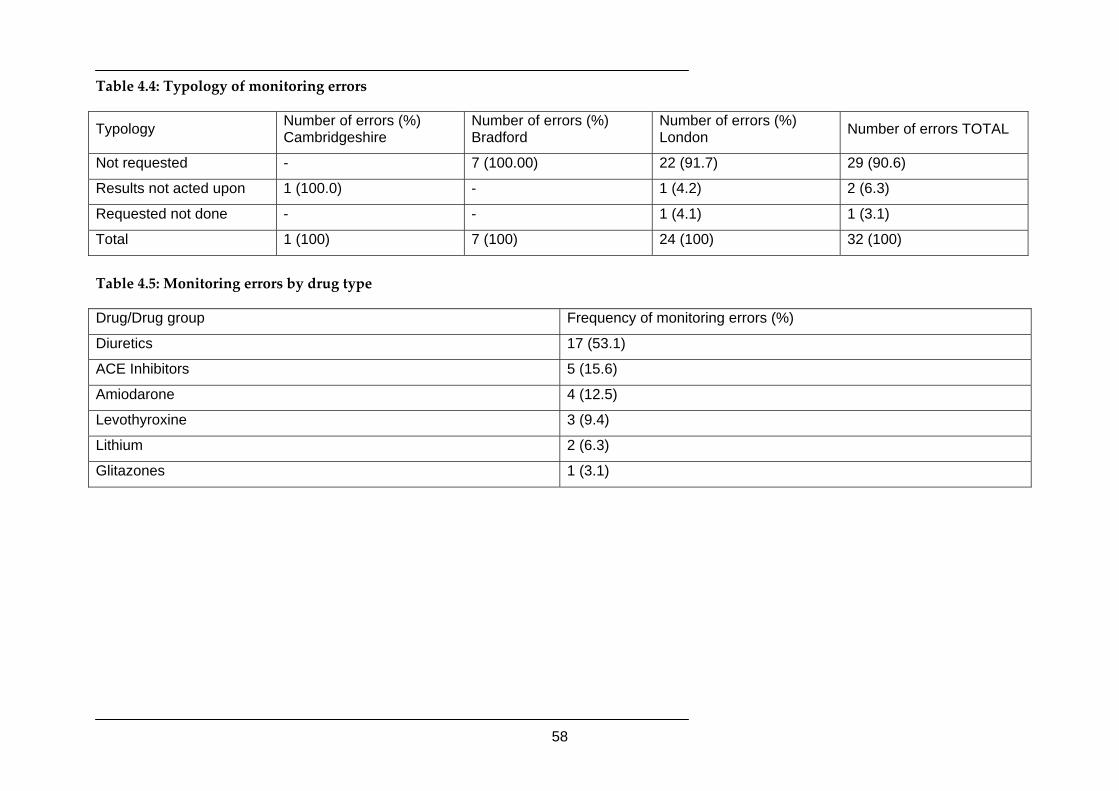
58
Table 4.4: Typology of monitoring errors
Typology Number of errors (%) Cambridgeshire
Number of errors (%) Bradford
Number of errors (%) London Number of errors TOTAL
Not requested - 7 (100.00) 22 (91.7) 29 (90.6)
Results not acted upon 1 (100.0) - 1 (4.2) 2 (6.3)
Requested not done - - 1 (4.1) 1 (3.1)
Total 1 (100) 7 (100) 24 (100) 32 (100)
Table 4.5: Monitoring errors by drug type
Drug/Drug group Frequency of monitoring errors (%)
Diuretics 17 (53.1)
ACE Inhibitors 5 (15.6)
Amiodarone 4 (12.5)
Levothyroxine 3 (9.4)
Lithium 2 (6.3)
Glitazones 1 (3.1)
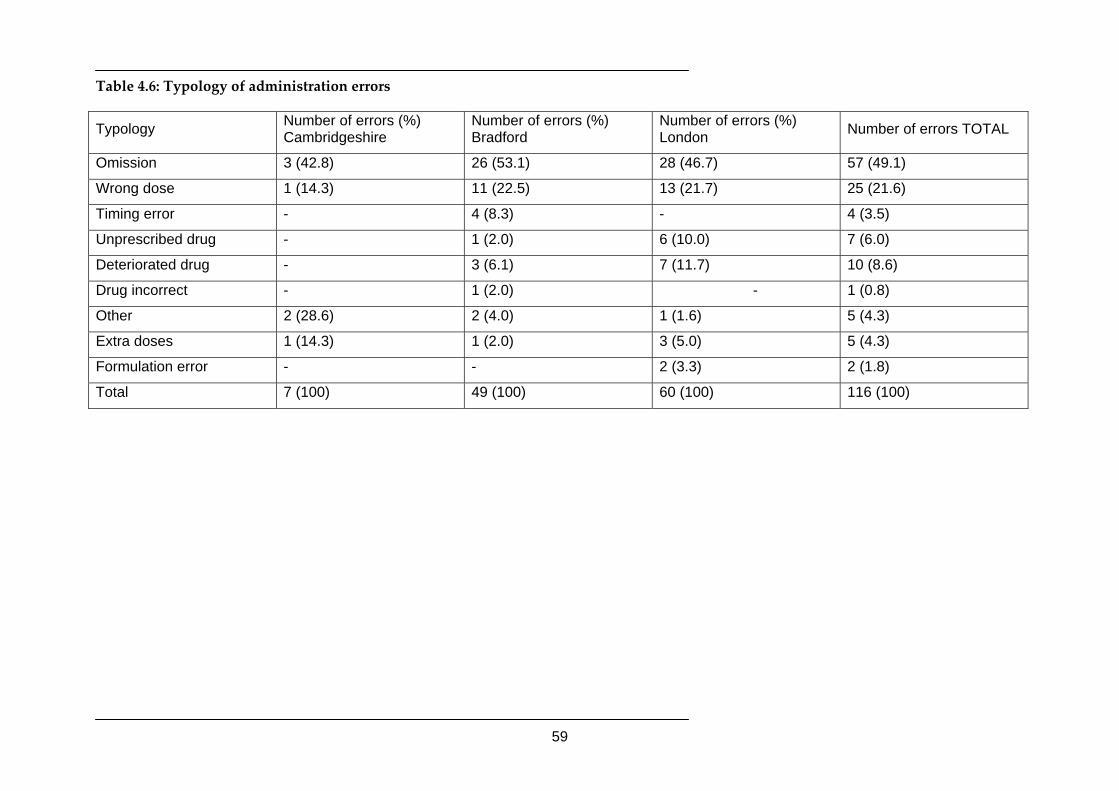
59
Table 4.6: Typology of administration errors
Typology Number of errors (%) Cambridgeshire
Number of errors (%) Bradford
Number of errors (%) London Number of errors TOTAL
Omission 3 (42.8) 26 (53.1) 28 (46.7) 57 (49.1)
Wrong dose 1 (14.3) 11 (22.5) 13 (21.7) 25 (21.6)
Timing error - 4 (8.3) - 4 (3.5)
Unprescribed drug - 1 (2.0) 6 (10.0) 7 (6.0)
Deteriorated drug - 3 (6.1) 7 (11.7) 10 (8.6)
Drug incorrect - 1 (2.0) - 1 (0.8)
Other 2 (28.6) 2 (4.0) 1 (1.6) 5 (4.3)
Extra doses 1 (14.3) 1 (2.0) 3 (5.0) 5 (4.3)
Formulation error - - 2 (3.3) 2 (1.8)
Total 7 (100) 49 (100) 60 (100) 116 (100)
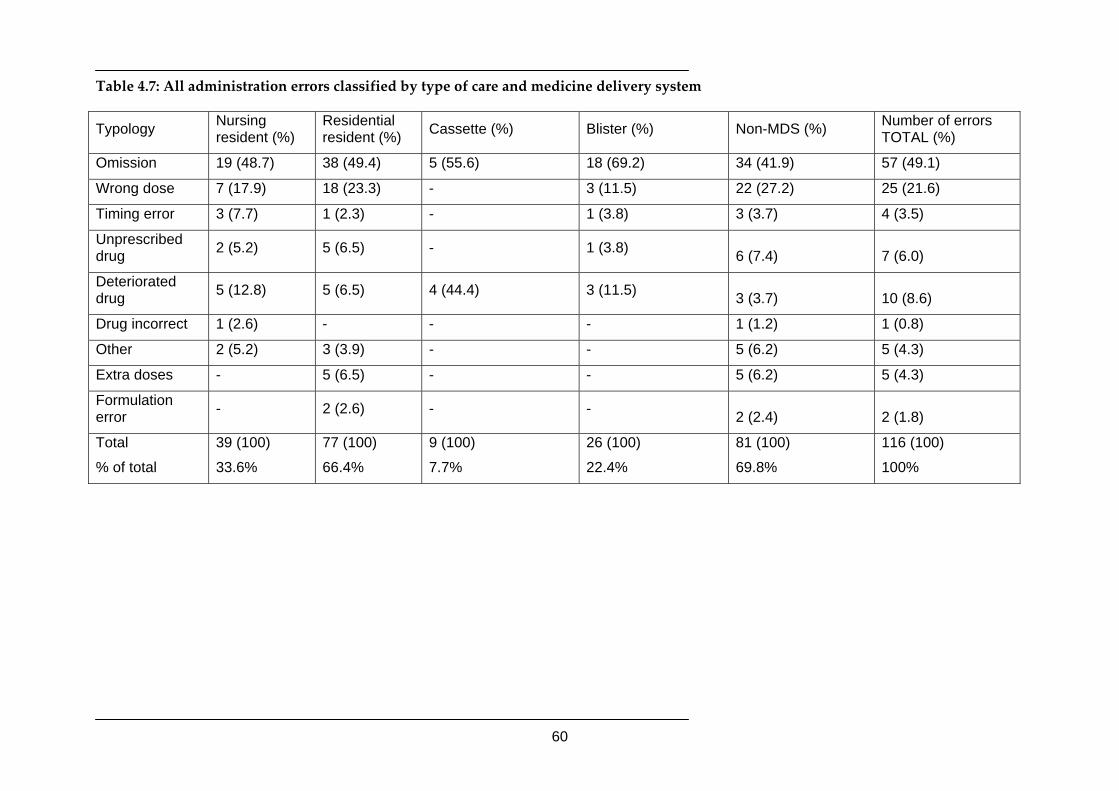
60
Table 4.7: All administration errors classified by type of care and medicine delivery system
Typology Nursing resident (%)
Residential resident (%) Cassette (%) Blister (%) Non-MDS (%) Number of errors
TOTAL (%)
Omission 19 (48.7) 38 (49.4) 5 (55.6) 18 (69.2) 34 (41.9) 57 (49.1)
Wrong dose 7 (17.9) 18 (23.3) - 3 (11.5) 22 (27.2) 25 (21.6)
Timing error 3 (7.7) 1 (2.3) - 1 (3.8) 3 (3.7) 4 (3.5)
Unprescribed drug 2 (5.2) 5 (6.5) - 1 (3.8) 6 (7.4) 7 (6.0)
Deteriorated drug 5 (12.8) 5 (6.5) 4 (44.4) 3 (11.5) 3 (3.7) 10 (8.6)
Drug incorrect 1 (2.6) - - - 1 (1.2) 1 (0.8)
Other 2 (5.2) 3 (3.9) - - 5 (6.2) 5 (4.3)
Extra doses - 5 (6.5) - - 5 (6.2) 5 (4.3)
Formulation error - 2 (2.6) - - 2 (2.4) 2 (1.8)
Total
% of total
39 (100)
33.6%
77 (100)
66.4%
9 (100)
7.7%
26 (100)
22.4%
81 (100)
69.8%
116 (100)
100%
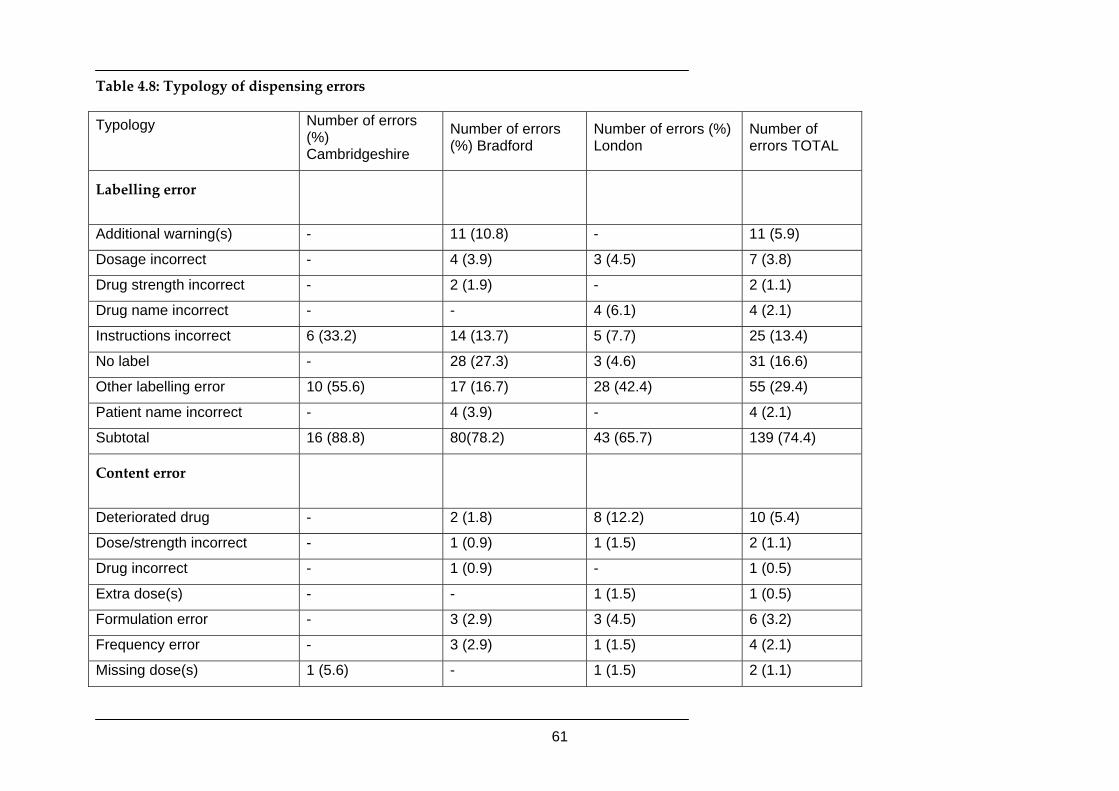
61
Table 4.8: Typology of dispensing errors
Typology
Number of errors (%) Cambridgeshire
Number of errors (%) Bradford
Number of errors (%) London
Number of errors TOTAL
Labelling error
Additional warning(s) - 11 (10.8) - 11 (5.9)
Dosage incorrect - 4 (3.9) 3 (4.5) 7 (3.8)
Drug strength incorrect - 2 (1.9) - 2 (1.1)
Drug name incorrect - - 4 (6.1) 4 (2.1)
Instructions incorrect 6 (33.2) 14 (13.7) 5 (7.7) 25 (13.4)
No label - 28 (27.3) 3 (4.6) 31 (16.6)
Other labelling error 10 (55.6) 17 (16.7) 28 (42.4) 55 (29.4)
Patient name incorrect - 4 (3.9) - 4 (2.1)
Subtotal 16 (88.8) 80(78.2) 43 (65.7) 139 (74.4)
Content error
Deteriorated drug - 2 (1.8) 8 (12.2) 10 (5.4)
Dose/strength incorrect - 1 (0.9) 1 (1.5) 2 (1.1)
Drug incorrect - 1 (0.9) - 1 (0.5)
Extra dose(s) - - 1 (1.5) 1 (0.5)
Formulation error - 3 (2.9) 3 (4.5) 6 (3.2)
Frequency error - 3 (2.9) 1 (1.5) 4 (2.1)
Missing dose(s) 1 (5.6) - 1 (1.5) 2 (1.1)
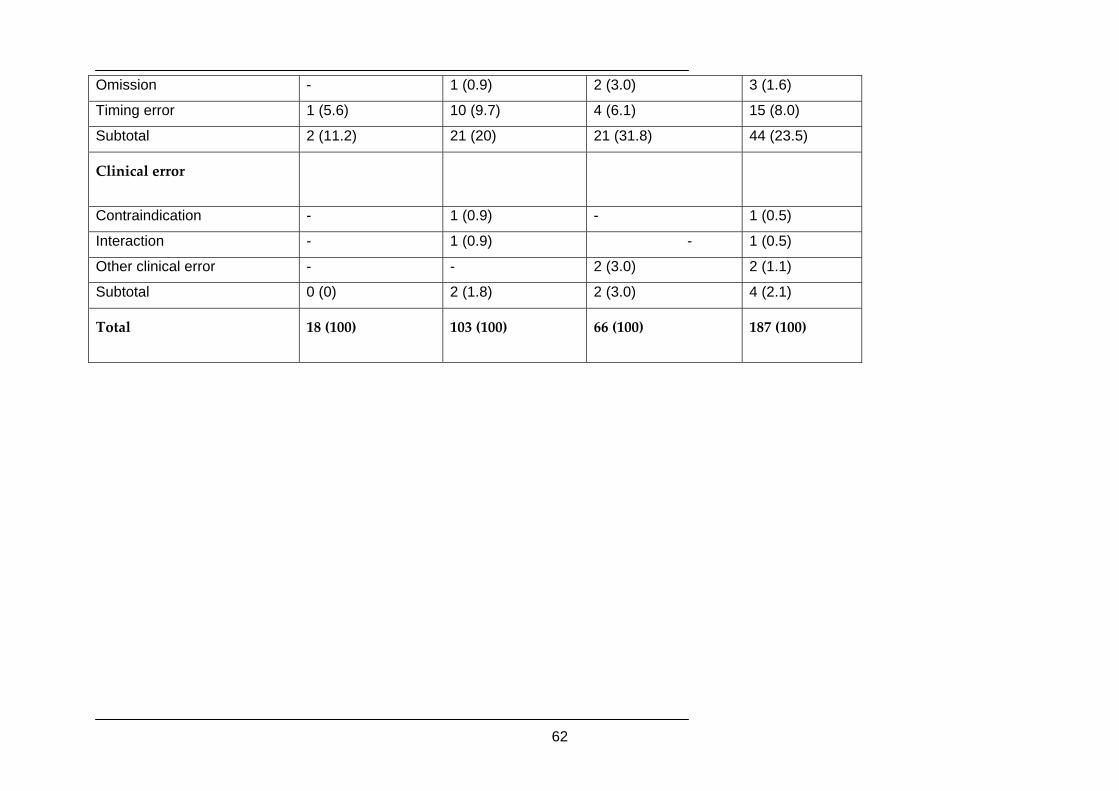
62
Omission - 1 (0.9) 2 (3.0) 3 (1.6)
Timing error 1 (5.6) 10 (9.7) 4 (6.1) 15 (8.0)
Subtotal 2 (11.2) 21 (20) 21 (31.8) 44 (23.5)
Clinical error
Contraindication - 1 (0.9) - 1 (0.5)
Interaction - 1 (0.9) - 1 (0.5)
Other clinical error - - 2 (3.0) 2 (1.1)
Subtotal 0 (0) 2 (1.8) 2 (3.0) 4 (2.1)
Total 18 (100) 103 (100) 66 (100) 187 (100)
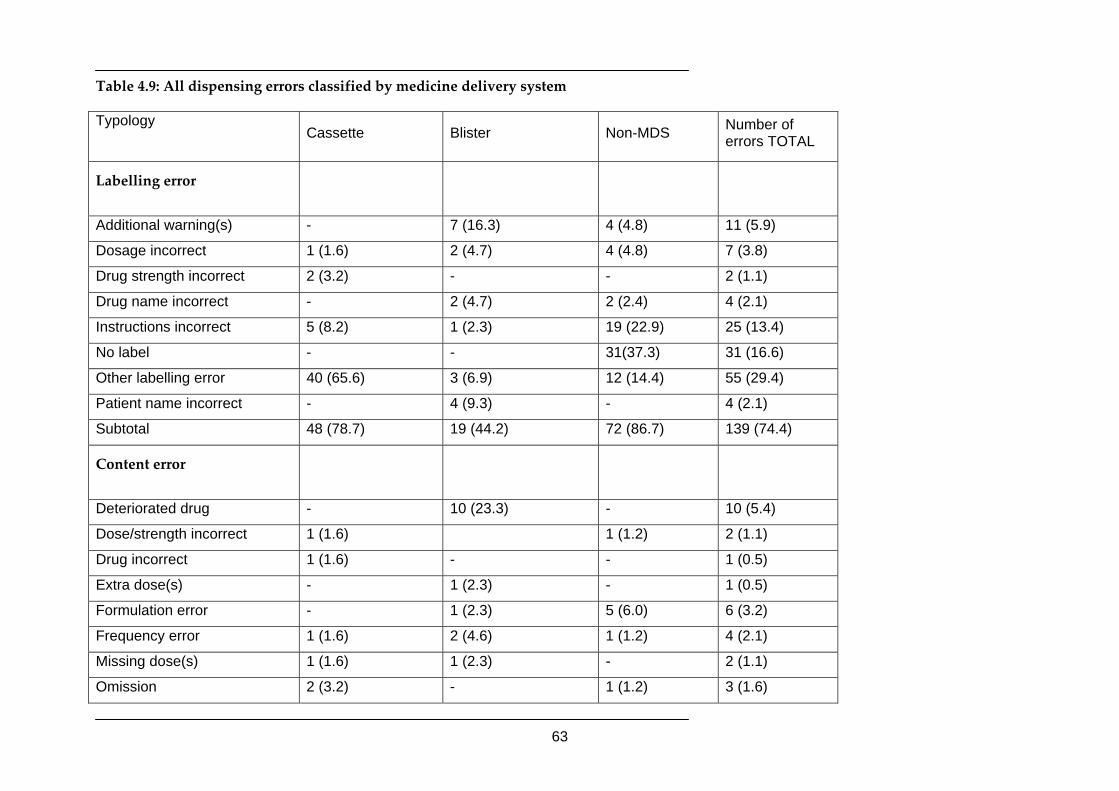
63
Table 4.9: All dispensing errors classified by medicine delivery system
Typology
Cassette Blister Non-MDS Number of
errors TOTAL
Labelling error
Additional warning(s) - 7 (16.3) 4 (4.8) 11 (5.9)
Dosage incorrect 1 (1.6) 2 (4.7) 4 (4.8) 7 (3.8)
Drug strength incorrect 2 (3.2) - - 2 (1.1)
Drug name incorrect - 2 (4.7) 2 (2.4) 4 (2.1)
Instructions incorrect 5 (8.2) 1 (2.3) 19 (22.9) 25 (13.4)
No label - - 31(37.3) 31 (16.6)
Other labelling error 40 (65.6) 3 (6.9) 12 (14.4) 55 (29.4)
Patient name incorrect - 4 (9.3) - 4 (2.1)
Subtotal 48 (78.7) 19 (44.2) 72 (86.7) 139 (74.4)
Content error
Deteriorated drug - 10 (23.3) - 10 (5.4)
Dose/strength incorrect 1 (1.6) 1 (1.2) 2 (1.1)
Drug incorrect 1 (1.6) - - 1 (0.5)
Extra dose(s) - 1 (2.3) - 1 (0.5)
Formulation error - 1 (2.3) 5 (6.0) 6 (3.2)
Frequency error 1 (1.6) 2 (4.6) 1 (1.2) 4 (2.1)
Missing dose(s) 1 (1.6) 1 (2.3) - 2 (1.1)
Omission 2 (3.2) - 1 (1.2) 3 (1.6)
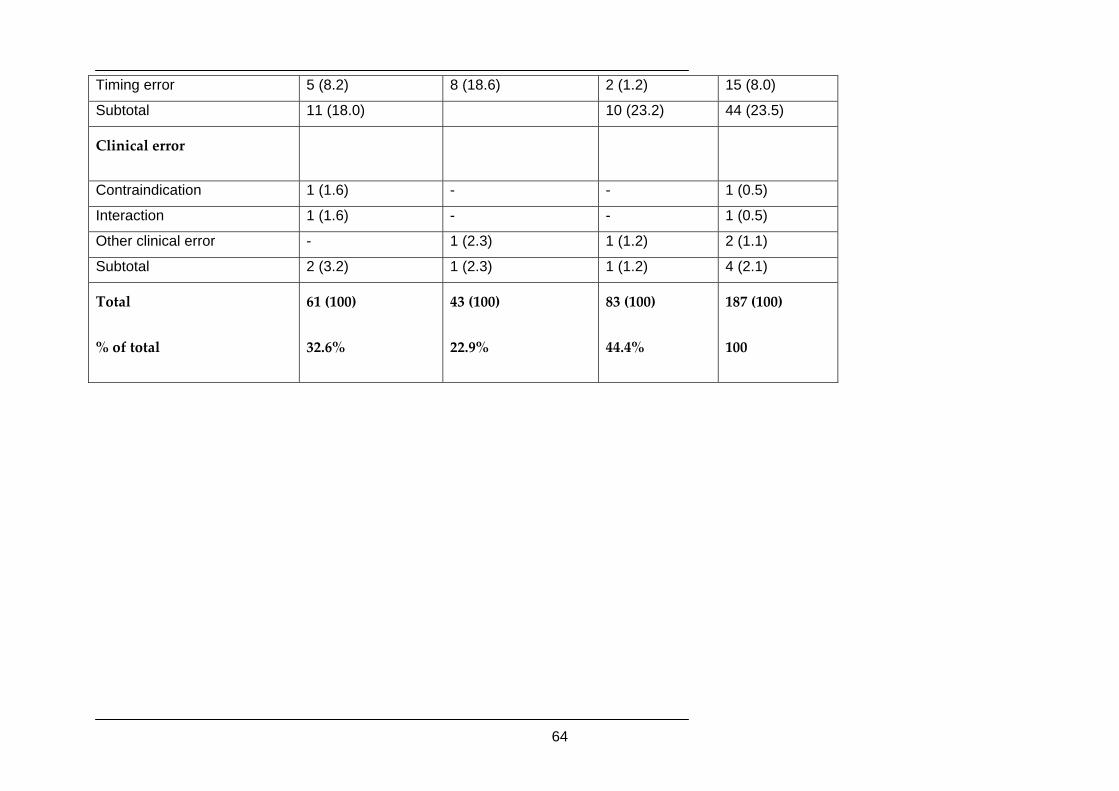
64
Timing error 5 (8.2) 8 (18.6) 2 (1.2) 15 (8.0)
Subtotal 11 (18.0) 10 (23.2) 44 (23.5)
Clinical error
Contraindication 1 (1.6) - - 1 (0.5)
Interaction 1 (1.6) - - 1 (0.5)
Other clinical error - 1 (2.3) 1 (1.2) 2 (1.1)
Subtotal 2 (3.2) 1 (2.3) 1 (1.2) 4 (2.1)
Total
% of total
61 (100)
32.6%
43 (100)
22.9%
83 (100)
44.4%
187 (100)
100
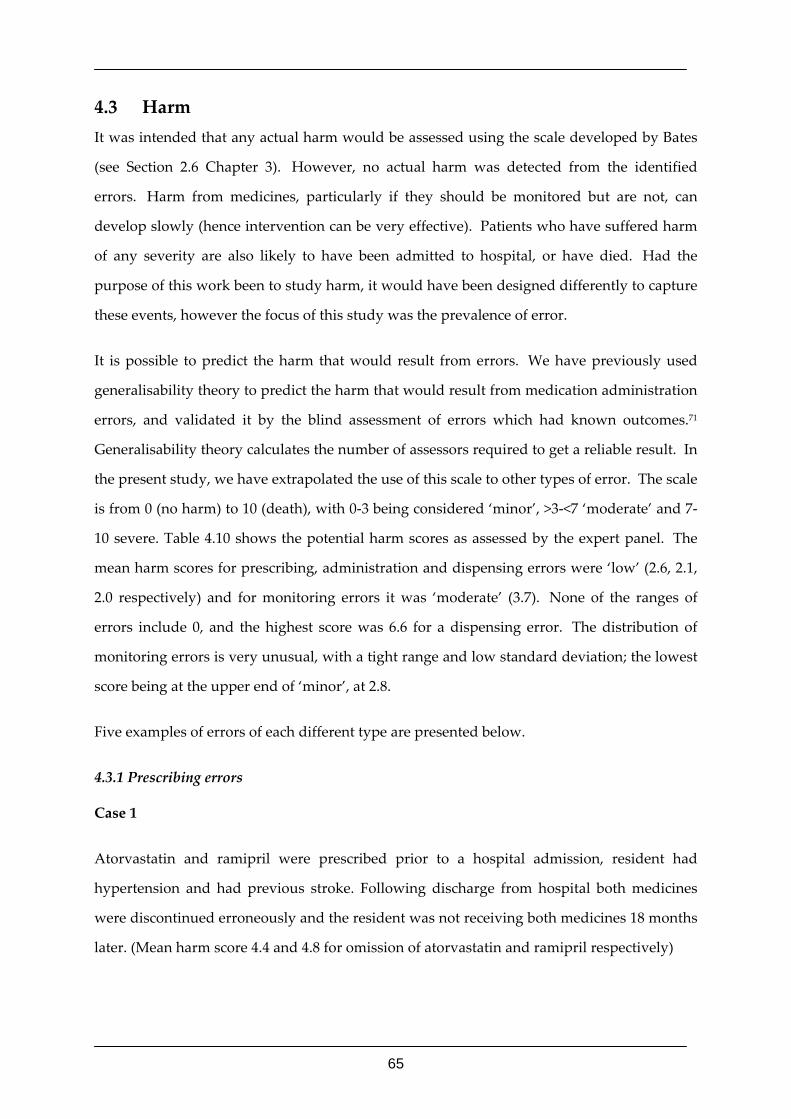
65
4.3 Harm It was intended that any actual harm would be assessed using the scale developed by Bates
(see Section 2.6 Chapter 3). However, no actual harm was detected from the identified
errors. Harm from medicines, particularly if they should be monitored but are not, can
develop slowly (hence intervention can be very effective). Patients who have suffered harm
of any severity are also likely to have been admitted to hospital, or have died. Had the
purpose of this work been to study harm, it would have been designed differently to capture
these events, however the focus of this study was the prevalence of error.
It is possible to predict the harm that would result from errors. We have previously used
generalisability theory to predict the harm that would result from medication administration
errors, and validated it by the blind assessment of errors which had known outcomes.71
Generalisability theory calculates the number of assessors required to get a reliable result. In
the present study, we have extrapolated the use of this scale to other types of error. The scale
is from 0 (no harm) to 10 (death), with 0‐3 being considered ‘minor’, >3‐<7 ‘moderate’ and 7‐
10 severe. Table 4.10 shows the potential harm scores as assessed by the expert panel. The
mean harm scores for prescribing, administration and dispensing errors were ‘low’ (2.6, 2.1,
2.0 respectively) and for monitoring errors it was ‘moderate’ (3.7). None of the ranges of
errors include 0, and the highest score was 6.6 for a dispensing error. The distribution of
monitoring errors is very unusual, with a tight range and low standard deviation; the lowest
score being at the upper end of ‘minor’, at 2.8.
Five examples of errors of each different type are presented below.
4.3.1 Prescribing errors
Case 1
Atorvastatin and ramipril were prescribed prior to a hospital admission, resident had
hypertension and had previous stroke. Following discharge from hospital both medicines
were discontinued erroneously and the resident was not receiving both medicines 18 months
later. (Mean harm score 4.4 and 4.8 for omission of atorvastatin and ramipril respectively)
66
Case 2
Glimepiride tablets prescribed “3mg daily” by GP for Type 2 diabetes. The diabetic specialist
clinic had recommended it be increased to 4mg daily as resident’s glycosylated haemoglobin
(HbA1c) remained elevated at 9.7% (target <7.5%). The dose had not been increased by the
GP and there was no record in the medical notes to indicate this was deliberate. (Mean harm
score 5.2)
Case 3
Tramadol capsules 50 mg prescribed “one to be taken up to four times a day” for chronic
foot pain, resident also taking warfarin for long term DVT prophylaxis (Tramadol can
enhance the effect of warfarin). International normalised ration (INR) checked regularly with
erratic results ranging from 0.9‐4.5. (Mean harm score 5.8)
Case 4
Amiodarone tablets 200mg prescribed “one daily” commenced in 2001 for atrial fibrillation.
Two hospital communications indicated that the amiodarone had been stopped during the
admission to hospital as the resident was found to be in sinus rhythm. The amiodarone had
not been discontinued by the GP and there was no indication in the medical notes that the
continuation was deliberate. (Mean harm score 5.2)
Case 5
Donepezil 10mg tablets prescribed “one daily” for dementia. Following a review from
hospital specialist a letter to the GP indicated Aricept® (brand name for donepezil) should
be stopped. The donepezil had not been discontinued by the GP and there was no indication
in the medical notes that the continuation was deliberate. (Mean harm score 1.8)
4.3.2 Monitoring errors
Case 1
Bumetanide 1mg tablets prescribed “one daily” for heart failure for at least 3 years, however
urea and electrolytes had never been checked in this time by the GP. (Mean harm score 4.6)
67
Case 2
Lisinopril 5mg tablets prescribed “one daily” for hypertension for a resident with an
estimated creatinine clearance of 19ml/min. A potassium level had been checked one year
ago and had revealed a high potassium level 5.8mmol/l (range 3.5‐5mmol/l): no action was
taken. (Mean harm score 5.8)
Case 3
Lithium carbonate 250mg tablets prescribed “one daily” for bipolar affective disorder. The
lithium level was last checked 13 months ago. (Mean harm score 5.2)
Case 4
Amiodarone 200mg tablets prescribed “one daily” for atrial fibrillation. Thyroid function
tests were last checked 9 months ago, when Thyroid Stimulating Hormone (TSH) was 12.9
mlU/l (range 0.3‐5.5 mlU/l) and T4 (thyroxine) was 18 nmol/l (range 50‐151 nmol/l) and no
action had been taken. (Mean harm score 5.8)
Case 5
Furosemide 40mg tablets prescribed “one twice a day” for knee oedema, urea and
electrolytes were last checked two years ago. (Mean harm score 3.8)
4.3.3 Medication Administration errors
Case 1
Casodex® (bicalutamide) 150mg tablets “one daily” were prescribed by the hospital for
prostate cancer and this prescription was continued by the GP generically as bicalutamide.
They were administered simultaneously for two days resulting in the resident receiving an
overdose. (Mean harm score 1.5)
Case 2
Fluoxetine 20mg capsules were prescribed “one daily” for depression and not administered
for 6 days as drug not in stock. (Mean harm score 3.0)
68
Case 3
Beclometasone 200 inhaler prescribed “two puffs twice a day as directed” for asthma.
Although an Aerochamber® was available for the resident it was not used. The resident had
poor inhaler technique and was not encouraged to rinse afterwards. (Mean harm score 3.4)
Case 4
Bendroflumethiazide 2.5mg tablets prescribed “one each morning” for hypertension. This
was discontinued due to low serum sodium of 127 mmol/l (range 135‐145 mmol/l), however
it remained on the current Medication Administration Record when the next monthly drug
supply was made and hence continued to be administered. (Mean harm score 4.6)
Case 5
Glyceryl trinitrate patch prescribed generically “5mg/24 hours take HALF daily” for
ischaemic heart disease. A patch was cut in half and applied to the resident’s chest despite
the fact that the contents were leaking out. The patch dispensed was Transiderm Nitro®
brand which is a reservoir patch and is unsuitable for cutting. (Mean harm score 4.6)
4.3.4 Dispensing errors
Case 1
Alendronate 70mg tablet prescribed “once weekly” for osteoporosis. The pharmacy
indicated on the Medication Administration Record for this to be given at the same time as
calcium and all other medicines. No warning labels on pharmacy label or Medication
Administration Record to indicate “Take before food” or “Follow printed instructions”.
Alendronate should be taken on an empty stomach at least 30 minutes before breakfast (or
other oral medicine); and remain upright for at least 30 minutes after taking the medicine.
(Mean harm score 3.6)
Case 2
Casodex® (brand name for bicalutamide) 150mg tablets dispensed from a hospital
prescription and later bicalutamide 150mg tablets dispensed from an FP10 for the same
69
resident. No evidence to indicate the care home had been informed by the pharmacy that
these medicines were identical. (Mean harm score 3.0)
Case 3
Lorazepam 500micrograms/5ml suspension prescribed “5ml at night as required” to settle at
night. Pharmacy labelled indicated “Lorazepam 500mg suspension” but with no strength
specified. The repeat prescription directions were “5mls at night as required” however
pharmacy label stated “Take 5ml when required”. No additional warning labels were
included on the pharmacy label. (Mean harm score 3.6)
Case 4
Tramadol 50mg capsules dispensed “one to be taken up to four times a day” as prescribed
despite the fact that the resident was taking warfarin regularly (see case 3 in prescribing
errors for more details). (Mean harm score 5.8)
Case 5
Aspirin enteric coated 75mg tablets dispensed instead of zopiclone 7.5mg tablets as a 7 day
supply in a cassette dispensing system. (Mean harm score 5.0)
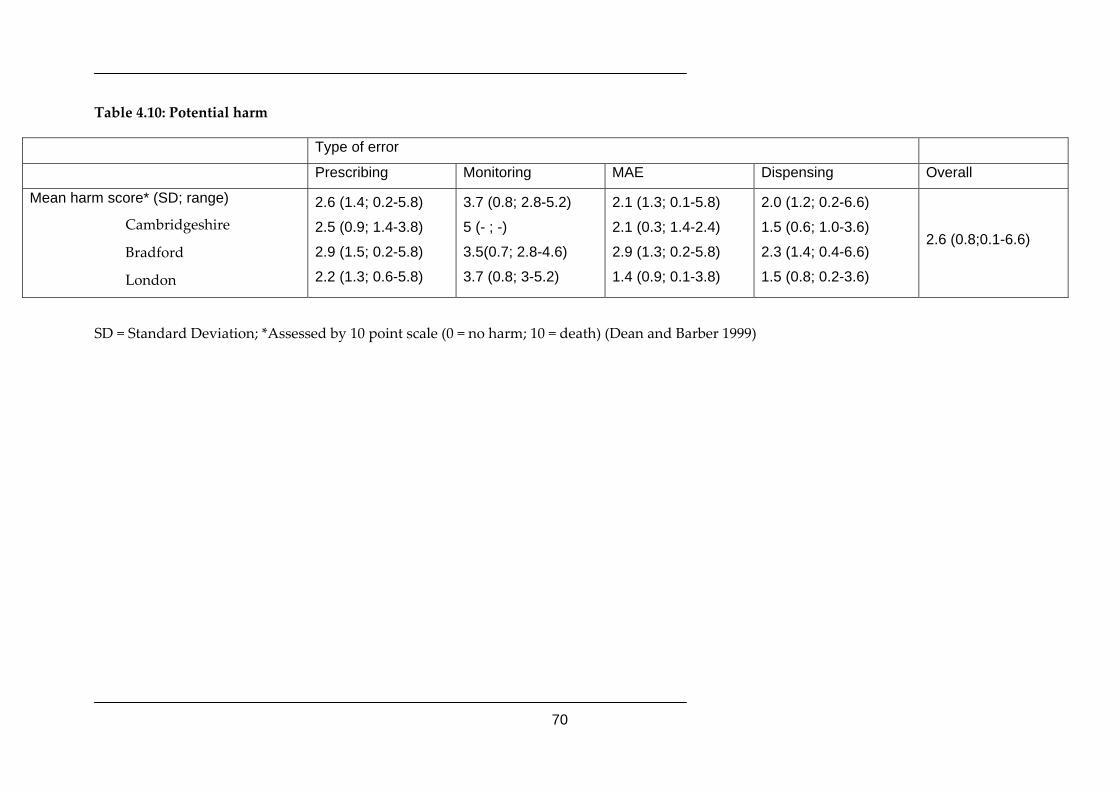
70
Table 4.10: Potential harm
Type of error
Prescribing Monitoring MAE Dispensing Overall
Mean harm score* (SD; range)
Cambridgeshire
Bradford
London
2.6 (1.4; 0.2-5.8)
2.5 (0.9; 1.4-3.8)
2.9 (1.5; 0.2-5.8)
2.2 (1.3; 0.6-5.8)
3.7 (0.8; 2.8-5.2)
5 (- ; -)
3.5(0.7; 2.8-4.6)
3.7 (0.8; 3-5.2)
2.1 (1.3; 0.1-5.8)
2.1 (0.3; 1.4-2.4)
2.9 (1.3; 0.2-5.8)
1.4 (0.9; 0.1-3.8)
2.0 (1.2; 0.2-6.6)
1.5 (0.6; 1.0-3.6)
2.3 (1.4; 0.4-6.6)
1.5 (0.8; 0.2-3.6)
2.6 (0.8;0.1-6.6)
SD = Standard Deviation; *Assessed by 10 point scale (0 = no harm; 10 = death) (Dean and Barber 1999)
71
Chapter 5 The Causes of Errors I: Analysis of identified errors
5.1 Introduction In this section we seek understanding of why the errors we have documented occurred.
In this chapter we investigate the causes of errors and in Chapter 6 we extend this to
evaluate the dispensing process and monitored dosage systems in particular. In this
introduction, before presenting the methods and results in detail, we give an overview of
the theories of human error which were used as the theoretical framework.
When attempting to understand the causes of error both the individual and the system, or
context in which the individual works, need to be considered. Reason’s organisational
accident model28 incorporates both individual and system factors and has been adapted by
into a framework specific to healthcare by Vincent et al.29
The actions of the individual are the focus of two general models. These are: Rasmussen’s27
Skill ‐ Rule ‐ Knowledge (S‐R‐K) Model; and Reason’s28 generic error‐modelling system
(GEMS). The Skill‐Rule‐Knowledge Model distinguishes between three types of actions.
Skills refer to automatic, familiar, well‐practised actions, e.g. an experienced driver; Rule
refers to rehearsed routine patterns that require some conscious thought or effort; and
Knowledge refers to new tasks, where there are no existing rules or actions to refer to. This
type of action requires a lot of conscious thought and effort, e.g. when first learning to drive
a car. Reason extended Rasmussen’s Skill, Rule, Knowledge (S‐R‐K) classification of actions
to identify types of errors. Skill‐based errors are those where the individual is conducting a
task in which he or she is skilled, gets interrupted and then makes an error. Reason refers to
these as slips or lapses. The other two types of errors, which Reason labels ‘mistakes’ refer
to planning or problem‐solving failures. Rule‐based errors refer to the misapplication of a
good rule, e.g. prescribing one drug but writing the dose of another, similar type of drug or
similar sounding drug. Knowledge‐based errors occur in novel situations, with the use of
inaccurate or incomplete information and where the person is subject to biases.
72
In addition to errors, Reason also distinguishes between different types of violations.
Violations are distinguished from errors in that they are done deliberately, i.e. with
conscious effort and the individual is aware they are violating a rule or protocol (Reason
1990). Types are: Routine violations, where corners are cut at every opportunity;
Optimising violations, where actions are made to further personal rather than strictly task‐
related goals; and Necessary or situational violations which are acts that seem to offer the
only path available to get the job done as rules/procedures are considered inappropriate for
the current situation.
System factors are taken into account in Reason’s Organisational Accident Model71 by
making a distinction between active failures and latent conditions. Active failures are
defined as errors and violations, described above; the ‘unsafe acts’ carried out by those
working directly with patients, e.g. general practitioners, nurses, pharmacists, etc. These
actions can have immediate adverse consequences. In contrast, latent failures are systems
failures which can lay dormant for a long time, only becoming evident when they combine
with other factors to break through the system’s defences. These latent failures are
committed by those away from the immediate healthcare area, such as designers, high‐level
decision makers, managers and maintenance personnel. These failures are influenced by
various factors which may have economic, political, or practical constraints..
Based on the error theories described above Vincent and colleagues created a framework for
the analysis of adverse events and critical incidents in healthcare. This framework includes
active failures, error and violation producing conditions, and latent conditions. In
particular the framework considers the following factors when assessing the causes and
contributory factors of each incident: the patient’s characteristics, including their condition;
the individual member of staff; the nature of the task itself; the environment in which they
work; the healthcare team, including communication and supervision; and the
organisational factors that influence the work environment and conditions, such as policy
and economic decisions (latent conditions or failures). The framework we use is illustrated
in Figure 5.1
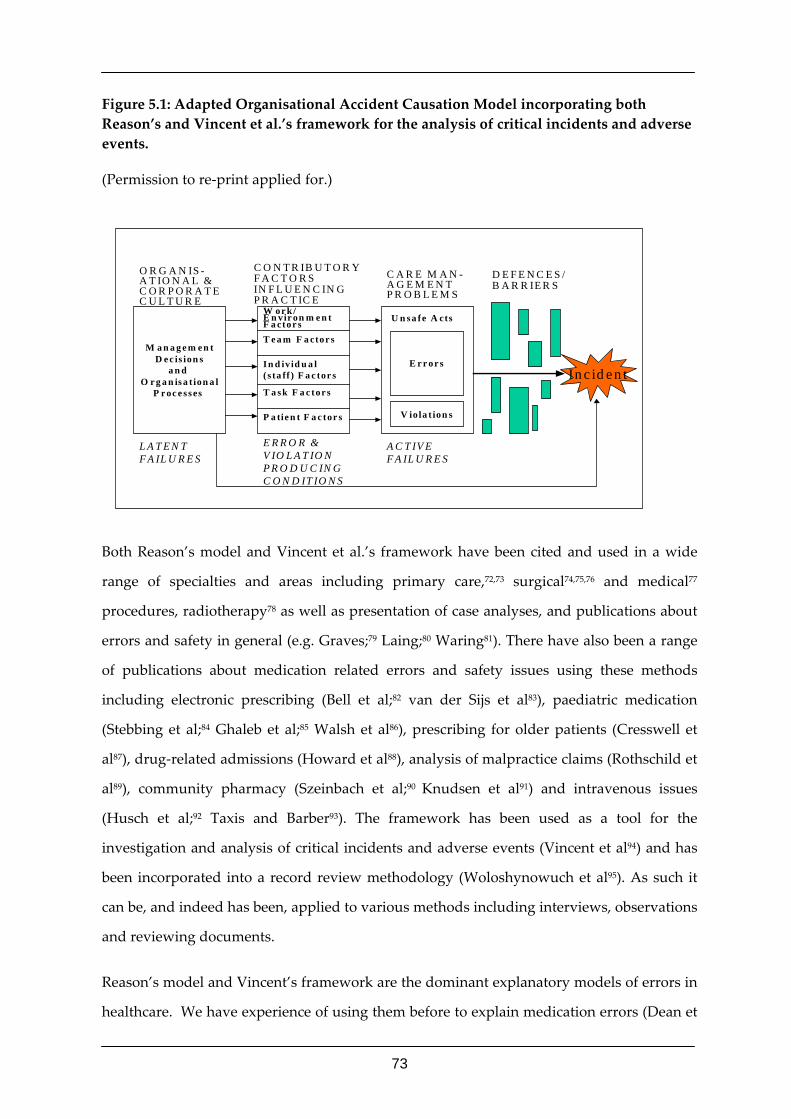
73
Figure 5.1: Adapted Organisational Accident Causation Model incorporating both Reason’s and Vincent et al.’s framework for the analysis of critical incidents and adverse events.
(Permission to re‐print applied for.)
M a n a g e m e n tD e c is ion s
a n d O r g a n isa t ion a l
P r oc e s ses
In c id en tE r r or s
V io la t ion s
U n sa fe A ctsW or k / E n vir on m e n t F a ctor sT e a m F a ctor s
In d iv id u a l ( s ta ff ) F a c tor s
T a sk F a c tor s
P a tie n t F a c tor s
L A T E N T F A IL U R E S
E R R O R & V IO L A T IO N P R O D U C IN G C O N D IT IO N S
A C T IV E F A IL U R E S
O R G A N IS -A T IO N A L & C O R P O R A T E C U L T U R E
C O N T R IB U T O R Y F A C T O R S IN F L U E N C IN G P R A C T IC E
C A R E M A N -A G E M E N T P R O B L E M S
D E F E N C E S / B A R R IE R S
Both Reason’s model and Vincent et al.’s framework have been cited and used in a wide
range of specialties and areas including primary care,72,73 surgical74,75,76 and medical77
procedures, radiotherapy78 as well as presentation of case analyses, and publications about
errors and safety in general (e.g. Graves;79 Laing;80 Waring81). There have also been a range
of publications about medication related errors and safety issues using these methods
including electronic prescribing (Bell et al;82 van der Sijs et al83), paediatric medication
(Stebbing et al;84 Ghaleb et al;85 Walsh et al86), prescribing for older patients (Cresswell et
al87), drug‐related admissions (Howard et al88), analysis of malpractice claims (Rothschild et
al89), community pharmacy (Szeinbach et al;90 Knudsen et al91) and intravenous issues
(Husch et al;92 Taxis and Barber93). The framework has been used as a tool for the
investigation and analysis of critical incidents and adverse events (Vincent et al94) and has
been incorporated into a record review methodology (Woloshynowuch et al95). As such it
can be, and indeed has been, applied to various methods including interviews, observations
and reviewing documents.
Reason’s model and Vincent’s framework are the dominant explanatory models of errors in
healthcare. We have experience of using them before to explain medication errors (Dean et
74
al96) and they would appear to be suitable for the data generated, so we had no hesitation in
adopting them for this study.
In order to understand and assess the causes of error we need to establish the following:
what happened and how it happened, then we can assess why it happened. The question
of ‘what happened’ has been answered in the quantitative section of the report. The
question ‘how it happened’ was addressed using human error theory27,28 as described
above. Some errors may not be easily classified into one or other error type using this
taxonomy by those assessing errors, particularly without knowing exactly what type of
action is being executed at the time. This will not only depend on the task, but also the level
of experience and expertise of the individual, and the context in which the individuals are
working at the time such as the level of interruptions, distractions, etc. The question ‘why it
happened’ was assessed (as far as possible) using Vincent et al.’s29 framework for the
analysis of risk and safety in medicine to attempt to identify the immediate conditions that
enable the errors to occur as well as the underlying or root causes of error.
5.2 Methods Information about the causes of errors came from several sources: interviews about specific
errors, interviews about past errors and problems in general, observations of administration
and dispensing, and field notes.
Interviews: We had originally intended to speak to people about specific errors, soon after
the error had happened, as we have done with prescribing errors in hospital.95 This was
possible for administration errors, which were observed by a researcher, and could be
discussed in a sensitive way at the time. In addition to the above in some cases a team
leader, deputy manager or manager was also interviewed. However prescribing errors
were found in the records and had commonly been made in the past; what is more it was
often difficult to get to speak to, and in some cases to identify, the prescribing doctor. Most
doctor interviews were therefore about problems with prescribing to care homes in general.
Doctors were also hesitant to give face–to–face interviews because of time constraints and
many of their interviews were conducted over the telephone.
75
Observation: Nurses and care assistants were observed while administering medicines and
records were made in field notes. In all cases our approach was as naturalistic as possible,
given such observation and recording represented implied criticism in a sensitive area. In
interviews we let the conversation flow, however the questions were structured according
to the analytical framework. Interviews were taped and transcribed when possible,
however this was not always the case (25/59 error specific interviews and 20/22 general
interviews transcribed) and additionally the researchers made notes which they expanded
on after the interview.
Errors were analysed using Reason’s framework28,70 as described in the Introduction to this
chapter. Error producing conditions were divided into patient factors, task factors,
individual factors, team factors and work environment factors.29 Latent factors contributing
to errors were also identified. Often there was insufficient information to definitively say
whether the error was the result of a slip, lapse, mistake or violation. Because we want to
show the way in which various factors relate to each other in the formation of errors we
have chosen to illustrate our points with case summaries rather than decontextualised
quotations.
In all cases interviews were read by several members of the team and the findings discussed
at regular group meetings. For the analysis each case was read by two members of the team
experienced in qualitative research. Errors were assessed from interviews as well as
confirmed using case records and other available documentation such as staff rota or field
notes. One member categorised the data and the second read and critiqued the analysis.
Together they synthesised the findings reported below. Additional sources of information
drawn upon were detailed notes made about the characteristics of each home, and field
notes made by the researchers on their visits to the homes.
5.3 Results 59 interviews were conducted relating to 66 administration errors, 34 dispensing errors, 18
prescribing errors and 8 monitoring errors . Further general interviews were carried out:
11 with pharmacists and 11 with GPs.
76
In the following sections the results are shown in the following order: administration errors,
prescribing and monitoring errors, and dispensing errors.
5.3.1 Administration errors
Patient Factors
Some patients in the care homes lacked both knowledge of their medicines and physical
independence. Lack of patients’ awareness of their own medication was common and
could be considered to have contributed to the majority of administration errors (see case
1). In addition, physical difficulties such as arthritis, difficulties in breathing and
difficulties swallowing made the administration of medicines and inhalers more difficult,
making errors more likely to occur (see case 4). Some patients suffered from dementia or
exhibited challenging and aggressive behaviour. Where patients did take a more active role
in their medicines this was often based on negative beliefs about medicines, e.g fears of
being poisoned or believing that medicines should not be taken on an empty stomach. Such
beliefs contributed to medication not being taken as prescribed. In some cases had the
patient’s relative acted as an advocate for them we would have expected errors would have
been avoided.
Location of patients during the drug round was a further contributing factor. For example,
some patients were asleep when the medication was being given and others changed rooms
in the middle or a drug round, which caused confusion. Being one of the last patients on
the drug round was also an error producing condition in some cases.
Changes to medicines, especially those that occurred in the middle of the monthly
medicines ordering cycle and recent admissions to hospital were identified as error
producing conditions.
Task Factors
Task factors included factors related to the medicines and devices themselves and lack of
use of protocols for administering them. Location of medicines was an identified factor in
homes across the UK. Some medicines could not be placed in the MDS system e.g. liquids,
sachets or those unstable in the system (see case 1). This contributed to them being omitted.
77
This was further exacerbated where medicines outside of the MDS system were placed
together on the drug trolley rather than in individual patient trays or where medicines had
to be kept in the fridge and were therefore not kept on the drug trolley at all. Some
medicines outside the MDS were shared between patients in the majority of homes, e.g.
bottles of lactulose, in order to save room on the drug trolley and therefore could not be put
into individual compartments. In some cases where medicines were omitted, the medicines
were in the wrong place e.g. inside the wrong packet or the wrong person’s medicine
drawer. Where medicines were in a multi dose Nomad system, individual tablets could not
be identified so care home staff were unaware if they had given them or not. In other cases
the medicine had not been reordered and so was not available to be administered. Errors in
ordering occurred in some cases when medicines did not fit into the monthly cycle, e.g. one
bottle of 500ml lactulose being insufficient for the whole month, the prescription being a
week out due to prescription changes during the month or changes occurring after the
monthly order had taken place (see case 2).
Special directions required for medicines contributed to some errors, e.g. medicines which
needed to be taken on an empty stomach (see case 3) or those which were not supposed to
be dissolved. The former was made difficult as medicines rounds took place during meal
times in some homes (see case 3). Inhalers were complex to administer, contributing to
errors (see case 4).
Lack of following systematic protocols contributed to errors. In particular the protocol of
administering medicines by systematically following the MAR chart was rarely used (see
case 2). In some cases the MDS system was not in the same order that the sequence in
which the patients were sitting in the room, and this also contributed to omissions. In
addition, there was often no system in place to remind the carer if a medicine had not been
given in systematic order and needed to be given later.
Other error producing conditions were more specific to particular cases. In one case lack of
the necessary equipment to administer medicine contributed to an error. In another a tablet
got stuck inside a Nomad system and therefore was omitted.
78
Individual factors
Lack of knowledge of the member of staff administering the medicines contributed to
administration errors in all sites involved in this study (see cases 3 and 4). Specifically, lack
of knowledge of inhaler technique was identified in many cases (see case 4). In addition,
lack of knowledge of the required timing of medicines in relation to food or other medicines
was also noted at all sites (see case 3).
A range of other factors relating to the individuals administering the medication were
identified. In some cases carers were inexperienced (see cases 2 and 4), tired (see case 1),
unwell or generally stressed. Being at the end of a shift was also an error producing
condition identified. Lack of motivation to administer medicines from a MAR sheet, rather
than relying on memory contributed to errors in several homes (see case 1). English was
not the first language of a carer in one home and she therefore had difficulty in
communication. In another home, staff had an individual approach to patient care and
altered medicines that are available over the counter to suit the patient e.g. altering the dose
of laxatives. This meant that there were technically errors as the dose given deviated from
the prescribed medication.
Team factors
The Medication Administration Record (MAR chart) is a form produced by the pharmacy
and copies are shared between the home, pharmacy and doctor’s surgery. In theory it
should serve as an accurate record of all medication being taken as well as communicating
any changes in medicines so that the same records are held by all three parties. However,
inaccuracies in the MAR charts contributed to administration errors in care homes at all
sites. Discontinued items were often left on the MAR chart, making it difficult to use. This
was partly caused by care homes not returning the MAR charts to pharmacies, and hence
not communicating changes in medication (see case 2). These changes are therefore not
reflected in the following month’s MAR chart produced by the pharmacy. Even where
information was supplied it was not always accurate. This was due to the pharmacy copy
being a carbon copy and irrelevant information sometimes came through to the copy in
question as a result of pressing on top of the chart of another patient. Where handwritten
79
changes were made on MAR charts during the month, if these were not communicated to
the pharmacy and the GP did not update their own records, they were missed in some
cases.
A number of other difficulties occurred with MAR charts. In some cases two MAR charts
were produced for the same person and each had different information on. For example, in
one case the branded name was written on one MAR chart and the generic name on the
other. This contributed to an overdose being given. The MAR chart also differed from the
instructions on the label in some cases. In other cases, the MAR chart was unclear.
When care home staff did attempt to use the MAR to look for which medication to
administer they tended to administer what has previously been signed for as being
administered. Therefore, if a medication was missed once it was likely to continue to be
missed.
Other team factors within the home itself also contributed to errors. Lack of supervision
meant that problems were allowed to continue (see cases 1, 3 and 4). There was a general
culture within homes of relying on verbal rather than written communication (see case 2).
Therefore, in some cases staff did not always gain the information they needed. Care home
staff were reliant on others to have completed tasks for them to be able to administer
medicines accurately. For example, where medication had not been ordered by those
responsible, the person responsible for administering it could not do so.
Likewise, if the pharmacy dispensed the wrong product this led to the wrong medication
being administered. A more common contributing factor, however, was in the information
supplied to the home from the pharmacy. In some cases, pharmacists lacked
understanding of the information that care home staff would need and assumed they
would have a large amount of knowledge concerning medication. For example, assuming
that they would know that alendronate should given separate from other medication.
Administration errors were linked to prescribing errors in some cases, for example where
insufficient quantity was prescribed for the month or where a prescription was omitted. In
other cases, they were linked to records at the GP surgery being inaccurate, for example
repeat medication not being placed on the repeat list. In yet other cases GPs had agreed to a
80
change of medication at the home but had not updated their own prescription records, so
that where the home had made the change it appeared as an error.
Finally in one case care home staff had not acted on information been given by a patient’s
relative, perceiving it as unreliable.
Work environment factors
The physical conditions within the work environment contributed to errors. Examples of
such conditions included homes being hot and airless, having unpleasant smells, being
poorly lit or being noisy (e.g. from television or care home residents moaning).
In addition, there were shortages of space in many care homes (see case 4). There was a
lack of space for the drug trolley in some homes. This meant that the drug trolley had to be
left in the corridor in some cases and the staff administering the medication had to walk
from each patient and back to the trolley to obtain the medication. In other cases, lack of
space meant that the drug trolley could not be opened completely. In one home one drug
trolley had to be shared between two nurses. A more frequent problem was lack of space
on the drug trolley itself resulting in a cluttered trolley where items were hidden from view.
A further error producing condition identified in all areas observed was staffing problems.
This was particularly problematic during the morning round. During this round a large
number of medicines generally had to be given by few staff (see case 1). In some cases the
member of staff administering the medicines was also carrying out other tasks during the
round such as washing, dressing, serving breakfast, acting as receptionist, carrying out
managerial roles and holding the keys (see case 1). There was pressure to complete the
drug round in order to complete other work and to make sure a big enough gap was left
before the lunchtime round. Care home staff were constantly interrupted by residents,
other care home staff, personnel from outside the care home e.g. delivery drivers and the
telephone (see case 1). Care home staff did not always have designated times for ordering
medication and had to fit this round their other work (see case 2). In addition staff often
worked long shifts in some cases (12 hours).
81
In one specific home there had recently been a change of management leading to
redundancies, resulting in a stressful atmosphere. In addition, there was a shortage of basic
equipment such as medicine spoons at this home.
Latent factors
Latent conditions contributed to the error producing conditions described above. In some
cases management policy led to difficulties. For example, in one home there was a policy
not to give out medication during meal times without accompanying policies to ensure
medication could still being given out systematically (see case 1). In the majority of cases,
the latent conditions identified indicated lack of adequate policies to support staff. For
example, lack of policy to achieve an optimum work environment, lack of development of
protocols for systematic administration of medicines. Policy to ensure staff in place and
arrangements to cover absentees was also lacking. Although some training for staff was in
place, this was not enough to ensure competency in the task of administering medicines
(see cases 2, 3 and 4). Refresher training was lacking in some cases. In other cases, training
in specific knowledge areas such as administration of inhalers was absent.
In addition, communication problems between care home, pharmacy and the GP surgery
were not adequately addressed. For example, where ordering errors had occurred and
supplies had run out there was no fall back system in place for obtaining the medication
quickly, and on occasion patients went several days without their medication. Supply to
homes is based on a monthly basis. Although there were systems in place for dealing with
interim prescriptions for acute items needed (e.g. antibiotics), there were inadequate
systems for dealing with changes to medicines already being dispensed monthly. Most
medication was prescribed/dispensed to be given in the morning which is the busiest time
of day in the care home. For medication where time of day administered is not important,
there was no arrangement for this to be given at other times of the day.
These conditions were linked to those higher up in the system in some cases. Difficulties in
staffing were linked to recruitment difficulties which were ultimately linked to budget
constraints (see case 1). Low salaries of nurses employed in care homes compared to NHS
institutions and the lack of training opportunities can lead to difficulties in recruiting and
82
retaining staff. In addition, managers (who were sometimes the only nurse present) were
unable to have a hands on approach because of their own administrative workload which
needed to be completed.
The MDS systems themselves were latent factors contributing to errors. For example some
medicines are not compatible with the MDS system, contributing to omissions. This is
discussed further in the section on dispensing below. In addition the common belief that
the MDS is a safe medication system may be contributing to behaviour. There is some
evidence that people may reduce their vigilance to error if they believe a system to be safe.
The above data came predominantly from staff who had made errors and had the specific
circumstances fresh in their mind. This sort of data is generally taken as being richer and
more complete than interviews about causes of medication errors in general. However, it is
notable that when interviewing GPs about the causes of prescribing and monitoring errors
in homes, their general comments corroborated several of the issues raised above. Two GPs
brought up another cause of administration errors: that some homes would not use local
pharmacies to supply newly prescribed medicines – this could result in a delay of several
days before the medicines were available to be administered.
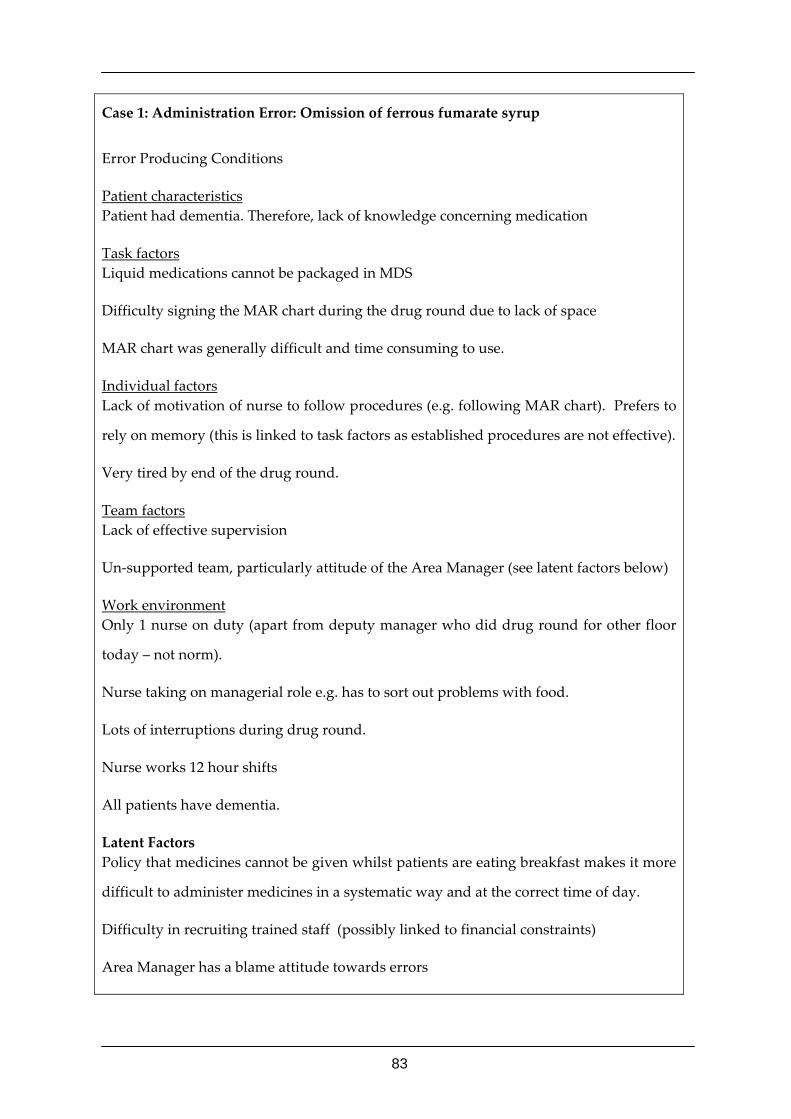
83
Case 1: Administration Error: Omission of ferrous fumarate syrup
Error Producing Conditions
Patient characteristics Patient had dementia. Therefore, lack of knowledge concerning medication
Task factors Liquid medications cannot be packaged in MDS
Difficulty signing the MAR chart during the drug round due to lack of space
MAR chart was generally difficult and time consuming to use.
Individual factors Lack of motivation of nurse to follow procedures (e.g. following MAR chart). Prefers to
rely on memory (this is linked to task factors as established procedures are not effective).
Very tired by end of the drug round.
Team factors Lack of effective supervision
Un‐supported team, particularly attitude of the Area Manager (see latent factors below)
Work environment Only 1 nurse on duty (apart from deputy manager who did drug round for other floor
today – not norm).
Nurse taking on managerial role e.g. has to sort out problems with food.
Lots of interruptions during drug round.
Nurse works 12 hour shifts
All patients have dementia.
Latent Factors Policy that medicines cannot be given whilst patients are eating breakfast makes it more
difficult to administer medicines in a systematic way and at the correct time of day.
Difficulty in recruiting trained staff (possibly linked to financial constraints)
Area Manager has a blame attitude towards errors
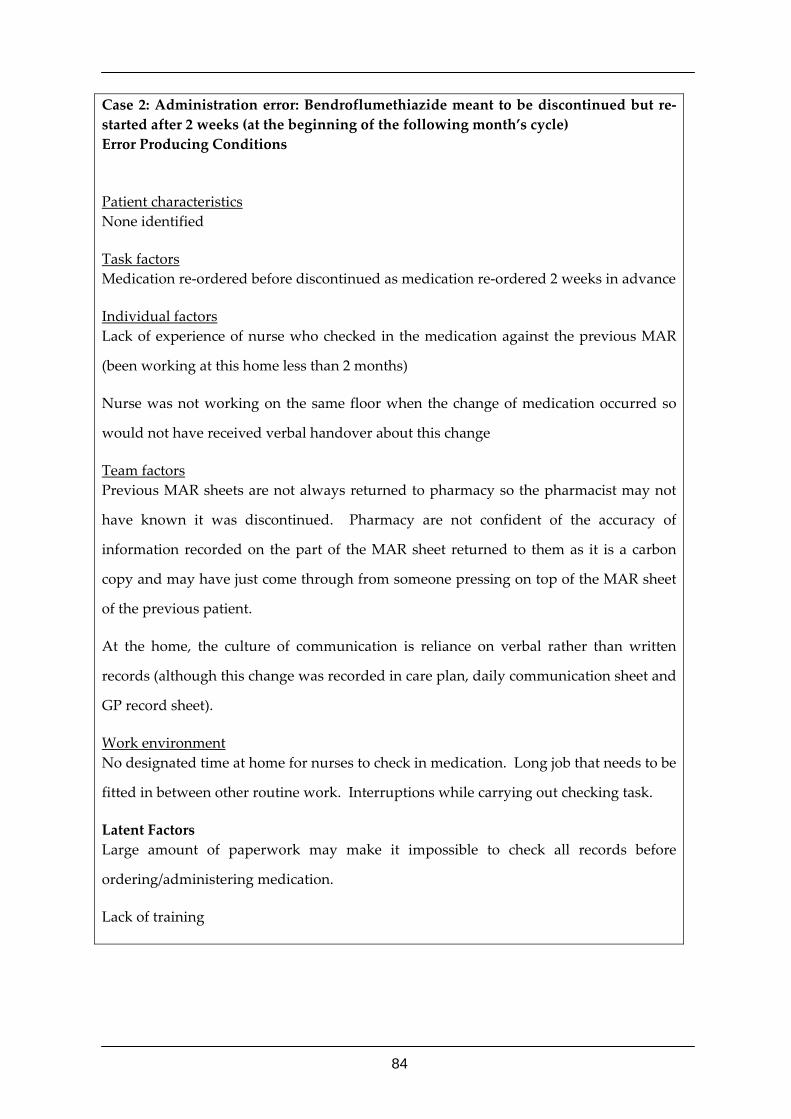
84
Case 2: Administration error: Bendroflumethiazide meant to be discontinued but re‐started after 2 weeks (at the beginning of the following month’s cycle) Error Producing Conditions
Patient characteristics None identified
Task factors Medication re‐ordered before discontinued as medication re‐ordered 2 weeks in advance
Individual factors Lack of experience of nurse who checked in the medication against the previous MAR
(been working at this home less than 2 months)
Nurse was not working on the same floor when the change of medication occurred so
would not have received verbal handover about this change
Team factors Previous MAR sheets are not always returned to pharmacy so the pharmacist may not
have known it was discontinued. Pharmacy are not confident of the accuracy of
information recorded on the part of the MAR sheet returned to them as it is a carbon
copy and may have just come through from someone pressing on top of the MAR sheet
of the previous patient.
At the home, the culture of communication is reliance on verbal rather than written
records (although this change was recorded in care plan, daily communication sheet and
GP record sheet).
Work environment No designated time at home for nurses to check in medication. Long job that needs to be
fitted in between other routine work. Interruptions while carrying out checking task.
Latent Factors Large amount of paperwork may make it impossible to check all records before
ordering/administering medication.
Lack of training
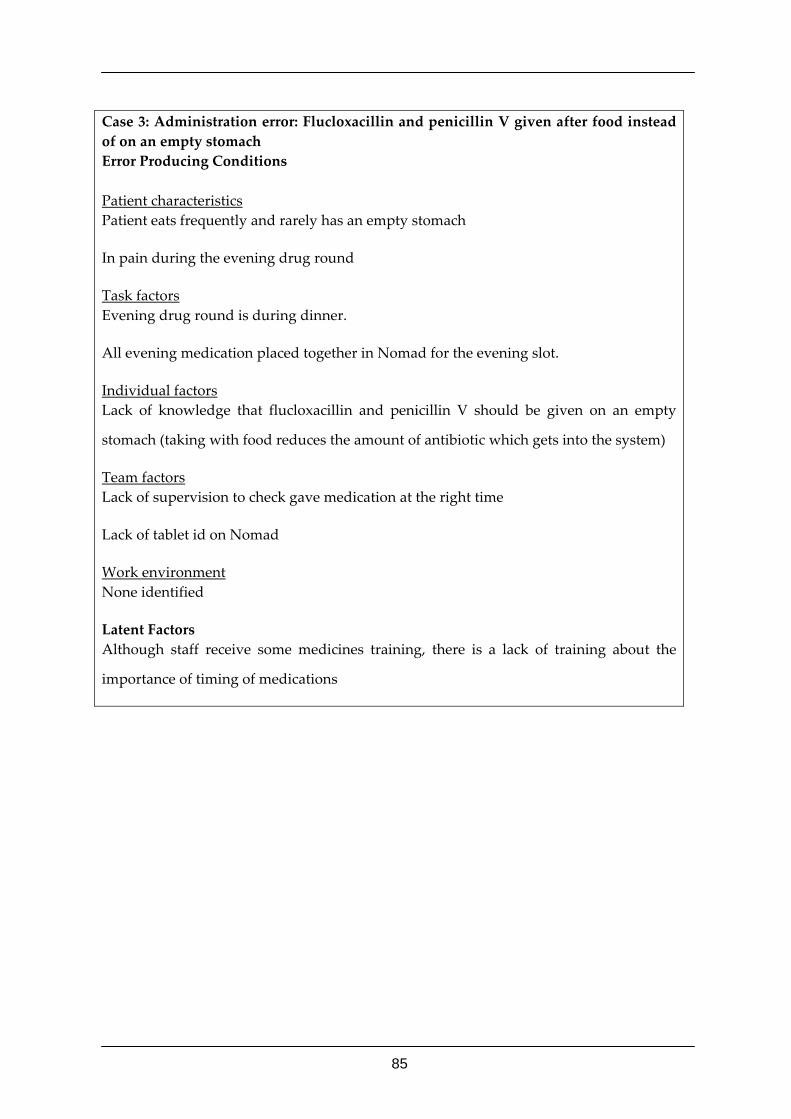
85
Case 3: Administration error: Flucloxacillin and penicillin V given after food instead of on an empty stomach Error Producing Conditions Patient characteristics Patient eats frequently and rarely has an empty stomach
In pain during the evening drug round
Task factors Evening drug round is during dinner.
All evening medication placed together in Nomad for the evening slot.
Individual factors Lack of knowledge that flucloxacillin and penicillin V should be given on an empty
stomach (taking with food reduces the amount of antibiotic which gets into the system)
Team factors Lack of supervision to check gave medication at the right time
Lack of tablet id on Nomad
Work environment None identified
Latent Factors Although staff receive some medicines training, there is a lack of training about the
importance of timing of medications
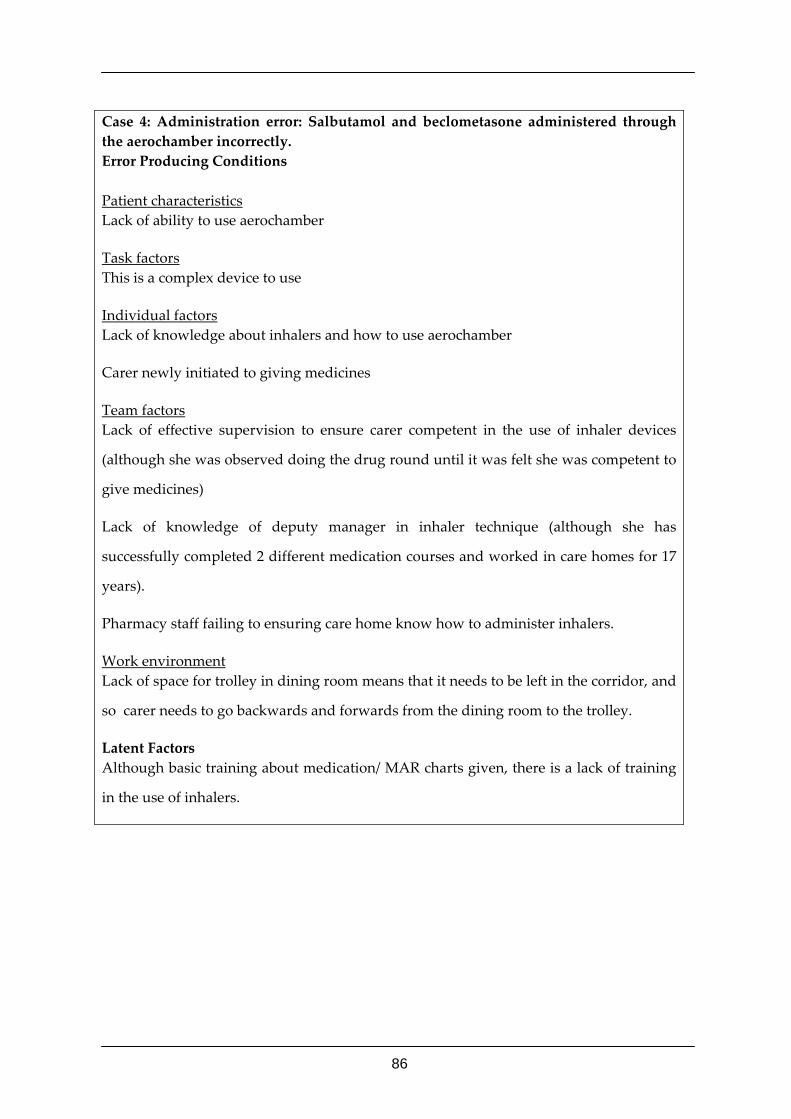
86
Case 4: Administration error: Salbutamol and beclometasone administered through the aerochamber incorrectly. Error Producing Conditions Patient characteristics Lack of ability to use aerochamber
Task factors This is a complex device to use
Individual factors Lack of knowledge about inhalers and how to use aerochamber
Carer newly initiated to giving medicines
Team factors Lack of effective supervision to ensure carer competent in the use of inhaler devices
(although she was observed doing the drug round until it was felt she was competent to
give medicines)
Lack of knowledge of deputy manager in inhaler technique (although she has
successfully completed 2 different medication courses and worked in care homes for 17
years).
Pharmacy staff failing to ensuring care home know how to administer inhalers.
Work environment Lack of space for trolley in dining room means that it needs to be left in the corridor, and
so carer needs to go backwards and forwards from the dining room to the trolley.
Latent Factors Although basic training about medication/ MAR charts given, there is a lack of training
in the use of inhalers.
87
5.3.2 Prescribing and monitoring errors
As it is almost impossible to interview GPs immediately after the occurrence of prescribing
and monitoring errors, this section is predominantly based on the analysis of interview data
relating to general error producing conditions.
Patient factors
A recurring theme (as it was in the cause of administration errors) was that patients in care
homes differed from other primary care patients. GPs identified that patients in homes
were generally very ill and had multiple pathologies. They had poor memory and were
therefore unable to give relevant information to the doctors (see cases 5‐8). One doctor
expressed the view that as patients in care homes did not manage their own medicines, it
was not possible to prescribe medicines on a when required basis as often as for other
patients. In addition, doctors identified that as most were permanently housebound, they
had a lack of access to services that would be available to the ambulatory population such
as dieticians and specialized chronic disease management nurses in some cases. Doctors
did not have full access to diagnostic equipment and most did not have access to records
when visiting homes, as opposed to when patients visit the surgery.
Other factors contributing to errors included patients being treated in secondary care (see
cases 7 and 8) or having been transferred from another care home (see case 6) (also see team
factors). In addition, patients’ dislike of medicines or blood tests contributed to some errors
(see case 5)
Task factors
Information technology was viewed by GPs as a limitation when prescribing in care homes
and this contributed to several errors (see cases 5 and 7). Lack of computer prescribing
software terminals at the care homes meant that doctors did not have access to full patient
medical records. They had to rely on paper notes kept at the home or a print out of
minimal information taken from the surgery. In addition, difficulties were identified with
information technology at the surgery. Reminders about monitoring tests that were due
and drug allergies came up in a screen with many other reminders and so could be easily
88
missed. Signing prescriptions was seen as a time consuming and not very productive
process.
Individual factors
Individual factors relating to errors were rarely identified but lack of specific knowledge
contributed to some errors. An example would be lack of knowledge by a hospital
consultant about his specialist area of medication (see case 8).
Team Factors
Management of the care home workload varied between practices. In two research areas an
allocated GP serviced the care home and made regular planned visits. Some practices had a
rota so that one GP would service the home for sometime (e.g. 3 months, 2 years) and then
another would take over the role. In some practices which serviced more than one home,
each home was allocated to a separate GP. However, in the majority of Bradford practices
visits were only made on request and were treated like any other home visits. Where
possible, a GP familiar with the patient would visit but this was not always possible due to
workload constraints or another GP already making visits in the same geographical area.
Administration staff at the practice had a large role in care home management. Each
practice had one or two prescription clerks who generated all the repeat prescriptions for
the doctors to sign. GPs stated that these clerks also had responsibility for updating records
from hospital letters and discharge summaries in some cases. One doctor stated that it was
therefore their responsibility to highlight monitoring tests that were due and that these
were often missed.
Doctors expressed concern that it could take up to 4 months for patient’s medical notes to
be transferred between practices. Patients often changed practices when they were
admitted to care homes resulting in a time lapse before GPs had access to their medical
history. This contributed to several prescribing errors (see case 6). The notes came through
after patients had had their new patient checks and one doctor was of the opinion that they
were never thoroughly reviewed.
89
GPs discussed staffing issues at care homes which caused difficulties in some cases. Two
doctors expressed concern over shortages of staff and one of these also discussed the large
turnover of staff; others reported that staff had little expertise or that it was very variable
between homes. One GP discussed the difference between care homes where staff were
acting in the capacity of a concerned relative and nursing homes where staff had medical
training. Another stated that even within nursing homes, the nurses were not as highly
qualified as in other settings. A lack of skills specifically stated as problematic included the
lack of ability to assess patients to determine whether or not a GP visit was necessary and
the lack of training to perform blood tests. Lack of experienced staff was linked to low
remuneration by several GPs.
A range of difficulties with consultant letters and discharge summaries were identified
from the interview data and interface communication contributed to several errors (see
cases 7 and 8). Firstly, the information was not always sent to the GP, e.g. it was sent to the
home only or to the wrong GP. When it was sent to the correct GP it was significantly
delayed in some cases. Information about the discharge was incomplete in many cases.
Specific examples of missing information reported included the reason a medication had
been stopped or the follow up action required by the GP. GPs reported querying it in some
cases. As it was not possible to query everything an assessment of whether there was an
obvious reason for it being stopped was made. These difficulties were not specific to care
homes and occurred with all patients.
Some GPs reported that they received no support from the PCT. In contrast other GPs
reported they could deploy staff such as district nurses, psychiatric care nurses, community
matron and a support practice pharmacist. The London homes no longer had access to a
phlebotomist, as the PCT had cut the service.
Two doctors in one research area identified a difficulty where homes did not use local
pharmacies, so it could take several days to get interim medication delivered.
Work environment factors
The work environment factor contributing to the largest number of errors was high
workload of the GP, including a large number of letters and telephone calls each day (see
90
cases 5‐8). This meant that there was insufficient time to optimally carry out tasks such as
medication review and updating records following visits to care homes or hospital
communications. In one case, prescribing for a patient the doctor was unfamiliar with
contributed to an error.
Latent Factors
A range of organisational issues were identified. First is information and communication.
GPs have become accustomed to prescribing with the aid of electronic records and the
associated prompts and error checks. These are not available when they prescribe to
patients in care homes. Nor does there appear always to be sufficiently functional
communication between practices in primary care, nor between hospital doctors and GPs.
Second, and related, is the way some GP practices manage, resource, and implicitly
prioritise, prescribing. For example whether non‐clinical staff who deal with repeat
prescribing and other medicines related issues always have the appropriate skills and are
appropriately monitored. Finally there is the way in which PCTs provide resources (ie
prioritise) for functions that support patients who generally can not leave a home and need
extra monitoring.
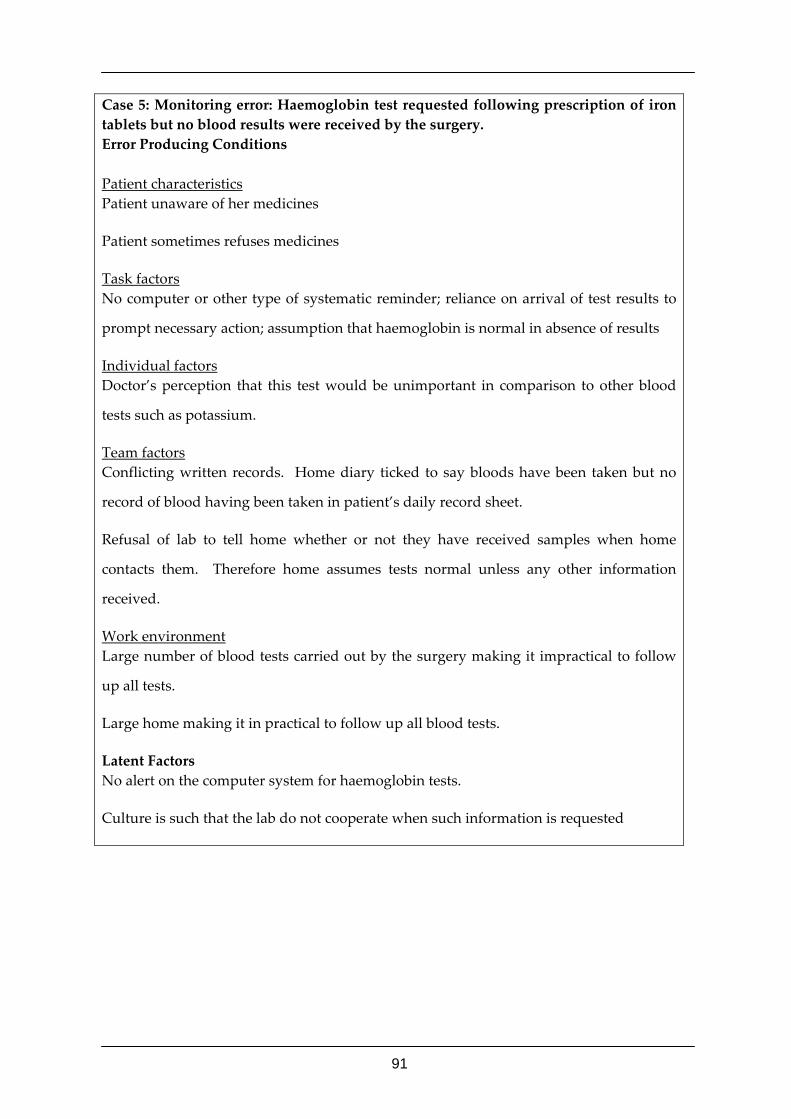
91
Case 5: Monitoring error: Haemoglobin test requested following prescription of iron tablets but no blood results were received by the surgery. Error Producing Conditions Patient characteristics Patient unaware of her medicines
Patient sometimes refuses medicines
Task factors No computer or other type of systematic reminder; reliance on arrival of test results to
prompt necessary action; assumption that haemoglobin is normal in absence of results
Individual factors Doctor’s perception that this test would be unimportant in comparison to other blood
tests such as potassium.
Team factors Conflicting written records. Home diary ticked to say bloods have been taken but no
record of blood having been taken in patient’s daily record sheet.
Refusal of lab to tell home whether or not they have received samples when home
contacts them. Therefore home assumes tests normal unless any other information
received.
Work environment Large number of blood tests carried out by the surgery making it impractical to follow
up all tests.
Large home making it in practical to follow up all blood tests.
Latent Factors No alert on the computer system for haemoglobin tests.
Culture is such that the lab do not cooperate when such information is requested
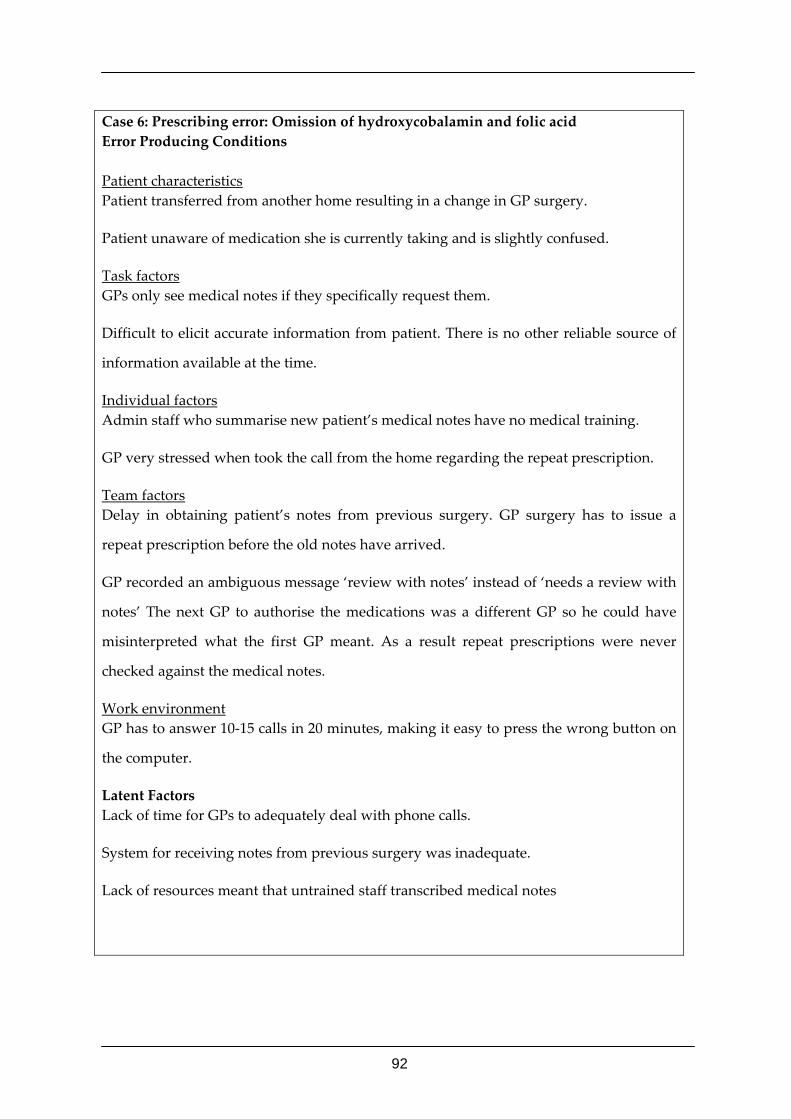
92
Case 6: Prescribing error: Omission of hydroxycobalamin and folic acid Error Producing Conditions Patient characteristics Patient transferred from another home resulting in a change in GP surgery.
Patient unaware of medication she is currently taking and is slightly confused.
Task factors GPs only see medical notes if they specifically request them.
Difficult to elicit accurate information from patient. There is no other reliable source of
information available at the time.
Individual factors Admin staff who summarise new patient’s medical notes have no medical training.
GP very stressed when took the call from the home regarding the repeat prescription.
Team factors Delay in obtaining patient’s notes from previous surgery. GP surgery has to issue a
repeat prescription before the old notes have arrived.
GP recorded an ambiguous message ‘review with notes’ instead of ‘needs a review with
notes’ The next GP to authorise the medications was a different GP so he could have
misinterpreted what the first GP meant. As a result repeat prescriptions were never
checked against the medical notes.
Work environment GP has to answer 10‐15 calls in 20 minutes, making it easy to press the wrong button on
the computer.
Latent Factors Lack of time for GPs to adequately deal with phone calls.
System for receiving notes from previous surgery was inadequate.
Lack of resources meant that untrained staff transcribed medical notes
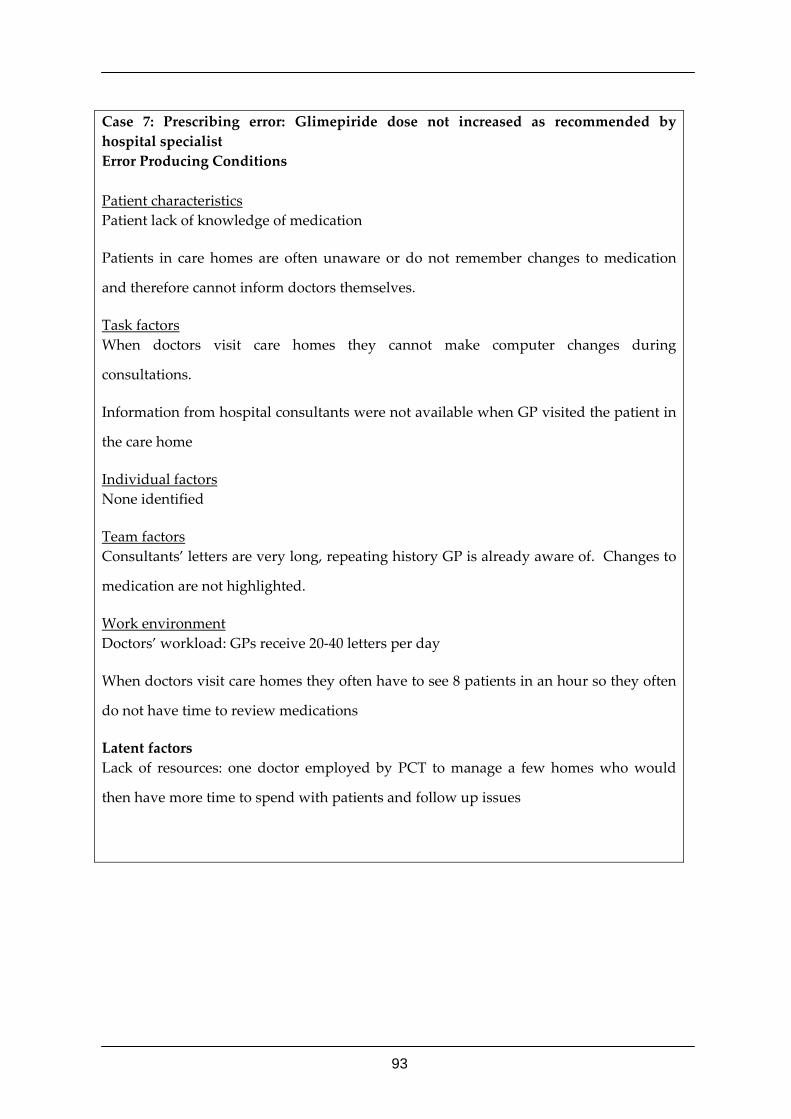
93
Case 7: Prescribing error: Glimepiride dose not increased as recommended by hospital specialist Error Producing Conditions Patient characteristics Patient lack of knowledge of medication
Patients in care homes are often unaware or do not remember changes to medication
and therefore cannot inform doctors themselves.
Task factors When doctors visit care homes they cannot make computer changes during
consultations.
Information from hospital consultants were not available when GP visited the patient in
the care home
Individual factors None identified
Team factors Consultants’ letters are very long, repeating history GP is already aware of. Changes to
medication are not highlighted.
Work environment Doctors’ workload: GPs receive 20‐40 letters per day
When doctors visit care homes they often have to see 8 patients in an hour so they often
do not have time to review medications
Latent factors Lack of resources: one doctor employed by PCT to manage a few homes who would
then have more time to spend with patients and follow up issues
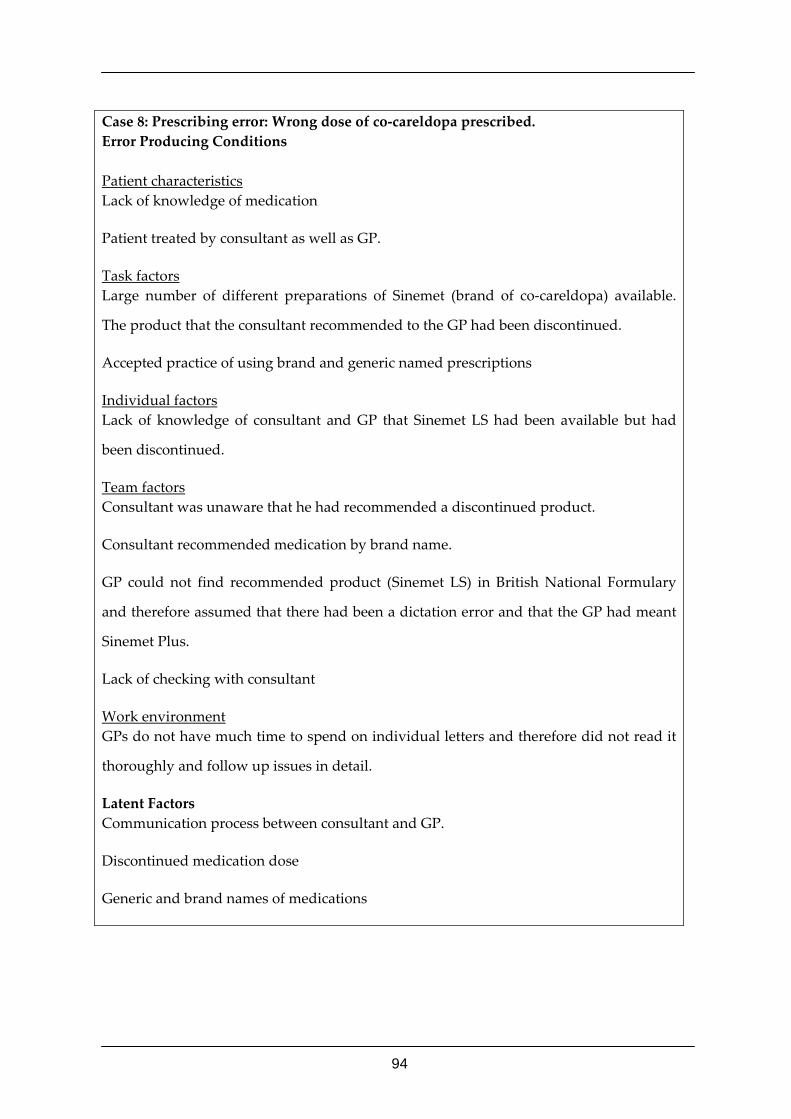
94
Case 8: Prescribing error: Wrong dose of co‐careldopa prescribed. Error Producing Conditions Patient characteristics Lack of knowledge of medication
Patient treated by consultant as well as GP.
Task factors Large number of different preparations of Sinemet (brand of co‐careldopa) available.
The product that the consultant recommended to the GP had been discontinued.
Accepted practice of using brand and generic named prescriptions
Individual factors Lack of knowledge of consultant and GP that Sinemet LS had been available but had
been discontinued.
Team factors Consultant was unaware that he had recommended a discontinued product.
Consultant recommended medication by brand name.
GP could not find recommended product (Sinemet LS) in British National Formulary
and therefore assumed that there had been a dictation error and that the GP had meant
Sinemet Plus.
Lack of checking with consultant
Work environment GPs do not have much time to spend on individual letters and therefore did not read it
thoroughly and follow up issues in detail.
Latent Factors Communication process between consultant and GP.
Discontinued medication dose
Generic and brand names of medications
95
5.3.3 Dispensing errors
This information was drawn from interviews and observation in the homes and in
dispensaries. As with the GPs, we could not interview the person who made each error.
Patient Factors
Patients’ medication regimes were not always compatible with the MDS system and this
contributed to some errors (see case 11).
Task factors
Information technology contributed to several dispensing errors. Lack of automation of
warnings or formulation of medication being placed on the label led to this information
being omitted in some cases. For some medication, this lack of automation was linked to
warnings not being legally mandatory but only being suggested as counselling in the BNF.
A warning system from pharmacists of all potential interactions, both minor and major, was
included in software packages, with the same level of alert, and this led to it being more
difficult to identify major interactions.
The MDS system also contributed to errors. Only one label could fit on some of the
systems. This led to warnings being omitted where they could not all fit onto one label (see
case 12). In addition, MDS systems were not easy to use where medication was not taken
every day of the month (see case 11).
In addition, the appearance of medication and its packaging were identified as error
producing conditions. Products were confused where packaging of different products
looked similar. The difficulty of identifying white tables in an MDS system also contributed
to errors (see case 10). Generic medication changed its appearance from month to month,
leading to further identification difficulties (see case 9).
The prescription itself was also a contributing factor. Where changes to a prescription had
occurred, these were not always actioned where the label was simply printed from the
PMR. Medication being prescribed for unlicensed use was an error producing condition in
one case.
96
Filling and checking MDS systems was described as a tedious process. The protocol for
filling MDS systems contributed to the type of error which occurred. If MDS systems were
filled from the prescription but not the MAR, this contributed to errors of medication being
put in the wrong time slot. However, if they were filled from the MAR rather than the
prescription, changes which had been missed at the labelling stage would be less likely to
be picked up at the filling stage.
Individual factors
A range of individual factors contributing to dispensing errors was identified. In one
pharmacy staff experienced low morale and other staff reported feeling hungry, tired and
unwell while dispensing the MDS (see case 12). Lack of experience of the dispenser or
pharmacist in care home systems also contributed to errors in pharmacies (see case 9).
However, the most common lack of knowledge was not with the systems themselves but
the level of support that care home staff needed and the motivation to provide this support.
One pharmacist expressed the view that she was not responsible for ensuring care home
staff administered medication correctly (see case 12). In other cases, pharmacy staff simply
assumed that if patients were taking long term medication, care home staff would already
know how to administer it or that they would ask if they had any queries. These findings
link with those identified when interviewing care home staff, where lack of information
from pharmacies contributed to administration errors.
Team Factors
Lack of individual knowledge of the needs of care home staff can be viewed in a wider
context of the communication difficulties between the pharmacy and home that were
identified from interview data. In some cases, pharmacy staff never visited care homes.
Some pharmacy staff also expressed the view that care home staff were uncooperative.
Language barriers added to communication problems where English was not the first
language of care home staff.
Supervision within the pharmacy team itself was lacking in some cases. For example,
dispensing errors were not always identified at the checking stage. When dispensers
labelled medication, the pharmacist did not view the patient medication record and
97
information regarding interactions was not always transferred from dispenser to
pharmacist. Information gaps between regular pharmacists and locums also contributed to
errors (see case 10).
A range of other team factors contributing to errors were identified. These included
discrepancies between records, records not being updated, manufacturing supply problems
and lack of communication between the surgery and pharmacy.
Work environment
The work environment in the pharmacies was described as being busy and pressured,
sometimes due to staff shortages. Staff reported experiencing constant distractions and
interruptions. In one pharmacy there was no counter assistant which led to dispensers
having to interrupt their work to serve customers. The dispensary was very noisy in some
cases due to the phone and fax machine. In one pharmacy, only a small space was available
for dispensing and checking.
Latent Factors
Company policy contributed to errors e.g. lack of training policy, policy dictating which
brands to dispense and staffing issues. Wider policies were also identified as error
producing conditions. For example, the large amount of paperwork which legally needed
to be completed led to it being difficult to check it all accurately and generic prescribing has
been encouraged without uniform shapes and colour of generics being developed.
Characteristics of information technology systems and MDS systems were also identified in
the analysis as contributing to errors. Dispensing had in some cases become an
industrialised act, separated from the patient and their needs, and the patient’s
surroundings and the carers needs. Re‐dispensing into MDS being an unfunded activity.
MDS being wanted by homes.
98
Case 9: Dispensing error: Ramipril capsule described on Nomad label as yellow but green and white capsules are dispensed. The product is correct but, because another brand has been used, the description is incorrect. Error Producing Conditions
Patient characteristics None identified
Task factors Different brand dispensed so looks different.
Individual factors Pharmacist very inexperienced with care homes.
Team factors Locum pharmacist is the most senior member of staff present and he has had little
experience of care homes. There is no evidence that he has sought or been offered help
from a manager or had any orientation training.
Work environment Busy
Regular pharmacist on maternity leave. Very hectic work environment due to
inexperienced staff.
Latent Factors No standard shape, size and colour for drugs.
No evidence of training for locums unfamiliar with homes/ MAR chart system.
99
Case 10: Dispensing error: Aspirin e/c 75mg dispensed instead of zopiclone 7.5mg. Home informed pharmacy but mistake was not rectified. Error Producing Conditions Patient characteristics None identified
Task factors Tablets look very similar (both white and oblong) making it difficult to check
Packaging similar –same company
Individual factors Tired as last patient of the day and repetitive task
Team factors Lack of transfer of information about the error between pharmacist and locum who
would be covering.
Work environment Busy day, constant interruptions, had to keep stopping to serve customers
Small space for dispensing and checking,
No quiet space.
The day the pharmacist was informed of the error was her last day before going on
holiday.
Latent Factors Design of system makes it very difficult to check similar looking tablets in blisters.
Different tablets in similar packaging
No designated staff member for shop means the staff cannot focus on dispensing only.
There was only one area for dispensing.
100
Case 11: Dispensing error: Extra dose of furosemide dispensed Error Producing Conditions Patient characteristics Furosemide prescribed on alternate days
Task factors Difficult to pack on alternative days in MDS blister.
Individual factors Not known
Team factors Pharmacy do not know which days it is being taken.
Packing the blister is the last stage so has less checking than the other stages( labelling
and selecting medication)
Work environment Not known
Latent Factors The MDS system is designed to be used for medicines taken every day.
The culture of checking is focussed on the earlier stages of the preparing and dispensing
process
101
Case 12: Dispensing error: Missing warning labels on aspirin e/c. Error Producing Conditions Patient characteristics None identified
Task factors Cannot fit all warnings on one dispensing label and so some are printed onto a second
label.
The MDS system only has room for one label
Individual factors Pharmacist’s assumption that if patients are on medication long term the home would
not need reminding of the warnings.
Low morale
Feeling tired/hungry/unwell
Team factors Management did not show appropriate level of concern
The team assumption was the same as the pharmacists
Work environment Very busy pharmacy‐ short staffed
Do not take full break entitlement due to high workload
Pressure from others to get the work done quickly
Noisy due to fax and phone
Constant distractions and interruptions
Latent factors Computer labelling system and MDS do not allow all warnings to fit on.
Short staffed due to staff off sick with stress in company as a whole. Personnel issues
Pharmacy manager not on site and generally not “hands on”
102
5.4 Summary The purpose of this chapter is to provide understanding behind the data presented in the
previous, quantitative chapter. We will draw the whole together in the final Discussion of
this report. In this section our aim is simply to draw out some of the most significant
findings from the qualitative work. We should add that these are some of the major themes
reported and observed, however they are not definitively causal. For example it is common
for someone at the end of their shift to feel tired. If they make an error they may report that
they were tired and that this might have been a contributory factor, whereas in reality it
was unrelated to the error.
5.4.1 Administration errors
When we followed up administration errors these are the factors which were raised at least
some of the time. The patients have a high level of dependency which adds to the
complexity of them receiving medicines, they may be very ill, immobile, demented and on a
large number of medicines. Nor should we under estimate the role of medicines, which are
heavily systematised and often need to be given with a high degree of precision. Here we
see an interaction between the skill, training and management of staff and their failure to
order or store medicines, to give medicines by the right technique (particularly inhalers), at
the right time in relation to food; and their failure to follow the appropriate procedures.
The MDS systems used in many homes also contributed. Some staff felt tired or unwell.
Certainly the homes could be a challenging environment in which to work, and large
medicines trolleys and often cluttered spaces contributed to error. Staff were often
interrupted and, particularly on the morning round, there were often too many calls on staff
(or too few staff). Finally, there were often communication problems. The Medication
Administration Record (MAR) chart, a key communication between the home, pharmacy
and GP, was often inaccurate and failed to communicate the correct information. There
were also problems within homes; where there was a dependence on verbal
communication; pharmacies and GP surgeries also contributed by not communicating
accurate or sufficiently helpful information.
103
Latent factors included medicines not being given sufficient priority on occasions, the lack
of policies and training, which at least partly reflected the difficulty in recruiting to these
posts, the MDS and the rigidity of its monthly supply system, prescribing of drugs for
administration in the morning, and the lack of adequate three way communication between
the home, the pharmacist and the GP. Finally, there was a lack of ownership of the whole
system by which medicines are prescribed, ordered, dispensed and administered. People
managed their own part of the system without taking a whole systems view.
5.4.2 Prescribing and monitoring errors
Several of the issues raised during the study of administration errors were again raised by
GPs with respect to prescribing and monitoring errors. The characteristics of the patients
again contribute; they are often very ill, with multiple pathologies and associated therapies.
Their immobility means they can not visit the surgery with its associated IT, measurement
equipment, and associated services.
Several factors contributed to monitoring errors: poorly designed computer prompts,
support staff in the practice not noticing prompts, staff in the homes not trained to take
blood, and the lack of a local phlebotomist service. Another area of similarity was that
there were concerns about staffing in some of the homes. These include staff shortages,
rapid staff turnover, poor knowledge of some staff, some poorly skilled nurses, including
their inability to decide whether a GP visit was required or to take blood. Poor
remuneration was viewed by several GPs as the cause of these problems.
Other factors identified by GPs included poor communication: between GP practices, and
from secondary care following patient discharge from hospital. The lack of the usual
computerised prescribing system (with its comprehensive medical record and error
trapping prescribing software), coupled with patients being poor historians, made
prescribing more error prone. Management arrangements between the GP practice and
home affected familiarity with the home and its patients, poor familiarity being more likely
to produce errors. Lack of other services could also be linked to errors, such as lack of PCT
services such as district nurses and psychiatric care nurses. Finally, GPs quoted their high
workload, high volume of communication and lack of time as factors
104
5.4.3 Dispensing errors
While there were the usual staff issues (training, morale, tiredness etc) that can contribute to
any error, many of the issues that emerged were related to MDS. For this reason we
decided to study MDS further, and this is described in the next chapter.
105
Chapter 6 Causes of Errors ‐ the dispensing process
6.1 Introduction Most medicines for care homes are dispensed in monitored dosage systems (MDS), which
package doses into individual spaces. This is generally dealt with in a mass assembly
process.
Initially, we had assumed MDS was an evidence‐based safe technology. After the first
stages of analysis it became clear that we should not take for granted that the MDS is a good
system and we decided to investigate it more deeply.
In order to gain a deeper knowledge of the dispensing process, in depth interviews were
carried out with eight pharmacies in one location in the country and observation of
dispensing processes were carried out in five of these pharmacies.
While we had investigated individual errors using Reason’s framework (see chapter 5), we
also wanted to study the technology in more depth and so chose to also adopt a different
approach. Because MDS is a technology we used a technology evaluation framework, that
of Cornford et al,30 previously used successfully for a related area: the evaluation of an
electronic prescribing, dispensing and administration checking system in hospitals.97
Our approach to the evaluation of dispensing was informed by the socio‐technical
perspective which considers information systems as social and technical systems, and
technology’s characteristics and capabilities as being revealed through use.98 This approach
is reflected in the evaluation framework of Cornfordet al30 which we chose for this study
(Figure 6.1), similar to that later proposed by the UK Department of Health to evaluate
information technology.99 The framework is structured as a matrix with Donabedian’s
model100,101 for evaluating quality of care (structure, process and outcome) as one
dimension, and system functions, human perspectives, and organizational context as the
other. The last three factors map onto Reason’s framework – those of the functioning of the
system, the users’ perspectives and the organisational (Latent failure) perspective.
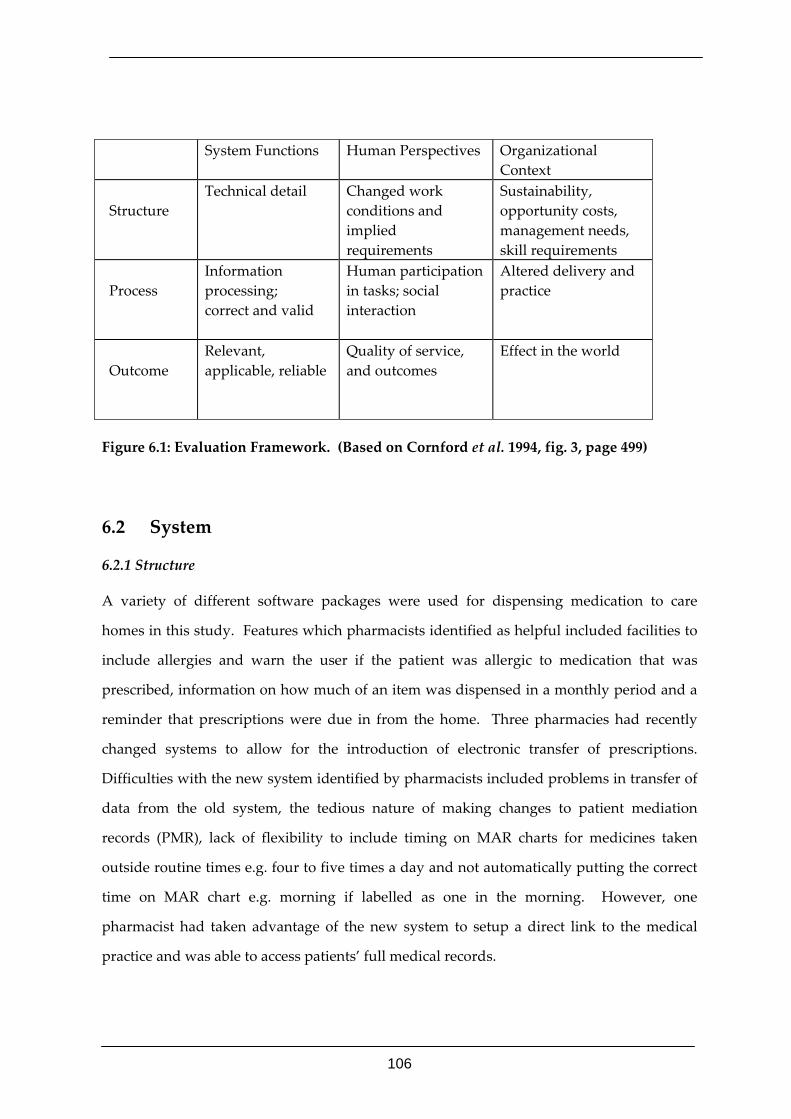
106
System Functions Human Perspectives Organizational Context
Structure
Technical detail Changed work conditions and implied requirements
Sustainability, opportunity costs, management needs, skill requirements
Process
Information processing; correct and valid
Human participation in tasks; social interaction
Altered delivery and practice
Outcome
Relevant, applicable, reliable
Quality of service, and outcomes
Effect in the world
Figure 6.1: Evaluation Framework. (Based on Cornford et al. 1994, fig. 3, page 499)
6.2 System
6.2.1 Structure
A variety of different software packages were used for dispensing medication to care
homes in this study. Features which pharmacists identified as helpful included facilities to
include allergies and warn the user if the patient was allergic to medication that was
prescribed, information on how much of an item was dispensed in a monthly period and a
reminder that prescriptions were due in from the home. Three pharmacies had recently
changed systems to allow for the introduction of electronic transfer of prescriptions.
Difficulties with the new system identified by pharmacists included problems in transfer of
data from the old system, the tedious nature of making changes to patient mediation
records (PMR), lack of flexibility to include timing on MAR charts for medicines taken
outside routine times e.g. four to five times a day and not automatically putting the correct
time on MAR chart e.g. morning if labelled as one in the morning. However, one
pharmacist had taken advantage of the new system to setup a direct link to the medical
practice and was able to access patients’ full medical records.
107
A range of different systems were used to pack medication including Boots MDS, Manrex,
MTS Venalink, Medisure and non MDS packing. Four of the eight pharmacies used more
than one system depending on the home or patient. The main differences between different
MDS systems included whether they were single or multi dose, whether they were weekly
or monthly and whether they were cold or heat sealed. Pharmacists using different
systems identified the advantage that all tablets could be identified in single dose systems.
Disadvantages included their bulky nature resulting in them taking up a lot of space and
the time consuming process for pharmacy staff of popping out all the different tablets.
MDS dispensing facilities ranged from a large separate MDS dispensing room with five
workstations to a dispenser dispensing on top of a pile of stacking boxes at the back of the
main dispensary. Two of the MDS dispensaries had no windows and therefore only
artificial light. There was generally good temperature control although a member of staff
complained of feeling cold in one pharmacy. In another pharmacy, a radio was on in the
dispensary.
6.2.2 Process
Many types of medication were not compatible with the MDS system. External items,
liquids, reconstitutable sachets and large tablets such as Calcichew were not packed in the
system by any pharmacists. In addition, medication which was unstable to light or heat or
water was not packed in the MDS by the majority of pharmacies. An exception was that
medication not stable to heat could be packed in cold seal systems. In addition, one
pharmacist packed sodium valproate, which is hygroscopic, in the MDS as she believed
little of the dose would be lost during the course of the month and that this is a lesser risk
than if it was not packed within the MDS, in which case they thought it would be likely to
be forgotten altogether. Medication which was not taken the same way everyday of the
month, or where dosage varied during the month, was often packed outside the system.
This included short courses of antibiotics, reducing dosage of steroids, weekly medication
where the day of the week being taken was not known and warfarin (see case 11 for
example of dispensing error) when attempted to pack within the MDS. Interim medications
(or ‘interims’) were packed outside the system in many cases, usually as a normally
dispensed item.
108
Other equipment was also not fully compatible with medication. It was difficult to split
generic tablets with tablet splitters (when ‘half a tablet’ was prescribed, or a dose prescribed
that could not be given as a whole tablet), with the two halves rarely being equal. One
pharmacist reported that devices were available for popping tablets out of blisters but that
these were cumbersome and were difficult to align with different sizes of blister. They were
not used by any of the pharmacies observed. The same pharmacist also reported that he did
not use gloves as tablets stuck to the latex. This appeared to be common practice, as gloves
were observed to be used by only two personnel in total.
Other technical difficulties included the printer becoming unaligned (printing in the wrong
position) when printing out MAR sheets and labels sticking to reminder cards making them
‘gunky’.
6.2.3 Outcome
A Nomad is a multidose cold seal MDS system (described in the Introduction to the report).
Identification is placed on the label (e.g. ‘pink round tablet’) in order to allow identification
of individual tablets within the Nomad. One pharmacist stated that the identity on the
Nomads was often inaccurate (also see case 9, Chapter 5) resulting from there being no
standard shape and colour of a tablet and generics constantly changing. In some
pharmacies, care was taken to ensure only one type of generic medication was used in each
blister.
A large number of tablets were discarded after attempts to split them resulting in unequal
halves.
Variation in MAR charts sent out to home was observed. In three pharmacies only
medication supplied that month was printed on the MAR chart, whereas in three others all
medication on the PMR was included on the MAR with a note, ‘not supplied this month’
when not supplied. There was also variation in whether all medication was placed on one
MAR chart or there were separate charts for different items e.g. one for regular medication
and one for medication to be taken only when needed. Medication on the MAR chart was
in alphabetical order in most pharmacies. Allergies were printed on if they were known to
the pharmacy. In one pharmacy ‘dispensed in separate box’ was printed on the MAR for
109
items dispensed outside the MDS. However, this could not be highlighted due to the
absence of a colour printer. In another pharmacy it was observed that the MAR chart had
faint print which was smudged in places. In the same pharmacy the MAR charts were sent
in one continuous roll for the care home staff to separate. In a third pharmacy, the
pharmacist said that the printer sometimes printed out two identical MAR charts resulting
in 2 two being sent to the home.
Medication was sent out in blue bags or white boxes which included MDS, bulk medication
and MAR charts. In one pharmacy the bags of fridge items were separately labelled as
fridge lines. In two pharmacies patient information leaflets were also sent.
6.3 Human participants
6.3.1 Structure
The number of personnel involved with MDS ranged from one pharmacist and non
qualified dispenser to a full unit with eight dispensers, including two accredited checkers
and several delivery drivers. In units with several dispensers, they each had distinct roles,
e.g. one was a key contact for the homes, another was in charge of all interims.
Pharmacists’ input varied. Generally the larger the unit and the more staff, the less
pharmacists were involved in the day to day dispensing to homes. In two pharmacies
dispensers dispensed without the presence of a pharmacist in the room.
Pharmacists had completed continuing education training packages relating to homes. Two
pharmacists were also supplementary prescribers. Where dispensers were qualified, they
had NVQ training. However, this did not include training on MDS, which was learnt ‘on
the job.’ The accredited checkers had to precheck 1,000 consecutive items without missing
any errors before being allowed to gain their accreditation. One checker was also a
qualified pharmacist in another country. A health and safety training session was taking
place on the day of the researcher’s visit at one pharmacy.
Pharmacists expressed a range of views about MDS with some stating that they made it
easier for care home staff to administer medication safely and systematically while others
expressed more negative opinions. Two pharmacists were of the view that MDS were not
safe as tablets could not be identified. One also said that when a tablet was dropped the
110
staff would not have a replacement. Another said that MDS encouraged staff not to look at
the label. These pharmacists did not use the MDS and were generally negative about
dispensing for the homes, with one stating that it was “not worth the aggravation”.
6.3.2 Process
Communication between pharmacy and surgery
Analysis of interview data showed that relationships between GPs and pharmacists were
variable. The amount of contact between them varied. In some cases, GPs were the first
point of contact if there were queries with prescriptions, although more commonly it would
be the home who would be contacted first. One pharmacist said it was difficult to access
the GP as he was very busy and she had not spoken to him for two months. Another
pharmacist said that where there were several GPs at a practice involved with the home it
was difficult to build a continuous relationship. In contrast, one pharmacist reported
always trying to combine a visit it to the home with a visit to the surgery.
Pharmacists’ input into GPs’ prescribing decisions also varied. One pharmacist reported
carrying out medication reviews with GPs and going on ‘ward rounds’ at the homes.
Another had a direct link to the surgery and carried out sessional work there. A third said
that once you had a ‘foot in the door’ and demonstrated what pharmacists could do, it was
easier the next time. However, some pharmacists were also of the view that some doctors
did not want to work with pharmacists.
Pharmacists reported a range of difficulties that arose with prescriptions. Three
pharmacists had difficulty obtaining a 28 day prescription from some doctors in order to fit
in with the monthly cycle. One pharmacist said that doctors did not like to prescribe in
advance in case changes occurred but that meant insufficient time to dispense the medicines
for the start date of the next cycle. The same pharmacist also reported that doctors did not
like to prescribe liquids, or branded tablets that were easier to split, as they were more
expensive. Yet another pharmacist said that doctors sometimes prescribed half a tablet of a
controlled release preparation. This is an error as these tablets have a complex structure so
they release the medicine in a controlled way – this benefit is lost (and is potentially
dangerous) if the tablets are split. Pharmacists also reported that mistakes occurred on
111
repeat prescriptions. They thought these were caused firstly by doctors not updating their
records when prescriptions were handwritten at the homes and secondly when
interruptions occurred when prescription clerks were issuing prescriptions.
Primary/secondary interface
Discharge information from a hospital was used to inform homes of changes that they
should make when administering medication and to check that GPs had updated patients’
prescriptions for the next cycle.
Receipt of discharge information varied between pharmacists and hospitals. One
pharmacist had been proactive in phoning all hospitals that discharged patients to care
home to ask them to fax discharge information to him. He therefore received discharge
information before GPs and then sent it to them. Where discharge information was not
received from the hospitals, it was sometimes received from the homes. One pharmacist
requested it from the homes when large changes had been made to the medication and he
suspected that they had probably had an admission to hospital.
Discharge information was reported as being often unclear by one pharmacist, who
contacted the doctor/ hospital to clarify information.
One pharmacist stated that on some occasions when patients were admitted the hospital
rang him to confirm what medication was being taken.
Communication between pharmacy and home
Communication between pharmacy and homes varied. One pharmacist reported that at
some homes a continuous relationship was built with a key contact person at the home.
However, at other homes staff turnover was high resulting in a lack of continuity. There
was a range of experiences reported regarding the return of MAR sheets, indicating changes
to patient’s medication, from homes.
It became apparent from the analysis that the pharmacy communicated with the home
concerning a range of medication related issues. During the repeat dispensing process,
pharmacists reported that they telephoned homes when prescriptions had not arrived at the
112
pharmacy when expected or if there were queries on prescriptions. The home was often the
first point of contact for queries. One pharmacist explained that the home had more up to
date information if handwritten changes had been made during GP visits. Another
pharmacist reported that dealing with queries was a time consuming process. Pharmacy
staff reported that homes contacted the pharmacy if there were any queries once the
medication had been received and checked in. Homes also contacted pharmacists to
request equipment or to inform them of a new resident admission to the home.
Occasionally homes asked for clinical information such as side effects. Where the key
contact at the pharmacy was a dispenser they would refer clinical queries to the pharmacist
if they were unsure of the answer.
A number of difficulties were reported to occur when communicating with homes. These
included lack of understanding of the dispensing process, lack of transfer of all information,
lack of trained staff at the homes with fluent English and loss of motivation of staff due to
the work environment, tedious nature of the job and lack of interaction with new people.
One pharmacist reported that the care home had recently been required by their
management to photocopy all prescriptions and expected the pharmacy to assist with that.
Communication in relation to interims was carried out by fax in the majority of homes. One
pharmacist explained that he did not take instructions verbally, in case there was a mistake.
Another stated that he would only change directions if there was written evidence. The
pharmacist with the direct link to the GP records did not need to rely on faxes. If the home
told him antibiotics had been prescribed he could check the prescription by accessing the
patient record.
Some difficulties were reported with interim prescriptions. One pharmacist said that
homes requesting bulk items as interims rather than monthlies was annoying because these
requests resulted in these items not being able to be dispensed as part of the planned
routine. Another pharmacist was of the view that homes run out of ‘PRNs’ (medicines to
be given as the patient needed them for specific symptoms, ie not a regular dose and hence
an easily calculable number) too often and were probably giving them as repeat medication.
Yet another pharmacist reported that different floors of one home faxed through their
requests at different times of the day, resulting in multiple journeys for the delivery driver.
113
During a research visit to one pharmacy, the home informed the pharmacist that an interim
prescription that they needed that day was at the GP surgery. However, the home gave the
pharmacy out of date GP details and the pharmacist was then unsure who the patient’s GP
was.
Use of computer system to generate labels and MARs
The process of generating labels and MAR charts was observed in five pharmacies. In the
remaining three pharmacies observation was not possible and data were collected by
interview.
In four pharmacies labels and MAR charts were generated by dispensers and in four they
were generated by pharmacists. One pharmacist explained that she liked to produce the
labels herself as she then had complete control over the process. In pharmacies where the
dispenser labelled the pharmacist did not view the PMR. In one pharmacy, the dispenser
who printed out labels of all interactions identified by the computer software and attached
them to the prescription for the pharmacist to access when checking.
Resources used when generating labels and MAR charts included prescriptions, patient
medication records, and MAR charts returned from homes in the majority of pharmacies.
In one pharmacy faxed interim sheets of changes made during the month were also referred
to. In two pharmacies the British National Formulary (BNF) was referred to occasionally.
In the pharmacy with the direct link to the GP surgery, the surgery’s electronic medical
records were accessed. In this pharmacy, the pharmacist reported that he generated 6
months supply of prescriptions which he asked the doctor to sign. Then every month he
checked to ensure that there had been no changes before dispensing.
In six pharmacies labelling was done as a bulk process for all patients in each home.
However, in one pharmacy labels were generated for one patient at a time, with the next
patient’s labels only being generated after the previous patient’s medicines had been
dispensed. The pharmacist perceived that this minimised the risk of a blister being filed
with the medication for the wrong patient.
114
MAR charts were printed off at the same time as labels in five pharmacies. Other
pharmacies printed them after all dispensing had been completed. In one pharmacy the
dispenser came in early in the morning to print off the MAR chart before the shop opened.
As there was only one computer and printer, no prescriptions could be dispensed whilst the
MAR charts were printed. In two pharmacies the printing process was not straight forward
as it took several attempts to line up the MAR chart correctly for printing.
Dispensing of MDS
As with labelling, observation took place in five pharmacies using MDS systems.
In six pharmacies there was a fixed routine for the dispensing of MDS. However, in two
pharmacies, the pharmacist fitted in the MDS around his other work when the shop was
quiet, doing a large amount at weekends. In four out of the five pharmacies where
observation took place, there were a number of interruptions during the dispensing
process, from walk in customers, telephone, other staff etc .
The personnel involved in the dispensing process varied between pharmacies. In two
pharmacies the pharmacist carried out the whole process, where as in four others the
dispensers were the only people involved. In two pharmacies the pharmacist selected the
medication and the dispensers filled the blisters.
The information sources used for dispensing varied, with two pharmacies dispensing from
the prescriptions, and three from the labels. MAR charts were referred to by dispensers in
one pharmacy.
A range of procedures were used for selecting medication. In four pharmacies the
medication was selected for the entire home before blisters were filled. In one pharmacy
medication was selected for one patient at a time and in another medication was selected
one item at a time, dispensed and put away before the next medication was taken out. The
pharmacist in the last pharmacy argued that that this procedure minimised the risk of the
wrong medication being placed in the blister.
The next stage of the dispensing process was filling the blisters. In the majority of cases
medication had to be removed from another blister before being packed in the MDS. In
115
some pharmacies the medication was popped out directly into the MDS blister and then
readjusted to ensure the correct number of tablets were in each slot. In other pharmacies,
the tablets were popped out into the dispenser’s hand and then put into one blister
compartment at a time. Errors were observed to occur during this process with some
compartments being missed or containing the wrong number of tablets. These were
corrected by the dispenser as they did a final check that the blister was filled correctly
before sealing. In one pharmacy, blisters were sometimes cut with scissors to make it easier
to pop out the tablets. In another pharmacy the correct quantity was sometimes counted
before filling the blisters, so if one tablet was left, the pharmacist knew there must be an
empty compartment. Where tablets needed to be split, these were split with tablet splitters
in two pharmacies and by hand in two others.
After the blisters had been filled, those that required heat sealing were sealed at this stage.
Foil was place on the blister before sealing. In three pharmacies the foil was folded and
then unfolded to prevent it from curling up. In some cases, errors were noticed by
dispensers after sealing. If the whole blister was wrong e.g. dihydrocodeine instead of
codeine dispensed, the whole blister was redone. However, if only one compartment was
wrong the foil was torn and then replaced with another small piece of foil and resealed.
After heat sealing labels were stuck on the blisters.
In four pharmacies “prepacks” were used for items frequently dispensed instead of
individually filling a blister each time. These are blisters pre‐filed in a batch in the
dispensary and kept in stock
The final stage in the dispensing process for blisters was to file the blisters in the correct
coloured sleeve (according to administration time) and rack them in files (placing the
blisters on a metal ring binder). In two pharmacies, the empty blister from the previous
month was removed from the sleeve on the file and the new one put in. In another, the
sleeves from the previous month were completely unpacked and repacked again. Blisters
were racked onto separate files for morning, afternoon, evening and night time
administration. In one pharmacy the pharmacist reported that medication which needed to
be taken at a separate time to other medication was sometimes packed in a separate sleeve
to emphasise this. The order of patients in the file was arranged according to the home’s
116
requirements e.g. alphabetical order, room number order or order patients sat in the dining
room. In some cases the filing did not take place immediately after dispensing e.g. in one
pharmacy there was a shortage of space as blisters needed a lot more space when filed. In
cases where blisters were prepared but not packed straight away a rubber band was placed
around each patient’s blisters.
Checking of MDS
When a dispenser rather than a pharmacist dispensed the medication, it was then checked
by an accredited checker or a pharmacist. The pharmacist who dispensed some Nomads,
said that he always filled these himself as it was impossible to check after someone else had
dispensed it. Medication was checked solely by a pharmacist in four cases but in one case a
clinical check of the prescription’s appropriateness was carried out by the pharmacist after
which an accredited technician checked the dispensed product (a similar procedure to that
used in most hospital dispensaries). The accredited technician did not check interims.
These were checked by the pharmacist. The checking process was carried out at different
stages at different pharmacies. In two pharmacies checking occurred before blisters were
racked and in three after blisters were racked. In two checking occurred before the printing
of the MAR sheets and in two checking occurred after printing.
The checking process involved first checking the label and then the blister. In two
pharmacies the checker held a pen and ran it across the blister to ensure all compartments
were filled correctly. Blisters were turned over during the checking process to ensure they
were correctly sealed. The identification of tablets in the blister was checked in different
ways in different pharmacies. In one pharmacy it was checked against the original packs
and in two others the dispenser had cut off information relating to the medication identity
from the original pack and clipped it to the blister. In these pharmacies if the tablets were
dispensed from a bulk pot, the dispenser showed the pot to another dispenser at the time of
dispensing and this was not checked again at the final check. Items outside the MDS
system were also checked. Liquids were smelt to confirm identity. In two pharmacies the
prescription was also checked against the MAR chart: a pen was run across the MAR sheet
with one hand and a finger run across the prescription with the other hand. In the
pharmacy where a pharmacist carried out a clinical check , this involved “eyeballing” the
117
prescription and signing it. No reference was made to any other resources, such as the
PMR. The accredited technician reported that she had identified clinical problems with
prescriptions after the clinical check had occurred on some occasions.
Errors which were observed to be identified by checkers during research visits included
wrong dose and filing for the wrong patient. When asked about errors commonly found
when checking, checkers included wrong dosage, wrong coloured sleeve and labelling
errors. Errors relating to the wrong product being dispensed were described as rare,
although the accredited technician said that it was common for the wrong formulation of a
product to be dispensed e.g. tablets instead of capsules. She said that labelling errors often
occurred when changes had been made to the prescription but the old instructions from the
PMR were printed.
During the checking process interruptions occurred, for example a telephone ringing or
liaison with a delivery driver.
6.3.3 Outcome
Relationships with homes were described as good by the majority of pharmacists.
The MDS dispensing process was reported to be much more time consuming than other
dispensing. One pharmacist stated that it took 3‐4 times as long. The pharmacist who
dispensed both Nomads and blisters said that the blisters were more time consuming and
described it as a tedious cumbersome process. However, two pharmacists reported that
although dispensing was more time consuming it was also more predictable than ‘walk in’
dispensing, as it was largely a repeat dispensing process, with interims being the only
unpredictable part, therefore staffing levels could be planned. A range of views, some
contrasting, regarding MDS dispensing were identified from interview data. For example
one pharmacist said MDS dispensing gave little satisfaction whereas another said it aided
staff development because of the different products seen.
118
6.4 Organisation
6.4.1 Structure
The number of homes to which pharmacies dispensed and the proportion of business
generated from homes varied. For example, two pharmacies dispensed to one home each,
whereas one dispensed to 76 homes. Homes were perceived as building up volume of
prescriptions and therefore revenue and good will. However, the view was also expressed
that it was easy to lose homes to large multiples. One pharmacist had agreed a one month
notice contract with the homes.
When asked about payment, no pharmacists reported being reimbursed for providing
medication in MDS. However, one had arranged to get weekly rather than monthly
prescriptions in order to increase the number of items and therefore number of dispensing
fees they were paid. Pharmacists were reimbursed for providing 6 monthly visits to homes
in some cases. This contract included, giving advice about administration and storage of
medicines and clinical governance procedures. Pharmacists were not reimbursed for
carrying out medication reviews.
6.4.2 Process
Standard operating procedures were in place in pharmacies for dispensing to homes.
It became apparent from analysis of interview data, that pharmacists had a neutral to
negative opinion of CSCI inspectors. Six had little contact with inspectors. Two
pharmacists were of the view that inspectors had a fault finding approach and one of them
expressed the opinion that it would better if inspectors helped homes to develop safer
systems. He said that he would like to be present at the inspection and aid in this process.
Pharmacists reported becoming involved when homes wanted to ensure they had all the
correct paperwork in place for the inspection. One pharmacist said that helping homes to
work with points identified on the report was good for relationship building. Inspectors
contacted the pharmacies when problems were identified. These included having
handwritten changes on MAR charts, putting medication on MAR charts which was not
supplied that month and putting hygroscopic tablets within the MDS system. One
pharmacist expressed concern over litigation as everything was documented even when
119
pharmacists did not have control over decision‐making. Advice from inspectors was
reported as being inconsistent from different inspectors and for different homes.
6.4.3 Outcome
A range of medicines and clinical services were reported by pharmacists as being provided
to homes. The majority of pharmacists were of the view that they would try to meet all
home requirements in order to retain business, whereas others were of the opinion that if
the home wanted the service they had to meet the pharmacist’s terms and conditions. Six of
the pharmacies we visited offered MDS dispensing but two did not. All but one pharmacy
delivered the medication to the homes. The number of interims dispensed was variable
between homes. One pharmacy supplied most interims to the homes to which they
supplied monthly medication. They ensured they got the trade by offering same day
delivery provided the prescription was faxed to them before 10am.
Clinical services provided were variable between pharmacies. Six pharmacies provided
training to care home staff on MDS and disease management. One pharmacist stated that
he provided pharmaceutical care and addressed compliance issues. Three carried out
some medication reviews or visited homes with the doctors and participated in ‘ward
rounds.’ However, pharmacists also expressed the view that their skills were under
utilised, that they could visit homes more often and could carry out detailed reviews for
more patients. Pharmacists identified barriers to extending their role including lack of
remuneration (including for locum cover) and communication problems.
6.5 Discussion The dispensing process to care homes varied between pharmacies, in terms of the physical
structure of the dispensary, the technology used (MDS and IT systems), dispensing
procedures, volume of MDS dispensing and PCT contracts.
The MDS system was perceived as having advantages by some pharmacists. These
included benefits to the homes, due to ease of administration of medicines. The predictable
nature of dispensing to care homes was cited as an advantage to pharmacies, although this
is not necessarily directly linked to the medication being dispensed in MDS.
120
However, many disadvantages of the MDS were also identified. Increased costs and
reduced profitability of dispensing medication into MDS have been identified in previous
studies.43,102 The time consuming nature of MDS dispensing and lack of remuneration were
also raised pharmacists by participating in the current study. Previous research has also
highlighted the lack of information available regarding stability of medication in MDS
systems.103 The current study found that pharmacists had to balance this limited
information with the risk of medication being omitted completely – already the most
frequent form of administration error. Variation in practice was observed. The study also
demonstrated that it was not only the medication itself which may be incompatible but also
the medication regime. MDS were most suitable for medicines which were taken every day
of the month. More complex regimes, such as reducing doses of steroids, were perceived as
very difficult to dispense in an MDS and were dispensed outside of it in most cases. It
appears that MDS are not compatible for the more complex regimes, where it would be
assumed they would be of most benefit. Difficulties of tablet identification were also
identified, particularly within multidose systems.
Difficulties were also identified with other aspects of technology such as IT as well as with
interrelationships between pharmacies, care homes, surgeries and CSCI inspectors.
Relationships between pharmacies and CSCI inspectors were weak. There is potential for
these relationships to be strengthened so that inspectors can work with pharmacists for
patient benefit. In the cases of relationships between pharmacies and care homes and
surgeries both strong and weak examples were seen. The extent to which pharmacies were
prepared to accommodate the wishes of the care home was to some extent linked to the
perception of the importance of maintaining the contract with the care home to the overall
business. In some cases, good relationships were built where pharmacists neither
dispensed in MDS systems nor delivered to the homes. The saving of time enabled these
pharmacists to become involved with individuals’ pharmaceutical care. However, these
pharmacists did not perceive dispensing to care homes as an organisational strategy.
Pharmacists wishing to build up a large volume of care home dispensing felt the need to
offer an MDS service.
121
There was evidence that pharmacists were interested in providing extended clinical services
to care homes but lack of remuneration and communication/relationship difficulties were
acting as barriers. Many pharmacies were offering clinical services beyond that they that
were remunerated for within their PCT contract. However, the view was expressed that
there was much scope for increasing their clinical role further. As shown above, the time
consuming nature of dispensing in MDS systems may one of the barrier to achieving this.
The use of accredited technicians to check MDS medication was one strategy being
employed to allow pharmacists to carry out clinical work while providing MDS services,
but this was not widespread.
We realise we have studied MDS predominantly from the pharmacy perspective in this
chapter, however that has not been done in this depth before. We have not specifically
asked care home staff about it in the same way, and so some things they value MDS for are
not included. An example would be that MDS gives care home managers the ability to
easily audit that the right medicines had been given.
On the basis of the findings in this chapter, MDS is a technology that strongly structures
pharmacists’ work and may be a barrier to enhanced clinical services.
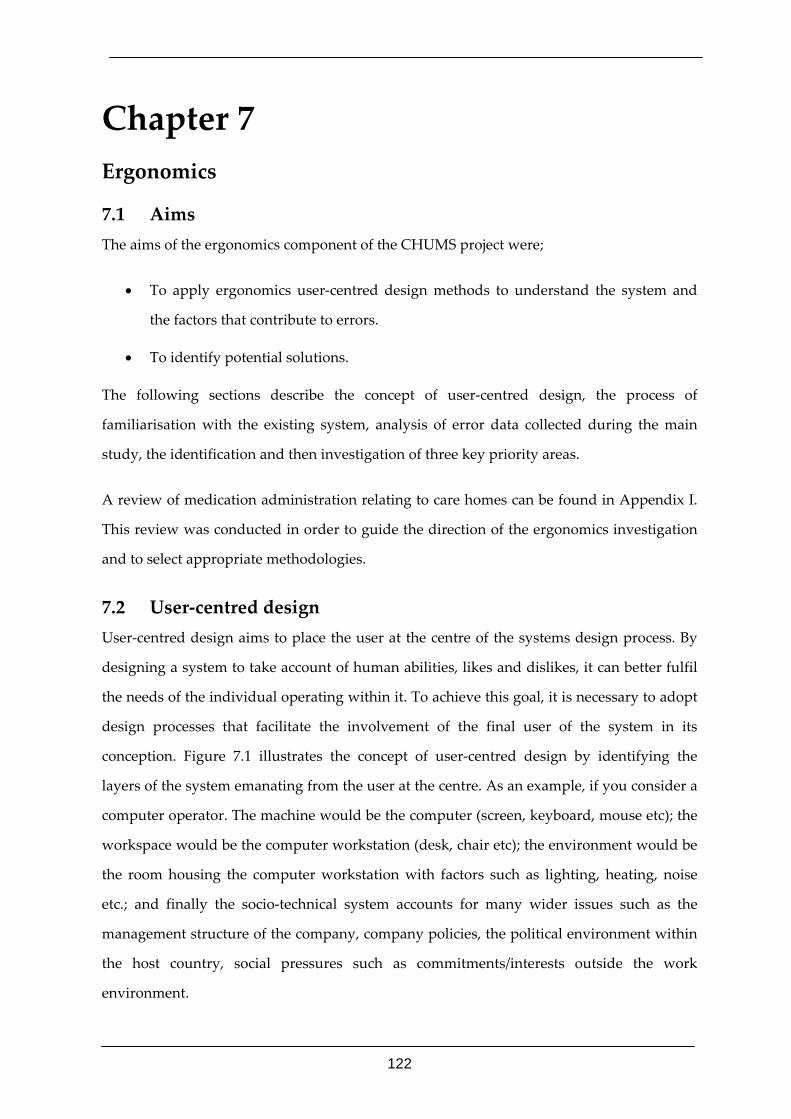
122
Chapter 7 Ergonomics
7.1 Aims The aims of the ergonomics component of the CHUMS project were;
• To apply ergonomics user‐centred design methods to understand the system and
the factors that contribute to errors.
• To identify potential solutions.
The following sections describe the concept of user‐centred design, the process of
familiarisation with the existing system, analysis of error data collected during the main
study, the identification and then investigation of three key priority areas.
A review of medication administration relating to care homes can be found in Appendix I.
This review was conducted in order to guide the direction of the ergonomics investigation
and to select appropriate methodologies.
7.2 User‐centred design User‐centred design aims to place the user at the centre of the systems design process. By
designing a system to take account of human abilities, likes and dislikes, it can better fulfil
the needs of the individual operating within it. To achieve this goal, it is necessary to adopt
design processes that facilitate the involvement of the final user of the system in its
conception. Figure 7.1 illustrates the concept of user‐centred design by identifying the
layers of the system emanating from the user at the centre. As an example, if you consider a
computer operator. The machine would be the computer (screen, keyboard, mouse etc); the
workspace would be the computer workstation (desk, chair etc); the environment would be
the room housing the computer workstation with factors such as lighting, heating, noise
etc.; and finally the socio‐technical system accounts for many wider issues such as the
management structure of the company, company policies, the political environment within
the host country, social pressures such as commitments/interests outside the work
environment.
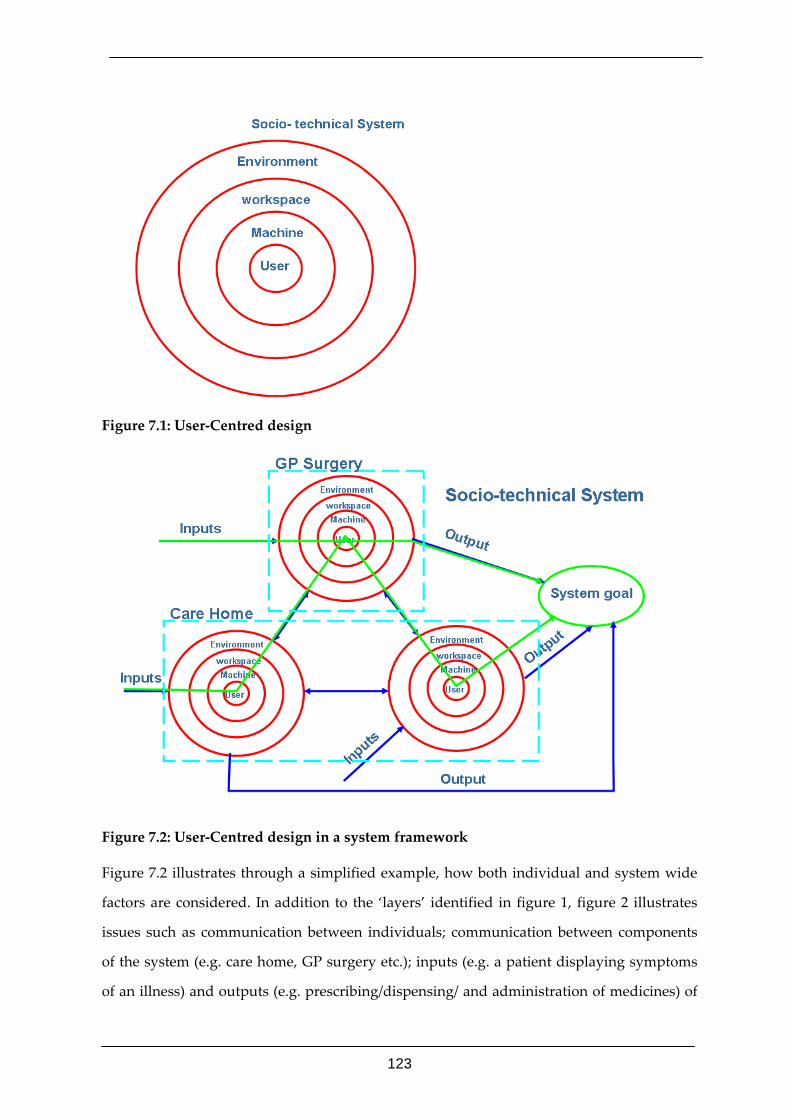
123
Figure 7.1: User‐Centred design
Figure 7.2: User‐Centred design in a system framework
Figure 7.2 illustrates through a simplified example, how both individual and system wide
factors are considered. In addition to the ‘layers’ identified in figure 1, figure 2 illustrates
issues such as communication between individuals; communication between components
of the system (e.g. care home, GP surgery etc.); inputs (e.g. a patient displaying symptoms
of an illness) and outputs (e.g. prescribing/dispensing/ and administration of medicines) of
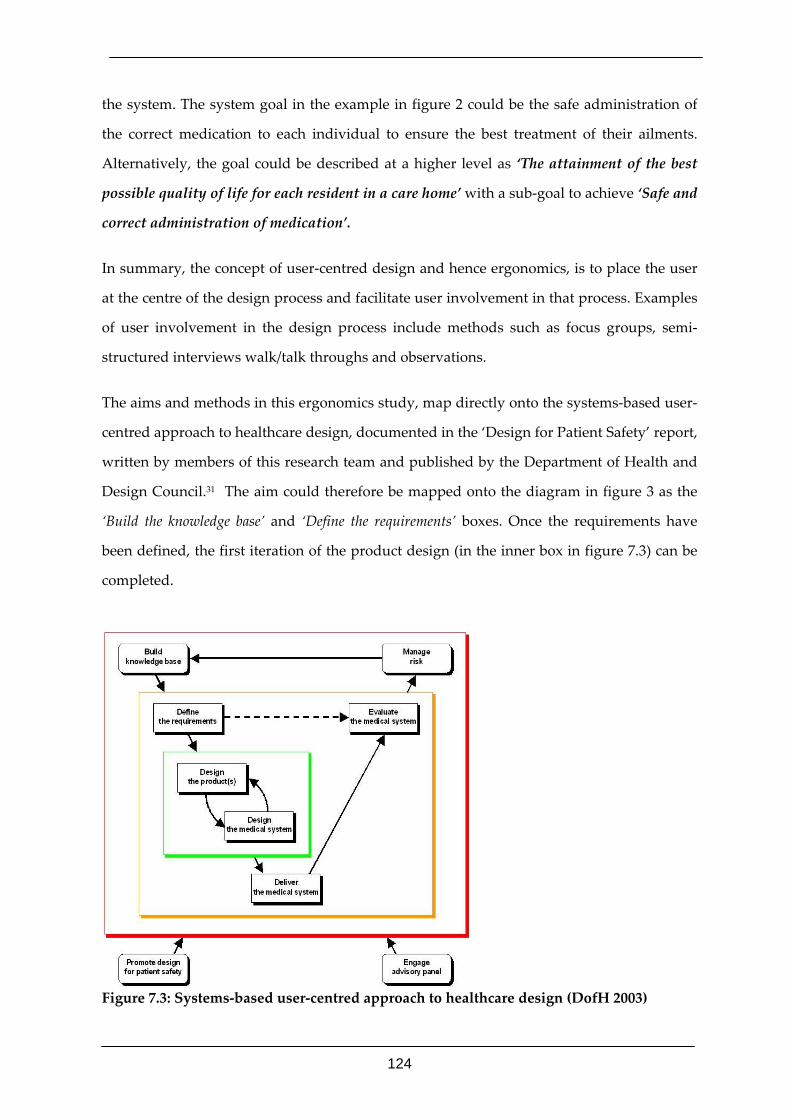
124
the system. The system goal in the example in figure 2 could be the safe administration of
the correct medication to each individual to ensure the best treatment of their ailments.
Alternatively, the goal could be described at a higher level as ‘The attainment of the best
possible quality of life for each resident in a care home’ with a sub‐goal to achieve ‘Safe and
correct administration of medication’.
In summary, the concept of user‐centred design and hence ergonomics, is to place the user
at the centre of the design process and facilitate user involvement in that process. Examples
of user involvement in the design process include methods such as focus groups, semi‐
structured interviews walk/talk throughs and observations.
The aims and methods in this ergonomics study, map directly onto the systems‐based user‐
centred approach to healthcare design, documented in the ‘Design for Patient Safety’ report,
written by members of this research team and published by the Department of Health and
Design Council.31 The aim could therefore be mapped onto the diagram in figure 3 as the
‘Build the knowledge base’ and ‘Define the requirements’ boxes. Once the requirements have
been defined, the first iteration of the product design (in the inner box in figure 7.3) can be
completed.
Figure 7.3: Systems‐based user‐centred approach to healthcare design (DofH 2003)
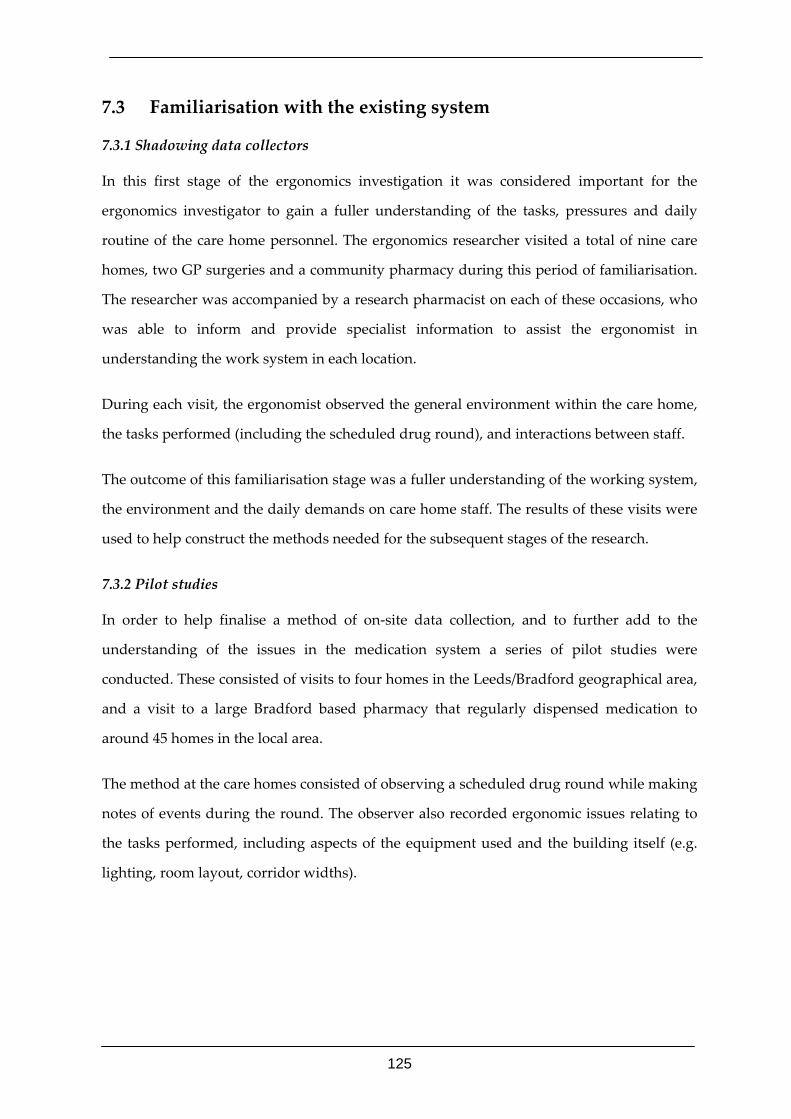
125
7.3 Familiarisation with the existing system
7.3.1 Shadowing data collectors
In this first stage of the ergonomics investigation it was considered important for the
ergonomics investigator to gain a fuller understanding of the tasks, pressures and daily
routine of the care home personnel. The ergonomics researcher visited a total of nine care
homes, two GP surgeries and a community pharmacy during this period of familiarisation.
The researcher was accompanied by a research pharmacist on each of these occasions, who
was able to inform and provide specialist information to assist the ergonomist in
understanding the work system in each location.
During each visit, the ergonomist observed the general environment within the care home,
the tasks performed (including the scheduled drug round), and interactions between staff.
The outcome of this familiarisation stage was a fuller understanding of the working system,
the environment and the daily demands on care home staff. The results of these visits were
used to help construct the methods needed for the subsequent stages of the research.
7.3.2 Pilot studies
In order to help finalise a method of on‐site data collection, and to further add to the
understanding of the issues in the medication system a series of pilot studies were
conducted. These consisted of visits to four homes in the Leeds/Bradford geographical area,
and a visit to a large Bradford based pharmacy that regularly dispensed medication to
around 45 homes in the local area.
The method at the care homes consisted of observing a scheduled drug round while making
notes of events during the round. The observer also recorded ergonomic issues relating to
the tasks performed, including aspects of the equipment used and the building itself (e.g.
lighting, room layout, corridor widths).
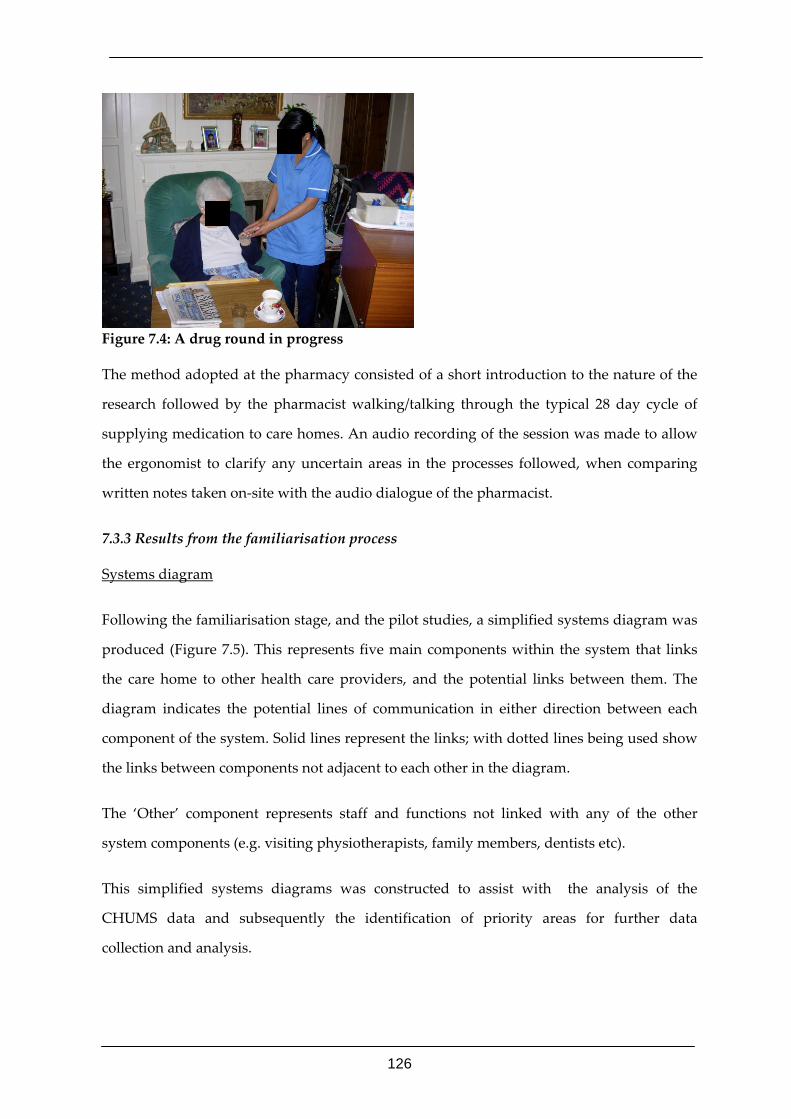
126
Figure 7.4: A drug round in progress
The method adopted at the pharmacy consisted of a short introduction to the nature of the
research followed by the pharmacist walking/talking through the typical 28 day cycle of
supplying medication to care homes. An audio recording of the session was made to allow
the ergonomist to clarify any uncertain areas in the processes followed, when comparing
written notes taken on‐site with the audio dialogue of the pharmacist.
7.3.3 Results from the familiarisation process
Systems diagram
Following the familiarisation stage, and the pilot studies, a simplified systems diagram was
produced (Figure 7.5). This represents five main components within the system that links
the care home to other health care providers, and the potential links between them. The
diagram indicates the potential lines of communication in either direction between each
component of the system. Solid lines represent the links; with dotted lines being used show
the links between components not adjacent to each other in the diagram.
The ‘Other’ component represents staff and functions not linked with any of the other
system components (e.g. visiting physiotherapists, family members, dentists etc).
This simplified systems diagrams was constructed to assist with the analysis of the
CHUMS data and subsequently the identification of priority areas for further data
collection and analysis.
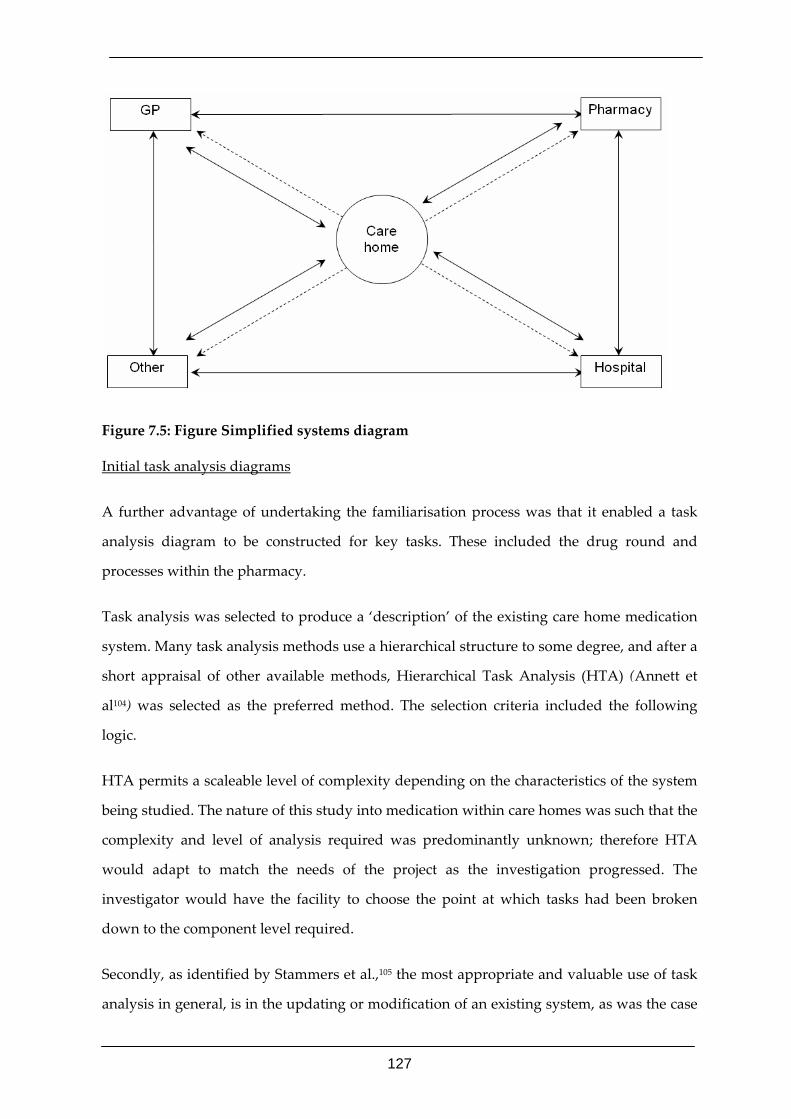
127
Figure 7.5: Figure Simplified systems diagram
Initial task analysis diagrams
A further advantage of undertaking the familiarisation process was that it enabled a task
analysis diagram to be constructed for key tasks. These included the drug round and
processes within the pharmacy.
Task analysis was selected to produce a ‘description’ of the existing care home medication
system. Many task analysis methods use a hierarchical structure to some degree, and after a
short appraisal of other available methods, Hierarchical Task Analysis (HTA) (Annett et
al104) was selected as the preferred method. The selection criteria included the following
logic.
HTA permits a scaleable level of complexity depending on the characteristics of the system
being studied. The nature of this study into medication within care homes was such that the
complexity and level of analysis required was predominantly unknown; therefore HTA
would adapt to match the needs of the project as the investigation progressed. The
investigator would have the facility to choose the point at which tasks had been broken
down to the component level required.
Secondly, as identified by Stammers et al.,105 the most appropriate and valuable use of task
analysis in general, is in the updating or modification of an existing system, as was the case
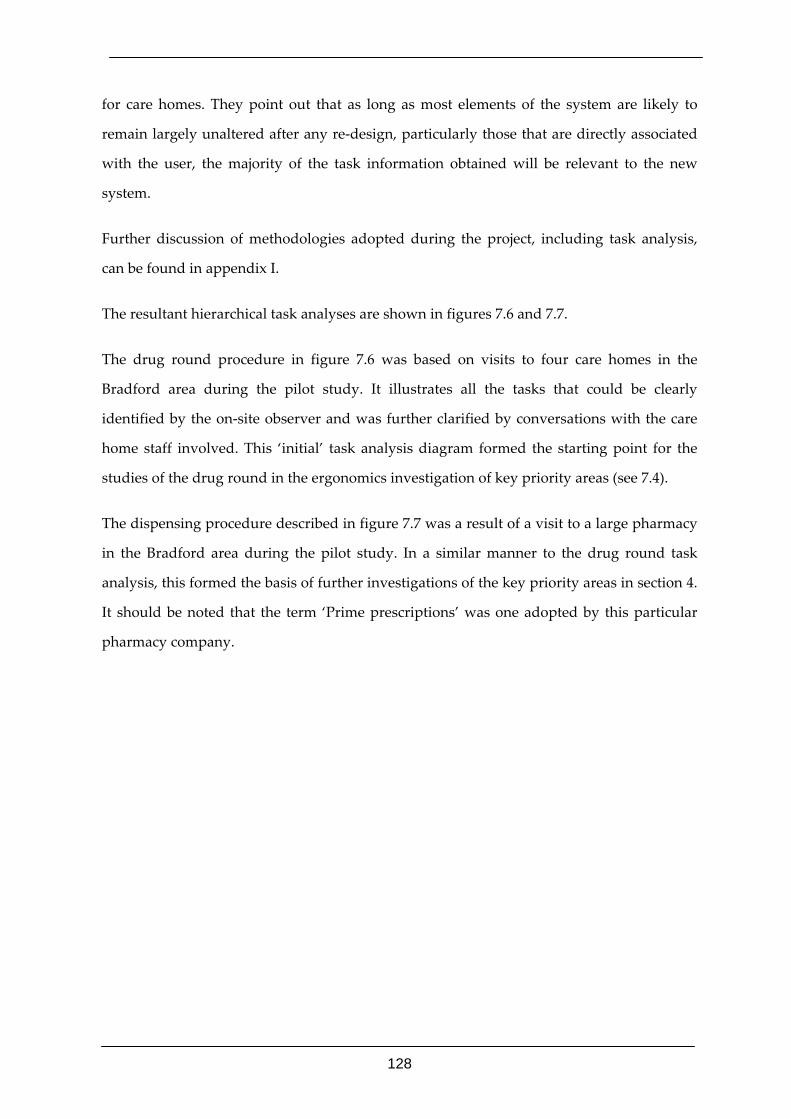
128
for care homes. They point out that as long as most elements of the system are likely to
remain largely unaltered after any re‐design, particularly those that are directly associated
with the user, the majority of the task information obtained will be relevant to the new
system.
Further discussion of methodologies adopted during the project, including task analysis,
can be found in appendix I.
The resultant hierarchical task analyses are shown in figures 7.6 and 7.7.
The drug round procedure in figure 7.6 was based on visits to four care homes in the
Bradford area during the pilot study. It illustrates all the tasks that could be clearly
identified by the on‐site observer and was further clarified by conversations with the care
home staff involved. This ‘initial’ task analysis diagram formed the starting point for the
studies of the drug round in the ergonomics investigation of key priority areas (see 7.4).
The dispensing procedure described in figure 7.7 was a result of a visit to a large pharmacy
in the Bradford area during the pilot study. In a similar manner to the drug round task
analysis, this formed the basis of further investigations of the key priority areas in section 4.
It should be noted that the term ‘Prime prescriptions’ was one adopted by this particular
pharmacy company.
129
Figure 7.6: Drug round procedure
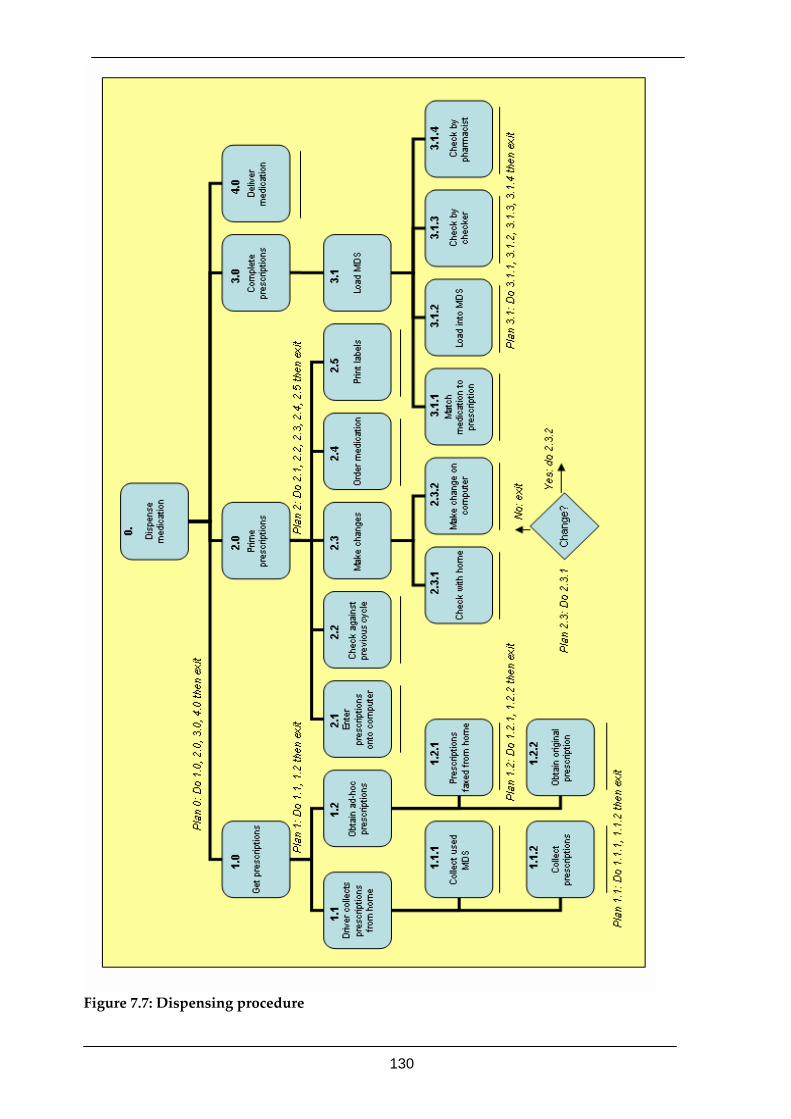
130
Figure 7.7: Dispensing procedure
131
7.4 Identifying key priority areas
7.4.1 Data analysis
Definition of the data set used for the analysis
The analysis was based on the 89 error reports .The errors were selected on the basis that
they were ‘more likely to have resulted in harm’.
Each of the 89 error reports was based on the information filed by key project personnel
during on‐site data collection in care homes, pharmacies, and GP surgeries. These sometimes
included semi‐structured interviews with the staff involved. This information was then
analysed to produce the 89 reports, using the framework developed by Vincent et al29 for the
analysis of risk and safety in medicine. This analysis attempted to identify and establish
contributory factors in a number of categories as well as identifying possible latent factors.
The categories included:
• Patient characteristics
• Task factors
• Individual factors
• Team factors
• Work environment
• Latent factors
Ergonomics Factors
In order to further analyse the 89 reports with the aim of focusing the ergonomics
investigation, a number of factors were defined. A summary of these (with examples) is
given below. The full list of factors can be seen in appendix J.
• Crossing system boundaries (25)
o GP – Pharmacy
o Care home – GP
o Hospital – Care home
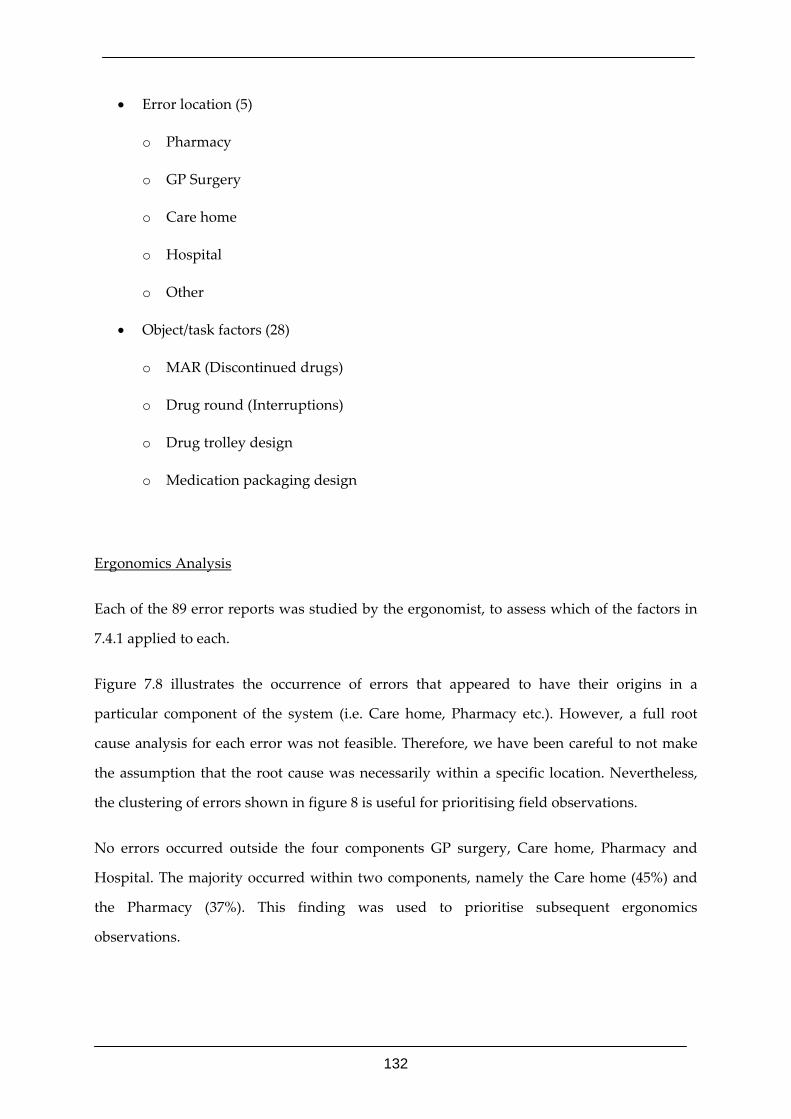
132
• Error location (5)
o Pharmacy
o GP Surgery
o Care home
o Hospital
o Other
• Object/task factors (28)
o MAR (Discontinued drugs)
o Drug round (Interruptions)
o Drug trolley design
o Medication packaging design
Ergonomics Analysis
Each of the 89 error reports was studied by the ergonomist, to assess which of the factors in
7.4.1 applied to each.
Figure 7.8 illustrates the occurrence of errors that appeared to have their origins in a
particular component of the system (i.e. Care home, Pharmacy etc.). However, a full root
cause analysis for each error was not feasible. Therefore, we have been careful to not make
the assumption that the root cause was necessarily within a specific location. Nevertheless,
the clustering of errors shown in figure 8 is useful for prioritising field observations.
No errors occurred outside the four components GP surgery, Care home, Pharmacy and
Hospital. The majority occurred within two components, namely the Care home (45%) and
the Pharmacy (37%). This finding was used to prioritise subsequent ergonomics
observations.
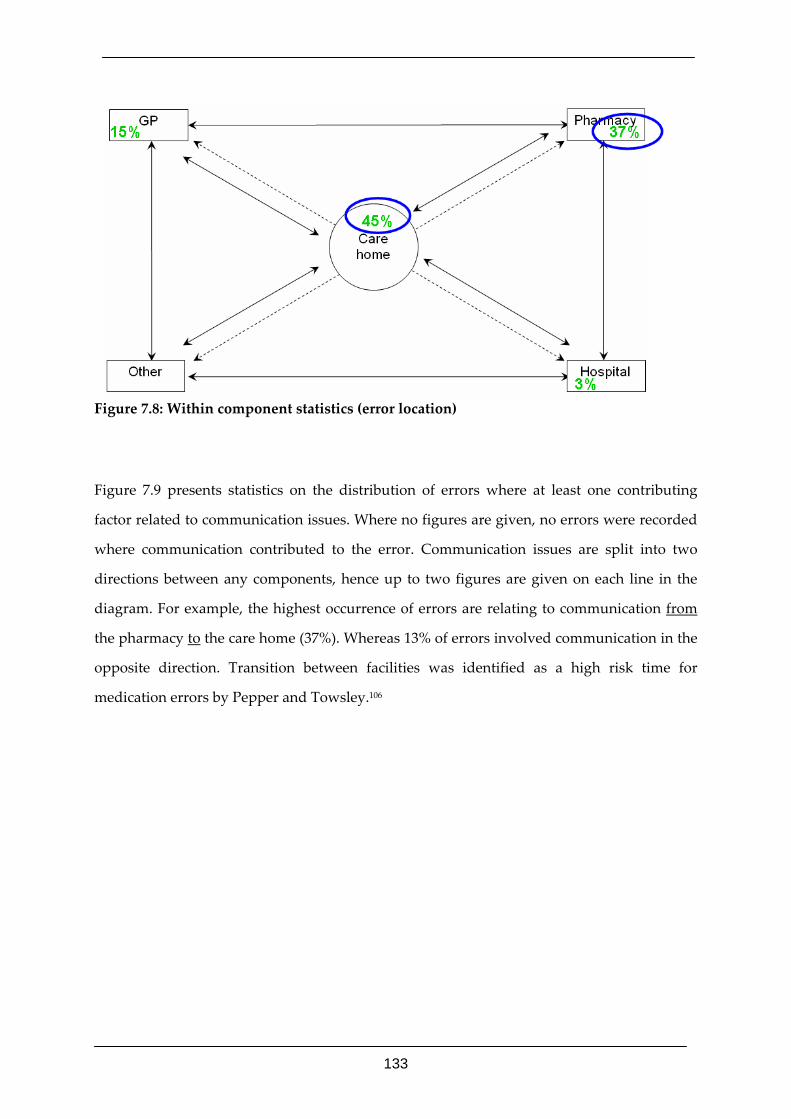
133
Figure 7.8: Within component statistics (error location)
Figure 7.9 presents statistics on the distribution of errors where at least one contributing
factor related to communication issues. Where no figures are given, no errors were recorded
where communication contributed to the error. Communication issues are split into two
directions between any components, hence up to two figures are given on each line in the
diagram. For example, the highest occurrence of errors are relating to communication from
the pharmacy to the care home (37%). Whereas 13% of errors involved communication in the
opposite direction. Transition between facilities was identified as a high risk time for
medication errors by Pepper and Towsley.106
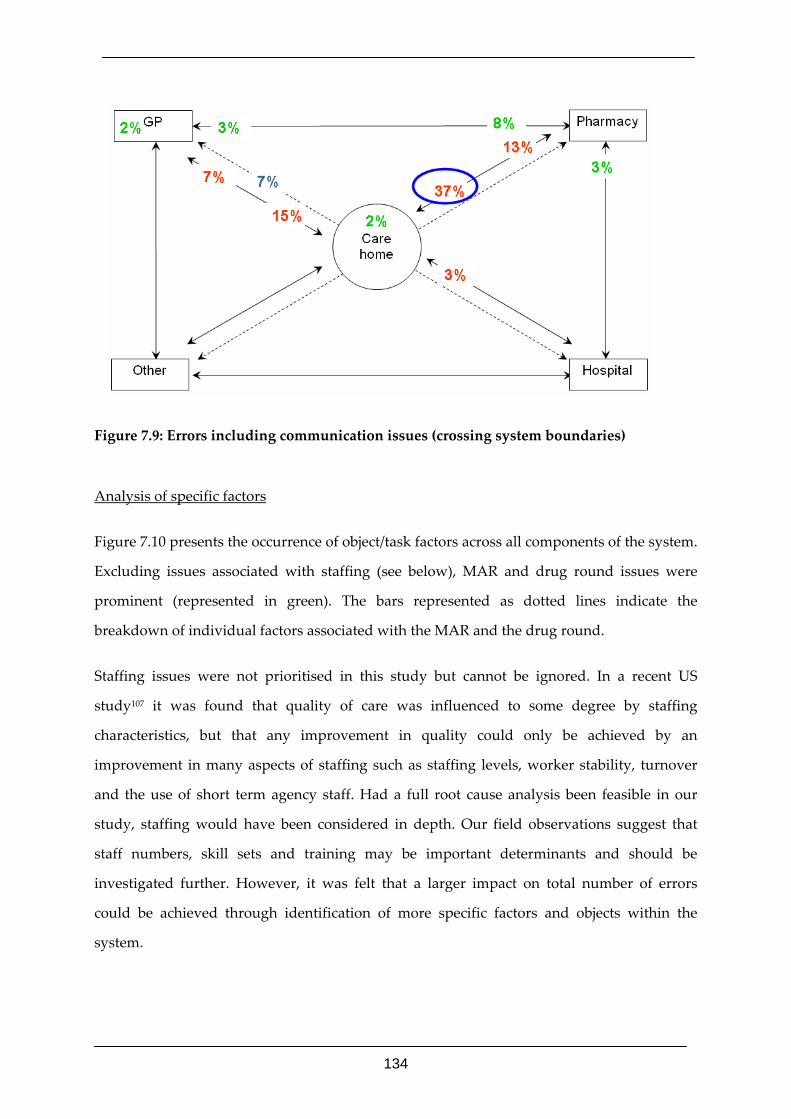
134
Figure 7.9: Errors including communication issues (crossing system boundaries)
Analysis of specific factors
Figure 7.10 presents the occurrence of object/task factors across all components of the system.
Excluding issues associated with staffing (see below), MAR and drug round issues were
prominent (represented in green). The bars represented as dotted lines indicate the
breakdown of individual factors associated with the MAR and the drug round.
Staffing issues were not prioritised in this study but cannot be ignored. In a recent US
study107 it was found that quality of care was influenced to some degree by staffing
characteristics, but that any improvement in quality could only be achieved by an
improvement in many aspects of staffing such as staffing levels, worker stability, turnover
and the use of short term agency staff. Had a full root cause analysis been feasible in our
study, staffing would have been considered in depth. Our field observations suggest that
staff numbers, skill sets and training may be important determinants and should be
investigated further. However, it was felt that a larger impact on total number of errors
could be achieved through identification of more specific factors and objects within the
system.
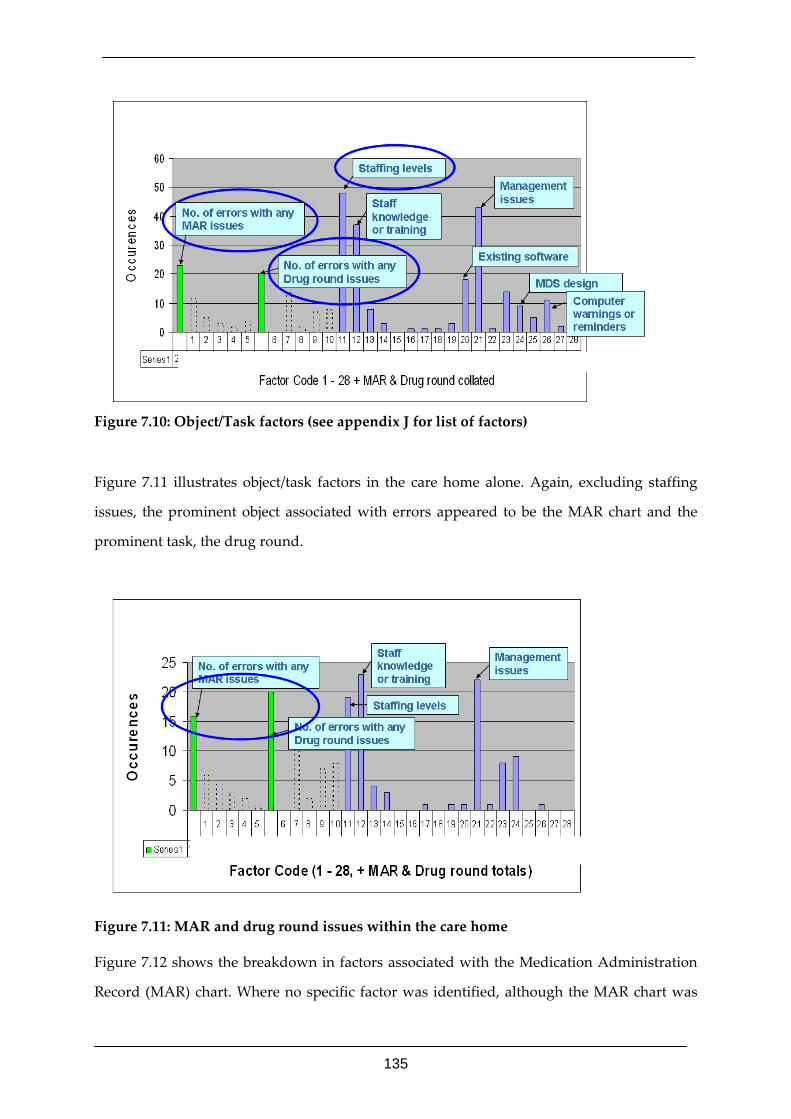
135
Figure 7.10: Object/Task factors (see appendix J for list of factors)
Figure 7.11 illustrates object/task factors in the care home alone. Again, excluding staffing
issues, the prominent object associated with errors appeared to be the MAR chart and the
prominent task, the drug round.
Figure 7.11: MAR and drug round issues within the care home
Figure 7.12 shows the breakdown in factors associated with the Medication Administration
Record (MAR) chart. Where no specific factor was identified, although the MAR chart was
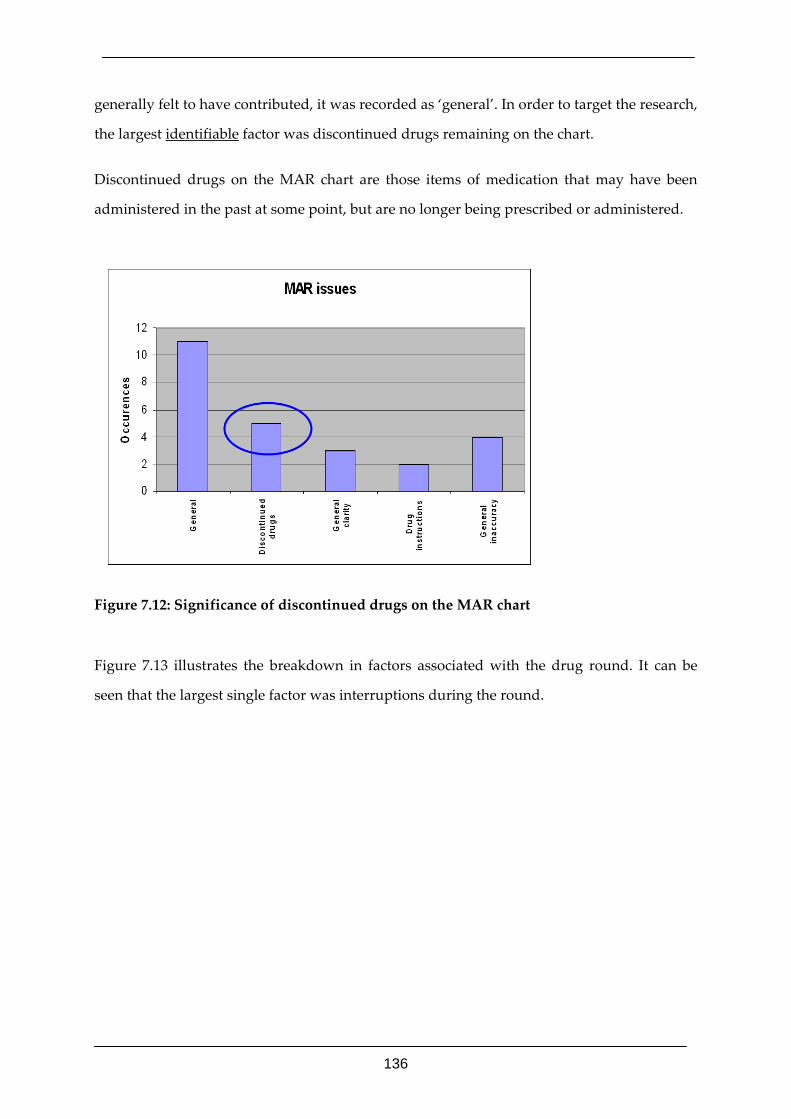
136
generally felt to have contributed, it was recorded as ‘general’. In order to target the research,
the largest identifiable factor was discontinued drugs remaining on the chart.
Discontinued drugs on the MAR chart are those items of medication that may have been
administered in the past at some point, but are no longer being prescribed or administered.
Figure 7.12: Significance of discontinued drugs on the MAR chart
Figure 7.13 illustrates the breakdown in factors associated with the drug round. It can be
seen that the largest single factor was interruptions during the round.
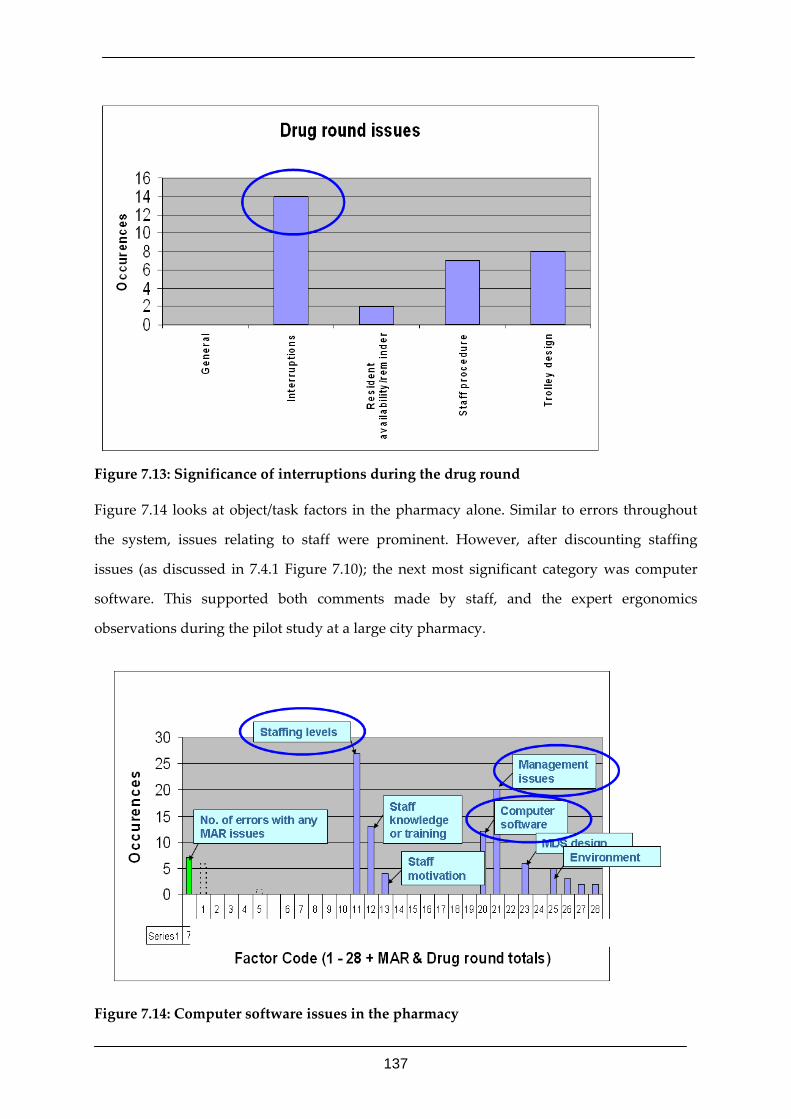
137
Figure 7.13: Significance of interruptions during the drug round
Figure 7.14 looks at object/task factors in the pharmacy alone. Similar to errors throughout
the system, issues relating to staff were prominent. However, after discounting staffing
issues (as discussed in 7.4.1 Figure 7.10); the next most significant category was computer
software. This supported both comments made by staff, and the expert ergonomics
observations during the pilot study at a large city pharmacy.
Figure 7.14: Computer software issues in the pharmacy
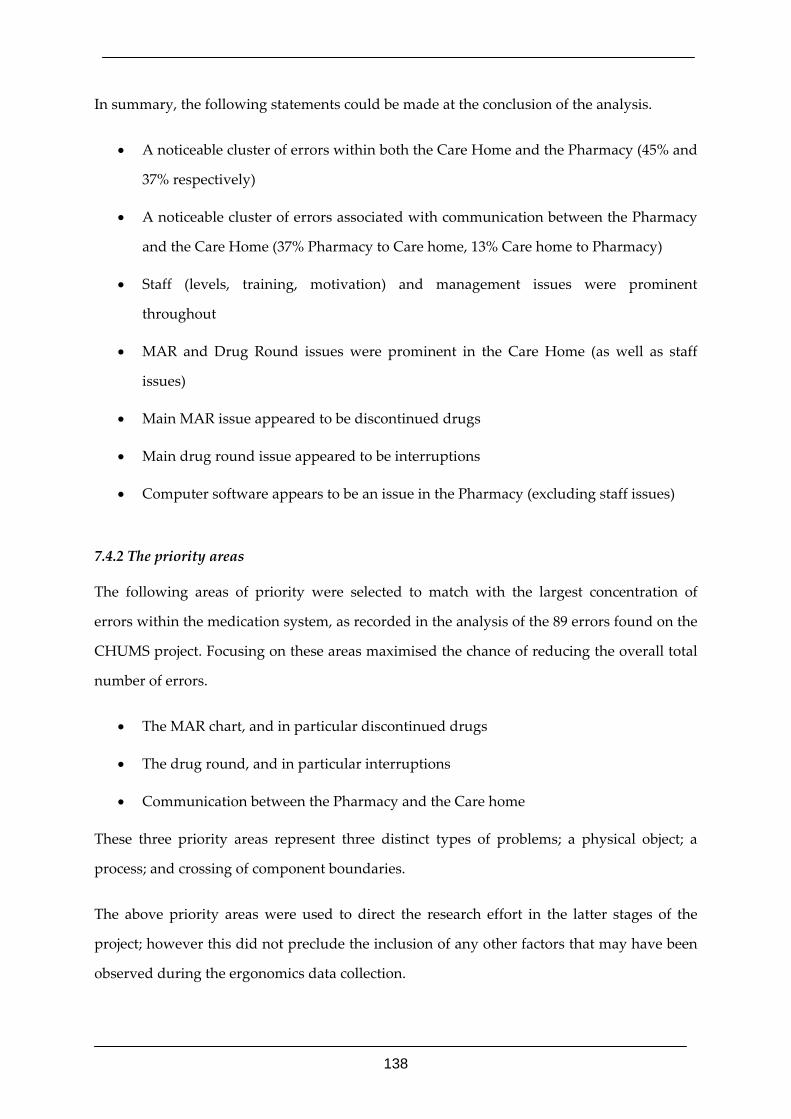
138
In summary, the following statements could be made at the conclusion of the analysis.
• A noticeable cluster of errors within both the Care Home and the Pharmacy (45% and
37% respectively)
• A noticeable cluster of errors associated with communication between the Pharmacy
and the Care Home (37% Pharmacy to Care home, 13% Care home to Pharmacy)
• Staff (levels, training, motivation) and management issues were prominent
throughout
• MAR and Drug Round issues were prominent in the Care Home (as well as staff
issues)
• Main MAR issue appeared to be discontinued drugs
• Main drug round issue appeared to be interruptions
• Computer software appears to be an issue in the Pharmacy (excluding staff issues)
7.4.2 The priority areas
The following areas of priority were selected to match with the largest concentration of
errors within the medication system, as recorded in the analysis of the 89 errors found on the
CHUMS project. Focusing on these areas maximised the chance of reducing the overall total
number of errors.
• The MAR chart, and in particular discontinued drugs
• The drug round, and in particular interruptions
• Communication between the Pharmacy and the Care home
These three priority areas represent three distinct types of problems; a physical object; a
process; and crossing of component boundaries.
The above priority areas were used to direct the research effort in the latter stages of the
project; however this did not preclude the inclusion of any other factors that may have been
observed during the ergonomics data collection.
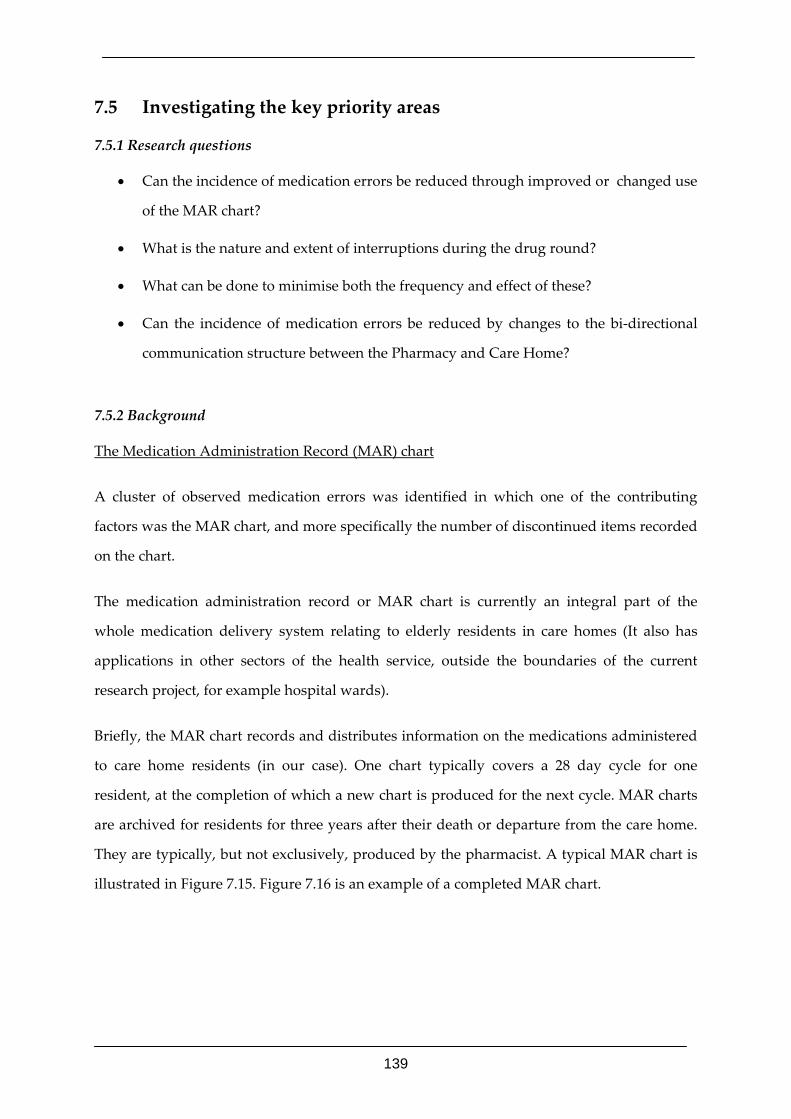
139
7.5 Investigating the key priority areas
7.5.1 Research questions
• Can the incidence of medication errors be reduced through improved or changed use
of the MAR chart?
• What is the nature and extent of interruptions during the drug round?
• What can be done to minimise both the frequency and effect of these?
• Can the incidence of medication errors be reduced by changes to the bi‐directional
communication structure between the Pharmacy and Care Home?
7.5.2 Background
The Medication Administration Record (MAR) chart
A cluster of observed medication errors was identified in which one of the contributing
factors was the MAR chart, and more specifically the number of discontinued items recorded
on the chart.
The medication administration record or MAR chart is currently an integral part of the
whole medication delivery system relating to elderly residents in care homes (It also has
applications in other sectors of the health service, outside the boundaries of the current
research project, for example hospital wards).
Briefly, the MAR chart records and distributes information on the medications administered
to care home residents (in our case). One chart typically covers a 28 day cycle for one
resident, at the completion of which a new chart is produced for the next cycle. MAR charts
are archived for residents for three years after their death or departure from the care home.
They are typically, but not exclusively, produced by the pharmacist. A typical MAR chart is
illustrated in Figure 7.15. Figure 7.16 is an example of a completed MAR chart.
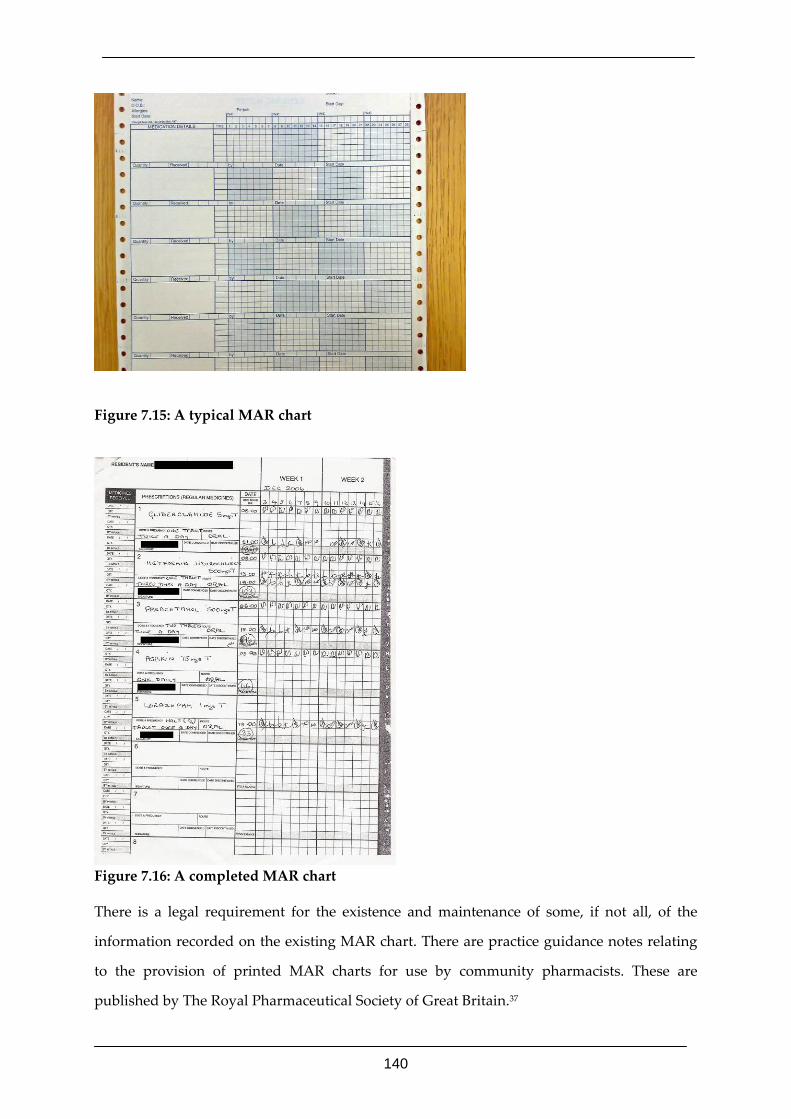
140
Figure 7.15: A typical MAR chart
Figure 7.16: A completed MAR chart
There is a legal requirement for the existence and maintenance of some, if not all, of the
information recorded on the existing MAR chart. There are practice guidance notes relating
to the provision of printed MAR charts for use by community pharmacists. These are
published by The Royal Pharmaceutical Society of Great Britain.37
141
It is acknowledged by RPSGB that MAR charts are official records. To quote, ‘They are a
formal record of administration of medicine and have been used as evidence in court cases’.
The document also continues to state that care workers are highly dependent on the content
and accuracy of printed MAR charts.
The drug round and interruptions
The medication error data collected on the CHUMS project identified a cluster of observed
errors in which at least one of the contributing factors was associated with the drug round
and more specifically interruptions during the drug round in the care home.
One of the daily tasks within a care home is to safely and accurately administer medication
to those residents requiring it. Typically to achieve this, a home will conduct three to four
‘drug rounds’ each day. These normally take place in the morning, midday, early evening,
and where required late evening.
The drug round will generally be conducted by one member of the care staff, and can
typically take anything between 30 minutes and in excess of two hours (depending on the
number of residents and the time of day). It is commonly designed to coincide with
resident’s meal times, therefore allowing some residents to receive their drugs while in a
single location. However, many residents will still be in their bedrooms necessitating staff in
travelling around the home to locate them.
The large majority of homes in the study use a trolley to transport the medication and
associated records around the home. A common design of trolley can be seen in Figure 7.17
below.
Figure 7.17: Typical drug trolley used in care homes
142
A small minority of homes were observed to use a ‘drug room’ rather than the more
common drug trolley. This is normally a small room or walk in cupboard, containing the
same items carried on the trolley. The extra space available did permit a wider choice of
layout.
Communication between the Pharmacy and the Care home
A cluster of observed medication errors was identified in which one of the contributing
factors was bi‐directional communication between the pharmacy and the care home.
The potential exists for either inaccurate or missing information between these two system
components. Information to be communicated between the pharmacy and the care home
include; administration instructions for medication (via medication labels and the MAR
chart), medication no longer to be administered; changes in medication instructed by
medical personnel during the typical 28 day cycle of medication supply etc.
7.5.3 Method
Aims
• To investigate the reason for discontinued items on the MAR (Medication
Administration Record) (i.e. medication that is not required by, or prescribed for the
resident but is still appearing as an item on the MAR chart.
• To collect data on interruptions during the drug round
• To describe the communication procedures between the care home and pharmacy
(and vice versa).
Domain professionals focus group
In order to solicit as much user feedback in a relatively short space of time, it was decided to
convene a focus group.
Focus groups are a recognised form of group interview involving one/two moderators who
facilitate a discussion with around 5 to 10 group members. The lead moderator is required to
keep the focus of the discussion on the pre‐selected topic of interest. It will commonly
143
include an introduction to the topic to be discussed. They are more often applied to the
evaluation of computer interfaces. A review of focus groups as applied to the user interface
of advanced IT systems can be found in Christie et al.108
The topic for this focus group was:‐
‘The MAR chart, its role in the medication system and the issue of discontinued items’.
The group consisted of six professionals associated with the entire system of caring for the
elderly in care homes. The professions of the group members were as listed below.
• Care home manager
• Local GP
• Academic pharmacist
• Pharmacy manager
• Research pharmacist
• Care home nurse
The group was hosted at Leeds University and met for approximately three hours.
A short presentation was given by the group convenor to introduce the CHUMS project to
those not already familiar with it.
To supplement the information to be elicited through the focus group discussion to follow,
the group were given individual questionnaires to complete (Appendix K).
The main section of the meeting consisted of a semi‐structured discussion in order to reach
consensus on the response to a set of statements/questions. These were identical to those
contained in the aforementioned questionnaire (Appendix K).
The entire focus group session was recorded and later transcribed.
In order to further understand the opinions of the group, a coding framework was devised
and the transcript was subsequently broken down into relevant statements relating to the
144
coding structure. Both the transcript and the coding framework can be seen in appendix 3
and 4 respectively.
Field data collection at the Care home
1. Observations during a drug round
The ergonomist shadowed a member of staff during each full drug round. Using an
observation table to record events, any interruptions were documented with time and
other details being recorded. If further clarification on the nature of the interruption
was required, the ergonomist asked the staff member to explain events in more
detail.
2. Semi‐structured interview
Immediately following the drug round, a number of questions (see below) were
raised with the staff member in a semi‐structured interview. They related to
interruptions during the drug round, the communication between the pharmacy and
the care home and MAR discontinued items.
Part 1 – Drug round interruptions
o How often do you conduct the drug round?
o Was today a typical round?
o What other responsibilities do you have on this shift?
In addition to the above questions, the ergonomist went through the list of recorded
interruptions to clarify whether the interruption was beneficial,
avoidable/unavoidable, and whether other staff could have dealt with it.
Part 2 ‐ Communication
o What are the lines of communication you have with the care home (e.g. Fax,
telephone, email, post, visits)?
145
o Could you complete the attached table for all categories of information
transferred?
o What information is not transferred from the care home to the pharmacy, but
should be?
o What information is not transferred from the pharmacy to the care home, but
should be?
Part 3 – The MAR chart
o What is the primary purpose of the MAR chart?
o What additional purposes (if any) does the MAR chart serve?
o Could you complete the attached table for all information contained on the MAR
chart?
o Does the MAR chart fulfil its primary purpose?
o Does the MAR chart fulfil its additional purposes?
o What are the reasons for discontinued items on the MAR chart?
o How are medicines not on the MAR chart catered for?
3. A semi‐structured interview also took place with the care home manager (where
practical). It covered the questions relating to the MAR chart and communication
Field data collection at the pharmacy
Walk/talk through
After an introduction to the CHUMS project, the pharmacy staff member was asked
to talk through the processes that take place in one full cycle of administration to a
care home.
Semi‐structured interview
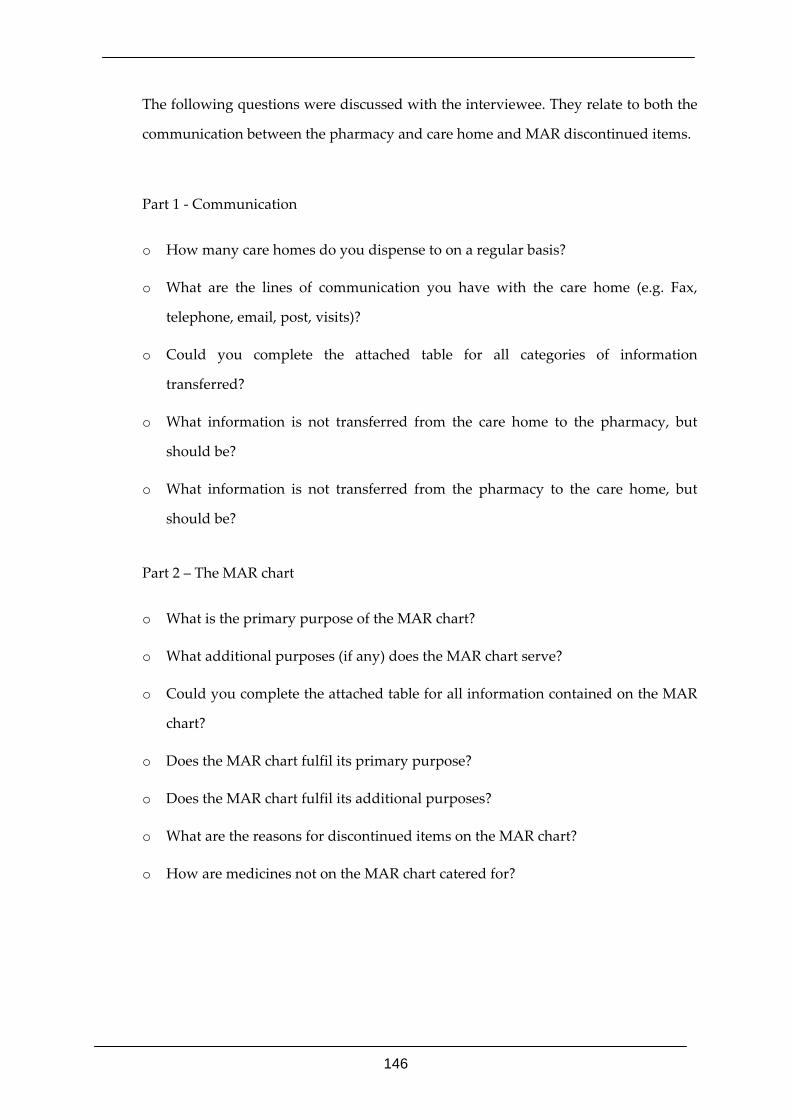
146
The following questions were discussed with the interviewee. They relate to both the
communication between the pharmacy and care home and MAR discontinued items.
Part 1 ‐ Communication
o How many care homes do you dispense to on a regular basis?
o What are the lines of communication you have with the care home (e.g. Fax,
telephone, email, post, visits)?
o Could you complete the attached table for all categories of information
transferred?
o What information is not transferred from the care home to the pharmacy, but
should be?
o What information is not transferred from the pharmacy to the care home, but
should be?
Part 2 – The MAR chart
o What is the primary purpose of the MAR chart?
o What additional purposes (if any) does the MAR chart serve?
o Could you complete the attached table for all information contained on the MAR
chart?
o Does the MAR chart fulfil its primary purpose?
o Does the MAR chart fulfil its additional purposes?
o What are the reasons for discontinued items on the MAR chart?
o How are medicines not on the MAR chart catered for?
147
7.5.4 Results
The drug round and interruptions
It is important to define what was being measured to fully understand the data collected.
The definitions below were generated to aid data interpretation.
• Definition of an interruption
o An interruption is an event from any source, with the potential to interfere in the
activity, physical or mental, devoted to the primary task
• Specific definitions for this study
o An interruption is an event that requires the attention, verbal or physical, of the
staff member performing the drug round
o An event is activity, other than the drug round, that the staff member could be
aware of visually or audibly
o An unanticipated task is an operational task required but not planned for in
normal drug round procedures
Figure 7.18 illustrates a typical data sheet used to record events during the drug round. It
highlights the categories of data recorded.
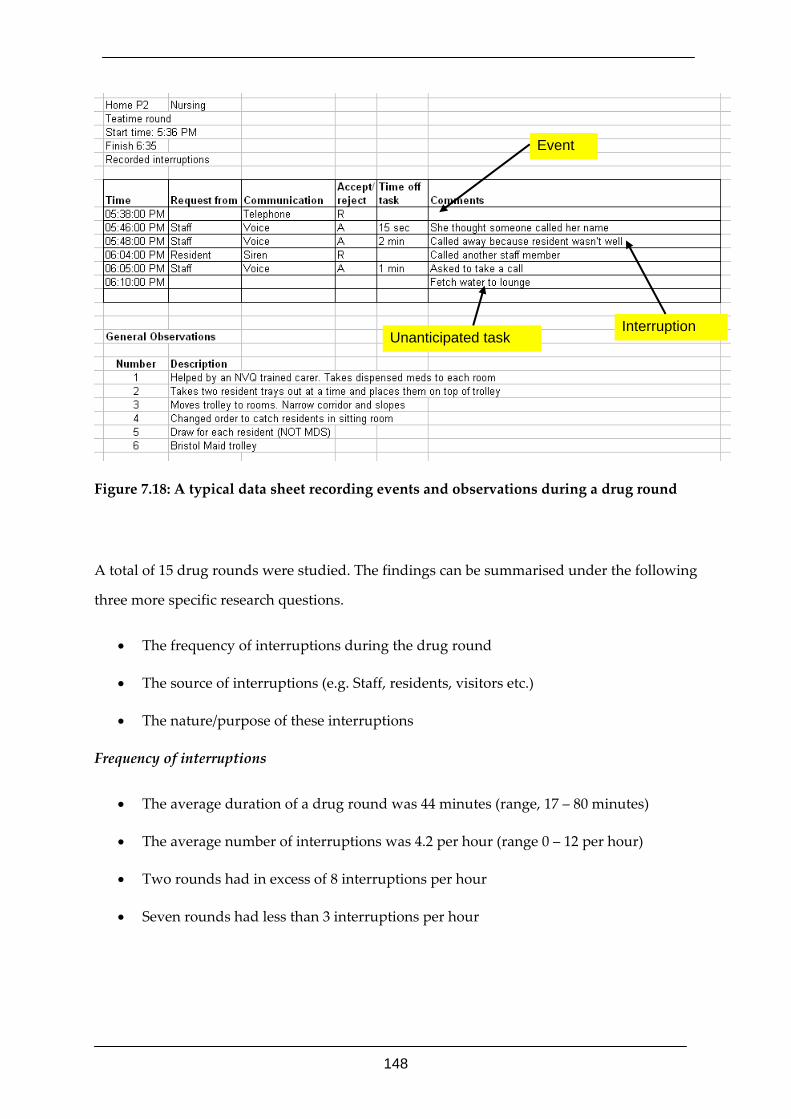
148
Figure 7.18: A typical data sheet recording events and observations during a drug round
A total of 15 drug rounds were studied. The findings can be summarised under the following
three more specific research questions.
• The frequency of interruptions during the drug round
• The source of interruptions (e.g. Staff, residents, visitors etc.)
• The nature/purpose of these interruptions
Frequency of interruptions
• The average duration of a drug round was 44 minutes (range, 17 – 80 minutes)
• The average number of interruptions was 4.2 per hour (range 0 – 12 per hour)
• Two rounds had in excess of 8 interruptions per hour
• Seven rounds had less than 3 interruptions per hour
Interruption
Event
Unanticipated task
149
Source of interruptions
• The most common interruptions were from other staff (28 out of a total of 46)
• A total of 4 of the 46 interruptions were verbal requests from residents
The nature/purpose of interruptions
• 25 of these 28 staff interruptions were operational issues
• Only 4 of the 28 were relevant to the drug round
Other events included
• Audible alarms
• Telephones ringing, but not requiring a response from the drug round staff
• Panic button sirens not requiring a response from drug round staff.
In summary the majority of interruptions originate from other care home staff and that the
majority of these relate to operational issues not relevant to the drug round. This suggests
that further research into the distribution of duties among staff could result in fewer
requirements for interruptions during the drug round.
Observations relating to all three priority areas
Figures 7.19 – 7.22 illustrate some of the observations made during the study of the three
priority areas, superimposed on the task analysis diagrams created during the earlier pilot
study. Variations in practices (Figures 7.19 and 7.20) can indicate adaptation of the system by
the operators (i.e. care workers, nurses, pharmacists etc.) to produce a better output.
Therefore these variations warranted close scrutiny to elicit useful information to guide
future design.
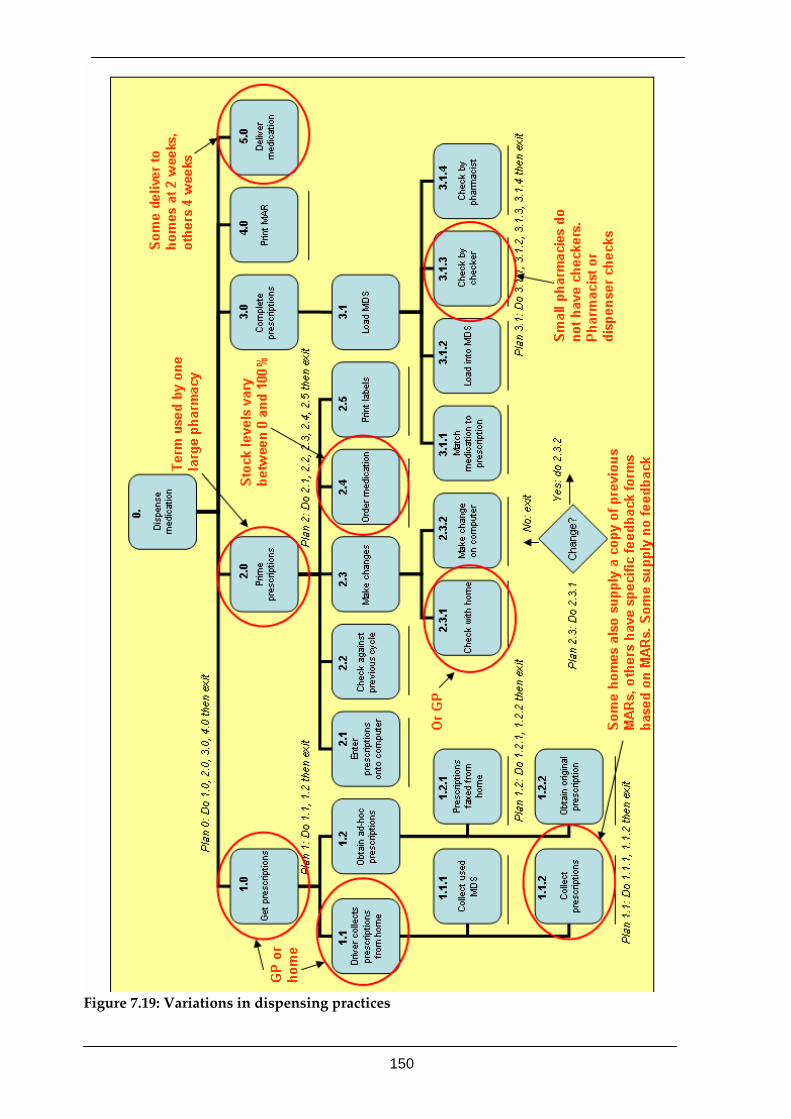
150
Figure 7.19: Variations in dispensing practices
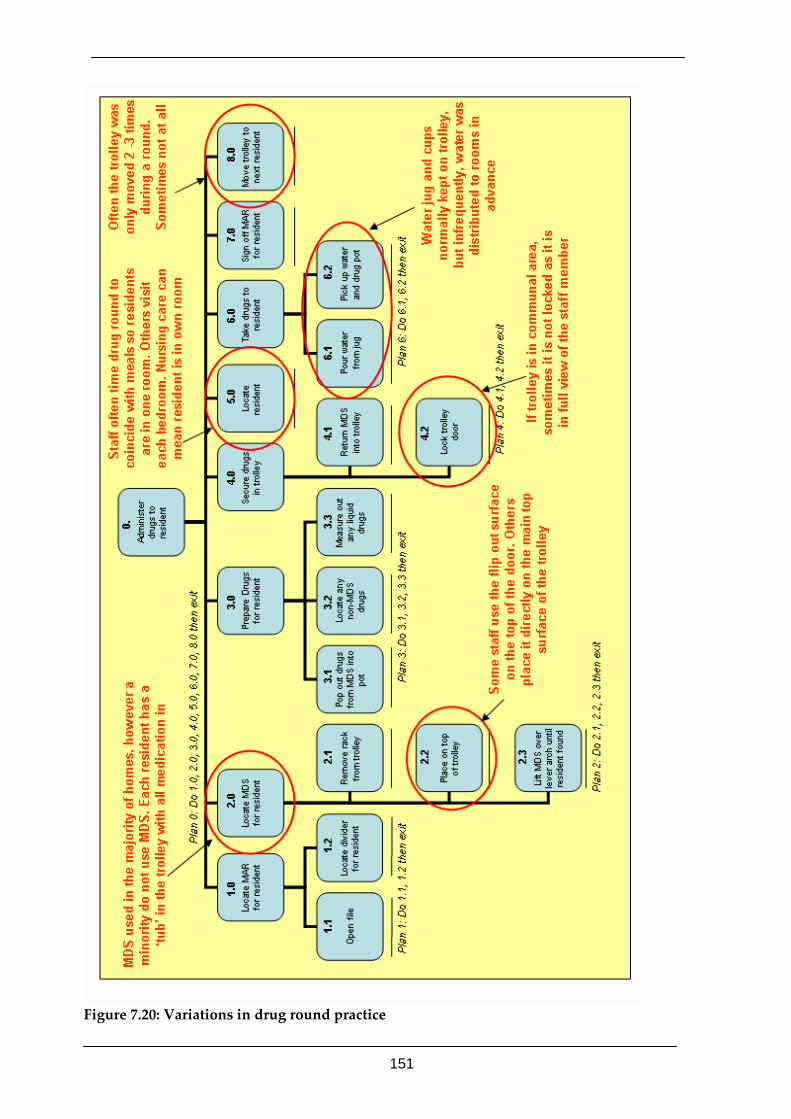
151
Figure 7.20: Variations in drug round practice
152
Figure 7.21 illustrates those tasks observed to be potentially susceptible to interruptions.
These tasks are as follows
• Task 4.0 ‘Secure drugs in trolley’
It was observed that the task of securing drugs in the trolley was repeated many
times during a drug round. Whenever a care worker/nurse was required to leave the
trolley the drugs needed to be secured to prevent access by residents.
In the event of an emergency interruption, the staff’s response to the emergency
could be delayed while the trolley was locked, or there would be potential for the
trolley to be unlocked while the staff member dealt with the interruption.
• Task 6.0 ‘Take drugs to resident’
After the staff member has prepared the drugs for a particular resident (i.e. retrieved
them from the MDS or measured liquids into a container) they then take the drugs to
the resident in order to administer them. In some cases the resident will be relatively
near, for example in the dining room along with the drugs trolley. In other cases the
resident may be in their bedroom with the trolley remaining outside the room in the
corridor.
In the case of an interruption, there is the potential for the medication to be
misplaced, left unattended or incorrectly administered.
• Task 7.0 ‘Sign off MAR for resident
It was generally observed that the staff member would sign off the MAR chart to
confirm administration of drugs after returning to the trolley following medication
administration to a resident.
If an interruption occurs during this stage of the task, an ‘error’ opportunity has been
generated as the staff member may omit to sign off the MAR chart although the
medication has been given.
153
• Task 3.2 ‘Locate any non‐MDS drugs’
In some cases due to the nature of the medication, items will not be within the MDS
system. Commonly such items are stored in the doors of the drugs trolley.
In the case of an interruption, if medication has been located ready for
administration, then it needs to be made secure until the administration can be
completed.
• Task 3.3 ‘Measure out any liquid medication’
Medicines in liquid form require to be measured out into a small container prior to
administration to the resident.
In the case of an interruption, the measured medicine needs to be made secure.
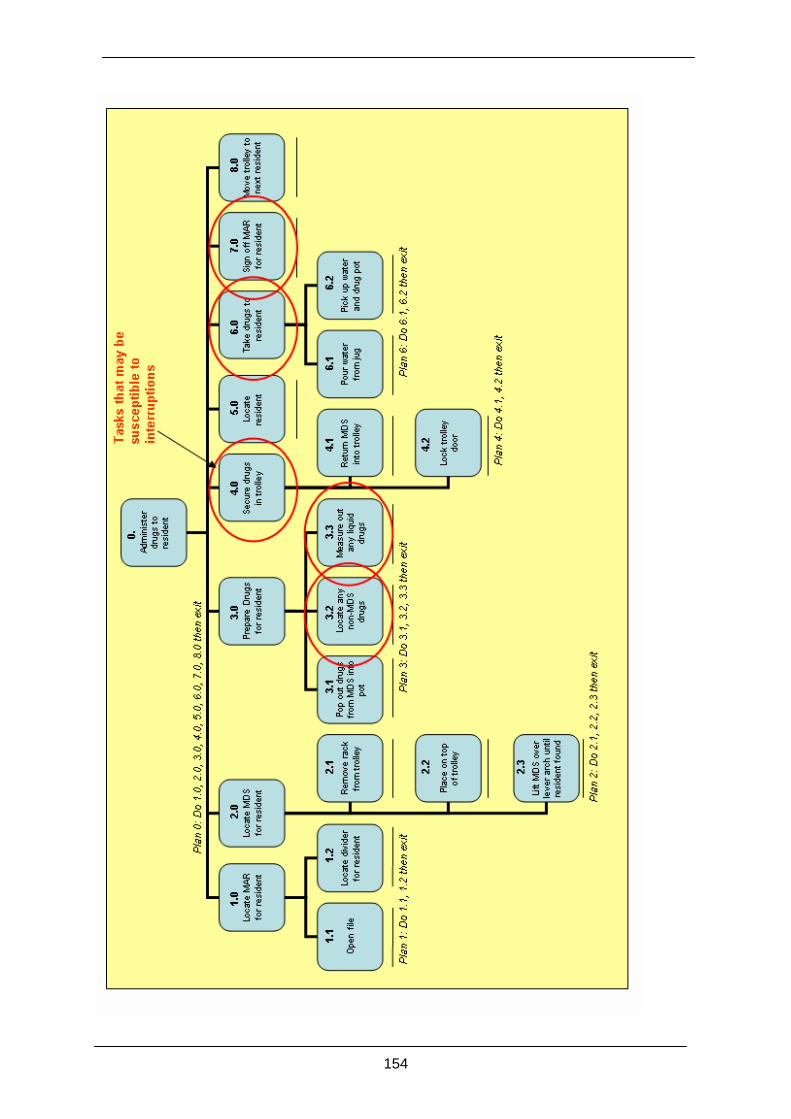
154
155
Figure 7.21: Drug round practices, interruption issues
Figure 7.22 indicates those dispensing tasks with communication links that are essential
components if task completion is to be successful. They are identified as follows.
• Task 1.0 ‘Get prescriptions’
The pharmacy need to obtain the prescriptions prior to the start of a typical 28 day
cycle of administration in the care home. In most cases, the home insists on seeing the
prescriptions from the GP surgery before they go to the pharmacy for dispensing.
This allows a check to be made on any missing, not required or incorrect medicines.
However, in a small number of cases the prescriptions went straight from the surgery
to the pharmacy. This may allow a greater number of errors in dispensing to occur.
• Task 1.1 ‘Driver collects prescriptions from home’
The prescriptions are generally collected from the care home by a driver employed by
the pharmacy, although in some cases the care home take the prescriptions to the
pharmacy themselves. By whichever means this occurs, there is a variation in the
amount of feedback from the home to the pharmacy on events during the preceding
medication cycle (typically 28 days). Information is needed by the pharmacy on
medication that has either been changed or stopped for each resident since the last
dispensing cycle. In some cases, the care home supplies a copy of the previous MAR
chart, in other cases there is a second version of the MAR chart with columns for the
care home to note changes that are intended for subsequent action by the pharmacy.
• Task 1.2.1 ‘Prescriptions faxed from home’
Most care homes used a FAX machine to send ad‐hoc prescriptions during the
medication cycle to the regular pharmacy for dispensing. A common issue raised by
care home staff was that they didn’t normally get confirmation from the pharmacy
that the prescription had been received. Additionally, there were occasions when,
due to opening hours and distance from the home, a local pharmacy was used
instead of the one handling the main medication cycle. On these occasions it was
observed that there was often no documented procedure to inform the main
pharmacy of the additional/changed medication.
156
• Task 2.3.1 ‘Check with home’
When the pharmacy goes through the process of preparing the prescriptions for
dispensing (e.g. ordering medications, printing labels etc) they check the
prescriptions against those dispensed during the previous cycle. When changes are
observed they often need to confirm this change with the care home. The pharmacist
normally does this by telephone. It was reported during interviews with the
pharmacist, that one problem is that they can rarely speak to the same person at the
home on each occasion. This can make it difficult to obtain definite confirmation that
the changes are actually required and that it is not a problem with the prescriptions
from the GP surgery. This is one potential reason for ‘discontinued items’ on the
MAR chart, as the pharmacist may not be confident that the change is to be made.
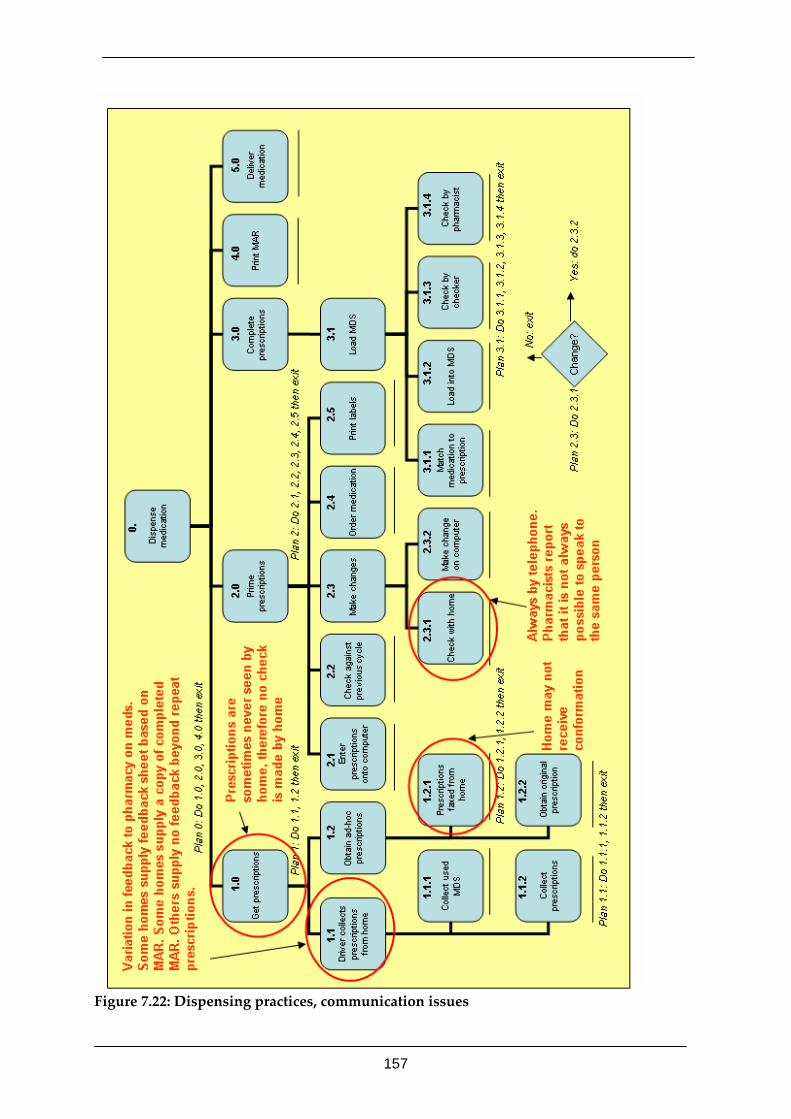
157
Figure 7.22: Dispensing practices, communication issues
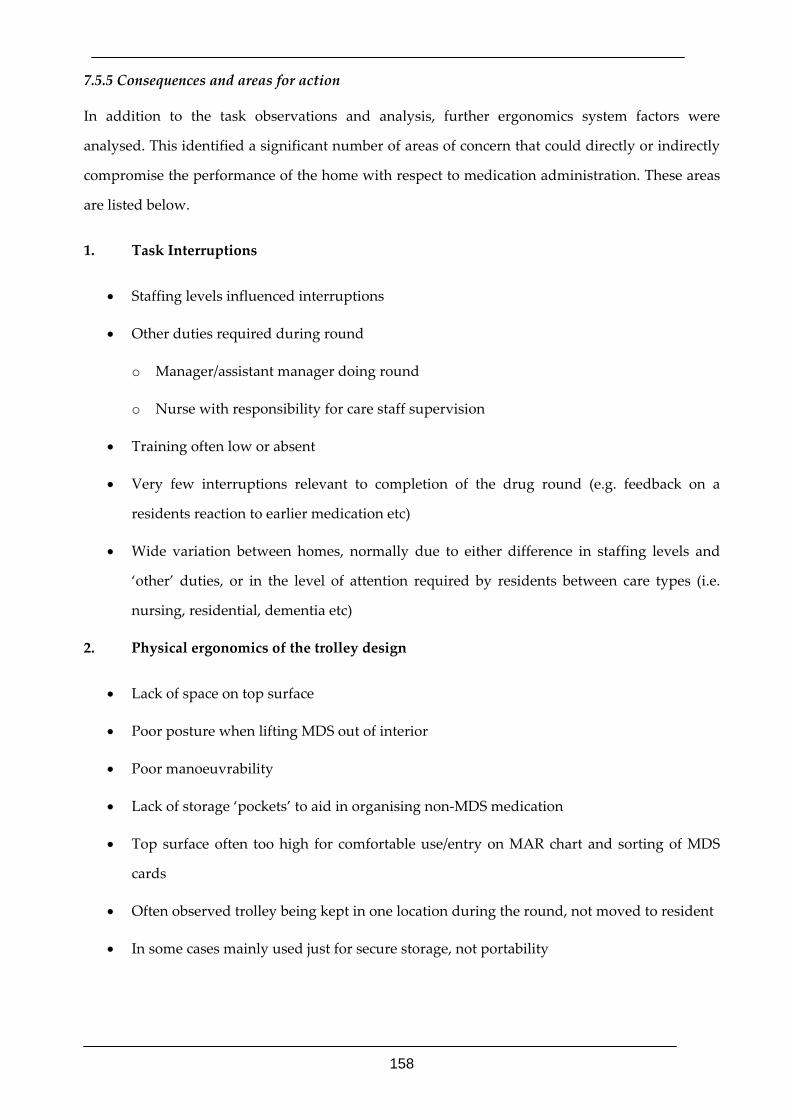
158
7.5.5 Consequences and areas for action
In addition to the task observations and analysis, further ergonomics system factors were
analysed. This identified a significant number of areas of concern that could directly or indirectly
compromise the performance of the home with respect to medication administration. These areas
are listed below.
1. Task Interruptions
• Staffing levels influenced interruptions
• Other duties required during round
o Manager/assistant manager doing round
o Nurse with responsibility for care staff supervision
• Training often low or absent
• Very few interruptions relevant to completion of the drug round (e.g. feedback on a
residents reaction to earlier medication etc)
• Wide variation between homes, normally due to either difference in staffing levels and
‘other’ duties, or in the level of attention required by residents between care types (i.e.
nursing, residential, dementia etc)
2. Physical ergonomics of the trolley design
• Lack of space on top surface
• Poor posture when lifting MDS out of interior
• Poor manoeuvrability
• Lack of storage ‘pockets’ to aid in organising non‐MDS medication
• Top surface often too high for comfortable use/entry on MAR chart and sorting of MDS
cards
• Often observed trolley being kept in one location during the round, not moved to resident
• In some cases mainly used just for secure storage, not portability
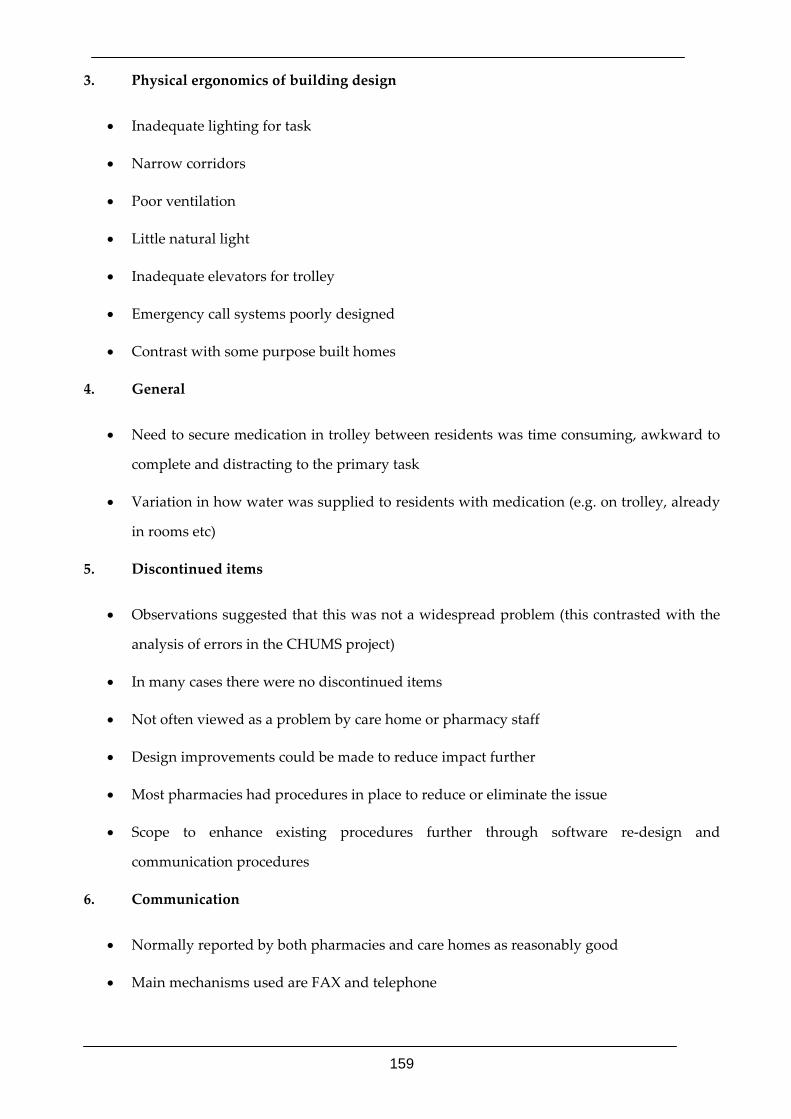
159
3. Physical ergonomics of building design
• Inadequate lighting for task
• Narrow corridors
• Poor ventilation
• Little natural light
• Inadequate elevators for trolley
• Emergency call systems poorly designed
• Contrast with some purpose built homes
4. General
• Need to secure medication in trolley between residents was time consuming, awkward to
complete and distracting to the primary task
• Variation in how water was supplied to residents with medication (e.g. on trolley, already
in rooms etc)
5. Discontinued items
• Observations suggested that this was not a widespread problem (this contrasted with the
analysis of errors in the CHUMS project)
• In many cases there were no discontinued items
• Not often viewed as a problem by care home or pharmacy staff
• Design improvements could be made to reduce impact further
• Most pharmacies had procedures in place to reduce or eliminate the issue
• Scope to enhance existing procedures further through software re‐design and
communication procedures
6. Communication
• Normally reported by both pharmacies and care homes as reasonably good
• Main mechanisms used are FAX and telephone
160
• Possible weakness in the procedures and mechanisms available for care homes to
communicate with pharmacy
• Variation in the use of the MAR chart to feed back data on next drug cycle requirements
• Some homes did not see prescriptions prior to dispensing by pharmacy
• Both pharmacy and care home staff would like to see the scope for more visits by
pharmacists and GPs to care home
• Patient medical and medication information could be more comprehensive/suitable for
tasks at both the pharmacy and care home
To further appreciate their implications, a table (Table 7.1) has been constructed that includes
suggestions regarding the consequences of each issue and also possible actions to resolve each. It
must be stressed that these are suggestions that might be explored and tested rather than being
‘answers’ to the problems raised. (Note: It was not possible within this study to provide and test
solutions to the problems encountered.)
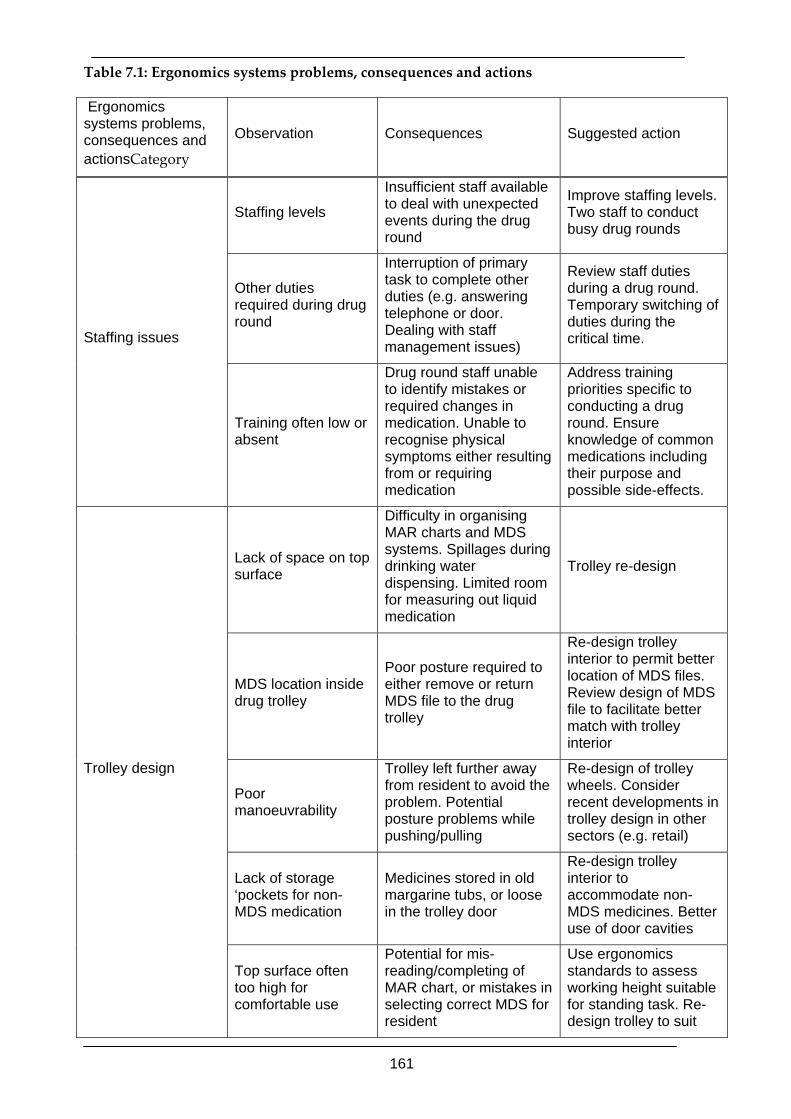
161
Table 7.1: Ergonomics systems problems, consequences and actions
Ergonomics systems problems, consequences and actionsCategory
Observation Consequences Suggested action
Staffing levels
Insufficient staff available to deal with unexpected events during the drug round
Improve staffing levels. Two staff to conduct busy drug rounds
Other duties required during drug round
Interruption of primary task to complete other duties (e.g. answering telephone or door. Dealing with staff management issues)
Review staff duties during a drug round. Temporary switching of duties during the critical time. Staffing issues
Training often low or absent
Drug round staff unable to identify mistakes or required changes in medication. Unable to recognise physical symptoms either resulting from or requiring medication
Address training priorities specific to conducting a drug round. Ensure knowledge of common medications including their purpose and possible side-effects.
Lack of space on top surface
Difficulty in organising MAR charts and MDS systems. Spillages during drinking water dispensing. Limited room for measuring out liquid medication
Trolley re-design
MDS location inside drug trolley
Poor posture required to either remove or return MDS file to the drug trolley
Re-design trolley interior to permit better location of MDS files. Review design of MDS file to facilitate better match with trolley interior
Poor manoeuvrability
Trolley left further away from resident to avoid the problem. Potential posture problems while pushing/pulling
Re-design of trolley wheels. Consider recent developments in trolley design in other sectors (e.g. retail)
Lack of storage ‘pockets for non-MDS medication
Medicines stored in old margarine tubs, or loose in the trolley door
Re-design trolley interior to accommodate non-MDS medicines. Better use of door cavities
Trolley design
Top surface often too high for comfortable use
Potential for mis-reading/completing of MAR chart, or mistakes in selecting correct MDS for resident
Use ergonomics standards to assess working height suitable for standing task. Re-design trolley to suit
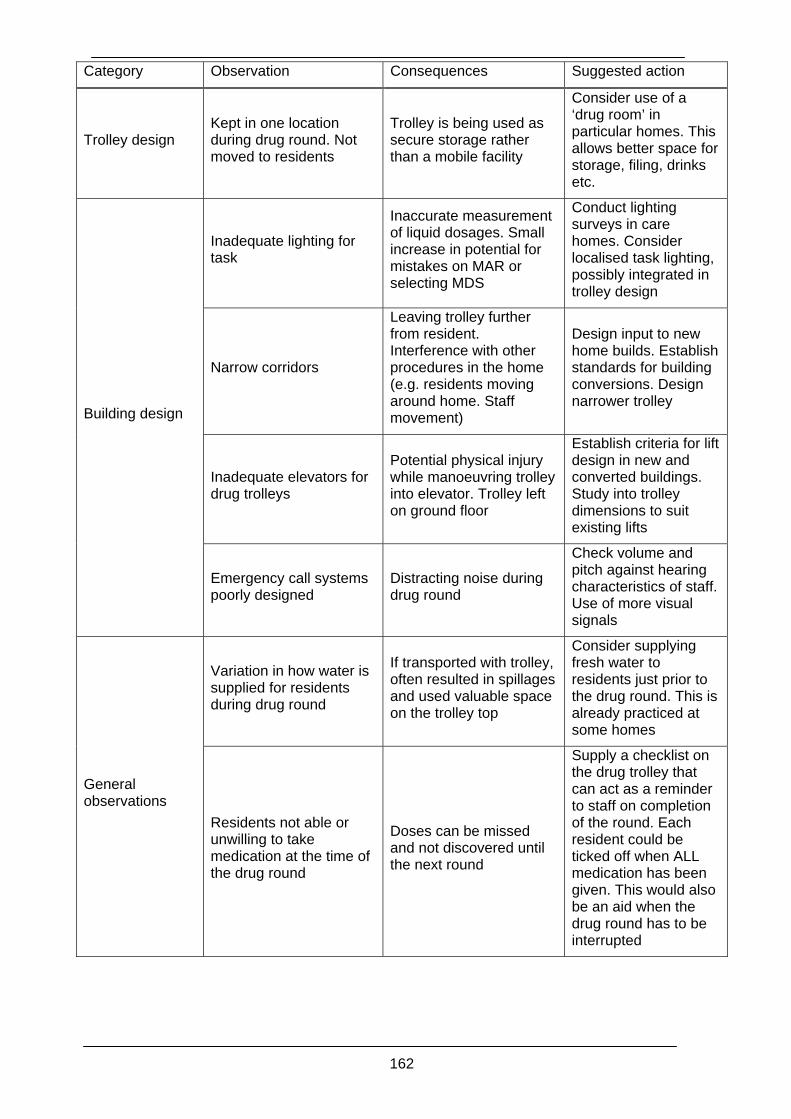
162
Category Observation Consequences Suggested action
Trolley design Kept in one location during drug round. Not moved to residents
Trolley is being used as secure storage rather than a mobile facility
Consider use of a ‘drug room’ in particular homes. This allows better space for storage, filing, drinks etc.
Inadequate lighting for task
Inaccurate measurement of liquid dosages. Small increase in potential for mistakes on MAR or selecting MDS
Conduct lighting surveys in care homes. Consider localised task lighting, possibly integrated in trolley design
Narrow corridors
Leaving trolley further from resident. Interference with other procedures in the home (e.g. residents moving around home. Staff movement)
Design input to new home builds. Establish standards for building conversions. Design narrower trolley
Inadequate elevators for drug trolleys
Potential physical injury while manoeuvring trolley into elevator. Trolley left on ground floor
Establish criteria for lift design in new and converted buildings. Study into trolley dimensions to suit existing lifts
Building design
Emergency call systems poorly designed
Distracting noise during drug round
Check volume and pitch against hearing characteristics of staff. Use of more visual signals
Variation in how water is supplied for residents during drug round
If transported with trolley, often resulted in spillages and used valuable space on the trolley top
Consider supplying fresh water to residents just prior to the drug round. This is already practiced at some homes
General observations
Residents not able or unwilling to take medication at the time of the drug round
Doses can be missed and not discovered until the next round
Supply a checklist on the drug trolley that can act as a reminder to staff on completion of the round. Each resident could be ticked off when ALL medication has been given. This would also be an aid when the drug round has to be interrupted
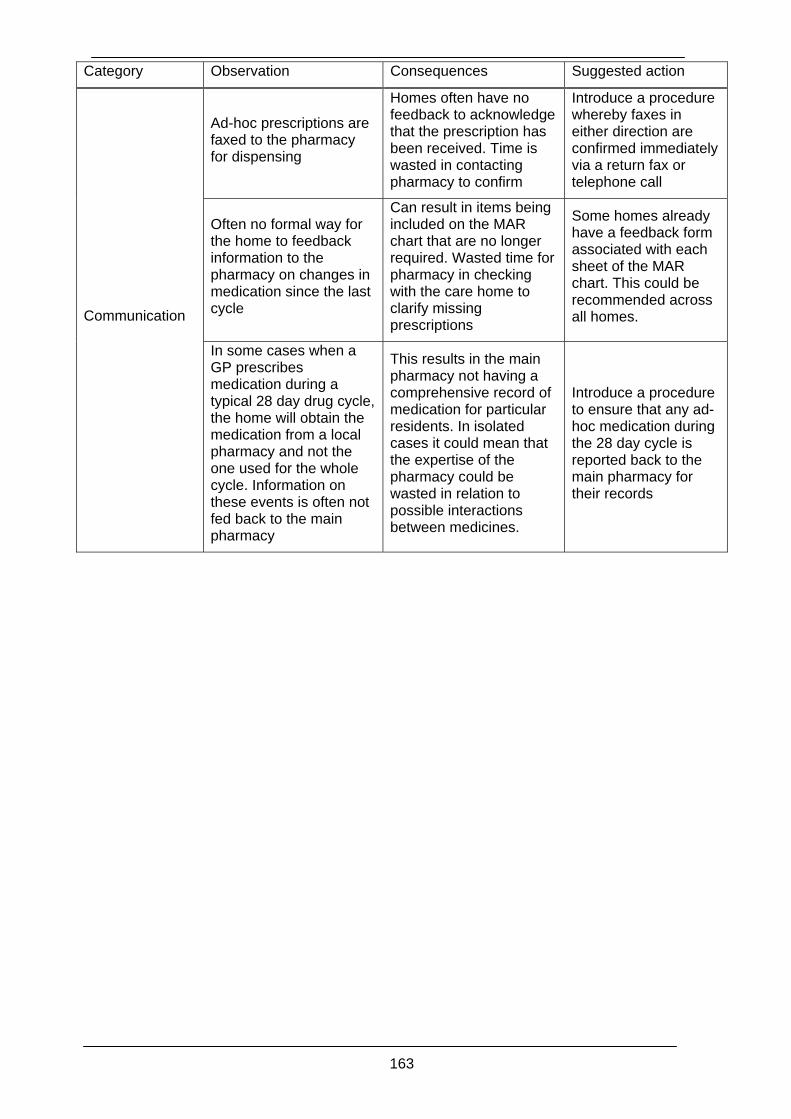
163
Category Observation Consequences Suggested action
Ad-hoc prescriptions are faxed to the pharmacy for dispensing
Homes often have no feedback to acknowledge that the prescription has been received. Time is wasted in contacting pharmacy to confirm
Introduce a procedure whereby faxes in either direction are confirmed immediately via a return fax or telephone call
Often no formal way for the home to feedback information to the pharmacy on changes in medication since the last cycle
Can result in items being included on the MAR chart that are no longer required. Wasted time for pharmacy in checking with the care home to clarify missing prescriptions
Some homes already have a feedback form associated with each sheet of the MAR chart. This could be recommended across all homes. Communication
In some cases when a GP prescribes medication during a typical 28 day drug cycle, the home will obtain the medication from a local pharmacy and not the one used for the whole cycle. Information on these events is often not fed back to the main pharmacy
This results in the main pharmacy not having a comprehensive record of medication for particular residents. In isolated cases it could mean that the expertise of the pharmacy could be wasted in relation to possible interactions between medicines.
Introduce a procedure to ensure that any ad-hoc medication during the 28 day cycle is reported back to the main pharmacy for their records
164
7.6 Further Potential Systems Improvements In addition to those areas identified in table 1, a number of key bottom‐level actions from the task
analysis diagrams presented in section 7.4.4 (Figures 7.19 & 7.20) were analysed using SHERPA
(The Systematic Human Error Reduction and Prediction Approach).109 This method and the
reason for its selection are described in Appendix I (section 4.0).
Table 7.2 documents the results of the analysis. The columns and there contents are described
below.
• Column 1 – Task step
This is the reference number for the bottom‐level task and in this instance can be found in
Figures 7.19 & 7. 20
• Column 2 – Error Mode
Error types are categorised into action, checking, retrieval, communication, and selection
errors. Each error type has a number of associated error modes. These are given codes.
Action errors are coded A1 – A10, checking errors C1 – C6 etc. A full list of error modes
can be found in appendix 5 (Table 1)
• Column 3 – Description
An outline description of the potential error
• Column 4 – Consequence
A prediction of the consequences of the error
• Column 5 – Recovery
This column indicates whether or not the error can be recovered. If the error can be
recovered by performing another task step in the task analysis diagram, then it is
referenced here. If it is not possible to recover the error then column 5 is left blank
• Column 6 – Probability
This column indicates the probability of the error occurring and is categorised as low
(hardy ever occurs), medium (has occurred once or twice) and high (occurs frequently)
165
• Column 7 – Remedial measures
Column 7 (the last column) indicates measures that could be taken to reduce errors. These
would require further investigation and assessment of suitability before implementation.
They are based on sound ergonomics theory and practice.
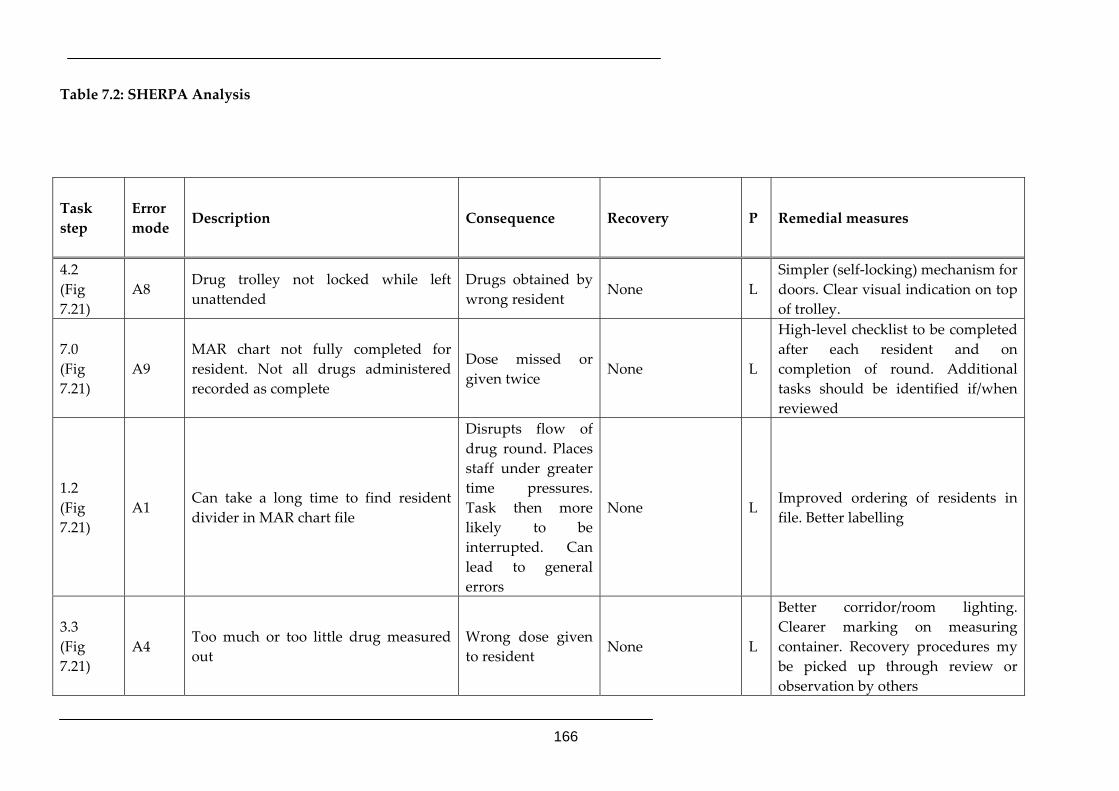
166
Table 7.2: SHERPA Analysis
Task step
Error mode Description Consequence Recovery P Remedial measures
4.2 (Fig 7.21)
A8 Drug trolley not locked while left unattended
Drugs obtained by wrong resident
None L Simpler (self‐locking) mechanism for doors. Clear visual indication on top of trolley.
7.0 (Fig 7.21)
A9 MAR chart not fully completed for resident. Not all drugs administered recorded as complete
Dose missed or given twice
None L
High‐level checklist to be completed after each resident and on completion of round. Additional tasks should be identified if/when reviewed
1.2 (Fig 7.21)
A1 Can take a long time to find resident divider in MAR chart file
Disrupts flow of drug round. Places staff under greater time pressures. Task then more likely to be interrupted. Can lead to general errors
None L Improved ordering of residents in file. Better labelling
3.3 (Fig 7.21)
A4 Too much or too little drug measured out
Wrong dose given to resident
None L
Better corridor/room lighting. Clearer marking on measuring container. Recovery procedures my be picked up through review or observation by others
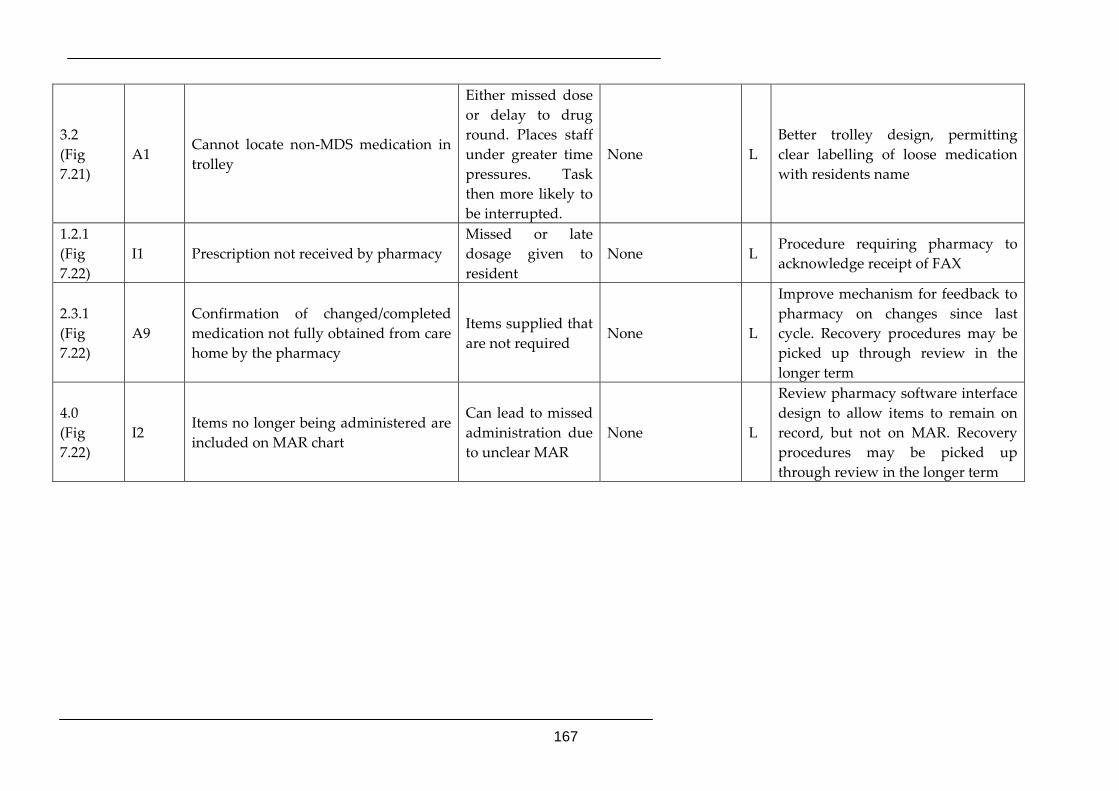
167
3.2 (Fig 7.21)
A1 Cannot locate non‐MDS medication in trolley
Either missed dose or delay to drug round. Places staff under greater time pressures. Task then more likely to be interrupted.
None L Better trolley design, permitting clear labelling of loose medication with residents name
1.2.1 (Fig 7.22)
I1 Prescription not received by pharmacy Missed or late dosage given to resident
None L Procedure requiring pharmacy to acknowledge receipt of FAX
2.3.1 (Fig 7.22)
A9 Confirmation of changed/completed medication not fully obtained from care home by the pharmacy
Items supplied that are not required
None L
Improve mechanism for feedback to pharmacy on changes since last cycle. Recovery procedures may be picked up through review in the longer term
4.0 (Fig 7.22)
I2 Items no longer being administered are included on MAR chart
Can lead to missed administration due to unclear MAR
None L
Review pharmacy software interface design to allow items to remain on record, but not on MAR. Recovery procedures may be picked up through review in the longer term
168
7.7 Discussion
7.7.1 Existing system
The ergonomics findings have focussed on three areas deemed to be priorities. These areas
were established during the study as trends in the data pertaining to the medication errors
were observed during the epidemiological phase of the CHUMS research.
The chronology of the investigation and the availability of resources (including access to
care homes) meant that decisions regarding priority areas had to be made before all the
epidemiological data were available or had been analysed.
Areas for ergonomics investigation were chosen, therefore, on a combination of criteria. The
first was that a higher incidence of errors appeared to be associated with them (based on the
epidemiological evidence at the time of the decision) and the second criterion was that the
issues chosen should give insights into three of the essential components of any socio‐
technical system, namely communication (both written and verbal), physical design and
problems associated with critical task completion.
In this discussion, key findings from each area are re‐iterated. Following this, a fuller
discussion is provided on the potential benefits of the extended implementation of ICT in
this sector.
Critical Task Completion
Successful completion of tasks is dependent on many factors within the system. One critical
task has been studied in this research, namely administration of medication during the drug
round within the care home. In many regards, the system used mirrors that found in most
acute hospital ward settings. However, in many critical ways it differs from this system,
perhaps most notably in the availability of appropriately trained health care professionals
within the immediate system.
The drug round was observed in many care homes and at different times during the day.
Most drug rounds were interrupted by other tasks with up to 12 interruptions per hour
occurring. The source of these was, most often, other staff. This would suggest that a review
169
of all staff duties during the drug round period might be initiated to further understand
why requests from other staff were so frequent. It might also be that planned ‘breaks’
within the drug round might be required if qualified personnel undertaking the drug round
are needed for other ‘non‐urgent’ tasks.
There is also a need to ensure that staff undertaking the drug round have the required
knowledge and experience to conduct drug administration in a safe and reliable manner.
This may include greater attention to ensuring each has knowledge of common
medications, including their possible side effects, and an understanding of how high
current rates of error appear to be.
The use of the drug trolley has many limitations and may be contributing to the likelihood
of errors occurring. The design of the trolley appears to have changed little over a long
period of time. This is in spite of vast differences in the extent of medication that patients /
older residents are likely to be receiving currently. Urgent re‐design of trolleys or other
systems for storage (notably for MDS) and administration of medication to reflect this
current need should be sought.
Some homes prefer to administer medication from a fixed location, for example a small
drugs room/office. This appears to offer many advantages and reduced likelihood of
interruption. For those homes where this is an option such examples of improved practice
should be encouraged. That said, all such interventions will require further evaluation as
too few were observed in this study to enable conclusions regarding efficacy to be reached.
The physical design and layout of care homes appears to have benefited little from
ergonomics knowledge. Evidence in the form of too low lighting levels (making reading of
medication information and MAR charts potentially difficult), corridors that prevented
passage of trolleys, poor design of emergency call systems, and elevators that were too
small to accommodate drug trolleys all suggested little systematic development or
application of design criteria for care homes. This appears to be a relatively straightforward
area for advancement and the design/architectural community should be urged to advance
this area (perhaps with the help of the National Patient Safety Agency.)
170
7.7.2 Future systems and information technology (IT)
Historical perspective
At the ‘birth’ of the UK National Health Service, there was no widespread availability of
computing technology, and the service grew and expanded for many years utilising a paper
based system of records. However, during the preceding twenty years, there had been a
worldwide acceptance that computing and information technology (IT) can or should make
a contribution to the administration/operation of health services. From a review of the
literature, it was clear that the extent, pace, strategy, and quality of implementation varies
from country to country.
Progress on IT within the UK
In the UK, the strategy centres on the ‘Connecting for Health’ project (NHS 2005). This is a
£6.2 billion government initiative spanning some 10 years, due for completion in 2014. It is
intended to connect over 100,000 doctors, 380,000 nurses, and 50,000 other professionals.
The components of the system are;
• NHS Care records service
o Electronic care record for every patient
• Choose and Book
o Electronic booking service
• Electronic Transmission of Prescriptions (ETP)
• National Network (N3)
o IT infrastructure and broadband
• Contact
o Central email and directory service
Connecting for Health (CforH) has generated a significant quantity of negative press in
recent months, most of which appears to be related to acceptance by the users, of early
implementations of some of the new systems. The need to gain the support and
171
commitment of not only senior management, but front line staff and users was recognised
as a potential weakness in CforH by Humber.111 He cites the BMA’s demand for greater
involvement in the programme112 as a sign that the incorporation of some important user
groups had, at the time (i.e. May 2004), been poor. More recently there have been signs that
the earlier warnings from the BMA had not been heeded. In a press release in June113 the
BMA, in response to the National Audit Office report114 stated “The report criticises the
National Programme for not doing enough to engage with healthcare workers using the
system, a sentiment shared by the BMA”. In fact a year earlier a study and report prepared
by QinetiQ for the National Audit Office115 found that in its sample of project processes,
most had been executed ‘fully’ and as recommended by recent international
standards116,117,118 with the exception of ‘stakeholder requirements definition’ which they
rated as ‘partially’ compliant with the standards. QinetiQ made recommendations for
‘improvement opportunities’. In actual fact, the National Audit Office report114 is broadly
complimentary about the management and execution of the project in the majority of areas,
with the exception of “winning the support of NHS staff and the public”.
Many of the problems appear to relate to compatibility with computer hardware and
software already adopted by many GPs surgeries and pharmacies. The need for CforH to
link with such existing platforms has caused additional problems and delays not apparently
anticipated at the outset of the project.
There does seem to be general agreement on the need and importance of a coordinated
adoption of IT in the UK Health Service. Humber111 states that without a national
programme for IT “Equitable health care free at the point of need, financed through
taxation, would be unsustainable and the rising costs prohibitive”.
Progress on IT in Australia
In Australia the government has launched the ‘HealthConnect’ project. Considerably less
direct government funding is going into this initiative ($128 million over four years), as the
project is intended as a facilitating and steering body, helping smaller clusters of hospitals
and GP surgeries across Australia to independently adopt new IT technology that will
ultimately link together at a National level. Australia has a larger proportion of its health
172
service in the private sector, and therefore the government’s role is as a steering body. The
general philosophy seems to be to trigger organic growth by helping local clusters to
implement the basic infrastructure first. For example, the Australian government has
invested around $60 million in a ‘broadband for health’ program. This offers local health
service providers a grant to implement industry standard broadband services within their
establishments, as long as they fulfil certain criteria to qualify. The aim is to ensure that
ultimately all health service providers across Australia will be connected to a common, and
nationally compatible, broadband service. This will then form the foundation for further
national IT implementations.
Focus on IT for care homes in Australia
Interestingly, although we could find no direct reference to the IT needs of care homes for
the elderly within the UK Connecting for health project, the needs of this sector feature
centrally within the Australian government’s initiatives. Their government department
itself is entitled ‘The Department for Health and Ageing’, and promotes major schemes
dedicated to the aged care sector. One such scheme is ‘e‐Connect’. Quoting the Australian
governments web site, e‐Connect is designed to “create an enabling environment to
leverage the use of IT to improve efficiency, quality of services and care delivered to older
Australians”.
In June 2006, the Australian Minister for Ageing, Julie Bishop, announced a one‐off
payment of $1,000 per resident for residential aged care providers. The payments, which
will total $152 million, are to help aged care providers take advantage of new technology,
improve their business practices, and increase staff training, particularly in dementia care.
Under the e‐Connect initiative, there is a project named ‘Clinical IT in Aged Care’. The cited
goal for this project is to investigate how “clinical IT applications or tools can support and
improve care standards for residents in aged care homes”. Within this project a number of
pilot studies have been implemented. Of particular note is aged care provider Lyndoch
Warrnambool Inc.119 This case study describes the implementation of a wireless care
management system into a large aged care facility in the South West of Victoria. Lyndoch
supplies care to a total of 194 residents. The government report claims a high level of staff
173
and management satisfaction (no mention of residents satisfaction!). The research project
was completed in February 2006.
Further trials through the Australian e‐Connect project include electronic prescribing in
aged care, as reported by Perkins et al.120 This trial has studied the use of electronic
prescribing and generation of medical charts. It involved the use of an existing GP clinical
package in aged care homes. These were also installed in GP practices. The study looked at
remote access by GPs, of medication information stored at the care home. Preliminary
findings reported in Perkins et al120 have identified some problems, but these were mainly
minor logistical issues. The main limitations of the trial were identified as the nature of the
selection of GPs (self‐selected), and that these probably represented a population sample
that was particularly enthusiastic about the technology. At the time of writing, no final
results could be sourced.
Progress on IT in the USA
In the United States of America (USA), President George W Bush, in 2004, launched an
initiative to facilitate electronic health records for ‘most’ Americans by 2014. Interestingly,
the same as the target completion year for the UK Connecting for Health programme. The
US government has established the American Health Information Community (AHIC),
being a committee comprising of both public and private representatives. The role of AHIC
is to make recommendations to the president on achieving his stated goal. As the US does
not have the equivalent of the UK National Health Service, the US government uses its
influence to encourage the availability of affordable health insurance to vulnerable groups
such as the elderly. According to statements from The Whitehouse (www.whitehouse.gov),
the government is ‘supporting’ several health IT projects.
It will be interesting to see how the US private health care sector reacts over the next decade
to government pressure to adopt IT in their operations. It is likely that market forces will
drive health suppliers to ‘stay ahead of the competition’ through the application of new
technology. It will be the central governments intention to ensure compatibility of platforms
across states.
174
Focus on IT for care homes in the USA
The US government supports the availability of health care specifically for veterans through
the Department of Veterans Affairs. On their web‐site (www.va.gov) they state that their
goal is to “streamline and modernize the information technology (IT) environment
throughout the Department of Veterans Affairs (VA)”. It would appear from this, that this
particular section of US society may well have access to IT based health care ahead of the
general public.
It can be observed that the UK Connecting for Health (CforH) management, through their
web‐site (www.connectingforhealth.nhs.uk), point to the US Veterans Health
Administration (VHA), as having the worlds largest functioning health information
technology system. The computer system is known as VistA (Veterans Health Information
Systems and Technology Architecture). The system is in place and operating in over 1200
care establishments across the USA. It includes a ‘computerised patient record system
(CPRS). This, at the time of writing, was understood to include records for 8.5 million
veterans. CforH believe that the US Vista system demonstrates that a single national health
record ‘can work’.
Compatibility and cooperation worldwide
Another issue arising is the possibility of not only being able to access patient records across
one nation, but to be able to do the same across the globe, and for many years. One such
initiative is OpenEHR.121 This is a not‐for‐profit international collaboration between
University College London (UCL) and Ocean Informatics Pty. Ltd., in Australia
(www.openehr.org). Its goal is to make available open architecture standards
internationally in order to encourage development of EHR systems with a common IT
format. Through this initiative they hope to “Make the interoperable, life‐long electronic
health record a reality”.
One way forward in ‘global’ standardisation, would be to agree the content of an electronic
patient record. To this end, ASTM International122 recently released a standard specification
for a “core set of patient data that follows patients as they receive care”. The data includes
the patient’s health status, treatment, allergies, medications and tests. Additionally, it
175
contains identification data, family health history, insurance, advance directives, care plan
and care provider.
The future for IT in health care
There seems to be many hurdles yet to negotiate before a fully implemented Nationwide, if
not worldwide IT system is implemented in the various Health Services. However, Blair123
editor of Health Management Technology (Nelson Publishing Inc.) in a recent note from the
editor made an interesting observation, suggested to him by Simmi P. Singh (vice president
of Cognizant Technology Solutions). He proposed that a quicker route would be to supply
patients with a ‘credit card’ style plastic card, which would store a range of basic medical
information needed at the point of care. He believes that it would only required the familiar
magnetic strip and not even the more recent ‘chip’ technology. He describes a situation
where a patient would walk into a surgery and the doctor’s receptionist would swipe your
medical card through a reader which would then generate an ‘electronic thumbnail sketch’
of your current medical records. This way, the treating doctor would have important
information on such things as allergies, recent medication etc. before suggesting any new
treatments.
176
Chapter 8 Discussion
8.1. Introduction We start by recognising the enormous support that care homes gave to this study. It was a
challenging study to participate in, and we had a pleasing acceptance rate by the homes –
72% of those we approached took part, and many others were willing to do so, but could
not do so within the timeframe of the study. We also came across some very dedicated
people – care home managers who would not take more than two weeks holiday because
they were worried about the ordering and delivery of medicines, and GPs and pharmacists
who gave a personal service to a home, no matter what the time of day or night. We also
found some examples of innovative and skilful practice, which we highlight later in the
discussion. We take these as important markers of interest and commitment in this field,
and as promising markers of a willingness to change. And change is certainly needed.
When we observed residents who were on medication, seven out of ten were subject to at
least one type of error: prescribing, monitoring, medicine administration or dispensing. For
each act of prescribing a medicine, dispensing it, or administering it, there was around an 8‐
10% chance of an error occurring; there was a 15% chance of a monitoring error.
Care home residents are among the most vulnerable people in society. Very elderly, often
frail and immobile, many suffering some degree of dementia or other mental health
problems and often with multiple pathologies, they are people who can often gain
considerable benefit from medicines. In contrast, they are also some of the most vulnerable
to side effects and to errors, and lack the advocacy and communication skills to report
them. The very elderly have a reduced resilience to the challenges to the body that result
from errors. Many of the errors we observed were negligible or trivial in their
consequences, and we did not observe any cases of serious harm in the 256 residents we
studied. However, if 1% of residents suffered serious harm, we might well miss it in a
study of this size and design. We also saw errors which might impact on the quality of life
and independence of the residents. The qualitative aspects of this study illustrate the

177
nature and contributors to many such errors, and we suggest some ways forward later in
this chapter.
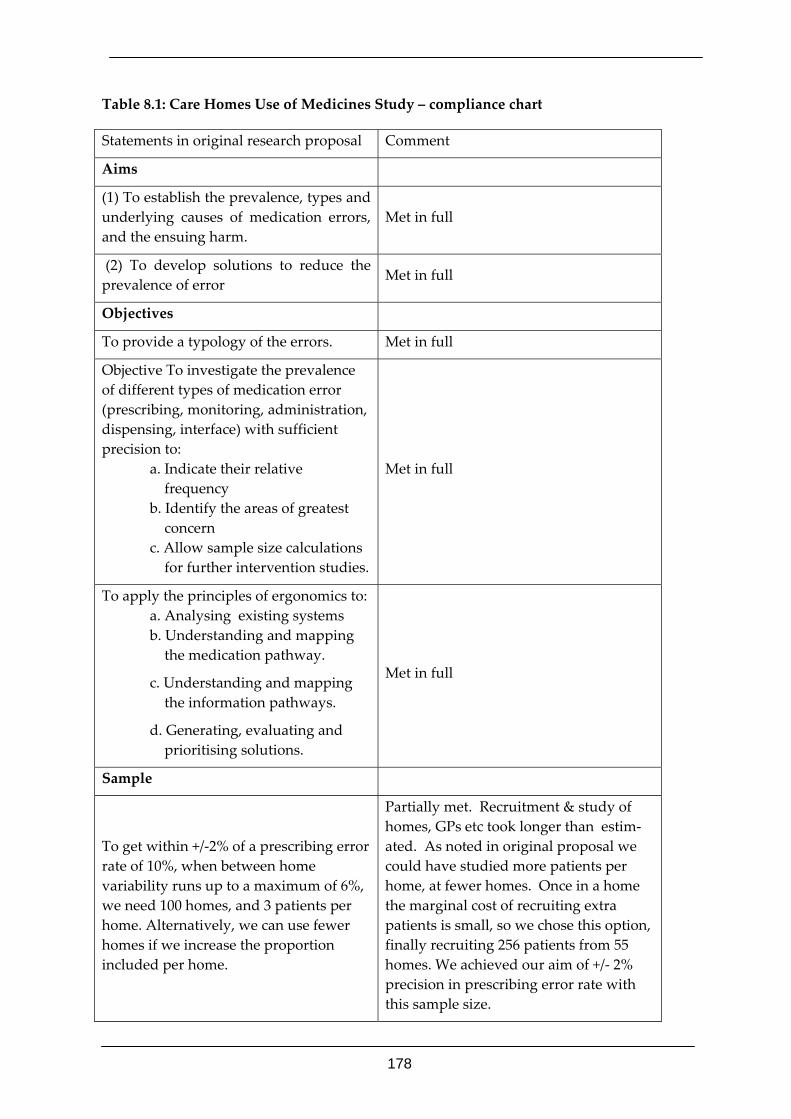
178
Table 8.1: Care Homes Use of Medicines Study – compliance chart
Statements in original research proposal Comment
Aims
(1) To establish the prevalence, types and underlying causes of medication errors, and the ensuing harm.
Met in full
(2) To develop solutions to reduce the prevalence of error
Met in full
Objectives
To provide a typology of the errors. Met in full
Objective To investigate the prevalence of different types of medication error (prescribing, monitoring, administration, dispensing, interface) with sufficient precision to: a. Indicate their relative frequency b. Identify the areas of greatest concern c. Allow sample size calculations for further intervention studies.
Met in full
To apply the principles of ergonomics to: a. Analysing existing systems b. Understanding and mapping the medication pathway.
c. Understanding and mapping the information pathways.
d. Generating, evaluating and prioritising solutions.
Met in full
Sample
To get within +/‐2% of a prescribing error rate of 10%, when between home variability runs up to a maximum of 6%, we need 100 homes, and 3 patients per home. Alternatively, we can use fewer homes if we increase the proportion included per home.
Partially met. Recruitment & study of homes, GPs etc took longer than estim‐ated. As noted in original proposal we could have studied more patients per home, at fewer homes. Once in a home the marginal cost of recruiting extra patients is small, so we chose this option, finally recruiting 256 patients from 55 homes. We achieved our aim of +/‐ 2% precision in prescribing error rate with this sample size.
179
8.2 Prevalence of errors and comparison with other sectors How does the prevalence of the errors we observed in homes compare with previous
reports? We have focussed here on the UK literature, because error rates are very context
dependent: they can be affected by many factors that are different in other countries, such
as staff training, and systems of ordering, dispensing, delivering, distributing and paying
for drugs. We have also taken into account that the way errors are defined and measured
can make major differences to the results that are reported. For this reason we have
focussed on observation‐based research based on agreed (usually user defined) definitions
of error; these are probably the best estimates we can get, and are comparable with the
methods used in this study.
8.2.1 Prescribing and monitoring errors
There is relatively little information about the prescribing error rate of GPs in the UK; there
is slightly more information on hospital doctors’ prescribing errors, and we could not find
any comparable UK data on monitoring errors in primary care. In our study 39% of
patients had at least one prescribing error and, for any given prescribed medicine, the
probability that there was an error in the prescription was 8.3%. This is similar to the 7.5%
error rate of GPs studied in 2001,124 which also, as with our study, found incomplete
information on the prescription to be the commonest form of error. Studies of prescribing
errors in hospitals, based simply on studying the medicines chart, showed a 1.5% error rate
across a hospital,57 however subsequent research found that studying the patient’s notes as
well in a study of a complex surgical ward revealed a three times higher error rate.51
Of the patients who had at least one medicine that required monitoring we found 18% were
not being monitored properly; for every medicine that required monitoring there was a
14.7% likelihood that this would not be done. This was significantly more likely in London
than elsewhere. We could not find any analogous studies on monitoring errors.
In summary, what little evidence there is would suggest the probability of a GP committing
a prescribing error when prescribing for a patient in a care home is similar to that in general
practice for each item initiated. However, our residents were prescribed an average of 7
180
items each, so the probability that a patient would receive an error is greater than if they
were on fewer medicines.
8.2.2 Dispensing errors
Dispensing errors were found in 9.8% of the doses examined; 37% of residents had at least
one error. This is a high percentage, compared to 3.3% of doses found in a study of 11
community pharmacies dispensing to ambulant patients (Franklin & O’Grady 2007), and
less than 1% in hospitals (Beso et al 2005.) . Part of the cause of this high rate is the different
ways in which medicines are repackaged and dispensed for homes; we explore this in
depth later.
8.2.3 Administration errors
Medication administration errors were observed to occur to 22% of the residents we
observed; 8.4% of individual administrations were erroneous. There are two comparators
that could be used here: the administration error rate in hospitals, and that of people taking
medicines when at home (called non‐compliance or non‐adherence). Since 1995 there have
been 10 comparable studies of administration error in UK hospitals, covering a total of
28,426 administered doses and a number of ward based administration systems. The
average error rate is 5% (range 3.0%‐8.0%)52,54,55,125,126,127,128,129,130,131 suggesting the rate in care
homes is high in comparison to hospitals. As is found in hospitals, around half the
administration errors were omissions (medicines being out of stock, or staff missing
medicines they should have given). In hospitals medicines are administered by nurses and,
in our study, nursing care patients (who have medicines administered by nurses) received
around half the administration errors of people in residential care, who have medicines
administered by carers (although this just failed to reach statistical significance). Nursing
care patients may therefore be closer to hospital patients in their error rates; this makes
medicines administration in people in residential care all the more worrying.
It is harder to compare the 8.4% error rate with what happens when people are at home. We
know that of patients who take medication for a chronic condition around 30‐50% will not
take their medication as directed,132 and that about half these cases voluntarily choose to
stop taking the medicine, or adjust the way in which they take it.133 However this has
181
limited relevance to people in care homes, many of whom are there because they can not
cope with tasks such as medicine taking. In our study many were showing some signs of
dementia and would not have been able to take their own medicines reliably.
8.2.4 Harm
Our methodology was designed to identify errors; a study to identify harm would have
been designed differently. We used a method to predict harm, using a 0 (no harm) to 10
(death) scale. Monitoring errors produced the largest mean harm score (3.7), and the
tightest range, with the lowest score being 2.8 and the highest 5.2. In some ways this is not
surprising, in that medicines which are monitored are associated with some significant risk
of toxicity, or the need to ensure efficacy. The high score and narrow range confirm that
monitoring errors are an important group. Prescribing errors were the next most severe
(mean 2.6, range 0.2‐5.8). This is substantially lower than the mean score previously
reported for prescribing errors in hospital in‐patients, where mean scores of 4.2 and 4.6
were reported before and after computerisation, using the same scale of potential harm.55
Dispensing errors and medication administration errors were the next most serious, and
fairly similar (dispensing mean 2.0, range 0.2‐6.6; administration mean 2.1, range 0.1‐5.8),
with a low mean score but showing examples of errors at the upper end of the ‘moderate’
range. A previous study of dispensing errors in community pharmacies reported a mean
score of 2.4144 and a recent study of medication administration errors in hospital in‐patients
reported a mean score of 2.7 for a paper‐based administration system.55 These mean scores
are both similar to those reported in the present study.
8.2.5 Limitations
There are limitations to the statements we make about the prevalence of errors, their
causation, and the extent of harm. First, the study required the consent (sometimes assent
in the case of residents) of the home, GP and resident, in that order. If all three were not
met then no data was collected. Clearly, those concerned about their practice would be
more likely to refuse to take part in the study, leading to our results being underestimates
of the severity of the situation. Similarly, in the ergonomics study, the choice of homes to
visit was limited to those that were prepared to give access. We may therefore have been
182
excluded from those homes who felt threatened by the research. Having said that, we felt
the response rate of homes (the highest response rate of all those that had to respond) was
remarkably high, and gave us confidence. The team approached homes with a supportive
attitude and were well received by and large.
Our sample of homes was not random and therefore the prevalence we found can not be
said to be generalisable. On the other hand to ensure representativeness, it was based on a
stratified sample derived from the natioan distribution of care home size, and designed to
represent different areas of the country. Home size may be a significant factor as it relates
to the organisation (very small homes tending to be family or small businesses, large homes
tending to be large organised chains), which in turn is likely to affect the causes of error.
The areas of the country were intended to represent urban, suburban and rural (including
homes served by dispensing doctor practices). Our inclusion criteria for patients also need
to be considered, as we only included patients on medicines, rather than all residents; in
practice nearly all residents were on medicines. In addition, randomisation was applied to
the choice of patients in each home.
The definition of errors is always contentious, and our goal was to avoid over specifying
errors, and hence we used user defined definitions, as described in our methods. However
we recognise that dichotomisation of complex judgements and situations into ‘error’ or ‘no
error’ will always be the subject of active debate. The identification of errors inevitably has
an element of subjectivity. However, we sought to minimise this specifically, some of our
group have been studying medication errors for 17 years and we had several meetings,
discussions and prepared a formal guide to help the assessors have a shared
understanding. Once data collection had started we had regular meetings to discuss
judgements in difficult cases.
The pharmacist assessors trained with each other to encourage uniformity. However each
area of the country had a different pharmacist, and we can not rule out that differences
between areas of the country reflect differences in the pharmacists assessing them. For this
reason we have not focussed on ‘geographical’ differences in the discussion. When
collecting evidence in homes, pharmacists observations may also have been affected by
factors which affected home staff, such as distractions.
183
The validity of the analysis of the causes of medication errors was limited by the
availability and access to information. For example, exhaustive interviews with medical
practitioners in relation to the errors identified was not possible and the reliance on
historical records may also carry bias and not reflect a true picture of all the factors
contributing to the incident.
The presence of observers will have some effect on those administering medicines, and on
the pharmacy staff when observed. There are two responses to this, theoretical and
empirical. The theoretical response is that, using Reason’s theory, we see that most errors,
for our present purposes, can be divided into four groups.
• First are those errors that the practitioner has no control over – such as a medication
not being administered because there was no stock.
• Second, the person knows what to do and inadvertently does the wrong thing, or
forgets to do the right thing (slips and lapses). In these cases the act is unconscious
and so is unlikely to be altered by an observer.
• Third, the person has a plan and enacts it, but the plan is wrong (a mistake); it is
based on ignorance or incorrect understanding of something. As the practitioner
thinks they are doing the right thing they would be unlikely to change it because of
an observer. In our experience these errors are quite common in medication error.
• Finally there are ‘violations’, errors in which the practitioner consciously breaks the
rules. In some cases the practitioner is happy to do so in front of an assessor as they
believe their action reasonable; in other cases they may avoid violations because
they are being observed.
The empirical response comes from our work studying nurses administering medicines in
hospitals. In our experience of studying hospital nurses, observation has no effect on the
error rates observed.69 The majority of errors arise due to poor systems, lack of knowledge
or unavailability of the correct medication, none of which can be affected by an observer’s
presence.
184
In some areas of the research (e.g. the ergonomics studies), areas of study have been
prioritised based on the epidemiological data and on the current literature. This approach
was driven by the need to use the research resources optimally, but this process of
prioritisation may have led to other important areas of concern remaining unstudied. Thus
this section should be viewed as examples of ergonomics systems issues rather than a
complete or random selection.
During field visits, the researchers were only able to view specific shifts and drug rounds
and the presence of an observer means the patterns of behaviour recorded and analysed
during these ‘site’ visits may not be a full reflection of the practices occurring at other times.
Our work on harm is speculative in that we ask health professionals to speculate on the
likely consequences of an error. As the study was not designed to identify harm, we have
to estimate it. Errors often lead to harm over a long period of time, and so, following the
identification of an error, often we can only try to predict the future. When harm is clear
(usually because it is severe) it is likely to be acted on and so fall outside the remit of our
study. If severe, it is likely to be identified and rectified, or at least treated, in the home or in
hospital; sometimes it will lead to death. There are also limitations in our ability to assess
harm from the sample size. To be 95% certain of detecting a 1 in 100 case of severe harm we
would need a sample size of 300.; however our sample only included 256 residents. We
also have to be aware that the method by which we estimate harm has only been shown to
be valid and reliable for medication administration errors.
The statistical analysis is complicated by the tendency of errors to correlated within
residents and within homes, and possibly within GPs and pharmacies, our analysis sought
to address this, but there remains the possibility that some of our borderline significant
findings may be false positives.
In the next section we link the quantitative and qualitative evidence. The qualitative
evidence is based on a number of forms of input, which include the opinions of the
researchers (elements of the field notes), which will have been affected by their world view.
Those being interviewed knew the researchers to be pharmacists and that may have
affected their response. Researchers making notes and later interpreting them may also be
185
associated with biases. In giving accounts of errors and system failures people will be likely
to be presenting the account to show them selves in a reasonable light. There will also be
several biases, such as hindsight bias.
8.3 Drawing together findings from quantitative & qualitative research In this section we consider why the errors occur – drawing together the quantitative and
qualitative studies. By understanding the causes of errors we can go on to suggest ways
forward. First we look at specific types of error, then we go on to common elements
independent of the type of error.
8.3.1 Contributory factors to prescribing and monitoring errors
The likelihood that any prescription for a medicine contained an error was 8.3%. The most
common errors were that the information was incomplete (for example the dose or route
missing) in 38% of errors, an unnecessary drug was prescribed (24%), the dose or strength
was incorrect (14%) or a necessary drug had been omitted (12%).
Prescribing seemed to be performed under more uncertainty than was normal for a GP,
generally because there was a lack of information of because information was incorrect.
The following were reported in interviews:
• A common issue was that the residents themselves were often not accurate
historians, or even able to describe their symptoms. This was sometimes
compounded by staff who also may not have been able to give an accurate history.
• In some homes the residents would be seen by whichever GP was doing home visits
that day, so the GPs often did not know the patient. This is a factor known to be a
cause of error in hospital prescribing.95
• Additionally, equipment and tests that might normally have been available in a
surgery, or even by sending the patient to a hospital, were often not usually
available as many of the residents were fairly immobile. Hence diagnosis was made
under still greater uncertainty.
186
• There were significant problems with residents who had been treated (or had
treatment recommended) elsewhere – either another GP practice (in which case
there could be delays of up to 4 months in transferring the notes of patients from
one practice to another) or a hospital (as an inpatient or outpatient). It is well
documented that there are often medication errors when residents are discharged to
their own homes from hospital.138,139,140,141 This was certainly a common theme, as
was an inadequate information flow following outpatient referral.
• Finally, GPs pointed out that they were prescribing without the usual support given
by their computerised prescribing and patient record system, which they would be
referring to and using in a normal consultation in the surgery. Hence the patient
history was usually missing, as was the drug interaction alert system at the time of
prescribing. However most prescriptions for residents in a home were not hand
written, as doctors made notes and went back to the surgery to prescribe.
Not all medicines require monitoring, however monitoring is necessary for some medicines
that have a high risk of toxicity or where dosage needs to be adjusted. The harm score for
monitoring errors was higher than for other forms of errors, which reflects the importance
of this function. The most common monitoring errors were for diuretics (55%) and ACE
inhibitors (16%). Morris et al134 found 37% of “preventable drug‐related morbidity” is
associated with a lack of monitoring of drugs, with over ¾ involving ACE Inhibitors.
Howard et al6 found that diuretics account for 16% of medicine related hospital admissions.
Pirmohamed135 found that after NSAIDs, diuretics were the second most common cause.135
What was most marked about the monitoring errors was the geographical distribution: 75%
of all these errors were from the homes in London PCTs, (although we were unable to
understand why) and 91% of all monitoring errors were failure by the GP to request
monitoring. Several factors contributed to failure to monitor – including the way in which
the GP surgery was organised to identify and deal with the prompt to monitor, and deal
with the results. However what emerged as a more significant problem was the issue of
who took blood. We come back to some of these issues as latent errors later in the
discussion. There are many factors which make the taking of blood for monitoring drugs
an issue. In some areas there is a district phlebotomy service who can be called on to do
187
this. In some areas this service had been withdrawn on the basis that district nurses could
do this, however some of them refused to do so, and one said she would only do it ‘if the
doctor asked nicely’. Nurses in homes can have problems retaining their competency and
confidence, or may just wish not to take bloods. Some homes trained staff, at costs of £200‐
£700, however they were worried that, given the rapid staff turnover in the sector, these
staff may leave. In some cases the GPs reluctantly took bloods themselves, which they
found quite time consuming.
8.3.2 Contributory factors to dispensing errors
Dispensing errors were observed to happen to 37% of residents, and they occurred in 9.8%
of cases where a drug should have been dispensed. Three quarters of these were labelling
errors and a quarter were content errors. Dispensing to care homes is a complex field, as
there are several ways of dispensing, the more complex of which are commonly thought to
reduce errors and wastage. The three broad methods are :
• Normal dispensing into bottles or packs, with a label containing the resident’s name
and the dose instructions, as would be done for a patient living in their own home;
• MDS based on a “cassette” which contains all the relevant medicines for a certain
day and time (e.g. Monday lunchtime)
• MDS based on blister packs in which, as described earlier, each dose of each drug is
accommodated in a separate plastic blister which needs to be popped out to be
given.
MDS systems were more common in Bradford than elsewhere; dispensing errors were more
common in Bradford than elsewhere. Cassette MDS systems were associated with more
errors than blister MDS systems, many of which seemed related to inadequate labelling of
these systems (which should include a description of all the tablets for a given day/time).
They often are not physically big enough to accommodate all the required labels. The
dispensing error rates above are likely to be an underestimate, as the identity of small white
tablets is impossible to verify: this is a popular form of tablet and we could not confirm
their identities.
188
The practice of packaging all the medicines for a given patient/time/day (e.g. Mrs Smith,
Monday, breakfast) has a long history in hospitals in the USA. Originally all the tablets for
a patient/time/day were slipped into an envelope with the details on the front, so the nurse
just had to ensure the patient took everything in the envelope at the right time. It was
called unit dose and shown to be safer (fewer administration errors) than the then normal
nursing practice in 1963.136 A modified version of this practice is still in use in hospitals in
the USA and is associated with a similar medication administration error rate to UK
hospitals,127 while having a higher dispensing error rate: at least four times that of a UK
hospital if one compares Cina et al137 with Beso et al.53
When considering the extent of dispensing errors associated with MDS it is first important
to reflect on the process which the pharmacists carry out – without any additional payment.
MDS is used for solid oral dosage forms – tablets and capsules. These are now mostly
supplied to pharmacies as 28 or 30 day packs, with each dose separately contained in blister
pack strips of 7 or 10. These need to be popped out of the manufacturer’s packaging, in
which they were chemically stable and accompanied by a patient information leaflet. They
then need to be arranged in the MDS device and, usually, checked by another person to
ensure the right drug is in the right place. Because this is such a labour intensive and
disruptive act in many dispensaries (but by no means all)) it is done in a special site, for
example some companies have centralised MDS dispensing sites which serve several homes
(the largest we saw provided for 76 homes). This allows skill mixing, batch processing and
process control to improve the efficiency of this unfunded task and prepacks are often
prepared for some commonly used drugs. The consequence of the repackaging is that the
drugs are given an arbitrary expiry date of 8 weeks (http://www.rpsgb.org/pdfs/mds.pdf)
and need to be re‐labelled.
The process of filling MDS devices is therefore a cause of potential error, not experienced by
most patients living at home nor those in hospital, which contributed to many of the
dispensing errors we observed for MDS preparations. When MDS dispensing was done
some distance from the home there was sometimes poor communication and a perceived
delayed responsiveness. Often a different, more local pharmacy would be used for
‘interims’ – new medicines prescribed outside the usual MDS cycle; this added to the lack of
189
local knowledge of the home and residents by pharmacy staff (and vice versa). A good
relationship, along with knowledge of the context of each others places of work, could lead
to improved communication overall.
Not all medicines can be placed in an MDS, so there was also dispensing of other medicines
as well in the usual, non‐MDS form. This includes all liquids, inhalers, creams, eye drops, as
well as tablets or capsules which are not stable outside of the blister packaging.
To give an idea of the extent of these activities we can extrapolate from the findings of this
study and the statistic that in 2003 there were 12,871 care homes for older people in
England.16 In our study we found that 86% of residents used MDS; that 40% of doses for
residents using MDS were not from the MDS system, that there were a mean of 7 medicines
per resident, and that there were an average of 39 residents per home. If we assume that the
If we assume that the average dose frequency was twice daily, then that equates to up to 3.6
million doses popped out of a factory prepared blister pack by pharmacies across England
every day.
The final cause of dispensing errors was the way in which the monthly order was made and
kept up to date. Pharmacists tended to use two main sources of information when
dispensing: the prescription and the returned copy of the MAR chart from the previous
month. A MAR chart is generated as part of the dispensing process, the chart then goes to
the home, where it is annotated during or at the end of its 28 day ‘life’, the home then return
a carbon copy which the pharmacist can refer to in order to identify any medication
changes. This may help to ensure that a prescription which has been discontinued is not re‐
dispensed (this discontinuation may not have found its way onto the prescription).
However, conversely, it may have been changed on the practice computer system but not
on the MAR chart. So MAR charts at some homes may not reflect the correct current
prescription.
However, this carbon copy is not always returned to the pharmacy and often, when it is
returned, may have poor legibility. Home staff and the pharmacists maintained they knew
what should and should not be dispensed, however there was no proof, and much of the
safety depended on the local knowledge of individuals, who could obviously be absent, or
190
on leave. A further problem is the difficulty that arises when a medicine is introduced or
the dosage is changed mid‐month. The way in which pharmacists deal with this common
phenomenon varies.
8.3.3 Contributory factors to administration errors
An administration error was observed in 8.4% of the doses observed to be administered.
Half the errors were omissions, and a fifth involved giving the wrong dose of the right
drug. One cause was that ‘as required’ medication, such as lactulose, was shared between
residents until it ran out, or that an ‘original pack’ (the container supplied by the
manufacturer) was given but was insufficient for the required use over the 28 day time
period. Another cause of omission was that nurses tended to administer looking at the
MAR chart and, if the previous dose was omitted, they assumed for example that the
medicine was out of stock and did not look for it. Failure to order medicines properly also
led to omission errors.
The administration error rate was higher for people in residential care compared to those in
nursing care. As most homes had both types of residents we assume these differences are
probably due to the extra knowledge about medicines (from their training and experience)
that nurses had, leading to safer medication administration. Having said that, the
knowledge of some of the nurses was poor. For example one was observed giving an
Aspirin 75mg dispersible tablet. These tablets are designed to disperse in water and hence
stop an aspirin tablet dissolving at one spot in the stomach, with the concomitant risk of
gastric irritation and, potentially, a gastric bleed. The nurse gave the tablet whole.
Interviews and observation revealed that often staff did not have sufficient training. This
was particularly so in respect of inhaler technique, leading to residents not getting the
benefits of the medicine concerned. Lack of knowledge about which medicines needed to
be given in a special way in relationship to food was another source of error, which was
compounded by most homes giving medicines always at the same times (usually at meal
times), irrespective of any special requirements. In addition pharmacies sometimes failed
to pass on appropriate instructions such as how to take the medicine with respect to meals.
191
On occasions low staffing levels and low motivation may have contributed to
administration errors.
Working conditions when administering medicines may also contribute to error. Those
identified in this study include distractions such as noise (e.g. alarm bells, residents
moaning), smells, interruptions, poor lighting conditions and a medicines trolley that was
cluttered, small and badly designed. Importantly, the MAR chart could be hard to read or
inaccurate, with many medicines that should have been discontinued remaining on the
MAR chart. One source of potential error reduction (or resilience) in a general hospital
setting may be the patient themselves. In contrast, in the nursing and residential home
setting, residents often could not contribute as they did not know what they were, or
should be, taking.
Residents receiving a non‐MDS medicine were significantly more likely to receive an
administration error. It remains unclear whether this reflects that the MDS systems are
inherently safer, or whether it reflects that, in homes using MDS systems, the medicines that
could not be fitted into the system, such as inhalers and ‘as required’ medicines were also
those that we observed more commonly associated with error, for example inhalers given
by poor technique, or prn medicines that were out of stock. As mentioned above,
pharmacies sometimes did not know how much of an ‘as required’ medicine to dispense,
and some homes could have been better at reordering when stocks were running low.
8.4 Whole system assessment In the previous section we have followed the traditional medicines related processes:
prescribing, monitoring, dispensing and administering. We have measured the errors in
each process and explored the causes of, and suggested contributors to, errors at each stage
in the process. Previous researchers into medication safety in care homes have generally
studied one process, however we have considered all of them. Using the model proposed
by Reason (1990) we are able to identify significant latent failures within the system. Reason
considers latent failures to be the higher level organisational and cultural issues that are
192
often the key factors in major industrial disasters. It appears that three of the most
significant latent failures in this study are
• lack of ownership and understanding of the whole system,
• lack of valid information that is available to all concerned at the time that they need
it,
• lack of sufficient recognition that health care is usually based on people moving to
and between experts and centres that have appropriate resources. Care home
residents can rarely move like this, and substantial resource is needed to move care
to these residents ‐ some of the most vulnerable in the community.
In this section, we discuss two other wider system issues, MDS and the drug round. Within
these sections we also recommend ways forward.
8.4.1 Leadership and ownership
When looking at the whole system (prescribers, pharmacists, care homes and their staff,
and the local commissioning bodies (PCTs in England)), what emerges strongly is that each
element may feel it is doing its best, but no one is observing the wider picture or taking
ownership of the whole system. In our view each home should have one person who
provides leadership and takes ownership for the effective running of the whole medicines
system in that home, and with the associated GPs, supplying pharmacists and the PCT.
This person would not normally be a member of the home staff, but would be
commissioned to provide the service. Because of their knowledge of medicines, and safe
systems pharmacists would appear to have the skills to best fit this role. This suggestion is
in accord with the recent white paper on pharmacy (DoH 2008 ) in which paragraph 3.80
states ‘The Government considers that chief pharmacists of provider organisations, PCTs
and other commissioners should have a lead role in ensuring that safe medication practices
are embedded in patient care.’. The white paper also suggests ‘health community clinical
pharmacy teams’ to ‘oversee and monitor medicines usage and effectiveness’ (para 3.64).
These teams would be expected to work on the interface issues between primary and
secondary care.
193
The person providing leadership must understand systems and processes to know how to
improve performance. It could be argued that the current system has not been able to adapt
to the increase in the number of medicines prescribed, and the increasing monitoring
recommendations; this needs to be rectified. Within this there would be roles for each
sector to improve their systems and communication, and we provide a ‘diagnostic’ in
section 8.5 and some other suggestions later in this section. Each sector (home, GP,
pharmacy, PCT) needs to have ownership and understanding of the issues in their own
section and those they interact with.
The pharmacist who oversees the whole process may or may not also review individual
patients’ medications. Ideally the pharmacist who reviews medication in a home should
have independent prescriber status in order for them to make medication changes
(communicated to the GP records), rather than just making recommendations which may or
may not be properly communicated and acted on. Should they be trained as a phlebotomist
they would be even more effective. GP practices have the potential to commission such a
service through practice based commissioning. We know that pharmacists can improve
prescribing in care homes through reviewing patients and their medications, and that this
can, for example, significantly reduce falls.26 In the USA it is mandatory to have
pharmacists to conduct regular reviews of medication in care homes, although effectiveness
is variable.106,142 However, this input is usually limited to reviewing the prescription
without seeing the patient, and is much more limited than the whole system approach that
we are suggesting.
8.4.2 Calming the sea of information
Often there is not a point of certainty in the whole system. The ‘truth’ of a resident’s
medicines bobs about like a cork on a storm tossed sea of conflicting information from GP
records, pharmacy records, care home records, hospital records, the MAR chart, the
physical evidence of medicines and the personal accounts of many people, including the
patient. With so many sources of potentially erroneous evidence, it took our researchers
(experienced pharmacists) a great deal of time to arrive at some form of “truth”. The
chance of other individuals having the time and resources to do so is, in many cases,
minimal.
194
Clearly some unified method of access to a single reference point, and simple
communication between all the players is required. There could be an argument that the
prescription should be the reference point, however there were cases when a GP had
changed the prescription but the practice patient record had not been updated, and the
MAR chart was more accurate. There were some examples of good practice, including one
GP who had a terminal to his practice in the home, and a pharmacist who had access to the
GP’s computer system, and would always check the patient record, resolving any
discrepancies before dispensing.
The ergonomics study identified a cluster of medication errors where the MAR chart was a
contributory factor. This particularly related to the number of discontinued items recorded
on the chart. The ergonomics study also identified a cluster of medication errors where a
contributory factor was the communication between the care home and the pharmacy. This
includes administration instructions for individual medicines (on medicine labels and on
MAR charts), medication no longer to be given and changes in medication during the 28
day cycle.
There is substantial potential for the NHS Connecting for Health programme to deliver
improvements. Here we refer to the English programmes, but other nations have similar
programmes. The Electronic Prescribing Service, Release 2 (EPS) will allow transfer of the
prescription electronically between prescriber and dispenser, and will also allow repeat
dispensing for up to a year. This is a substantial improvement on the current repeat
dispensing service as it can be updated in real time, so changes in prescribing are reflected
before the next dispensing. This should help ensure dispensing is from the prescription,
particularly if the GP can prescribe electronically while in the home. A second point of
concern was the long time to transfer records when changing GPs (in one case 4 months),
which should be addressed by GP2GP, which will transfer the records electronically when
the patient registers with another GP. The GP Systems of Choice (GPSoC) programme
should ensure that GPs have systems of sufficient complexity and robustness to deliver
these benefits.
Information following hospital discharge or outpatient appointment may improve when
the Clinical Records Systems (CRS) are introduced into hospitals, however the timescale is
195
unclear and effectiveness will depend on how the system is implemented. The Summary
Care Record (SCR) and Personal Demographics Service should ensure accurate information
on the patient is available remotely. Finally, HealthSpace will become important. This is a
‘secure online personal health organiser’ which allows residents to log preferences etc, and
which can also allow viewing of the SCR. It may be useful if homes could use this on behalf
of their clients, whose preferences they often know. All the above (with the exception of
some key functions in CRS) are, at the time of writing, scheduled to be available by the start
of 2009.
For pharmacists to be effective they need access to relevant patient information, however
the access of community pharmacists to the patient record is being contested by some
patient groups. Work is needed to find a solution that allows pharmacists appropriate
levels of access. Another potential barrier is that some PCTs may choose to delay
implementation of some systems on cost grounds.
PCTs need to establish how care homes can be linked into the NHS IT programme to
provide patient benefit. Care homes should consider the extent of advanced IT provision of
GP practices and pharmacies that they interact with. We recognise that just being enabled
to perform an IT function does not mean that benefits will be delivered. Sometimes IT use
creates new errors. However there are evaluations being carried out of many IT services
which should provide guidance on how to get the best out of them. We revisit technology
in a section on error reduction below.
The need for good communication is reduced if there are fewer people involved in care.
When patients move into a care home they may choose to have their GP, who they know
and trust, continue to provide care. For this reason homes may work with many GPs (the
maximum in our study was 14). We think there is a strong case for a home to have a
preferred GP, who should be the GP of choice if the patient is in equipoise. In this case it is
easier for a terminal from the practice computer system to be in the home, and there may be
sufficient patients for regular visits from the GP, or practice nurse, and pharmacist. The GP
should also review the effectiveness of their systems if flagging those patients who require
monitoring because of their medicines, and how effectively the flags are acted upon.
196
8.4.3 The home‐bound resident
The third ‘latent failure’ that needed to be addressed was that the dominant model of
healthcare is predicated on residents being expected to move to points of care (surgeries,
clinics, hospitals etc). Most care home residents can be considered as functionally
immobile. While a few leave the home alone, most remain within the home, unless taken
somewhere. This means that, for example, for one patient to have a blood test at a hospital,
or an X‐ray, takes a lot of time, effort and resource. An ambulance or taxi needs to be
called. A carer has to accompany the patient to the hospital, wait for the test, and then find
transport home. It can easily take the best part of half a day of staff time. In contrast, one
care home manager explained what a major difference a visiting phlebotomist had made to
his managing a home. He phoned them when needed, and when they arrived they were in
and out of the home in 10 minutes.
These services are usually resourced (or not) from the PCT, and there needs to be a review
of the extent and effectiveness of these services. In some cases, as above, the GP can do
more, with the home, to bring the resources of the surgery into the home. The first three
issues in this section on the ‘whole system’ emerged from the study of latent failures; there
follow two related issued which also emerged – the way medicines are dispensed and
administered in homes.
197
8.4.4 Medicine dispensing systems
Our work has brought out for the first time the interconnectedness, possibly a reciprocal
ratio, between dispensing and administration errors when comparing normal dispensing
(predominantly labelling an original container) with various forms of dispensing
technologies – Monitored Dosage Systems (MDS). We particularly bring out their role as a
technology as we think the problem is usefully informed by the literature on the use and
effectiveness of technology, particularly as several computerised secure ‘dispensing’
cabinets are now available.
MDS seems to divide people into those who like or dislike it. We have already described it
and its attributes in detail, however the findings of the research are, frustratingly not yet
clear enough to make firm recommendations. Is MDS safer than non‐MDS? We cannot
clearly say, because MDS is limited to regularly prescribed solid dosage forms and non‐
MDS can include those and everything else. Hence a comparison of the associated
prevalence of errors, particularly administration errors, can be misleading as it is not
comparing like with like. Our harm scale suggests that dispensing and administration
errors are associated with producing similar extents or harm, so both types of error need to
be taken equally seriously. There is the suggestion that MDS may be associated with a
higher dispensing error rate. As their practices are so varied, pharmacies need to review
their error rate with their home and if there is a problem, the pharmacists should be asked
to find a solution.
One thing is clear about MDS, the large amount of resource associated with it. Not only is
there the large, unfunded repackaging that pharmacies undertake, but there is also an effect
on the homes. Several care home managers estimated that 40‐50% of staff time was spent
on medicines related activities (ordering, storing, administering, recording etc). This
suggests that there is considerable potential, and motivation, to find an alternative solution.
Some UK hospitals are now using automated dispensing machines, which can be used to
permit access only to prescribed medication for the individual patient, as well as bar code
checking systems. Robotic dispensing of original packs of medicines exists in several
hospitals and is associated with reduced content errors.144
198
There are a number of electronic ‘cupboards’ of various complexity that can store medicines
and allow access only for the right medicine for each patient. These systems need a
database of all the residents and their medicines, and the boxes need to be refilled; most can
send a message to the pharmacy to do this. A third area of technology that can be applied
is the use of bar codes. Original packs are increasingly bar coded, and bar codes could be
generated for other packaging, and can be used to match the drug to the patient. An
advantage of all these systems is that they automatically provide an electronic audit trail,
and can be monitored in real time if need be. We have shown that an automated
combination of electronically controlled access to medicines, combined with bar coded
identity checking, significantly reduced medication administration errors in a UK hospital
ward.55,96
We have taken a socio‐technical approach to technologies (explained more fully in Chapter
6). The effectiveness of technologies is only found by use, and it is the interaction of what
people do to the machines, and what the machines do to people, that produces the end
result. The effects of technologies can therefore differ between places, and they need to be
well managed to achieve full effectiveness. We are not expecting technology to necessarily
provide a solution, but it needs to be explored and, given the rapid rate of change, needs to
be constantly reviewed and evaluated.
One final point about MDS (and the other technologies listed above). Like many safety
technologies they are ‘structuring’ – they structure the work that people do, making them
do a series of ordered acts with little or no discretion. This is commonly seen as a way to
improve safety, as people are forced to do the ‘right’ thing. This structuring often takes
resource, and can lead to the mechanisation and deskilling of tasks. One care home
manager said giving medicines had become a large task of work instead of an act of care. It
also means the systems find it hard to cope with anything other than the regular supply of
the same tablets: changes of dose, newly prescribed medicines, liquids, creams, inhalers etc
all can either not be accommodated by the system, or require a lot of work to accommodate
them. These other tasks are not within the main safety system so can be more prone to
error, and yet these are also consequences of the system. It is perhaps significant that when
comparing all medication administration errors in homes that use MDS, compared to
199
homes that do not, there was no significant difference. The true effect of the technology is
its effect not only of the doses it can control, but also of those it can not control, which
people deal with in different ways.
The trend to a higher rate of medication administration error in residential rather than
nursing care residents is of particular concern, as these residents are often in the same home
so location, systems of work etc are the same. This places the focus on the knowledge, skills
and abilities of staff giving the medicines and the support they are given. They need to be
observed giving medicines and be seen to show sufficient skills.
8.4.5 Drug round issues
The ergonomics study identified drug administration during the drug round as a critical
task, and that interruptions to the care home staff when undertaking drug rounds were
common (up to 12 interruptions per hour). The fact that most of these interruptions came
from other staff suggest that understanding these interruptions with a view to designing
them out should be possible with changes to care home processes and training. A number
of potential interventions might be tested including: planned breaks during the round,
changing drug administration times and engaging more trained staff. In addition, the drug
trolley used during the drug round may be contributing to errors. Re‐designing of drug
trolleys or use of other forms of storage might be considered, such as a small drugs room.
At a more fundamental level, our research has raised the question of whether the “hospital
model” trolley‐based drug round is most appropriate for homes providing “personal care”
and where many of the staff do not have appropriate knowledge or training in medication
administration.
8.5 Appetite for change We have been very impressed by the interest of the care home managers. There is
considerable concern about medication errors and, we think, an appetite for change. There
are some homes where they manage medicines very well. However as practices vary so
much it is difficult to be too prescriptive about change – there are many ways of creating
safe systems and we saw good practices which were sometimes a function of context and
200
not always transferable to other settings. For this reason our recommendations above are
fairly general.
8.5.1 Diagnostic questions
However working from the factors that we found to contribute to errors it is possible to
build up a ‘diagnostic’ list of risk factors which one could look for and work to eliminate.
This can be used by anyone involved in the system, or anyone taking a whole systems view.
Not all the issues on the list can be resolved easily at present, however that does not mean
they disappear as risk factors. The list is below:
Diagnostic risk factors
In this section we create a starting point for a diagnostic tool which could be applied to a
home to assess whether it is avoiding factors known to contribute to medication errors. It is
a reworking of factors which we found to contribute to error. It is not, however, meant to
be sufficient as a sole means of change. It needs to be used as a starting point for a process
or regular monitoring and reflective review of the local situation. In some cases questions
may not be answered satisfactorily, but a good alternative way of achieving the same ends
is available.
Prescribing and Monitoring
• Does the prescriber know the patient?
• At the time of prescribing does the prescriber have access to the patient’s electronic
record and prescribing software?
• Does the surgery have training/sufficient processes/adequate software to ensure that
drugs that need monitoring are flagged and that staff know how to identify
monitoring when it is needed, and know how to act on this?
• Is there a regular, independent review of prescribing? Does the reviewer check for
appropriateness of prescribing?
• Are there processes to improve transmission of information to and from secondary
care, and between GPs and pharmacies?
201
Dispensing
• If MDS is used, is all the relevant information about medicines getting to the home,
including instructions for inhalation devices, and all the appropriate warning labels
(relating to food etc) and the patient information leaflet?
• Does the dispensing pharmacy have a relationship with the home and know their
requirements?
• Is there a system for identifying medicines which are about to run out before the
next supply cycle?
• Can ‘interims’ and out of stock medicines be rapidly supplied?
• Is dispensing referenced to the prescription, or at least to a current, clear and
accurate MAR?
Administration
• Are staff trained to administer medicines, particularly inhalers?
• Are prescriptions written to smooth the workload of staff and hence reduce
medication errors? Is the prescribing reviewed to reduce the number of medicines
prescribed as much as possible, rationalise to once daily dosage where possible,
work with the home to reduce the number of medicines given in the morning round
(the busiest and most interrupted, hence the most error prone)?
• Is there a mechanism to alert the home as to which drugs have to be taken in a
special relationship to meals (before, after etc)? If there is, does the home have a
suitable procedure to ensure this information is acted on?
• Are staff regularly observed administering medicines to establish training needs,
and to praise good practice? When was each member of staff last observed
administering medicines?
General
• Does all documentation seem clear, non‐contradictory and up to date?
• What sources of information about medicines are available to staff in homes?
202
• Which services are provided locally by the PCT: regular pharmacist visits?
Phlebotomist? District nurse? etc. Are these all readily accessible if required?
8.5.2 Implications for practice
Care homes vary and there can be many ways to create a safe systems – we have tried to
balance broad goals with practical suggestions, but the main endpoint is a robust, resilient
safe system.
We list here some suggestions for reducing errors (categorised around the error type, rather
than who is involved). The context of each suggestion has been explored in the previous
parts of the chapter.
Reducing prescribing and monitoring error
• Each home has a preferred general practitioner
• GPs at the home can prescribe using their usual computer system i.e have access to
the pateints notes and other features of the system. This could be achieved through a
remote terminal or by computer and remote link software
• Regular visits of the practice nurse or GP and also pharmacist
• Regular visits by pharmacist to review individual residents medication
• Review processes to identify patients needing monitoring and robust ways
developed to trigger the process, carry it out, and act on findings.
• PCT to support GPs and homes in taking bloods, for example by providing
phlebotomists or funding training for nurses and others.
• Review handling of information about medicines to and from secondary care
Reducing dispensing errors
• Ensure all relevant information goes with the medicine (including information about
taking with respect to meals)
203
• Dispense from the most accurate information source (always from the prescription,
but also using the returned MAR chart if thought reliable)
• If using cassette MDS systems, find a way of labeling them correctly
• Review use of pre‐packs to reduce the stock that will be out of date before the end of
the month they are dispensed to be used in
• Audit current practice to identify and reduce dispensing errors.
Reducing administration errors
• Work to make fewer distractions for the administering carer
• Review prescriptions with pharmacist or GP to reduce the workload on the morning
round, and to reduce the total daily number of administrations for each medicine ‐
when possible to do with no detriment to the patient
• Have a method of flagging and dealing with medicines that need to be taken at a
certain time with respect to food.
• Ensure rapid dispensing and receipt of new medicines, or those about to go out of
stock. so that the number of missed doses is reduced.
• Regularly review the number of omitted doses and develop and evaluate solutions.
• Pharmacists and homes should meet to ensure they understand each others needs
and constraints
System wide issues
• The commissioning of someone to oversee and facilitate a safer medicines system in
each home or group of homes.
• Improve communication between all concerned In England several CfH initiatives
are important to improve the situation (in particular EPS Release 2 and GP2GP and
summary care record).
• Pharmacist access to the patients’ notes is a prerequisite to a truly safer system ‐
something which has not yet been agreed. HealthSpace has potential if homes can
use it on the residentsʹ behalf.
204
• The use of MDS, and possible alternatives to it, requires further research (questions
this research was not designed to answer). The large amount of resource associated
with MDS, the rigidity of the systems, the number of medicines it can not handle
(40% of doses given) and the lack of clarity about the benefits mean it is time to
review the system and to compare it to alternatives.
• The drug trolley and drug round also need more research to reduce their error
producing factors
• The PCT needs to recognize the problems associated with patients that are
effectively home bound and ensure appropriate services are resourced.
205
Chapter 9 Conclusion
Care home residents are amongst the most vulnerable people in society. They have the
potential to both benefit most and suffer most harm from medicines. This study has found
that they are at high risk of medication errors. Errors associated with all aspects of
medicines management (prescribing, dispensing, administration and monitoring) were as
high or higher for this group of care home residents than found in studies of people living
in their own homes or being treated in hospitals.
We did not see any cases with the potential for severe harm during the study, but this does
not prove that this does not occur. However, we have found that seven out of ten were
subject to at least one form of medication error and that for each act of prescribing there
was a 8‐10% chance of an error occurring. This means that action needs to be taken to
improve the benefits care home residents obtain from medicines, reduce the potential harm,
and improve the quality of life and independence of residents.
Solutions to improve medicines management in care homes are required at the macro and
micro level. At the macro level someone needs to take responsibility for safe medication
practices in the whole system, a role the Government has recently assigned to chief
pharmacists (DoH 2008). There is a need for someone to understand all aspects of the
medication system and ensure that all players and sites are co‐ordinated. At the micro level
there is work for all to engage in. GPs need to review their prescribing and endeavour to
prescribe electronically from the home. They may wish to have regular visits by
themselves, nurse practitioners or clinical pharmacists. Within their practice they need to
review how they identify medicines that require monitoring and ensure it happens. Homes
need to look to their staff, especially the training of those giving medicines to patients in
residential care. They should work with GPs and may wish to move towards a main
provider. They should review the way they order, to reduce ‘out of stock’ medications, and
may wish to reconsider what is the best way for medicines to be dispensed to them.
Pharmacists need to dispense from authoritative sources and need to consider, particularly
206
with the MDS cassette system, how they can reduce dispensing errors. PCTs need to
resource carers visiting the patients in homes.
The extent to which dispensing and administration errors relate to the type of system used,
whether conventional individual bottles, cassette MDS or blister MDS, is unclear. The view
that MDS is clearly safer is not yet proven in our view. This needs further urgent research.
However, the fact that millions of doses a week, which have been factory packed into blister
packs, are then popped out of these blisters, only to be put into another blister or cassette
cannot be ignored. New technologies to control access to medicines and identify medicines
and patients should be explored.
Poor communication underpins many of the types of errors seen in this study. The
communication between the home, the GP and the pharmacy (or pharmacies) needs to be
improved. IT solutions have been proposed, but they cannot be relied upon, particularly in
the short to medium term. The relationship between care home healthcare provision and
the Connecting for Health programme (including PCT funding of elements of it) needs to be
researched and actively managed to ensure that the potential benefits are fully realised.
Our interaction with all the players in practices, homes and pharmacies has convinced us
that change is possible.

207
Acknowledgements
We are very grateful to all care home staff, GPs and pharmacists who agreed to take part in
the study.
Thanks are also due to Janet Watkinson, Miriam Idskes, Francien Paalhaar and Mike
Schachter for their valuable input.
We are grateful to the input from the Steering Group: Kate Brown, Peter Bowie, Elizabeth
Flynn and Baroness Greengross.
We thank First DataBank for providing the computerised medication database.
Finally we thank Hazel French & Ruth Allcroft for their assistance in preparing the final
report.
208
Contributions of authors
Mr David Alldred. Lecturer. Area of speciality: Clinical Pharmacy and Medicines
Management in Care Homes. Project Manager for the study. Contributed to the conception
and design of the study and the analysis and interpretation of data.
Professor Nick Barber. Professor of Pharmacy Practice. Area of speciality: Medication
Error. Principal Investigator for the study. Contributed to the conception and design of the
study and the interpretation of data.
Professor Peter Buckle. Professor of Health Ergonomics. Area of speciality: Health
Ergonomics. Responsible for the ergonomics component of the study. Contributed to the
conception and design of the ergonomics study and the interpretation of this data.
Professor Bryony Dean‐Franklin. Director, Centre for Medication Safety and Service
Quality, Imperial College Healthcare NHS Trust and the School of Pharmacy, University of
London. Area of speciality: Medication safety. Contributed to the conception and design of
the study and the interpretation of data.
Mrs Rebecca Dickinson. Research Nurse. Area of speciality: The health of older people.
Contributed to the design of the study and the acquisition of data. Responsible for the
recruitment of care homes and consent/assent of care home residents in Bradford.
Dr Sara Garfield. Postdoctoral Research Fellow. Area of speciality: Medication error.
Undertook analysis and interpretation of qualitative data.
Ms Barbara Jesson. Research Fellow and clinical research pharmacist. Area of speciality:
Clinical Pharmacy and Medicines Management in Care Homes. Contributed to the design
of the study and collected data for the London area.
Ms Rosemary Lim. Research Clinical Pharmacist. Area of speciality: Clinical Pharmacy.
Contributed to the design of the study and the collection of data in the Cambridgeshire
area.
209
Professor DK Theo Raynor. Professor of Pharmacy Practice. Area of speciality: Medicines
Management. Contributed to the conception and design of the study and interpretation of
data.
Dr Imogen Savage. Lecturer in Patient Safety. Area of speciality: Patient safety.
Contributed to the conception and design of the study, acquisition of qualitative data and
interpretation of data.
Ms Claire Standage. Research Clinical Pharmacist. Area of speciality: Medicines
management in care homes. Contributed to the design of the study, acquisition of data in
the Bradford area and analysis of data.
Dr Paul Wadsworth. Research Fellow. Area of speciality: Consumer ergonomics, human‐
computer interaction, office ergonomics, user‐centred designed. Contributed to the
conception, design, collection, analysis and interpretation of the ergonomics component of
the study.
Dr Maria Woloshynowych. Lecturer in Clinical Safety. Area of specialty: Patient safety.
Contributed to the conception and design of the study and the analysis and interpretation
of qualitative data.
Dr Arnold Zermansky. Honorary Senior Research Fellow and General Practitioner. Area of
speciality: Medicines Management in Care Homes. Contributed to the conception and
design of the study and interpretation of data.
All authors were involved in drafting the manuscript and/or critically revising it and
approved the final version.
210
References
1. DoH 2001a. Department of Health. Building a safer NHS for patients. 2001. London,
Department of Health.
2. DoH 2000. Expert Group on Learning from Adverse Events in the NHS. An
organisation with a memory. 200. London, Stationary Office.
3. DoH 2004. Building a safer NHS for patients: improving medication safety. London:
Department of Health, 2004.
4. DoH 2001b. National Service Framework for Older People. London: Department of
Health, 2001.
5. DoH 2001c. Medicines and Older People: implementing medicine-related aspects of
the NSF for older people. London: Department of Health, 2001.
6. Howard et al 2006. Which drugs cause preventable admissions to hospital? A
systematic review. British Journal of Clinical Pharmacology. 63; 136-147.
7. Cannon J,Hughes CM. An assessment of the incidence and factors leading to drug-
related hospital admissions in the elderly. Eur.J.Hosp.Pharm. 1997;3:14-8.
8. Cunningham G, Dodd TRP, Grant JA, et al. Drug-related problems in elderly patients
admitted to Tayside hospitals, methods for prevention and subsequent reassessment.
Age and Aging 1997;26:375-82.
9. CSCI 2007. State of social care: facts and figures. Accessed 10.04.08
www.csci.org.uk/about_us/news/state_of_social_care_facts_a.aspx.
10. McGrath AM,.Jackson GA. Survey of neuroleptic prescribing in residents of nursing
homes in Glasgow. British Medical Journal 1996;312:611-2.
11. Fahey T, Montgomery AA, Barnes J, Protheroe J. Quality of care for elderly residents
in nursing homes and elderly people living at home. British Medical Journal
2003;326:580-3.
12. Zermansky A, Alldred DP, Petty D, Raynor DK, Freemantle N, Eastaugh J, Bowie P.
Clinical medication review by a pharmacist of elderly people living in care homes –
randomised controlled trial Age and Ageing, 35, pp.586-591, 2006.
13. Alldred et al. Antipsychotic prescribing patterns in care homes and relationship with
dementia. Psychiatric Bulletin 2007; 31: 329-332.
14. DoH 2002. Care Homes for Older People. National Minimum Standards.
http://www.doh.gov.uk/ncsc. 2002. London, The Sationery Office.
211
15. NCSC 2004a. Health Select Committee Inquiry into Elder Abuse: Evidence from the
National Care Standards Commission.
http://www.carestandards.org.uk/press+release/pressitems/elder_abuse.pdf
16. NCSC 2004b. The management of medication in care services 2002/3. National Care
Standards Commission.
17. CSCI. Handle with care? February 2006. Commission for Social Care Inspection.
18. Gurwitz JH, Sanchez-Cross MT, Eckler MA, Matulis J. The epidemiology of adverse
and unexpected events in the long- term care setting. Journal of the American
Geriatrics Society 1994;42:33-8.
19. Barker KN, Flynn EA, Pepper GA, Bates DW, Mikeal RL. Medication errors observed
in 36 health care facilities. Archives of Internal Medicine 2002;162:1897-903.
20. Gurwitz et al. The incidence of adverse drug events in two large academic long-term
care facilities. American Journal of medicine 2005; 118: 251-258.
21. Oborne CA, Hooper R, Swift CG, Jackson SHD. Explicity evidence based criteria to
access the quality of prescribing to elderly nursing home residents. Age & Ageing
2003;32:102-108.
22. Barber N, Bradley C., Barry C, Stevenson F, Britten N, Jenkins L. Measuring the
appopriateness of prescribing in primary care: Are current measures complete?.
Paper undergoing revision with Quality and Safety in Health Care. 2004.
23. Spinewine A, Schmader KE, Barber N, Hughes C, Lapane KL, Swine C, Hanlon JT.
Prescribing in Elderly People 1: Appropriate prescribing in elderly people: how well
can it be measured and optimized? Lancet 2007 370: 173-84.
24. Alldred DP, Zermansky A, Petty D, Raynor DK, Freemantle N, Eastaugh J, Bowie P.
Clinical medication review by a pharmacist of elderly people living in care homes:
pharmacist interventions. International Journal of Pharmacy Practice, 15, pp.93-
99,2007b.
25. Lunn J, Chan K, Donahue J, Riley B, Wally T. A study of appropriateness of
prescribing in nursing homes. International Journal of Pharmacy Practice 1997; 5: 6-
10.
26. Zermansky A, Alldred D, Petty D, Raynor DK, Freemantle N, Eastaugh J, Bowie P.
Clinical medication review by a pharmacist of elderly people living in care homes –
randomised controlled trial. Age and Ageing. 2006; 35: 586-591.
212
27. Rasmussen J, Jensen A. Mental procedures in real life tasks: a case study of
electronic trouble-shooting. Ergonomics 1974;17:293-307.
28. Reason J. Human Error. Cambridge: University of Cambridge, 1990.
29. Vincent C, Taylor-Adams SE, Stanhope N. Framework for analysing risk and safety in
clinical practice. British Medical Journal. 1998;316:1154-7.
30. Cornford T, Doukidis G I, Forster D. Experience with a structure, process and
outcome framework for evaluating an information system. Omega. Int J Manage Sci
1994;22:491–504.
31. DoH 2003. Design for patient safety. London Department of Health.
32. CSCI. Handled with care: managing medication for residents of care homes, (2006).
33. CSCI. Professional advice: Medicines administration records (MAR) in care homes
and domiciliary care (2007a).
34. CSCI. Professional advice: Administration of medicines in care homes (2007b).
35. CSCI. Professional advice: Training care workers to safely administer medicines in
care homes (2007c).
36. RPSGB. Practice Guidance: Advisory services to care homes (2003).
37. RPSGB. Practice Guidance for the provision of printed medication administration
record charts (MAR) by community pharmacists (2005).
38. RPSGB. The handling of medicines in social care (2007a).
39. RPSGB. Fitness to Practice & Legal Affairs Directorate Fact Sheet 6. Monitored
dosage systems and compliance aids (2007b).
40. Zermansky AG. Who controls repeats? Br J Gen Pract 1996; 46: 643-647.
41. Sprey L.S. Monitored dosage systems. Pharm J 1995; 254: 767-70.
42. NPCC (National Pharmaceutical Consultative Committee). Scottish Health Service
Planning Council. Pharmaceutical services for the elderly. Report by the National
Pharmaceutical Consultative committee, 1981.
43. Rivers PH, Poston JW. Evaluation of a controlled medication system. The
Pharmaceutical Journal 1985;235:787-89.
44. Anonymous. Controlled dosage systems for residential homes. The Pharmaceutical
Journal 1990;244:385-386.
213
45. Ashurst A, Deans BJ. Using a monitored dosage system. British Journal of Nursing
1992;1:379-82.
46. Manrex. The Boots Company PCL Nottingham, England. Monitored Dosage System
product information, june 2005. http://www.manrex.com/ltc.html
47. Venalink. Medication Management Systems, England. Monitored Dosage System
product information 2004. http://www.venalink.co.uk/products.html
48. Gaucher M, Greer M. A Nursing Evaluation of Unit Dose and Computerized
Medication Administration Records. The Canadian Journal of Hospital Pharmacy
1992;45:145-50.
49. Franklin BD, Vincent C, Schachter M, Barber N. (2005). The incidence of prescribing
errors in hospital inpatients - an overview of the research methods. Drug Safety.28:
891-900.
50. Barker KN, McConnell WE. The problems of detecting medication errors in hospitals.
American Journal of Hospital Pharmacy 1962;19:360-9.
51. Barber N, Franklin BD, Cornford T, Klecun E, Savage I. (2006). Safer, faster better?
Evaluating electronic prescribing. Report to the Patient Safety Research Programme,
Department of Health.
52. Dean B, Barber N. (2000). The effects of a patients’ own drugs scheme on the
incidence and severity of medication administration errors. International Journal of
Pharmacy Practice 8: 209-16.
53. Beso A, Franklin BD, Barber N. (2005). The frequency and potential causes of
dispensing errors in a hospital pharmacy. Pharmacy World and Science 27: 182-190.
54. Franklin BD, O’Grady K, Parr J and Walton I. (2006). Using the internet to deliver
education on medication safety. Quality and Safety in Health Care, 15:329-333.
55. Franklin BD, O’Grady K, Donyai PD, Jacklin A, Barber N. (2007). The impact of a
closed-loop electronic prescribing and administration system on prescribing errors,
administration errors and staff time: a before and after study. Quality and Safety in
Health Care 16: 279-284.
56. Dean B, Barber N, Schachter M. What is a prescribing error? Quality and Safety in
Healthcare 2000; 9: 232-237.
57. Dean BS, Schachter M, Vincent C, Barber ND. Prescribing errors in hospital
inpatients – incidence and clinical significance. Quality and Safety in Health Care
2002; 11: 340-4.
214
58. Sagripanti M, Dean B, Barber N. An evaluation of the process-related medication
risks for elective surgery patients from pre-operative assessment to discharge.
International Journal of Pharmacy Practice 2002; 10: 161-70.
59. Donyai PD, O’Grady K, Jacklin A, Barber N, Franklin BD. (2007). The effects of
electronic prescribing on the quality of prescribing. British Journal of Clinical
Pharmacology. 15: 133-139.
60. Zermansky A, Petty D, Raynor DK, Freemantle N, Vail A, Lowe CJ. Randomised
controlled trial of clinical medication review by a pharmacist of elderly patients
receiving repeat prescriptions in general practice British Medical Journal, 323,
pp.1340-1343, 2001.
61. Zermansky A, Alldred D, Petty D, Raynor DK, Freemantle N, Eastaugh J, Bowie
P.Clinical medication review by a pharmacist of elderly people living in care homes—
randomised controlled trial Age and Ageing, 35, pp.586-591, 2006.
62. BNF. British Medical Association and Royal Pharmaceutical Society of Great Britain.
British National Formulary 51 March 2006 ed. London.
63. North West Drug Information Letter. Monitoring drug therapy. North West Drug
Information Letter No.120. Sept 2002. Available at
http://www.ukmi.nhs.uk/newmaterial/html/docs/21100201.pdf Accessed 6th December 2007.
64. London and South East Medicines Information Service and Croydon PCT.
Suggestions for Drug Monitoring in Adults in Primary Care: A collaboration between
London and South East Medicines Information Service and Croydon Primary Care
Trust. June 2006.
65. Hinchingbrooke Hospital NHS Trust . Monitoring of Maintenance Therapy in Primary
Care. October 2005.
66. Shekelle PG, MacLean CH, Morton SC, Wenger NS. Assessing care of vulnerable
elders: methods for developing quality indicators. Ann Intern Med 2001; 135: 647-52.
67. Gurwitz JH, Field TS, Judge J, Rochon P, Harrold LR, Cadoret C, Lee M, White K,
LaPrino J, Erramuspe-Mainard J, DeFlorio M, Gavendo L, Auger J, Bates DW. The
incidence of adverse drug events in two large academic long-term care facilities. Am J
Med. 2005;118(3):251-8.
68. Allan EL, Barker KN. Fundamentals of medication error research. American Journal
of Hospital Pharmacy 1990; 47: 555-571.
215
69. Dean B, Barber N. Validity and reliability of observational methods for studying
medication administration errors. American Journal of Health-System Pharmacy
2001; 58: 54-9.
70. Dean B, Barber N, Schachter M. What is a prescribing error? Quality and Safety in
Healthcare 2000; 9:232-237.
71. Reason J. Managing the risks of organisational accidents. Aldershot: Ashgate, 1997.
72. Kirk S, Parker D, Claridge T, Esmail A, Marshall M. (2007). Patient safety culture in
primary care: developing a theoretical framework for practical use. Qual Saf Health
Care 16: 313-320.
73. Naish J, Carter Y H, Gray R W, Stevens T, Tissier J M, Gantley M M. (2002). Brief
encounters of aggression and violence in primary care: a team approach to coping
strategies. Fam Pract 19: 504-510.
74. Healey AN, Undre S, Vincent CA. (2004). Developing observational measures of
performance in surgical teams. Qual Saf Health Care 13: i33-i40.
75. Thompson AM, Stonebridge PA. (2005). Building a framework for trust: critical event
analysis of deaths in surgical care. BMJ 330: 1139-1142
76. Tang B, Hanna GB, Joice P, Cuschieri A. (2004). Identification and Categorization of
Technical Errors by Observational Clinical Human Reliability Assessment (OCHRA)
During Laparoscopic Cholecystectomy. Arch Surg 139: 1215-1220.
77. Tasker RC. (2000). Training and dealing with errors or mistakes in medical practical
procedures. Arch. Dis. Child. 83: 95-98.
78. Williams MV. (2007). Improving patient safety in radiotherapy by learning from near
misses, incidents and errors. Br. J. Radiol. 80:297-301.
79. Graves K. (2005). Perfusion safety in Europe: managing risks, learning from mistakes.
Perfusion 20: 209-215.
80. Liang BA. (2002). A system of medical error disclosure. Qual Saf Health Care 11: 64-
68
81. Waring J. (2007). Getting to the ‘roots’ of patient safety. Int J Qual Health Care
19:257-258.
82. Bell DS, Cretin S, Marken RS, Landman AB. (2004). A Conceptual Framework for
Evaluating Outpatient Electronic Prescribing Systems Based on Their Functional
Capabilities. J. Am. Med. Inform. Assoc. 11: 60-70.
216
83. van der Sijs H, Aarts J, Vulto A, Berg M. (2006). Overriding of Drug Safety Alerts in
Computerized Physician Order Entry. J. Am. Med. Inform. Assoc. 13: 138-147.
84. Stebbing C, Wong ICK, Kaushal, R Jaffe A. (2007). The role of communication in
paediatric drug safety. Arch. Dis. Child. 92: 440-445.
85. Ghaleb M A, Barber N, Franklin BD, Yeung VW, Khaki Z F, Wong I C. (2006).
Systematic Review of Medication Errors in Pediatric Patients. The Annals of
Pharmacotherapy 40: 1766-1776.
86. Walsh KE, Kaushal R, Chessare JB. (2005). How to avoid paediatric medication
errors: a user’s guide to the literature. Arch. Dis. Child. 90: 698-702.
87. Cresswell KM, Fernando B, McKinstry B, Sheikh A. (2007). Adverse drug events in
the elderly. Br Med Bull 83: 259-274.
88. Howard RL, Avery AJ, Howard PD, Partridge M. (2003). Investigation into the reasons
for preventable drug related admissions to a medical admissions unit: observational
study. Qual Saf Health Care 12: 280-285.
89. Rothschild J M, Federico FA, Gandhi TK, Kaushal R, Williams D H, Bates DW. (2002).
Analysis of Medication-Related Malpractice Claims: Causes, Preventability, and
Costs. Arch Intern Med 162: 2414-2420.
90. Szeinbach S, Seoane-Vazquez E, Parekh A, Herderick M. (2007). Dispensing errors
in community pharmacy: perceived influence of sociotechnical factors. Int J Qual
Health Care 19: 203-209.
91. Knudsen P, Herborg H, Mortensen A R, Knudsen M, Hellebek A. (2007). Preventing
medication errors in community pharmacy: root-cause analysis of transcription errors.
Qual Saf Health Care 16: 285-290.
92. Husch M, Sullivan C, Rooney D, Barnard C, Fotis M, Clarke J, Noskin G. (2005).
Insights from the sharp end of intravenous medication errors: implications for infusion
pump technology. Qual Saf Health Care 14: 80-86.
93. Taxis K, Barber N. (2003). Causes of intravenous medication errors: an ethnographic
study. Qual Saf Health Care 12: 343-347.
94. Vincent C, Taylor-Adams SE, Chapman EJ, Hewett D, Prior S, Strange P et al. How
to investigate and analyse clinical incidents: Clinical Risk Unit and Association of
Litigation and Risk Management Protocol. British Medical Journal 2000;320:777-81.
95. Woloshynowych M, Neale G, Vincent C. Case record review of adverse events: a new
approach. Quality and Safety in Healthcare 2003;12:411-5.
217
96. Dean B, Schachter M, Vincent C, et al. Cause of prescribing errors in hospital
inpatients: a prospective study. Lancet 2002; 359:1373–8. (b).
97. Barber N, Cornford T, Kelcun E. Qualitative evaluation of an electronic prescribing
and administration system. Quality and Safety in Health Care 2007; 16: 271-278.
98. Berg M. Patient care information systems and health care work: a sociotechnical
approach. Int J Med Inform 1999; 55: 87-101.
99. DoH. Project Review: Objective evaluation. Guidance for NHS managers on
evaluating information systems projects. Leeds: NHS Executive, Information
Management Group; 1996.
100. Donabedian A. The quality of medical care - methods for assessing and monitoring
quality of care for research and for quality assurance programs. Science, Technology
and Human Values 1978;200:856-864.
101. Donabedian A. Evaluating the quality of medical care. Millbank Memorial Fund
1966;44(3):166-203.
102. Kibble SL, Kendray JC. Cost analysis of supplying monitored dosage systems to
residential homes from a community pharmacy. Journal of Pharmacy and
Pharmacology 1996; 48 (Suppl 2): 11.
103. Church C, Smith J. How stable are medicines moved from original packs into
compliance aids? Pharmaceutical Journal 2006; 276: 75-76.
104. Annett J, Duncan KD, StammersR.B, Gary MJ. 1971. Task Analysis. London: HMSO,
Training Information Paper No. 6.
105. Stammers RB, Carey MS, Astley JA. 1990. Task Analysis. In: Evaluation of Human
Work ED, Wilson JR, Corlett EN. 1990. Taylor & Francis. Chapter 6, 134 – 160.
106. Pepper GA, Towsley GL. 2007. Medication errors in nursing homes: Incidence and
reduction strategies. J. of Pharm. Finance, Economics & Policy. Vol. 16(1).
107. Castle N. & Engberg J. 2007. The Influence of staffing characteristics on Quality of
Care in Nursing Homes. Health Services Research. 42 (5), pp, 1822-1847.
108. Christie B , Scane R, Collyer J. Evaluation of human–computer interaction at the user
interface to advanced IT systems. In: J.R. Wilson and E.N. Corlett, Editors, Evaluation
of Human Work (Second ed), Taylor & Francis, London (1995), pp. 310–356.
109. Embrey DE. 1986. SHERPA: a systematic human error reduction and prediction
approach. Paper presented at the International Topical Meeting on Advances in
Human Factors in Nuclear Power Systems. Knoxville, TE.
218
110. NHS 2005. A guide to the national programme for information technology. NHS
corporate brochure, April 2005.
111. Humber M. 2004. National programme for information technology. Article in: BMJ,
328; 1145 – 1146.
112. BMA, 2004. BMA calls for greater involvement in national programme for information
technology. Press release, 29th April 2004. www.bma.org.
113. BMA, 2006. BMA comment on the National Audit Office report - The National
Programme for IT in the NHS. Press release, 16th June 2006. www.bma.org.
114. National Audit Office, 2006. Department of Health: The National Programme for IT in
the NHS. 16/06/2006. HC 1173 2005-2006. ISBN: 0102938288.
115. QinetiQ, 2005. NHS Connecting for Health, Process Capability Appraisal.
QinetiQ/D&TS/CS/CR050700, 28th April 2005.
116. BS ISO/IEC 15288:2002 Systems Engineering – System lifecycle processes.
117. BS ISO/IEC 15504-2:2003 Information Technology – Process Assessment – Part 2:
Performing an Assessment.
118. BS ISO/IEC 15504-4:2004 Information Technology – Process Assessment – Part 4:
Guidance on use for Process Improvement and Process Capability Determination.
119. Lyndoch Warrnambool Inc. 2005. Wireless Care Management System. Australian
Government publication, December 2005. www.health.gov.au
120. Perkins D, Burns P, Farrelly T. 2005. The introduction of electronic prescribing in
residential aged care facilities. Centre for Equity and Primary Health Research in the
Illawarra and Shoalhaven (CEPHRIS), University of New South Wales.
www.health.gov.au
121. Ingram D, Beale T, Heard S, Kalra D, Lloyd D, Schloeffel P. 2006. Introducing
openEHR. The openEHR Foundation, 2nd Jan 2006.
122. Health Management Technology, 2006. Electronic Medical Records. Industry Watch.
March 2006 Issue, Health Management Technology. Nelson Publishing Inc.
123. Blair R. 2006. Pleasantly Plastic. Health Management Technology, April 2006. Nelson
Publishing Inc.
124. Shah SDH et al. A survey of prescription errors in general practice Pharmaceutical
Journal, 2001; 267: 860 -862.
219
125. Ridge KW, Jenkins DB, Noyce PR, Barber ND. Medication errors during hospital drug
rounds. Qual Health Care. 4:240-243, 1995..
126. Dean BS, Allan EL, Barber ND, Barker KN. Comparison of medication errors in an
American and a British Hospital. Am J Health Syst Pharm. 52:2543-2549, 1995.
127. Gethins B. Wise up to medication errors. Pharmacy in Practice 6:323-328, 1996.
128. Ho CYW, Dean BS, Barber ND. When do medication administration errors happen to
hospital inpatients? International Journal of Pharmacy Practice. 5:91-96, 1997.
129. Cavell GF, Hughes DK. Does computerised prescribing improve the accuracy of drug
administration? Pharmaceutical Journal. 259:782-784, 1997..
130. Ogden DA, Kinnear M, McArthur DM. A quantitative and qualitative evaluation of
medication errors in hospital inpatients. Pharmaceutical Journal 259:R19, 1997.
131. Taxis K, Dean BS, Barber ND. Hospital drug distribution systems in the UK and
Germany – a study of medication errors. Pharm World Sci. 21:25-31, 1999.
132. Horne R, Weinman J, Barber N et al. Concordance, Adherence and Compliance in
Medicine Taking – Report for the National Co-ordinating Centre for NHS Service
Delivery and Organisation Research and Development.
133. Clifford S, Barber N, Horne R. Understanding different beliefs held by adherers,
unintentional nonadherers, and intentional nonadherers: Application of the Necessity–
Concerns Framework . Journal of Psychosomatic Research , Vol64 , Issue 1 , Pages
41-46 S.
134. Morris CJ, Rodgers S, Hammersley VS, Avery AJ, Cantrill JA. Indicators for
preventable drug related morbidity: application in preimary care. Qual.Saf. Health
Care. Jun 2004; 13:181-185.
135. Primohamed M, James S, Meakin S, Green C, Scott AK, Walley T, J, Farrar K, Park
KB, Breckenridge AM. Adverse drug reactions as cause of admission to hospital:
prospective analysis of 18 820 patients. BMJ 2004; 329: 15-19.
136. Barker KN, Heller WN, Brennan JJ et al. The development of a unit dose dispensing
system. Am J Hosp Pharm 1964; 21:609-25.
137. Cina JL, Gandhi TK, Churchill W, Franikos J, McCrea M, Mitton P et al. How many
hospital pharmacy medication dispensing errors go undetected? J Qual Patient Saf.
2006;32:73-80.
138. Duggan C, Bates I, Hough J. Discrepancies in prescribing. Where do they occur? PJ
1996; 256: 65-67.
220
139. Duggan C, Feldman R, Hough J, et al. Reducing adverse prescribing discrepancies
following hospital discharge IJPP 1998; 6: 77-82..
140. Smith L, McGowan L, Moss-Barclay C, et al. An investigation of hospital generated
pharmaceutical care when patients are discharged from hospital. Br J Clin Pharmacol
1997;44:163-165.
141. Pickrell L, Duggan C, Dhillon S. From hospital admission to discharge: an exploratory
study to evaluate seamless care. PJ 2001; 267: 650-653.
142. DoH. The white paper on Pharmacy Building on Strengths – delivering the future.
London TSO 2008.
143. Patterson, S.P., Hughes, C.M., Lapane, K.L., “Assessment of a United States
Pharmaceutical Care Model for Nursing Homes in the United Kingdom,” Pharmacy
World and Science 2007; 29: 517–25.
144. Franklin BD, O’Grady K, Voncina L, Popoola J and Jacklin A (2008). An evaluation of
two automated dispensing machines in a UK hospital pharmacy. International Journal
of Pharmacy Practice. 16: 47-53.
145. Franklin BD, O’grady K. Dispensing errors in community pharmacy: frequency, clinical
significance and potential impact of authentication at the point of dispensing.
International Journal of Pharmacy Practice. 2007; 15: 273-281.
1
Appendix A
Sample Size
We approached the sample size calculation with the goals of providing sufficient
precision to allow a meaningful estimate of the prevalence of medication errors, and
allowing future researchers sufficient information (including ICC) to calculate
sample sizes for intervention studies. However we did not wish to be over precise,
thereby using resources which could be spent on understanding the causes and
consequences of errors, and developing solutions. We believe we achieved a suitable
balance.
In our experience the major sources of variation in medication error will be the GP
and the home, or in other words we would expect clustering of errors because
individual GPs or homes will be more likely to create errors. Thus, as the GP is
linked to the home, we decided to study a large number of homes to get a realistic
estimate of the prevalence of the various types of medication error.
We powered the study on the prevalence of prescribing errors, as they are the
commonest cause of harm 18. We assumed a mean of 7 prescribed items per patient,
based on our own experience 10 and the means of four other UK studies 9;17;19;20. In
addition to the clustering effect of GPs/homes, we anticipated a further clustering
effect of errors within repeat prescriptions on patients. Ideally, we would have made
use of estimates of the ICC at the home level and the patient level in our power
calculations. However, the literature does not provide directly relevant ICCs. The
closest work, by Oborne et al 21, using prescribing indicators, found ICCs ranged
from 0.027‐0.335, which we bore in mind in choosing parameters in the power
calculations below.
We considered the home to be a principal source of variability, followed by GPs used
by the home. Given that our previous study showed only 50% of homes and 40%of
patients could be recruited, other sources of bias were ignored.
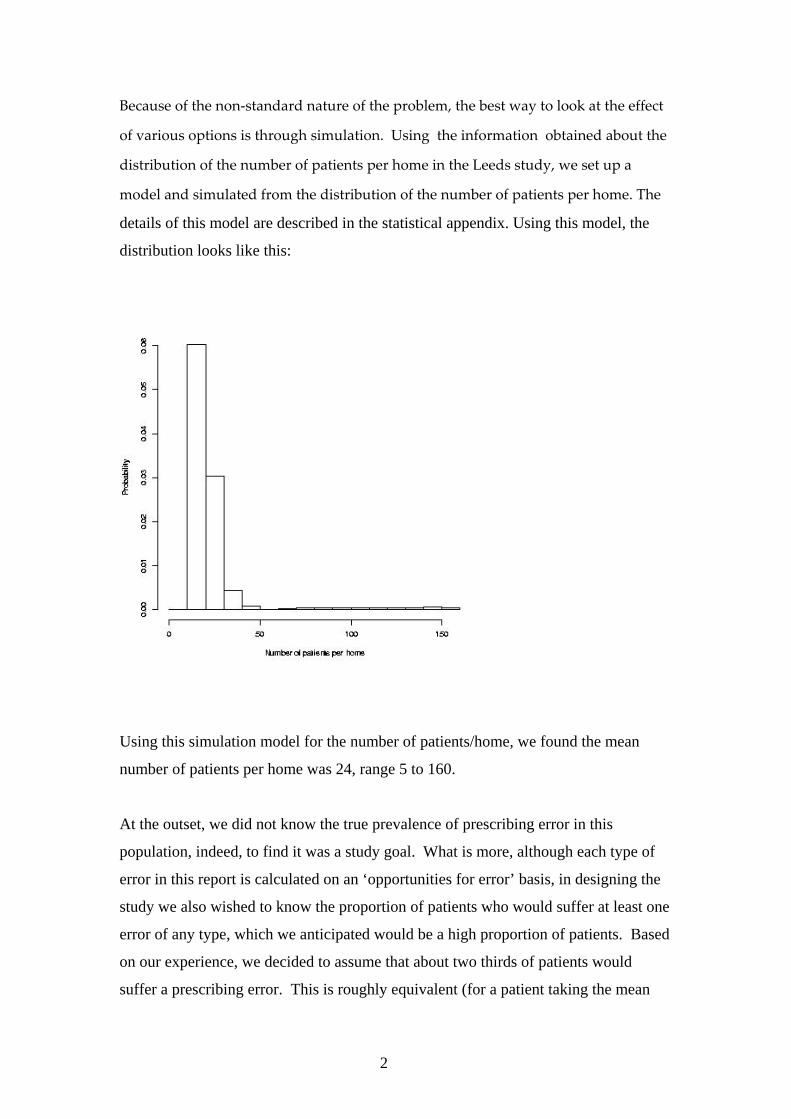
2
Because of the non‐standard nature of the problem, the best way to look at the effect
of various options is through simulation. Using the information obtained about the
distribution of the number of patients per home in the Leeds study, we set up a
model and simulated from the distribution of the number of patients per home. The
details of this model are described in the statistical appendix. Using this model, the
distribution looks like this:
Using this simulation model for the number of patients/home, we found the mean
number of patients per home was 24, range 5 to 160.
At the outset, we did not know the true prevalence of prescribing error in this
population, indeed, to find it was a study goal. What is more, although each type of
error in this report is calculated on an ‘opportunities for error’ basis, in designing the
study we also wished to know the proportion of patients who would suffer at least one
error of any type, which we anticipated would be a high proportion of patients. Based
on our experience, we decided to assume that about two thirds of patients would
suffer a prescribing error. This is roughly equivalent (for a patient taking the mean
3
value of 7 medicines) to a 10% chance that any one prescribed item contains a
prescribing error.
As described in the original application, we decided to sample homes, using the
beds/home distribution above, and we sought to have enough homes and patients in
our study to estimate an error running at a true rate of 10% per prescription item
written, with a 95% confidence interval of (estimated rate) +/- X %. The table below
gives the X that we expected to see, given the number of homes and average number
of patients consenting to be sampled per home.
The values in the table are estimated using a combination of established formulae for
clustered data and simulation, as described in the statistical appendix. We set the
variability of error rates between homes to be +/- 6%, and the patient level ICC for the
clustering of prescription errors to be 0.17. These were expected to be plausible, but
on the conservative side, bearing in mind (i) the tendency for clustered studies to
subsequently turn out to be underpowered and (ii) the sensitivity of the calculations to
the patient level ICC.
Number of patients per home
Number of homes 2 [i.e. if ~10%
consent]
3 [i.e. if ~15%
consent]
4 [i.e. if ~20%
consent]
50 3.1 2.6 2.3
100 2.2 1.9 1.6
150 1.8 1.5 1.4
Number of patients per home
Number of homes 6 [i.e. if ~27%
consent]
8 [i.e. if ~36%
consent]
50 2.04 1.87
80 1.62 1.47
100 1.47 1.33
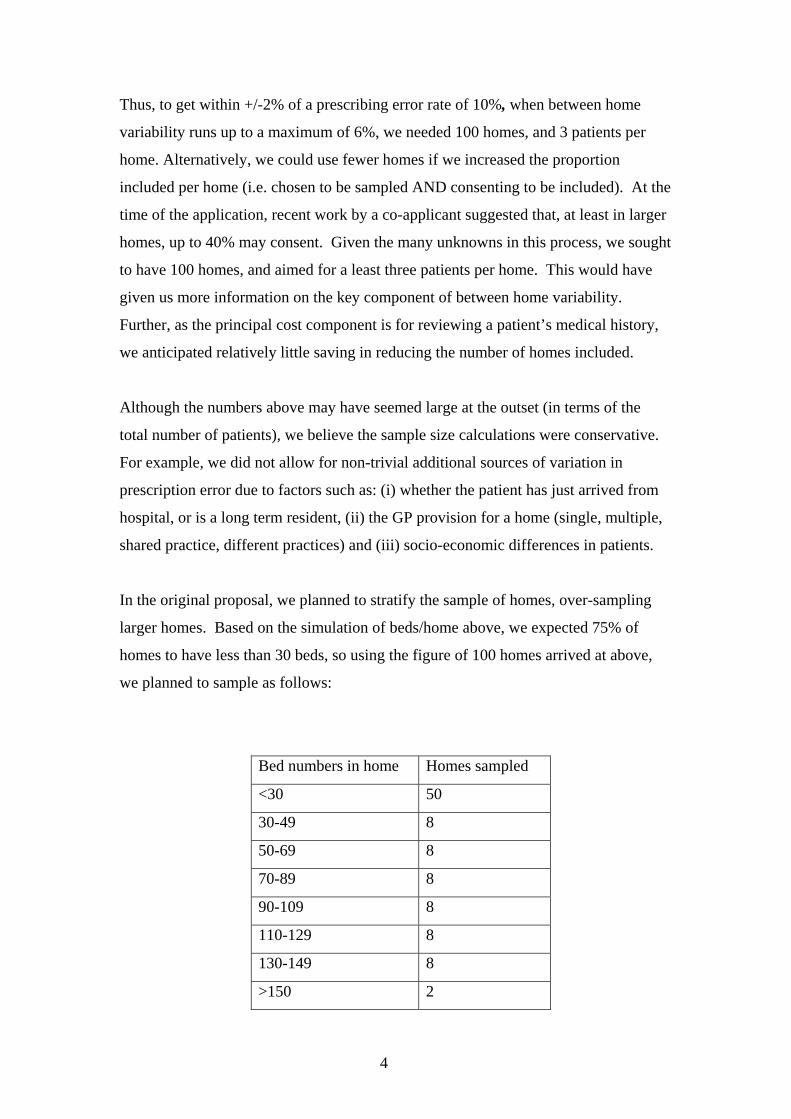
4
Thus, to get within +/-2% of a prescribing error rate of 10%, when between home
variability runs up to a maximum of 6%, we needed 100 homes, and 3 patients per
home. Alternatively, we could use fewer homes if we increased the proportion
included per home (i.e. chosen to be sampled AND consenting to be included). At the
time of the application, recent work by a co-applicant suggested that, at least in larger
homes, up to 40% may consent. Given the many unknowns in this process, we sought
to have 100 homes, and aimed for a least three patients per home. This would have
given us more information on the key component of between home variability.
Further, as the principal cost component is for reviewing a patient’s medical history,
we anticipated relatively little saving in reducing the number of homes included.
Although the numbers above may have seemed large at the outset (in terms of the
total number of patients), we believe the sample size calculations were conservative.
For example, we did not allow for non-trivial additional sources of variation in
prescription error due to factors such as: (i) whether the patient has just arrived from
hospital, or is a long term resident, (ii) the GP provision for a home (single, multiple,
shared practice, different practices) and (iii) socio-economic differences in patients.
In the original proposal, we planned to stratify the sample of homes, over-sampling
larger homes. Based on the simulation of beds/home above, we expected 75% of
homes to have less than 30 beds, so using the figure of 100 homes arrived at above,
we planned to sample as follows:
Bed numbers in home Homes sampled
<30 50
30-49 8
50-69 8
70-89 8
90-109 8
110-129 8
130-149 8
>150 2
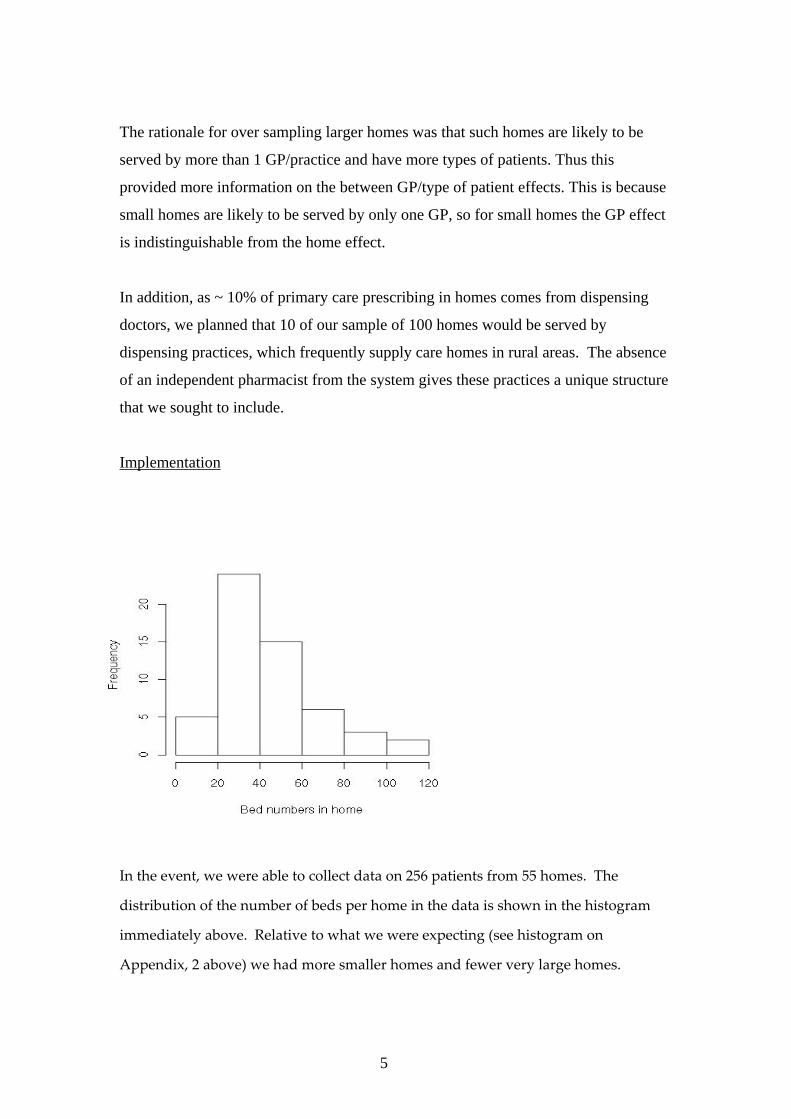
5
The rationale for over sampling larger homes was that such homes are likely to be
served by more than 1 GP/practice and have more types of patients. Thus this
provided more information on the between GP/type of patient effects. This is because
small homes are likely to be served by only one GP, so for small homes the GP effect
is indistinguishable from the home effect.
In addition, as ~ 10% of primary care prescribing in homes comes from dispensing
doctors, we planned that 10 of our sample of 100 homes would be served by
dispensing practices, which frequently supply care homes in rural areas. The absence
of an independent pharmacist from the system gives these practices a unique structure
that we sought to include.
Implementation
In the event, we were able to collect data on 256 patients from 55 homes. The
distribution of the number of beds per home in the data is shown in the histogram
immediately above. Relative to what we were expecting (see histogram on
Appendix, 2 above) we had more smaller homes and fewer very large homes.
6
This reflects our stratified sampling strategy. However, it is important to note that
we were only able to implement this strategy for approximately the first third of the
study. This was partly due to the trend towards fewer smaller homes and more
larger homes, which continued during the course of this study. Thus we could no
longer follow our initial plan. Nevertheless we continued to try and include a
variety of home sizes.
In addition, we were pleased that the consent rate was relatively high. Thus we were
able to recruit an average of 4.7 (median 5) patients per home. Referring back to the
table above, based on our initial assumptions, we would have expected this to give
us sampling errors of +/‐ between 2 and 2.3%. Thus, even though the typical number
of beds per home changed substantially during the study, a higher rate of consent
within homes than we originally expected meant that our power was only slightly
compromised.
Below, for completeness, we reproduce the details of the power calculations from the
original proposal.
Appendix: Details of power calculations [reproduced from initial proposal].
James Carpenter, July 7th 2004
1. Distribution of beds within homes
The distribution of homes is suspected of being bimodal, with modes around 20 and
80, and a long right tail. In consultation with co-applicants, I therefore decided to
simulate this using a mixture of normal and uniform distributions. The parameters of
these distributions were varied until typical datasets from this distribution agreed with
co-applicants experience and the limited available literature.
Specifically, for the power calculations, the mixture distribution had three
components: I) N(20,2), II) N(30,8), and III) uniform(60,160), with respective
weights 0.85, 0.11 and 0.04.
7
This generated frequency distribution is shown in the text.
2. Power calculations
Each entry in the table in the main application was based on the average of 20
simulations. Broadly, each simulation drew data from a multilevel structure, with two
levels (homes and patients), then reduced the number of patients to allow for those
who did not consent. A multilevel logistic model was then fitted to the simulated data,
with a component of variance for home and a constant, which estimates the logit
(prescription error) probability. The 95% confidence interval for this constant term
was back transformed, and its length divided by 2 to give an estimate of the likely
variability in rates estimated from real data – i.e. the ‘+/- X %’ in the table in the main
application. Twenty such estimates were averaged to get the results presented in the
table in the main application.
Details of the simulation are as follows. The number of homes and the probability of a
patient in that home consenting were varied as shown in the margins of the table in
the main application. The distribution of beds per home was sampled using the model
in section 1 above. The underlying prescription error rate was set at 10% and the
maximum between home variability was set at ~6%. In other words the linear
predictor for the error rate in each home was: logit(0.1) + uj, where j indexes homes,
and uj ~ N(0,σ2), where σ = [logit(0.1 + 0.06) – logit(0.1-0.06)]/4.
Then, each ‘effective individual’ (see next paragraph) in a home had their response
(error yes/no) drawn from a binary distribution with home specific probability given
by the above (note that individuals correspond to beds in a home).
Using ‘effective individuals’ is a simple way of allowing for repeat prescriptions on
individuals without simulating a third level of data. We judge it is an acceptable
8
approximation given the other unknowns in the power calculation. ‘Effective
individuals’ are defined as follows. As, on average each patient would have 7
prescriptions, if the ICC is ρ, then, inverting the standard adjustment for clustering in
a randomised trial each patient contributes the equivalent of 7/(1 + (7-1) ρ)
independent, or ‘effective’ prescriptions. Taking ρ=0.17, a rough guide from the
literature, we therefore adjust for the intra-patient correlation in prescription error by
saying repeat prescriptions mean each patient contributes the equivalent of 7/(1 +
6*0.17) =3.5 ‘effective patients’ who each have only one prescription. We thus end up
with a simulated data set where instead of three levels, homes, patients, prescriptions,
we have two levels, homes and ‘effective’ number of patients per home (adjusted for
repeat prescriptions).
Lastly, we reduce the number of ‘effective’ patients per home using the various values
of the probability of consent as shown in the table in the application.
We then fit a two level multilevel model with a component of variance for homes to
the simulated data and back transform the estimated confidence interval for the error
rates. Dividing this by 2 gives an estimate of the ‘+/- X%’ value shown in the table.
As discussed in the first paragraph of this section, we repeat the whole
simulation/modelling routine above 20 times for each ‘no of patients per home’ / ‘no
of homes’ combination and report the average X value in the corresponding cell of the
table in the main application.
9
Appendix B Care Home Profile
Care Home Use of Medicines Study
CARE HOME PROFILE
Home ref number……………….
Date of profile…………………..
1) Brief description of home location:
Would you classify this as suburban? or rural? Approx miles from your local research base
2) Your first impressions of this home
AREA
LEEDs
LONDon
CAMBridge
PCT Bradford City Bradford North Bradford South Calderdale Craven Harrogate & Rural
Ealing Huntingdon Lambeth Lewisham Southwark
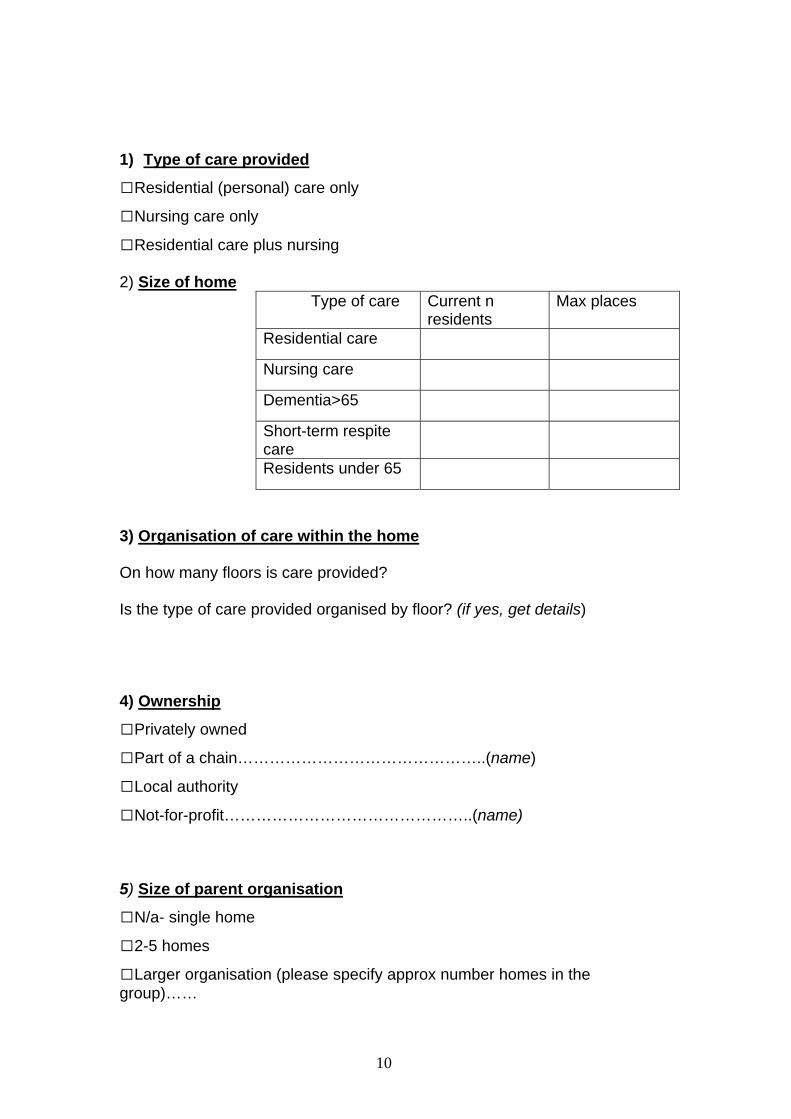
10
1) Type of care provided
□Residential (personal) care only
□Nursing care only
□Residential care plus nursing 2) Size of home
Type of care Current n residents
Max places
Residential care
Nursing care
Dementia>65
Short-term respite care
Residents under 65
3) Organisation of care within the home On how many floors is care provided? Is the type of care provided organised by floor? (if yes, get details) 4) Ownership
□Privately owned
□Part of a chain………………………………………..(name)
□Local authority
□Not-for-profit………………………………………..(name) 5) Size of parent organisation
□N/a- single home
□2-5 homes
□Larger organisation (please specify approx number homes in the group)……

11
If a large organisation- how often do you have contact with your head office/area managers ?
6. Staffing
Approximately how many staff would be on duty on a typical day? Early shift Late shift Nights Team leaders
Care assistants
RGNs
Adaptation (overseas) nurses
Others (please state)
7) Staff training What type of training is there for new staff on medicines procedures? What does training involve and who provides it What about on-going training (refreshers or updates) for staff ? What does this involve? Is it ad hoc or on a regular basis?
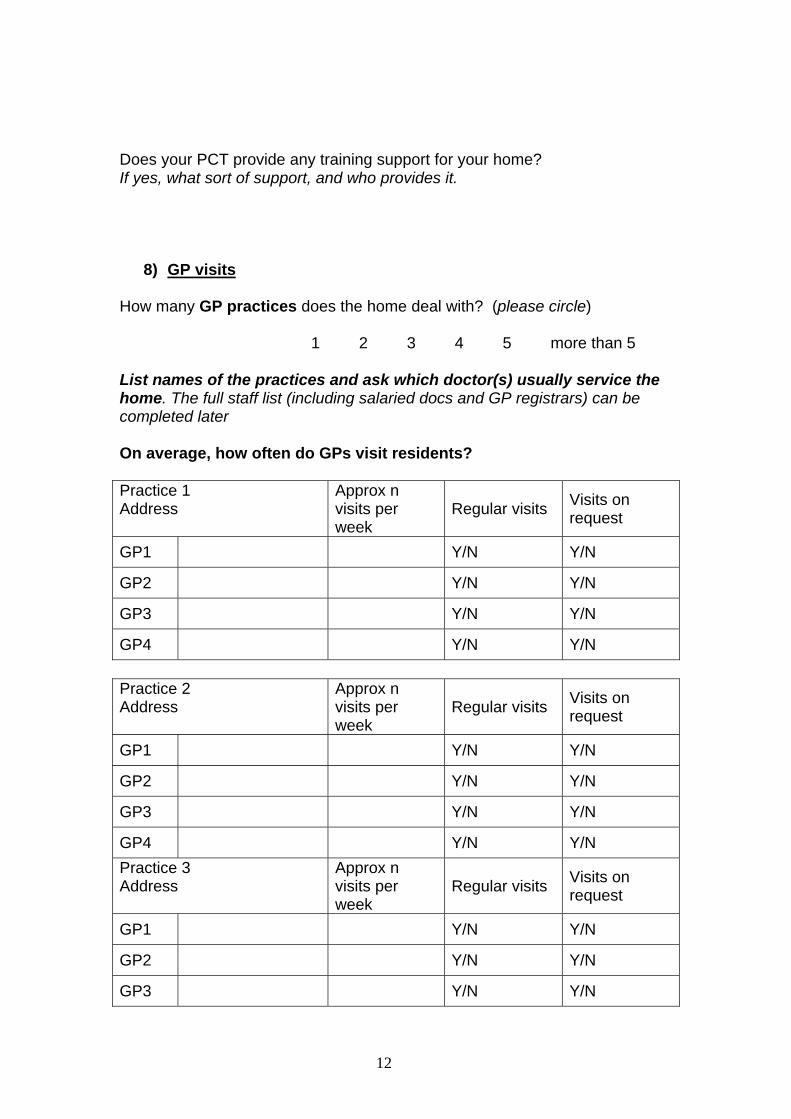
12
Does your PCT provide any training support for your home? If yes, what sort of support, and who provides it.
8) GP visits How many GP practices does the home deal with? (please circle) 1 2 3 4 5 more than 5 List names of the practices and ask which doctor(s) usually service the home. The full staff list (including salaried docs and GP registrars) can be completed later On average, how often do GPs visit residents? Practice 1 Address
Approx n visits per week
Regular visits Visits on request
GP1 Y/N Y/N
GP2 Y/N Y/N
GP3 Y/N Y/N
GP4 Y/N Y/N Practice 2 Address
Approx n visits per week
Regular visits Visits on request
GP1 Y/N Y/N
GP2 Y/N Y/N
GP3 Y/N Y/N
GP4 Y/N Y/N Practice 3 Address
Approx n visits per week
Regular visits Visits on request
GP1 Y/N Y/N
GP2 Y/N Y/N
GP3 Y/N Y/N
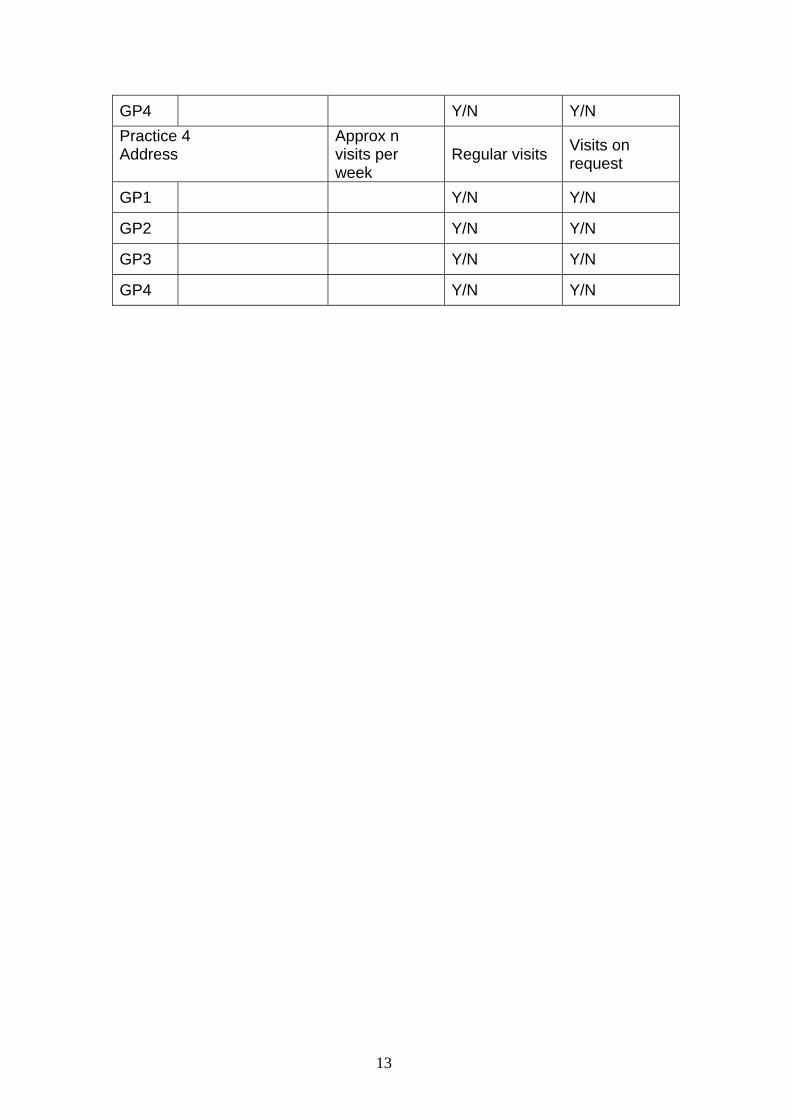
13
GP4 Y/N Y/N Practice 4 Address
Approx n visits per week
Regular visits Visits on request
GP1 Y/N Y/N
GP2 Y/N Y/N
GP3 Y/N Y/N
GP4 Y/N Y/N
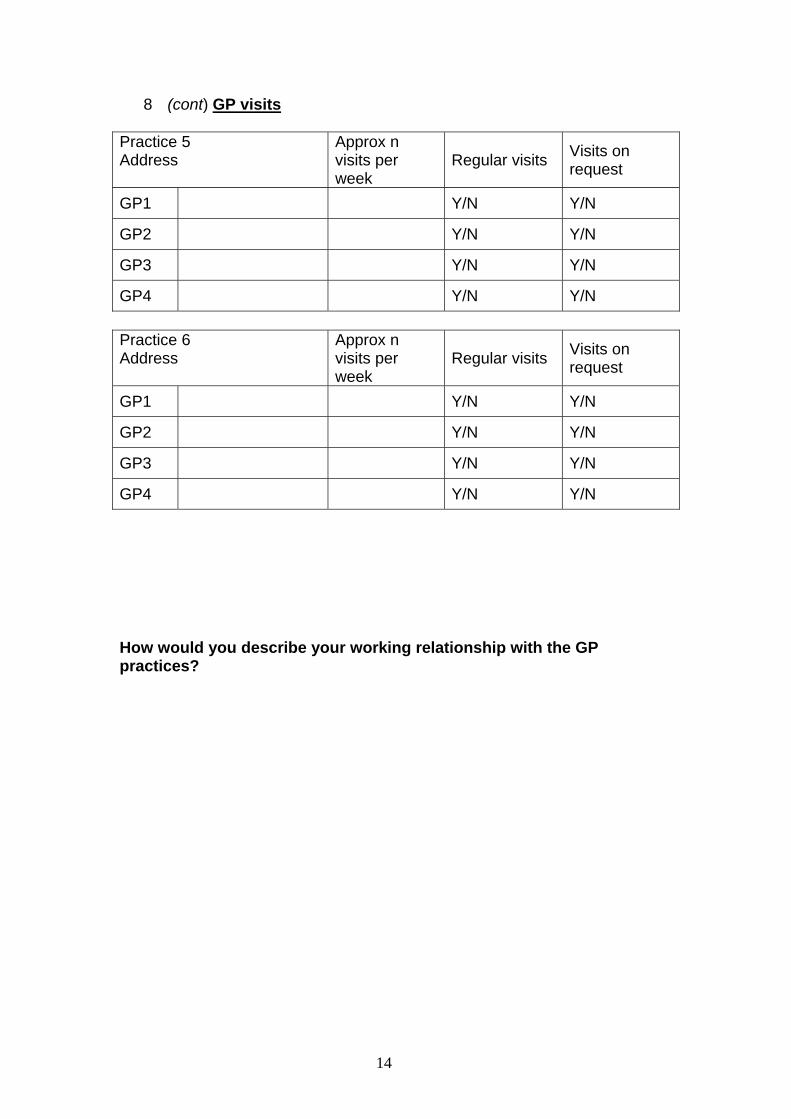
14
8 (cont) GP visits Practice 5 Address
Approx n visits per week
Regular visits Visits on request
GP1 Y/N Y/N
GP2 Y/N Y/N
GP3 Y/N Y/N
GP4 Y/N Y/N Practice 6 Address
Approx n visits per week
Regular visits Visits on request
GP1 Y/N Y/N
GP2 Y/N Y/N
GP3 Y/N Y/N
GP4 Y/N Y/N How would you describe your working relationship with the GP practices?
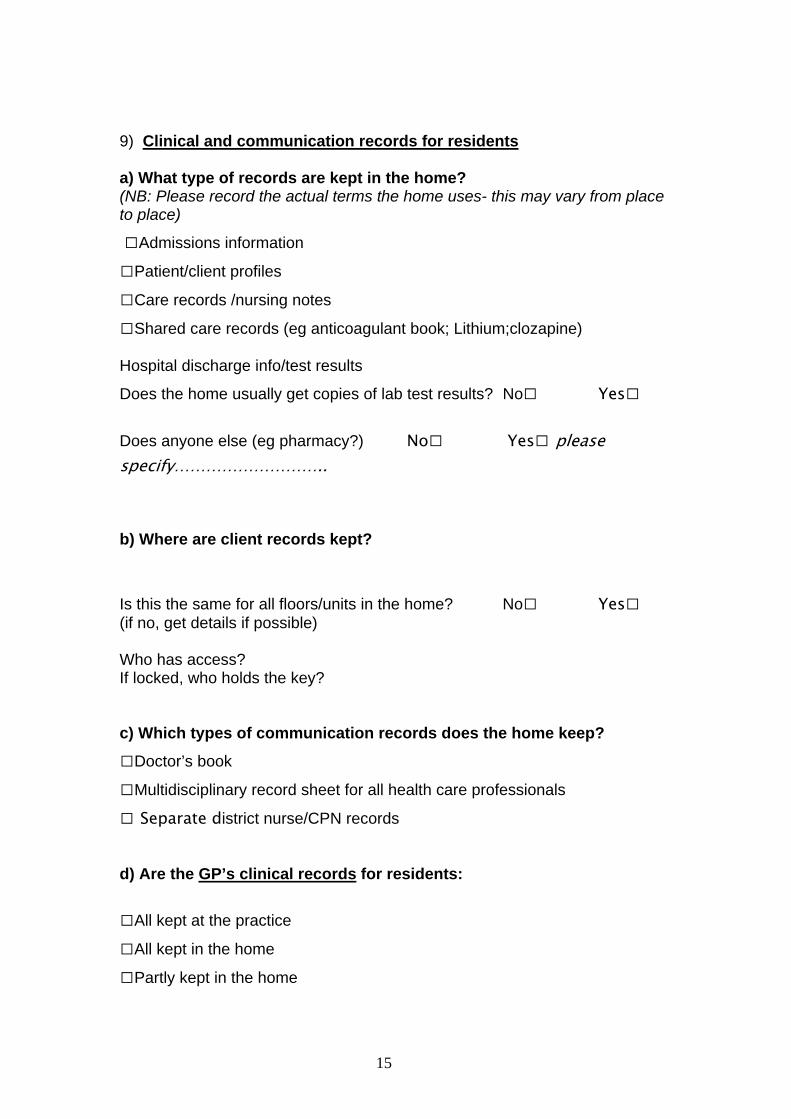
15
9) Clinical and communication records for residents a) What type of records are kept in the home? (NB: Please record the actual terms the home uses- this may vary from place to place)
□Admissions information
□Patient/client profiles
□Care records /nursing notes
□Shared care records (eg anticoagulant book; Lithium;clozapine) Hospital discharge info/test results
Does the home usually get copies of lab test results? No□ Yes□
Does anyone else (eg pharmacy?) No□ Yes□ please specify……………………….. b) Where are client records kept?
Is this the same for all floors/units in the home? No□ Yes□ (if no, get details if possible) Who has access? If locked, who holds the key? c) Which types of communication records does the home keep?
□Doctor’s book
□Multidisciplinary record sheet for all health care professionals
□ Separate district nurse/CPN records d) Are the GP’s clinical records for residents:
□All kept at the practice
□All kept in the home
□Partly kept in the home
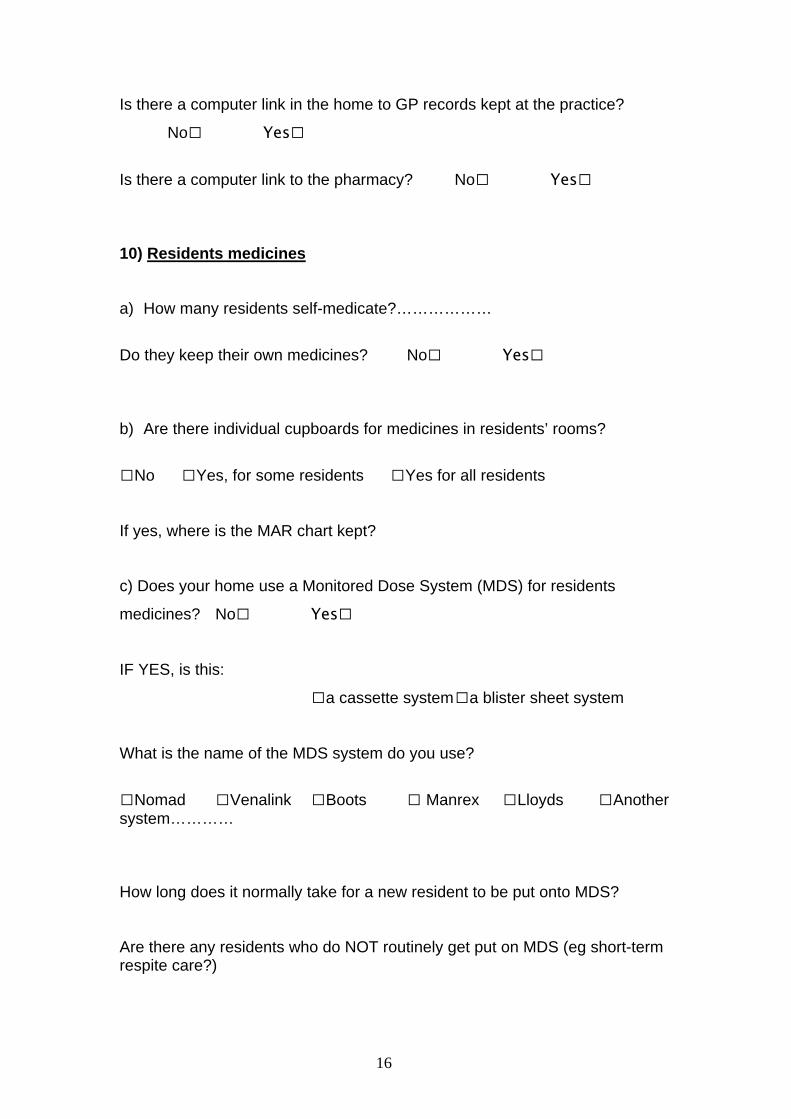
16
Is there a computer link in the home to GP records kept at the practice?
No□ Yes□
Is there a computer link to the pharmacy? No□ Yes□ 10) Residents medicines a) How many residents self-medicate?………………
Do they keep their own medicines? No□ Yes□ b) Are there individual cupboards for medicines in residents’ rooms?
□No □Yes, for some residents □Yes for all residents If yes, where is the MAR chart kept? c) Does your home use a Monitored Dose System (MDS) for residents
medicines? No□ Yes□ IF YES, is this:
□a cassette system □a blister sheet system What is the name of the MDS system do you use?
□Nomad □Venalink □Boots □ Manrex □Lloyds □Another system………… How long does it normally take for a new resident to be put onto MDS? Are there any residents who do NOT routinely get put on MDS (eg short-term respite care?)
17
10) continued Residents medicines c) Medicine administration records Does your home use the printed Medicine Administration Record (MAR)
charts No□ Yes□ supplied by the makers of the MDS system? If NO, how do you record medication administration? (get as much detail as possible) How long does one MAR chart last? Where are old charts stored? What other records do you keep of medicines administered to residents? (eg self-administration; district nurse records) d) GP prescription records Are the repeat prescriptions for all residents produced by the GP practice computer?
□Yes □No which practice(s) don’t use a computer?………………………………………………… Where is the repeat medicines list (the RHS of the FP10 form) kept?
□ In the home
□In the pharmacy
□Somewhere else (give details) …………
18
11) For the supply of repeat medication:
a) How are prescriptions for repeat medicines for residents usually ordered?
□Home orders direct from GP practice using repeat slip (RHS of prescription form)
□Home orders direct from GP practice using the MAR sheets
□Pharmacy orders from the GP practice after visiting/consulting with the home
□Pharmacy orders from GP practice without contacting the home
□Another method (please describe) If repeat medicines are ordered by the home, who usually does this?............................................ (What happens if he or she is on leave?)
Does the home keep photocopies of residents’ prescriptions? No□ Yes□
Do you have any residents on batch (repeatable) prescriptions? No□ Yes□ b) How do dispensed medicines usually reach the home?
□pharmacist delivers personally
□someone from the pharmacy delivers
□home staff collect from pharmacy
□Another arrangement (please describe) c) What time of day are dispensed medicines usually delivered? How are dispensed medicines checked on delivery? Who usually does this, and when? Are records routinely kept of discrepancies? (eg a pharmacy “error book”?)
No□ Yes□
19
12) For new or changed medicines
What happens if there is an urgent change or addition to a resident’s medication? Please tick all that apply
□Home faxes script to usual pharmacy
□GP contacts usual pharmacy with script
□Request telephoned to usual pharmacy
□Prescription taken to nearest pharmacy
□Another arrangement (please describe) What happens if there is an urgent change or addition to a resident’s medication outside normal pharmacy opening hours?
20
13) Supplying pharmacy
How many pharmacies does the home use on a regular basis to obtain medication for residents? (List names and complete other details later) Pharmacy name Address Postcode Approx miles
from home
How often do you have telephone or face-to-face contact with the pharmacy about residents’ medication? Who do usually speak to? How would you describe your working relationship with that person? How often does the pharmacist visit the home?
□ Most days
□Once a week
□Once a month
□Less often than that
□Never visits What does he or she do when they visit? (check storage etc? or review medication?)

21
Is there anything else that you would like to tell us?
Thanks and close
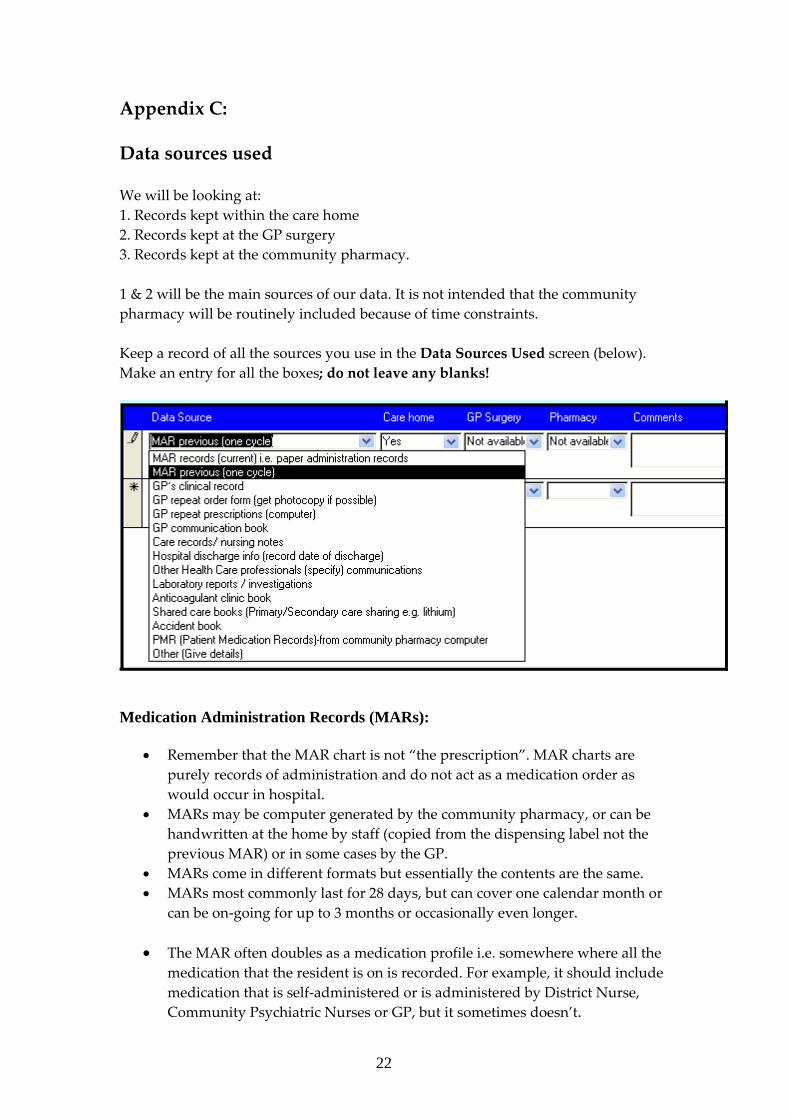
22
Appendix C: Data sources used We will be looking at: 1. Records kept within the care home 2. Records kept at the GP surgery 3. Records kept at the community pharmacy. 1 & 2 will be the main sources of our data. It is not intended that the community pharmacy will be routinely included because of time constraints. Keep a record of all the sources you use in the Data Sources Used screen (below). Make an entry for all the boxes; do not leave any blanks!
Medication Administration Records (MARs):
• Remember that the MAR chart is not “the prescription”. MAR charts are purely records of administration and do not act as a medication order as would occur in hospital.
• MARs may be computer generated by the community pharmacy, or can be handwritten at the home by staff (copied from the dispensing label not the previous MAR) or in some cases by the GP.
• MARs come in different formats but essentially the contents are the same. • MARs most commonly last for 28 days, but can cover one calendar month or
can be on‐going for up to 3 months or occasionally even longer.
• The MAR often doubles as a medication profile i.e. somewhere where all the medication that the resident is on is recorded. For example, it should include medication that is self‐administered or is administered by District Nurse, Community Psychiatric Nurses or GP, but it sometimes doesn’t.
23
• It is worth asking to see the medication profile or asking if they have any other records of medication being administered or taken elsewhere.
Previous MAR:
• It is very important that the previous MAR is looked at and compared with the medications on the current MAR. When changes occur mid‐cycle it is on the MAR where it would be recorded, and if medicines are changed close to the end of the cycle, after the request has been put in for the repeats, it is possible that the change may not be carried forward.
• The home must keep MARs for at least 3 years, but sometimes they are not very easy to find. They could be rolled up and put in a box to await sorting with many other previous MARs or kept in with the resident’s clinical or care history.
• The old MARs may be stored by resident or by floor/unit or by home. The GP’s clinical record:
• May be computer based, paper based or a combination of both. o It may be kept entirely in the home, partly in the home or entirely at
the GP practice. o Some homes may have a computer link to residents’ clinical records at
the practice so prescriptions may be generated in the home and signed by the GP during a visit.
o The pharmacy may have a computer terminal from which all the prescriptions are generated.
• The records in the home may be split in different places‐ make a point of asking for all GP records that the doctor may access e.g. communication book, repeat prescription request slips/book, care plans, clinical records, admission information
o The clinical records may be locked away in the home and sometimes only the GP has a key, so you need to ask if anything is locked away.
• Note that different floors/units in the same care home may have different ways of storing information and can also use different systems for ordering, administering etc.
• Different homes use different terminology for clinical records. • In the GP surgery records may be entirely on computer or partly in paper.
Some GPs may only record repeat prescriptions on the computer, using FP10s for all acute medication and associated medical notes; this may be in Lloyd George envelopes at the surgery or at the care home or both.
Residents’ repeat prescriptions: This refers to the medications that are in the repeat list for that resident on the GP’s computer.
24
• There are many different GP computer systems in use o Some will have repeat and acute medications in the same window o Some systems have separate windows for repeat and acute medicines o GPs vary in how they categorise medicines‐ some will have all
medicines as acutes so only they can reauthorise them, others have all medicines, including antibiotics, authorised for repeats.
• The actual prescription may be available in the home either as the original or as a photocopy.
• If the actual prescription is not available the repeat section of the FP10 might
be. o Sometimes the repeat section is kept at the pharmacy. o Note that some homes may reorder their prescriptions using a copy of
the Medication Administration Record (MAR) instead of the computer generated repeat slip.
If possible obtain a photocopy of the prescription/s or repeat slip/s:
• It is possible that some residents have had their medications put on “Repeatable Prescriptions” in line with repeat dispensing guidelines. In this case the batch issues may be either at the care home or at the pharmacy, but the original repeatable prescription will always be kept at the pharmacy. This may become more common as the new Pharmacy Contract becomes fully implemented, and is probably more likely to be used for residential care residents than nursing care residents.
GP communication book:
• It’s usually worth asking if you can see this; most homes have a written method for communication and the doctor will often write comments in it following the visit.
• It should tell you when the resident has last seen the GP and what for. Care records/nursing notes/client profile:
• Different homes use different terminology for these records and they vary in how much information is stored in them.
• All homes have to keep a daily log of care‐ this may just refer to personal care but can also include relevant medical information.
• It should include reference to sleep and bowel activity where relevant, and this may be pertinent to the medication review.
Hospital discharge information (record date of discharge):
• These may be found in the surgery in either paper format or on the computer, either scanned in or the data entered from the original.
25
o In the surgery it may be a doctor or a receptionist entering details of discharge medications.
• The care home may be sent a copy of the results either from the GP or the hospital, but not all hospitals or GPs will do this.
• The pharmacy may also have a system set up so they receive a copy
Other Health Care Professionals’ (HCPs) communications:
• Homes vary in how visiting HCPs record their visits. Visiting HCPs can include District Nurses, Community Mental Health Teams, Specialist Nurses, Physiotherapists, Occupational Therapists, Speech and Language Therapists (SALT).
o Some homes have a record sheet in the care records on which all visiting HCPs record their comments, others will have separate records for each different one
o District Nurses and Community Psychiatric Nurses will often keep their own records which are not always available in the home, but staff are usually aware of what is being administered, so ask.
Laboratory reports/investigations:
• These may be found in the surgery in either paper format or on the computer, either scanned in or the data entered from the original. Some GPs are also sent lab reports direct to the computer from the hospital, but this does not necessarily include tests initiated by the hospital during inpatient stays.
• The care home may be sent a copy of the results either from the GP or the hospital, but not all hospitals or GPs will do this.
• The pharmacy may also have a system set up so they receive a copy. Anticoagulant clinic book:
• Often the dose on the GP records and on the dispensing labels and MARs will just have “as directed” as dose changes after INR checks rarely coincide with the issue of new prescriptions, so this book will be the source of up to date information.
• If there is a dose on the MAR it is always worth checking against this book as doses might not get updated on the MAR, which could be a source of error.
Other shared care books:
• This covers all communication means between primary and secondary care where responsibility for care and monitoring is shared e.g. lithium, clozapine, methotrexate, antidementia drugs etc.
26
Accident book:
• All homes must have an accident book • Referral to this may be relevant if the resident is at high risk of falls.
Patient Medication Records (PMR):
• These are the records kept by community pharmacists on what has been dispensed for each individual.
o The repeat medications and acute medications may be kept separately or it may just be a chronological record of everything dispensed.
o Many systems will generate the dispensing labels and the MAR from the same inputted information, but for some systems they are generated separately and discrepancies between them could be a source of error.
Other:
• Record here anything that doesn’t fit into the above. Use the comments boxes
in the Data Sources Used screen to record anything at all that may be relevant.
27
Appendix D
Development and validation of criteria to identify medication
monitoring errors in care home residents
Alldred, David Phillip Pharmacy Lecturer 1
Standage, Claire Parmacy Lecturer 1
Zermansky, Arnold Geoffrey Honorary Senior Research Fellow 1
Jesson, Barbara Research Clinical Pharmacist 2
Savage, Imogen Lecturer in Patient Safety 2
Franklin, Bryony Dean Director, Centre for Medication
Safety and Service Quality2,3
Barber, Nick Professor of Pharmacy Practice 2
Raynor, David Kenneth Professor of Pharmacy Practice 1
1 Pharmacy Practice and Medicines Management Group, School of Healthcare, Baines Wing,
University of Leeds, Leeds, West Yorkshire, UK, LS2 9UT
2 The School of Pharmacy, BMA House, Tavistock Square, University of London, London,
WC1H 9JP
3 Imperial College Healthcare NHS Trust, Du Cane Road, London W12 0HS
Corresponding/submitting author: David Phillip Alldred ([email protected])
Keywords: medication error, monitoring, primary care, care homes
28
What is already known about this subject?
• Care home residents are particularly susceptible to adverse drug events.
• Failure to adequately monitor drug therapy is associated with significant
morbidity.
• A validated definition and criteria for the identification of monitoring errors
in the care home setting has not been published.
What this study adds
• A definition and criteria for the identification of monitoring errors in care
home residents was validated.
• The definition and criteria are pragmatic and easily operationalised.
• The definition and criteria can be used in future research studies to determine
the prevalence and nature of monitoring errors in care homes
29
Summary
Aim
The identification of medication monitoring errors requires a validated definition.
This paper describes the development and validation of a definition which includes
criteria for specific drugs to determine whether a monitoring error has occurred in
the care home setting.
Setting
Criteria were developed for older people (aged 65 years or older) living in care
homes.
Methods
Criteria were developed by two clinical pharmacists using published guidelines. The
criteria were divided into those relating to initiation of therapy and maintenance
monitoring. The study steering group, made up of clinical pharmacists, a GP and
pharmacy academics, then reviewed the criteria and a consensus achieved. The
criteria were then reviewed by a sample of general practitioners (21) and clinical
pharmacists (11). The threshold for acceptance for each criterion was set at
agreement by 70% of all participants.
Results
The definition of a medication monitoring error was accepted as “when a prescribed
medicine is not monitored in the way which would be considered acceptable in
routine general practice. It includes the absence of tests being carried out at the
frequency listed in criteria for each drug, with tolerance of +50%.” Seventy percent
agreement was reached on all criteria for the initiation of therapy, except warfarin
30
(69%), and on all criteria for maintenance monitoring, except penicillamine (63%) and
potassium (63%).
Conclusions
To our knowledge, this is the first study to define a medication monitoring error, and
to determine and validate specific criteria to identify such errors in older people
living in care homes.
31
Introduction
Older people living in care homes are at a higher risk of medication error, and
resultant harm, than most other populations. This is for several reasons. Firstly,
older people are more susceptible to adverse drug events due to age‐related changes
in pharmacokinetics and pharmacodynamics [1]. Secondly, care home residents
have a high level of morbidity not only because of their age and frailty, but also
because poor health is usually the reason for being in residential care. They therefore
receive a greater number of medicines than their counterparts living in their own
homes, with a mean number of medicines of 5‐7 in the UK [2,3,4]. Thirdly, medicines
management in care homes is complex both in terms of the model of care and the
sheer numbers of people involved in the process. This further increases the risk of
error. The UK Government is committed to reducing medication errors [5,6].
There is a paucity of evidence and often disagreement amongst health care
professionals regarding how often, if at all, a particular medicine should be
monitored. Several national and local guidelines exist for the monitoring of
medication, however, they often differ in their recommendations [7,8,9,10].
Quality indicators for medication monitoring in vulnerable older people have been
published [11]. However, specific monitoring criteria were limited to
antidepressants, diuretics, angiotensin converting enzyme inhibitors (ACE
inhibitors) and warfarin, and other potentially harmful medicines were not included.
Gurwitz et al conducted a study of preventable adverse drug events in two US long‐
term care facilities and identified monitoring errors including inadequate laboratory
32
monitoring, a delayed response or failure to respond to signs or symptoms or
laboratory evidence of drug toxicity [12]. However, criteria to identify monitoring
errors for specific medicines were not reported.
There is evidence that medication monitoring in the care home setting is suboptimal.
In the study conducted by Gurwitz et al, four fifths of preventable adverse drug
events involved a monitoring error with ʺinadequate monitoringʺ and ʺfailure to act
on monitoringʺ predominating [12]. In a randomised controlled trial of pharmacist‐
led clinical medication review in UK care home residents, one fifth of interventions
were to conduct monitoring of medication and 14% of these resulted in a medication
change [13].
We intended to develop a definition and criteria that were pragmatic, easily
operationalised, and owned by practising general practitioners and clinical
pharmacists. It was not the intention to produce an exhaustive list of drugs that
required monitoring, rather to focus on the drugs most likely to be prescribed with
the potential for harm in the care home setting. The aim of this study was, therefore,
to define a monitoring error by developing and validating criteria to assess whether a
monitoring error had occurred in the care home setting. We intend that such criteria
can be utilised in future research studies to determine the prevalence and nature of
monitoring errors in the care home population.
Method
33
Research ethics approval was obtained from the Central Office for Research Ethics
Committees. A literature search was conducted using MEDLINE (May 2006) and
EMBASE (May 2006) using the search terms “medication error”, “drug monitoring”
and “monitoring error” to identify whether criteria for determining medication
monitoring errors had previously been published, or whether a monitoring error had
previously been defined. No generic definition of a monitoring error was identified.
A definition of a monitoring error was therefore developed and agreed by the study
steering group. Criteria were initially developed by two clinical pharmacists (DPA
and CS), using local and national guidelines for the monitoring of pharmacotherapy
[7,8,9,10]. The criteria developed were designed to reflect routine clinical practice
and be applicable to primary care prescribing for care home residents.
Firstly, the list of drugs for which a monitoring error would be included in the
definition was determined. This took into account the drugs included in the above
guidelines. Sixteen drugs or groups of drugs were deemed to have properties which
made monitoring necessary in the primary care setting (Table 1 and Table 2). The
criteria were split into two sections:
(a) monitoring following the initiation of therapy (8 drugs or groups of drugs).
(b) monitoring of maintenance therapy (all 16 drugs or groups of drugs);
The criteria for each drug were then agreed by experienced practitioners and
academics from the study steering group. These comprised four clinical pharmacists
(DPA, CS, BJ, BDF), a pharmacist lecturer in patient safety (IS), two professors of
34
pharmacy practice (NB, DKR) and one practising general practitioner / research
fellow (AZ).
To ensure external validity, the criteria were reviewed by a sample of GPs (21) and
clinical pharmacists with primary care experience (11) who were selected from the
Primary Care Pharmacy Network (5 pharmacists), from GP trainers (9 GPs) and from
a convenience sample (6 pharmacists, 12 GPs). The pharmacists and general
practitioners were e‐mailed the criteria in August 2006 and asked to indicate whether
they agreed or disagreed with each specific medication monitoring criterion and to
give comments where they disagreed. An overall consensus rate of 70% was deemed
sufficient to accept each criterion.
Results
The core definition of a monitoring error was agreed by the study steering group as:
“A monitoring error occurs when a prescribed medicine is not monitored in the way which
would be considered acceptable in routine general practice. It includes the absence of tests
being carried out at the frequency listed in the criteria, with tolerance of
+/‐50%. This means, for example, that if a drug requires liver function tests at 3 monthly
intervals, we would class as an error if a test has not been conducted within 18 weeks.” If a
patient refused to give consent for a test, then this would not constitute an error.
Table 1 shows GP, pharmacist and overall responses for monitoring following the
initiation of therapy. An overall agreement or 70% or more was obtained for all
drugs except warfarin (69%). One hundred percent of pharmacists agreed with the
35
suggested warfarin criterion but only 67% of GPs responded, with 52% of all GPs
agreeing. Therefore, warfarin was removed from the initiation of therapy criteria.
GP, pharmacist and overall responses for the monitoring of maintenance therapy are
shown in Table 2. An overall agreement of 70% or more was obtained for all but two
drugs; these were penicillamine and potassium supplements. Ninety one percent of
the pharmacists agreed with the suggested penicillamine criterion, but only 67% of
GPs gave a response, with only 48% of all GPs agreeing. Although 73% of the
pharmacists agreed with the potassium supplements criterion, only 57% of GPs did
so. Consequently, penicillamine and potassium supplements were removed from the
criteria.
The criterion for the maintenance monitoring of theophylline was to obtain a plasma
level when toxicity or lack of efficacy was suspected. It was decided within the study
steering group that for the purpose of identifying an error, it was neither reasonable
nor practical to include lack of efficacy in the criterion. As such, this part of the
criterion was removed.
Although consensus was reached for carbimazole and levothyroxine, it became
apparent that the monitoring specified on initiation was a pre‐requisite of the drug
being prescribed i.e. the test had to be done to establish a diagnosis. Consequently,
these three drugs were removed from the monitoring for initiation or dose changes.
The final agreed criteria are presented in Table 3.
36
Discussion
To our knowledge, this is the first study to develop a definition of a medication
monitoring error and to develop and validate drug‐specific criteria to identify
monitoring errors in the care home setting. The 50% tolerance for the frequency of
tests conducted was a pragmatic judgement based on what was deemed to be
reasonable and practical. Identifying patients who were technically in breach of the
criteria because they were, for example, a week late in having their blood test, would
not have been a reasonable reflection of routine clinical practice. If a test was not
conducted within the 50% leeway, it would be clearly and unequivocally outside the
recommendation and represent a significant breach of standards. The 70%
agreement level for acceptance of a criterion was also a pragmatic judgement.
Overall agreement was not reach for the monitoring of warfarin on initiation, despite
all the pharmacists agreeing. Only two thirds of the GPs responded to this criterion,
with just over half agreeing. On analysing the GPs’comments, it would appear that
agreement was not reached due to a lack of experience of initiating warfarin as this
was usually done in secondary care or by anticoagulant clinics. Overall consensus
was not obtained for the maintenance monitoring of penicillamine, although 91% of
pharmacists agreed. Only two thirds of GPs responded with just under half
agreeing. The reasons for GPs not agreeing were again due to a lack of experience of
the drug because it was prescribed infrequently or monitored by a specialist. Overall
agreement was not achieved for the maintenance monitoring of potassium
supplements, with nearly three quarters of pharmacists agreeing but only 57% of GPs
37
agreeing. Some disagreed because they felt patients should not be prescribed
potassium supplements long‐term and some disagreed because they advocated more
frequent monitoring. It was clear that the pharmacists were more likely to agree on
the criteria than the GPs. This may reflect that the pharmacists had greater
familiarity with the monitoring recommendations of drugs. It is also possible that
the GPs were less likely to agree due to the potential practical problems of
monitoring in this population, for example, difficulties in obtaining samples due to
refusal of consent or service restrictions.
Medicines are monitored for two main reasons, to evaluate their effectiveness and to
detect or anticipate harm. The majority of the validated criteria developed in this
study relate to the detection of medicine‐induced harm, for example, the monitoring
of full blood counts for azathioprine to identify neutropenia. However, harm can
also be caused by a lack of efficacy, for example, an increase risk of
thromboembolism due to underdosing with warfarin. A lack of efficacy may also be
due to poor adherence and this may be detected by monitoring. Errors in monitoring
can occur at several stages: (i) a failure to request a test (ii) a failure to undertake a
requested test (including a sample being obtained but no result reported) and (iii) a
failure to act upon a deranged result. Morris et al found that 37% of preventable
drug‐related morbidity was associated with a lack of monitoring of drugs, with over
three quarters of the events involving ACE inhibitors [14] It has been found that
medicine‐related harm accounts for 4.3% of preventable hospital admissions [15];
diuretics account for 16% of these and anticoagulants 8%. Reducing monitoring
38
errors for these medicines may potentially avoid iatrogenic disease and hospital
admissions.
The criteria validated in this study include a wider range of medicines than the
ACOVE quality indicators developed by Shekelle et al which were restricted to
antidepressants, diuretics, ACE inhibitors and warfarin [11]. Our criteria were
designed to reflect common prescribing patterns and clinical practice in the care
home setting, and were not designed to be exhaustive. Several potentially harmful
medicines, for example, ciclosporin were omitted from the criteria because it was felt
that these medicines would not be commonly prescribed in this population and
because monitoring is usually conducted in secondary care.
The sample of GPs and clinical pharmacists may not have been representative of the
whole population, however, the sample was geographically diverse and consisted of
practising experts. Another limitation is the fact that for most drugs there is not an
objective scientifically evidence‐based criterion for monitoring requirements, and
much recommended monitoring may be overcautious extrapolation from what is
known about the drug’s toxicity.
Such evidence about toxicity is rarely derived from studies of the very elderly or of
care home residents. In addition, it is often appropriate to increase monitoring in
situations where the patient is clinically unwell and such situations were not
considered in the criteria.
In summary, a pragmatic definition and criteria for the identification of monitoring
errors in the care home setting was validated and can be used in future to determine
39
the prevalence and nature of such errors in this setting. It is hoped that intervention
studies can then be conducted, and safer systems developed, to reduce the burden of
monitoring errors on care home residents and the healthcare system.
Acknowledgements
The study was funded by the Patient Safety Research Portfolio. We would like to
thank the general practitioners and pharmacists who took part in the study.
Competing interests
None declared.
References
1. Armour D, Cairns C. (editors). Medicines in the Elderly. London: The
Pharmaceutical Press 2002.
2. Furniss L, Burns A, Craig SKL, Scobie S, Cooke J, Faragher B. Effects of a
pharmacist’s medication review in nursing homes: randomised controlled
trial. Br J Psychiatry 2000; 176: 563‐7.
3. Oborne CA, Hooper R, Swift GC, Jackson SHD. Explicit, evidence‐based
criteria to assess the quality of prescribing to elderly nursing home residents.
Age Ageing 2003; 32; 102‐8
4. Zermansky AG, Alldred DP, Petty DR, Raynor DK, Freemantle N, Eastaugh J,
Bowie P. Clinical medication review by a pharmacist of elderly people living
in care homes‐‐randomised controlled trial. Age Ageing 2006; 35(6):586‐91.
40
5. Expert Group on Learning from Adverse Events in the NHS. An organisation
with a memory. 2000. London, Stationary Office.
6. Department of Health. Building a safer NHS for patients. 2001. London, Department
of Health.
7. British Medical Association and Royal Pharmaceutical Society of Great
Britain. British National Formulary 51 March 2006 ed. London.
8. Monitoring drug therapy. North West Drug Information Letter No.120. Sept
2002. Available at
http://www.ukmi.nhs.uk/newmaterial/html/docs/21100201.pdf Accessed 6th
December 2007.
9. Suggestions for Drug Monitoring in Adults in Primary Care: A collaboration
between London and South East Medicines Information Service and Croydon
Primary Care Trust. June 2006
10. Hinchingbrooke Hospital NHS Trust . Monitoring of Maintenance Therapy in
Primary Care. October 2005
41
11. Shekelle PG, MacLean CH, Morton SC, Wenger NS. Assessing care of
vulnerable elders: methods for developing quality indicators. Ann Intern
Med 2001; 135: 647‐52.
12. Gurwitz JH, Field TS, Judge J, Rochon P, Harrold LR, Cadoret C, Lee M,
White K, LaPrino J, Erramuspe‐Mainard J, DeFlorio M, Gavendo L, Auger J,
Bates DWGurwitz et al. The incidence of adverse drug events in two large
academic long‐term care facilities. Am J Med. 2005;118(3):251‐8.
13. Alldred DP, Zermansky AG, Petty DR, Raynor DK, Freemantle N, Eastaugh J,
Bowie P. Clinical medication review by a pharmacist of elderly people living
in care homes: pharmacist interventions. Int J Pharm Pract 2007; 13:93‐9.
14. Morris CJ, Rodgers S, Hammersley VS, Avery AJ and Cantrill JA. Indicators
for preventable drug‐related morbidity: applications in primary care. Qual
Saf Health Care 2004;13;181‐5
15. Howard RL, Avery AJ, Slavenburg S, Royal S, Pipe G, Lucassen P,
Pirmohamed M. Which drugs cause preventable admissions to hospital? A
systematic review. Br J Clin Pharmacol 2006
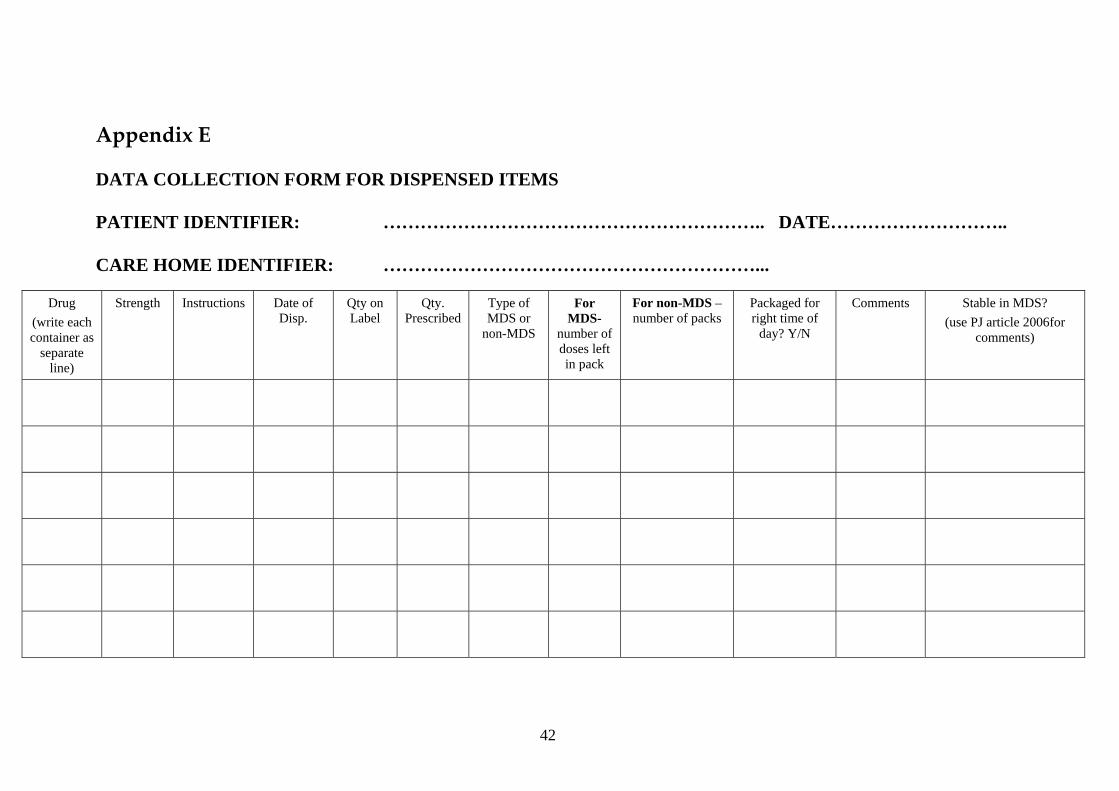
42
Appendix E DATA COLLECTION FORM FOR DISPENSED ITEMS PATIENT IDENTIFIER: …………………………………………………….. DATE……………………….. CARE HOME IDENTIFIER: ……………………………………………………...
Drug (write each container as
separate line)
Strength Instructions Date of Disp.
Qty on Label
Qty. Prescribed
Type of MDS or
non-MDS
For MDS-
number of doses left in pack
For non-MDS –number of packs
Packaged for right time of
day? Y/N
Comments Stable in MDS? (use PJ article 2006for
comments)
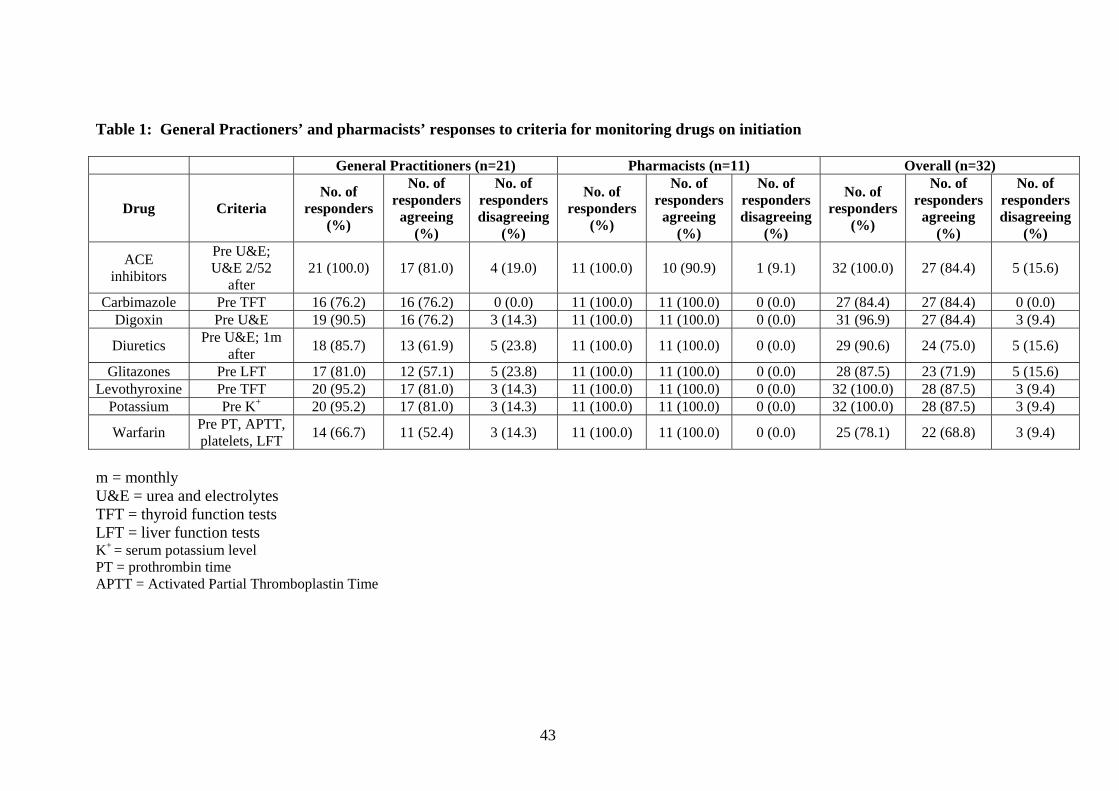
43
Table 1: General Practioners’ and pharmacists’ responses to criteria for monitoring drugs on initiation
General Practitioners (n=21) Pharmacists (n=11) Overall (n=32)
Drug Criteria No. of
responders (%)
No. of responders
agreeing (%)
No. of responders disagreeing
(%)
No. of responders
(%)
No. of responders
agreeing (%)
No. of responders disagreeing
(%)
No. of responders
(%)
No. of responders
agreeing (%)
No. of responders disagreeing
(%)
ACE inhibitors
Pre U&E; U&E 2/52
after 21 (100.0) 17 (81.0) 4 (19.0) 11 (100.0) 10 (90.9) 1 (9.1) 32 (100.0) 27 (84.4) 5 (15.6)
Carbimazole Pre TFT 16 (76.2) 16 (76.2) 0 (0.0) 11 (100.0) 11 (100.0) 0 (0.0) 27 (84.4) 27 (84.4) 0 (0.0) Digoxin Pre U&E 19 (90.5) 16 (76.2) 3 (14.3) 11 (100.0) 11 (100.0) 0 (0.0) 31 (96.9) 27 (84.4) 3 (9.4)
Diuretics Pre U&E; 1m after 18 (85.7) 13 (61.9) 5 (23.8) 11 (100.0) 11 (100.0) 0 (0.0) 29 (90.6) 24 (75.0) 5 (15.6)
Glitazones Pre LFT 17 (81.0) 12 (57.1) 5 (23.8) 11 (100.0) 11 (100.0) 0 (0.0) 28 (87.5) 23 (71.9) 5 (15.6) Levothyroxine Pre TFT 20 (95.2) 17 (81.0) 3 (14.3) 11 (100.0) 11 (100.0) 0 (0.0) 32 (100.0) 28 (87.5) 3 (9.4)
Potassium Pre K+ 20 (95.2) 17 (81.0) 3 (14.3) 11 (100.0) 11 (100.0) 0 (0.0) 32 (100.0) 28 (87.5) 3 (9.4)
Warfarin Pre PT, APTT, platelets, LFT 14 (66.7) 11 (52.4) 3 (14.3) 11 (100.0) 11 (100.0) 0 (0.0) 25 (78.1) 22 (68.8) 3 (9.4)
m = monthly U&E = urea and electrolytes TFT = thyroid function tests LFT = liver function tests K+ = serum potassium level PT = prothrombin time APTT = Activated Partial Thromboplastin Time
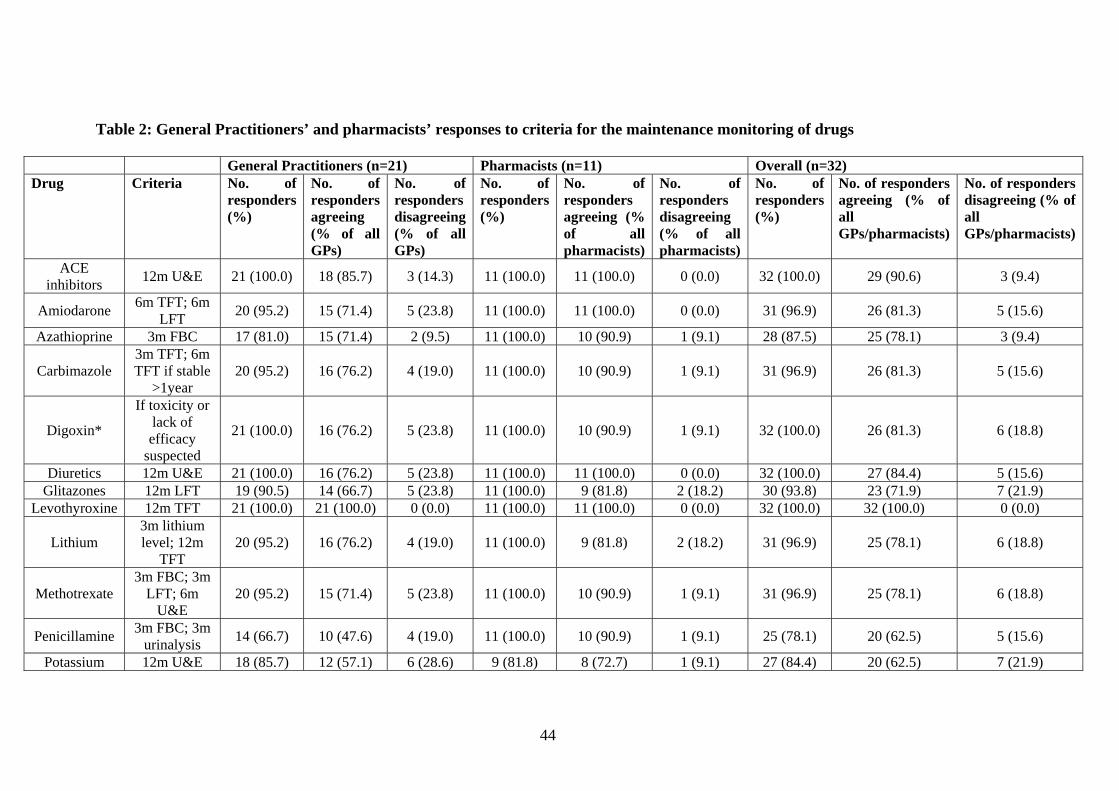
44
Table 2: General Practitioners’ and pharmacists’ responses to criteria for the maintenance monitoring of drugs
General Practitioners (n=21) Pharmacists (n=11) Overall (n=32) Drug Criteria No. of
responders (%)
No. of responders agreeing (% of all GPs)
No. of responders disagreeing (% of all GPs)
No. of responders (%)
No. of responders agreeing (% of all pharmacists)
No. of responders disagreeing (% of all pharmacists)
No. of responders (%)
No. of responders agreeing (% of all GPs/pharmacists)
No. of responders disagreeing (% of all GPs/pharmacists)
ACE inhibitors 12m U&E 21 (100.0) 18 (85.7) 3 (14.3) 11 (100.0) 11 (100.0) 0 (0.0) 32 (100.0) 29 (90.6) 3 (9.4)
Amiodarone 6m TFT; 6m LFT 20 (95.2) 15 (71.4) 5 (23.8) 11 (100.0) 11 (100.0) 0 (0.0) 31 (96.9) 26 (81.3) 5 (15.6)
Azathioprine 3m FBC 17 (81.0) 15 (71.4) 2 (9.5) 11 (100.0) 10 (90.9) 1 (9.1) 28 (87.5) 25 (78.1) 3 (9.4)
Carbimazole 3m TFT; 6m TFT if stable
>1year 20 (95.2) 16 (76.2) 4 (19.0) 11 (100.0) 10 (90.9) 1 (9.1) 31 (96.9) 26 (81.3) 5 (15.6)
Digoxin*
If toxicity or lack of efficacy
suspected
21 (100.0) 16 (76.2) 5 (23.8) 11 (100.0) 10 (90.9) 1 (9.1) 32 (100.0) 26 (81.3) 6 (18.8)
Diuretics 12m U&E 21 (100.0) 16 (76.2) 5 (23.8) 11 (100.0) 11 (100.0) 0 (0.0) 32 (100.0) 27 (84.4) 5 (15.6) Glitazones 12m LFT 19 (90.5) 14 (66.7) 5 (23.8) 11 (100.0) 9 (81.8) 2 (18.2) 30 (93.8) 23 (71.9) 7 (21.9)
Levothyroxine 12m TFT 21 (100.0) 21 (100.0) 0 (0.0) 11 (100.0) 11 (100.0) 0 (0.0) 32 (100.0) 32 (100.0) 0 (0.0)
Lithium 3m lithium level; 12m
TFT 20 (95.2) 16 (76.2) 4 (19.0) 11 (100.0) 9 (81.8) 2 (18.2) 31 (96.9) 25 (78.1) 6 (18.8)
Methotrexate 3m FBC; 3m
LFT; 6m U&E
20 (95.2) 15 (71.4) 5 (23.8) 11 (100.0) 10 (90.9) 1 (9.1) 31 (96.9) 25 (78.1) 6 (18.8)
Penicillamine 3m FBC; 3m urinalysis 14 (66.7) 10 (47.6) 4 (19.0) 11 (100.0) 10 (90.9) 1 (9.1) 25 (78.1) 20 (62.5) 5 (15.6)
Potassium 12m U&E 18 (85.7) 12 (57.1) 6 (28.6) 9 (81.8) 8 (72.7) 1 (9.1) 27 (84.4) 20 (62.5) 7 (21.9)
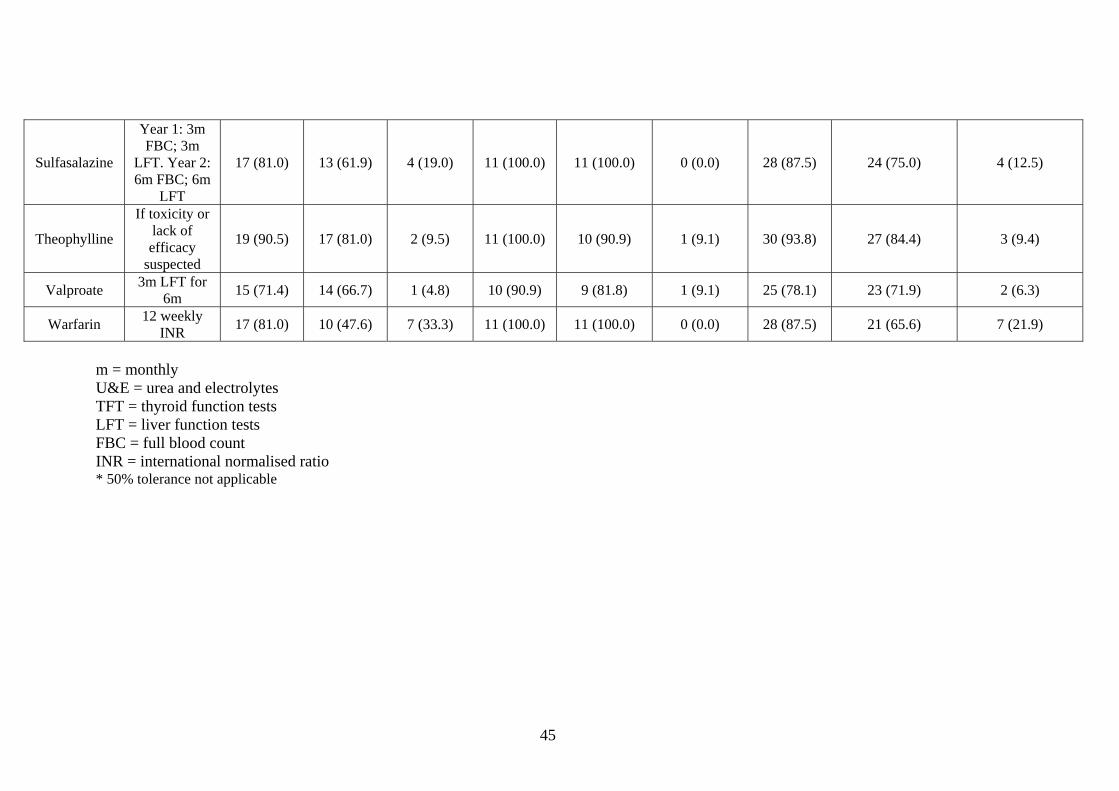
45
Sulfasalazine
Year 1: 3m FBC; 3m
LFT. Year 2: 6m FBC; 6m
LFT
17 (81.0) 13 (61.9) 4 (19.0) 11 (100.0) 11 (100.0) 0 (0.0) 28 (87.5) 24 (75.0) 4 (12.5)
Theophylline
If toxicity or lack of efficacy
suspected
19 (90.5) 17 (81.0) 2 (9.5) 11 (100.0) 10 (90.9) 1 (9.1) 30 (93.8) 27 (84.4) 3 (9.4)
Valproate 3m LFT for 6m 15 (71.4) 14 (66.7) 1 (4.8) 10 (90.9) 9 (81.8) 1 (9.1) 25 (78.1) 23 (71.9) 2 (6.3)
Warfarin 12 weekly INR 17 (81.0) 10 (47.6) 7 (33.3) 11 (100.0) 11 (100.0) 0 (0.0) 28 (87.5) 21 (65.6) 7 (21.9)
m = monthly U&E = urea and electrolytes TFT = thyroid function tests LFT = liver function tests FBC = full blood count INR = international normalised ratio * 50% tolerance not applicable
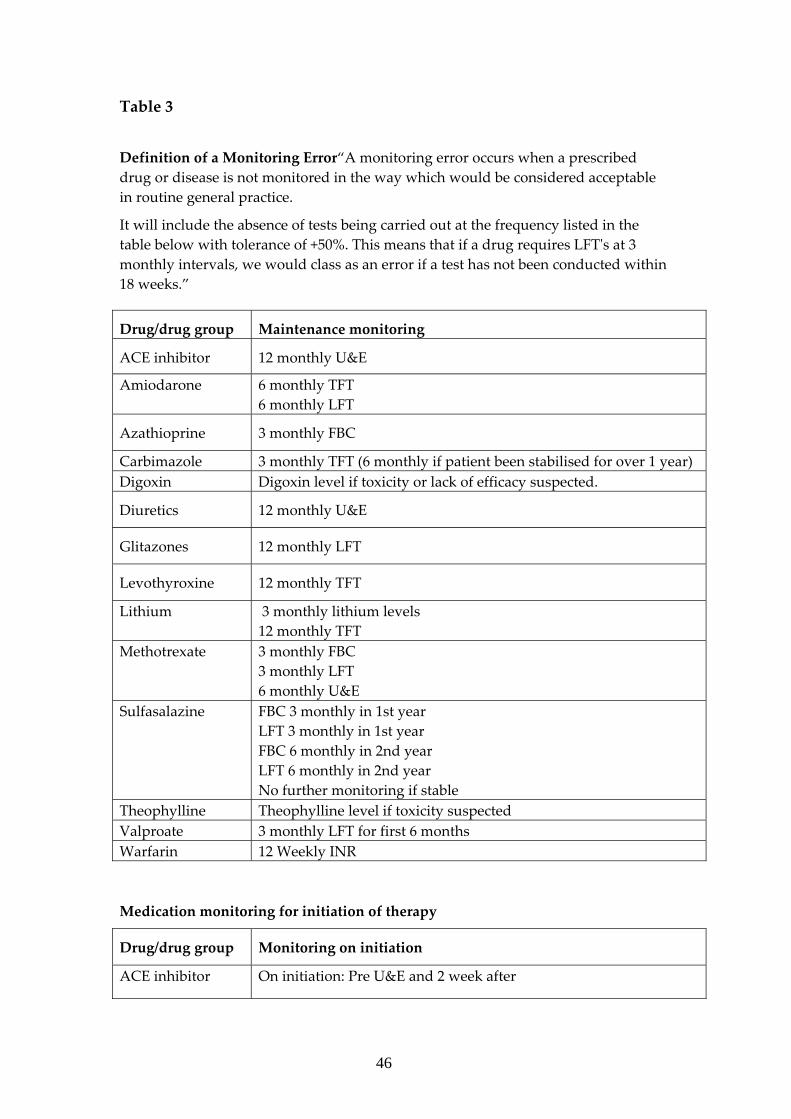
46
Table 3
Definition of a Monitoring Error“A monitoring error occurs when a prescribed drug or disease is not monitored in the way which would be considered acceptable in routine general practice.
It will include the absence of tests being carried out at the frequency listed in the table below with tolerance of +50%. This means that if a drug requires LFTʹs at 3 monthly intervals, we would class as an error if a test has not been conducted within 18 weeks.”
Drug/drug group Maintenance monitoring
ACE inhibitor 12 monthly U&E
Amiodarone
6 monthly TFT 6 monthly LFT
Azathioprine 3 monthly FBC
Carbimazole 3 monthly TFT (6 monthly if patient been stabilised for over 1 year) Digoxin Digoxin level if toxicity or lack of efficacy suspected.
Diuretics 12 monthly U&E
Glitazones 12 monthly LFT
Levothyroxine 12 monthly TFT
Lithium
3 monthly lithium levels 12 monthly TFT
Methotrexate
3 monthly FBC 3 monthly LFT 6 monthly U&E
Sulfasalazine FBC 3 monthly in 1st year LFT 3 monthly in 1st year FBC 6 monthly in 2nd year LFT 6 monthly in 2nd year No further monitoring if stable
Theophylline Theophylline level if toxicity suspected Valproate 3 monthly LFT for first 6 months Warfarin 12 Weekly INR Medication monitoring for initiation of therapy
Drug/drug group Monitoring on initiation
ACE inhibitor On initiation: Pre U&E and 2 week after

47
Digoxin Pre U&E
Diuretics Pre U&E and 1 month after starting
Glitazones Pre LFT
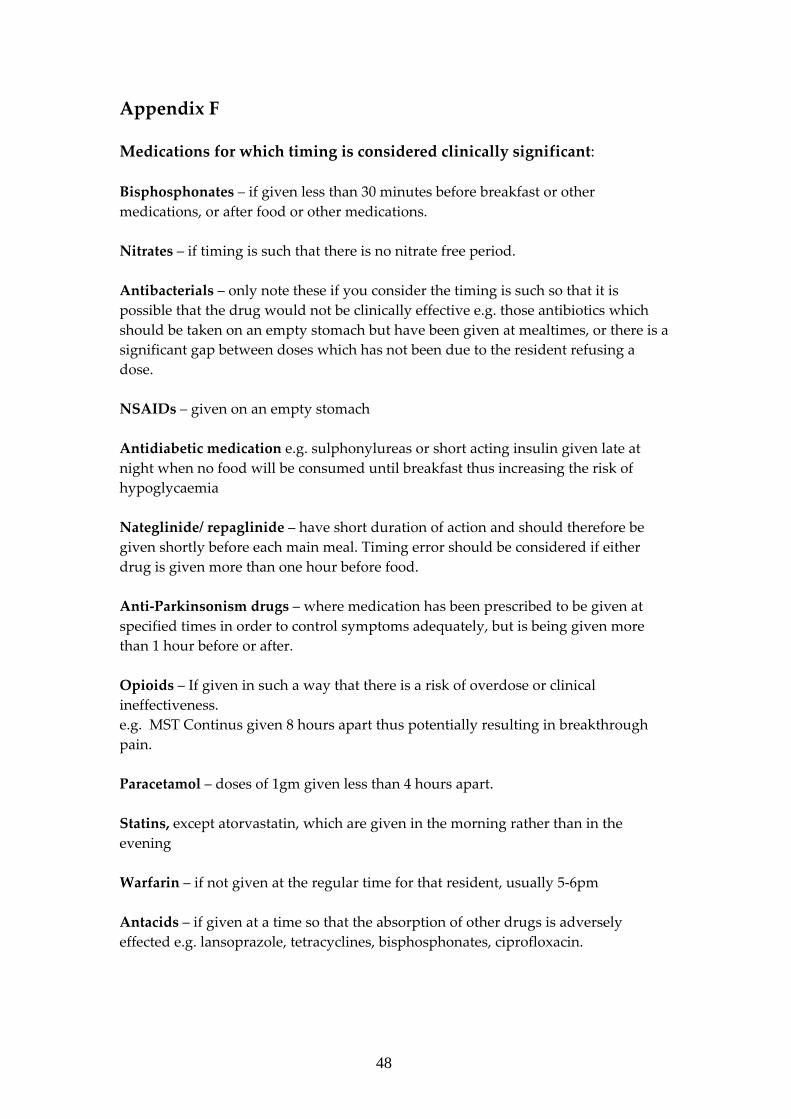
48
Appendix F Medications for which timing is considered clinically significant: Bisphosphonates – if given less than 30 minutes before breakfast or other medications, or after food or other medications. Nitrates – if timing is such that there is no nitrate free period. Antibacterials – only note these if you consider the timing is such so that it is possible that the drug would not be clinically effective e.g. those antibiotics which should be taken on an empty stomach but have been given at mealtimes, or there is a significant gap between doses which has not been due to the resident refusing a dose. NSAIDs – given on an empty stomach Antidiabetic medication e.g. sulphonylureas or short acting insulin given late at night when no food will be consumed until breakfast thus increasing the risk of hypoglycaemia Nateglinide/ repaglinide – have short duration of action and should therefore be given shortly before each main meal. Timing error should be considered if either drug is given more than one hour before food. Anti‐Parkinsonism drugs – where medication has been prescribed to be given at specified times in order to control symptoms adequately, but is being given more than 1 hour before or after. Opioids – If given in such a way that there is a risk of overdose or clinical ineffectiveness. e.g. MST Continus given 8 hours apart thus potentially resulting in breakthrough pain. Paracetamol – doses of 1gm given less than 4 hours apart. Statins, except atorvastatin, which are given in the morning rather than in the evening Warfarin – if not given at the regular time for that resident, usually 5‐6pm Antacids – if given at a time so that the absorption of other drugs is adversely effected e.g. lansoprazole, tetracyclines, bisphosphonates, ciprofloxacin.
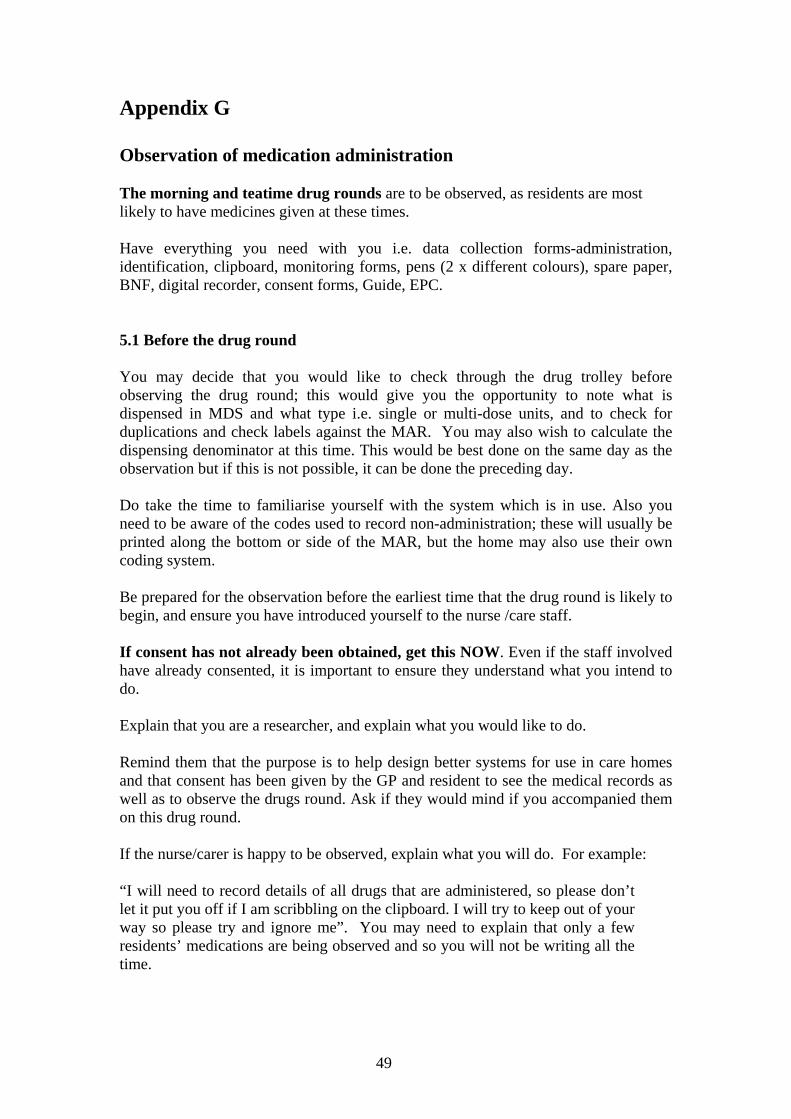
49
Appendix G Observation of medication administration The morning and teatime drug rounds are to be observed, as residents are most likely to have medicines given at these times. Have everything you need with you i.e. data collection forms-administration, identification, clipboard, monitoring forms, pens (2 x different colours), spare paper, BNF, digital recorder, consent forms, Guide, EPC. 5.1 Before the drug round You may decide that you would like to check through the drug trolley before observing the drug round; this would give you the opportunity to note what is dispensed in MDS and what type i.e. single or multi-dose units, and to check for duplications and check labels against the MAR. You may also wish to calculate the dispensing denominator at this time. This would be best done on the same day as the observation but if this is not possible, it can be done the preceding day. Do take the time to familiarise yourself with the system which is in use. Also you need to be aware of the codes used to record non-administration; these will usually be printed along the bottom or side of the MAR, but the home may also use their own coding system. Be prepared for the observation before the earliest time that the drug round is likely to begin, and ensure you have introduced yourself to the nurse /care staff. If consent has not already been obtained, get this NOW. Even if the staff involved have already consented, it is important to ensure they understand what you intend to do. Explain that you are a researcher, and explain what you would like to do. Remind them that the purpose is to help design better systems for use in care homes and that consent has been given by the GP and resident to see the medical records as well as to observe the drugs round. Ask if they would mind if you accompanied them on this drug round. If the nurse/carer is happy to be observed, explain what you will do. For example: “I will need to record details of all drugs that are administered, so please don’t let it put you off if I am scribbling on the clipboard. I will try to keep out of your way so please try and ignore me”. You may need to explain that only a few residents’ medications are being observed and so you will not be writing all the time.
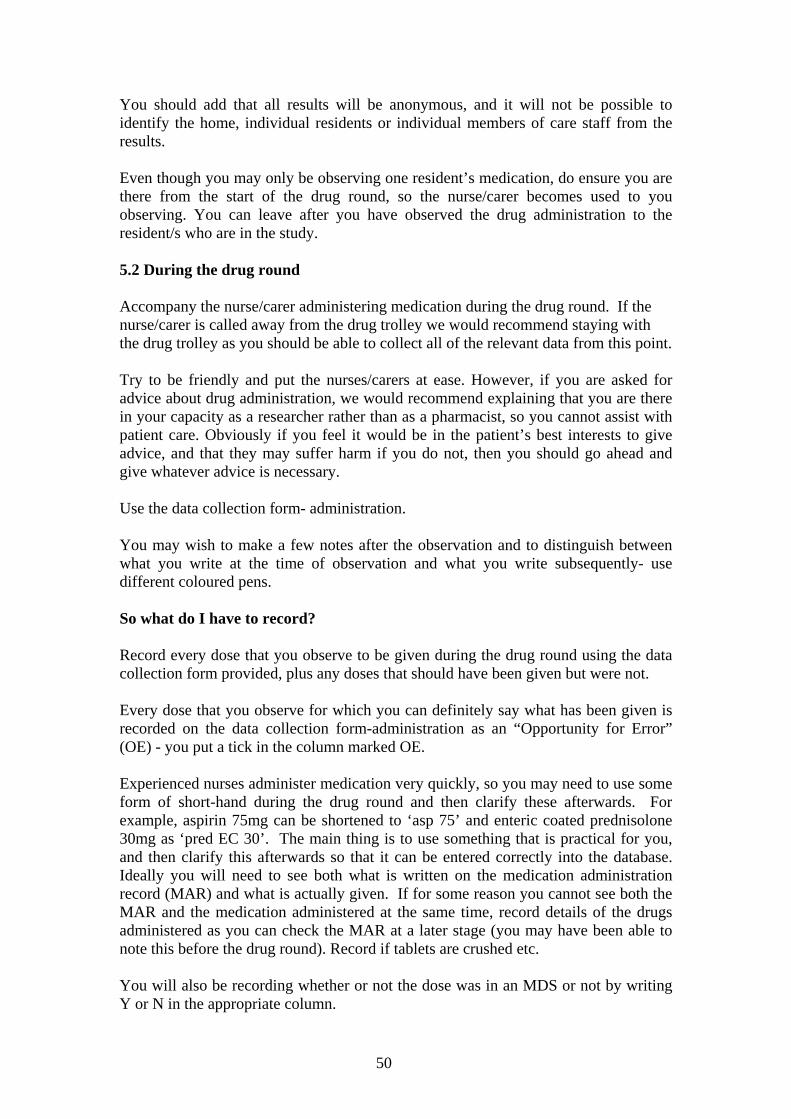
50
You should add that all results will be anonymous, and it will not be possible to identify the home, individual residents or individual members of care staff from the results. Even though you may only be observing one resident’s medication, do ensure you are there from the start of the drug round, so the nurse/carer becomes used to you observing. You can leave after you have observed the drug administration to the resident/s who are in the study. 5.2 During the drug round Accompany the nurse/carer administering medication during the drug round. If the nurse/carer is called away from the drug trolley we would recommend staying with the drug trolley as you should be able to collect all of the relevant data from this point. Try to be friendly and put the nurses/carers at ease. However, if you are asked for advice about drug administration, we would recommend explaining that you are there in your capacity as a researcher rather than as a pharmacist, so you cannot assist with patient care. Obviously if you feel it would be in the patient’s best interests to give advice, and that they may suffer harm if you do not, then you should go ahead and give whatever advice is necessary. Use the data collection form- administration. You may wish to make a few notes after the observation and to distinguish between what you write at the time of observation and what you write subsequently- use different coloured pens. So what do I have to record? Record every dose that you observe to be given during the drug round using the data collection form provided, plus any doses that should have been given but were not. Every dose that you observe for which you can definitely say what has been given is recorded on the data collection form-administration as an “Opportunity for Error” (OE) - you put a tick in the column marked OE. Experienced nurses administer medication very quickly, so you may need to use some form of short-hand during the drug round and then clarify these afterwards. For example, aspirin 75mg can be shortened to ‘asp 75’ and enteric coated prednisolone 30mg as ‘pred EC 30’. The main thing is to use something that is practical for you, and then clarify this afterwards so that it can be entered correctly into the database. Ideally you will need to see both what is written on the medication administration record (MAR) and what is actually given. If for some reason you cannot see both the MAR and the medication administered at the same time, record details of the drugs administered as you can check the MAR at a later stage (you may have been able to note this before the drug round). Record if tablets are crushed etc. You will also be recording whether or not the dose was in an MDS or not by writing Y or N in the appropriate column.
51
If you identify an MAE, document this also. Again, use shorthand if you wish and then clarify the details afterwards. If an MAE is prevented by a patient or by yourself, record these details. If in doubt, record anything that happens as we can sort out how to classify it afterwards! When a dose is omitted during the drug round but the drug chart is signed to indicate that it has been administered, count this as an omission as we will assume that the dose is never given. However if a dose is omitted and the drug chart left blank, you should ask the nurse or carer at the end of the round whether the drug was intentionally omitted. If the omission was unintentional, again, this should be included as an OE and an omission error. 5.3 What is an opportunity for error (OE)? An opportunity for error is any dose of medication that the researcher observes being administered (or omitted) and can classify as being either correct or incorrect. Drugs prescribed to be given “when required” ie prn) should be included as opportunities for error if they are administered while you are observing. Doses given between the observed drug rounds are not considered opportunities for error as they cannot be observed. Controlled drugs as well as many rectal, topical and intramuscular doses may need to be excluded, as observation of the administration of these may not be appropriate. PEG feeds and other nutritional supplements are excluded as they are not medicines. 5.4 After the drug round Once the drug round is finished, thank the nurse/carer. If there is anything you need to check on the MARs of the residents observed, go back and check these now. You will need to check that the MAR and dispensing label agree and you can fill in whether or not the medicines have been signed for by ticking in the appropriate column. This may also be the best time to check for expiry dates on medicines. Note that medicines in heat sealed MDS are usually considered to have an expiry date of 8 weeks from dispensing. Record any other ‘field notes’ as soon as possible after the round. Use a different colour pen, or a separate sheet of paper, so that we can tell what was recorded during the drug round and what was recorded afterwards from memory. Explain any abbreviations you have used that may be ambiguous to another pharmacist, and add any other comments about the round, why things happened, and anything else you think may be relevant. If there is anything that will need checking at a later drug round, or later in the day (such as whether an omitted dose was subsequently given), document this clearly on a separate sheet of paper so you can check it later.
Doses left for patient
Please make a note on the data collection form if the nurse/carer does not observe the patient taking the dose, but leaves it at their bedside for them to self-administer. This is not considered an error, but
should be noted separately in the field notes.
52
5.5 What can be expected? In previous studies of this type in secondary care, the majority of MAEs have been drugs omitted because they are not available on the ward. The next most common groups are doses omitted because nursing staff cannot find the medication, or cannot find the drug chart. Experience to date in care homes is that the majority of MAEs are also omissions. This can be because medicines have not been re-prescribed (ordered) or have not been delivered, or because carers cannot see the medicine in the trolley. We have observed one case of a dose omitted because the tablet was stuck in the MDS. Medicines are also omitted because staff miss the order on the MAR chart. Other types of administration error encountered so far include dose duplication when the same drug was prescribed generically and by brand name, and inappropriate administration methods eg crushing tablets intended to be swallowed whole. 6. When and how should interventions be made?
6.1 Errors observed during medication administration The issue of whether or not to intervene is a difficult one. If we intervene for every MAE, however minor, it could affect the study’s results. However, most health care professionals would be uncomfortable with the idea of not intervening in a situation that could result in patient harm. You should therefore intervene if you are in a position to prevent patient harm. For example, it would not be necessary to intervene in the majority of omission errors, because the omission of one dose is unlikely to result in patient harm, or in the administration of two Calcichew tablets instead of one, or the administration of vitamin B compound strong instead of vitamins BPC. However intervention would be appropriate to prevent the omission of certain medication such as a dose of phenytoin, or the administration of a clinically significant overdose, or the administration of a drug to the wrong patient. At the end of the day however, it is up to your clinical judgement and there are no right or wrong answers. There will be some situations where you cannot intervene to prevent patient harm, for example because you only realise there has been an error after the drug has been administered, or because the drug is not available in the home. In this case there is no need to intervene. If you decide to intervene, this should be done in as tactful and non-judgemental a manner as possible, to prevent the patient from receiving the dose. For example:
“Are you sure it’s 250 microgram? I thought that said 125 micrograms”
53
“Oh, I interpreted that as 70mg once a week, not every day” Avoid use of judgmental terms like ‘wrong’ and ‘error’. For example do not say ‘Oh, you’ve made an error’ or ‘you’ve got that wrong!’ We have never had problems in previous work in secondary care, and staff have always been grateful for the intervention and not particularly concerned by it. 6.2 Other types of unintentional error If an error occurs we will be providing feedback to the person who has made the error. We will also be interviewing the person who made the error to gain an understanding of the error in order to prevent further errors. GP prescribing errors will be communicated to him/her via the medication review form (and if necessary via the telephone), and explored further in interview. If serious dispensing errors are identified, the same will be done for pharmacists. 6.3 What if there is a serious risk of recurrence? If after providing feedback, we are concerned that the patient may continue to suffer significant harm, or future patients could suffer significant harm, then we would consult the ethics committee as to whether we should break confidentiality in order to protect the patient(s). We would seek to do this urgently. However, it must be stressed that we will be breaking our ethical principles as we have informed consent from participants on the understanding that anonymity and confidentiality will be assured. If we are in such a situation and the ethics committee recommends breaking confidentiality, then the clinical governance lead for the PCT would be notified if the person of concern is a GP or pharmacist. If harm, or potential harm, is being caused by a care home or a particular member of care home staff, then the local CSCI office would be alerted. If we suspect an individual is harming patients intentionally, then we will notify the appropriate authorities immediately. This would include the clinical governance lead for the PCT.
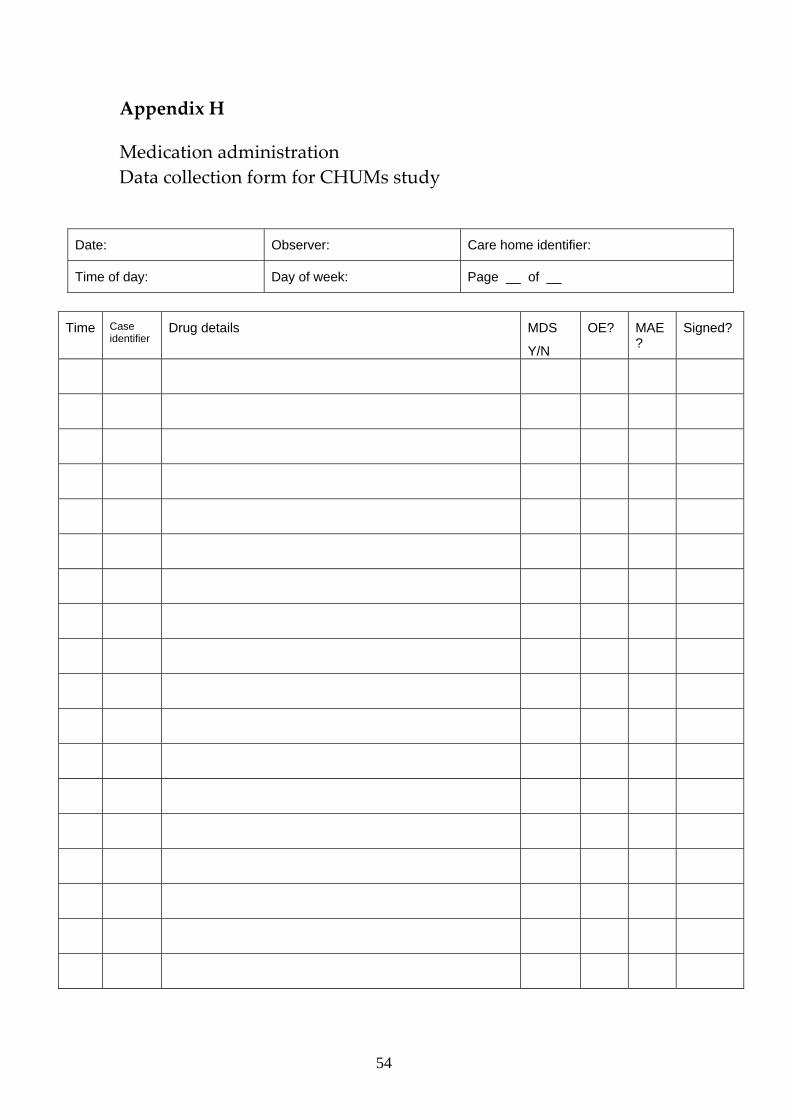
54
Appendix H Medication administration Data collection form for CHUMs study
Date: Observer: Care home identifier:
Time of day: Day of week: Page __ of __
Time Case
identifier Drug details MDS
Y/N
OE? MAE?
Signed?
55
Appendix I A review of medication administration relating to care homes 1.0 Outline and Aims of the review To open this review, evidence of the approaches previously or currently being adopted to study the problem of medication errors has been gathered, leading to parallels being drawn with methods of study in other industries. The outcome of some of these earlier studies gives an insight into the prevailing attitudes to medication errors in the existing system. This section therefore aimed to help guide the CHUMS project in the best method to adopt, as well as creating a picture of the current system and attitudes. The review then progresses to look at current and recent initiatives already adopted to tackle the problem of patient safety in relation to care of the elderly. The final section of the review of current and recent initiatives looks at the role of the pharmacy, as this has been identified as significant by a number of authors (Ashcroft et al 2005, Hawksworth et al 1999). In order to tackle the issue of medication errors in an existing system such as the health service, or more specifically on this occasion, the Care Home, there was a need to study and document the current structure and follow this with recommendations for system improvements. To this end, a review of the available methodologies to achieve this goal was included. 2.0 Existing approaches and attitudes towards medication errors The field or ergonomics promotes the systems approach to error reduction, and in particular the ergonomics systems approach based on user-centred design (Buckle et al., 2006). A useful discussion on the shortcomings of punitive approaches to reducing medication errors, and the value of a systems approach can be found in Anderson and Webster (2001). Their study takes medication errors on a hospital ward as a focal point. It is all too common for nurses to be blamed for medication errors on the grounds of ‘carelessness’. Anderson and Webster point out that by focusing on the individual, the “complete set of contributing factors cannot be known”. They cite other high-risk industries such as aviation and nuclear power as examples of the successful application of a systems approach to reducing errors/accidents. Although the nurse, and in the case of care homes, possibly the care worker, is the final ‘cog’ in the safe administration of medication (i.e. they physically deliver the drug to the patient/resident), it should not be assumed that they are responsible for all, or indeed any, errors. Anderson and Webster (2001) go on to describe the categorization of components of a system. These being Design, Equipment, Procedures,
56
Operators, Supplies and Environment (DEPOSE). Taking the safety of a new medication as an example, the elements of the system would consist of the following. Testing of the medication before introduction (Design), manufacture and packaging (Equipment), development of the prescription criteria (Procedure), mechanism for giving to patients effectively (Operator), reliability and consistency of supplies (Supply), and finally, whether the situation within the care setting permits or facilitates proper administration (Environment). All of these categories need to be considered to fully understand how errors occur. The commonly found ‘person-centred’ approach to blame, only examines the ‘operator’ category of the DEPOSE description of a system. Further support for the systems approach can be found in Allard et al (2002). They believe that counting and categorizing errors is of limited value. They suggest that more useful information can be obtained by tracing errors through the system. They go on to cite evidence suggesting that ‘situational factors’, or in other words ‘the wider system’ can be the route cause of errors. Workload in the form of number of patients and prescriptions may lead to errors, which is in line with findings in other industries such as aviation and nuclear power plants. Evidence has indicated that pilot or operator workload and shift patterns are associated with error rates. In an aircraft simulator study, it was found that cockpit task management (CTM) performance was inversely related to workload (Chou et al 1996). In a review of literature relating to medication errors O’Shea (1999) found many references to shift patterns and workload influencing error rate. Other factors identified by O’Shea included medication delivery systems and policy and procedures, both forming part of the wider ‘system’ rather than the individual. Allard et al (2002) state that “Medication errors can only be prevented and reduced by focusing on the system as a whole, not on the individual clinician or nurse”. This may seem obvious to readers within the ergonomics community, but it is not a widespread culture within the health care sector. 3.0 The role of the pharmacy in relation to care homes Without intentionally singling out one particular aspect of the medication delivery system, it came to the attention of the ergonomist that over the preceding ten years or so, a number of papers/articles have identified the role of the pharmacy as a significant factor in the successful performance of the overall system. Ashcroft et al (2005), as a result of identifying a lack of documented investigations into the performance of community pharmacies, undertook a study to measure their performance in relation to dispensing errors. They point out that, at the time of publication, around 600 million prescription items were dispensed each year through community pharmacies in England and Wales. Their study found that on average, for every 10000 items dispensed there were in the region of 22 ‘near misses’ and four dispensing errors. Ashcroft suggested that these figures may be conservative, as their method may have been vulnerable to under reporting of incidents, and only the errors that pharmacists became aware of were recorded.
57
As will become apparent in later sections of this review, what is particularly interesting is that Ashcroft noted that pharmacists themselves reported that the situations commonly associated with increased errors included occasions when the pharmacy was busier than normal, and when there were telephone interruptions. 3.1 A pharmacy initiative in the UK While searching for general information associated with medication errors, a regional initiative was identified with the aim of improving the quality of service offered specifically to care homes, by the local community pharmacy. Pharmacy Plus (www.pharmacyplus.co.uk) is a commercial venture centred on the Bristol area of the UK. They have departed from the traditional approach to pharmacy, by separating the day to day service offered to members of the general public, from that offered to care homes. They operate a dedicated dispensing centre whose sole purpose is to cater for care homes. Each care home has a designated area within the complex. Their service integrates aspects such as training for care home staff, medication reviews, re-designed MDS systems, and interim MAR charts. In light of the observations recorded by Ashcroft et al (2005) citing increased errors associated with interruptions within the pharmacy, this dedicated service would seem to have potential for improved medication safety through reduced errors. No independent review into the effectiveness of Pharmacy Plus was found, but an objective study would be valuable in assessing some aspects of their operations for wider application within the UK. The contribution that community pharmacists can, and often do, make to the quality and not simply the quantity of medication administration, was illustrated in a study by Hawksworth et al (1999). They studied fourteen pharmacists over a one year period. The pharmacists recorded occurrences of ‘clinical pharmacy interventions’ for one week of each month. 1503 clinical pharmacy interventions were made out of 210 000 items dispensed. The broad finding was that a panel of expert judges determined that 748 (0.37%) interventions “improved the clinical outcome and could have saved a visit to or by the general practitioner”. 4.0 Analysing the existing system and seeking improvements In order to study the issue of medication errors in the Care Home, there was a need to study and document the current structure of the whole medication system and follow this with recommendations for system improvements. What follows is a review of available methodologies to achieve this goal. As the intention was to adopt task analysis to produce a ‘description’ of the existing care home medication system; a review of methods was undertaken. Many task analysis methods use a hierarchical structure to some degree, and after a short appraisal of other available methods, Hierarchical Task Analysis
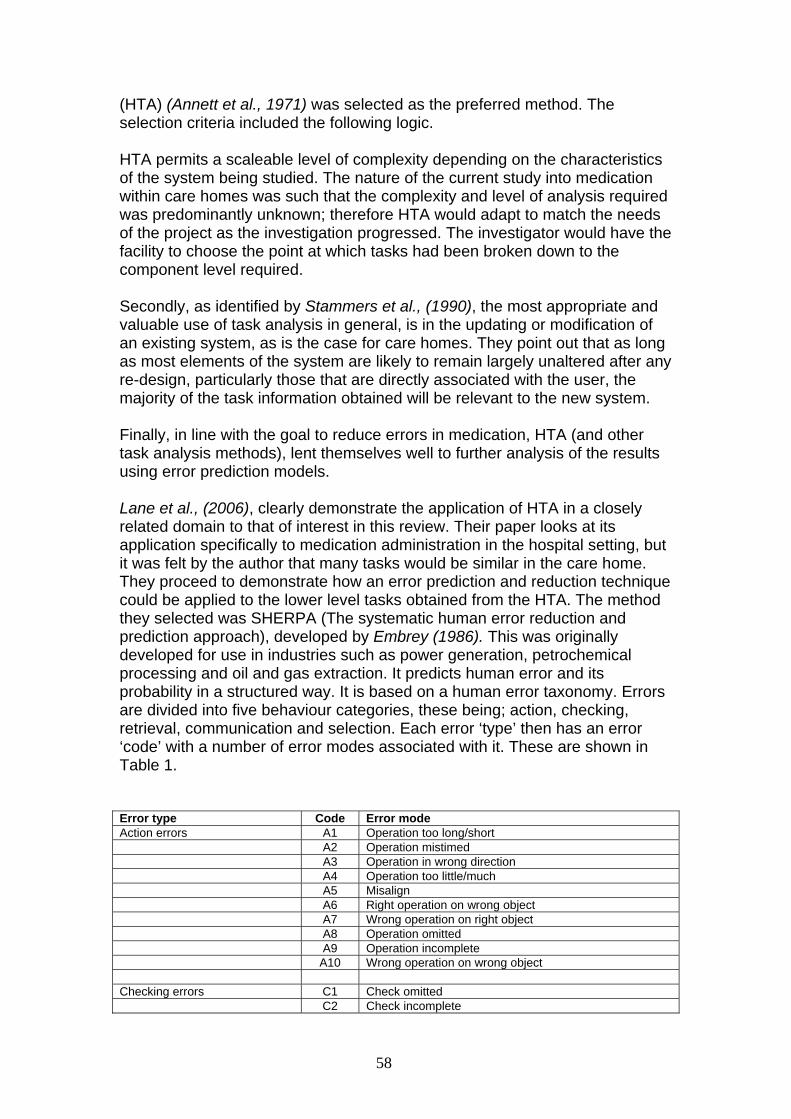
58
(HTA) (Annett et al., 1971) was selected as the preferred method. The selection criteria included the following logic. HTA permits a scaleable level of complexity depending on the characteristics of the system being studied. The nature of the current study into medication within care homes was such that the complexity and level of analysis required was predominantly unknown; therefore HTA would adapt to match the needs of the project as the investigation progressed. The investigator would have the facility to choose the point at which tasks had been broken down to the component level required. Secondly, as identified by Stammers et al., (1990), the most appropriate and valuable use of task analysis in general, is in the updating or modification of an existing system, as is the case for care homes. They point out that as long as most elements of the system are likely to remain largely unaltered after any re-design, particularly those that are directly associated with the user, the majority of the task information obtained will be relevant to the new system. Finally, in line with the goal to reduce errors in medication, HTA (and other task analysis methods), lent themselves well to further analysis of the results using error prediction models. Lane et al., (2006), clearly demonstrate the application of HTA in a closely related domain to that of interest in this review. Their paper looks at its application specifically to medication administration in the hospital setting, but it was felt by the author that many tasks would be similar in the care home. They proceed to demonstrate how an error prediction and reduction technique could be applied to the lower level tasks obtained from the HTA. The method they selected was SHERPA (The systematic human error reduction and prediction approach), developed by Embrey (1986). This was originally developed for use in industries such as power generation, petrochemical processing and oil and gas extraction. It predicts human error and its probability in a structured way. It is based on a human error taxonomy. Errors are divided into five behaviour categories, these being; action, checking, retrieval, communication and selection. Each error ‘type’ then has an error ‘code’ with a number of error modes associated with it. These are shown in Table 1. Error type Code Error mode Action errors A1 Operation too long/short A2 Operation mistimed A3 Operation in wrong direction A4 Operation too little/much A5 Misalign A6 Right operation on wrong object A7 Wrong operation on right object A8 Operation omitted A9 Operation incomplete A10 Wrong operation on wrong object Checking errors C1 Check omitted C2 Check incomplete
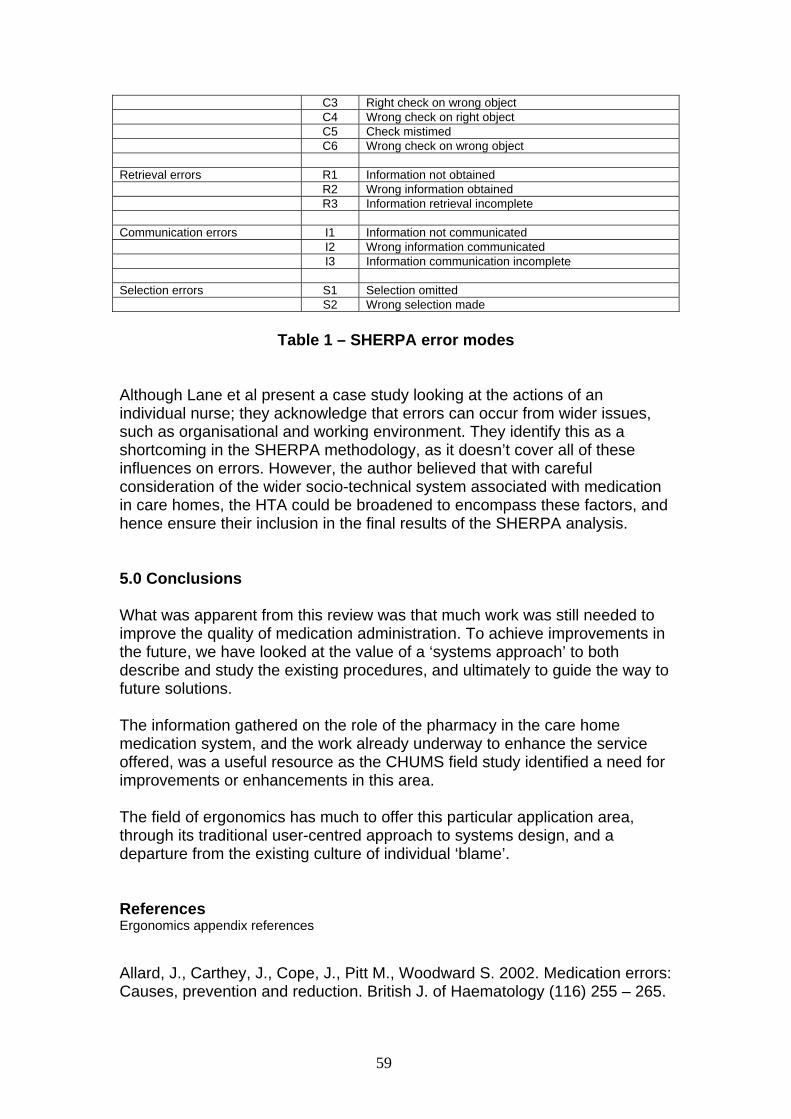
59
C3 Right check on wrong object C4 Wrong check on right object C5 Check mistimed C6 Wrong check on wrong object Retrieval errors R1 Information not obtained R2 Wrong information obtained R3 Information retrieval incomplete Communication errors I1 Information not communicated I2 Wrong information communicated I3 Information communication incomplete Selection errors S1 Selection omitted S2 Wrong selection made
Table 1 – SHERPA error modes Although Lane et al present a case study looking at the actions of an individual nurse; they acknowledge that errors can occur from wider issues, such as organisational and working environment. They identify this as a shortcoming in the SHERPA methodology, as it doesn’t cover all of these influences on errors. However, the author believed that with careful consideration of the wider socio-technical system associated with medication in care homes, the HTA could be broadened to encompass these factors, and hence ensure their inclusion in the final results of the SHERPA analysis. 5.0 Conclusions What was apparent from this review was that much work was still needed to improve the quality of medication administration. To achieve improvements in the future, we have looked at the value of a ‘systems approach’ to both describe and study the existing procedures, and ultimately to guide the way to future solutions. The information gathered on the role of the pharmacy in the care home medication system, and the work already underway to enhance the service offered, was a useful resource as the CHUMS field study identified a need for improvements or enhancements in this area. The field of ergonomics has much to offer this particular application area, through its traditional user-centred approach to systems design, and a departure from the existing culture of individual ‘blame’. References Ergonomics appendix references Allard, J., Carthey, J., Cope, J., Pitt M., Woodward S. 2002. Medication errors: Causes, prevention and reduction. British J. of Haematology (116) 255 – 265.
60
Anderson, D.J., Webster, C.S., 2001. A systems approach to the reduction of medication error on the hospital ward. J. Adv. Nurs. 35(1) 34 – 41. Annett, J., Duncan, K.D., Stammers, R.B., Gary, M.J. 1971. Task Analysis. London: HMSO, Training Information Paper No. 6 Ashcroft, D.M., Quinlan, P., Blenkinsopp, A., 2005. Prospective study of the incidence, nature and causes of dispensing errors in community pharmacies. Pharmacoepidemiology and Drug Safety. 14: 327 – 332. John Wiley & Sons. Buckle, P., Clarkson, P.J., Coleman, R., Ward, J., Anderson, J., 2006. Patient safety, systems design and ergonomics. App. Ergonomics (37) 491 – 500. Chou Chung-Di., Madhavan D., Funk K. 1996. Studies of cockpit task management errors. The Int., J. of Aviation Psychology 6(4) 307 – 320. Hawksworth, G.M., Corlett, A.J., Wright, D.J., Chrystyn, H., 1999. Clinical pharmacy interventions by community pharmacisits during the dispensing process. J. of Clinical Pharmacology, 47, 695 – 700. Lane, R., Stanton, N.A., Harrison, D., 2006. Applying hierarchical task analysis to medication administration errors. Applied Ergonomics 37(2006), 669 - 679 O,Shea, E. 1999. Factors contributing to medication errors: a literature review. J. of Clinical Nursing (8) 496 – 504. Stammers, R.B., Carey, M.S., Astley, J.A., 1990. Task Analysis. In: Evaluation of Human Work. Ed., Wilson J.R, Corlett, E.N., 1990. Taylor & Francis. Chapter 6, 134 – 160.
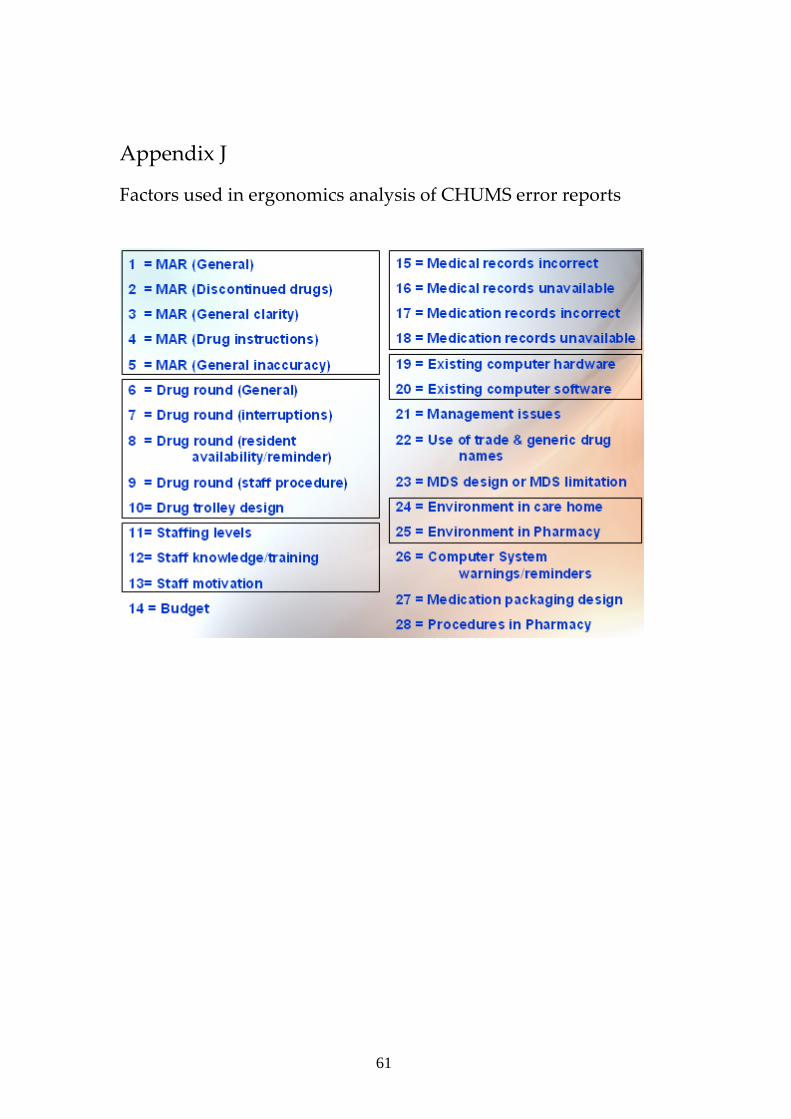
61
Appendix J
Factors used in ergonomics analysis of CHUMS error reports
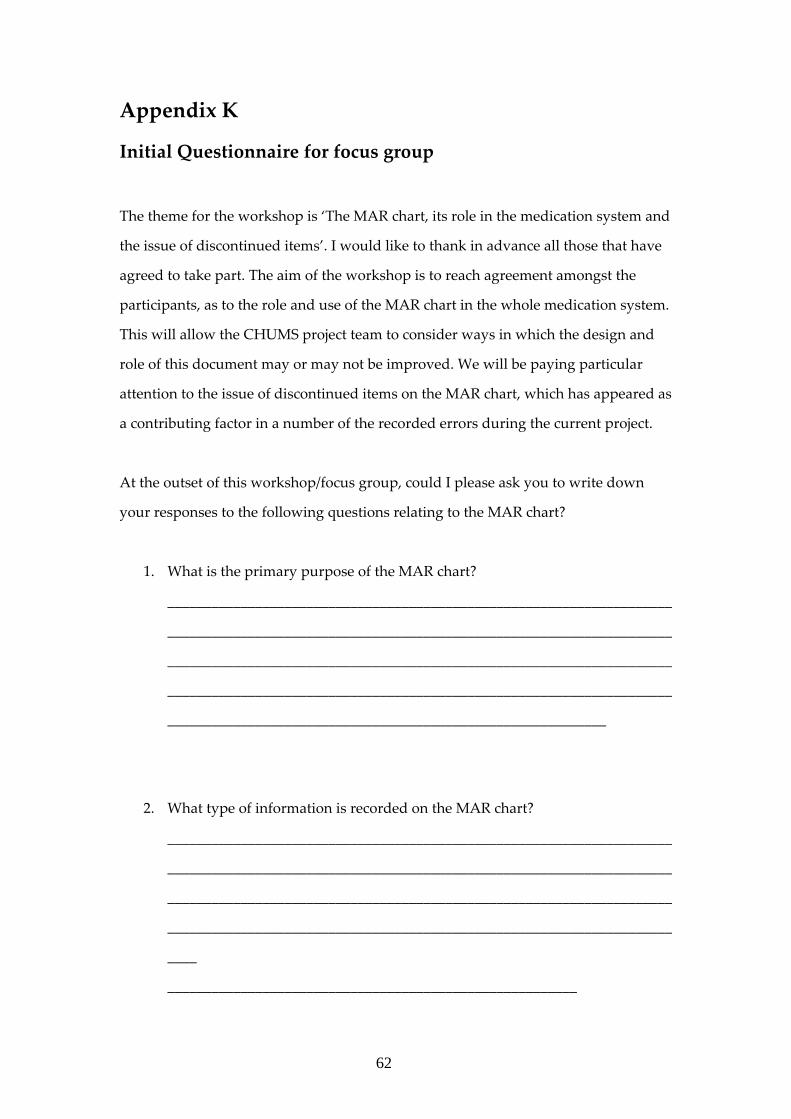
62
Appendix K
Initial Questionnaire for focus group
The theme for the workshop is ‘The MAR chart, its role in the medication system and
the issue of discontinued items’. I would like to thank in advance all those that have
agreed to take part. The aim of the workshop is to reach agreement amongst the
participants, as to the role and use of the MAR chart in the whole medication system.
This will allow the CHUMS project team to consider ways in which the design and
role of this document may or may not be improved. We will be paying particular
attention to the issue of discontinued items on the MAR chart, which has appeared as
a contributing factor in a number of the recorded errors during the current project.
At the outset of this workshop/focus group, could I please ask you to write down
your responses to the following questions relating to the MAR chart?
1. What is the primary purpose of the MAR chart?
_____________________________________________________________________
_____________________________________________________________________
_____________________________________________________________________
_____________________________________________________________________
____________________________________________________________
2. What type of information is recorded on the MAR chart?
_____________________________________________________________________
_____________________________________________________________________
_____________________________________________________________________
_____________________________________________________________________
____
________________________________________________________
63
3. Who makes use of the MAR chart?
_____________________________________________________________________
_____________________________________________________________________
_____________________________________________________________________
_____________________________________________________________________
____________________________________________________________
4. Who enters/makes changes to, information on the MAR chart?
_____________________________________________________________________
_____________________________________________________________________
_____________________________________________________________________
_____________________________________________________________________
____________________________________________________________
5. In your opinion, does the MAR chart fulfil its primary purpose, stated in 1?
_____________________________________________________________________
_____________________________________________________________________
_____________________________________________________________________
_____________________________________________________________________
____________________________________________________________
6. What do you think is the main reason for discontinued items on the MAR
chart?
_____________________________________________________________________
_____________________________________________________________________
64
_____________________________________________________________________
_____________________________________________________________________
____________________________________________________________
7. What are the priorities when using a MAR chart (e.g. accuracy, efficiency etc)
_____________________________________________________________________
_____________________________________________________________________
_____________________________________________________________________
_____________________________________________________________________
____________________________________________________________
8. What are the purposes of using a MAR chart (e.g. as a means of recording,
auditing etc.)
_____________________________________________________________________
_____________________________________________________________________
_____________________________________________________________________
_____________________________________________________________________
____________________________________________________________
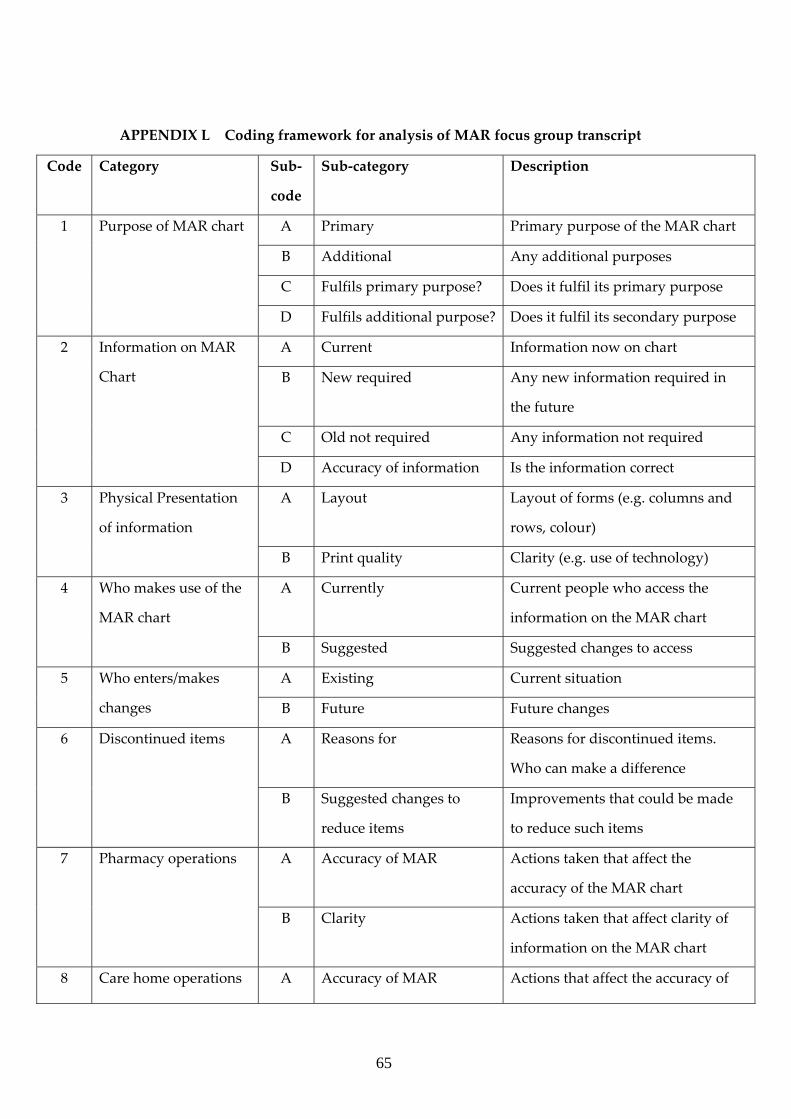
65
APPENDIX L Coding framework for analysis of MAR focus group transcript
Code Category Sub‐
code
Sub‐category Description
A Primary Primary purpose of the MAR chart
B Additional Any additional purposes
C Fulfils primary purpose? Does it fulfil its primary purpose
1
Purpose of MAR chart
D Fulfils additional purpose? Does it fulfil its secondary purpose
A Current Information now on chart
B New required Any new information required in
the future
C Old not required Any information not required
2 Information on MAR
Chart
D Accuracy of information Is the information correct
A Layout Layout of forms (e.g. columns and
rows, colour)
3 Physical Presentation
of information
B Print quality Clarity (e.g. use of technology)
A Currently Current people who access the
information on the MAR chart
4 Who makes use of the
MAR chart
B Suggested Suggested changes to access
A Existing Current situation 5 Who enters/makes
changes B Future Future changes
A Reasons for Reasons for discontinued items.
Who can make a difference
6 Discontinued items
B Suggested changes to
reduce items
Improvements that could be made
to reduce such items
A Accuracy of MAR Actions taken that affect the
accuracy of the MAR chart
7 Pharmacy operations
B Clarity Actions taken that affect clarity of
information on the MAR chart
8 Care home operations A Accuracy of MAR Actions that affect the accuracy of
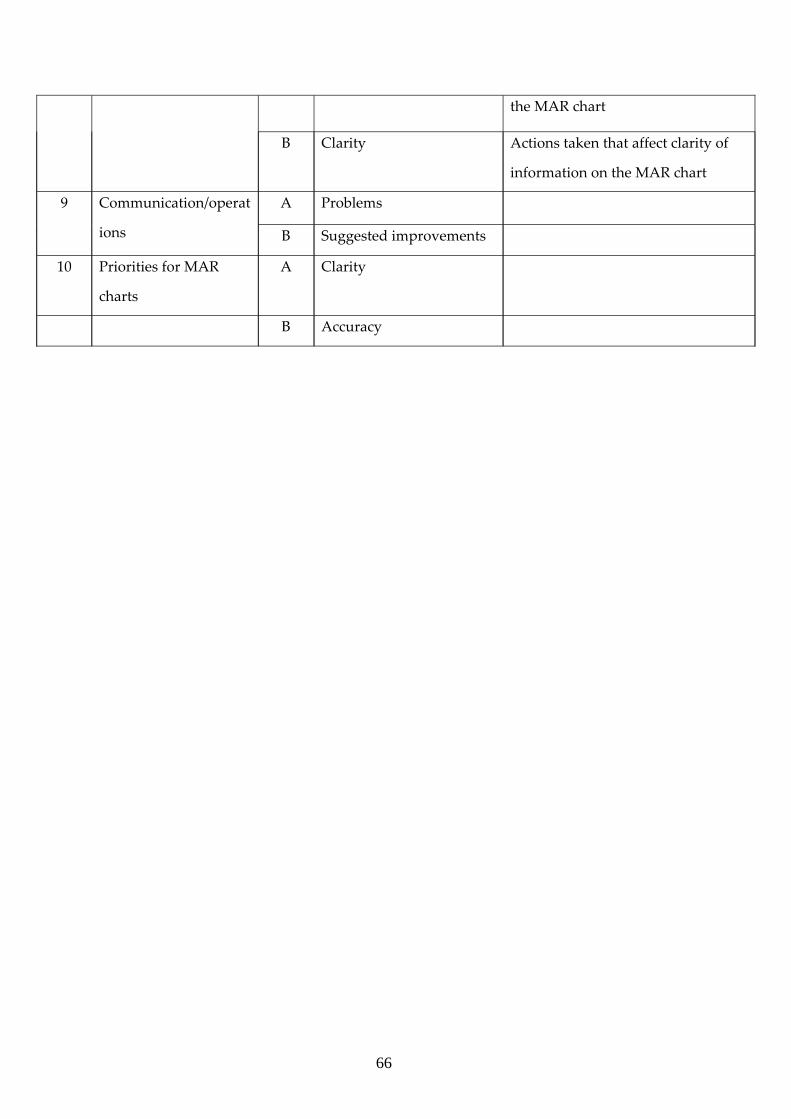
66
the MAR chart
B Clarity Actions taken that affect clarity of
information on the MAR chart
A Problems 9 Communication/operat
ions B Suggested improvements
10 Priorities for MAR
charts
A Clarity
B Accuracy
67
Appendix M
Sample of focus group transcript
MAR Focus Group
We’ll do two stages. Further on in the meeting we’ll go on to look at the
organizational chart, but first of all we’ll look at this. The primary terms of the MAR
chart is the first question that I’ve posed on there and maybe we can start a heated
discussion on the purpose of the MAR chart. So, if I pop that up there … there we
go. Who wants to start the ball rolling? What’s at the top of the list?
(1A) D: I’ve got to ensure safe administration of medicines i.e. to provide the right
medicines to the right patient at the right time, which is what I tell my students.
A: I think administration is a matter of patch, ?fine rights? The safe administration
of medicines implies, one, that the medicines are the right ones and secondly that
you actually administer them appropriately.
So for you to split that down …
M: Yes, it seems to me that there is a split in it.
(1A) K: I’ve split it down and I’ve put it to indicate the drug that’s being prescribed,
the dose and the time of when that medication should be given, so it gives you an
indicator of when it should be administered and what dose, to whichever patient,
which is probably slightly more hands‐on practical rather than ??? point, what it
should be ideally. But I look at it more that it’s sort of components that make up
what should be administered to that patient, because there’s a practical element
between it coming out of the bottle and going to the patient, and that’s dependent on
the human giving it … human errors and that.
68
(1A, 1C) D: And I think, like you were saying, the assumption that the medicines are
correct. That’s in an ideal world, it would be nice, but from the administers’ point of
view, everything before and everything that is on there should be entirely 100%
correct, and then it’s your job to follow those instructions.
A: I’m beginning to doubt your definition then, because I don’t think there’s a MAR
chart … I guess there’s a MAR chart was invented by some pharmacist somewhere
who just wanted to provide a list of what he was sending to the Care Home and that
the bells and whistles on it, like the tick boxes from the administration were probably
things that happened afterwards.
(1A) C: You see, I don’t agree with that. I think the MAR chart purpose is purely
what it says. You’ve got a prescription, and then the pharmacist dispenses it and
you’ve got a label and they’ve done their job. The MAR chart is surplus to that,
which is pure ???
Sorry, can I ask you start again. I was just talking to Dave. I’m sorry. I missed
that very good point.
(1A, 1B) C: My understanding of a MAR chart is that it’s a medicine’s administration
record. So it’s purely a record of what you’ve administered to the patient. The fact
that it helps to give safety and a list of the ??? that the patient’s taking is a bonus, if
you like. But for me, the purpose of the document is to provide a record. It’s an
historical record and it’s for legal, so nurses know what they’ve been given. So it’s a
sort of legal document.
(1C) A: So when something seems to have gone wrong and you go back over it, you
can say “Ah. They didn’t’ get it, or they did get it, or they refused it, or whatever.”
(1A, 1B) C: So that’s the sole purpose of the MAR chart. That’s what I’ve written on
my piece of paper, but then it fuels the other things.
69
(1B) A: That fits the name of the actual document, doesn’t it, but what it in effect gets
used for is the very opposite of that, not a historical document, but a
contemporaneous document of what the patient’s having. Part of the issue is that
those two things are inherently incompatible.
(1A, 4A, 7A, 7B) M: The other thing is to look at it from a perspective … I was
looking at it in terms of if you look at it from a care homes perspective, what a MAR
chart’s for, is very different from a pharmacist’s perspective. I can do these things all
the time, and I’m ??? and the thing with it was, the MAR chart was the least
important thing from the pharmacists, the way they were preparing them. What was
important was the label and the prescription and everything else; and this was
completely incidental because we never really used it, which is why I think you find
all the errors, because a lot of the software wasn’t designed to integrate the MAR
chart or the labeling. I mean, now it’s getting better and better, but in a lot of places
this is what happens … the label, they prepare the product but because the
pharmacist doesn’t use the MAR chart it’s no value to them and legally they’re not
required to make one, it’s completely incidental. So it’s something that happens at
the end of the periphery of what they do. They prepare, supply the medicines and
they give that out, because that’s what the home wants. More often than not the
pharmacy never sees them and in a lot of places, you look at the error and ??? check
it. The important thing for them is the medicines and the labels and ?dossit? boxes,
that’s the legal thing and this is completely incidental, this is additional; and because
of that it gets pushed aside and I think the focus then for the pharmacist is the
medicines, not the MAR charts; and you can see that come through in how critical
they are, how much attention they pay to their MAR charts.
(2D, 7A) C: And the fact that there’s paracetamol, like three times, or cocodomal.
There’s just not the same care when you’re checking it. It’s not given at all to the
MAR chart.
70
A: Sorry. When who’s checking it?
(2D, 7A) C: The pharmacist. Are not checking it.
A: Sorry, you mean the man or the woman in the pharmacy who is dispensing the
medicine, checking it, or do you mean the pharmacist who actually goes into the
home and and makes sure that things …
C: The person who’s in the chemist.
A: The chemist shop, right.
(2D, 7A, 9B) M: What they should be doing is, they should have an audit trail in the
pharmacy for who checked the prescriptions when they came in, who prepared the
products, who dispensed them, who checked the ?dossit? boxes, who checked the
labels, who checked the PRNs which are done separately, but then most places you
go, it’s not reckoned ??? just the MAR chart. In some cases it’s the same person, but
in other cases it’s not. If you’ve got two pharmacists working, where they pre‐
prepare things, and then this is where the errors sneak in.
A: When you say checking them, they’re checking them against ...?
(2D, 7A) M: The prescription. Making sure that it’s an accurate record of what the
person should be on.
(7A) A: Right. So, in effect, what you’re saying is the pharmacist sees his role as
ensuring that what goes out of the pharmacy matches what the prescription is, but
not part of the role to decide what the prescription says is what the patient ought to
be having.
71
(7A, 9A, 9B) M: No, no. I think the pharmacist has that responsibility, not just to
supply it but also more than that; but too often what happens is that, and the
problems that I’ve had in Leeds in some of the pharmacies when we’ve found errors
in care homes, is that the pharmacist thinks it’s ??? prescription hasn’t had that drug
and if there isn’t a prescription, you don’t need to follow it up. For example,
something starts last month and they haven’t got another prescription for him, if he
hasn’t had a repeat after discharge or something like that, and they don’t bother …
they don’t challenge any omissions or additions on the prescriptions. They just think
“Oh, the legal prescription act …” but what you’re saying is actually right, what they
should be doing is looking at are they entitled to supply legally and is it something
the patient needs? Or is something missing that the patient needs
(8A, 9B) K: Well, the care home, whoever does the repeat order at the care home, has
a responsibility to say “The script’s come back and actually they were put on
something in hospital and that isn’t on this, and therefore it needs to go back to the
GP to say in fact you need to do me a script for the ??? because it’s not on this
prescription.
D: That’s right.

72