care homes: how being average can make you profitable
TRANSCRIPT

CARE HOMES
FORGETABOUT

FORGETABOUT
CARE HOMES

AVERAGEIS THE KEY
CARE HOMES - FOR NOW

CARE HOMES – WE NEED
AVERAGESUPPLY

AVERAGESUPPLY
AVERAGECARE HOMES – WE NEED
Source: Colliers International Healthcare Market Review 2015 Care Homes
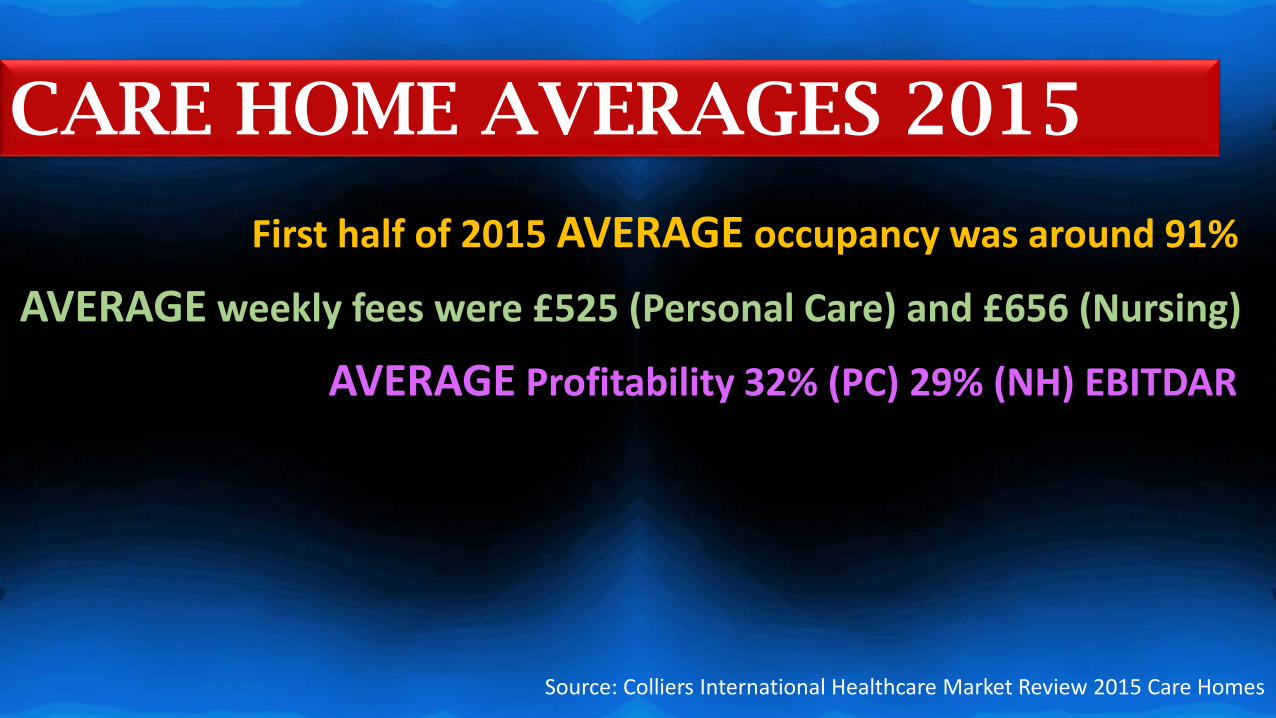
CARE HOME AVERAGES 2015
First half of 2015 AVERAGE occupancy was around 91%
AVERAGE weekly fees were £525 (Personal Care) and £656 (Nursing)
AVERAGE Profitability 32% (PC) 29% (NH) EBITDAR
Source: Colliers International Healthcare Market Review 2015 Care Homes
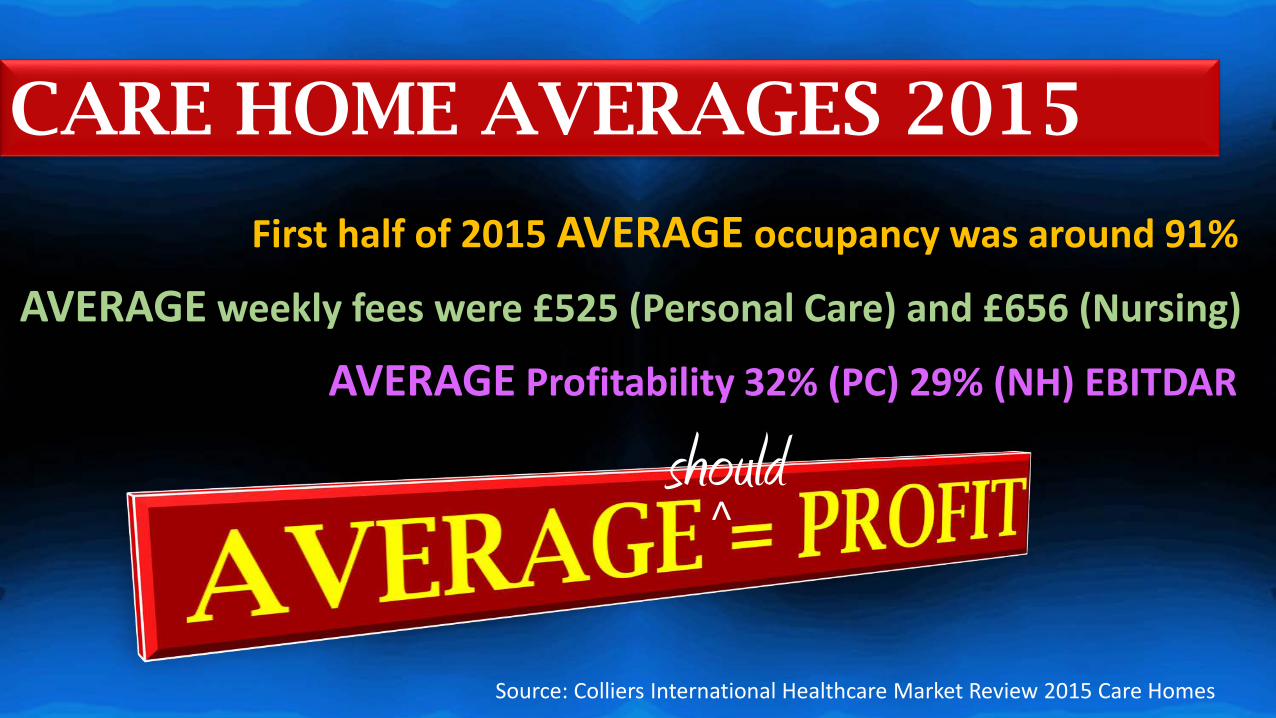
First half of 2015 AVERAGE occupancy was around 91%
AVERAGE weekly fees were £525 (Personal Care) and £656 (Nursing)
AVERAGE Profitability 32% (PC) 29% (NH) EBITDAR
should^
CARE HOME AVERAGES 2015

Source: Colliers International Healthcare Market Review 2015 Care Homes
SUPPLY & DEMAND AVERAGES
90% OF THE CARE HOME POPULATION IS 75 OR OLDER
THERE ARE ON AVERAGE 89 BEDS PER ‘000 75 PLUS POPULATION IN ENGLAND

90% OF THE CARE HOME POPULATION IS 75 OR OLDER
THERE ARE ON AVERAGE 89 BEDS PER ‘000 75 PLUS POPULATION IN ENGLAND
Source: Colliers International Healthcare Market Review 2015 Care Homes
SUPPLY & DEMAND AVERAGES
should^

BUT ONLY 1 IN 3 Local Authorities are within 5% of the AVERAGE
Highest Local Authority 72% higher than the AVERAGELowest Local Authority 68% lower than the AVERAGE
AVERAGE SUPPLY = 89 beds per 000

BUT ONLY 1 IN 3 Local Authorities are within 5% of the AVERAGE
Highest Local Authority 72% higher than the AVERAGELowest Local Authority 68% lower than the AVERAGE
AVERAGE SUPPLY = 89 beds per 000

Low average occupancy levels. Empty beds = reduced care + poor trading > closures
New applications permitted in these areas will just make the situation worse

Little or no local choice for those needing care
People and their families having to find care in other local authorities, miles away

Little or no local choice for those needing care
People and their families having to find care in other local authorities, miles away
NB! The demand for care home beds could grow by 40% over
the next 10 years

Do not permit planning permission when there is already enough supply, both now and for the futureIgnore petty “damage the area” arguments and permit applications where care is or will be needed

Don’t get involved in already over supplied areas, and consider areas that need extra care provisionSuch areas are more likely to provide higher occupancy levels to benefit trading performance

The CSI Care Sector Market Model can accurately report current supply and demand levels and forecast the next 20 years, based on an agreed radius from a location.

The CSI Care Sector Market Model can be used to prove or disprove the need for new care home beds within a local area

The CSI Care Sector Market Model can save you time, and make you money, and together we will work towards providing quality care on a local basis for our elderly, wherever they live.

The CSI Care Sector Market Model helped St Quentins Care Home, Staffordshirewin an appeal against a refused planning application by proving a current and future demand for extra beds in the area.

The Loft, 7 Warwick Street Worthing, West Sussex BN11 3DF Tel: 01903 256 519
www.caresectorinnovations.co.uk
@CareSectorInnov
Market Intelligence
Intelligent Marketing