care management entity quality collaborative technical
TRANSCRIPT

Care Management Entity Quality CollaborativeTechnical Assistance Webinar Series
Determining CME Costs to Inform Financing
June 20, 2011, 2:00 – 3:30 p.m., ET
For audio and to participate, dial: (866) 699-3239Meeting/Event Number: 716 761 871
In case of technical difficulties, call (609) 528-8400
This document was developed under grant CFDA 93.767 from the U.S. Department of Health and Human Services, Centers for Medicare & Medicaid
Services. However, these contents do not necessarily represent the policy of the U.S. Department of Health and Human Services, and you should not assume
endorsement by the Federal Government..

2
CHCS PrioritiesOur work with state and federal agencies, Medicaid health plans, providers, and consumers focuses on:
2
Integrating Care for People with Complex and Special Needs
Improving Quality and Reducing Racial and Ethnic Disparities
Building Medicaid Leadership and Capacity
Enhancing Access to Coverage and Services

Maryland, Georgia and Wyoming Collaborative CHIPRA Grant Project
Goal: Improving the health and social outcomes for children with serious behavioral health needs.Implement and/or expand a Care Management Entity (CME) provider model to improve the quality - and better control the cost - of care for children with serious behavioral health challenges who are enrolled in Medicaid or the Children’s Health Insurance Program.
3

Care Management Entity Quality CollaborativeTechnical Assistance Webinar Series
Determining CME Costs to Inform Financing
.

CME Costs
Shannon Van DemanKnute Rotto
5

Choices, Inc.
• Built as a Care Management Organization in 1997 – 14 years ago. (non profit, non provider)
• Started in Indianapolis, Marion County – now in 23 counties across Indiana
• Ohio (8 yrs); Maryland (5 yrs) and Washington DC (3 yrs).
• Manage the clinical and fiscal process for high cost, highly complex youth in counties and states
6

Choices Operations
• Systems of Care Principles (clinical)– Family Centered Involvement– Wraparound Process– Multi‐system Coordinated Care
• Care Management technologies (fiscal)– Capitated or Case Rates– Outcome Based– Flexible Funding
• Technology blending clinical & fiscal– Real Time Data – Data driven decision making
7

Care Management Operations
• Clinical operations:– 1 Supervisor to 6‐7 Care Coordinators– 1 Care Coordinator to 10 clients
• Scalable up – this forms a “team” within the organization• 120 clients are needed to scale operations
– 1 Clinical Director– 1 Provider Network Director
• Administrative operations:– Program Director– Finance Director– IT/HR/Outcomes & Evaluation
8

If you’ve seen one CME, then you’ve seen one CME.
If you’ve seen one case rate, then you’ve seen one case rate.
9

CME “Buckets” of Cost
Care Coordination
• Care Coordination• Clinical Supervision
Start‐Up
• One time• Initial or with Expansion
Administration
Services
• All other service costs
• RTC, therapy…
• Not involved with direct care
• IT, HR, Fin, O&E…
10

Start‐Up
Estimating Start‐Up Cost
•Office remodeling, wiring, painting, etc.• Training (outside certifications?)• Equipment (servers, firewalls, phones, laptops, desktops, printers…)
• Office furniture (desks, chairs, filing cabinets, cubes, book shelves, tables…)
• Software (MS Office licensing, information management system…)
• Initial “unproductive” staff time
Start‐Up
11

Start‐Up
Defining Functions of a CME
•Finance & Accounting‐Cost modeling, claims adjudication, contracting
•Information Technology‐Info management system, networking, programming
•Communications and Social Marketing‐Website, reports
•Outcomes and Evaluation‐Training, QA, outcome reporting
•Human Resources‐Hire, retain, and support staff
Administration
12

Start‐Up
Estimating Administration Costs
•Identify personnel needed to fill functions•Salaries, fringe, & recruiting costs
•Consultation?•Travel•Facility (rent, utilities, housekeeping)•Office supplies•Equipment leases•Telecommunications, internet, cell service•Hardware & software•Insurance (general and professional liability)
Administration
13

Start‐Up
Estimating Care Coordination Costs
• Youth to CC ratio and CC to supervisor ratio• Salary, fringe, & recruiting costs
•Travel•Facility (rent, utilities, housekeeping)•Office supplies•Equipment leases•Telecommunications, internet, cell service•Hardware & software•Insurance (general and professional liability)
Care Coordination
14

Start‐Up
Estimating Service Costs
• First Who?• Then What?• Then How Much?
• How many youth will use services?• How many units of service will each youth use?
• How much does one unit of service cost?
Services
15

How many youth will use services?
Service Min Mode Max
Mentoring 5% 14% 23%
Service 2 . . .
. . . .
16

How many youth will use services?
How much does oneunit of service cost?
Service Min Mode Max
Mentoring 5% 14% 23%
Service 2 . . .
. . . .
Service Min Mode Max
Mentoring 49 73 97
Service 2 . . .
. . . .
Service Min Mode Max
Mentoring $20 $35 $50
Service 2 . . .
. . . .
How many units of service will each youth use?
17

How many youth will use services?
How many units of services will each youth use?
How much does oneunit of service cost?
18

19

Combining Costs to Develop Different Financial Models
Care Coordination
Start‐Up Administration
Services
What financial model should be used to fund the CME?
•Fixed Annualized Budgets•Case Rates•Cost Reimbursement•Fee For Service
20

All Inclusive Case Rate
Care Coordination
Start‐Up
Administration
Services
21

Fixed Budgets and Services Case Rate
Start‐Up
Administration
Services
Care Coordination
22

Fixed Budget, Admin & CC Case Rate, & Cost Reimbursed Services
Start‐Up
Administration
Services
Care Coordination
23
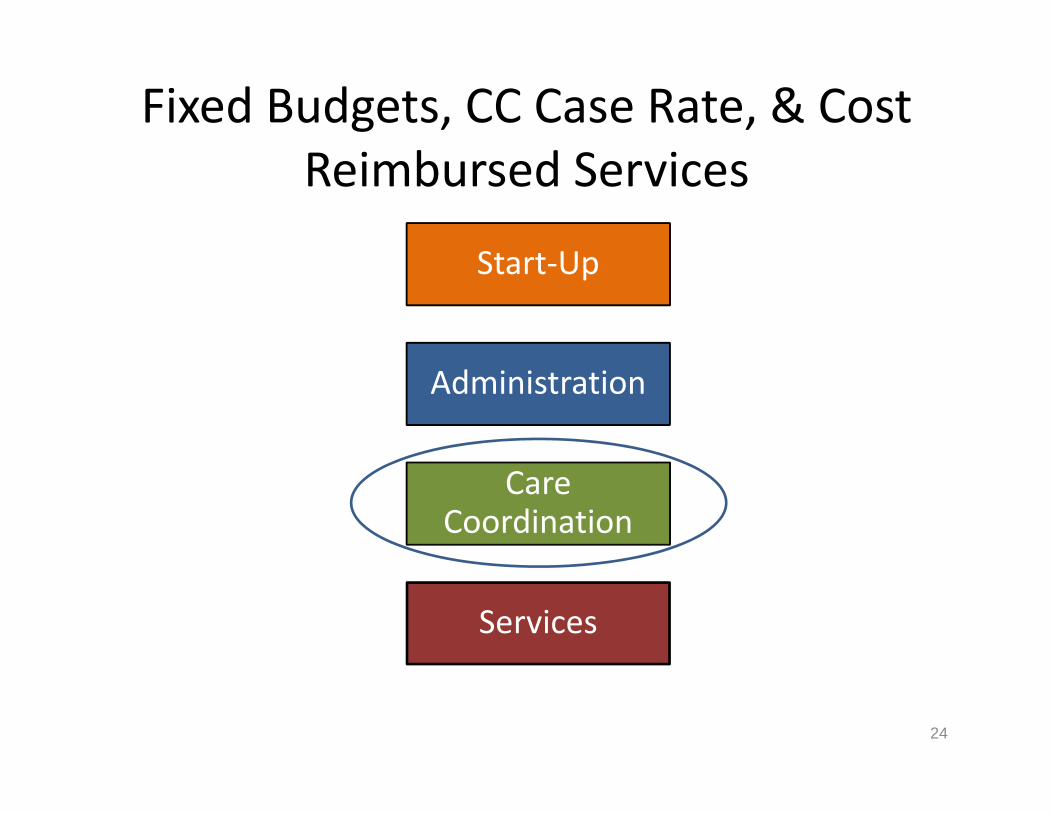
Fixed Budgets, CC Case Rate, & Cost Reimbursed Services
Start‐Up
Administration
Services
Care Coordination
24

Financial Risk
CME risk high CME risk lowFunder risk low Funder risk high
25

CME risk high CME risk low
Funder risk low Funder risk high
Financial Model
All Inclusive Case Rate Fixed Budgets & Services Case Rate
Fixed Budgets, Admin and CC Case Rate, & Services Reimbursed
Pros / Cons
•Funder has fixed costs•Flexibility to scale up and down•Incentivize CME to have low admin, CC, and service costs•Unstable census can be difficult to manage•Cost shifting can occur•Large gains & losses experienced by CME
•Funder has fixed costs•Little ability to scale up and down•Incentivize CME to have low service costs•Incentivize funder to maintain census •Fixed admin budget helps with planning•Cost shifting can occur•Moderate gains & losses experienced by CME
•CME has fixed costs•Flexibility to scale up and down•Incentivize CME to have low admin & CC costs•Incentivize funder to have low service costs•Not much opportunity for cost shifting•Large gains & losses experienced by funder
Comparing Risk Structures
26

Wraparound Milwaukee: Determining Costs,
Calculations, Case Rates, Capitation and Other Strategies
Presented By:
Bruce Kamradt, MSW, Director Wraparound Milwaukee

Mechanisms for Blending, Braiding or Pooling Funds Across Systems
Case RatesCapitationFixed AllocationsFee-for-ServiceExpense Based Contracting
29

What are Pooled Funds? CHILD WELFARE
Funds thru Case RateBudget for InstitutionalCare for CHIP Children
JUVENILE JUSTICE
Funds Budgeted for Residential Treatment and Juvenile Corrections Placements
MEDICAID CAPITATION
$1843 per Month per Enrollee
MENTAL HEALTH
•CRISIS BILLING• BLOCK GRANT•HMO COMMERCIAL INS.
WRAPAROUND MILWAUKEECARE MANAGEMENT ORGANIZATION
(CMO)$45 M
CHILDAND FAMILY
TEAM
PLANOF
CARE
$10.0M $11.0M $16.5M $7.5M
30

Funding Sources for Wraparound Milwaukee
Child Welfare: • case rate• direct funding for dedicated crisis teamDelinquency and Court Services:• fixed funding• case rate for FOCUS youth (alternative to corrections
commitment)Medicaid:• capitation• fee-for-service for crisis servicesMilwaukee Public School System:• fixed funding for dedicated crisis team• Safe-Schools funding
31
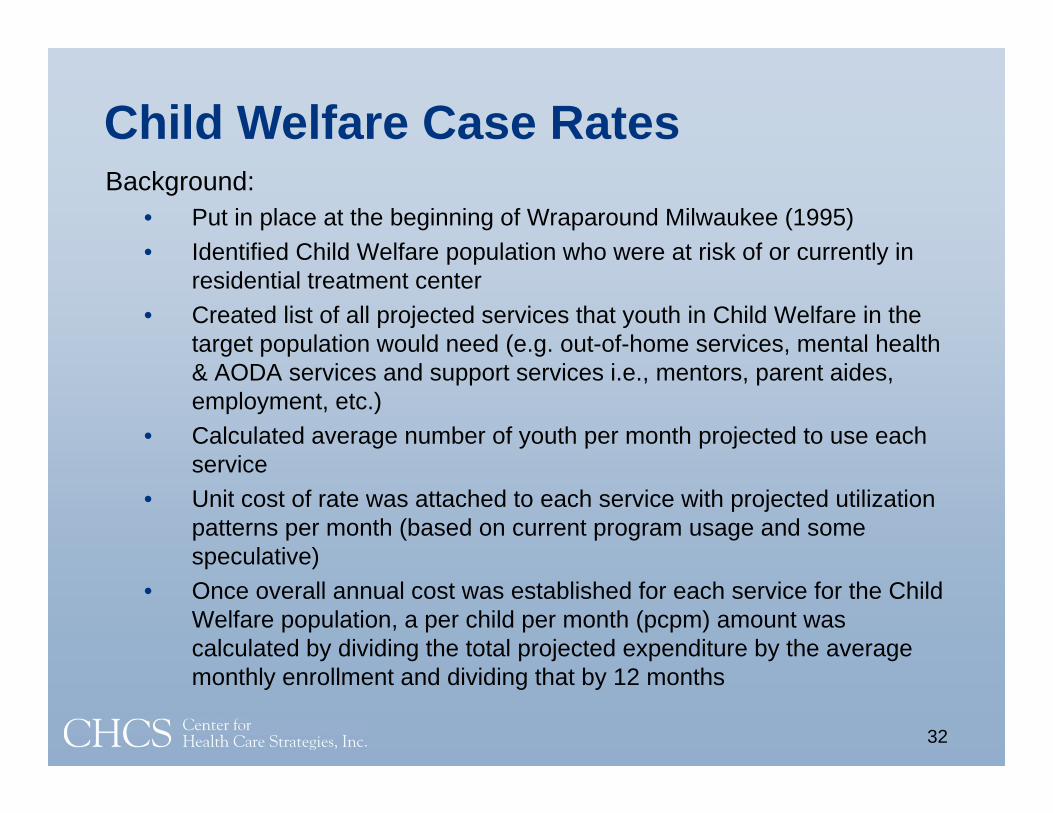
Child Welfare Case RatesBackground:
• Put in place at the beginning of Wraparound Milwaukee (1995)• Identified Child Welfare population who were at risk of or currently in
residential treatment center• Created list of all projected services that youth in Child Welfare in the
target population would need (e.g. out-of-home services, mental health & AODA services and support services i.e., mentors, parent aides, employment, etc.)
• Calculated average number of youth per month projected to use each service
• Unit cost of rate was attached to each service with projected utilization patterns per month (based on current program usage and some speculative)
• Once overall annual cost was established for each service for the Child Welfare population, a per child per month (pcpm) amount was calculated by dividing the total projected expenditure by the average monthly enrollment and dividing that by 12 months
32

Child Welfare Case Rates (cont.)Example of Projecting Rate Across Benefit Plan:
Projected average enrollment = 300 youth (or 3600 annual enrollment months)Service Calculation:
Individual Therapy = • 100 youth per month x $65/hr x 5 hours/month of utilization x
12 months = $390,000• $390,000 ÷ 12months ÷ 300 enrollees = $108.33 (pcpm)Mentors =• 60 mentors x $25/hr x 32 hrs/mo x 12 months = $576,000• $576,000 ÷ 12 months ÷ 300 enrollees = $160.00 (pcpm)Residential Treatment = • 50 youth/mo x $7500/mo x 12 months = $4,500,000• $4,500,000 ÷ 300 enrollees ÷ 12 months = $1,250,000 (pcpm)
33

Child Welfare Case Rates (cont.)Original case rate negotiated with Child Welfare (1995) = $3300 pcpm for minimum of 12 months or until child was disenrolledCurrent case rate (2011) = $3,984.58 pcpm• 21% increase over 15 years or 1.4% per year
Wraparound Milwaukee currently serves 240 youth in Child Welfare In addition to case rate, Child Welfare provides $725,000 per year for dedicated mobile crisis services through an expense-based contractChild Welfare reduces case rate by 50% per month for youth with dual delinquency and dependency petitions
34

Delinquency and Court ServicesBackground for Fixed Funding:
Wraparound Milwaukee receives one twelfth of $8.4m fixed funding amount each month Fixed funding amount was established based on the total $ Delinquency Services spent on residential treatment placement in 1996Wraparound Milwaukee agrees to serve all delinquent youth who meet program eligibility as determined by Wraparound Milwaukee screening/assessment unit. Eligibility Criteria includes:
• DSM-IV Diagnosis• Psychiatric condition and/or impairment at home, school or in the community• A condition that has persisted for at least six months and is likely to persist for a
year or more• Involvement in 2 or more service systems i.e., mental health, Child Welfare, or
special education• At immediate risk of residential treatment, juvenile correctional or psychiatric
impatient placementWraparound Milwaukee can decline to accept any delinquent youth who doesn’t meet enrollment criteria or when the program capacity does not permit additional enrollment
35

Delinquency and Court Services – cont’dBackground for Case Rate:
Milwaukee County pays for placements of delinquent youth committed; 75% of youth have a DSM-IV diagnosis and meet SED eligibility criteriaWraparound Milwaukee and Delinquency Services established FOCUS six years ago as an alternative to State Juvenile Corrections placement:Juvenile is committed to the Dept. of Corrections but the Judge “stays the orders” and orders them to Wraparound FOCUS program – program serves up to 42 youthIn 2005 Delinquency Services & Wraparound Milwaukee established case rate of $3500 per month (50% of the monthly cost of a correctional placement)Wraparound Milwaukee “pulls down” Medicaid capitated rate of $1842 per month as eligibility & custody stay in the communityIf child needs crisis intervention or a crisis stabilizer, that is billed on a fee-for-service basisWraparound Milwaukee:
• assumes all the service & administrative costs for the program• currently serves about 420 delinquent youth among 3 programs
36

Medicaid Capitation – PricingWraparound Milwaukee submits:
Utilization data (services paid) to the WI Dept of Health – Medicaid annuallyEnrollment data to Medicaid monthly, Medicaid verifies eligibility and pays capitated rate x the number of Medicaid enrollees (averages 94% of total population)
Medicaid:Reviews the service codes to determine what is covered service versus what is notUses a measurement conversion and adjusts the cost of services covered, for each service code, by the relevant WI maximum allowable fee ratesDevelops a final rate and Wraparound Milwaukee receives 95% of Medicaid cost (allowable residential treatment cost under is calculated through an established formula with the current proration being 59.96% Medicaid allowable. A separate calculation is used for treatment foster care)
Rates:Must be approved by CME each year – July 1 of each year for the new capitation rateHave been adjusted over the past 15 years and have gone from $1300 pcpm to the current $1843 pcpm
37

Other Lessons Learned About Rates and the CME Model
Not every service that is authorized is actually utilized: • Authorized to paid services runs approx.80%The cost for each target population of SED youth served may vary significantly:• Costs for delinquent youth are about 1/3 less than
average monthly cost for youth in Child Welfare, and length of stay is 6 months less on average
38

Managing CostsDevelop a good business flow model to understand revenues and expendituresUtilization Management is important in tracking:
• Average cost per month per participant• Service utilization trends• Capitation or case rate payments received• Authorizations versus payments (about 80% of what
is authorized is delivered)Administrative costs for Wraparound Milwaukee which include some direct service staff (i.e. Mobile Crisis staff and 1.5 psychiatry staff), equals about 10% of our entire budget
39

Managing and Tracking CostsOn-going utilization management:
• IT system (Synthesis) tracks costs on a per child per month basis (pcpm)
Use of prior authorization for high cost services like residential treatment or psychiatric hospitalizationRisk pool techniques are followed and savings can be retained from year to yearContracts/MOU’s that identify the financing arrangements were developed with child serving systemsFlexible court orders allow WM to more easily move children between out-of-home resources and their own home and community which reduces unnecessary and inappropriate institutional careGood communication maintained through our Partnership Council:
• frequent meetings of administrators • written conflict resolution procedures• shared reports
40

Wraparound Milwaukee Organizational Chart
MEDICAL DIRECTORD. Kozel, M.D.
FAMILY ADVOCACYFAMILIES UNITED OF
MILWAUKEEMargaret Jefferson, DirectorMargaret Jefferson, Director
WRAPAROUNDMILWAUKEE
BruceKamradt, Director
INTERNAL OPERATIONSAdmin. Coord.
ENROLLMENTS&
DISENROLLMENTSClinical Coord
3 AssessmentStaff
CHILDREN'SCOURT
LIAISONS3 Staff
VerificationsInvoicing/ ProviderProvider LogsAccounts Receivable
MANAGEMENT INFORMATION
Consultant
Synthesis SoftwareApplication
QUALITY ASSURANCE
Coordinator
MOBILE URGENTTREATMENT TEAM
Director
20 Psych. Soc.2 Clin. Psych.1 Reg. Nurse
PROVIDERNETWORK
Network Coord.
220 Plus Agencies80 Services
NETWORK.
DEPUTY DIRECTORM. J. Meyers, M.S.
2 Staff
8 CARE COORDINATION
AGENCIES8 -Supervisors
100 Care Coord
-FISCALSERVICES
Admin. Coord
FISCALSERVICES
Coord
41

Finance Office Processes T19
Application(Including FAST Determination)
BMCW Billed Monthly• $131 per Day From Bureau of Milwaukee Child Welfare
• Monthly Meetings to Reconcile Discrepancies
4 E Eligibility Determined
State Eligibility for Fed Dollars
T19 Eligible• Receive Monthly Case Rate
• Monthly Report Reconciled
• Monitor Eligibility Status for Change
Per Month Fixed Rate• 1/12th of Delinquency and
Court Service Annual Out-of Home Placement Budget
• Monitor County Budget for Monthly Fund Transfer
Care Coordinator Authorizes ServicesOn a Monthly Basis
Service Providers/Vendors• Invoice Online (60 day limit)• Payment Check processed weekly• Invoices over 60 days require
Administrative Approval for payment
Crisis Stabilization & Crisis Respite• Billed to T19 for T19 Eligible Clients
Transportation• Review Monthly Log prior to
Payment• Process medically Eligible Services
for Re-payment by Medicaid
Not T19 Eligible• Monitor
Eligibility Status for Change
BMCW Billed Monthly• $65 per Day From Bureau of Milwaukee Child Welfare
• Monthly Meetings to Reconcile Discrepancies
Delinquency• Delinquency Fixed Rate
If Child Placement Fosteror Kinship Care
• Finance Office Responsible for Payments while in Wraparound Payments Processed Monthly
Authorizations Above Maximum Allowable Units of Service
• Reviewed by Quality Assurance Staff
Determine T19 Eligibility
Child Enrolled in Wraparound
Care Coordinator Assigned
Notice from CC
Child’s Placement
has Changed
Business Office Processes
Delinquent
Wraparound Milwaukee – Business Office Flow Chart
42

Service Utilization TrendsService Utilization Trends(2011 Service Data is Reflective of payments for January and February services only)
Service GroupTotal paid in 2011
Total paid in 2010
2011 % of Total
2010 % of Total
Per Child Per Month 2011
Per Child Per Month 2010
2011 # of Youth
2010 # of Youth
2011 % of Total Enrollees
2010 % of Total Enrollees
AODA Svcs 14,118 90,904 0.2% 0.2% 7.78 8.45 62 195 6.5% 13.1%Care Coordination 1,374,628 7,840,642 22.6% 21.1% 757.37 728.41 961 1,487 100.0% 100.0%Child Care/Recreation 10,419 168,445 0.2% 0.5% 5.74 15.65 18 119 1.9% 8.0%Crisis 560,124 3,039,341 9.2% 8.2% 308.61 282.36 577 1,022 60.0% 68.7%Day Treatment 30,720 138,001 0.5% 0.4% 16.93 12.82 9 34 0.9% 2.3%Discretion/Flex Fund 20,692 192,697 0.3% 0.5% 11.40 17.90 144 659 15.0% 44.3%Fam/Parent Support Svcs 30,300 248,203 0.5% 0.7% 16.69 23.06 69 204 7.2% 13.7%Foster Care 574,817 3,889,734 9.5% 10.5% 316.70 361.37 121 221 12.6% 14.9%Group Home 754,551 4,623,192 12.4% 12.4% 415.73 429.51 112 295 11.7% 19.8%In-Home 260,387 1,837,187 4.3% 4.9% 143.46 170.68 376 816 39.1% 54.9%Inpatient 95,691 636,995 1.6% 1.7% 52.72 59.18 36 168 3.7% 11.3%Life Skills 69,183 710,016 1.1% 1.9% 38.12 65.96 92 281 9.6% 18.9%Med. Mgmt/Nursing 32,330 187,540 0.5% 0.5% 17.81 17.42 141 361 14.7% 24.3%Outpatient 127,472 720,578 2.1% 1.9% 70.23 66.94 344 623 35.8% 41.9%Psychological Assmts 10,180 44,180 0.2% 0.1% 5.61 4.10 20 86 2.1% 5.8%Residential Treatmt 1,984,967 11,952,446 32.7% 32.1% 1,093.65 1,110.41 163 379 17.0% 25.5%Respite 16,560 143,905 0.3% 0.4% 9.12 13.37 19 97 2.0% 6.5%Transportation 70,621 433,648 1.2% 1.2% 38.91 40.29 314 713 32.7% 47.9%Youth Support Svcs 39,961 291,109 0.7% 0.8% 22.02 27.04 108 316 11.2% 21.3%T ota l $6,077,721 $37,188,763 100.0% 100.0% 3,348.61 3,454.92 961 1,487
43

44

45

Financial OutcomesCost:
• Wraparound Milwaukee = about $3700/mo • Residential placement = $10,000/mo • Correctional placement = $8500/mo Inpatient psychiatric care ($1500/day) was reduced from 5000 to 500 days/yearJuvenile correctional placements (70% of youth with DSM-IV diagnosis) was reduced by 50%Growth of residential costs has been brought under control since new Wraparound model was implemented:• Child Welfare and Juvenile Justice expenditures:
On residential treatment care for 375 youth (1995) = $18.4mContributions to Wraparound Milwaukee for nearly 700 youth at risk of residential treatment under a court order (2010) = about $19 million
46