caribbean development bank annual report 2020
TRANSCRIPT


CARIBBEAN DEVELOPMENT BANK ANNUAL REPORT 2020 | 2

CARIBBEAN DEVELOPMENT BANK ANNUAL REPORT 2020 | 3
CARIBBEAN DEVELOPMENT BANK ANNUAL REPORT 2020 | 4
“The purpose of the Bank shall be to contribute to the harmonious economic growth and development of the member countries in the Caribbean (hereinafter called the "region") and to promote economic co-operation and integration among them, having special and urgent
regard to the needs of the less developed members of the region.”
Article 1 - Agreement establishing the Caribbean Development Bank
CDB intends to be the leading catalyst for development resources into the Region, working in an efficient, responsive and collaborative manner with our Borrowing Member Countries and other development partners,
towards the systematic reduction of poverty in their countries through social and economic development.
PURPOSE
MISSION STATEMENT

CARIBBEAN DEVELOPMENT BANK ANNUAL REPORT 2020 | 5
Wildey, St. MichaelBarbados, West Indies
BB11000
Hon. Mia Amor MottleyChairman
Board of GovernorsCaribbean Development Bank
Dear Chairman
I enclose the Annual Report of the Caribbean Development Bank for the year ended December 31, 2020, which the Board of Directors, acting pursuant to Paragraph 2 of Article 38 of the Agreement establishing the Caribbean Development Bank and in accordance with Section 18
of the By-Laws of the Bank, has requested me to submit to the Board of Governors.
Yours sincerely Wm. Warren Smith, Ph.D., CD
President

CARIBBEAN DEVELOPMENT BANK ANNUAL REPORT 2020 | 6
CONTENTS
SCARIBBEAN ECONOMIC REVIEW AND OUTLOOK 18
Overview
BMCs Performance
Labour Markets
Fiscal Performance and Debt
Outlook
1PROJECTS PERFORMANCE REVIEW 28
Climate Change and Disaster Resilience
Renewable Energy and Energy Efficiency
Economic Infrastructure
Financial Intermediary Activities and Private Sector Development
MSME Development
Cultural and Creative Industries Innovation Fund
Regional Cooperation
Government
Education
Basic Needs Trust Fund
Procurement and Disbursements
2
DEVELOPMENT EFFECTIVENESS 44Overview
Level 1: Regional Development Progress
Level 2: CDB’s Contribution to Country Outcomes
Levels 3 and 4: Operational Effectiveness and Efficiency
3
20
22
23
25
27
30
32
33
35
36
36
37
37
39
40
42
46
46
46
49
INTERNAL FOCUS 50Human Resources Development
Internal Audit
Independent Evaluation
Integrity, Compliance and Accountability
4 52
54
54
56

CARIBBEAN DEVELOPMENT BANK ANNUAL REPORT 2020 | 7
RISK REVIEW
Organisation
Operational Risk
Environmental Risk and Climate Change
Credit Risk
Concentration Risk
Exposure Trends
Capital Risk
Internal Capital Adequacy Calculations
Market Risk
Interest Rate Risk
Foreign Exchange Risk
Liquidity and Funding Risk
New Developments
5
MANAGEMENT’S DISCUSSION AND ANALYSIS
Overview
Ordinary Capital Resource
Special Development Fund
Other Special Funds
Operations
6
61
61
63
63
63
66
67
68
69
69
69
71
71
58
7274
74
78
79
80
FINANCIAL STATEMENTS
Appendices
Board of Governors
Board of Directors and Alternates 2020-2022
Principal Officers of the Bank as at December 31, 2020
Abbreviations and Acronyms
7 82251
251
256
264
288

CARIBBEAN DEVELOPMENT BANK ANNUAL REPORT 2020 | 8
• $305 million (mn) in loans and grants approved for road projects:
• $190 mn for the upgrading of 121 kilometres (km) of roadway from Linden to Mabura Hill in Guyana. The largest CDB project to date.
• $60 mn to upgrade 125 km of the Philip S. W. Goldson Highway and the Remate Bypass Road, and improve the trade corridor between Belize, Guatemala, and Mexico.
• $55 mn to rehabilitate and improve 40 km of the Millennium Highway and West Coast Road in Saint Lucia.
BASIC NEEDS TRUST FUND (BNTF)
• 59 basic school classrooms built or upgraded benefitting 1,094 students.
• 196 teachers trained in elements of basic education
• 4,106 households benefitted from improved water supply and sanitation services integrated with water, sanitation and hygiene training (WASH initiative).
• Country-specific policy frameworks developed for planning and implementation of the next BNTF cycle.
ENERGY SECURITYAND WATER
• $8.6 mn approved for a five megawatt (MW) utility battery energy storage and a 1 MW grid-connected, solar photovoltaic system for St. Vincent and the Grenadines.
• 224 electrical inspectors and photovoltaic system installers in the Eastern Caribbean received training and international certification.
• $30 mn for upgrade of water supply systems serving communities in six parishes which will benefit 100,000 Jamaicans.
TRANSPORT
2020 HIGHLIGHTS
AT-A-GLANCE

CARIBBEAN DEVELOPMENT BANK ANNUAL REPORT 2020 | 9
CLIMATE CHANGERESILIENCE
• $14.8 mn in grants provided with support from the Canada-CARICOM Climate Adaptation Fund to eight governments for insurance premiums through the Caribbean Catastrophe Risk Insurance Facility.
• State of the Caribbean Climate Change 2020 report launched in partnership with the University of the West Indies to inform evidence-based planning and decision-making.
REGIONAL COOPERATIONAND INTEGRATION
• CARIFORUM-European Union Economic Partnership Agreement CARICOM Single Market and Economy Standby Facility for Capacity Building launched.
• $1.7 mn approved for regional cooperation and integration projects.
• Initiative commenced to establish an integrated digital portal for maritime ports in Member States of the Organisation of Eastern Caribbean States for more efficient processing of trade-related data for passengers and goods
EDUCATION
• In partnership with the Caribbean Examinations Council (CXC), completed development of a Digital Toolkit for the delivery of the Caribbean Advanced Proficiency Examination (CAPE) Environmental Science Syllabus.
PROCUREMENT
• Use of electronic procurement and disbursement solutions enabled by Borrowing Member Countries in response to COVID-19.
• Procurement procedures strengthened to enhance effectiveness and integrity provisions
INTEGRITY COMPLIANCEAND ACCOUNTABILITY
• First Caribbean Conference on Corruption, Compliance and Cybercrime held with over 860 online participants.
• Discourse on corruption broadened with awareness outreach to non-traditional target groups including youth and women.
HUMAN RESOURCEDEVELOPMENT
• Level 1 of Economic Dividends for Gender Equality (EDGE) certification obtained to transform CDB’s workforce by measuring, accelerating and certifying gender equality.
• Employee Wellbeing Programme launched.

CARIBBEAN DEVELOPMENT BANK ANNUAL REPORT 2020 | 10
CDB’S COVID-19 RESPONSE
AT-A-GLANCE
Some $182 mn for BMCs to tackle the fallout from the pandemic and other shocks.
About $67 mn in emergency loans to seven Caribbean countries
• $13 mn Antigua and Barbuda
• $15 mn Belize
• $2.5 mn Dominica
• $5.9 mn Grenada
• $10.8 mn Saint Lucia
• $11.3 mn St. Vincent and the Grenadines
• $8.2 mn Suriname
SUPPORT FOR BMCs
$65 mn in policy-based loans to three countries to facilitate COVID-19 response and to support economic recovery and resilience building in sectors hardest hit by the pandemic
• $15 mn Bahamas
• $20 mn Dominica
• $30 mn Saint Lucia
$50 mn loan-agreement with the Inter-American Development Bank to support continued COVID-19 response in the Member States of the Organisation of Eastern Caribbean States (OECS) in 2021.
In response, CDB provided multidimensional support to address the immediate needs of BMCs through mitigative intervention.
• Total support exceeded $190 millionIn 2020, COVID-19 fundamentally changed how we live, learn, work and do business in the Caribbean. The pandemic caused a decline in government revenues in Borrowing Member Countries (BMCs) while putting social services and health systems under pressure.

CARIBBEAN DEVELOPMENT BANK ANNUAL REPORT 2020 | 11
• Webinars for more than 1000 MSMEs, conducted on pivoting businesses during the pandemic.
• Collaboration with Caribbean Export Development Agency − $600,000 emergency response grant to assist export-oriented MSMEs.
• The University of the West Indies – $200,000 grant for computing devices for disadvantaged students across five campuses and free internet for 70 students for one semester.
• Saint Lucia – $59,000 repurposed from a previous loan for 130 tablets for special needs students.
• Collaborated with the CARICOM Secretariat and the UNESCO International Institute for Educational Planning to develop a framework for the safe re-opening of schools.
• Collaborated with the CARICOM Secretariat and the Caribbean Association of National Training Authorities to develop guidelines for the safe operation of classrooms, labs and workshops for technical and vocational training.
• CDB’s Cultural and Creative Industries Innovation Fund − $100,000 grant funding for seven cultural projects to mitigate loss of income.
Health• $3 mn grant to purchase personal protective equipment for healthcare workers in 14 countries.
• “Stronger Together 2020” campaign, an awareness initiative to promote positive coping strategies for COVID-19 and the hurricane season in partnership with the Pan American Health Organisation.
Education• Grenada – $4.2 mn from a previous loan repurposed for 15,000 laptops to improve online education for primary and secondary school children.
• Guyana – $310,000 from a previous loan repurposed to purchase laptops, tablets, projectors, and cloud storage for online technical and vocational teaching.
SUPPORT FOR SOCIAL SERVICES
SUPPORT FOR MICRO, SMALL AND MEDIUM-SIZED ENTERPRISES (MSMES)

CARIBBEAN DEVELOPMENT BANK ANNUAL REPORT 2020 | 12
President of CDB Wm. Warren Smith, Ph.D., CD.
CARIBBEAN DEVELOPMENT BANK ANNUAL REPORT 2020 | 12

CARIBBEAN DEVELOPMENT BANK ANNUAL REPORT 2020 | 13
PRESIDENT’S
STATEMENTIn 2020, the Caribbean Development Bank (CDB) marked
50 years of proudly contributing to the development of the Caribbean Region and improving people’s lives.
This achievement was overshadowed by the COVID-19 pandemic very early in 2020. What started as a health emergency quicky morphed into a global epidemic, testing the economic and social fabric of our Region.
The Caribbean’s first cases of COVID-19 were recorded in March, and pressure on the health system emerged as hospitalisations and the death toll rose. Regional governments responded proactively to limit the spread of the virus by imposing curfews, closing borders, and halt-ing non-essential activities. The resulting socio-economic impact was severe, leading to a surge in unemployment, loss of livelihoods and elevated poverty levels. The advent of the pandemic also greatly undermined resilience-building efforts in the economic and social spheres.
Regional gross domestic product (GDP) fell by 7.2% in 2020, after averaging 2.2% growth per year in the preceding five years. The service-oriented economies were hard-hit as a result of closed borders and physical distancing, in an effort to control the spread of the virus. Overnight visitors decreased by about 70% and cruise ship calls ceased from March. Meanwhile, the commodity-based economies faced depressed prices, as well as a slump in domestic demand. Fiscal and debt management came under severe pressure with increasing demands on governments to deal with the health emergency, offer social protection, and provide economic stimuli, even as government revenues were being eroded.
Meeting the collective needs of our Borrowing Member Countries (BMCs) in a period of sustained emergency was a paramount concern for CDB. These were unprecedented circumstances that required both traditional and innovative support to enable Governments to meet the unanticipated increases in expenditures to cover their COVID-19 response. At the same time, CDB’s response needed to strike the right balance between meeting the immediate needs of BMCs for budget and liquidity support; and ensuring that the operations are managed in a manner that will allow it to emerge in a post-COVID-19 environment capable of delivering on its longer-term development mandate.
Our strategy for engagement in 2020 was built largely on two pillars – responding to the immediate needs of the BMCs through mitigative intervention and enabling recovery and resilience. Our response was to buttress country efforts by financing the purchase of personal protective equipment to support frontline workers; providing emergency support to the most vulnerable segment of the population; promoting recovery through liquidity support to the MSMEs; and repurposing undisbursed project funds to provide debt relief support to selected BMCs whilst providing the fiscal space needed to meet pressing spending in the health and social sectors. Our policy-based operations, in conjunction with our traditional project assistance, facilitated a relaxation of the difficult liquidity constraint, and a deepening of their policy reform agenda for improved debt sustainability and economic and social resilience.
At CDB, our institutional resilience was also put to the test when, as a result of country lockdowns, we had to switch

CARIBBEAN DEVELOPMENT BANK ANNUAL REPORT 2020 | 14
Above: Honourable Mia Amor Mottley, (at left) Prime Minister of Barbados and Chairman of the Board of Governor of the Caribbean Development Bank (CDB) and CDB President Dr. Wm Warren Smith addressing the thanksgiving service held in February 2020 to celebrate the Bank's 50th Anniversary.
Above: In January 2020, the CDB welcomed a delegation from the Government of Saint Lucia to the Bank’s head of fice in St. Michael, Barbados. Present on that occasion were, (from left) Stephen Julien, Attorney General, Saint Lucia; Diana Wilson-Patrick, General Counsel; CDB, Yvette Lemonias Seale, Vice-President, Corporate Services and Bank Secretary; CDB, Hon. Stephenson King, Minister for Infrastructure, Ports, Energy and Labour, Saint Lucia; Dr. Wm Warren Smith, CDB President; Hon. Allen Chastanet, Prime Minister of Saint Lucia; Claudius Emmanuel, Permanent Secretary, Department of Economic Development and CDB Director, Saint Lucia; Albert Jean Baptiste, Chief Engineer, Saint Lucia; Hon. Guy Joseph, Minister for Economic Development, Housing, Urban Renewal, Transport and Civil Aviation, Saint Lucia and CDB Governor, Saint Lucia.

CARIBBEAN DEVELOPMENT BANK ANNUAL REPORT 2020 | 15
It is noteworthy that, during this period of considerable uncertainty, three credit rating agencies reaffirmed CDB’s credit rating, an expression of their confidence in the financial operations and management.
Despite the enormity of the challenges in 2020, CDB was able to remain faithful to its mandate and respond quickly and effectively to the needs of its BMCs. It would be remiss of me not to acknowledge the valuable contributions made by the Board of Directors, the Management, and the Staff in the achievement of the results and the milestones reached. Now, more than ever, we must put this strong spirit of collaboration, cooperation, and teamwork on display as the region continues its quest to overcome the obstacles which COVID-19 placed in its path to sustainable socio-economic development.
quickly to complete virtual operations in order to continue fulfilling our obligations to the BMCs. The Bank’s regular business processes continued seamlessly and engagement with clients sustained, as the technology facilitated remote access and allowed meetings to be conducted virtually.
We emerged as a major partner in the regional response to the COVID-19 pandemic, directing substantial financial and technical resources into the BMCs in 2020. Total approvals jumped to $557.2 mn from $340 mn in 2019; and disbursements rose to $361.3 mn from $306 mn over the same period. Approvals during the year included $190 mn for the Linden-to-Mabura-Hill project in Guyana, CDB’s largest approval to date.
We also signed a $50 mn loan agreement with the Inter-American Development Bank in December 2020, to support COVID-19 responses in Member States of the Organisation of Eastern Caribbean States. This line of credit will finance programmes to safeguard adequate quality of life and health for vulnerable citizens and provide support for MSMEs.
Wm. Warren Smith, Ph.D., CD
CARIBBEAN DEVELOPMENT BANK ANNUAL REPORT 2020 | 16
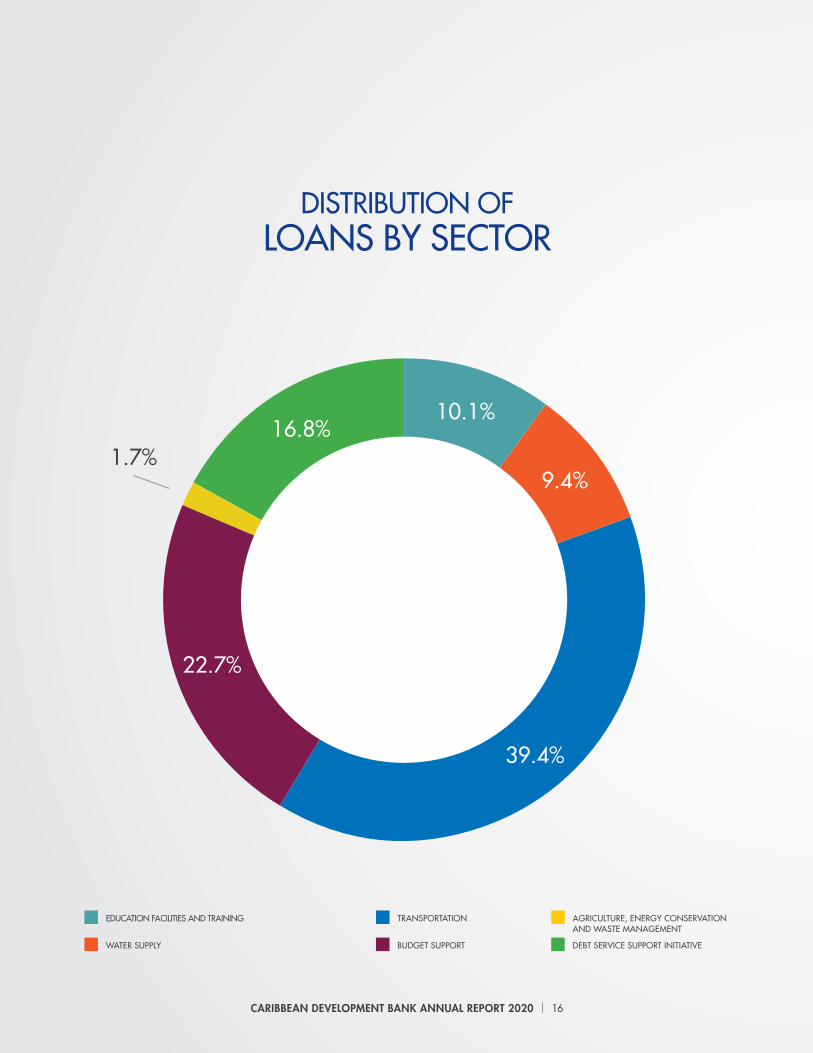
EDUCATION FACILITIES AND TRAINING
WATER SUPPLY
TRANSPORTATION
BUDGET SUPPORT
AGRICULTURE, ENERGY CONSERVATION AND WASTE MANAGEMENT
DEBT SERVICE SUPPORT INITIATIVE
DISTRIBUTION OFLOANS BY SECTOR
CARIBBEAN DEVELOPMENT BANK ANNUAL REPORT 2020 | 16

CARIBBEAN DEVELOPMENT BANK ANNUAL REPORT 2020 | 17
ANTIGUA AND BARBUDA
THE BAHAMAS
BELIZE
DOMINICA
ST. VINCENT AND THE GRENADINES
SAINT LUCIA
SURINAME
GRENADA
GUYANA
JAMAICA
DISTRIBUTION OF LOANS BY COUNTRY
CARIBBEAN DEVELOPMENT BANK ANNUAL REPORT 2020 | 16 CARIBBEAN DEVELOPMENT BANK ANNUAL REPORT 2020 | 17

CARIBBEAN DEVELOPMENT BANK ANNUAL REPORT 2020 | 18
CARIBBEAN ECONOMICREVIEW AND OUTLOOK
SECTION 1

CARIBBEAN DEVELOPMENT BANK ANNUAL REPORT 2020 | 19

CARIBBEAN DEVELOPMENT BANK ANNUAL REPORT 2020 | 20
Many BMCs, and particularly those most dependent on tourism, experienced severe economic contraction. Regional GDP fell by 7.2%. CDB worked closely with many affected BMCs to combat the effects of the pandemic, helping them to meet the necessary healthcare and social provisions, and by supporting economic activity.
The short to medium term outlook for BMCs is clouded by COVID-19. The immunisation of populations will take time; and even after that, health protocols could remain given the risk of new variants. This might hinder economic recovery. The challenge will be to steer the economies towards recovery while keeping the pandemic in check. BMCs will need to restart their resilience building and work to restore fiscal sustainability to create space and rebuild buffers and, to be better prepared for any future pandemic.
ln 2020, the economic performance in the Caribbean mirrored an emerging trend in the rest of the world. The COVID-19 pandemic, caused by the 2019 Novel Coro-
navirus (Severe Acute Respiratory Syndrome [SARS]-CoV-2), resulted in severe socio-economic hardship, serious illness and death. Economic activity came to a standstill as social distancing and public health measures were implemented to contain the spread of the virus. There was increased pressure on healthcare and social safety net systems, and on public finances as governments struggled to cope with rising expenditure and falling revenues.
Overview
In 2020 economic activity came to a standstill as social distancing and public health measures were implemented to contain the spread of COVID-19.

CARIBBEAN DEVELOPMENT BANK ANNUAL REPORT 2020 | 21
In 2020 COVID-19 created economic upheaval in the Region and the impacts on
income and poverty were significant. BMCs governments had to provide income
support to help sustain livelihoods.
CARIBBEAN DEVELOPMENT BANK ANNUAL REPORT 2020 | 21

CARIBBEAN DEVELOPMENT BANK ANNUAL REPORT 2020 | 22
BMCs Performance
The outbreak of COVID-19 in December 2019 spread rapidly around the world. The World Health Organisation declared a global pandemic on March 11, 2020, the same month that the virus was first detected in the Caribbean.
The health crisis rapidly created economic upheaval in the Region. Lockdowns were enforced as a precautionary health measure to contain the spread of the virus and ease pressures on health systems. This led to a sharp reduction in economic activity, particularly in the tourism-dependent economies, and a slump in domestic demand. The suspension of cruise operations and closure of international borders caused a steep decline in visitor arrivals. In Anguilla, the Bahamas, Barbados, Belize, Cayman Islands, Dominica, Grenada, and Saint Lucia, stay-over arrivals fell by around 70%. The decline in tourism activity had knock-on effects on the manufacturing, transport, distribution and real estate sectors. Construction activity fell in nearly every BMC, including the Bahamas, Dominica and the Virgin Islands, where rehabilitation and rebuilding had been underway after the recent passage of devastating hurricanes. Across the Region, there was a high incidence of worker lay-offs and business closures.
Commodity producers, especially in oil producing countries, such as Guyana, Suriname, and Trinidad and Tobago, were also affected. A downward trend in international oil prices, triggered by a price war between the Russian Federation and Saudi Arabia, continued as shutdowns resulted in a drop in global fuel demand. Consequently, export earnings were less than expected. Additionally, many planned investments, such as exploration drilling, were put on hold.
In Belize, a severe drought in 2019, exacerbated by reduced demand from the tourism sector caused a decline in agriculture production. By the third quarter, however, signs
of recovery had emerged, aided by relatively favourable weather conditions. Guyana, Haiti and Jamaica also reported increased production whilst output fell in Grenada and Saint Lucia.
With declining COVID-19 infection rates, restrictions were eased by the middle of the year, allowing for limited reopening of borders to accommodate international travel. However, the emergence of more virulent strains of the virus led to new waves of infection in major source markets and the reimposition of restrictions towards the end of the year. Small businesses in particular, faced catastrophic losses, and workers remained vulnerable to income loss and lay-offs. There was also pressure on foreign exchange reserves due to falling foreign direct investment inflows and lower remittances.
CDB estimates that regional GDP fell by about 7.2% in 2020. Only Guyana reported economic growth, boosted by the commencement of oil production.
Women, youth and informal workers in hard-hit areas such as tourism, were disproportionately affected by lockdown measures in 2020.

CARIBBEAN DEVELOPMENT BANK ANNUAL REPORT 2020 | 23
CHART 1: REAL GDP GROWTH (%) 2020
Source: Central Banks, Ministries of Finance, Statistical Offices, IMF, CDB
Labour Markets
Labour market shocks from the pandemic proved to be devastating for jobs and for livelihoods. The unprecedented scale of disruptions for workers due to business closures or inability to meet salaries, resulted in a rise in unemployment rates, along with deteriorating quality of employment across the Region.
In Belize, the unemployment rate was 13.7%, compared with 10.4% one year earlier. In September 2020, more than 38,000 persons were reported to be without work because of COVID-19, although not all were actively looking for work and therefore were not classified as unemployed.
There were notable increases in the unemployment rate in Barbados, the Bahamas, Grenada, and Jamaica. In Trinidad and Tobago, the rate of unemployment also rose as several companies, especially in the oil and gas sector, folded. The number of persons retrenched between May and September was 1,820, much higher than 469 during the same period in 2019.
Women, youth and informal workers, who are highly represented in vulnerable jobs in hard-hit areas such as tourism, were disproportionately affected by lockdown measures. In Jamaica, female unemployment increased to 13.0% in October, compared with 8.6% for males. The rate for young persons (aged 14-24 years) rose to

CARIBBEAN DEVELOPMENT BANK ANNUAL REPORT 2020 | 24
Lockdowns and border closures enforced in 2020 in response to
COVID-19 led to a decline in tourism activity in the Caribbean
which had knock-on effects onthe manufacturing, transport,
distribution and real estate sectors.
CARIBBEAN DEVELOPMENT BANK ANNUAL REPORT 2020 | 24
[Photo by Juan Jose – unsplash.com]

CARIBBEAN DEVELOPMENT BANK ANNUAL REPORT 2020 | 25
27.8%. In Belize, female and male unemployment was 17.0% and 11.6% respectively while youth unemployment was 23%.
Impacts on income and poverty were significant. BMC governments provided income support to help sustain livelihoods. In Barbados, the National Insurance Scheme paid out over $61.5 mn to about 32,000 claimants between March and October, tripling the total payment from the scheme in 2019. Supplemented by domestic and external borrowings, social security funds provided support in other BMCs. Some BMCs engaged proactively in the design and implementation of post-COVID-19 recovery plans. The Government of Barbados, for example, launched a programme to assist with the re-engagement of workers in the tourism sector.
Fiscal Performance and Debt
The pandemic had devastating effects on public finances, some of which were already weak. Governments had to mobilise additional resources to strengthen the resilience of their health systems, provide social protection to the most vulnerable, and stimulate economic activity. Measures to increase fiscal space were taken against a background of significantly declining tax revenues and already high debt levels. The fall in revenues affected the tourism and non-tourism-dependent BMCs. Oil revenues in Guyana and Trinidad and Tobago were well below original projections, given lower oil prices. The Governments of the Cayman Islands and the Virgin Islands reported lower revenue inflows from their financial services sector.
As a result, primary fiscal deficits averaged 5.0% in 2020 compared with deficits of just 0.9% in 2019. Governments closed funding gaps by repurposing existing project loans financed by CDB and other development partners, reprioritising and cutting back expenditure where possible, drawing down reserve funds where available, and increasing borrowing. CDB implemented a debt service initiative worth $66.6 mn, that allowed countries to expand fiscal space and redirect liquidity for meeting pressing spending needs. In addition, CDB provided policy-based loans totalling $90 mn to the Bahamas, Dominica and Saint Lucia, in support of their COVID-19 policy responses and to support economic recovery and resilience building.
After making good progress to address debt over-hang, BMCs debt levels rose in 2020 due to the impacts of the pandemic. Public sector debt averaged 84.4% of GDP, up from 66.4% of GDP in 2019. Many BMCs revised their timelines for reducing debt to below 60% of GDP, a key fiscal target. The Government of Barbados negotiated a downward revision of the fiscal targets under the country’s economic reform programme with the International Monetary Fund (IMF) to help mitigate the impact of the crisis.
Some countries were assessed to be at elevated levels of debt distress. The Government of Belize reached agreements with creditors to capitalise interest payments due on its commercial bond while the Government of Suriname faced downgrades of its credit rating to selected default by the major rating agencies. In Suriname, investors agreed to restructure two foreign currency bond issues, and negotiations commenced with the IMF and other international financial institutions for policy and financial support.

CARIBBEAN DEVELOPMENT BANK ANNUAL REPORT 2020 | 26
CHART 2: DEBT-TO-GDP (%)
Sources: IMF World Economic Outlook Database, central banks, ministries off finance, CDB estimates.
CARIBBEAN DEVELOPMENT BANK ANNUAL REPORT 2020 | 26

CARIBBEAN DEVELOPMENT BANK ANNUAL REPORT 2020 | 27CARIBBEAN DEVELOPMENT BANK ANNUAL REPORT 2020 | 27
Outlook
Prospects for economic recovery in 2021 are subject to significant uncertainty. The development and approval of new vaccines against COVID-19 have raised hopes for a return to levels of economic activity seen before the pandemic, but this will take time.
Upside and downside risks for the Region mainly revolve around how quickly and effectively populations can be
immunised. Meanwhile, building climate resilience is an ongoing process as the Region makes preparation for the perennial hurricane season starting in June and other weather-related events.
In the meantime, BMC governments must continue to strike a delicate balance between providing the requisite social and economic support to their populations, generating adequate fiscal surpluses and containing debt levels.

CARIBBEAN DEVELOPMENT BANK ANNUAL REPORT 2020 | 28

CARIBBEAN DEVELOPMENT BANK ANNUAL REPORT 2020 | 29
PROJECTS PERFORMANCE REVIEW
SECTION 2
CARIBBEAN DEVELOPMENT BANK ANNUAL REPORT 2020 | 30
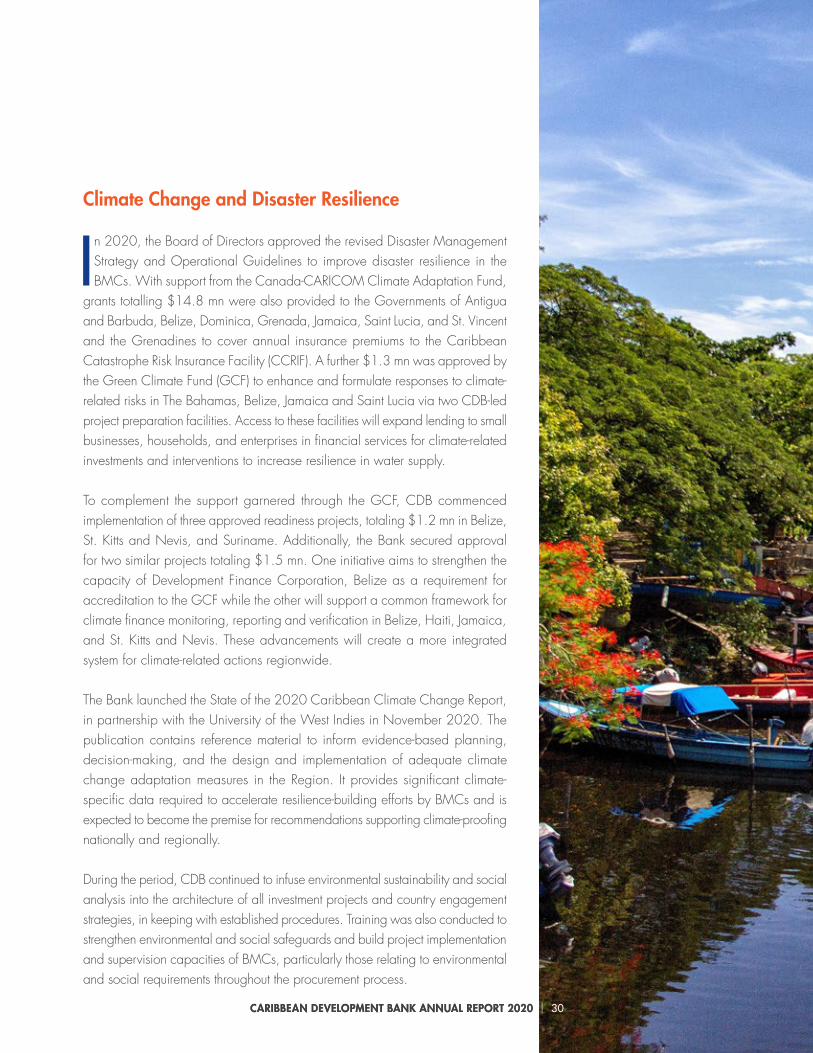
In 2020, the Board of Directors approved the revised Disaster Management Strategy and Operational Guidelines to improve disaster resilience in the BMCs. With support from the Canada-CARICOM Climate Adaptation Fund,
grants totalling $14.8 mn were also provided to the Governments of Antigua and Barbuda, Belize, Dominica, Grenada, Jamaica, Saint Lucia, and St. Vincent and the Grenadines to cover annual insurance premiums to the Caribbean Catastrophe Risk Insurance Facility (CCRIF). A further $1.3 mn was approved by the Green Climate Fund (GCF) to enhance and formulate responses to climate-related risks in The Bahamas, Belize, Jamaica and Saint Lucia via two CDB-led project preparation facilities. Access to these facilities will expand lending to small businesses, households, and enterprises in financial services for climate-related investments and interventions to increase resilience in water supply.
To complement the support garnered through the GCF, CDB commenced implementation of three approved readiness projects, totaling $1.2 mn in Belize, St. Kitts and Nevis, and Suriname. Additionally, the Bank secured approval for two similar projects totaling $1.5 mn. One initiative aims to strengthen the capacity of Development Finance Corporation, Belize as a requirement for accreditation to the GCF while the other will support a common framework for climate finance monitoring, reporting and verification in Belize, Haiti, Jamaica, and St. Kitts and Nevis. These advancements will create a more integrated system for climate-related actions regionwide.
The Bank launched the State of the 2020 Caribbean Climate Change Report, in partnership with the University of the West Indies in November 2020. The publication contains reference material to inform evidence-based planning, decision-making, and the design and implementation of adequate climate change adaptation measures in the Region. It provides significant climate-specific data required to accelerate resilience-building efforts by BMCs and is expected to become the premise for recommendations supporting climate-proofing nationally and regionally.
During the period, CDB continued to infuse environmental sustainability and social analysis into the architecture of all investment projects and country engagement strategies, in keeping with established procedures. Training was also conducted to strengthen environmental and social safeguards and build project implementation and supervision capacities of BMCs, particularly those relating to environmental and social requirements throughout the procurement process.
Climate Change and Disaster Resilience
CARIBBEAN DEVELOPMENT BANK ANNUAL REPORT 2020 | 30

CARIBBEAN DEVELOPMENT BANK ANNUAL REPORT 2020 | 31CARIBBEAN DEVELOPMENT BANK ANNUAL REPORT 2020 | 31
In 2020, CDB's Board of Directors approved a revised Disaster Management Strategy and
Operational Guidelines to improve disaster resilience in the BMCs.
[Photo by Yves Alarie – unsplash.com]

CARIBBEAN DEVELOPMENT BANK ANNUAL REPORT 2020 | 32
Renewable Energy and Energy Efficiency
Continuing to support the region’s sustainable energy transition, in 2020, the Bank approved financing of $8.6 mn to St. Vincent Electricity Services Ltd for the supply and installation of a ground mounted solar photovoltaic (PV) system at Argyle; distributed PV systems and a battery energy storage system. This project was the second battery energy storage project approved by CDB, cementing the Bank’s thrust in the promotion of energy storage to optimise energy from variable renewable energy sources while improving efficiency of existing fossil fuel generation assets of electric utilities.
The Bank also focused on advancing the implementation of approved renewable energy investment projects in Antigua and Barbuda, Jamaica, St. Vincent and the Grenadines and Suriname. Implementation of energy-efficient street-lighting projects was completed in Antigua and Barbuda, and advanced in The Bahamas, Jamaica, St. Kitts and Nevis, St. Vincent and the Grenadines, and Suriname.
CDB Geosmart Initiative and Resource Mobilisation
CDB signed an agreement with the IDB for $5.6 mn grant resources from the Government of Italy, coming through the IDB. These resources are part of the Sustainable Energy Facility (SEF) for the Eastern Caribbean Programme, under the GeoSmart Initiative for supporting geothermal energy development. Additional funding approved for geothermal energy development in St. Vincent and the Grenadines allowed for the completion of the exploratory drilling programme. The project achieved the intended outcome of providing information for evidence-based decision-making on further resource development. The Bank also advanced project preparation support under the SEF for geothermal energy development in Grenada and St. Kitts and Nevis.
Project identification and preparation
Through grant resources from the Canadian Support to the Energy Sector in the Caribbean Fund, CDB approved $370,000 to prepare a Climate Resilient Energy Infrastructure Project for the Virgin Islands. This will be done through a range of studies to support the climate resilient design and moder- nisation of segments of the BVI Electricity Corporation's grid.
Capacity-building
CDB approved a grant of $0.75 mn to the Government of Haiti to provide training to 20-30 male and female govern-ment professionals. The training involves the development of geospatial maps and mini-grid specifications for inclusion in future mini-grid requests for proposals. This intervention is part of a wider collaboration between CDB and the World Bank under the Scaling-Up Renewable Energy Programme. The programme is aimed at supporting the Government’s Energy Roadmap for providing electricity access through scaled deployment of micro/mini grids across rural Haiti where approximately two thirds of the population reside without energy access. With resources from the Sustainable Energy for the East-ern Caribbean Programme, which includes contributions from the United Kingdom's Foreign, Commonwealth and Development Office and the European Union (EU), CDB assisted with addressing the shortage of technical capacity for implementation of renewable energy projects in BMCs. In collaboration with the OECS Commission, CDB approved and implemented a grant of $0.36 mn to provide training for the certification of electrical inspectors and installers of PV systems in the Eastern Caribbean. A total of 224 persons, 13% of which were females, were trained. Most of the participants, comprised mainly of practicing or potential solar energy service providers and electrical inspectors, achieved the internationally recognised North American Board of Certified Energy Practitioners (NABCEP)
CARIBBEAN DEVELOPMENT BANK ANNUAL REPORT 2020 | 33
certification. The certification has improved their individual professional qualifications and skills to provide high quality installation and maintenance of PV systems; possibly to increase the competitiveness of their micro/small businesses (where relevant); and enhance their capacity to participate in international tenders and to offer their services regionally and internationally.
Building on earlier interventions, the Bank provided regional training in renewable energy and energy efficiency financing in collaboration with the multi-partner Technical Assistance Programme for Sustainable Energy in the Caribbean (TAPSEC) (funded by EU and GIZ). CDB also approved financing for institutional strengthening in St. Kitts and Nevis and in the energy sector in Grenada.
For the third consecutive year, CDB, with funding from Canadian Support to the Energy Sector in the Caribbean (CSES-C), co-sponsored the Island Resilience Action Challenge, as part of the Caribbean Renewable Energy Forum. This event which was held virtually brought together 97 persons (30% women) comprised of executives from electric utilities, electricity regulators, and ministers and senior government officials to discuss resiliency challenges, and to identify specific interventions for increasing resilience of electricity systems in the Caribbean.
Economic Infrastructure
Transportation
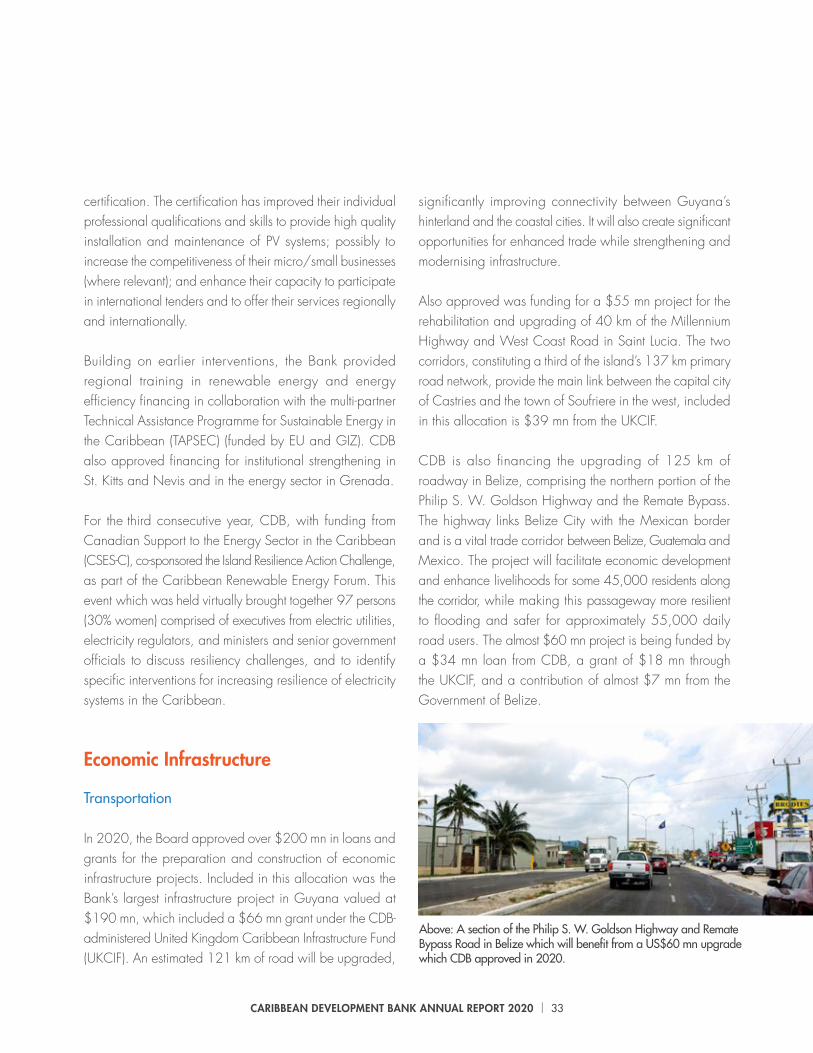
In 2020, the Board approved over $200 mn in loans and grants for the preparation and construction of economic infrastructure projects. Included in this allocation was the Bank’s largest infrastructure project in Guyana valued at $190 mn, which included a $66 mn grant under the CDB-administered United Kingdom Caribbean Infrastructure Fund (UKCIF). An estimated 121 km of road will be upgraded,
Above: A section of the Philip S. W. Goldson Highway and Remate Bypass Road in Belize which will benefit from a US$60 mn upgrade which CDB approved in 2020.
significantly improving connectivity between Guyana’s hinterland and the coastal cities. It will also create significant opportunities for enhanced trade while strengthening and modernising infrastructure.
Also approved was funding for a $55 mn project for the rehabilitation and upgrading of 40 km of the Millennium Highway and West Coast Road in Saint Lucia. The two corridors, constituting a third of the island’s 137 km primary road network, provide the main link between the capital city of Castries and the town of Soufriere in the west, included in this allocation is $39 mn from the UKCIF.
CDB is also financing the upgrading of 125 km of roadway in Belize, comprising the northern portion of the Philip S. W. Goldson Highway and the Remate Bypass. The highway links Belize City with the Mexican border and is a vital trade corridor between Belize, Guatemala and Mexico. The project will facilitate economic development and enhance livelihoods for some 45,000 residents along the corridor, while making this passageway more resilient to flooding and safer for approximately 55,000 daily road users. The almost $60 mn project is being funded by a $34 mn loan from CDB, a grant of $18 mn through the UKCIF, and a contribution of almost $7 mn from the Government of Belize.
CARIBBEAN DEVELOPMENT BANK ANNUAL REPORT 2020 | 34
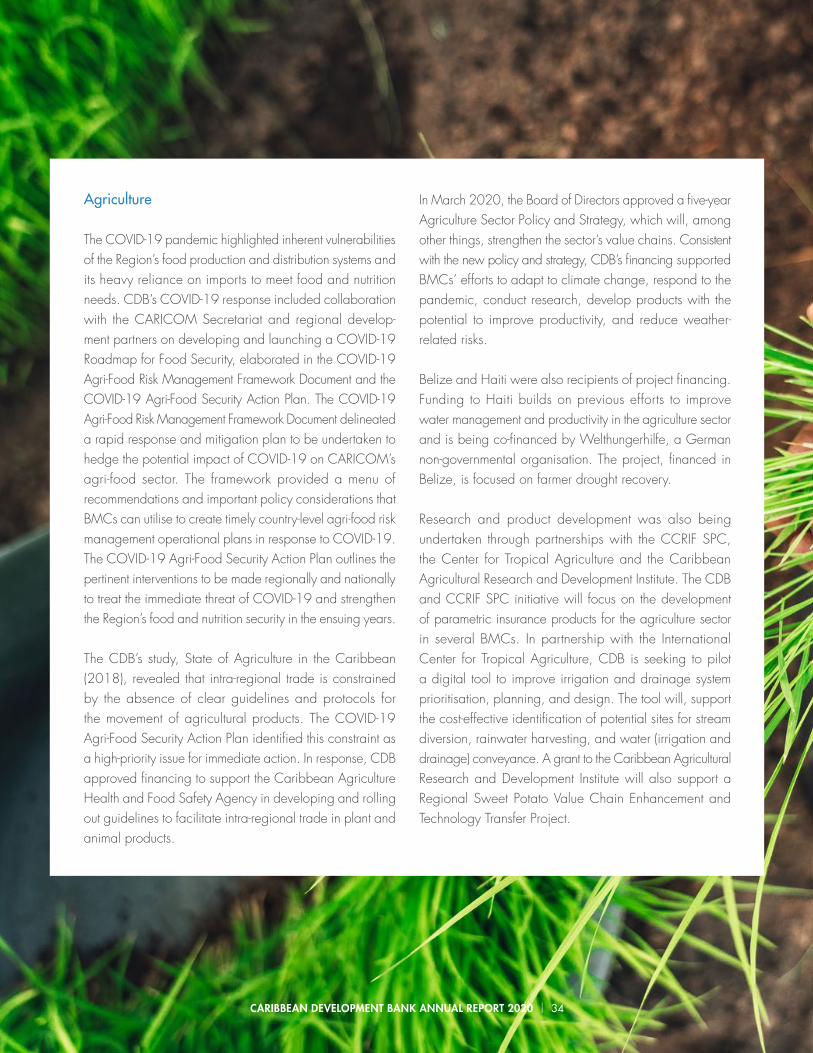
Agriculture
The COVID-19 pandemic highlighted inherent vulnerabilities of the Region’s food production and distribution systems and its heavy reliance on imports to meet food and nutrition needs. CDB’s COVID-19 response included collaboration with the CARICOM Secretariat and regional develop-ment partners on developing and launching a COVID-19 Roadmap for Food Security, elaborated in the COVID-19 Agri-Food Risk Management Framework Document and the COVID-19 Agri-Food Security Action Plan. The COVID-19 Agri-Food Risk Management Framework Document delineated a rapid response and mitigation plan to be undertaken to hedge the potential impact of COVID-19 on CARICOM’s agri-food sector. The framework provided a menu of recommendations and important policy considerations that BMCs can utilise to create timely country-level agri-food risk management operational plans in response to COVID-19. The COVID-19 Agri-Food Security Action Plan outlines the pertinent interventions to be made regionally and nationally to treat the immediate threat of COVID-19 and strengthen the Region’s food and nutrition security in the ensuing years.
The CDB’s study, State of Agriculture in the Caribbean (2018), revealed that intra-regional trade is constrained by the absence of clear guidelines and protocols for the movement of agricultural products. The COVID-19 Agri-Food Security Action Plan identified this constraint as a high-priority issue for immediate action. In response, CDB approved financing to support the Caribbean Agriculture Health and Food Safety Agency in developing and rolling out guidelines to facilitate intra-regional trade in plant and animal products.
In March 2020, the Board of Directors approved a five-year Agriculture Sector Policy and Strategy, which will, among other things, strengthen the sector’s value chains. Consistent with the new policy and strategy, CDB’s financing supported BMCs’ efforts to adapt to climate change, respond to the pandemic, conduct research, develop products with the potential to improve productivity, and reduce weather-related risks.
Belize and Haiti were also recipients of project financing. Funding to Haiti builds on previous efforts to improve water management and productivity in the agriculture sector and is being co-financed by Welthungerhilfe, a German non-governmental organisation. The project, financed in Belize, is focused on farmer drought recovery.
Research and product development was also being undertaken through partnerships with the CCRIF SPC, the Center for Tropical Agriculture and the Caribbean Agricultural Research and Development Institute. The CDB and CCRIF SPC initiative will focus on the development of parametric insurance products for the agriculture sector in several BMCs. In partnership with the International Center for Tropical Agriculture, CDB is seeking to pilot a digital tool to improve irrigation and drainage system prioritisation, planning, and design. The tool will, support the cost-effective identification of potential sites for stream diversion, rainwater harvesting, and water (irrigation and drainage) conveyance. A grant to the Caribbean Agricultural Research and Development Institute will also support a Regional Sweet Potato Value Chain Enhancement and Technology Transfer Project.
CARIBBEAN DEVELOPMENT BANK ANNUAL REPORT 2020 | 34

CARIBBEAN DEVELOPMENT BANK ANNUAL REPORT 2020 | 35
Water
A $30 mn loan was approved to support a critical rural water project in Jamaica. Upon completion an estimated 100,000 Jamaicans will have access to an improved water supply, with upgrades of seven systems serving communities in the parishes of Clarendon, St. Ann, St. Elizabeth, St. Mary, St. Thomas, and Trelawny. Ad-ditionally, the project will help to mitigate the negative impacts of climate variability and change, and it will provide access to clean, safe and affordable water.
The Dennery North Water Supply Redevelopment Project in Saint Lucia was completed in 2020. The work included the expansion of the water treatment plant, construction of several pumping stations and water storage tanks and the upgrade of the distribution system. This resulted in improved quality, reliability and climate resilience of the water supply system serving approximately 2,900 households in the area.
In The Bahamas, works were substantially completed on the Long Island and Crooked Island Water Supply Improvement Project, providing an improved, climate-resilient water supply system for approximately 540 households.
Financial Intermediary Activities and Private Sector Development
Through existing CDB lines of credit (LOCs), resources were made available to approximately 61 beneficiaries totalling $6.8 mn, in support of lending across a range of sectors. Included in this credit allocation was an amount of $2 mn used to provide MSMEs with critical access to liquidity support through working capital, as part of the Bank’s response to supporting the operations of businesses impacted by the COVID-19 pandemic. In
CARIBBEAN DEVELOPMENT BANK ANNUAL REPORT 2020 | 35

CARIBBEAN DEVELOPMENT BANK ANNUAL REPORT 2020 | 36
addition, credit was made available to support improved housing solutions and facilitate access to tertiary education for students, including those from poor and vulnerable households.
CDB also accessed an IDB Global Credit facility on concessional terms for on-lending to OECS Member Countries aimed at supporting COVID-19 project responses. A portion of these resources was earmarked for MSME financing (economic component) to improve the short-term financial capacity of MSMEs and access to production-oriented finance for economic recovery. Such resources under the component will be used to help MSMEs affected by the crisis to overcome temporary liquidity problems and continue operating; and include mechanisms to finance working capital through sub-loans in activities, including the acquisition of supplies or merchandise, wages, utilities, and any other purpose related to the recovery, improve-ment and maintenance of economic activity. In addition, the resources also cater for supporting production, as well as meeting increased demand, including support for value chains, so that anchor companies receiving financing can contribute to the recovery of their suppliers in the supply chain as a consequence of COVID-19. An estimated $30 mn in loan financing is anticipated from eligible BMCs, which are likely to be focused on financing the short-term financial capacity requirements of MSMEs.
CDB also supported interventions to improve access to finance by facilitating ongoing capacity building to the Government of the Turks and Caicos Islands for determining the feasibility of establishing a partial credit guarantee scheme, aimed at identifying solutions for small and medium-sized enterprises to gain greater access to credit. In addition, work on a previously approved technical assistance activity for the Government of The Bahamas to review the operations of the state-owned development bank was completed and an enhanced business model along with a new strategic plan were made available for execution by that institution. It is anticipated that both initiatives will offer opportunities for the
Bank to contribute other resources aimed at improving access to finance for several business enterprises in both jurisdictions.
MSME Development
The Bank, through its Caribbean Technological Consultancy Services (CTCS) Network, convened a three-part webinar series aimed at assisting MSMEs to cope with the challenges of the pandemic. Approximately 1,000 MSME operators participated in the webinars, which focused on pivoting businesses, money and relationship management, and marketing and client engagement.
Another webinar series was convened in partnership with the Pan-American Health Organization to engage staff of business support organisations on issues surrounding mental wellbeing. The webinars centred on understanding the mental health impacts, needs and challenges for MSMEs and practical coping skills and tools. The series also high-lighted other natural hazards, which increase the vulnerability of the MSME sector, including hurricanes. The Bank also approved $82,688 to establish a proposal- writing facility to finance consultancy services to strengthen business support organisations and MSME project proposal capabilities. It is anticipated that this facility will contribute to greater access to funding and other forms of required support to facilitate increased competitiveness of MSMEs.
Cultural and Creative Industries Innovation Fund
As part of the ongoing efforts to address challenges faced by MSMEs in accessing affordable finance, CDB, through CTCS, approved $178,450 to train a cadre of consultants and staff of 20 development finance institutions in appraising loan applications for creative sector projects.

CARIBBEAN DEVELOPMENT BANK ANNUAL REPORT 2020 | 37
The Cultural and Creative Industries Innovation Fund (CIIF) also approved grants totalling $880,000 for the creative sector. This included the awarding of $100,000 in emergency relief financing to entrepreneurs in creative industries who demonstrated loss of income from cancelled events as a result of the pandemic. Additionally, and in collaboration with the Caribbean Export Development Agency, CDB approved a $600,000 programme to aid export-oriented MSMEs to retool and mitigate the impact of the pandemic.
Regional Cooperation
CDB approved over $1.7 mn for regional cooperation and integration-related projects in 2020.
The Bank facilitated the outfitting and accreditation of the Saint Lucia Bureau of Standards Metrology Laboratory. This was the first laboratory certified by the Jamaica National Agency for Accreditation and concluded a project led by the CARICOM Regional Organisation for Standards and Quality to strengthen regional quality infrastructure.
Two regional initiatives to improve access to trade-related services and deepen economic integration also commenced. Both are co-financed by the 11th European Development Fund (EDF) and CDB using its Special Development Fund. The first initiative provides for increased efficiency at maritime ports in the OECS by establishing an integrated digital portal to be used by border agencies processing trade related data for passengers and goods entering and exiting the customs union. The second initiative will further advance CARICOM’s agenda on quality infrastructure with equipment and technical support to standards agencies in Barbados, Dominica and St. Kitts and Nevis. CDB launched the CARIFORUM-European Union Econom-ic Partnership Agreement CARICOM Single Market and Economy Standby Facility for Capacity Building in 2020. A total of 40 submissions were received from 15 beneficiaries.
The Bank commenced coordinating the implementation of two national and two regional projects financed by the Standby Facility.
Government
CDB commenced execution of a unique project focused on capacity building, targeting those involved in finance at the municipal level, to ensure effective resource utilisation and allocation and with a focus on enhanced accountability mechanisms and inclusive governance practices.
The Bank is providing technical assistance to accounting and financial reporting officials from seven BMCs in partnership with the Commonwealth Local Government Forum – Caribbean (CLGF – Caribbean). Through the Regional Capacity Building in Municipal Finances pro-ject CDB is engaging seven active municipalities in the Bahamas, Belize, Dominica, Guyana, Jamaica, Saint Lucia and Trinidad and Tobago. CDB hosted seven national consultations with the leadership of municipal councils, line ministries and national local government associations to identify priorities for development.
Having completed the face-to-face training in Public Policy Analysis and Management (PPAM) and Project Cycle Management (PCM) in all BMCs by 2019, the Bank reached an agreement with the UWI (Open Campus) in 2020 to launch a CDB online e-Learning course, targeted at civil servants in the BMCs. The course will begin in 2021.
Recognising the disruptions to project activities across the Region due to the pandemic, the Bank launched a virtual series covering topics such as contract management and project communications to sustain dialogue on project management with project owners in the civil service. Also, during the year, a total of 187 certificates of achievement were awarded to CDB staff who had completed several modules of the PPAM PCM Masterclass.

CARIBBEAN DEVELOPMENT BANK ANNUAL REPORT 2020 | 38CARIBBEAN DEVELOPMENT BANK ANNUAL REPORT 2020 | 38

CARIBBEAN DEVELOPMENT BANK ANNUAL REPORT 2020 | 39
Education
Framework for Reopening Schools
In response to the pandemic, CDB collaborated with the CARICOM Secretariat and the International Institute of Educational Planning to host two online working meetings with targeted sector stakeholders to ensure the continued provision of quality education and inclusive of Special Education Needs (SEN) learners. From those meetings, Regional Guidelines for the Reopening of Schools in the Caribbean were formulated. The guidelines are recommen-dations advanced to ensure health and safety, continuation of education, and in particular, adequate preparations to meet the challenges of the new school year within the regional context. They aid in identifying strengths and gaps in response, surveying existing structures and processes and prioritising actions for the short and medium term.
CDB is also working with the CARICOM Secretariat and Caribbean Association of National Training Authorities to assist with the development of the guidelines for the technical
and vocational education and training (TVET) sub-sector.
CXC Digital Toolkit
CDB, in partnership with the CXC completed a Digital Toolkit for the delivery of Caribbean Advanced Proficiency Examination (CAPE) Environmental Science Syllabus. The Toolkit was developed under a grant to CXC and which has been under implementation for the past two years. The project will strengthen CXC’s capacity to support implemen-tation and assessment of the CAPE Environmental Science Syllabus; enhance the skills of Environmental Science teachers to deliver the CAPE Environmental Science curriculum; improve student performance; and enhance public awareness of the environmental sciences and environmental issues. The toolkit will be officially launched by CXC and CDB in 2021.
CDB President Dr. Wm Warren Smith engaging with students at Queen Square
Primary School in Belize.
CARIBBEAN DEVELOPMENT BANK ANNUAL REPORT 2020 | 39
CARIBBEAN DEVELOPMENT BANK ANNUAL REPORT 2020 | 40
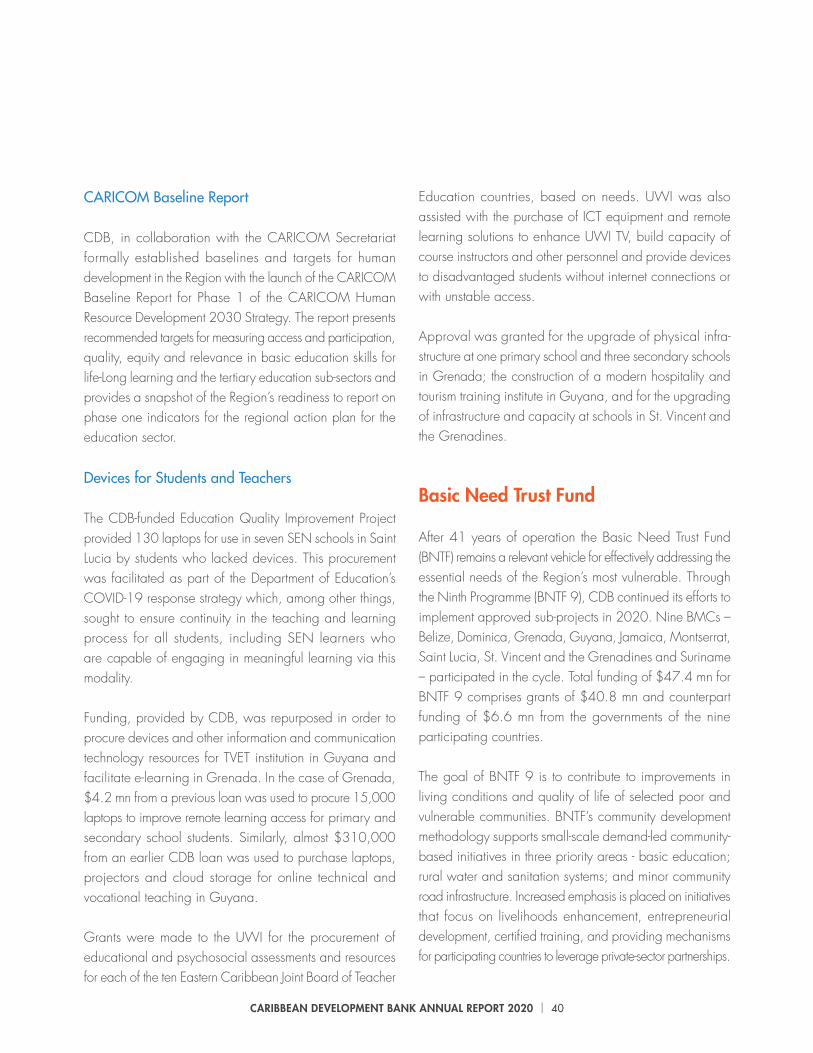
CARICOM Baseline Report
CDB, in collaboration with the CARICOM Secretariat formally established baselines and targets for human development in the Region with the launch of the CARICOM Baseline Report for Phase 1 of the CARICOM Human Resource Development 2030 Strategy. The report presents recommended targets for measuring access and participation, quality, equity and relevance in basic education skills for life-Long learning and the tertiary education sub-sectors and provides a snapshot of the Region’s readiness to report on phase one indicators for the regional action plan for the education sector.
Devices for Students and Teachers
The CDB-funded Education Quality Improvement Project provided 130 laptops for use in seven SEN schools in Saint Lucia by students who lacked devices. This procurement was facilitated as part of the Department of Education’s COVID-19 response strategy which, among other things, sought to ensure continuity in the teaching and learning process for all students, including SEN learners who are capable of engaging in meaningful learning via this modality.
Funding, provided by CDB, was repurposed in order to procure devices and other information and communication technology resources for TVET institution in Guyana and facilitate e-learning in Grenada. In the case of Grenada, $4.2 mn from a previous loan was used to procure 15,000 laptops to improve remote learning access for primary and secondary school students. Similarly, almost $310,000 from an earlier CDB loan was used to purchase laptops, projectors and cloud storage for online technical and vocational teaching in Guyana.
Grants were made to the UWI for the procurement of educational and psychosocial assessments and resources for each of the ten Eastern Caribbean Joint Board of Teacher
Education countries, based on needs. UWI was also assisted with the purchase of ICT equipment and remote learning solutions to enhance UWI TV, build capacity of course instructors and other personnel and provide devices to disadvantaged students without internet connections or with unstable access.
Approval was granted for the upgrade of physical infra-structure at one primary school and three secondary schools in Grenada; the construction of a modern hospitality and tourism training institute in Guyana, and for the upgrading of infrastructure and capacity at schools in St. Vincent and the Grenadines.
Basic Need Trust Fund
After 41 years of operation the Basic Need Trust Fund (BNTF) remains a relevant vehicle for effectively addressing the essential needs of the Region’s most vulnerable. Through the Ninth Programme (BNTF 9), CDB continued its efforts to implement approved sub-projects in 2020. Nine BMCs – Belize, Dominica, Grenada, Guyana, Jamaica, Montserrat, Saint Lucia, St. Vincent and the Grenadines and Suriname – participated in the cycle. Total funding of $47.4 mn for BNTF 9 comprises grants of $40.8 mn and counterpart funding of $6.6 mn from the governments of the nine participating countries.
The goal of BNTF 9 is to contribute to improvements in living conditions and quality of life of selected poor and vulnerable communities. BNTF’s community development methodology supports small-scale demand-led community-based initiatives in three priority areas - basic education; rural water and sanitation systems; and minor community road infrastructure. Increased emphasis is placed on initiatives that focus on livelihoods enhancement, entrepreneurial development, certified training, and providing mechanisms for participating countries to leverage private-sector partnerships.
CARIBBEAN DEVELOPMENT BANK ANNUAL REPORT 2020 | 41
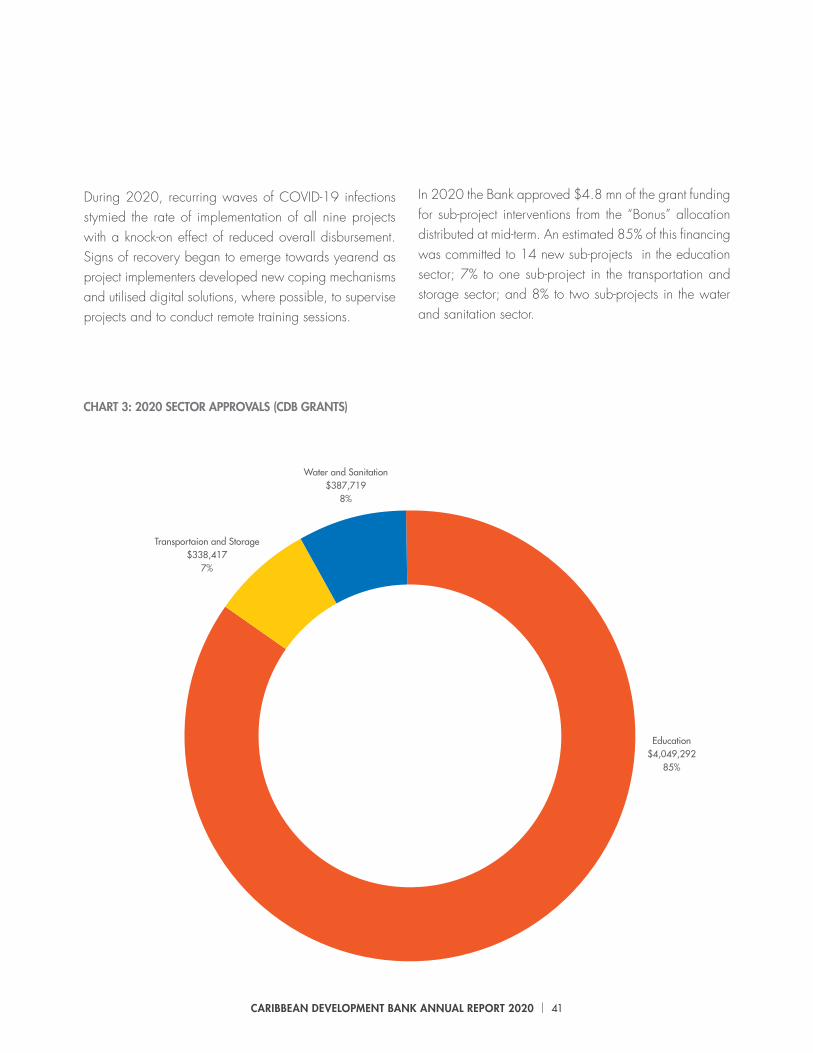
During 2020, recurring waves of COVID-19 infections stymied the rate of implementation of all nine projects with a knock-on effect of reduced overall disbursement. Signs of recovery began to emerge towards yearend as project implementers developed new coping mechanisms and utilised digital solutions, where possible, to supervise projects and to conduct remote training sessions.
In 2020 the Bank approved $4.8 mn of the grant funding for sub-project interventions from the “Bonus” allocation distributed at mid-term. An estimated 85% of this financing was committed to 14 new sub-projects in the education sector; 7% to one sub-project in the transportation and storage sector; and 8% to two sub-projects in the water and sanitation sector.
CHART 3: 2020 SECTOR APPROVALS (CDB GRANTS)
Education$4,049,292
85%
Water and Sanitation$387,719
8%
Transportaion and Storage$338,417
7%

CARIBBEAN DEVELOPMENT BANK ANNUAL REPORT 2020 | 42
Results accumulated after the initiation of construction and training activities in 2019 continued into 2020. However, the anticipated pace of implementation was curtailed by the impact of COVID-19, with all project offices being closed at some point due to infections among core staff. Sub-project activities were halted for long periods, as contractors struggled to remobilise amidst government-enforced protocols. Human resource development and livelihoods training were most adversely impacted, as beneficiaries were unable to attend workshops or access online sessions. However, some 59 classrooms in basic schools have been built or upgraded to date, benefitting 1,094 students of whom 544 are females, while 198 teachers (183 females and 15 males) were trained in elements of basic education. Significant livelihoods enhancement training interventions continued across several regions in Guyana with co-implementing agencies. This was most notable in the application of smart agricultural techniques using greenhouse technology and complementary training in partnership with the Inter-American Institute for Cooperation on Agriculture, which has already started to improve the well being of rural farmers. In the water sector, some 4,106 households benefitted from improved water supply and sanitation services integrated with water, sanitisation and hygiene training. Approximately two km of community roads were upgraded, benefitting 259 persons (129 women). Disbursement increased by approximately $12 mn by the end of 2020.
Dominica completed the implementation of the BNTF 7 and 8 projects at the end of December 2020, despite the slowdown, caused by the pandemic. This was within the extended period granted to Dominica following two successive hurricanes, which had halted implementation. During the year, 16 classrooms and educational support facilities were built or upgraded, benefiting 595 students (of which 397 were female). Some 2,053 households benefitted from improved access to safe reliable water and improved sanitation.
At the programme level, CDB took a strategic decision to advance the preparation of the Country Policy Framework, which outlines the new country project allocations for each BMC. This was necessary to advance the implementation of the planned BNTF 10th cycle. This process was initiated in the fourth quarter of 2020, with CDB approval of the Framework planned for the end of March 2021, in line with the expected approval of the next cycle.
Procurement and Disbursements
The onset of COVID-19 presented serious practical implementation challenges for CDB projects under execution. In the areas of procurement and disbursement, the Bank responded by establishing an electronic disbursement system and advising BMCs on the use of appropriate electronic procurement solutions, which are encouraged under the new procurement framework. The unprecedented situation also saw CDB successfully procuring personal protective equipment (PPE), for its sovereign BMCs and the Caribbean Disaster Emergency Management Agency, as well as advising regional agencies on pooled procurement solutions for acquiring PPE. CDB also supported ministries of education in developing appropriate procurement strategies to conduct the expedited procurement of information technology devices needed for online education.
Capacity-building continued during the year to position staff and BMCs to utilise the tools more effectively and to achieve greater flexibility under the new CDB Procurement Framework. Sensitisation sessions were also held with the private sector. Given the limitations on travel and physical meetings, due to COVID-19, these sessions largely took the form of webinars.
The procurement procedures were revised in late 2020, with the new version to be applied to all projects approved from January 2021. The revisions enhance the integrity

CARIBBEAN DEVELOPMENT BANK ANNUAL REPORT 2020 | 43
provisions and reflect the lessons learnt from using the new procedures for over a year to make them more effective.
During the year, CDB finalised and signed agreements with the IDB and the World Bank to establish standard procurement arrangements for co-financing situations, which are becoming increasingly common. These arrangements should lower transaction costs for multilateral development banks, BMCs and the private sector during project planning and execution.
CDB also continued to support the modernisation of procure-ment laws and regulations through technical assistance to Anguilla, Dominica, St. Kitts and Nevis, Monserrat, and Virgin Islands. These new procurement frameworks will help facilitate more effective procurement processes that optimise value for money outcomes.
Above: At the onset of the COVID-19 pandemic in the first quarter of 2021, CDB procured personal protective equipment (PPE) valued at US $3 million for healthcare workers in 14 of its BMCs.

CARIBBEAN DEVELOPMENT BANK ANNUAL REPORT 2020 | 44
DEVELOPMENTEFFECTIVENESS
SECTION 3

CARIBBEAN DEVELOPMENT BANK ANNUAL REPORT 2020 | 45

CARIBBEAN DEVELOPMENT BANK ANNUAL REPORT 2020 | 46
protection, fiscal stimulus packages and utilising financing from the donor community to address health sector and liquidity needs. BMCs return to the pre-pandemic trajectory will be highly dependent on the ability to contain the disease spread and to quickly address other far-reaching fallouts. Achieving the SDGs based on the agreed timetable will also be a big challenge for BMCs.
Level 2 – CDB’s contribution to country outcomes
CDB remained committed to meeting the development needs of BMCs and achieving results. Ongoing and completed projects during the year accomplished mean-ingful results across several sectors and areas in relation to the first year of the 2020-2024 Strategic Plan.
The year 2020 marked the first year of implementing the Bank’s 2020-2024 Strategic Plan and associ-ated results monitoring framework (RMF) directed
at transforming lives in the Caribbean Region. The RMF allows the Bank to track implementation progress of its strategic plan, examine the quality and effectiveness of its operations, and make mid-course corrections to achieve the desired development outcomes in BMCs. The RMF tracks performance at four levels – regional development progress (Level 1); CDB’s contribution to country outcomes (Level 2); and operational effectiveness and efficiency (Levels 3 and 4).
Consistent with the 2030 Agenda and the Paris Agreement, CDB will continue to focus on building economic, social and environmental resilience in its BMCs.
Level 1 – Regional development progress
There is optimism about the future of Caribbean econo-mies despite current uncertainties. The first year of CDB’s five-year strategic journey was defined by COVID-19, with unprecedented and long-lasting consequences. This seriously jeopardised health, economic and social systems, as well as lives and livelihoods. The impact was especially severe on the poor and vulnerable. The COVID-19 domino effect contributed to rising unemployment especially among youth; falling production and productivity; low economic growth; rising poverty; rising income inequality; growing educational inequalities; and increasing psychological distress, particularly among women, the elderly, and children.
Despite facing fiscal challenges, BMCs swiftly responded to the effects of the pandemic by providing additional social
Overview

CARIBBEAN DEVELOPMENT BANK ANNUAL REPORT 2020 | 47
BUILDING ENVIRONMENTAL RESILIENCE
Education and Training 868 new and upgraded classrooms and support facilities benefitting 45,987 students (22,036 girls), as well as training for about 1,003 teachers and administrative staff (682 females).
Improved access to efficient, reliable, and sustainable potable water for about 3,200 persons (1,500 females), including 1,267 urban and rural households.
67,591 persons benefitting from 11.7 km of quality, reliable, safe, sustainable and resilient road infrastructure (33,827 females).
Carbon dioxide emissions decreased by 22,208 (tonnes of carbon dioxide equivalent/year).
8.9 gigawatt hours saved due to investments in energy efficiency initiatives.
Water and Sanitation
BUILDING ECONOMIC RESILIENCE
CO2
Transport and Communication
BUILDING SOCIAL RESILIENCE
CARIBBEAN DEVELOPMENT BANK ANNUAL REPORT 2020 | 47
RESULTS OF THE 2020-2024 STRATEGIC PLAN IN 2020

CARIBBEAN DEVELOPMENT BANK ANNUAL REPORT 2020 | 48CARIBBEAN DEVELOPMENT BANK ANNUAL REPORT 2020 | 48
Close to 68,000 persons are now benefitting from 11.7 km of quality,
reliable, safe, sustainable, and resilientroad infrastructure thanks to the BNTF.
[Photo by Meritt Thomas – unsplash.com]

CARIBBEAN DEVELOPMENT BANK ANNUAL REPORT 2020 | 49
IDB and the Government of Canada, thereby augment-ing its pool of resources by $70 mn. Other initiatives included modifications to terms and conditions of its lend-ing arrangements with BMCs, such as waiving the limits on counterpart contributions to December 2022. These efforts are expected to mitigate the short-term health and socio-economic impacts, protect livelihoods, strengthen resilience for economic recovery; cover temporary liquid-ity needs; preserve fiscal space; and, at the same time, divert resources towards immediate health, economic and social needs.
To support the implementation of the Managing for Development Results (MfDR) agenda for the strategy period, an action plan was developed by CDB. The plan, which replaced the 2015-2019 MfDR Action Plan, is expected to continue a results-oriented approach within CDB and improve development effectiveness of areas, outlined in the new strategic plan.
Levels 3 and 4 – operational effectiveness and efficiency
The Bank made noteworthy progress in implementing the recommendations from the Transformation Programme, and the 2019 Business Process Review exercise, aimed at achieving improved efficiency, service delivery, client engagement, performance, and greater development effectiveness. An important feature of the ongoing reforms is quality control to ensure that CDB’s country engagement, programming efforts and its interventions are timely, and high-quality, as well as yield positive and meaningful development outcomes and impacts.
Despite COVID-19 headwinds, CDB remained committed to its mandate; and in 2020, approved a record-breaking $557.2 mn in loan and grant resources. Approvals included COVID-related activities totalling $159.6 mn mainly for policy-based and debt service relief lending. Recognising the role of increased partnership in tackling the pandemic, CDB scaled up its resource mobilisation efforts with the

CARIBBEAN DEVELOPMENT BANK ANNUAL REPORT 2020 | 50
INTERNALFOCUS
SECTION 4

CARIBBEAN DEVELOPMENT BANK ANNUAL REPORT 2020 | 51

CARIBBEAN DEVELOPMENT BANK ANNUAL REPORT 2020 | 52
Map. All staff were invited to attend the Learning Map experience initiative to learn and discuss information about the Transformation Programme. Significant emphasis was also placed on equipping managers to support the changes and inspire buy-in from their respective teams.
Learning and Development
Leadership, learning and culture played major roles in the Bank’s ability to adapt to the new challenges it faced during 2020. Staff were exposed to learning and development workshops focused on the six capabilities, identified as key for the Bank in executing its strategy. The training workshops enabled staff to expand their knowledge and sharpen their skill sets. An overview of the training undertaken in 2020 is provided in table that follows.
Despite having to navigate the COVID-19 pandemic, the Bank continued to follow its 2020 to 2024 strategic roadmap while maintaining a focus on:
• the safety of staff during the pandemic;• increasing awareness and understanding among staff of the Bank’s transformation priorities; and• promoting gender equality in the workplace.
Change Management Programme
As the Bank underwent cultural, technological and process shifts inherent in its transformation programme, a change management component was implemented to assist staff in making the necessary transitions. This programme, which was initiated in the third quarter of 2020 and is scheduled to end in 2021, aims to enable success by effectively communicating the imperatives driving the changes, and promoting wide participation in implementation.
The change management programme’s main objectives are to:
• create a transformation narrative for the organisation;• empower managers and staff to be effective change agents; and • normalise the change through frequent, structured conversations between managers and their teams.
In December, through staff-led and facilitated virtual interactive sessions, the Bank’s Transformation Programme was brought to life using a visualisation tool, the Learning
HUMAN RESOURCES DEVELOPMENT

CARIBBEAN DEVELOPMENT BANK ANNUAL REPORT 2020 | 53
Subject Area Recipients Total Participants
Presentation Skills • Administrative Professionals• Operations Officers
15
Innovation: Transforming Ideas into Solutions
• Portfolio Managers• Operations Officers• Economists• Legal Counsels
30
Effective Client Engagement • Portfolio Managers• Operations Officers• Economists• Legal Counsels
25
What Got You Here Won’t Get You There
• Portfolio Managers• Operations Officers• Economists• Legal Counsels
25
Leading Change • First Line Managers • Middle Managers
30
General Leadership Training • All Managers 30
TABLE 1: TRAINNING COMPLETED IN 2020
EDGE engages with organisations to assess and measure four key areas:
• gender balance at all levels; • pay equity;• effectiveness of policies and practices to ensure equitable career flows for both men and women; and• inclusive culture.
EDGE Certification
The Economic Dividends for Gender Equality (EDGE) is the leading global assessment methodology and business certification standard for gender equality. Launched at the World Economic Forum in 2011, EDGE has been designated to help companies create an optimal workplace for women and men.
CARIBBEAN DEVELOPMENT BANK ANNUAL REPORT 2020 | 54
This resulted in IAD providing one major engagement related to the review of the legitimacy of the expenses associated with the loans to the Caribbean Financial Services Corporation. In addition, IAD reviewed CDB’s compliance level with the mandatory controls identified in the SWIFT Customer Security Controls Framework v2019 (Customer Security Programme) - and provided the inde-pendent attestation, required by SWIFT.
In addition to supporting digital transformation initiatives where the adequacy of associated internal controls processes needed to be assessed, IAD participated in several business development activities. Alongside follow-up activities from previous assurance engagements, IAD also started an assessment of the adequacy of management action plans stemming from the 2020 External Auditors’ Management Letter for financial and information technology general controls. These activities encourage management owner-ship of the timely-reporting and mitigation of identified risks.
INDEPENDENT EVALUATION
In 2020, the Office of Independent Evaluation (OIE) conducted three major evaluations, examining the Bank’s technical assistance programmes, its Caribbean Technological Consulting Service (CTCS) Network, and the Barbados Country Strategy and Programme (2010-2019).
Technical Assistance
Technical assistance (TA) has been recognised as fundamental to the Bank’s mandate since its inception. This programme area was first evaluated in 2007, resulting in several recommendations for improvement. A Technical Assistance Policy and Operational Strategy was approved in 2012.
The certification follows a three-tiered system, referred to as ASSESS (Level 1), MOVE (Level 2), and LEAD (Level 3). These three levels seek to enable the advancement and recognition of organisations in different stages of their journey towards a gender-equal workplace.
CDB attained Level 1 EDGE certification in October 2020, demonstrating the Bank’s commitment to gender equality in the workplace.
Staff Wellbeing Programme
Recognising the importance of the mental, physical and emotional health of its employees, the Bank made a commitment to staff that a formal well-being programme would be operational by the second quarter of the year. In March, the first component of the initiative – an Employee Assistance Programme (EAP) – was implemented to enable staff and family members to access professional counselling, where necessary. The launch of the EAP was timely, given the onset of the COVID-19 pandemic.
The remaining components of the programme were launched in the final quarter of the year, providing employees with incentives, tools, social support and strategies to maintain mental, emotional, and physical well being.
INTERNAL AUDIT
In 2020, the Internal Audit Division (IAD) completed two assurance engagements, and 11 consultancy/advisory engagements. These engagements included contribution to the information technology digital transformation activities and general controls; the review of new applications; information security; privacy and data protection; and accounting and financial reporting processes.

CARIBBEAN DEVELOPMENT BANK ANNUAL REPORT 2020 | 55
OIE’s evaluation found that TA had been an important, though under-recognised, part of the value package provided by the Bank to its BMCs, and that benefits delivered had been substantial. At the same time, there were opportunities for improvement, including greater strategic focus, a more programmatic approach, strengthened results management, and a clear typology of the different types of TA as used at other Banks.
Caribbean Technological Consulting Services Network
Conducted in parallel with the TA evaluation, a report on the CTCS Network traced its evolution since establishment in the early 1980s and noted its ambitious scope and the degree of satisfaction among stakeholders who had been engaged but also its limited resources and low visibility. Going forward, there is opportunity to revisit the strategic orientation, reposition and rebrand the CTCS, as part of the Bank’s increased emphasis on private sector engagement.
Barbados Country Strategy and ProgrammeThe Barbados Country Strategy and Programme Evaluation examined the 2010-13 Country Assistance Strategy, the 2015-18 Country Strategy Paper, and the early period of the Barbados Economic Recovery and Transition Plan. It also assessed the portfolio of investment and policy-based lending that the Bank planned and implemented over this period. It noted a challenging macroeconomic context over the period, and capacity challenges that hindered loan implementation. Suggestions for improved performance included:
• ensuring that project designs and implementation schedules are realistic considering capacity constraints;• supporting public sector reform to address the implementation gap;
• rethinking aspects of the country strategy process so it becomes more of a management tool over the entire planning and implementation cycle;• advocating for greater efforts in climate resilience, adaptation, and disaster risk management; • prioritising growth and private sector development; and• supporting further progress in gender equality and social sectors.
OIE continued to validate project completion reports and to generate knowledge products. A synthesis of five past evaluations of policy-based lending at CDB was prepared and submitted for expected 2021 publication, as part of a cross-multilateral development banks compendium of experience in this area.

CARIBBEAN DEVELOPMENT BANK ANNUAL REPORT 2020 | 56
• collaborations with other multilateral development banks.
Additionally, ICA’s work enabled CDB to meet its fiduciary duty to ensure that its financial resources reached intended beneficiaries without diversion by corrupt and fraudulent actors.
Most notably, ICA led the Bank’s observance of Anti-Corruption Week 2020 on December 7-11, with the delivery of the inaugural Caribbean Conference on Corruption, Compliance and Cybercrime 2020. The event, conceptualised by ICA, to mark CDB’s 50th anniversary, was executed on December 7 and 8 in collaboration with the World Bank.
The conference agenda was devised to increase under-standing of the impact of corruption on emerging economies and to strengthen institutional and individual responsiveness. ICA’s novel approach focused on target groups, such as youth and women, who are not typically at the forefront of established anti-corruption initiatives but can play a critical role in the solution. The virtual conference had over 800 attendees, 60 speakers, and 2,800 session views.
INTEGRITY, COMPLIANCE AND ACCOUNTABILITY
During 2020, the preventive and investigative work of the Office of Integrity Compliance and Accountability (ICA) helped CDB to mitigate integrity and accountability risks arising from the Bank’s internal systems and external operations. The work of the Office covered:
• management of the six channels of the Bank’s whistleblower system; • conduct of integrity and counterparty due diligence; • outreach to stakeholders and beneficiaries of CDB financing; • training of staff and management on corruption, fraud prevention, sexual harassment, integrity due diligence, including digitising and embedding the integrity due diligence toolkit; • conduct of proactive and reactive integrity investigations; • imposition of temporary suspensions on entities and individuals subject to ICA investigations; and

CARIBBEAN DEVELOPMENT BANK ANNUAL REPORT 2020 | 57CARIBBEAN DEVELOPMENT BANK ANNUAL REPORT 2020 | 57

CARIBBEAN DEVELOPMENT BANK ANNUAL REPORT 2020 | 58
RISKREVIEW
SECTION 5
[Photo by Renaldo Matamoro – unsplash.com]

CARIBBEAN DEVELOPMENT BANK ANNUAL REPORT 2020 | 59

CARIBBEAN DEVELOPMENT BANK ANNUAL REPORT 2020 | 60
I n 2020, the Bank maintained its Enterprise Risk Manage-ment (ERM) approach with scope of coverage, including financial, strategic, operational and developmental risks.
The operational risk pillar includes environmental, climate
and disaster risk management, given its increasing visibility and potential impact on the sovereign risk profiles of BMCs.
At year end, CDB was in full compliance with all of its risk appetite thresholds, as shown in Table 2.
CDB NEW OCR RISK MEASURES AND POLICY RATIOS SCORECARD
AS AT DECEMBER 31, 2020 ($US Mn)
RISK TYPE RISK MEASURE/ POLICY RATIO MEASURE BASE AMOUNT
THRESHOLD LIMIT
ACTUAL RAG STATUS
CAPITALCAPITAL ADEQUACY
Minimum - 150% of Economic Capital
$441.6 $931.7 211.0%
CREDIT
SINGLE SOVEREIGN EXPOSURE
GREATER OF: 40% of
Outstanding Loans$1,324.2 $529.7 $259.9 19.6%
50% of TotalAvailable Capital
$931.7 $465.8 $259.9 27.9%
EXPOSURE TO 3LARGEST BORROWERS
GREATER OF: 60% Of
Outstanding Loans$1,324.2 $794.5 $496.7 37.5%
90% of Total Available Capital
$931.7 $838.5 $496.7 53.3%
RISK TYPE RISK MEASURE/ POLICY RATIO MEASURE BASE AMOUNT
THRESHOLD LIMIT
ACTUAL RAG TATUS
Non-Sovereign Exposure Limit
Single Exposure
2.5% of Total Outstanding Loans
$1,324.2 $33.10 $28.8 2.2%
3.6% of Total Available Capital
$931.7 $32.6 $28.8 3.1%
Non-Sovereign Exposure Cap
30% of Total Outstanding Loans
$1,324.2 $397.20 $79.4 6.0%
43% of Total Available Capital
$931.7 $400.6 $79.4 8.5%
Policy-Based Loans (PBL) & Guarantees
38% of Total Outstanding Loans
& Guarantees
$2,015.2 $765.77 $748.0 37.1%
Policy-Based Loans (PBL) & Guarantees
38% of Total Outstanding Loans
& Guarantees
$2,015.2 $765.77 $748.0 37.1%
Limit on Operations (Article14.1) Equal to or less than Limit
$2,423.3 $1,336.2 55.1%
TABLE 2: OCR RISK APPETITE THRESHOLDS AT DECEMBER 31, 2020

CARIBBEAN DEVELOPMENT BANK ANNUAL REPORT 2020 | 61
CDB NEW OCR RISK MEASURES AND POLICY RATIOS SCORECARDAS AT DECEMBER 31, 2020 ($US Mn)
Borrowing Limit - Proforma Equal to or Less than100% Capital
Limit (as defined)
$1,509.8 $1,094.1 72.5%
Borrowing Limit - Capitalisation Equal to or Less than 65% of Capitalisation
$2,053.9 $1,094.1 53.3%
LIQUIDITY LIQUIDITY RISK
GREATER OF:
40% of Undisbursed & Loans not yet effective
$617.3 $246.9 $620.6 100.5%
3 Years of Net Funding
Requirements
$508.2 $508.2 $620.6 122.1%
MARKET INVESTMENT RISK Investment Risk - Single Entity Limit 10% of Total
Investment Portfolio$535.6 $53.6 $18.3 3.4%
Investment Risk - Single Entity Limit - US Treasury or Gov’t Agency
35% of Total Investment Portfolio
$535.6 $187.5 $165.1 30.8%
Commercial Entity Exposure Limit 50% of Total Investment Portfolio
$535.6 $267.8 $147.9 27.6%
OPERATIONAL Operational Risk Equal to or Less than $1mn per annum
1 0 0%
Zero Tolerance for Fraud
0 0 0%
• Line 3 – IAD provides assurance on internal compliance with controls.
Operational Risk
System
CDB continued to use the aCCelerate operational risk system which automates the Bank’s end-to-end operational risk management process, including the annual risk control self-assessment risk register; and escalation and manage-ment processes. The system also serves as an automated internal surveillance and early warning system for identifying potential threats to the Bank. During the year, the ORM monitored the progress of control actions against the baseline previously set.
Organisation
The Office of Risk Management (ORM) is an independent but integral part of the Bank’s activities, free from influence. The Bank’s risk liaison framework is formally aligned to ORM, as part of an extended monitoring framework.
The framework is anchored in a strong three lines of defence governance structure defined below:
• Line 1 – Front Line Functions are the core areas where activities take place either in the front, middle or back office.
• Line 2 – ORM provides leadership, guidance, monitoring, and independent oversight of the activities conducted by Line 1.

CARIBBEAN DEVELOPMENT BANK ANNUAL REPORT 2020 | 62CARIBBEAN DEVELOPMENT BANK ANNUAL REPORT 2020 | 62
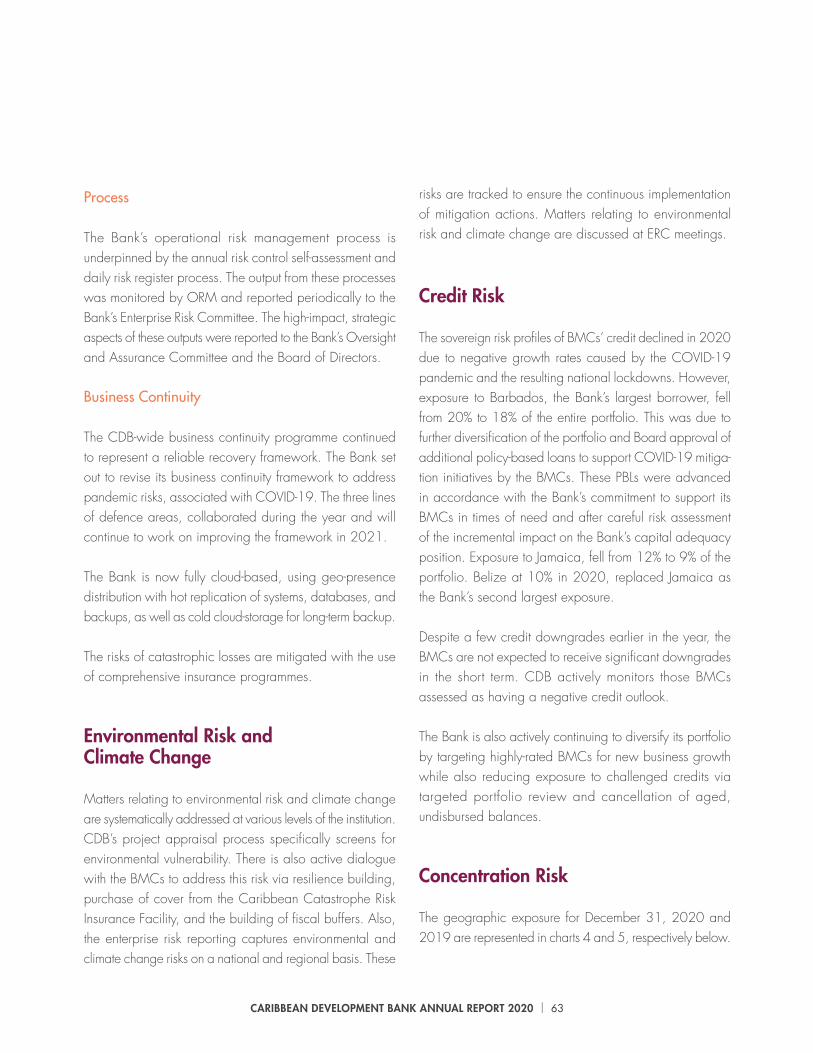
CARIBBEAN DEVELOPMENT BANK ANNUAL REPORT 2020 | 63
risks are tracked to ensure the continuous implementation of mitigation actions. Matters relating to environmental risk and climate change are discussed at ERC meetings.
Credit Risk
The sovereign risk profiles of BMCs’ credit declined in 2020 due to negative growth rates caused by the COVID-19 pandemic and the resulting national lockdowns. However, exposure to Barbados, the Bank’s largest borrower, fell from 20% to 18% of the entire portfolio. This was due to further diversification of the portfolio and Board approval of additional policy-based loans to support COVID-19 mitiga-tion initiatives by the BMCs. These PBLs were advanced in accordance with the Bank’s commitment to support its BMCs in times of need and after careful risk assessment of the incremental impact on the Bank’s capital adequacy position. Exposure to Jamaica, fell from 12% to 9% of the portfolio. Belize at 10% in 2020, replaced Jamaica as the Bank’s second largest exposure.
Despite a few credit downgrades earlier in the year, the BMCs are not expected to receive significant downgrades in the short term. CDB actively monitors those BMCs assessed as having a negative credit outlook.
The Bank is also actively continuing to diversify its portfolio by targeting highly-rated BMCs for new business growth while also reducing exposure to challenged credits via targeted portfolio review and cancellation of aged, undisbursed balances.
Concentration Risk
The geographic exposure for December 31, 2020 and 2019 are represented in charts 4 and 5, respectively below.
Process
The Bank’s operational risk management process is underpinned by the annual risk control self-assessment and daily risk register process. The output from these processes was monitored by ORM and reported periodically to the Bank’s Enterprise Risk Committee. The high-impact, strategic aspects of these outputs were reported to the Bank’s Oversight and Assurance Committee and the Board of Directors.
Business Continuity
The CDB-wide business continuity programme continued to represent a reliable recovery framework. The Bank set out to revise its business continuity framework to address pandemic risks, associated with COVID-19. The three lines of defence areas, collaborated during the year and will continue to work on improving the framework in 2021.
The Bank is now fully cloud-based, using geo-presence distribution with hot replication of systems, databases, and backups, as well as cold cloud-storage for long-term backup.
The risks of catastrophic losses are mitigated with the use of comprehensive insurance programmes.
Environmental Risk and Climate Change
Matters relating to environmental risk and climate change are systematically addressed at various levels of the institution. CDB’s project appraisal process specifically screens for environmental vulnerability. There is also active dialogue with the BMCs to address this risk via resilience building, purchase of cover from the Caribbean Catastrophe Risk Insurance Facility, and the building of fiscal buffers. Also, the enterprise risk reporting captures environmental and climate change risks on a national and regional basis. These

CARIBBEAN DEVELOPMENT BANK ANNUAL REPORT 2020 | 64
CHART 4: CDB’S GEOGRAPHIC EXPOSURE AT DECEMBER 31, 2020
ANGUILLA
ANTIGUA AND BARBUDA
THE BAHAMAS
BARBADOS
BELIZE
SURINAMES
ST. VINCENT AND THE GRENADINES
TRINIDAD AND TOBAGO
REGIONALS | TURKS AND CAICOS ISLANDS
VIRGIN ISLANDS
DOMINICA
GRENADA
GUYANA
ST. KITTS AND NEVIS
JAMAICA
SAINT LUCIA
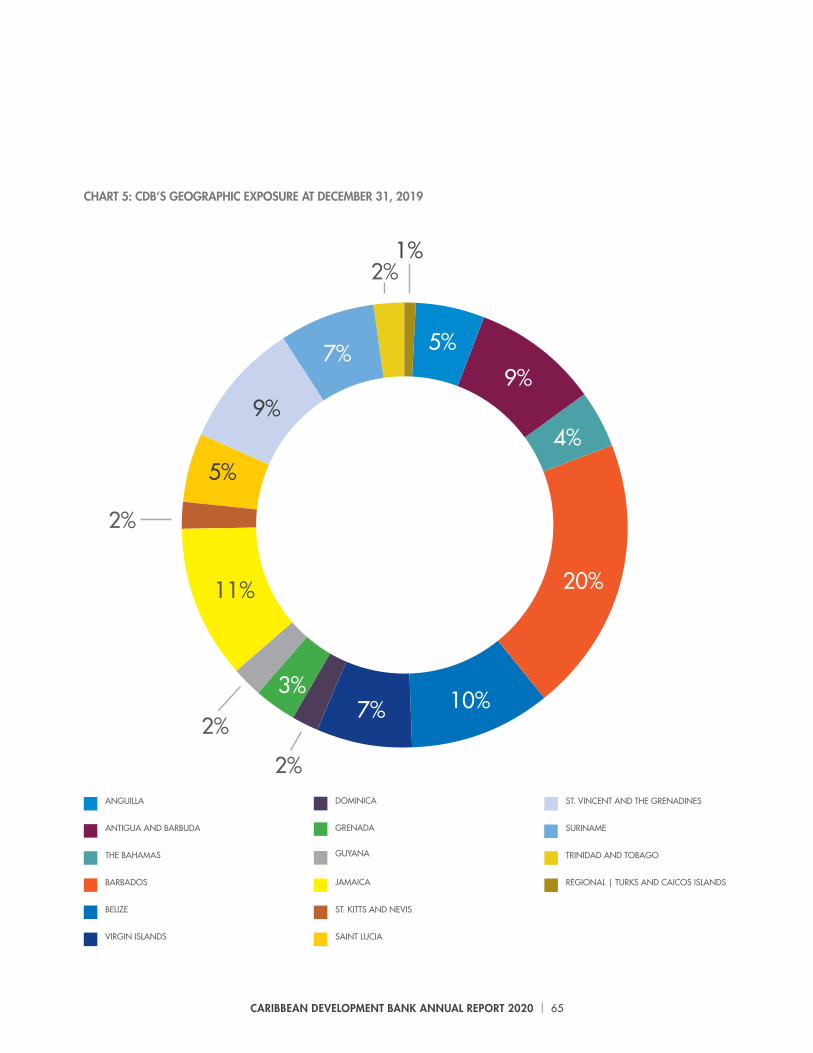
CARIBBEAN DEVELOPMENT BANK ANNUAL REPORT 2020 | 65
ANGUILLA
ANTIGUA AND BARBUDA
THE BAHAMAS
BARBADOS
BELIZE
VIRGIN ISLANDS
DOMINICA
GRENADA
GUYANA
ST. KITTS AND NEVIS
SAINT LUCIA
JAMAICA
SURINAME
ST. VINCENT AND THE GRENADINES
TRINIDAD AND TOBAGO
REGIONAL | TURKS AND CAICOS ISLANDS
CHART 5: CDB’S GEOGRAPHIC EXPOSURE AT DECEMBER 31, 2019

CARIBBEAN DEVELOPMENT BANK ANNUAL REPORT 2020 | 66
decreasing to 18% at year end 2020. The Bank’s top five sovereign trends are represented in Chart 6.
Exposure Trends
Overall, concentration remained at manageable levels and within the risk appetite of the Bank, with Barbados
CHART 6: TOP 5 HIGH RISK EXPOSURE TRENDS
Country Dec-13 Dec-14 Dec-15 Dec-16 Dec-17 Dec-18 Dec-19 Dec-20
Antigua and Barbuda 5% 6% 9% 9% 12% 11% 10% 9%
Barbados 17% 16% 13% 14% 11% 15% 20% 18%
Belize 8% 9% 8% 10% 10% 10% 10% 10%
Jamaica 23% 21% 23% 18% 17% 14% 12% 9%
St. Vincent and the Grenadines
10% 10% 10% 8% 7% 6% 9% 8%

CARIBBEAN DEVELOPMENT BANK ANNUAL REPORT 2020 | 67
operational risk controls; managing undisbursed balances; and maintaining a robust capital generation strategy.
These efforts resulted in a reduction in risk-weighted assets, while the Bank increased its capital levels as reflected in Chart 6.
Capital Risk
Measures, adopted by the Bank to improve its capital adequacy, included encouraging new lending to highly- rated BMCs; supporting lower-rated entities with interven-tions, sourced from its soft funding window; enforcing hard credit limit controls; minimising concentration; strengthening
CARIBBEAN DEVELOPMENT BANK ANNUAL REPORT 2020 | 68
CHART 7: S&P RISKWEIGHTED ASSETS VERSUS CDB EQUITY CAPITAL TRENDS (US 000S)
book, and business and concentration risks. These are then complemented with top-down and bottom-up scenario assessments to determine the extent of additive capital that may be needed as a cushion against unexpected risk losses.
Under Pillar III, CDB has been meeting its enhanced disclosure reporting obligations by improving the dissemina-tion of risk reviews. The Bank is currently monitoring newly implemented Basel III and the impending Basel IV rules to determine the need for amendments to its modus operandi.
Internal Capital Adequacy Calculations
The Bank’s capital adequacy is computed manually, utilising the Basel II framework.
Under Pillar I, a Basic Indicator Approach for Operational Risk and a modified Standardised Approach for Credit Risk are used.
Under Pillar II, the Bank ensures that all other residual risks over and above Pillar I are computed. These include, additional liquidity requirements, interest rate in the banking
Standard & Poor's Risk Charges

CARIBBEAN DEVELOPMENT BANK ANNUAL REPORT 2020 | 69
Market Risk
CDB’s overall objective is to manage market risks to minimise losses and optimise return. During 2020, the Bank applied revised treasury guidelines, approved by the Board of Directors in the management of its portfolio to maximise returns whilst minimising risk.
Interest Rate Risk
CDB manages interest rate exposure by ensuring that changes in the cash flow of its assets closely match those
of its liabilities. This relationship is managed with the use of interest rate swaps, which convert fixed-rate liabilities into floating-rate liabilities. Residual exposure, resulting from interest rate movements, is effectively monitored and managed operationally with governance oversight provided by ERC. Residual interest rate exposure risks, which arose during the year, were well within the Bank’s risk appetite.
Foreign Exchange Risk
CDB’s exposure to currency exchange movements is mini-mised by the extent of its activities, which limit its assets and
Standard & Poor's Risk Charges

CARIBBEAN DEVELOPMENT BANK ANNUAL REPORT 2020 | 70CARIBBEAN DEVELOPMENT BANK ANNUAL REPORT 2020 | 70

CARIBBEAN DEVELOPMENT BANK ANNUAL REPORT 2020 | 71CARIBBEAN DEVELOPMENT BANK ANNUAL REPORT 2020 | 70
New Developments
A new risk-based pricing model, which is in the testing phase, will enable the Bank to independently price inter-ventions for the non-sovereign sector.
Further improvements were made to the Bank’s risk adjusted capital framework modelled around the approach of a reputed external rating agency. The framework and model were reviewed by OAC, as well as the Board of Directors, which provided feedback. The Bank intends to finalise the framework and attain Board approval in the first quarter of 2021. The framework and model, with built-in scenarios capabilities, will enable the CDB to ex-ante, assess and determine its capital adequacy position, under different circumstances, to effectively support its strategic planning efforts.
liabilities to a single currency, United States dollars. Mis-matches are managed effectively via the use of derivative hedging instruments, where necessary. Loans by the Bank are made either from currencies available from members’ subscriptions, or from currencies borrowed. The principal amounts are repayable to the Bank in the currencies lent. Residual currency exposure arising during the year were well within the Bank’s risk appetite.
Liquidity and Funding Risk
CDB’s objective is to ensure that all foreseeable funding commitments can be met when due, and that access to the wholesale market is maintained.
To that end, the Bank seeks to maintain a portfolio of highly liquid assets, augmented with a diversified funding base to enable it to respond promptly to unforeseen liquidity demands. There were no anticipated roll-over issues, as the risk was eliminated with no immediate maturities anticipated.
CDB loans are usually fully disbursed over several years. As a result, undisbursed balances on approved loans continue to rise. CDB is generally required to provide funds to BMCs once Board approval has been granted; and this leads to a call on liquidity. The risks to liquidity shortfalls are managed by adherence to the Bank’s policy of maintaining a net, three-year funding requirement, or 40% of undisbursed commitments, whichever is greater. At year end 2020, CDB’s liquid assets exceeded the 150% prudential minimum guideline, which was in keeping with management’s decision to maintain high-liquidity levels.
The liquidity position of the Bank is further supported via access to approved unsecured facilities, with a highly reputed and rated international financial institution.

CARIBBEAN DEVELOPMENT BANK ANNUAL REPORT 2020 | 72
MANAGEMENT’S DISCUSSION
AND ANALYSIS
SECTION 6

CARIBBEAN DEVELOPMENT BANK ANNUAL REPORT 2020 | 73

CARIBBEAN DEVELOPMENT BANK ANNUAL REPORT 2020 | 74
I. OVERVIEW
CDB is a multilateral financial institution dedicated to the development of the economies of the BMCs with a focus on the least developed countries, primarily through project loans and technical assistance to the governments, public agencies and other entities in those countries. The Bank’s main goals are to promote sustainable economic development to reduce poverty and facilitate regional integration. The Bank was established in 1969 and is owned by its member countries. These include 19 BMCs and 9 non-borrowing members.
The Bank is structured into two funds through which it delivers on its mandate. These comprise the Ordinary Capital Resources (OCR) and the Special Funds Resources (SFR). The OCR operations are financed from CDB’s share capital, borrowings raised in the capital markets, lines of credit from commercial and other multilateral institutions and internally generated equity. The SFR operations are financed from the contributions of members and non-members of the Bank to the Special Development Fund (SDF) and Other Special Funds (OSF). The SFR comprises the Bank’s concessionary funding window.
The Bank is rated by three major international rating agencies. In March 2020 Fitch Ratings reaffirmed its Long-Term Issuer Default Rating (IDR) of AA+ with a Stable Outlook. The outlook was downgraded from Stable to Negative in March 2021. This change was primarily driven by the potential adverse economic, fiscal and social impacts of COVID-19 in the BMCs. In May 2020, Standard and Poor’s (S&P) affirmed its Long-Term Issuer Credit Rating of AA+ with a Stable Outlook. In November 2020, Moody’s Investor Services affirmed CDB’s Long Term Issuer Rating as Aa1 with a Stable Outlook. These ratings were reaffirmed in May 2021.
The following discussions should be read in conjunction with the audited financial statements and accompanying Notes of the Bank set out in Section 7 of this report.
II. ORDINARY CAPITAL RESOURCES
FINANCIAL STATEMENT REPORTING
The financial statements of the OCR are prepared in accordance with International Financial Reporting Standards (IFRS) on an historical cost basis, as modified by the measurement of debt securities held at fair value through Other Comprehensive Income (OCI) and derivative financial instruments which are reflected at fair value through profit and loss.
The preparation of the financial statements in conformity with IFRS requires management to make estimates and assumptions and to exercise judgement in the process of applying its various accounting policies.
All of the amounts shown in the financial statements are United States dollar equivalents.
MANAGEMENT REPORTING
Management has determined that operating income is the best representation of the results of the Bank’s core activities, and it is therefore used in the determination of CDB’s financial performance evaluations, liquidity, capital adequacy and other ratios and analyses. The accounting treatment in accordance with IFRS requires that derivatives are recorded at their fair value through profit and loss. This creates significant income volatility due to foreign exchange and interest rate movements, and is not representative of the underlying strategy, or economics of the transactions since it is the Bank’s policy to hold these instruments to maturity. As
CARIBBEAN DEVELOPMENT BANK ANNUAL REPORT 2020 | 75
a result, therefore, the Bank excludes the impact of these fair value and related foreign exchange translation adjustments associated with these derivatives from the determination of its operating income.
Loans and borrowings are recorded on the amortised cost basis.
In compliance with the international standards, the Bank calculates the impairment of its financial instruments under the provisions of IFRS 9. This standard is based upon the expected credit loss methodology, as well as various rules, governing the classification and subsequent treatment of financial instruments. This methodology is forward looking and based on changes in credit risk that determine whether impairment is calculated on a 12-month, expected loss, a lifetime expected loss or an impaired basis, with movements between categories being based on assessed increases or decreases in credit risks. Impairment provisions are calculated based on the exposure at default, which includes commitments, measured against expected cash flows that are factored by probability of default, loss given default applicable to the credit ratings of counterparties, the time value of money and probability weighted optimistic and pessimistic scenarios against the base scenario. RESULTS OF OPERATIONS OF THE OCR
Total comprehensive income: Total comprehensive income is defined as the sum of operating income and the effects of foreign exchange and interest rate adjustments related to derivative adjustments, fair value gains or losses on debt securities, and actuarial re-measurements. The OCR operations of the Bank for the year ended December 31, 2020 recorded total comprehensive income of $33.8 mn (2019: $34.0 mn) in line with that of the previous year. There was higher operating income that was offset by lower positive derivative foreign exchange and valuation adjustments. The Bank operated in a low interest rate
environment during the year due to the economic impact of COVID-19.
Operating income: Operating income is defined as income prior to derivative, fair value and debt security adjustments. Management defines this as its performance measure that reflects its core operations. This represents the metric, which is used to analyse the Bank’s performance and is allocated to reserves by the Board of Governors in accordance with the Bank’s Charter. The operating income was $29.5 mn (2019: $24.6 mn) an increase of 19.9%.
Income from loans: Loan income for the year declined by $2.1 mn to $56.5 mn (2019: $58.6 mn). This was due to a lower average interest rate of 4.15% (2019: 4.80%) due to the lower interest rates although partly mitigated by a higher average portfolio balance.
Income from cash and investments: For the year, income from cash and investments was $8.9 mn (2019: $8.3 mn), representing an increase of $0.6 mn, which was driven by higher volumes that mitigated the lower interest rates during the year.
Interest expense: Interest expense for the year was $21.6 mn (2019: $26.9 mn). The decline of $5.3 mn was due to the impact of very low interest rates during the year.
Operating expenses: In 2020, operating expenses amounted to $14.3 mn (2019: $15.4 mn). This change resulted from an increase in administrative expenses of $0.7 mn related to IAS19 pension obligation estimates. There was an impairment recovery of $7.0 mn (2019: $3.1 mn), reflecting lower exposures on demand notes and a significant reduction in the impaired private sector loans. The foreign exchange translation loss related to the Euro borrowing in 2019. (See following table).

CARIBBEAN DEVELOPMENT BANK ANNUAL REPORT 2020 | 76
OPERATING EXPENSES ($ mn)
2020 2019
Administrative expenses 15.9 15.2
Realised (gains)/losses (1.3) 0.2
Impairment (recovery)/ charges losses on financial assets (7.0) (3.1)
Other adjustments -– forex translations 6.7 3.1
Total operating expenses 14.3 15.4
Rate/Volume analysis: The rate/volume analysis shows the effect on interest income (excluding fees and charges and unrealised gains and losses) of the Bank analysed by the various drivers.
RATE/VOLUME ANALYSIS ($ mn)
Increase/(Decrease) Due to
Rate Volume Total
Interest-earning assets
Cash & investments (0.6) 1.1 0.5
Loans (7.0) 4.7 (2.3)
Total earning assets (7.6) 5.8 (1.8)
Interest-bearing liabilities (11.7) 6.3 (5.4)
Net change in interest income 4.1 (0.5) 3.6
FINANCIAL POSITION OF THE OCR
Total assets: As at December 31, 2020, total assets were $2,121.3 mn (2019: $2,095.5 mn), representing an increase of $25.8 mn (1.2%). This was due the impact of higher loan and derivative balances and lower cash and investments.
Loans: In 2020 the loan portfolio was $1,332.1 mn (2019: $1,249.3 mn). This was an increase of $82.8 (6.6%), reflecting higher net disbursements and a decreased impairment balance. The impaired non-performing non-sovereign loans in the portfolio were reduced to
$1.6 mn (2019: $3.0 mn) due to disposal of certain assets held as collateral.
Borrowings and other liabilities: Total liabilities decreased by $9.0 mn (0.8%) to $1,152.9 mn (2019: $1,161.9 mn). This decrease was mainly due to repayments during the year.
Shareholders’ equity: At December 31, 2020, CDB’s equity was $968.4 mn (2019: $933.6 mn). The increase of $34.8 mn (3.7%) was mainly due to the comprehensive income earned for the year. Total equity currently represents 45.6% (2019: 44.6%) of total assets.
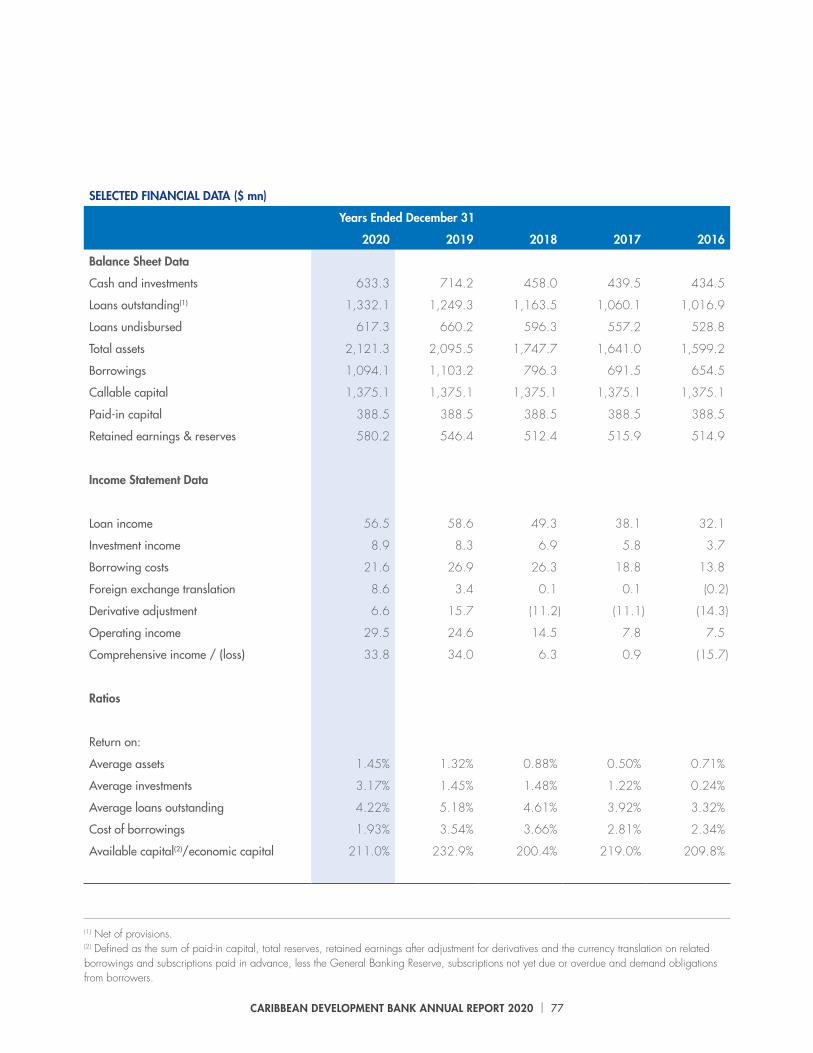
CARIBBEAN DEVELOPMENT BANK ANNUAL REPORT 2020 | 77
SELECTED FINANCIAL DATA ($ mn)
Years Ended December 31
2020 2019 2018 2017 2016
Balance Sheet Data
Cash and investments 633.3 714.2 458.0 439.5 434.5
Loans outstanding(1) 1,332.1 1,249.3 1,163.5 1,060.1 1,016.9
Loans undisbursed 617.3 660.2 596.3 557.2 528.8
Total assets 2,121.3 2,095.5 1,747.7 1,641.0 1,599.2
Borrowings 1,094.1 1,103.2 796.3 691.5 654.5
Callable capital 1,375.1 1,375.1 1,375.1 1,375.1 1,375.1
Paid-in capital 388.5 388.5 388.5 388.5 388.5
Retained earnings & reserves 580.2 546.4 512.4 515.9 514.9
Income Statement Data
Loan income 56.5 58.6 49.3 38.1 32.1
Investment income 8.9 8.3 6.9 5.8 3.7
Borrowing costs 21.6 26.9 26.3 18.8 13.8
Foreign exchange translation 8.6 3.4 0.1 0.1 (0.2)
Derivative adjustment 6.6 15.7 (11.2) (11.1) (14.3)
Operating income 29.5 24.6 14.5 7.8 7.5
Comprehensive income / (loss) 33.8 34.0 6.3 0.9 (15.7)
Ratios
Return on:
Average assets 1.45% 1.32% 0.88% 0.50% 0.71%
Average investments 3.17% 1.45% 1.48% 1.22% 0.24%
Average loans outstanding 4.22% 5.18% 4.61% 3.92% 3.32%
Cost of borrowings 1.93% 3.54% 3.66% 2.81% 2.34%
Available capital(2)/economic capital 211.0% 232.9% 200.4% 219.0% 209.8%
(1) Net of provisions.(2) Defined as the sum of paid-in capital, total reserves, retained earnings after adjustment for derivatives and the currency translation on related borrowings and subscriptions paid in advance, less the General Banking Reserve, subscriptions not yet due or overdue and demand obligations from borrowers.

CARIBBEAN DEVELOPMENT BANK ANNUAL REPORT 2020 | 78
III. SPECIAL DEVELOPMENT FUND
The Special Development Fund, (SDF), was established in 1970 and is the Bank’s largest pool of concessionary funding, offering loans on more concessionary terms and conditions than those that are applied in the Bank’s ordinary operations, that is, longer maturities and grace periods and lower interest rates.
The SDF represents a significant and important enabler in the Bank’s mission to reduce poverty and contribute to sustained welfare enhancement in eligible BMCs. Successive replenishments of the SDF since its inception have allowed CDB to make a meaningful contribution to the transformation of the lives of underprivileged and at-risk members of the population, primarily those in rural communities.
The SDF originally comprised a conglomeration of funds that operated under varied terms and conditions fixed by the Fund’s various contributors. These differing terms and conditions created a number of complexities and inefficiencies in the Fund’s management and operations, which prompted the decision to set up the fund as one with a uniform set of rules, hence the formation of the Unified Special Development Fund [SDF(U)] in 1983.
All members of the Bank are required to contribute to SDF(U), and contributions are also sought from non-members. Contributions are interest-free and provided on a multi-year basis, for an indefinite term. SDF(U) also has consistent terms, objectives and procurement conditions and thus overcomes the problems associated with individual donors and funding arrangements. There is a supplementary governance structure through an Annual Meeting of Contributors which focuses on the SDF(U)’s operations and an annual report on the performance of the fund is provided. Non-members are also invited to participate as observers in meetings of the Bank’s Board of Directors (BOD) and Board of Governors (BOG).
Contributors to the SDF (U), which is usually replenished in four-year cycles, enter into negotiations with the Bank with the objective of agreeing on the priority areas and programmes that should be addressed and on the amount of SDF (U) resources which will be necessary to realise the agreed objectives. The ninth cycle of the SDF (U), which covered the period 2017-2020, underpinned the Bank’s efforts to support the BMCs in achieving their development goals consistent with the Sustainable Development Goals (SDGs). Negotiations are in process on a new funding cycle (SDF10) during the new year.
SUMMARY OF RESULTS
RESULT OF OPERATIONS OF THE SDF
For the year ended December 31, 2020 there was comprehensive income of $7.5 mn (2019: $8.7 mn). Total interest income for the year was $24.7 mn (2019 : $26.3 mn). The decrease of 6.1% was due to lower returns on investments as a consequence of lower interest rates. Total expenses were $17.2 mn (2019: $17.6 mn), the reduction occurring as a result of foreign exchange gains.
Income from loans: Loan income of $12.5 mn was the same as in 2019 as the higher portfolio balance compensated for lower average interest rates. Income from cash and investments: Income from cash and investments declined to $12.2 mn (2019: $13.8 mn), reflecting a lower portfolio and lower-interest rates.
Administrative expenses: Administrative expenses were $17.7 mn (2019: $16.5 mn) an increase of $1.2 mn. The SDF’s share of the Bank’s total administrative expenses is based on a predetermined cost-sharing formula, which is driven by the number of loan accounts and their status.

CARIBBEAN DEVELOPMENT BANK ANNUAL REPORT 2020 | 79
FINANCIAL POSITION OF THE SDF
Total assets: At December 31,2020, total assets were $1,065.3 mn (2019: $1,040.2 mn).
Investments: At December 31, 2020, SDF cash and investments amounted to $359.7 mn (2019: $391.3 mn). This change was largely due to loan disbursements.
Loan portfolio: Total outstanding loans were $614.8 mn (2019: $560.2 mn) an increase of $54.6 mn due to a higher level of activity.
Receivable from contributors: This amounted to $90.6 mn (2019: $88.2 mn) largely reflecting exchange rate adjustments on demand notes.
Liabilities and Funds: At the end of the year, liabilities and funds totalled $835.4 mn (2019: $819.0 mn), where the change was due to increases in accounts payable and accrued liabilities and funds, made available.
Contributed resources: Contributions to the SDF net of allocations to technical assistance and grant resources increased by $7.1 mn to $776.1 mn (2019: $769.0 mn). This was the due to additional contributions received with respect to SDF9.
IV. OTHER SPECIAL FUNDS
The Other Special Funds (OSF) was established to carry out the special operations of the Bank by providing resources on concessional terms to assist BMCs in achieving poverty reduction. The Bank accepts contributions to the OSF for on-lending or administration on terms agreed with the contributors once the purposes are consistent with its objectives and functions.
SUMMARY OF RESULTS
RESULTS OF OPERATIONS OF THE OSF
For the year, there was comprehensive income of $3.5 mn (2019: $2.9 mn) an increase of $0.6 mn (20.7%). This change was largely due to unrealised foreign exchange gains and dividends from equity investments.
Income from loans: Income from loans was $1.7 mn (2019: $1.9mn). This decline was caused by a lower average balance in the loan portfolio compared to the previous year.
Income from cash and investments: This decreased to $0.9 mn (2019: $1.9 mn) mainly due to unrealised losses.
Administrative expenses: Administrative expenses remained relatively flat at $1.1 mn (2019: $1.0 mn). The OSF’s share of the total administrative expenses for the Bank as a whole is based on a predetermined cost-sharing formula, which is driven by the number of loans and accounts and their status. FINANCIAL POSITION OF THE OSF
Total assets: This registered $450.2 mn (2019: $451.4 mn), representing a decline of $1.2 mn. The main components of the change are discussed below.
Cash and Investments: Cash and investments amounted to $99.8 mn (2019: $82.6 mn), reflecting a decline in loan balances where repayments exceeded disbursements.
Loan portfolio: Total outstanding loans were $78.6 mn (2019: $85.1 mn) a decrease of $6.5 mn due to repayments exceeding disbursements during the year.
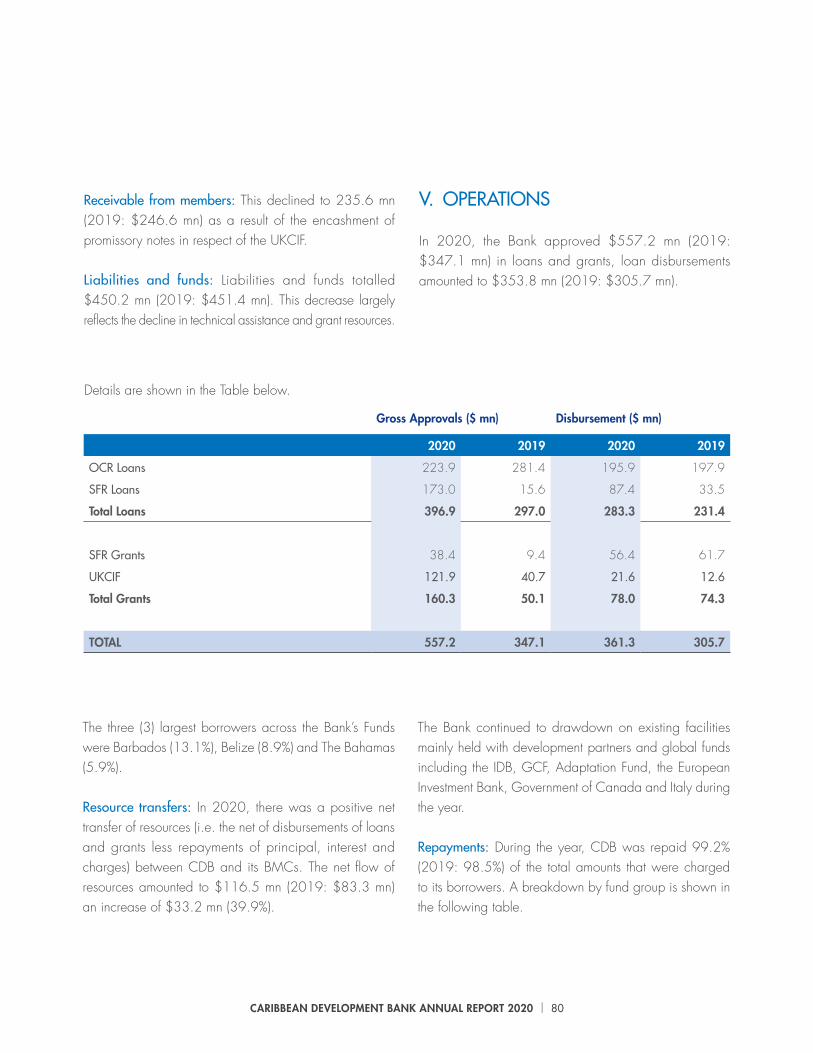
CARIBBEAN DEVELOPMENT BANK ANNUAL REPORT 2020 | 80
Receivable from members: This declined to 235.6 mn (2019: $246.6 mn) as a result of the encashment of promissory notes in respect of the UKCIF.
Liabilities and funds: Liabilities and funds totalled $450.2 mn (2019: $451.4 mn). This decrease largely reflects the decline in technical assistance and grant resources.
V. OPERATIONS
In 2020, the Bank approved $557.2 mn (2019: $347.1 mn) in loans and grants, loan disbursements amounted to $353.8 mn (2019: $305.7 mn).
The three (3) largest borrowers across the Bank’s Funds were Barbados (13.1%), Belize (8.9%) and The Bahamas (5.9%).
Resource transfers: In 2020, there was a positive net transfer of resources (i.e. the net of disbursements of loans and grants less repayments of principal, interest and charges) between CDB and its BMCs. The net flow of resources amounted to $116.5 mn (2019: $83.3 mn) an increase of $33.2 mn (39.9%).
Details are shown in the Table below.
Gross Approvals ($ mn) Disbursement ($ mn)
2020 2019 2020 2019
OCR Loans 223.9 281.4 195.9 197.9
SFR Loans 173.0 15.6 87.4 33.5
Total Loans 396.9 297.0 283.3 231.4
SFR Grants 38.4 9.4 56.4 61.7
UKCIF 121.9 40.7 21.6 12.6
Total Grants 160.3 50.1 78.0 74.3
TOTAL 557.2 347.1 361.3 305.7
The Bank continued to drawdown on existing facilities mainly held with development partners and global funds including the IDB, GCF, Adaptation Fund, the European Investment Bank, Government of Canada and Italy during the year.
Repayments: During the year, CDB was repaid 99.2% (2019: 98.5%) of the total amounts that were charged to its borrowers. A breakdown by fund group is shown in the following table.

CARIBBEAN DEVELOPMENT BANK ANNUAL REPORT 2020 | 81
December 31, 2020Amounts in $ mn
December 31, 2019Amounts in $ mn
Principal Interest & Charges Principal Interest & Charges
Billed Received % Billed Received %
OCR 159.5 157.9 99.0 171.8 168.4 98.0
SDF 44.1 44.1 100.0 43.7 43.7 100
OSF 8.6 8.6 100.0 8.8 8.8 100
Total $212.2 $210.6 99.2 224.3 $220.9 98.5
TOTAL ADMINISTRATIVE EXPENSES
A comparative analysis of major administrative expenditure items is shown below. At December 31, 2020, total administrative expenses amounted to
2020 2019 Variance %
Employee costs 24.0 22.7 (1.3) (5.7)
Professional fees and consultants 1.7 1.9 0.2 10.5
Travel 0.3 1.5 1.2 80.0
Maintenance and utilities 0.6 0.7 0.1 14.3
IT services 1.8 1.3 (0.5) (38.5)
Other 1.9 3.1 1.2 38.7
Depreciation 1.3 1.4 0.1 7.1
Base - Total 31.6 32.6 1.0 3.1
Transformation Expenses 2.9 - (2.9)
Fiftieth Anniversary Celebrations 0.1 - (0.1)
Enhanced – Total Administrative Expenses 34.6 32.6 (2.0) 6.1
ANALYSIS OF ACTUAL EXPENSES FOR 2020 AND 2019 ($ mn)
$34.6 mn, where recurrent expenses totalled $31.6 mn, decreasing by $1.0 mn (3.1%) from $32.6 mn in 2019 as costs continued to be actively managed, and the one-off expenditure items totalled $3.0 mn.

CARIBBEAN DEVELOPMENT BANK ANNUAL REPORT 2020 | 82
FINANCIALSTATEMENTS
SECTION 7

83
CARIBBEAN DEVELOPMENT BANK ANNUAL REPORT 2020

84
CARIBBEAN DEVELOPMENT BANK ANNUAL REPORT 2020
FINANCIALSTATEMENTS

85
CARIBBEAN DEVELOPMENT BANK ANNUAL REPORT 2020
CCaarriibbbbeeaann DDeevveellooppmmeenntt BBaannkk OOrrddiinnaarryy CCaappiittaall RReessoouurrcceess Financial Statements
For the year ended December 31, 2020 (Expressed in thousands of United States Dollars unless otherwise stated)

86
CARIBBEAN DEVELOPMENT BANK ANNUAL REPORT 2020
CCAARRIIBBBBEEAANN DDEEVVEELLOOPPMMEENNTT BBAANNKK OORRDDIINNAARRYY CCAAPPIITTAALL RREESSOOUURRCCEESS Index to the Financial Statements For the year ended December 31, 2020
Pages
Independent Auditor’s Report 1-5 Statement of Financial Position 6-7 Statement of Changes in Equity 8 Statement of Comprehensive Income 9 Statement of Cash Flows 10 Notes to the Financial Statements 11-92
Independent Auditor's Report
Statement of Financial Position
Statement of Change in Equity
Statement of Comprehensive Income
Statement of Cash Flows
Notes to the Financial Statements
Page
86-92
93-94
95
96
97
98-180

87
CARIBBEAN DEVELOPMENT BANK ANNUAL REPORT 2020
KPMG Hastings Christ Church, BB 15154 Barbados West Indies Telephone: (246) 434-3900 Fax: (246) 427-7123 P. O. Box 690C Bridgetown, Barbados
- 1 - KPMG in Barbados and the Eastern Caribbean, a partnership registered in Barbados, Antigua and Barbuda, Saint Lucia and St. Vincent and the Grenadines, and a member firm of the KPMG global organization of independent member firms affiliated with KPMG International Limited, a private English company limited by guarantee.
INDEPENDENT AUDITOR’S REPORT To the Board of Governors of Caribbean Development Bank
Report on the Audit of the Financial Statements
Opinion
We have audited the financial statements of the Ordinary Capital Resources of the Caribbean Development Bank (“the Bank”), which comprise the statement of financial position as at December 31, 2020, the statements of comprehensive income, changes in equity and cash flows for the year then ended, and notes, comprising significant accounting policies and other explanatory information.
In our opinion, the accompanying financial statements present fairly, in all material respects, the financial position of the Bank as at December 31, 2020, and its financial performance and its cash flows for the year then ended in accordance with International Financial Reporting Standards (IFRS).
Basis for Opinion
We conducted our audit in accordance with International Standards on Auditing (ISAs). Our responsibilities under those standards are further described in the Auditors’ Responsibilities for the Audit of the Financial Statements section of our report. We are independent of the Bank in accordance with International Ethics Standards Board for Accountants International Code of Ethics for Professional Accountants (including International Independence Standards) (IESBA Code) together with the ethical requirements that are relevant to our audit of the financial statements in Barbados and we have fulfilled our other ethical responsibilities in accordance with these requirements and the IESBA Code. We believe that the audit evidence we have obtained is sufficient and appropriate to provide a basis for our opinion.

88
CARIBBEAN DEVELOPMENT BANK ANNUAL REPORT 2020
- 2 -
INDEPENDENT AUDITOR’S REPORT (CONTINUED)
To the Board of Governors of Caribbean Development Bank (continued)
Report on the Audit of the Financial Statements (continued)
Key Audit Matters
Key audit matters are those matters that, in our professional judgment, were of most significance in our audit of the financial statements of the current period. These matters were addressed in the context of our audit of the financial statements as a whole, and in forming our opinion thereon, and we do not provide a separate opinion on these matters. The key audit matters for the financial statements are detailed below:-
Expected credit loss Related disclosures in the financial statements are included in Note 2, 5, 8, 10, 12 and Note 13. As a Multilateral Development Bank (MDB), the Bank’s largest exposure is country credit risk, which is the risk that a Borrowing Member Country is unable or unwilling to service its obligations to the Bank. This is a key audit matter as the estimation of Expected Credit Losses (ECL) is inherently uncertain and requires the application of judgment and use of subjective assumptions by management. Furthermore, models used to determine credit impairment are complex.
We assessed and tested the design and operating effectiveness of controls over:
- Management’s process for making lending decisions inclusive of the approval, disbursement and monitoring of the loan portfolio.
- Data used to determine the allowance for expected credit loss, including transactional data captured at loan origination, internal credit quality assessments, storage of data and computations.
We assessed the adequacy of allowance for expected credit loss by testing the key assumptions used in the Bank’s calculations regarding Loss Given Default, Probability of Default, and the relevant scenarios and stage clasification. In addition, we assessed the adequacy of the disclosures in the financial statements including disclosures of key assumptions, judgements and sensitivities.
We involved relevant specialists in areas that required specific expertise (i.e. compliance with IFRS 9).
89
CARIBBEAN DEVELOPMENT BANK ANNUAL REPORT 2020
- 3 -
INDEPENDENT AUDITOR’S REPORT (CONTINUED)
To the Board of Governors of Caribbean Development Bank (continued)
Report on the Audit of the Financial Statements (continued)
Key Audit Matters (continued) Fair value of financial instruments Related disclosures in the Financial Statements are included in Note 3, Risk Management and Note 5 Financial Assets, Fair value measurement. Valuation models are in use which require the input of market-observable data. The use of different valuation techniques and assumptions however could produce significantly different estimates of fair value. The associated risk management disclosure is complex and dependent upon high quality data. Consequently we have determined the valuation of debt securities and derivative financial instruments to be a key audit matter.
We reviewed the market prices applied to the Bank’s debt securities by comparing the prices used to an independent external source. We included derivative valuation specialists on our team who independently recomputed the fair value of all derivatives held by the Bank and the related sensitivity disclosures in accordance with IFRS 7, using their own internal model. We also assessed the adequacy of the disclosures in the financial statements, including the disclosure of valuation sensitivity and fair value hierarchy in Note 3 and the subsequent impact of the global pandemic in relation to Covid-19 in Note 29. We involved IT specialists in areas that required specific expertise (i.e. data reliability, input of market prices).
Other Matter
The financial statements of the Bank for the year ended December 31, 2019, were audited by another auditor who expressed an unmodified opinion on those financial statements on June 30, 2020.

90
CARIBBEAN DEVELOPMENT BANK ANNUAL REPORT 2020
- 4 -
INDEPENDENT AUDITOR’S REPORT (CONTINUED)
To the Board of Governors of Caribbean Development Bank (continued)
Report on the Audit of the Financial Statements (continued)
Other Information
Management is responsible for the other information. The other information comprises the Management’s Discussion and Analysis but does not include the financial statements and our auditors’ report thereon.
Our opinion on the financial statements does not cover the other information and we do not express any form of assurance conclusion thereon.
In connection with our audit of the financial statements, our responsibility is to read the other information and, in doing so, consider whether the other information is materially inconsistent with the financial statements or our knowledge obtained in the audit, or otherwise appears to be materially misstated. If, based on the work we have performed, we conclude that there is a material misstatement of this other information, we are required to report that fact. We have nothing to report in this regard.
Responsibilities of Management and the Oversight and Assurance Committee for the Financial Statements Management is responsible for the preparation and fair presentation of the financial statements in accordance with IFRS, and for such internal control as management determines is necessary to enable the preparation of financial statements that are free from material misstatement, whether due to fraud or error.
In preparing the financial statements, management is responsible for assessing the Bank’s ability to continue as a going concern, disclosing, as applicable, matters related to going concern and using the going concern basis of accounting unless management either intends to liquidate the Bank or to cease operations, or has no realistic alternative but to do so.
The Oversight and Assurance Committee is responsible for overseeing the Bank’s financial reporting process.
91
CARIBBEAN DEVELOPMENT BANK ANNUAL REPORT 2020
- 5 -
INDEPENDENT AUDITOR’S REPORT (CONTINUED)
To the Board of Governors of Caribbean Development Bank (continued)
Report on the Audit of the Financial Statements (continued)
Auditors’ Responsibilities for the Audit of the Financial Statements
Our objectives are to obtain reasonable assurance about whether the financial statements as a whole are free from material misstatement, whether due to fraud or error, and to issue an auditors’ report that includes our opinion. Reasonable assurance is a high level of assurance, but is not a guarantee that an audit conducted in accordance with ISAs will always detect a material misstatement when it exists. Misstatements can arise from fraud or error and are considered material if, individually or in the aggregate, they could reasonably be expected to influence the economic decisions of users taken on the basis of these financial statements.
As part of an audit in accordance with ISAs, we exercise professional judgment and maintain professional skepticism throughout the audit. We also: • Identify and assess the risks of material misstatement of the financial statements,
whether due to fraud or error, design and perform audit procedures responsive to those risks, and obtain audit evidence that is sufficient and appropriate to provide a basis for our opinion. The risk of not detecting a material misstatement resulting from fraud is higher than for one resulting from error, as fraud may involve collusion, forgery, intentional omissions, misrepresentations, or the override of internal control.
• Obtain an understanding of internal control relevant to the audit in order to design
audit procedures that are appropriate in the circumstances, but not for the purpose of expressing an opinion on the effectiveness of the Bank’s internal control.
• Evaluate the appropriateness of accounting policies used and the reasonableness
of accounting estimates and related disclosures made by management. • Conclude on the appropriateness of management’s use of the going concern basis
of accounting and, based on the audit evidence obtained, whether a material uncertainty exists related to events or conditions that may cast significant doubt on the Bank’s ability to continue as a going concern. If we conclude that a material uncertainty exists, we are required to draw attention in our auditors’ report to the related disclosures in the financial statements or, if such disclosures are inadequate, to modify our opinion. Our conclusions are based on the audit evidence obtained up to the date of our auditors’ report. However, future events or conditions may cause the Bank to cease to continue as a going concern.
• Evaluate the overall presentation, structure and content of the financial statements,
including the disclosures, and whether the financial statements represent the underlying transactions and events in a manner that achieves fair presentation.
92
CARIBBEAN DEVELOPMENT BANK ANNUAL REPORT 2020
- 6 -
INDEPENDENT AUDITOR’S REPORT (CONTINUED)
To the Board of Governors of Caribbean Development Bank (continued)
Report on the Audit of the Financial Statements (continued)
Auditors’ Responsibilities for the Audit of the Financial Statements (continued)
We communicate with the Oversight and Assurance Committee regarding, among other matters, the planned scope and timing of the audit and significant audit findings, including any significant deficiencies in internal control that we identify during our audit. We also provide the Oversight and Assurance Committee with a statement that we have complied with relevant ethical requirements regarding independence, and communicate with them all relationships and other matters that may reasonably be thought to bear on our independence, and where applicable, actions taken to eliminate threats or safeguards applied.
From the matters communicated with the Oversight and Assurance Committee, we determine those matters that were of most significance in the audit of the financial statements of the current period and are therefore the key audit matters. We describe these matters in our auditors’ report unless law or regulation precludes public disclosure about the matter or when, in extremely rare circumstances, we determine that a matter should not be communicated in our report because the adverse consequences of doing so would reasonably be expected to outweigh the public interest benefits of such communication.
Other Matter
This report is made solely to the Bank’s members, as a body, in accordance with Article 38, sub-section 2 of the Agreement establishing the Bank entered into force on January 26, 1970. Our audit work has been undertaken so that we might state to the Bank’s members those matters we are required to state to them in an auditor’s report and for no other purpose. To the fullest extent permitted by law, we do not accept or assume responsibility to anyone other than the Bank and the Bank’s members as a body, for our audit work, for this report, or for the opinion we have formed.
The engagement partner on the audit resulting in this independent auditors’ report is Michael Edghill.
Chartered Accountants Bridgetown, Barbados June 30, 2021
90 91
CARIBBEAN DEVELOPMENT BANK ANNUAL REPORT 2020 CARIBBEAN DEVELOPMENT BANK ANNUAL REPORT 2020
- 5 -
INDEPENDENT AUDITOR’S REPORT (Continued) TO THE BOARD OF GOVERNORS OF CARIBBEAN DEVELOPMENT BANK Report on the Audit of the Financial Statements (continued) Auditors’ Responsibilities for the Audit of the Financial Statements
We communicate with those charged with governance regarding, among other matters, the planned scope and timing of the audit and significant audit findings, including any significant deficiencies in internal control that we identify during our audit. We also provide those charged with governance with a statement that we have complied with relevant ethical requirements regarding independence, and communicate with them all relationships and other matters that may reasonably be thought to bear on our independence, and where applicable, actions taken to eliminate threats or safeguards applied.
From the matters communicated with those charged with governance, we determine those matters that were of most significance in the audit of the financial statements of the current period and are therefore the key audit matters. We describe these matters in our auditors’ report unless law or regulation precludes public disclosure about the matter or when, in extremely rare circumstances, we determine that a matter should not be communicated in our report because the adverse consequences of doing so would reasonably be expected to outweigh the public interest benefits of such communication.
Other Matter
This report is made solely to the Bank’s members, as a body, in accordance with Article 38, sub-section 2 of the Agreement establishing the Bank, entered into force on January 26, 1970. Our audit work has been undertaken so that we might state to the Bank’s members those matters we are required to state to them in an auditor’s report and for no other purpose. To the fullest extent permitted by law, we do not accept or assume responsibility to anyone other than the Bank and the Bank’s members as a body, for our audit work, for this report, or for the opinion we have formed.
The engagement partner on the audit resulting in this independent auditors’ report is Michael Edghill.
Chartered Accountants Bridgetown Barbados XXXX XX, 2021
CCAARRIIBBBBEEAANN DDEEVVEELLOOPPMMEENNTT BBAANNKK OORRDDIINNAARRYY CCAAPPIITTAALL RREESSOOUURRCCEESS SSTTAATTEEMMEENNTT OOFF FFIINNAANNCCIIAALL PPOOSSIITTIIOONN AAss ooff DDeecceemmbbeerr 3311,, 22002200 (expressed in thousands of United States dollars, unless otherwise stated)
- 6 -
2020 2019
Notes Assets
Cash and cash equivalents 6 $95,349 $292,045 Debt securities at fair value through other 7 comprehensive income 537,986 422,138 Receivables and prepaid assets 8 15,542 7,655 Cash collateral on derivatives 9 - 2,400 Loans outstanding 10 1,332,087 1,249,318 Receivable from members
Non-negotiable demand notes 11 21,597 38,512 Maintenance of value on currency holdings 12 3,572 4,389 Subscriptions in arrears 13 2,943 1,936 28,112 44,837
Derivative financial instruments 14 94,288 60,246
Property and equipment 15 17,984 16,875
Total Assets $2,121,348 $2,095,514
The accompanying notes form an integral part of these financial statements.

93
CARIBBEAN DEVELOPMENT BANK ANNUAL REPORT 2020
90 91
CARIBBEAN DEVELOPMENT BANK ANNUAL REPORT 2020 CARIBBEAN DEVELOPMENT BANK ANNUAL REPORT 2020
- 5 -
INDEPENDENT AUDITOR’S REPORT (Continued) TO THE BOARD OF GOVERNORS OF CARIBBEAN DEVELOPMENT BANK Report on the Audit of the Financial Statements (continued) Auditors’ Responsibilities for the Audit of the Financial Statements
We communicate with those charged with governance regarding, among other matters, the planned scope and timing of the audit and significant audit findings, including any significant deficiencies in internal control that we identify during our audit. We also provide those charged with governance with a statement that we have complied with relevant ethical requirements regarding independence, and communicate with them all relationships and other matters that may reasonably be thought to bear on our independence, and where applicable, actions taken to eliminate threats or safeguards applied.
From the matters communicated with those charged with governance, we determine those matters that were of most significance in the audit of the financial statements of the current period and are therefore the key audit matters. We describe these matters in our auditors’ report unless law or regulation precludes public disclosure about the matter or when, in extremely rare circumstances, we determine that a matter should not be communicated in our report because the adverse consequences of doing so would reasonably be expected to outweigh the public interest benefits of such communication.
Other Matter
This report is made solely to the Bank’s members, as a body, in accordance with Article 38, sub-section 2 of the Agreement establishing the Bank, entered into force on January 26, 1970. Our audit work has been undertaken so that we might state to the Bank’s members those matters we are required to state to them in an auditor’s report and for no other purpose. To the fullest extent permitted by law, we do not accept or assume responsibility to anyone other than the Bank and the Bank’s members as a body, for our audit work, for this report, or for the opinion we have formed.
The engagement partner on the audit resulting in this independent auditors’ report is Michael Edghill.
Chartered Accountants Bridgetown Barbados XXXX XX, 2021
CCAARRIIBBBBEEAANN DDEEVVEELLOOPPMMEENNTT BBAANNKK OORRDDIINNAARRYY CCAAPPIITTAALL RREESSOOUURRCCEESS SSTTAATTEEMMEENNTT OOFF FFIINNAANNCCIIAALL PPOOSSIITTIIOONN AAss ooff DDeecceemmbbeerr 3311,, 22002200 (expressed in thousands of United States dollars, unless otherwise stated)
- 6 -
2020 2019
Notes Assets
Cash and cash equivalents 6 $95,349 $292,045 Debt securities at fair value through other 7 comprehensive income 537,986 422,138 Receivables and prepaid assets 8 15,542 7,655 Cash collateral on derivatives 9 - 2,400 Loans outstanding 10 1,332,087 1,249,318 Receivable from members
Non-negotiable demand notes 11 21,597 38,512 Maintenance of value on currency holdings 12 3,572 4,389 Subscriptions in arrears 13 2,943 1,936 28,112 44,837
Derivative financial instruments 14 94,288 60,246
Property and equipment 15 17,984 16,875
Total Assets $2,121,348 $2,095,514
The accompanying notes form an integral part of these financial statements.
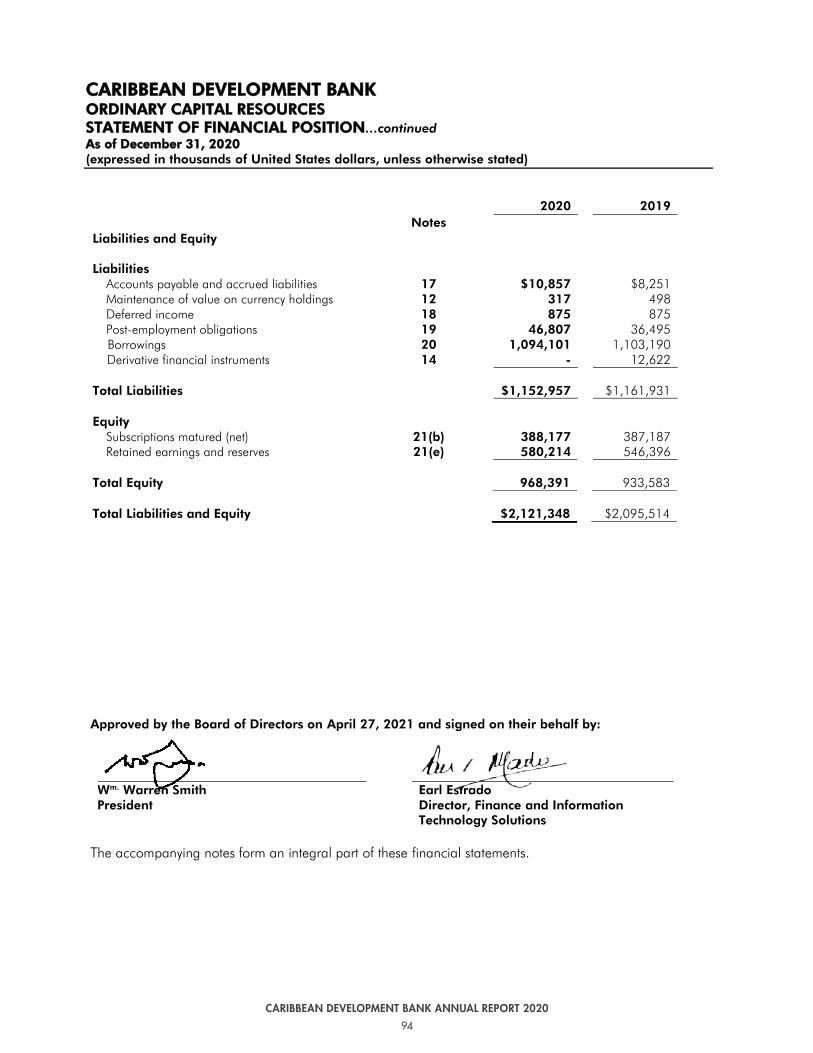
94
CARIBBEAN DEVELOPMENT BANK ANNUAL REPORT 2020
92 93
CARIBBEAN DEVELOPMENT BANK ANNUAL REPORT 2020 CARIBBEAN DEVELOPMENT BANK ANNUAL REPORT 2020
CCAARRIIBBBBEEAANN DDEEVVEELLOOPPMMEENNTT BBAANNKK OORRDDIINNAARRYY CCAAPPIITTAALL RREESSOOUURRCCEESS SSTTAATTEEMMEENNTT OOFF FFIINNAANNCCIIAALL PPOOSSIITTIIOONN…continued AAss ooff DDeecceemmbbeerr 3311,, 22002200 (expressed in thousands of United States dollars, unless otherwise stated)
- 7 -
Approved by the Board of Directors on XXXX XX, 2021 and signed on their behalf by: Wm. Warren Smith President
Earl Estrado Director, Finance and Information Technology Solutions
The accompanying notes form an integral part of these financial statements.
2020 2019 Notes
Liabilities and Equity
Liabilities Accounts payable and accrued liabilities 17 $10,857 $8,251 Maintenance of value on currency holdings 317 498 Deferred income 18 875 875 Post-employment obligations 19 46,807 36,495 Borrowings 20 1,094,101 1,103,190
Derivative financial instruments 14 - 12,622
Total Liabilities $1,152,957 $1,161,931
Equity Subscriptions matured (net) 21(b) 388,177 387,187 Retained earnings and reserves 21(e) 580,214 546,396
Total Equity 968,391 933,583
Total Liabilities and Equity $2,121,348 $2,095,514
CCAARRIIBBBBEEAANN DDEEVVEELLOOPPMMEENNTT BBAANNKK OORRDDIINNAARRYY CCAAPPIITTAALL RREESSOOUURRCCEESS SSTTAATTEEMMEENNTT OOFF CCHHAANNGGEESS IINN EEQQUUIITTYY FFoorr tthhee yyeeaarr eennddeedd DDeecceemmbbeerr 3311,, 22002200 (expressed in thousands of United States dollars, unless otherwise stated)
- 8 -
Post Employment
Capital Retained Obligations Fair value Other Stock Earnings Reserve Reserve Reserves Total
Notes Balance as of January 1, 2019 as previously reported
$386,199 $518,664 $(8,554) $(3,993) $6,254 $898,570 New capital subscriptions 21 (b) 988 - - - - 988 Net income for the year - $40,271 - - - 40,271 Other comprehensive gain/(loss) - - (11,894) 5,648 - (6,246) Balance as of December 31, 2019
$387,187
$558,935
$(20,448)
$1,655
$6,254
$933,583
Balance as of January 1, 2020
$387,187 $558,935 $(20,448) $1,655 $6,254 $933,583
New capital subscriptions 21 (b) 990 - - - - 990 Net income for the year - 36,093 - - - 36,093 Other comprehensive (loss)/gain
-
-
(9,071)
6,796
-
(2,275)
Balance as of December 31, 2020 $388,177 $595,028 $(29,519) $8,451 $6,254 $968,391 The accompanying notes form an integral part of these financial statements.
CCAARRIIBBBBEEAANN DDEEVVEELLOOPPMMEENNTT BBAANNKK OORRDDIINNAARRYY CCAAPPIITTAALL RREESSOOUURRCCEESS SSTTAATTEEMMEENNTT OOFF FFIINNAANNCCIIAALL PPOOSSIITTIIOONN…continued AAss ooff DDeecceemmbbeerr 3311,, 22002200 (expressed in thousands of United States dollars, unless otherwise stated)
- 7 -
Approved by the Board of Directors on April 27, 2021 and signed on their behalf by: Wm. Warren Smith President
Earl Estrado Director, Finance and Information Technology Solutions
The accompanying notes form an integral part of these financial statements.
2020 2019 Notes Liabilities and Equity Liabilities
Accounts payable and accrued liabilities 17 $10,857 $8,251 Maintenance of value on currency holdings 12 317 498 Deferred income 18 875 875 Post-employment obligations 19 46,807 36,495 Borrowings 20 1,094,101 1,103,190
Derivative financial instruments 14 - 12,622 Total Liabilities $1,152,957 $1,161,931 Equity
Subscriptions matured (net) 21(b) 388,177 387,187 Retained earnings and reserves 21(e) 580,214 546,396
Total Equity 968,391 933,583 Total Liabilities and Equity $2,121,348 $2,095,514
CCAARRIIBBBBEEAANN DDEEVVEELLOOPPMMEENNTT BBAANNKK OORRDDIINNAARRYY CCAAPPIITTAALL RREESSOOUURRCCEESS SSTTAATTEEMMEENNTT OOFF CCHHAANNGGEESS IINN EEQQUUIITTYY FFoorr tthhee yyeeaarr eennddeedd DDeecceemmbbeerr 3311,, 22002200 (expressed in thousands of United States dollars, unless otherwise stated)
- 8 -
Post Employment
Capital Retained Obligations Fair value Other Stock Earnings Reserve Reserve Reserves Total
Notes Balance as of January 1, 2019 as previously reported
$386,199 $518,664 $(8,554) $(3,993) $6,254 $898,570 New capital subscriptions 21 (b) 988 - - - - 988 Net income for the year - $40,271 - - - 40,271 Other comprehensive gain/(loss) - - (11,894) 5,648 - (6,246) Balance as of December 31, 2019
$387,187
$558,935
$(20,448)
$1,655
$6,254
$933,583
Balance as of January 1, 2020
$387,187 $558,935 $(20,448) $1,655 $6,254 $933,583
New capital subscriptions 21 (b) 990 - - - - 990 Net income for the year - 36,093 - - - 36,093 Other comprehensive (loss)/gain
-
-
(9,071)
6,796
-
(2,275)
Balance as of December 31, 2020 $388,177 $595,028 $(29,519) $8,451 $6,254 $968,391 The accompanying notes form an integral part of these financial statements.

95
CARIBBEAN DEVELOPMENT BANK ANNUAL REPORT 2020
92 93
CARIBBEAN DEVELOPMENT BANK ANNUAL REPORT 2020 CARIBBEAN DEVELOPMENT BANK ANNUAL REPORT 2020
CCAARRIIBBBBEEAANN DDEEVVEELLOOPPMMEENNTT BBAANNKK OORRDDIINNAARRYY CCAAPPIITTAALL RREESSOOUURRCCEESS SSTTAATTEEMMEENNTT OOFF FFIINNAANNCCIIAALL PPOOSSIITTIIOONN…continued AAss ooff DDeecceemmbbeerr 3311,, 22002200 (expressed in thousands of United States dollars, unless otherwise stated)
- 7 -
Approved by the Board of Directors on XXXX XX, 2021 and signed on their behalf by: Wm. Warren Smith President
Earl Estrado Director, Finance and Information Technology Solutions
The accompanying notes form an integral part of these financial statements.
2020 2019 Notes
Liabilities and Equity
Liabilities Accounts payable and accrued liabilities 17 $10,857 $8,251 Maintenance of value on currency holdings 317 498 Deferred income 18 875 875 Post-employment obligations 19 46,807 36,495 Borrowings 20 1,094,101 1,103,190
Derivative financial instruments 14 - 12,622
Total Liabilities $1,152,957 $1,161,931
Equity Subscriptions matured (net) 21(b) 388,177 387,187 Retained earnings and reserves 21(e) 580,214 546,396
Total Equity 968,391 933,583
Total Liabilities and Equity $2,121,348 $2,095,514
CCAARRIIBBBBEEAANN DDEEVVEELLOOPPMMEENNTT BBAANNKK OORRDDIINNAARRYY CCAAPPIITTAALL RREESSOOUURRCCEESS SSTTAATTEEMMEENNTT OOFF CCHHAANNGGEESS IINN EEQQUUIITTYY FFoorr tthhee yyeeaarr eennddeedd DDeecceemmbbeerr 3311,, 22002200 (expressed in thousands of United States dollars, unless otherwise stated)
- 8 -
Post Employment
Capital Retained Obligations Fair value Other Stock Earnings Reserve Reserve Reserves Total
Notes Balance as of January 1, 2019 as previously reported
$386,199 $518,664 $(8,554) $(3,993) $6,254 $898,570 New capital subscriptions 21 (b) 988 - - - - 988 Net income for the year - $40,271 - - - 40,271 Other comprehensive gain/(loss) - - (11,894) 5,648 - (6,246) Balance as of December 31, 2019
$387,187
$558,935
$(20,448)
$1,655
$6,254
$933,583
Balance as of January 1, 2020
$387,187 $558,935 $(20,448) $1,655 $6,254 $933,583
New capital subscriptions 21 (b) 990 - - - - 990 Net income for the year - 36,093 - - - 36,093 Other comprehensive (loss)/gain
-
-
(9,071)
6,796
-
(2,275)
Balance as of December 31, 2020 $388,177 $595,028 $(29,519) $8,451 $6,254 $968,391 The accompanying notes form an integral part of these financial statements.
CCAARRIIBBBBEEAANN DDEEVVEELLOOPPMMEENNTT BBAANNKK OORRDDIINNAARRYY CCAAPPIITTAALL RREESSOOUURRCCEESS SSTTAATTEEMMEENNTT OOFF FFIINNAANNCCIIAALL PPOOSSIITTIIOONN…continued AAss ooff DDeecceemmbbeerr 3311,, 22002200 (expressed in thousands of United States dollars, unless otherwise stated)
- 7 -
Approved by the Board of Directors on April 27, 2021 and signed on their behalf by: Wm. Warren Smith President
Earl Estrado Director, Finance and Information Technology Solutions
The accompanying notes form an integral part of these financial statements.
2020 2019 Notes Liabilities and Equity Liabilities
Accounts payable and accrued liabilities 17 $10,857 $8,251 Maintenance of value on currency holdings 12 317 498 Deferred income 18 875 875 Post-employment obligations 19 46,807 36,495 Borrowings 20 1,094,101 1,103,190
Derivative financial instruments 14 - 12,622 Total Liabilities $1,152,957 $1,161,931 Equity
Subscriptions matured (net) 21(b) 388,177 387,187 Retained earnings and reserves 21(e) 580,214 546,396
Total Equity 968,391 933,583 Total Liabilities and Equity $2,121,348 $2,095,514
CCAARRIIBBBBEEAANN DDEEVVEELLOOPPMMEENNTT BBAANNKK OORRDDIINNAARRYY CCAAPPIITTAALL RREESSOOUURRCCEESS SSTTAATTEEMMEENNTT OOFF CCHHAANNGGEESS IINN EEQQUUIITTYY FFoorr tthhee yyeeaarr eennddeedd DDeecceemmbbeerr 3311,, 22002200 (expressed in thousands of United States dollars, unless otherwise stated)
- 8 -
Post Employment
Capital Retained Obligations Fair value Other Stock Earnings Reserve Reserve Reserves Total
Notes Balance as of January 1, 2019 as previously reported
$386,199 $518,664 $(8,554) $(3,993) $6,254 $898,570 New capital subscriptions 21 (b) 988 - - - - 988 Net income for the year - $40,271 - - - 40,271 Other comprehensive gain/(loss) - - (11,894) 5,648 - (6,246) Balance as of December 31, 2019
$387,187
$558,935
$(20,448)
$1,655
$6,254
$933,583
Balance as of January 1, 2020
$387,187 $558,935 $(20,448) $1,655 $6,254 $933,583
New capital subscriptions 21 (b) 990 - - - - 990 Net income for the year - 36,093 - - - 36,093 Other comprehensive (loss)/gain
-
-
(9,071)
6,796
-
(2,275)
Balance as of December 31, 2020 $388,177 $595,028 $(29,519) $8,451 $6,254 $968,391 The accompanying notes form an integral part of these financial statements.

96
CARIBBEAN DEVELOPMENT BANK ANNUAL REPORT 2020
94 95
CARIBBEAN DEVELOPMENT BANK ANNUAL REPORT 2020 CARIBBEAN DEVELOPMENT BANK ANNUAL REPORT 2020
CCAARRIIBBBBEEAANN DDEEVVEELLOOPPMMEENNTT BBAANNKK OORRDDIINNAARRYY CCAAPPIITTAALL RREESSOOUURRCCEESS SSTTAATTEEMMEENNTT OOFF CCOOMMPPRREEHHEENNSSIIVVEE IINNCCOOMMEE FFoorr tthhee yyeeaarr eennddeedd DDeecceemmbbeerr 3311,, 22002200 (expressed in thousands of United States dollars, unless otherwise stated)
- 9 -
2020 2019 Notes
Interest and similar income 22 (a) $65,339 $66,927 Interest expense and similar charges 22 (b) (21,574) (26,958)
Net interest income 43,765 39,969
Other income 1,913 289
45,678 40,258
Operating expenses 23 (23,170) (18,820) Impairment recovery 24 7,011 3,142
Operating income before derivative and foreign denominated borrowing adjustments
29,519
24,580
Derivative fair value adjustment 26 47,633 20,654
Foreign exchange loss in translation 20 (b),
26 (41,059) (4,963)
Net income for the year 36,093 40,271 Other comprehensive (loss)/gain that will not be reclassified to the statement of comprehensive income
Re-measurements – Actuarial loss 19 (9,071) (11,894)
Other comprehensive gain/(loss) that will be reclassified to the statement of comprehensive income Fair value gain on debt securities at fair value through other comprehensive income 6,796 5,648
Total other comprehensive loss (2,275) (6,246)
Total comprehensive income for the year $33,818 $34,025
The accompanying notes form an integral part of these financial statements.
CCAARRIIBBBBEEAANN DDEEVVEELLOOPPMMEENNTT BBAANNKK OORRDDIINNAARRYY CCAAPPIITTAALL RREESSOOUURRCCEESS SSTTAATTEEMMEENNTT OOFF CCAASSHH FFLLOOWWSS FFoorr tthhee yyeeaarr eennddeedd DDeecceemmbbeerr 3311,, 22002200 (expressed in thousands of United States dollars, unless otherwise stated)
- 10 -
2020 2019 Operating activities: Notes Net income for the year $36,093 $40,271 Adjustments:
Depreciation 15 1,254 1,428 Impairment recovery on financial assets 24 (7,011) (3,142) Gain on sale of property and equipment - 2 Derivative fair value adjustment 26 (47,633) (20,654) Interest income 22 (a) (65,339) (66,927) Interest expense 22 (b) 21,574 26,958 Foreign exchange loss in translation 20 (b) 48,372 4,963 Decrease/(increase) in maintenance of value on currency Holdings 636 (127)
Total cash flows used in operating activities before
changes in operating assets and liabilities (12,054) (17,228)
Changes in operating assets and liabilities: Increase/(decrease) in receivables and prepaid assets (8,006) 3,159 Decrease in cash collateral on derivatives 2,400 7,350
Increase in accounts payable and accrued liabilities
2,606
1,760 Increase in post-employment obligations 1,241 852 Net Increase in debt securities at fair value through other comprehensive income (108,557) (84,652)
Cash used in operating activities
(122,370) (88,759)
Disbursements on loans 10 (195,881 (197,922) Principal repayments on loans 10 118,102 110,180 Interest received 65,710 65,415
Net cash used in operating activities
(134,439) (111,086)
Investing activities: Purchase of property and equipment 15 (2,363) (4,946)
Net cash used in investing activities (2,363) (4,946)
Financing activities: New borrowings 20 (b) 29,294 348,806 Repayments on borrowings 20 (b) (83,460) (45,412) Interest paid on borrowings (23,900) (27,435) New capital subscriptions 21 (b) 990 988 Decrease in receivables from members 17,182 4,394
Net cash (used in)/provided by financing activities (59,894) 281,341
Net (Decrease)/increase in cash and cash equivalents (196,696) 165,309 Cash and cash equivalents at beginning of year 292,045 126,736
Cash and cash equivalents at end of year $95,349 $292,045
The accompanying notes form an integral part of these financial statements.

97
CARIBBEAN DEVELOPMENT BANK ANNUAL REPORT 2020
94 95
CARIBBEAN DEVELOPMENT BANK ANNUAL REPORT 2020 CARIBBEAN DEVELOPMENT BANK ANNUAL REPORT 2020
CCAARRIIBBBBEEAANN DDEEVVEELLOOPPMMEENNTT BBAANNKK OORRDDIINNAARRYY CCAAPPIITTAALL RREESSOOUURRCCEESS SSTTAATTEEMMEENNTT OOFF CCOOMMPPRREEHHEENNSSIIVVEE IINNCCOOMMEE FFoorr tthhee yyeeaarr eennddeedd DDeecceemmbbeerr 3311,, 22002200 (expressed in thousands of United States dollars, unless otherwise stated)
- 9 -
2020 2019 Notes
Interest and similar income 22 (a) $65,339 $66,927 Interest expense and similar charges 22 (b) (21,574) (26,958)
Net interest income 43,765 39,969
Other income 1,913 289
45,678 40,258
Operating expenses 23 (23,170) (18,820) Impairment recovery 24 7,011 3,142
Operating income before derivative and foreign denominated borrowing adjustments
29,519
24,580
Derivative fair value adjustment 26 47,633 20,654
Foreign exchange loss in translation 20 (b),
26 (41,059) (4,963)
Net income for the year 36,093 40,271 Other comprehensive (loss)/gain that will not be reclassified to the statement of comprehensive income
Re-measurements – Actuarial loss 19 (9,071) (11,894)
Other comprehensive gain/(loss) that will be reclassified to the statement of comprehensive income Fair value gain on debt securities at fair value through other comprehensive income 6,796 5,648
Total other comprehensive loss (2,275) (6,246)
Total comprehensive income for the year $33,818 $34,025
The accompanying notes form an integral part of these financial statements.
CCAARRIIBBBBEEAANN DDEEVVEELLOOPPMMEENNTT BBAANNKK OORRDDIINNAARRYY CCAAPPIITTAALL RREESSOOUURRCCEESS SSTTAATTEEMMEENNTT OOFF CCAASSHH FFLLOOWWSS FFoorr tthhee yyeeaarr eennddeedd DDeecceemmbbeerr 3311,, 22002200 (expressed in thousands of United States dollars, unless otherwise stated)
- 10 -
2020 2019 Operating activities: Notes Net income for the year $36,093 $40,271 Adjustments:
Depreciation 15 1,254 1,428 Impairment recovery on financial assets 24 (7,011) (3,142) Gain on sale of property and equipment - 2 Derivative fair value adjustment 26 (47,633) (20,654) Interest income 22 (a) (65,339) (66,927) Interest expense 22 (b) 21,574 26,958 Foreign exchange loss in translation 20 (b) 48,372 4,963 Decrease/(increase) in maintenance of value on currency Holdings 636 (127)
Total cash flows used in operating activities before
changes in operating assets and liabilities (12,054) (17,228)
Changes in operating assets and liabilities: Increase/(decrease) in receivables and prepaid assets (8,006) 3,159 Decrease in cash collateral on derivatives 2,400 7,350
Increase in accounts payable and accrued liabilities
2,606
1,760 Increase in post-employment obligations 1,241 852 Net Increase in debt securities at fair value through other comprehensive income (108,557) (84,652)
Cash used in operating activities
(122,370) (88,759)
Disbursements on loans 10 (195,881 (197,922) Principal repayments on loans 10 118,102 110,180 Interest received 65,710 65,415
Net cash used in operating activities
(134,439) (111,086)
Investing activities: Purchase of property and equipment 15 (2,363) (4,946)
Net cash used in investing activities (2,363) (4,946)
Financing activities: New borrowings 20 (b) 29,294 348,806 Repayments on borrowings 20 (b) (83,460) (45,412) Interest paid on borrowings (23,900) (27,435) New capital subscriptions 21 (b) 990 988 Decrease in receivables from members 17,182 4,394
Net cash (used in)/provided by financing activities (59,894) 281,341
Net (Decrease)/increase in cash and cash equivalents (196,696) 165,309 Cash and cash equivalents at beginning of year 292,045 126,736
Cash and cash equivalents at end of year $95,349 $292,045
The accompanying notes form an integral part of these financial statements.

98
CARIBBEAN DEVELOPMENT BANK ANNUAL REPORT 2020
96 97
CARIBBEAN DEVELOPMENT BANK ANNUAL REPORT 2020 CARIBBEAN DEVELOPMENT BANK ANNUAL REPORT 2020
CCAARRIIBBBBEEAANN DDEEVVEELLOOPPMMEENNTT BBAANNKK OORRDDIINNAARRYY CCAAPPIITTAALL RREESSOOUURRCCEESS NNOOTTEESS TTOO TTHHEE FFIINNAANNCCIIAALL SSTTAATTEEMMEENNTTSS FFoorr tthhee yyeeaarr eennddeedd DDeecceemmbbeerr 3311,, 22002200 (expressed in thousands of United States dollars, unless otherwise stated)
- 11 -
NOTE 1 – NATURE OF OPERATIONS
Corporate structure The Caribbean Development Bank (“CDB” or “the Bank”) is an international organisation established by an Agreement (“Charter”) signed in Kingston, Jamaica, on October 18, 1969 and accepted and ratified by all the member countries which are signatories thereto. The Charter is an international treaty which, together with the instruments of ratification and accession by member countries, is deposited with the United Nations Secretary-General. The Charter entered into force on January 26, 1970 and CDB commenced operations on January 31, 1970. Since then other countries have become members of CDB by acceding to the Charter. The Bank’s headquarters is located in Wildey in the parish of Saint Michael in the island of Barbados.
Purpose and objectives CDB is a regional financial institution established for the purpose of contributing to the harmonious economic growth and development of the member countries in the Caribbean (“the Region”) and to promote economic cooperation and integration among them, with special and urgent regard to the needs of the less developed members.
Membership The membership of the Bank is open to: (a) States and Territories of the Region; (b) Non-Regional States which are members of the United Nations or any of its specialised Agencies; or of the
International Atomic Energy Agency. The Bank’s members are classified as either: -
• Borrowing member countries (“BMCs”) which comprise members of the Region that are qualified to borrow from the Bank.
• Non-regional members (“NRMs”) which comprise of members outside of the region that do not qualify to borrow from the Bank.
The BMCs are also shareholders of the Ordinary Capital Resources (“OCR”) of the Bank and are therefore considered related parties. The current membership of the Bank is comprised of twenty-three (23) regional states and territories and five (5) non-regional states (2019: 23 regional states and territories and 5 non-regional states). A detailed listing of the membership is provided at Note 21(c) - Equity. Reducing poverty in the region is CDB’s main objective and it finances development projects in its BMCs primarily through its OCR which comprises shareholders’ paid-in capital, retained earnings and reserves and borrowings. In advancing this objective, the Bank participates in the selection, study and preparation of projects contributing to poverty reduction and, where necessary, provides technical assistance and support. Special funds resourcesAttainment of the Bank’s objectives are also supplemented by the Special Development Fund (“SDF”) and Other Special Funds (“OSF”) which comprise its Special Fund Resources (“SFR”) with distinct assets and liabilities and which are subject to different operational, financial and other rules as set out by the contributors some of which are non-members of the Bank. The SFR is independently managed from, and has no recourse to, the OCR for obligations in respect of any of the liabilities of the SDF or OSF.
CCAARRIIBBBBEEAANN DDEEVVEELLOOPPMMEENNTT BBAANNKK OORRDDIINNAARRYY CCAAPPIITTAALL RREESSOOUURRCCEESS NNOOTTEESS TTOO TTHHEE FFIINNAANNCCIIAALL SSTTAATTEEMMEENNTTSS FFoorr tthhee yyeeaarr eennddeedd DDeecceemmbbeerr 3311,, 22002200 (expressed in thousands of United States dollars, unless otherwise stated)
- 12 -
NOTE 1 – NATURE OF OPERATIONS …continued
Mobilising financial resources is an integral part of CDB’s strategic and operational activities, where alone or jointly, it administers funds under agreements that are restricted to specific uses such as technical assistance, grants and regional programmes. These funds are provided by donors, including members, some of their agencies and other development institutions. NOTE 2 – ACCOUNTING POLICIES (GENERAL) Accounting policies which are specific in nature are included as part of the disclosures that are relevant to the particular item in these Notes to the financial statements. All policies have been consistently applied to the years presented, except where otherwise stated. Prior year comparatives have been adjusted or amended to conform with the presentation in the current year where applicable. The accounting policies that are of a general nature applied in the preparation of these financial statements are set out below: Foreign currency translation The functional and presentation currency of the Bank is the United States dollar (USD). Monetary assets and liabilities in currencies other than USD are translated at market rates of exchange prevailing at the reporting date. Non-monetary items measured at historical cost in currencies other than United States dollars are translated into USD using the prevailing exchange rates at the effective dates of the initial transactions.
Foreign currency transactions are initially translated into USD at applicable rates of exchange on the transaction dates. Any gains or losses arising as a result of differences in rates applied to income or expenses and to assets or liabilities are shown as an exchange gain or loss in the determination of net income for the year. Taxation Under the provisions of Article 55 of the Charter and the provisions of the Caribbean Development Bank Act, 1970-71 of Barbados, the Bank’s assets, property, income and its operations and transactions are exempt from all direct and indirect taxation and from all custom duties on goods imported for its official use. Basis of preparation Statement of compliance These financial statements are prepared in accordance with International Financial Reporting Standards (IFRS) under the historical cost basis, modified by the measurement of debt securities at fair value through other comprehensive income (FVOCI) (refer to Note 5) and derivative financial instruments (cross currency interest rate swaps and interest rate swaps) which are reflected at fair value. The financial statements are presented in United States dollars (USD) and all values are rounded to the nearest thousand, except where otherwise indicated.

99
CARIBBEAN DEVELOPMENT BANK ANNUAL REPORT 2020
96 97
CARIBBEAN DEVELOPMENT BANK ANNUAL REPORT 2020 CARIBBEAN DEVELOPMENT BANK ANNUAL REPORT 2020
CCAARRIIBBBBEEAANN DDEEVVEELLOOPPMMEENNTT BBAANNKK OORRDDIINNAARRYY CCAAPPIITTAALL RREESSOOUURRCCEESS NNOOTTEESS TTOO TTHHEE FFIINNAANNCCIIAALL SSTTAATTEEMMEENNTTSS FFoorr tthhee yyeeaarr eennddeedd DDeecceemmbbeerr 3311,, 22002200 (expressed in thousands of United States dollars, unless otherwise stated)
- 11 -
NOTE 1 – NATURE OF OPERATIONS
Corporate structure The Caribbean Development Bank (“CDB” or “the Bank”) is an international organisation established by an Agreement (“Charter”) signed in Kingston, Jamaica, on October 18, 1969 and accepted and ratified by all the member countries which are signatories thereto. The Charter is an international treaty which, together with the instruments of ratification and accession by member countries, is deposited with the United Nations Secretary-General. The Charter entered into force on January 26, 1970 and CDB commenced operations on January 31, 1970. Since then other countries have become members of CDB by acceding to the Charter. The Bank’s headquarters is located in Wildey in the parish of Saint Michael in the island of Barbados.
Purpose and objectives CDB is a regional financial institution established for the purpose of contributing to the harmonious economic growth and development of the member countries in the Caribbean (“the Region”) and to promote economic cooperation and integration among them, with special and urgent regard to the needs of the less developed members.
Membership The membership of the Bank is open to: (a) States and Territories of the Region; (b) Non-Regional States which are members of the United Nations or any of its specialised Agencies; or of the
International Atomic Energy Agency. The Bank’s members are classified as either: -
• Borrowing member countries (“BMCs”) which comprise members of the Region that are qualified to borrow from the Bank.
• Non-regional members (“NRMs”) which comprise of members outside of the region that do not qualify to borrow from the Bank.
The BMCs are also shareholders of the Ordinary Capital Resources (“OCR”) of the Bank and are therefore considered related parties. The current membership of the Bank is comprised of twenty-three (23) regional states and territories and five (5) non-regional states (2019: 23 regional states and territories and 5 non-regional states). A detailed listing of the membership is provided at Note 21(c) - Equity. Reducing poverty in the region is CDB’s main objective and it finances development projects in its BMCs primarily through its OCR which comprises shareholders’ paid-in capital, retained earnings and reserves and borrowings. In advancing this objective, the Bank participates in the selection, study and preparation of projects contributing to poverty reduction and, where necessary, provides technical assistance and support. Special funds resourcesAttainment of the Bank’s objectives are also supplemented by the Special Development Fund (“SDF”) and Other Special Funds (“OSF”) which comprise its Special Fund Resources (“SFR”) with distinct assets and liabilities and which are subject to different operational, financial and other rules as set out by the contributors some of which are non-members of the Bank. The SFR is independently managed from, and has no recourse to, the OCR for obligations in respect of any of the liabilities of the SDF or OSF.
CCAARRIIBBBBEEAANN DDEEVVEELLOOPPMMEENNTT BBAANNKK OORRDDIINNAARRYY CCAAPPIITTAALL RREESSOOUURRCCEESS NNOOTTEESS TTOO TTHHEE FFIINNAANNCCIIAALL SSTTAATTEEMMEENNTTSS FFoorr tthhee yyeeaarr eennddeedd DDeecceemmbbeerr 3311,, 22002200 (expressed in thousands of United States dollars, unless otherwise stated)
- 12 -
NOTE 1 – NATURE OF OPERATIONS …continued
Mobilising financial resources is an integral part of CDB’s strategic and operational activities, where alone or jointly, it administers funds under agreements that are restricted to specific uses such as technical assistance, grants and regional programmes. These funds are provided by donors, including members, some of their agencies and other development institutions. NOTE 2 – ACCOUNTING POLICIES (GENERAL) Accounting policies which are specific in nature are included as part of the disclosures that are relevant to the particular item in these Notes to the financial statements. All policies have been consistently applied to the years presented, except where otherwise stated. Prior year comparatives have been adjusted or amended to conform with the presentation in the current year where applicable. The accounting policies that are of a general nature applied in the preparation of these financial statements are set out below: Foreign currency translation The functional and presentation currency of the Bank is the United States dollar (USD). Monetary assets and liabilities in currencies other than USD are translated at market rates of exchange prevailing at the reporting date. Non-monetary items measured at historical cost in currencies other than United States dollars are translated into USD using the prevailing exchange rates at the effective dates of the initial transactions.
Foreign currency transactions are initially translated into USD at applicable rates of exchange on the transaction dates. Any gains or losses arising as a result of differences in rates applied to income or expenses and to assets or liabilities are shown as an exchange gain or loss in the determination of net income for the year. Taxation Under the provisions of Article 55 of the Charter and the provisions of the Caribbean Development Bank Act, 1970-71 of Barbados, the Bank’s assets, property, income and its operations and transactions are exempt from all direct and indirect taxation and from all custom duties on goods imported for its official use. Basis of preparation Statement of compliance These financial statements are prepared in accordance with International Financial Reporting Standards (IFRS) under the historical cost basis, modified by the measurement of debt securities at fair value through other comprehensive income (FVOCI) (refer to Note 5) and derivative financial instruments (cross currency interest rate swaps and interest rate swaps) which are reflected at fair value. The financial statements are presented in United States dollars (USD) and all values are rounded to the nearest thousand, except where otherwise indicated.

100
CARIBBEAN DEVELOPMENT BANK ANNUAL REPORT 2020
98 99
CARIBBEAN DEVELOPMENT BANK ANNUAL REPORT 2020 CARIBBEAN DEVELOPMENT BANK ANNUAL REPORT 2020
CCAARRIIBBBBEEAANN DDEEVVEELLOOPPMMEENNTT BBAANNKK OORRDDIINNAARRYY CCAAPPIITTAALL RREESSOOUURRCCEESS NNOOTTEESS TTOO TTHHEE FFIINNAANNCCIIAALL SSTTAATTEEMMEENNTTSS FFoorr tthhee yyeeaarr eennddeedd DDeecceemmbbeerr 3311,, 22002200 (expressed in thousands of United States dollars, unless otherwise stated)
- 13 -
NOTE 2 – ACCOUNTING POLICIES (GENERAL)…continued Basis of preparation…continued Content of financial statements The financial statements comprise the statement of financial position, the statement of comprehensive income, the statement of changes in equity, the statement of cash flows and the notes to the financial statements for the year ended December 31, 2020 (the reporting date). Presentation of financial statements The presentation format of the Bank’s statement of comprehensive income reflects the Operating Income from the Bank’s core activities. In the opinion of management, this enhances the information to the users of the Bank’s financial statements, as Operating Income is the basis upon which the Bank’s financial, liquidity, capital adequacy, efficiency and other performance ratios and measures are determined. The Bank presents its statement of financial position in order of liquidity. An analysis regarding recovery or settlement within 12 months after the reporting date (current) and more than 12 months after the reporting date (non–current) is presented in Notes 6 – 20 as applicable. Financial assets and financial liabilities are generally reported gross in the statement of financial position. They are only offset and reported net when, in addition to having an unconditional legally enforceable right to offset the recognised amounts, the parties also intend to settle on a net basis in all of the following circumstances:
• The normal course of business • The event of default • The event of insolvency or bankruptcy of the Bank and/or its counterparties
Derivative assets and liabilities with master netting arrangements (e.g. ISDAs) are only presented net when they satisfy the eligibility of netting for all of the above criteria and not just in the event of default. Significant accounting judgements, estimates and assumptions The preparation of the Bank’s financial statements requires management to make judgements, estimates and assumptions that affect the reported amount of revenues, expenses, assets and liabilities, and the accompanying disclosures, as well as the disclosure of contingent liabilities. Uncertainty about these assumptions and estimates could result in outcomes that require a material adjustment to the carrying amount of assets or liabilities affected in future periods. In the process of applying the Bank’s accounting policies, management has made the following judgements and assumptions concerning the future and other key sources of estimation uncertainty at the reporting date, that have a significant risk of causing a material adjustment to the carrying amounts of assets and liabilities within the next financial year. Existing circumstances and assumptions about future developments may change due to circumstances beyond the Bank’s control and are reflected in the assumptions if and when they occur. Management’s judgment for certain items that are especially critical for the Bank’s results and financial situation due to their materiality is included in the relevant note disclosures in these financial statements, except as denoted on the following page:
CCAARRIIBBBBEEAANN DDEEVVEELLOOPPMMEENNTT BBAANNKK OORRDDIINNAARRYY CCAAPPIITTAALL RREESSOOUURRCCEESS NNOOTTEESS TTOO TTHHEE FFIINNAANNCCIIAALL SSTTAATTEEMMEENNTTSS FFoorr tthhee yyeeaarr eennddeedd DDeecceemmbbeerr 3311,, 22002200 (expressed in thousands of United States dollars, unless otherwise stated)
- 14 -
NOTE 2 – ACCOUNTING POLICIES (GENERAL)…continued
Significant accounting judgements, estimates and assumptions…continued
Going concern The Bank’s management has made an assessment of its ability to continue as a going concern and is satisfied that it has the resources to continue its operations for the foreseeable future. The Bank also continues to have the full support of its Members through the provision of additional financial, technical, material and other assistance as well as guidance and support from the Board of Directors. In 2020, the World Health Organisation (WHO) declared COVID-19, an infectious disease caused by severe acute respiratory syndrome coronavirus, a pandemic. The impact of the pandemic and the steps taken to treat infection and to mitigate its spread have had significant negative economic and social consequences for the Bank’s BMCs. Consistent with its mandate, the Bank has taken various actions to assist its BMCs by including the provision of grants for personal protective equipment and other equipment and for technical assistance, both from its own resources and in conjunction with regional and international agencies including international financial institutions. The Bank has also made additional resources available from its concessionary window (Special Funds Resources) to qualifying BMCs, to address certain specific needs and has increased the volume of resources available for Policy Based Loans (PBLs) to deal with exogenous shocks such as natural disasters or COVID-19 or macro-economic issues. The Bank is also discussing with its BMCs the repurposing of existing loans and the application of undisbursed balances to appropriate COVID-19 related activities. The Bank will continue to monitor developments in its BMCs and to aggressively mobilise resources to enable it to assist its members in these challenging times. Neither the fair value of debt securities in the Bank portfolio, nor the Bank’s liquidity position has been adversely impacted by the pandemic. Management continues to monitor and assess the potential impact of current and projected economic conditions on all financial assets, and to exercise its judgement to determine and include reasonable estimates of these as needed in calculations of expected credit losses and assessments of consequential impacts on capital maintenance requirements. While there is continuing uncertainty over the duration and potential impact of the pandemic, given the increasing availability of vaccines and concerted efforts by member governments to contain the spread of the disease, management believes that there are no material uncertainties which may cast a significant doubt over the Bank’s ability to continue as a going concern and therefore the financial statements continue to be prepared on this basis.
New and amended standards and interpretations which are applicable to the Bank In these financial statements, the Bank has applied the following standards and amendments for the first time. The nature and effect of the changes as a result of adoption of this new accounting standard are described below. The new and amended standards and interpretations are effective for annual periods beginning on or after January 1, 2020, unless otherwise stated. The Bank has not early adopted any standards, interpretations or amendments that have been issued but are not yet effective. AAmmeennddmmeennttss ttoo IIFFRRSS 99,, IIAASS 3399 aanndd IIFFRRSS 77 In September 2019, the IASB issued amendments to IFRS 9 Financial Instruments, IAS 39 Financial Instruments: Recognition and Measurement and IFRS 7 Financial Instruments: Disclosures, which concludes phase one of its work to respond to the effects of Interbank Offered Rates (IBOR) reform on financial reporting. The amendments provide temporary reliefs which enable hedge accounting to continue during the period of uncertainty before the replacement of an existing interest rate benchmark with an alternative nearly risk-free interest rate (an RFR). The amendments also introduce specific disclosure requirements for hedging relationships to which the reliefs are applied.

101
CARIBBEAN DEVELOPMENT BANK ANNUAL REPORT 2020
98 99
CARIBBEAN DEVELOPMENT BANK ANNUAL REPORT 2020 CARIBBEAN DEVELOPMENT BANK ANNUAL REPORT 2020
CCAARRIIBBBBEEAANN DDEEVVEELLOOPPMMEENNTT BBAANNKK OORRDDIINNAARRYY CCAAPPIITTAALL RREESSOOUURRCCEESS NNOOTTEESS TTOO TTHHEE FFIINNAANNCCIIAALL SSTTAATTEEMMEENNTTSS FFoorr tthhee yyeeaarr eennddeedd DDeecceemmbbeerr 3311,, 22002200 (expressed in thousands of United States dollars, unless otherwise stated)
- 13 -
NOTE 2 – ACCOUNTING POLICIES (GENERAL)…continued Basis of preparation…continued Content of financial statements The financial statements comprise the statement of financial position, the statement of comprehensive income, the statement of changes in equity, the statement of cash flows and the notes to the financial statements for the year ended December 31, 2020 (the reporting date). Presentation of financial statements The presentation format of the Bank’s statement of comprehensive income reflects the Operating Income from the Bank’s core activities. In the opinion of management, this enhances the information to the users of the Bank’s financial statements, as Operating Income is the basis upon which the Bank’s financial, liquidity, capital adequacy, efficiency and other performance ratios and measures are determined. The Bank presents its statement of financial position in order of liquidity. An analysis regarding recovery or settlement within 12 months after the reporting date (current) and more than 12 months after the reporting date (non–current) is presented in Notes 6 – 20 as applicable. Financial assets and financial liabilities are generally reported gross in the statement of financial position. They are only offset and reported net when, in addition to having an unconditional legally enforceable right to offset the recognised amounts, the parties also intend to settle on a net basis in all of the following circumstances:
• The normal course of business • The event of default • The event of insolvency or bankruptcy of the Bank and/or its counterparties
Derivative assets and liabilities with master netting arrangements (e.g. ISDAs) are only presented net when they satisfy the eligibility of netting for all of the above criteria and not just in the event of default. Significant accounting judgements, estimates and assumptions The preparation of the Bank’s financial statements requires management to make judgements, estimates and assumptions that affect the reported amount of revenues, expenses, assets and liabilities, and the accompanying disclosures, as well as the disclosure of contingent liabilities. Uncertainty about these assumptions and estimates could result in outcomes that require a material adjustment to the carrying amount of assets or liabilities affected in future periods. In the process of applying the Bank’s accounting policies, management has made the following judgements and assumptions concerning the future and other key sources of estimation uncertainty at the reporting date, that have a significant risk of causing a material adjustment to the carrying amounts of assets and liabilities within the next financial year. Existing circumstances and assumptions about future developments may change due to circumstances beyond the Bank’s control and are reflected in the assumptions if and when they occur. Management’s judgment for certain items that are especially critical for the Bank’s results and financial situation due to their materiality is included in the relevant note disclosures in these financial statements, except as denoted on the following page:
CCAARRIIBBBBEEAANN DDEEVVEELLOOPPMMEENNTT BBAANNKK OORRDDIINNAARRYY CCAAPPIITTAALL RREESSOOUURRCCEESS NNOOTTEESS TTOO TTHHEE FFIINNAANNCCIIAALL SSTTAATTEEMMEENNTTSS FFoorr tthhee yyeeaarr eennddeedd DDeecceemmbbeerr 3311,, 22002200 (expressed in thousands of United States dollars, unless otherwise stated)
- 14 -
NOTE 2 – ACCOUNTING POLICIES (GENERAL)…continued
Significant accounting judgements, estimates and assumptions…continued
Going concern The Bank’s management has made an assessment of its ability to continue as a going concern and is satisfied that it has the resources to continue its operations for the foreseeable future. The Bank also continues to have the full support of its Members through the provision of additional financial, technical, material and other assistance as well as guidance and support from the Board of Directors. In 2020, the World Health Organisation (WHO) declared COVID-19, an infectious disease caused by severe acute respiratory syndrome coronavirus, a pandemic. The impact of the pandemic and the steps taken to treat infection and to mitigate its spread have had significant negative economic and social consequences for the Bank’s BMCs. Consistent with its mandate, the Bank has taken various actions to assist its BMCs by including the provision of grants for personal protective equipment and other equipment and for technical assistance, both from its own resources and in conjunction with regional and international agencies including international financial institutions. The Bank has also made additional resources available from its concessionary window (Special Funds Resources) to qualifying BMCs, to address certain specific needs and has increased the volume of resources available for Policy Based Loans (PBLs) to deal with exogenous shocks such as natural disasters or COVID-19 or macro-economic issues. The Bank is also discussing with its BMCs the repurposing of existing loans and the application of undisbursed balances to appropriate COVID-19 related activities. The Bank will continue to monitor developments in its BMCs and to aggressively mobilise resources to enable it to assist its members in these challenging times. Neither the fair value of debt securities in the Bank portfolio, nor the Bank’s liquidity position has been adversely impacted by the pandemic. Management continues to monitor and assess the potential impact of current and projected economic conditions on all financial assets, and to exercise its judgement to determine and include reasonable estimates of these as needed in calculations of expected credit losses and assessments of consequential impacts on capital maintenance requirements. While there is continuing uncertainty over the duration and potential impact of the pandemic, given the increasing availability of vaccines and concerted efforts by member governments to contain the spread of the disease, management believes that there are no material uncertainties which may cast a significant doubt over the Bank’s ability to continue as a going concern and therefore the financial statements continue to be prepared on this basis.
New and amended standards and interpretations which are applicable to the Bank In these financial statements, the Bank has applied the following standards and amendments for the first time. The nature and effect of the changes as a result of adoption of this new accounting standard are described below. The new and amended standards and interpretations are effective for annual periods beginning on or after January 1, 2020, unless otherwise stated. The Bank has not early adopted any standards, interpretations or amendments that have been issued but are not yet effective. AAmmeennddmmeennttss ttoo IIFFRRSS 99,, IIAASS 3399 aanndd IIFFRRSS 77 In September 2019, the IASB issued amendments to IFRS 9 Financial Instruments, IAS 39 Financial Instruments: Recognition and Measurement and IFRS 7 Financial Instruments: Disclosures, which concludes phase one of its work to respond to the effects of Interbank Offered Rates (IBOR) reform on financial reporting. The amendments provide temporary reliefs which enable hedge accounting to continue during the period of uncertainty before the replacement of an existing interest rate benchmark with an alternative nearly risk-free interest rate (an RFR). The amendments also introduce specific disclosure requirements for hedging relationships to which the reliefs are applied.

102
CARIBBEAN DEVELOPMENT BANK ANNUAL REPORT 2020100 101
CARIBBEAN DEVELOPMENT BANK ANNUAL REPORT 2020 CARIBBEAN DEVELOPMENT BANK ANNUAL REPORT 2020
CCAARRIIBBBBEEAANN DDEEVVEELLOOPPMMEENNTT BBAANNKK OORRDDIINNAARRYY CCAAPPIITTAALL RREESSOOUURRCCEESS NNOOTTEESS TTOO TTHHEE FFIINNAANNCCIIAALL SSTTAATTEEMMEENNTTSS FFoorr tthhee yyeeaarr eennddeedd DDeecceemmbbeerr 3311,, 22002200 (expressed in thousands of United States dollars, unless otherwise stated)
- 15 -
NOTE 2 – ACCOUNTING POLICIES (GENERAL)…continued New and amended standards and interpretations which are applicable to the Bank…continued AAmmeennddmmeennttss ttoo IIFFRRSS 99,, IIAASS 3399 aanndd IIFFRRSS 77…continued The amendments must be applied retrospectively. However, any hedge relationships that have previously been de-designated cannot be reinstated upon application, nor can any hedge relationships be designated with the benefit of hindsight. Early application is permitted and must be disclosed. This had no impact on the financial statements of the Bank. AAmmeennddmmeennttss ttoo IIAASS 11 aanndd IIAASS 88 In October 2018, the IASB issued amendments to IAS 1 Presentation of Financial Statements and IAS 8 Accounting Policies, Changes in Accounting Estimates and Errors to align the definition of ‘material’across the standards and to clarify certain aspects of the definition. The new definition states that, ’Information is material if omitting, misstating or obscuring it could reasonably be expected to influence decisions that the primary users of general-purpose financial statements make on the basis of those financial statements, which provide financial information about a specific reporting entity.’ EExxtteennssiioonn ooff tthhee tteemmppoorraarryy eexxeemmppttiioonn ffrroomm aappppllyyiinngg IIFFRRSS 99,, FFiinnaanncciiaall IInnssttrruummeennttss ((aammeennddmmeennttss ttoo IIFFRRSS 44,, IInnssuurraannccee CCoonnttrraaccttss)) The amendments extend the expiry date of the temporary exemption from applying IFRS 9, Financial Instruments, from 1 January 2021 to 1 January 2023. The changes are to align the effective dates of IFRS 9 with IFRS 17, Insurance Contracts, for entities within the scope of the exemption. OOtthheerr ssttaannddaarrddss,, iinntteerrpprreettaattiioonnss aanndd aammeennddmmeennttss eeffffeeccttiivvee JJaannuuaarryy 11,, 22002200 The following are the amendments and interpretations which apply for the first time in 2020, but do not have an impact on the financial statements of the Bank.
• IFRIC Interpretation 23 – Uncertainty over Income Tax treatments • Amendments to IAS 28 – Long-term interests in Associates and Joint Ventures
CCAARRIIBBBBEEAANN DDEEVVEELLOOPPMMEENNTT BBAANNKK OORRDDIINNAARRYY CCAAPPIITTAALL RREESSOOUURRCCEESS NNOOTTEESS TTOO TTHHEE FFIINNAANNCCIIAALL SSTTAATTEEMMEENNTTSS FFoorr tthhee yyeeaarr eennddeedd DDeecceemmbbeerr 3311,, 22002200 (expressed in thousands of United States dollars, unless otherwise stated)
- 16 -
NOTE 2 – ACCOUNTING POLICIES (GENERAL)…continued
New and amended standards and interpretations which are applicable to the Bank)…continued • Annual IFRS Improvement Process:
o IFRS 3, Business combinations – previously held interest in a joint operation o IFRS 11, Joint arrangement – previously held interests in a joint operation o IAS 12, Income taxes - income tax consequences of payments on financial instruments
classified as equity o Amendments to IFRS 3 Definition of a business – January 1, 2020
TThhee CCoonncceeppttuuaall FFrraammeewwoorrkk ffoorr FFiinnaanncciiaall RReeppoorrttiinngg Effective for annual periods beginning on or after 1 January 2020. The revised Conceptual Framework for Financial Reporting (the Conceptual Framework) is not a standard, and none of the concepts override those in any standard or any requirements in a standard. The purpose of the Conceptual Framework is to assist the Board in developing standards, to help preparers develop consistent accounting policies if there is no applicable standard in place and to assist all parties to understand and interpret the standards. The Conceptual Framework includes some new concepts, provides updated definitions and recognition criteria for assets and liabilities and clarifies some important concepts. Standards in issue not yet effective which may be applicable to the Bank The following is a list of standards and interpretations issued that are applicable but not yet effective up to the date of the issuance of the Bank’s financial statements. The Bank intends to adopt these standards when they become effective. The impact of adoption depends on the assets held by the Bank at the date of adoption. AAmmeennddmmeennttss ttoo IIFFRRSS 1166 Effective for annual periods beginning on or after July 1, 2020. COVID-19-Related Rent Concessions: Amendment providing lessees with an exemption from assessing whether a COVID-19-related rent concession (a rent concession that reduces lease payments due on or before 30 June 2021) is a lease modification. IInntteerreesstt RRaattee BBeenncchhmmaarrkk RReeffoorrmm——PPhhaassee 22 ((AAmmeennddmmeennttss ttoo IIFFRRSS 99,, IIAASS 3399,, IIFFRRSS 77,, IIFFRRSS 44 aanndd IIFFRRSS 1166)) Effective for annual periods on or after 1 January 2021 The Phase 2 amendments apply only to changes required by the reform to financial instruments and hedging relationships. The amendments address the effects of the reform on a company’s financial statements that arise when, for example, an interest rate benchmark used to calculate interest on a financial asset is replaced with an alternative benchmark rate. AAmmeennddmmeennttss ttoo IIAASS 11 PPrreesseennttaattiioonn ooff FFiinnaanncciiaall SSttaatteemmeennttss Effective for annual periods beginning on or after January 1, 2022 Clarifies that the classification of liabilities as current or noncurrent is based solely on a company’s right to defer settlement at the reporting date. The right needs to be unconditional and must have substance. The amendments also clarify that the transfer of a company’s own equity instruments is regarded as settlement of a liability, unless it results from the exercise of a conversion option meeting the definition of an equity instrument.
CCAARRIIBBBBEEAANN DDEEVVEELLOOPPMMEENNTT BBAANNKK OORRDDIINNAARRYY CCAAPPIITTAALL RREESSOOUURRCCEESS NNOOTTEESS TTOO TTHHEE FFIINNAANNCCIIAALL SSTTAATTEEMMEENNTTSS FFoorr tthhee yyeeaarr eennddeedd DDeecceemmbbeerr 3311,, 22002200 (expressed in thousands of United States dollars, unless otherwise stated)
- 15 -
NOTE 2 – ACCOUNTING POLICIES (GENERAL)…continued New and amended standards and interpretations which are applicable to the Bank…continued AAmmeennddmmeennttss ttoo IIFFRRSS 99,, IIAASS 3399 aanndd IIFFRRSS 77…continued The amendments must be applied retrospectively. However, any hedge relationships that have previously been de-designated cannot be reinstated upon application, nor can any hedge relationships be designated with the benefit of hindsight. Early application is permitted and must be disclosed. This had no impact on the financial statements of the Bank. AAmmeennddmmeennttss ttoo IIAASS 11 aanndd IIAASS 88 In October 2018, the IASB issued amendments to IAS 1 Presentation of Financial Statements and IAS 8 Accounting Policies, Changes in Accounting Estimates and Errors to align the definition of ‘material’across the standards and to clarify certain aspects of the definition. The new definition states that, ’Information is material if omitting, misstating or obscuring it could reasonably be expected to influence decisions that the primary users of general-purpose financial statements make on the basis of those financial statements, which provide financial information about a specific reporting entity.’ EExxtteennssiioonn ooff tthhee tteemmppoorraarryy eexxeemmppttiioonn ffrroomm aappppllyyiinngg IIFFRRSS 99,, FFiinnaanncciiaall IInnssttrruummeennttss ((aammeennddmmeennttss ttoo IIFFRRSS 44,, IInnssuurraannccee CCoonnttrraaccttss)) The amendments extend the expiry date of the temporary exemption from applying IFRS 9, Financial Instruments, from January 1, 2021 - January 1, 2023. The changes are to align the effective dates of IFRS 9 with IFRS 17, Insurance Contracts, for entities within the scope of the exemption. This had no impact on the financial statements of the Bank. OOtthheerr ssttaannddaarrddss,, iinntteerrpprreettaattiioonnss aanndd aammeennddmmeennttss eeffffeeccttiivvee JJaannuuaarryy 11,, 22002200 The following are the amendments and interpretations which apply for the first time in 2020, but do not have an impact on the financial statements of the Bank.
• IFRIC Interpretation 23 – Uncertainty over Income Tax treatments • Amendments to IAS 28 – Long-term interests in Associates and Joint Ventures
CCAARRIIBBBBEEAANN DDEEVVEELLOOPPMMEENNTT BBAANNKK OORRDDIINNAARRYY CCAAPPIITTAALL RREESSOOUURRCCEESS NNOOTTEESS TTOO TTHHEE FFIINNAANNCCIIAALL SSTTAATTEEMMEENNTTSS FFoorr tthhee yyeeaarr eennddeedd DDeecceemmbbeerr 3311,, 22002200 (expressed in thousands of United States dollars, unless otherwise stated)
- 16 -
NOTE 2 – ACCOUNTING POLICIES (GENERAL)…continued
New and amended standards and interpretations which are applicable to the Bank)…continued • Annual IFRS Improvement Process:
o IFRS 3, Business combinations – previously held interest in a joint operation o IFRS 11, Joint arrangement – previously held interests in a joint operation o IAS 12, Income taxes - income tax consequences of payments on financial instruments
classified as equity o Amendments to IFRS 3 Definition of a business – January 1, 2020
TThhee CCoonncceeppttuuaall FFrraammeewwoorrkk ffoorr FFiinnaanncciiaall RReeppoorrttiinngg Effective for annual periods beginning on or after January 1, 2020. The revised Conceptual Framework for Financial Reporting (the Conceptual Framework) is not a standard, and none of the concepts override those in any standard or any requirements in a standard. The purpose of the Conceptual Framework is to assist the Board in developing standards, to help preparers develop consistent accounting policies if there is no applicable standard in place and to assist all parties to understand and interpret the standards. The Conceptual Framework includes some new concepts, provides updated definitions and recognition criteria for assets and liabilities and clarifies some important concepts. Standards in issue not yet effective which may be applicable to the Bank The following is a list of standards and interpretations issued that are applicable but not yet effective up to the date of the issuance of the Bank’s financial statements. The Bank intends to adopt these standards when they become effective. The impact of adoption depends on the assets held by the Bank at the date of adoption. AAmmeennddmmeennttss ttoo IIFFRRSS 1166 Effective for annual periods beginning on or after July 1, 2020. COVID-19-Related Rent Concessions: Amendment providing lessees with an exemption from assessing whether a COVID-19-related rent concession (a rent concession that reduces lease payments due on or before 30 June 2021) is a lease modification. IInntteerreesstt RRaattee BBeenncchhmmaarrkk RReeffoorrmm——PPhhaassee 22 ((AAmmeennddmmeennttss ttoo IIFFRRSS 99,, IIAASS 3399,, IIFFRRSS 77,, IIFFRRSS 44 aanndd IIFFRRSS 1166)) Effective for annual periods on or after January 1, 2021 The Phase 2 amendments apply only to changes required by the reform to financial instruments and hedging relationships. The amendments address the effects of the reform on a company’s financial statements that arise when, for example, an interest rate benchmark used to calculate interest on a financial asset is replaced with an alternative benchmark rate. AAmmeennddmmeennttss ttoo IIAASS 11 PPrreesseennttaattiioonn ooff FFiinnaanncciiaall SSttaatteemmeennttss Effective for annual periods beginning on or after January 1, 2022 Clarifies that the classification of liabilities as current or noncurrent is based solely on a company’s right to defer settlement at the reporting date. The right needs to be unconditional and must have substance. The amendments also clarify that the transfer of a company’s own equity instruments is regarded as settlement of a liability, unless it results from the exercise of a conversion option meeting the definition of an equity instrument.

103
CARIBBEAN DEVELOPMENT BANK ANNUAL REPORT 2020100 101
CARIBBEAN DEVELOPMENT BANK ANNUAL REPORT 2020 CARIBBEAN DEVELOPMENT BANK ANNUAL REPORT 2020
CCAARRIIBBBBEEAANN DDEEVVEELLOOPPMMEENNTT BBAANNKK OORRDDIINNAARRYY CCAAPPIITTAALL RREESSOOUURRCCEESS NNOOTTEESS TTOO TTHHEE FFIINNAANNCCIIAALL SSTTAATTEEMMEENNTTSS FFoorr tthhee yyeeaarr eennddeedd DDeecceemmbbeerr 3311,, 22002200 (expressed in thousands of United States dollars, unless otherwise stated)
- 15 -
NOTE 2 – ACCOUNTING POLICIES (GENERAL)…continued New and amended standards and interpretations which are applicable to the Bank…continued AAmmeennddmmeennttss ttoo IIFFRRSS 99,, IIAASS 3399 aanndd IIFFRRSS 77…continued The amendments must be applied retrospectively. However, any hedge relationships that have previously been de-designated cannot be reinstated upon application, nor can any hedge relationships be designated with the benefit of hindsight. Early application is permitted and must be disclosed. This had no impact on the financial statements of the Bank. AAmmeennddmmeennttss ttoo IIAASS 11 aanndd IIAASS 88 In October 2018, the IASB issued amendments to IAS 1 Presentation of Financial Statements and IAS 8 Accounting Policies, Changes in Accounting Estimates and Errors to align the definition of ‘material’across the standards and to clarify certain aspects of the definition. The new definition states that, ’Information is material if omitting, misstating or obscuring it could reasonably be expected to influence decisions that the primary users of general-purpose financial statements make on the basis of those financial statements, which provide financial information about a specific reporting entity.’ EExxtteennssiioonn ooff tthhee tteemmppoorraarryy eexxeemmppttiioonn ffrroomm aappppllyyiinngg IIFFRRSS 99,, FFiinnaanncciiaall IInnssttrruummeennttss ((aammeennddmmeennttss ttoo IIFFRRSS 44,, IInnssuurraannccee CCoonnttrraaccttss)) The amendments extend the expiry date of the temporary exemption from applying IFRS 9, Financial Instruments, from 1 January 2021 to 1 January 2023. The changes are to align the effective dates of IFRS 9 with IFRS 17, Insurance Contracts, for entities within the scope of the exemption. OOtthheerr ssttaannddaarrddss,, iinntteerrpprreettaattiioonnss aanndd aammeennddmmeennttss eeffffeeccttiivvee JJaannuuaarryy 11,, 22002200 The following are the amendments and interpretations which apply for the first time in 2020, but do not have an impact on the financial statements of the Bank.
• IFRIC Interpretation 23 – Uncertainty over Income Tax treatments • Amendments to IAS 28 – Long-term interests in Associates and Joint Ventures
CCAARRIIBBBBEEAANN DDEEVVEELLOOPPMMEENNTT BBAANNKK OORRDDIINNAARRYY CCAAPPIITTAALL RREESSOOUURRCCEESS NNOOTTEESS TTOO TTHHEE FFIINNAANNCCIIAALL SSTTAATTEEMMEENNTTSS FFoorr tthhee yyeeaarr eennddeedd DDeecceemmbbeerr 3311,, 22002200 (expressed in thousands of United States dollars, unless otherwise stated)
- 16 -
NOTE 2 – ACCOUNTING POLICIES (GENERAL)…continued
New and amended standards and interpretations which are applicable to the Bank)…continued • Annual IFRS Improvement Process:
o IFRS 3, Business combinations – previously held interest in a joint operation o IFRS 11, Joint arrangement – previously held interests in a joint operation o IAS 12, Income taxes - income tax consequences of payments on financial instruments
classified as equity o Amendments to IFRS 3 Definition of a business – January 1, 2020
TThhee CCoonncceeppttuuaall FFrraammeewwoorrkk ffoorr FFiinnaanncciiaall RReeppoorrttiinngg Effective for annual periods beginning on or after 1 January 2020. The revised Conceptual Framework for Financial Reporting (the Conceptual Framework) is not a standard, and none of the concepts override those in any standard or any requirements in a standard. The purpose of the Conceptual Framework is to assist the Board in developing standards, to help preparers develop consistent accounting policies if there is no applicable standard in place and to assist all parties to understand and interpret the standards. The Conceptual Framework includes some new concepts, provides updated definitions and recognition criteria for assets and liabilities and clarifies some important concepts. Standards in issue not yet effective which may be applicable to the Bank The following is a list of standards and interpretations issued that are applicable but not yet effective up to the date of the issuance of the Bank’s financial statements. The Bank intends to adopt these standards when they become effective. The impact of adoption depends on the assets held by the Bank at the date of adoption. AAmmeennddmmeennttss ttoo IIFFRRSS 1166 Effective for annual periods beginning on or after July 1, 2020. COVID-19-Related Rent Concessions: Amendment providing lessees with an exemption from assessing whether a COVID-19-related rent concession (a rent concession that reduces lease payments due on or before 30 June 2021) is a lease modification. IInntteerreesstt RRaattee BBeenncchhmmaarrkk RReeffoorrmm——PPhhaassee 22 ((AAmmeennddmmeennttss ttoo IIFFRRSS 99,, IIAASS 3399,, IIFFRRSS 77,, IIFFRRSS 44 aanndd IIFFRRSS 1166)) Effective for annual periods on or after 1 January 2021 The Phase 2 amendments apply only to changes required by the reform to financial instruments and hedging relationships. The amendments address the effects of the reform on a company’s financial statements that arise when, for example, an interest rate benchmark used to calculate interest on a financial asset is replaced with an alternative benchmark rate. AAmmeennddmmeennttss ttoo IIAASS 11 PPrreesseennttaattiioonn ooff FFiinnaanncciiaall SSttaatteemmeennttss Effective for annual periods beginning on or after January 1, 2022 Clarifies that the classification of liabilities as current or noncurrent is based solely on a company’s right to defer settlement at the reporting date. The right needs to be unconditional and must have substance. The amendments also clarify that the transfer of a company’s own equity instruments is regarded as settlement of a liability, unless it results from the exercise of a conversion option meeting the definition of an equity instrument.
CCAARRIIBBBBEEAANN DDEEVVEELLOOPPMMEENNTT BBAANNKK OORRDDIINNAARRYY CCAAPPIITTAALL RREESSOOUURRCCEESS NNOOTTEESS TTOO TTHHEE FFIINNAANNCCIIAALL SSTTAATTEEMMEENNTTSS FFoorr tthhee yyeeaarr eennddeedd DDeecceemmbbeerr 3311,, 22002200 (expressed in thousands of United States dollars, unless otherwise stated)
- 15 -
NOTE 2 – ACCOUNTING POLICIES (GENERAL)…continued New and amended standards and interpretations which are applicable to the Bank…continued AAmmeennddmmeennttss ttoo IIFFRRSS 99,, IIAASS 3399 aanndd IIFFRRSS 77…continued The amendments must be applied retrospectively. However, any hedge relationships that have previously been de-designated cannot be reinstated upon application, nor can any hedge relationships be designated with the benefit of hindsight. Early application is permitted and must be disclosed. This had no impact on the financial statements of the Bank. AAmmeennddmmeennttss ttoo IIAASS 11 aanndd IIAASS 88 In October 2018, the IASB issued amendments to IAS 1 Presentation of Financial Statements and IAS 8 Accounting Policies, Changes in Accounting Estimates and Errors to align the definition of ‘material’across the standards and to clarify certain aspects of the definition. The new definition states that, ’Information is material if omitting, misstating or obscuring it could reasonably be expected to influence decisions that the primary users of general-purpose financial statements make on the basis of those financial statements, which provide financial information about a specific reporting entity.’ EExxtteennssiioonn ooff tthhee tteemmppoorraarryy eexxeemmppttiioonn ffrroomm aappppllyyiinngg IIFFRRSS 99,, FFiinnaanncciiaall IInnssttrruummeennttss ((aammeennddmmeennttss ttoo IIFFRRSS 44,, IInnssuurraannccee CCoonnttrraaccttss)) The amendments extend the expiry date of the temporary exemption from applying IFRS 9, Financial Instruments, from January 1, 2021 - January 1, 2023. The changes are to align the effective dates of IFRS 9 with IFRS 17, Insurance Contracts, for entities within the scope of the exemption. This had no impact on the financial statements of the Bank. OOtthheerr ssttaannddaarrddss,, iinntteerrpprreettaattiioonnss aanndd aammeennddmmeennttss eeffffeeccttiivvee JJaannuuaarryy 11,, 22002200 The following are the amendments and interpretations which apply for the first time in 2020, but do not have an impact on the financial statements of the Bank.
• IFRIC Interpretation 23 – Uncertainty over Income Tax treatments • Amendments to IAS 28 – Long-term interests in Associates and Joint Ventures
CCAARRIIBBBBEEAANN DDEEVVEELLOOPPMMEENNTT BBAANNKK OORRDDIINNAARRYY CCAAPPIITTAALL RREESSOOUURRCCEESS NNOOTTEESS TTOO TTHHEE FFIINNAANNCCIIAALL SSTTAATTEEMMEENNTTSS FFoorr tthhee yyeeaarr eennddeedd DDeecceemmbbeerr 3311,, 22002200 (expressed in thousands of United States dollars, unless otherwise stated)
- 16 -
NOTE 2 – ACCOUNTING POLICIES (GENERAL)…continued
New and amended standards and interpretations which are applicable to the Bank)…continued • Annual IFRS Improvement Process:
o IFRS 3, Business combinations – previously held interest in a joint operation o IFRS 11, Joint arrangement – previously held interests in a joint operation o IAS 12, Income taxes - income tax consequences of payments on financial instruments
classified as equity o Amendments to IFRS 3 Definition of a business – January 1, 2020
TThhee CCoonncceeppttuuaall FFrraammeewwoorrkk ffoorr FFiinnaanncciiaall RReeppoorrttiinngg Effective for annual periods beginning on or after January 1, 2020. The revised Conceptual Framework for Financial Reporting (the Conceptual Framework) is not a standard, and none of the concepts override those in any standard or any requirements in a standard. The purpose of the Conceptual Framework is to assist the Board in developing standards, to help preparers develop consistent accounting policies if there is no applicable standard in place and to assist all parties to understand and interpret the standards. The Conceptual Framework includes some new concepts, provides updated definitions and recognition criteria for assets and liabilities and clarifies some important concepts. Standards in issue not yet effective which may be applicable to the Bank The following is a list of standards and interpretations issued that are applicable but not yet effective up to the date of the issuance of the Bank’s financial statements. The Bank intends to adopt these standards when they become effective. The impact of adoption depends on the assets held by the Bank at the date of adoption. AAmmeennddmmeennttss ttoo IIFFRRSS 1166 Effective for annual periods beginning on or after July 1, 2020. COVID-19-Related Rent Concessions: Amendment providing lessees with an exemption from assessing whether a COVID-19-related rent concession (a rent concession that reduces lease payments due on or before 30 June 2021) is a lease modification. IInntteerreesstt RRaattee BBeenncchhmmaarrkk RReeffoorrmm——PPhhaassee 22 ((AAmmeennddmmeennttss ttoo IIFFRRSS 99,, IIAASS 3399,, IIFFRRSS 77,, IIFFRRSS 44 aanndd IIFFRRSS 1166)) Effective for annual periods on or after January 1, 2021 The Phase 2 amendments apply only to changes required by the reform to financial instruments and hedging relationships. The amendments address the effects of the reform on a company’s financial statements that arise when, for example, an interest rate benchmark used to calculate interest on a financial asset is replaced with an alternative benchmark rate. AAmmeennddmmeennttss ttoo IIAASS 11 PPrreesseennttaattiioonn ooff FFiinnaanncciiaall SSttaatteemmeennttss Effective for annual periods beginning on or after January 1, 2022 Clarifies that the classification of liabilities as current or noncurrent is based solely on a company’s right to defer settlement at the reporting date. The right needs to be unconditional and must have substance. The amendments also clarify that the transfer of a company’s own equity instruments is regarded as settlement of a liability, unless it results from the exercise of a conversion option meeting the definition of an equity instrument.

104
CARIBBEAN DEVELOPMENT BANK ANNUAL REPORT 2020
102 103
CARIBBEAN DEVELOPMENT BANK ANNUAL REPORT 2020 CARIBBEAN DEVELOPMENT BANK ANNUAL REPORT 2020
CCAARRIIBBBBEEAANN DDEEVVEELLOOPPMMEENNTT BBAANNKK OORRDDIINNAARRYY CCAAPPIITTAALL RREESSOOUURRCCEESS NNOOTTEESS TTOO TTHHEE FFIINNAANNCCIIAALL SSTTAATTEEMMEENNTTSS FFoorr tthhee yyeeaarr eennddeedd DDeecceemmbbeerr 3311,, 22002200 (expressed in thousands of United States dollars, unless otherwise stated)
- 17 -
NOTE 2 – ACCOUNTING POLICIES (GENERAL)…continued Standards in issue not yet effective which may be applicable to the Bank…continued AAmmeennddmmeennttss ttoo IIAASS 3377 PPrroovviissiioonnss,, CCoonnttiinnggeenntt LLiiaabbiilliittiieess aanndd CCoonnttiinnggeenntt AAsssseettss Effective for annual periods beginning on or after January 1, 2022 Clarifies that when assessing if a contract is onerous, the cost of fulfilling the contract includes all costs that relate directly to the contract. AAmmeennddmmeennttss ttoo IIAASS 1166 PPrrooppeerrttyy,, PPllaanntt aanndd EEqquuiippmmeenntt Effective for annual periods beginning on or after January 1, 2022 OOtthheerr ssttaannddaarrddss,, iinntteerrpprreettaattiioonnss aanndd aammeennddmmeennttss nnoott yyeett eeffffeeccttiivvee wwhhiicchh mmaayy nnoott bbee aapppplliiccaabbllee ttoo tthhee BBaannkk IFRS 17 Insurance Contracts – January 1, 2021 Amendments to IFRS 3 Business Combinations – January 1, 2022Amendments to IFRS 10 and IAS 28 Sale or Contribution of Assets between an Investor and its Associate or Joint Venture – effective date deferred indefinitely Annual improvements to IFRS:
o IFRS 1 First-time Adoption of IFRS: simplify the application by a subsidiary o IFRS 9 Financial Instruments: clarify the test for derecognition of financial liabilities o Amendments to Illustrative Examples accompanying IFRS 16: clarification of lease incentives o IAS 41 Agriculture: remove the requirement to exclude cash flows for taxation in fair value
measurement.
CCAARRIIBBBBEEAANN DDEEVVEELLOOPPMMEENNTT BBAANNKK OORRDDIINNAARRYY CCAAPPIITTAALL RREESSOOUURRCCEESS NNOOTTEESS TTOO TTHHEE FFIINNAANNCCIIAALL SSTTAATTEEMMEENNTTSS FFoorr tthhee yyeeaarr eennddeedd DDeecceemmbbeerr 3311,, 22002200 (expressed in thousands of United States dollars, unless otherwise stated)
- 17 -
NOTE 3 – RISK MANAGEMENT The Bank’s principal financial liabilities, other than derivative financial instruments, comprise borrowings and accounts payable, the main purpose of which is to finance the Bank’s operations. The Bank also provides guarantees to its borrowers under set terms and conditions. The Bank’s principal financial assets are loans outstanding, receivables, cash and cash equivalents and debt securities at fair value through other comprehensive income that are all derived directly from its operations. The Bank also holds derivative contracts and enters into derivative transactions when deemed necessary by senior management. All derivative activities for risk management purposes are undertaken by senior management in accordance with the approved Board of Directors (BOD) policy which includes the provision that derivatives are held to maturity except under specific conditions and that no trading in derivatives for speculative purposes may be undertaken. The Bank’s BOD sets the governance framework for the Bank by setting the risk and risk appetite framework, and the underlying policies and procedures. Financial risk activities are governed by the policies and procedures and financial risks are identified, measured and managed in accordance with the Bank’s approved policies and risk objectives. The ability to manage these risks is supported by an enterprise wide risk management framework which was approved by the BOD. Operationally, CDB seeks to minimise its risks via the implementation of robust mitigating controls aimed at achieving adherence to approved risk appetite portfolio limits. The Bank’s risk mitigation approaches include adopting processes, systems, policies, guidelines and practices which are reviewed and modified periodically in line with the institution’s changing circumstances. The Bank’s Office of Risk Management (ORM) manages, coordinates, monitors and reports on the mitigation of all risks that the Bank faces such as strategic, financial, operational, and reputational risks. The ORM also has the responsibility for recommending and implementing new or amended policies and procedures for effective risk management to the BOD for approval and to ensure that risk awareness is embedded within the Bank’s operations and among the Bank’s employees. CDB’s risk management framework is built around its governance, policies and processes. The risk management governance structure supports the Bank’s senior management in their oversight function in the coordination of different aspects of risk management, and is built around the following committees: (i) The Enterprise Risk Committee (ERC) which is responsible for monitoring adherence to BOD approved
policies related to financial and other risks; (ii) The Loans Committee (LC) which reviews and recommends Loans, Grants and Technical Assistance (TA)
applications to the BOD for consideration; (iii) The Oversight and Assurance Committee (OAC) through which the ORM, the Office of Institutional
integrity, Compliance and Accountability (ICA), the Office of Independent Evaluation (OIE) and the Internal Audit Division (IAD) report to the BOD. ICA was established to operationalise the strategic framework for integrity, compliance and accountability. It is responsible for managing institutional integrity, compliance, anti-money laundering (AML), countering the financing of terrorism (CFT) and financial sanctions, ethics, whistleblowing, and project accountability;
(iv) The Advisory Management Team (AMT) which is the highest decision-making body of the Bank.
105
CARIBBEAN DEVELOPMENT BANK ANNUAL REPORT 2020
102 103
CARIBBEAN DEVELOPMENT BANK ANNUAL REPORT 2020 CARIBBEAN DEVELOPMENT BANK ANNUAL REPORT 2020
CCAARRIIBBBBEEAANN DDEEVVEELLOOPPMMEENNTT BBAANNKK OORRDDIINNAARRYY CCAAPPIITTAALL RREESSOOUURRCCEESS NNOOTTEESS TTOO TTHHEE FFIINNAANNCCIIAALL SSTTAATTEEMMEENNTTSS FFoorr tthhee yyeeaarr eennddeedd DDeecceemmbbeerr 3311,, 22002200 (expressed in thousands of United States dollars, unless otherwise stated)
- 17 -
NOTE 2 – ACCOUNTING POLICIES (GENERAL)…continued Standards in issue not yet effective which may be applicable to the Bank…continued AAmmeennddmmeennttss ttoo IIAASS 3377 PPrroovviissiioonnss,, CCoonnttiinnggeenntt LLiiaabbiilliittiieess aanndd CCoonnttiinnggeenntt AAsssseettss Effective for annual periods beginning on or after January 1, 2022 Clarifies that when assessing if a contract is onerous, the cost of fulfilling the contract includes all costs that relate directly to the contract. AAmmeennddmmeennttss ttoo IIAASS 1166 PPrrooppeerrttyy,, PPllaanntt aanndd EEqquuiippmmeenntt Effective for annual periods beginning on or after January 1, 2022 OOtthheerr ssttaannddaarrddss,, iinntteerrpprreettaattiioonnss aanndd aammeennddmmeennttss nnoott yyeett eeffffeeccttiivvee wwhhiicchh mmaayy nnoott bbee aapppplliiccaabbllee ttoo tthhee BBaannkk IFRS 17 Insurance Contracts – January 1, 2021 Amendments to IFRS 3 Business Combinations – January 1, 2022Amendments to IFRS 10 and IAS 28 Sale or Contribution of Assets between an Investor and its Associate or Joint Venture – effective date deferred indefinitely Annual improvements to IFRS:
o IFRS 1 First-time Adoption of IFRS: simplify the application by a subsidiary o IFRS 9 Financial Instruments: clarify the test for derecognition of financial liabilities o Amendments to Illustrative Examples accompanying IFRS 16: clarification of lease incentives o IAS 41 Agriculture: remove the requirement to exclude cash flows for taxation in fair value
measurement.
CCAARRIIBBBBEEAANN DDEEVVEELLOOPPMMEENNTT BBAANNKK OORRDDIINNAARRYY CCAAPPIITTAALL RREESSOOUURRCCEESS NNOOTTEESS TTOO TTHHEE FFIINNAANNCCIIAALL SSTTAATTEEMMEENNTTSS FFoorr tthhee yyeeaarr eennddeedd DDeecceemmbbeerr 3311,, 22002200 (expressed in thousands of United States dollars, unless otherwise stated)
- 17 -
NOTE 3 – RISK MANAGEMENT The Bank’s principal financial liabilities, other than derivative financial instruments, comprise borrowings and accounts payable, the main purpose of which is to finance the Bank’s operations. The Bank also provides guarantees to its borrowers under set terms and conditions. The Bank’s principal financial assets are loans outstanding, receivables, cash and cash equivalents and debt securities at fair value through other comprehensive income that are all derived directly from its operations. The Bank also holds derivative contracts and enters into derivative transactions when deemed necessary by senior management. All derivative activities for risk management purposes are undertaken by senior management in accordance with the approved Board of Directors (BOD) policy which includes the provision that derivatives are held to maturity except under specific conditions and that no trading in derivatives for speculative purposes may be undertaken. The Bank’s BOD sets the governance framework for the Bank by setting the risk and risk appetite framework, and the underlying policies and procedures. Financial risk activities are governed by the policies and procedures and financial risks are identified, measured and managed in accordance with the Bank’s approved policies and risk objectives. The ability to manage these risks is supported by an enterprise wide risk management framework which was approved by the BOD. Operationally, CDB seeks to minimise its risks via the implementation of robust mitigating controls aimed at achieving adherence to approved risk appetite portfolio limits. The Bank’s risk mitigation approaches include adopting processes, systems, policies, guidelines and practices which are reviewed and modified periodically in line with the institution’s changing circumstances. The Bank’s Office of Risk Management (ORM) manages, coordinates, monitors and reports on the mitigation of all risks that the Bank faces such as strategic, financial, operational, and reputational risks. The ORM also has the responsibility for recommending and implementing new or amended policies and procedures for effective risk management to the BOD for approval and to ensure that risk awareness is embedded within the Bank’s operations and among the Bank’s employees. CDB’s risk management framework is built around its governance, policies and processes. The risk management governance structure supports the Bank’s senior management in their oversight function in the coordination of different aspects of risk management, and is built around the following committees: (i) The Enterprise Risk Committee (ERC) which is responsible for monitoring adherence to BOD approved
policies related to financial and other risks; (ii) The Loans Committee (LC) which reviews and recommends Loans, Grants and Technical Assistance (TA)
applications to the BOD for consideration; (iii) The Oversight and Assurance Committee (OAC) through which the ORM, the Office of Institutional
integrity, Compliance and Accountability (ICA), the Office of Independent Evaluation (OIE) and the Internal Audit Division (IAD) report to the BOD. ICA was established to operationalise the strategic framework for integrity, compliance and accountability. It is responsible for managing institutional integrity, compliance, anti-money laundering (AML), countering the financing of terrorism (CFT) and financial sanctions, ethics, whistleblowing, and project accountability;
(iv) The Advisory Management Team (AMT) which is the highest decision-making body of the Bank.

106
CARIBBEAN DEVELOPMENT BANK ANNUAL REPORT 2020
104 105
CARIBBEAN DEVELOPMENT BANK ANNUAL REPORT 2020 CARIBBEAN DEVELOPMENT BANK ANNUAL REPORT 2020
CCAARRIIBBBBEEAANN DDEEVVEELLOOPPMMEENNTT BBAANNKK OORRDDIINNAARRYY CCAAPPIITTAALL RREESSOOUURRCCEESS NNOOTTEESS TTOO TTHHEE FFIINNAANNCCIIAALL SSTTAATTEEMMEENNTTSS FFoorr tthhee yyeeaarr eennddeedd DDeecceemmbbeerr 3311,, 22002200 (expressed in thousands of United States dollars, unless otherwise stated)
- 18 -
NOTE 3 – RISK MANAGEMENT…continued The Bank is exposed to credit risk, market risk (currency and interest rate risk), liquidity risk and operational risk. By its very nature the Bank is also subjected to concentration risk in relation to its BMCs. The Bank manages and controls concentration of credit risk through financial policies which limit the amount of exposure in relation to a single borrower and to groups of borrowers, by counterparties, credit ratings and by type of investments. Performance against these limits is measured and reported on a monthly and quarterly basis to the ERC. Credit risk Credit risk relates to potential losses in the event that a BMC is unable or unwilling to service its obligations to the Bank. CDB manages this risk through its financial policies and lending strategies, including the setting of individual country exposure limits and evaluation of overall creditworthiness. Individual BMC exposure to the Bank on outstanding loans as at December 31, 2020 is reported in Note 4 and Note 10. The Bank manages its credit risk related to liquid funds and derivative financial instruments by ensuring that all individual investments carry a minimum credit rating as follows:
Additionally, CDB can invest in non-freely convertible currencies in unconditional obligations issued or guaranteed by indigenous commercial banks provided that no such bank holds more than $1 million of the investible amount of the given currency or 10% of CDB’s capital, whichever is smaller. In relation to derivative transactions, all counterparties must have a minimum rating of BBB/Baa2 (by Standard & Poor’s and Moody’s respectively), with a minimum rating for new transactions of A-/ A3 (stable outlook) by Standard & Poor’s and Moody’s respectively. Credit risk measurement The Bank assesses borrowers based upon their external credit ratings. For borrowers without an external rating, judgment and benchmarking against similar credits are used to assign an appropriate internal rating. Borrowers are segmented into four rating classes. The rating scale, shown below, reflects the range of default probabilities defined for each rating class and related exposures can migrate between classes based on the results of the re-assessments of their probability of default. The internal rating scale and mapping of external ratings are as follows: CDB Grade Description of the grade CDB Rating
1 Basic monitoring AAA, AA, A Range 2 Standard monitoring BBB, BB, B Range 3 Special monitoring CCC to C Range 4 Sub-standard D Range
Standard & Poor's Moody's Investors Service Commercial bank obligations A- A3 Government obligations A- A3 Corporate obligations BBB+ Baa1
CCAARRIIBBBBEEAANN DDEEVVEELLOOPPMMEENNTT BBAANNKK OORRDDIINNAARRYY CCAAPPIITTAALL RREESSOOUURRCCEESS NNOOTTEESS TTOO TTHHEE FFIINNAANNCCIIAALL SSTTAATTEEMMEENNTTSS FFoorr tthhee yyeeaarr eennddeedd DDeecceemmbbeerr 3311,, 22002200 (expressed in thousands of United States dollars, unless otherwise stated)
- 19 -
NOTE 3 – RISK MANAGEMENT…continued Credit risk…continued The CDB ratings are aligned to a large extent with external ratings and mapped to corresponding proxy default rates. The observed defaults per rating category vary year on year, based on current and projected economic cycles. Risk limit control and mitigation measures Loans Currently the approved exposure limit to the single largest borrower is 40% of total outstanding loans or 50% of total available capital, whichever is greater. The limit for the three largest borrowers is 60% of total outstanding loans or 90% of total available capital whichever is greater. 2020 2019 Single largest borrower’s exposure to total outstanding loans 19.6% 20.9% Three largest borrowers’ exposure to total outstanding loans 37.5% 42.2% Three largest borrowers’ exposure to available capital 53.6% 59.7%
Cash and cash equivalents and Debt securities at FVOCI The Bank’s results as at December 31 against the BOD approved policy ratios were as follows:
Investment Type Maximum policy limit (based
upon total investment portfolio) 2020 2019
Single entity 10% 3.4% 6.6% US Treasury or US Government Agency 35% 30.8% 24.0%
Commercial entity 50% 27.5% 28.9% Credit related commitments Guarantees and standby letters of credit represent irrevocable assurances that the Bank will make payment. The primary purpose of these instruments is to ensure that funds are available to a borrower as required. The Bank currently has guarantees not exceeding the equivalent of $12 million (2019 - $12 million) with respect to bonds issued by the Government of St. Kitts and Nevis (GOSKN). These commitments expose the Bank to similar risks as loans outstanding and are mitigated by the same control processes and policies.

107
CARIBBEAN DEVELOPMENT BANK ANNUAL REPORT 2020
104 105
CARIBBEAN DEVELOPMENT BANK ANNUAL REPORT 2020 CARIBBEAN DEVELOPMENT BANK ANNUAL REPORT 2020
CCAARRIIBBBBEEAANN DDEEVVEELLOOPPMMEENNTT BBAANNKK OORRDDIINNAARRYY CCAAPPIITTAALL RREESSOOUURRCCEESS NNOOTTEESS TTOO TTHHEE FFIINNAANNCCIIAALL SSTTAATTEEMMEENNTTSS FFoorr tthhee yyeeaarr eennddeedd DDeecceemmbbeerr 3311,, 22002200 (expressed in thousands of United States dollars, unless otherwise stated)
- 18 -
NOTE 3 – RISK MANAGEMENT…continued The Bank is exposed to credit risk, market risk (currency and interest rate risk), liquidity risk and operational risk. By its very nature the Bank is also subjected to concentration risk in relation to its BMCs. The Bank manages and controls concentration of credit risk through financial policies which limit the amount of exposure in relation to a single borrower and to groups of borrowers, by counterparties, credit ratings and by type of investments. Performance against these limits is measured and reported on a monthly and quarterly basis to the ERC. Credit risk Credit risk relates to potential losses in the event that a BMC is unable or unwilling to service its obligations to the Bank. CDB manages this risk through its financial policies and lending strategies, including the setting of individual country exposure limits and evaluation of overall creditworthiness. Individual BMC exposure to the Bank on outstanding loans as at December 31, 2020 is reported in Note 4 and Note 10. The Bank manages its credit risk related to liquid funds and derivative financial instruments by ensuring that all individual investments carry a minimum credit rating as follows:
Additionally, CDB can invest in non-freely convertible currencies in unconditional obligations issued or guaranteed by indigenous commercial banks provided that no such bank holds more than $1 million of the investible amount of the given currency or 10% of CDB’s capital, whichever is smaller. In relation to derivative transactions, all counterparties must have a minimum rating of BBB/Baa2 (by Standard & Poor’s and Moody’s respectively), with a minimum rating for new transactions of A-/ A3 (stable outlook) by Standard & Poor’s and Moody’s respectively. Credit risk measurement The Bank assesses borrowers based upon their external credit ratings. For borrowers without an external rating, judgment and benchmarking against similar credits are used to assign an appropriate internal rating. Borrowers are segmented into four rating classes. The rating scale, shown below, reflects the range of default probabilities defined for each rating class and related exposures can migrate between classes based on the results of the re-assessments of their probability of default. The internal rating scale and mapping of external ratings are as follows: CDB Grade Description of the grade CDB Rating
1 Basic monitoring AAA, AA, A Range 2 Standard monitoring BBB, BB, B Range 3 Special monitoring CCC to C Range 4 Sub-standard D Range
Standard & Poor's Moody's Investors Service Commercial bank obligations A- A3 Government obligations A- A3 Corporate obligations BBB+ Baa1
CCAARRIIBBBBEEAANN DDEEVVEELLOOPPMMEENNTT BBAANNKK OORRDDIINNAARRYY CCAAPPIITTAALL RREESSOOUURRCCEESS NNOOTTEESS TTOO TTHHEE FFIINNAANNCCIIAALL SSTTAATTEEMMEENNTTSS FFoorr tthhee yyeeaarr eennddeedd DDeecceemmbbeerr 3311,, 22002200 (expressed in thousands of United States dollars, unless otherwise stated)
- 19 -
NOTE 3 – RISK MANAGEMENT…continued Credit risk…continued The CDB ratings are aligned to a large extent with external ratings and mapped to corresponding proxy default rates. The observed defaults per rating category vary year on year, based on current and projected economic cycles. Risk limit control and mitigation measures Loans Currently the approved exposure limit to the single largest borrower is 40% of total outstanding loans or 50% of total available capital, whichever is greater. The limit for the three largest borrowers is 60% of total outstanding loans or 90% of total available capital whichever is greater. 2020 2019 Single largest borrower’s exposure to total outstanding loans 19.6% 20.9% Three largest borrowers’ exposure to total outstanding loans 37.5% 42.2% Three largest borrowers’ exposure to available capital 53.6% 59.7%
Cash and cash equivalents and Debt securities at FVOCI The Bank’s results as at December 31 against the BOD approved policy ratios were as follows:
Investment Type Maximum policy limit (based
upon total investment portfolio) 2020 2019
Single entity 10% 3.4% 6.6% US Treasury or US Government Agency 35% 30.8% 24.0%
Commercial entity 50% 27.5% 28.9% Credit related commitments Guarantees and standby letters of credit represent irrevocable assurances that the Bank will make payment. The primary purpose of these instruments is to ensure that funds are available to a borrower as required. The Bank currently has guarantees not exceeding the equivalent of $12 million (2019 - $12 million) with respect to bonds issued by the Government of St. Kitts and Nevis (GOSKN). These commitments expose the Bank to similar risks as loans outstanding and are mitigated by the same control processes and policies.

108
CARIBBEAN DEVELOPMENT BANK ANNUAL REPORT 2020
106 107
CARIBBEAN DEVELOPMENT BANK ANNUAL REPORT 2020 CARIBBEAN DEVELOPMENT BANK ANNUAL REPORT 2020
CCAARRIIBBBBEEAANN DDEEVVEELLOOPPMMEENNTT BBAANNKK OORRDDIINNAARRYY CCAAPPIITTAALL RREESSOOUURRCCEESS NNOOTTEESS TTOO TTHHEE FFIINNAANNCCIIAALL SSTTAATTEEMMEENNTTSS FFoorr tthhee yyeeaarr eennddeedd DDeecceemmbbeerr 3311,, 22002200 (expressed in thousands of United States dollars, unless otherwise stated)
- 20 -
NOTE 3 – RISK MANAGEMENT…continued Credit risk…continued Master netting arrangements All of the Bank’s derivatives are executed under International Swap Dealers’ Association (ISDA) Master Agreements and the Schedule to the Master Agreement in order to limit exposure to credit risk through the provisions in these agreements for offsetting of amounts due to or by both counterparties. Under the provisions of these agreements both parties compute amounts owing to and by each other and the party with a net amount owing makes payment to the second party. The ISDA and related Schedule also make provision for the voluntary netting of currencies and transactions and for the computation methodology of and settlement of final net payment in the event of termination. CDB is currently party to five swaps with four counterparties. Maximum exposure to credit risk before collateral held or other credit enhancements The table below shows the maximum exposure to credit risk based on the Bank’s internal credit rating system and year-end stage classification. The amounts presented are the gross carrying amounts net of the allowance for expected credit loss (ECL). Details of the Bank’s internal grading system are explained in Note 3 (above) and policies about the calculation of the ECL allowance are disclosed in Note 5.
2020
Stage 1 Stage 2 Stage 3 Total
Cash and cash equivalents $95,349 $- $- $95,349 Debt securities fair value through OCI 537,986 - - 537,986 Sovereign loans outstanding 1,033,378 223,270 - 1,256,648 Non-sovereign loans outstanding 75,439 - - 75,439 Derivative financial instruments 94,288 - - 94,288 Non-negotiable demand notes 21,597 - - 21,597 Maintenance of value on currency holdings 3,572 - - 3,572 Subscriptions in arrears 2,943 - - 2,943 Receivables 12,677 - 661 13,338 $1,877,229 $223,270 $661 $2,101,160
Commitments
Undisbursed sovereign loan balances $469,647 $- $- $469,647 Undisbursed non-sovereign loan balances 5,540 - - 5,540 Commitments 15,000 - - 15,000 Guarantees 12,000 - - 12,000 $502,187 $- $- $502,187
$2,379,416 $223,270 $661 $2,603,347
CCAARRIIBBBBEEAANN DDEEVVEELLOOPPMMEENNTT BBAANNKK OORRDDIINNAARRYY CCAAPPIITTAALL RREESSOOUURRCCEESS NNOOTTEESS TTOO TTHHEE FFIINNAANNCCIIAALL SSTTAATTEEMMEENNTTSS FFoorr tthhee yyeeaarr eennddeedd DDeecceemmbbeerr 3311,, 22002200 (expressed in thousands of United States dollars, unless otherwise stated)
- 21 -
NOTE 3 – RISK MANAGEMENT…continued Credit risk…continued Maximum exposure to credit risk before collateral held or other credit enhancements…continued
2019
Stage 1 Stage 2 Stage 3 Total
Cash and cash equivalents $292,045 $- $- $292,045 Cash collateral on derivatives 2,400 -- - 2,400 Debt securities fair value through OCI 422,138 - - 422,138 Sovereign loans outstanding 829,571 315,898 38,343 1,183,812 Non-sovereign loans outstanding 65,506 - - 65,506 Derivative financial instruments 60,246 - - 60,246 Non-negotiable demand notes 35,179 1,016 2,317 38,512 Maintenance of value on currency holdings 4,389 - - 4,389 Subscriptions in arrears 1,936 - - 1,936 Receivables - 6,019 1,101 7,120 $1,713,410 $322,933 $41,761 $2,078,104
Commitments
Undisbursed sovereign loan balances $431,908 $- $- $431,908 Undisbursed non-sovereign loan balances 18,061 - - 18,061 Commitments 15,000 - - 15,000 Guarantees 12,000 - - 12,000 $476,969 $- $- $476,969 $2,190,379 $322,933 $41,761 $2,555,073
The above tables represent a worst-case scenario of credit risk exposure as at December 31, 2020 and 2019, without taking account of any collateral held or other credit enhancements attached. The Bank’s policy in relation to collateral is disclosed in Note 10 to these financial statements. As shown, the total gross maximum exposure from loans and commitments to the sovereign was 67.3% (2019: 63.2%), and to the non-sovereign was 3.1% (2019: 3.3%).

109
CARIBBEAN DEVELOPMENT BANK ANNUAL REPORT 2020
106 107
CARIBBEAN DEVELOPMENT BANK ANNUAL REPORT 2020 CARIBBEAN DEVELOPMENT BANK ANNUAL REPORT 2020
CCAARRIIBBBBEEAANN DDEEVVEELLOOPPMMEENNTT BBAANNKK OORRDDIINNAARRYY CCAAPPIITTAALL RREESSOOUURRCCEESS NNOOTTEESS TTOO TTHHEE FFIINNAANNCCIIAALL SSTTAATTEEMMEENNTTSS FFoorr tthhee yyeeaarr eennddeedd DDeecceemmbbeerr 3311,, 22002200 (expressed in thousands of United States dollars, unless otherwise stated)
- 20 -
NOTE 3 – RISK MANAGEMENT…continued Credit risk…continued Master netting arrangements All of the Bank’s derivatives are executed under International Swap Dealers’ Association (ISDA) Master Agreements and the Schedule to the Master Agreement in order to limit exposure to credit risk through the provisions in these agreements for offsetting of amounts due to or by both counterparties. Under the provisions of these agreements both parties compute amounts owing to and by each other and the party with a net amount owing makes payment to the second party. The ISDA and related Schedule also make provision for the voluntary netting of currencies and transactions and for the computation methodology of and settlement of final net payment in the event of termination. CDB is currently party to five swaps with four counterparties. Maximum exposure to credit risk before collateral held or other credit enhancements The table below shows the maximum exposure to credit risk based on the Bank’s internal credit rating system and year-end stage classification. The amounts presented are the gross carrying amounts net of the allowance for expected credit loss (ECL). Details of the Bank’s internal grading system are explained in Note 3 (above) and policies about the calculation of the ECL allowance are disclosed in Note 5.
2020
Stage 1 Stage 2 Stage 3 Total
Cash and cash equivalents $95,349 $- $- $95,349 Debt securities fair value through OCI 537,986 - - 537,986 Sovereign loans outstanding 1,033,378 223,270 - 1,256,648 Non-sovereign loans outstanding 75,439 - - 75,439 Derivative financial instruments 94,288 - - 94,288 Non-negotiable demand notes 21,597 - - 21,597 Maintenance of value on currency holdings 3,572 - - 3,572 Subscriptions in arrears 2,943 - - 2,943 Receivables 12,677 - 661 13,338 $1,877,229 $223,270 $661 $2,101,160
Commitments
Undisbursed sovereign loan balances $469,647 $- $- $469,647 Undisbursed non-sovereign loan balances 5,540 - - 5,540 Commitments 15,000 - - 15,000 Guarantees 12,000 - - 12,000 $502,187 $- $- $502,187
$2,379,416 $223,270 $661 $2,603,347
CCAARRIIBBBBEEAANN DDEEVVEELLOOPPMMEENNTT BBAANNKK OORRDDIINNAARRYY CCAAPPIITTAALL RREESSOOUURRCCEESS NNOOTTEESS TTOO TTHHEE FFIINNAANNCCIIAALL SSTTAATTEEMMEENNTTSS FFoorr tthhee yyeeaarr eennddeedd DDeecceemmbbeerr 3311,, 22002200 (expressed in thousands of United States dollars, unless otherwise stated)
- 21 -
NOTE 3 – RISK MANAGEMENT…continued Credit risk…continued Maximum exposure to credit risk before collateral held or other credit enhancements…continued
2019
Stage 1 Stage 2 Stage 3 Total
Cash and cash equivalents $292,045 $- $- $292,045 Cash collateral on derivatives 2,400 -- - 2,400 Debt securities fair value through OCI 422,138 - - 422,138 Sovereign loans outstanding 829,571 315,898 38,343 1,183,812 Non-sovereign loans outstanding 65,506 - - 65,506 Derivative financial instruments 60,246 - - 60,246 Non-negotiable demand notes 35,179 1,016 2,317 38,512 Maintenance of value on currency holdings 4,389 - - 4,389 Subscriptions in arrears 1,936 - - 1,936 Receivables - 6,019 1,101 7,120 $1,713,410 $322,933 $41,761 $2,078,104
Commitments
Undisbursed sovereign loan balances $431,908 $- $- $431,908 Undisbursed non-sovereign loan balances 18,061 - - 18,061 Commitments 15,000 - - 15,000 Guarantees 12,000 - - 12,000 $476,969 $- $- $476,969 $2,190,379 $322,933 $41,761 $2,555,073
The above tables represent a worst-case scenario of credit risk exposure as at December 31, 2020 and 2019, without taking account of any collateral held or other credit enhancements attached. The Bank’s policy in relation to collateral is disclosed in Note 10 to these financial statements. As shown, the total gross maximum exposure from loans and commitments to the sovereign was 67.3% (2019: 63.2%), and to the non-sovereign was 3.1% (2019: 3.3%).

110
CARIBBEAN DEVELOPMENT BANK ANNUAL REPORT 2020
108 109
CARIBBEAN DEVELOPMENT BANK ANNUAL REPORT 2020 CARIBBEAN DEVELOPMENT BANK ANNUAL REPORT 2020
CCAARRIIBBBBEEAANN DDEEVVEELLOOPPMMEENNTT BBAANNKK OORRDDIINNAARRYY CCAAPPIITTAALL RREESSOOUURRCCEESS NNOOTTEESS TTOO TTHHEE FFIINNAANNCCIIAALL SSTTAATTEEMMEENNTTSS FFoorr tthhee yyeeaarr eennddeedd DDeecceemmbbeerr 3311,, 22002200 (expressed in thousands of United States dollars, unless otherwise stated)
- 22 -
NOTE 3 – RISK MANAGEMENT…continued Credit quality Debt securities, treasury bills and other eligible bills The main investment management objectives are for capital preservation and liquidity. In accordance with these parameters, CDB seeks the highest possible return on its investments. CDB’s Investment Policy restricts its investments to government and government-related debt instruments, corporate bonds and time deposits. Investments may also be made in unconditional obligations issued or guaranteed by commercial banks rated A-/A3, or better, AAA rated asset-backed securities, and AAA-rated mortgage-backed securities. Adherence to the investment policy guidelines is monitored on a continuous basis by the ERC. The following tables present an analysis of the credit quality of debt securities, treasury bills and other eligible bills, neither past due nor impaired based on Standard & Poor’s rating or equivalent. As of December 31, 2020, the Bank’s debt securities were classified as fair value through other comprehensive income. These assets were individually assessed for ECL and were all classified as Stage 1 financial assets.
2020
AAA AA+ to
AA- A+ to A- BBB+ to
BBB- Total Obligations guaranteed by Governments1 $205,693 $25,191 $- $- $230,884 Time Deposits - 762 - - 762 Sovereign Bonds 16,291 26,749 34,141 - 77,181 Supranational Bonds2 76,410 3,023 - - 79,433 Corporate Bonds 13,384 32,420 98,634 5,288 149,726
$311,779 $88,145 $132,775 $5,288 $537,986
2019
AAA AA+ to
AA- A+ to A- BBB+ to
BBB- Total Obligations guaranteed by Governments3 $116,839 $49,227 $15,752 $- $181,818 Time Deposits - 760 - - 760 Sovereign Bonds 4,032 7,527 - - 11,559 Supranational Bonds4 105,154 6,022 - - 111,176 Corporate Bonds 2,130 65,582 41,434 7,679 116,825
$228,155 $129,118 $57,186 $7,679 $422,138
11 Freely convertible currencies in Government and Government-guaranteed obligations which are members of the G7 or EU and its agencies.
2 An international organization, or union, whereby member states transcend national boundaries or interests to share in the decision-making and vote on issues pertaining to the wider grouping.
33 Freely convertible currencies in Government and Government-guaranteed obligations which are members of the G7 or EU and its agencies.
4 An international organization, or union, whereby member states transcend national boundaries or interests to share in the decision-making and vote on issues pertaining to the wider grouping.
CCAARRIIBBBBEEAANN DDEEVVEELLOOPPMMEENNTT BBAANNKK OORRDDIINNAARRYY CCAAPPIITTAALL RREESSOOUURRCCEESS NNOOTTEESS TTOO TTHHEE FFIINNAANNCCIIAALL SSTTAATTEEMMEENNTTSS FFoorr tthhee yyeeaarr eennddeedd DDeecceemmbbeerr 3311,, 22002200 (expressed in thousands of United States dollars, unless otherwise stated)
- 23 -
NOTE 3 – RISK MANAGEMENT…continued
Credit risk…continued
Credit quality…continued In accordance with the Bank’s internal rating scale 100% (2019: 100%) of debt securities, treasury bills and other eligible bills are classified as ‘Basic monitoring’. Loans and advances As of December 31, 2020, loans that were classified as Stage 1 and Stage 2 represented 99.9% (2019: 96.7%) of gross loans outstanding. Loans are summarised as follows:
December 31, 2020
Sovereign Non-sovereign
Total
Stage 1 $1,034,322 $79,127 $1,113,449
Stage 2 224,057 - 224,057
Stage 3 - 1,627 1,627 Gross 1,258,379 80,754 1,339,133 Less: allowance for ECL (1,731) (5,315) (7,046)
Net $1,256,648 $75,439 $1,332,087
December 31, 2019
Sovereign Non-sovereign
Total
Stage 1 $831,176 $72,402 $903,578
Stage 2 317,075 - 317,075
Stage 3 38,572 3,013 41,585 Gross 1,186,823 75,415 1,262,238 Less: allowance for ECL (3,011) (9,909) (12,920)
Net $1,183,812 $65,506 $1,249,318

111
CARIBBEAN DEVELOPMENT BANK ANNUAL REPORT 2020
108 109
CARIBBEAN DEVELOPMENT BANK ANNUAL REPORT 2020 CARIBBEAN DEVELOPMENT BANK ANNUAL REPORT 2020
CCAARRIIBBBBEEAANN DDEEVVEELLOOPPMMEENNTT BBAANNKK OORRDDIINNAARRYY CCAAPPIITTAALL RREESSOOUURRCCEESS NNOOTTEESS TTOO TTHHEE FFIINNAANNCCIIAALL SSTTAATTEEMMEENNTTSS FFoorr tthhee yyeeaarr eennddeedd DDeecceemmbbeerr 3311,, 22002200 (expressed in thousands of United States dollars, unless otherwise stated)
- 22 -
NOTE 3 – RISK MANAGEMENT…continued Credit quality Debt securities, treasury bills and other eligible bills The main investment management objectives are for capital preservation and liquidity. In accordance with these parameters, CDB seeks the highest possible return on its investments. CDB’s Investment Policy restricts its investments to government and government-related debt instruments, corporate bonds and time deposits. Investments may also be made in unconditional obligations issued or guaranteed by commercial banks rated A-/A3, or better, AAA rated asset-backed securities, and AAA-rated mortgage-backed securities. Adherence to the investment policy guidelines is monitored on a continuous basis by the ERC. The following tables present an analysis of the credit quality of debt securities, treasury bills and other eligible bills, neither past due nor impaired based on Standard & Poor’s rating or equivalent. As of December 31, 2020, the Bank’s debt securities were classified as fair value through other comprehensive income. These assets were individually assessed for ECL and were all classified as Stage 1 financial assets.
2020
AAA AA+ to
AA- A+ to A- BBB+ to
BBB- Total Obligations guaranteed by Governments1 $205,693 $25,191 $- $- $230,884 Time Deposits - 762 - - 762 Sovereign Bonds 16,291 26,749 34,141 - 77,181 Supranational Bonds2 76,410 3,023 - - 79,433 Corporate Bonds 13,384 32,420 98,634 5,288 149,726
$311,779 $88,145 $132,775 $5,288 $537,986
2019
AAA AA+ to
AA- A+ to A- BBB+ to
BBB- Total Obligations guaranteed by Governments3 $116,839 $49,227 $15,752 $- $181,818 Time Deposits - 760 - - 760 Sovereign Bonds 4,032 7,527 - - 11,559 Supranational Bonds4 105,154 6,022 - - 111,176 Corporate Bonds 2,130 65,582 41,434 7,679 116,825
$228,155 $129,118 $57,186 $7,679 $422,138
11 Freely convertible currencies in Government and Government-guaranteed obligations which are members of the G7 or EU and its agencies.
2 An international organization, or union, whereby member states transcend national boundaries or interests to share in the decision-making and vote on issues pertaining to the wider grouping.
33 Freely convertible currencies in Government and Government-guaranteed obligations which are members of the G7 or EU and its agencies.
4 An international organization, or union, whereby member states transcend national boundaries or interests to share in the decision-making and vote on issues pertaining to the wider grouping.
CCAARRIIBBBBEEAANN DDEEVVEELLOOPPMMEENNTT BBAANNKK OORRDDIINNAARRYY CCAAPPIITTAALL RREESSOOUURRCCEESS NNOOTTEESS TTOO TTHHEE FFIINNAANNCCIIAALL SSTTAATTEEMMEENNTTSS FFoorr tthhee yyeeaarr eennddeedd DDeecceemmbbeerr 3311,, 22002200 (expressed in thousands of United States dollars, unless otherwise stated)
- 23 -
NOTE 3 – RISK MANAGEMENT…continued
Credit risk…continued
Credit quality…continued In accordance with the Bank’s internal rating scale 100% (2019: 100%) of debt securities, treasury bills and other eligible bills are classified as ‘Basic monitoring’. Loans and advances As of December 31, 2020, loans that were classified as Stage 1 and Stage 2 represented 99.9% (2019: 96.7%) of gross loans outstanding. Loans are summarised as follows:
December 31, 2020
Sovereign Non-sovereign
Total
Stage 1 $1,034,322 $79,127 $1,113,449
Stage 2 224,057 - 224,057
Stage 3 - 1,627 1,627 Gross 1,258,379 80,754 1,339,133 Less: allowance for ECL (1,731) (5,315) (7,046)
Net $1,256,648 $75,439 $1,332,087
December 31, 2019
Sovereign Non-sovereign
Total
Stage 1 $831,176 $72,402 $903,578
Stage 2 317,075 - 317,075
Stage 3 38,572 3,013 41,585 Gross 1,186,823 75,415 1,262,238 Less: allowance for ECL (3,011) (9,909) (12,920)
Net $1,183,812 $65,506 $1,249,318

112
CARIBBEAN DEVELOPMENT BANK ANNUAL REPORT 2020
110 111
CARIBBEAN DEVELOPMENT BANK ANNUAL REPORT 2020 CARIBBEAN DEVELOPMENT BANK ANNUAL REPORT 2020
CCAARRIIBBBBEEAANN DDEEVVEELLOOPPMMEENNTT BBAANNKK OORRDDIINNAARRYY CCAAPPIITTAALL RREESSOOUURRCCEESS NNOOTTEESS TTOO TTHHEE FFIINNAANNCCIIAALL SSTTAATTEEMMEENNTTSS FFoorr tthhee yyeeaarr eennddeedd DDeecceemmbbeerr 3311,, 22002200 (expressed in thousands of United States dollars, unless otherwise stated)
- 24 -
NOTE 3 – RISK MANAGEMENT…continued
Credit risk…continued
Credit quality…continued Loans and advances – Stage 1 and Stage 2 The credit quality of the loan portfolio classified as Stage 1 and Stage 2 was assessed by reference to the internal rating system adopted by the Bank.
2020
Sovereign Non-
Sovereign
Total Loans
Standard monitoring $615,452 $33,267 $648,719 Special monitoring 545,353 42,172 587,525 Sub-Standard 95,843 - 95,843
$1,256,648 $$75,439 $1,332,087
2019
Sovereign Non-
Sovereign
Total Loans
Standard monitoring $984,864 $46,486 $1,031,350 Special monitoring 163,387 25,916 189,303
$1,148,251 $72,402 $1,220,653
CCAARRIIBBBBEEAANN DDEEVVEELLOOPPMMEENNTT BBAANNKK OORRDDIINNAARRYY CCAAPPIITTAALL RREESSOOUURRCCEESS NNOOTTEESS TTOO TTHHEE FFIINNAANNCCIIAALL SSTTAATTEEMMEENNTTSS FFoorr tthhee yyeeaarr eennddeedd DDeecceemmbbeerr 3311,, 22002200 (expressed in thousands of United States dollars, unless otherwise stated)
- 25 -
NOTE 3 – RISK MANAGEMENT…continued
Credit risk…continued
Credit quality…continued
Other financial assets Other financial assets comprise amounts due from the Bank’s member countries, local institutions and staff.
Other financial assets carried at amortised cost and classified as Stage 1 and 2
2020
Basic Monitoring
Standard Monitoring
Special Monitoring
Sub- Standard
Total
Cash and cash equivalents $95,349 $- $- $- $95,349 Cash collateral on derivatives - - - - - Receivables - - 12,678 - 12,678 Non-negotiable demand notes 8 18,418 576 2,595 21,597 Maintenance of value on currency holdings 1,250 2,322 -
- 3,572
Subscriptions in arrears - 990 1,953 - 2,943
$96,607 $21,730 $15,207 $2,595 $136,139
2019 Basic
Monitoring Standard
Monitoring Special
Monitoring Sub-
Standard
Total
Cash and cash equivalents
$261,988
$20,858
$9,199
$-
$292,045 Cash collateral on derivatives 2,400 - - - 2,400 Receivables - 6,019 - - 6,019 Non-negotiable demand notes 7,875 30,000 637 - 38,512 Maintenance of value on currency holdings 1,250 3,139 -
- 4,389
Subscriptions in arrears - 1,936 - - 1,936
$273,513 $61,952 $9,836 $- $345,301 Other financial assets – Fair value through profit and loss
2020
Basic Monitoring
Standard Monitoring
Special Monitoring
Sub- Standard
Total
Derivative financial instruments 94,288 - - 94,288

113
CARIBBEAN DEVELOPMENT BANK ANNUAL REPORT 2020
110 111
CARIBBEAN DEVELOPMENT BANK ANNUAL REPORT 2020 CARIBBEAN DEVELOPMENT BANK ANNUAL REPORT 2020
CCAARRIIBBBBEEAANN DDEEVVEELLOOPPMMEENNTT BBAANNKK OORRDDIINNAARRYY CCAAPPIITTAALL RREESSOOUURRCCEESS NNOOTTEESS TTOO TTHHEE FFIINNAANNCCIIAALL SSTTAATTEEMMEENNTTSS FFoorr tthhee yyeeaarr eennddeedd DDeecceemmbbeerr 3311,, 22002200 (expressed in thousands of United States dollars, unless otherwise stated)
- 24 -
NOTE 3 – RISK MANAGEMENT…continued
Credit risk…continued
Credit quality…continued Loans and advances – Stage 1 and Stage 2 The credit quality of the loan portfolio classified as Stage 1 and Stage 2 was assessed by reference to the internal rating system adopted by the Bank.
2020
Sovereign Non-
Sovereign
Total Loans
Standard monitoring $615,452 $33,267 $648,719 Special monitoring 545,353 42,172 587,525 Sub-Standard 95,843 - 95,843
$1,256,648 $$75,439 $1,332,087
2019
Sovereign Non-
Sovereign
Total Loans
Standard monitoring $984,864 $46,486 $1,031,350 Special monitoring 163,387 25,916 189,303
$1,148,251 $72,402 $1,220,653
CCAARRIIBBBBEEAANN DDEEVVEELLOOPPMMEENNTT BBAANNKK OORRDDIINNAARRYY CCAAPPIITTAALL RREESSOOUURRCCEESS NNOOTTEESS TTOO TTHHEE FFIINNAANNCCIIAALL SSTTAATTEEMMEENNTTSS FFoorr tthhee yyeeaarr eennddeedd DDeecceemmbbeerr 3311,, 22002200 (expressed in thousands of United States dollars, unless otherwise stated)
- 25 -
NOTE 3 – RISK MANAGEMENT…continued
Credit risk…continued
Credit quality…continued
Other financial assets Other financial assets comprise amounts due from the Bank’s member countries, local institutions and staff.
Other financial assets carried at amortised cost and classified as Stage 1 and 2
2020
Basic Monitoring
Standard Monitoring
Special Monitoring
Sub- Standard
Total
Cash and cash equivalents $95,349 $- $- $- $95,349 Cash collateral on derivatives - - - - - Receivables - - 12,678 - 12,678 Non-negotiable demand notes 8 18,418 576 2,595 21,597 Maintenance of value on currency holdings 1,250 2,322 -
- 3,572
Subscriptions in arrears - 990 1,953 - 2,943
$96,607 $21,730 $15,207 $2,595 $136,139
2019 Basic
Monitoring Standard
Monitoring Special
Monitoring Sub-
Standard
Total
Cash and cash equivalents
$261,988
$20,858
$9,199
$-
$292,045 Cash collateral on derivatives 2,400 - - - 2,400 Receivables - 6,019 - - 6,019 Non-negotiable demand notes 7,875 30,000 637 - 38,512 Maintenance of value on currency holdings 1,250 3,139 -
- 4,389
Subscriptions in arrears - 1,936 - - 1,936
$273,513 $61,952 $9,836 $- $345,301 Other financial assets – Fair value through profit and loss
2020
Basic Monitoring
Standard Monitoring
Special Monitoring
Sub- Standard
Total
Derivative financial instruments 94,288 - - 94,288

114
CARIBBEAN DEVELOPMENT BANK ANNUAL REPORT 2020
112 113
CARIBBEAN DEVELOPMENT BANK ANNUAL REPORT 2020 CARIBBEAN DEVELOPMENT BANK ANNUAL REPORT 2020
CCAARRIIBBBBEEAANN DDEEVVEELLOOPPMMEENNTT BBAANNKK OORRDDIINNAARRYY CCAAPPIITTAALL RREESSOOUURRCCEESS NNOOTTEESS TTOO TTHHEE FFIINNAANNCCIIAALL SSTTAATTEEMMEENNTTSS FFoorr tthhee yyeeaarr eennddeedd DDeecceemmbbeerr 3311,, 22002200 (expressed in thousands of United States dollars, unless otherwise stated)
- 26 -
NOTE 3 – RISK MANAGEMENT…continued
Credit risk…continued
Credit quality…continued
Other financial assets…continued
Other financial assets – Fair value through profit and loss…continued
2019 Basic
Monitoring Standard
Monitoring Special
Monitoring Sub-
Standard
Total Derivative financial instruments 60,246 - - 60,246
Risk concentration of financial assets with exposure to credit risk
Concentrations of risk arise from financial instruments that have similar characteristics and are affected similarly by changes in economic or other conditions. The Bank manages risk concentration by counterparty and geography.
Geographical sectors The following table presents CDB’s main credit exposures at their gross amounts, net of impairment allowances, as categorised by BMC and non-regional members, USA, and other countries. For this table, the exposures are allocated to regions based on the country of domicile of the counterparties. A further analysis of the Bank’s exposure to loans by geographical region is provided at Note 10.
2020 Borrowing
Member Countries
Non-Regional Members
USA
Other
Total
Cash and cash equivalents $21,953 $9,579 $62,678 $1,139 $95,349 Debt securities at fair value through OCI - 97,792 301,163 139,031 537,986 Sovereign loans outstanding 1,256,648 - - - 1,256,648 Non-sovereign loans outstanding 75,439 - - - 75,439 Derivative financial instruments -- 49,404 40,220 4,664 94,288 Maintenance of value on currency holdings 735 2,837 - - 3,572 Non-negotiable demand notes 21,597 - - - 21,597 Subscriptions in arrears 2,943 - - - 2,943 Receivables 14,880 - - - 14,880
$1,394,195 $159,612 $404,061 $144,834 $2,102,702
CCAARRIIBBBBEEAANN DDEEVVEELLOOPPMMEENNTT BBAANNKK OORRDDIINNAARRYY CCAAPPIITTAALL RREESSOOUURRCCEESS NNOOTTEESS TTOO TTHHEE FFIINNAANNCCIIAALL SSTTAATTEEMMEENNTTSS FFoorr tthhee yyeeaarr eennddeedd DDeecceemmbbeerr 3311,, 22002200 (expressed in thousands of United States dollars, unless otherwise stated)
- 27 -
NOTE 3 – RISK MANAGEMENT…continued
Credit risk…continued
Risk concentration of financial assets with exposure to credit risk …continued
Geographical sectors…continued 2019
Borrowing Member
Countries
Non-Regional Members
USA
Other
Total
Cash and cash equivalents $30,155 $10,442 $251,754 ($306) $292,045 Cash collateral on derivatives - - - 2,400 2,400 Debt securities at fair value through OCI 11,935 148,082 232,491 29,630 422,138 Sovereign loans outstanding 1,183,812 - - - 1,183,812 Non-sovereign loans outstanding 65,506 - - - 65,506 Derivative financial instruments -- 29,406 30,840 - 60,246 Maintenance of value on currency holdings 742 3,647 - - 4,389 Non-negotiable demand notes 32,963 5,549 - - 38,512 Subscriptions in arrears 1,936 - - - 1,936 Receivables 7,120 - - - 7,120
$1,334,169 $197,126 $515,085 $31,724 $2,078,104
Market risk CDB takes on exposure to market risks, which is the risk that the fair value or future cash flows of a financial instrument will fluctuate because of changes in market prices. CDB is exposed to two types of market risk - foreign currency risk and interest rate risk. Financial instruments affected by market risk include loans, debt securities at fair value through OCI, borrowings and derivative financial instruments. Foreign currency risk Foreign currency risk is the risk that the fair value or future cash flows of a financial instrument will fluctuate because of changes in foreign exchange rates. The Bank manages foreign currency risk by ensuring that all loans by the Bank are made either from currencies available from members’ subscriptions or from currencies borrowed, and the principal amounts are repayable to the Bank in the currencies lent. It also manages this risk by entering into currency swaps where borrowing currencies are not denominated in USD. The following table summarises the exposure to foreign currency exchange rate risk. Included in the table are the financial instruments at carrying amounts, categorised by currency. Management has considered the impact of non-freely convertible currencies and the risk is minimal. All of the Bank’s loans are denominated in United States dollars.

115
CARIBBEAN DEVELOPMENT BANK ANNUAL REPORT 2020
112 113
CARIBBEAN DEVELOPMENT BANK ANNUAL REPORT 2020 CARIBBEAN DEVELOPMENT BANK ANNUAL REPORT 2020
CCAARRIIBBBBEEAANN DDEEVVEELLOOPPMMEENNTT BBAANNKK OORRDDIINNAARRYY CCAAPPIITTAALL RREESSOOUURRCCEESS NNOOTTEESS TTOO TTHHEE FFIINNAANNCCIIAALL SSTTAATTEEMMEENNTTSS FFoorr tthhee yyeeaarr eennddeedd DDeecceemmbbeerr 3311,, 22002200 (expressed in thousands of United States dollars, unless otherwise stated)
- 26 -
NOTE 3 – RISK MANAGEMENT…continued
Credit risk…continued
Credit quality…continued
Other financial assets…continued
Other financial assets – Fair value through profit and loss…continued
2019 Basic
Monitoring Standard
Monitoring Special
Monitoring Sub-
Standard
Total Derivative financial instruments 60,246 - - 60,246
Risk concentration of financial assets with exposure to credit risk
Concentrations of risk arise from financial instruments that have similar characteristics and are affected similarly by changes in economic or other conditions. The Bank manages risk concentration by counterparty and geography.
Geographical sectors The following table presents CDB’s main credit exposures at their gross amounts, net of impairment allowances, as categorised by BMC and non-regional members, USA, and other countries. For this table, the exposures are allocated to regions based on the country of domicile of the counterparties. A further analysis of the Bank’s exposure to loans by geographical region is provided at Note 10.
2020 Borrowing
Member Countries
Non-Regional Members
USA
Other
Total
Cash and cash equivalents $21,953 $9,579 $62,678 $1,139 $95,349 Debt securities at fair value through OCI - 97,792 301,163 139,031 537,986 Sovereign loans outstanding 1,256,648 - - - 1,256,648 Non-sovereign loans outstanding 75,439 - - - 75,439 Derivative financial instruments -- 49,404 40,220 4,664 94,288 Maintenance of value on currency holdings 735 2,837 - - 3,572 Non-negotiable demand notes 21,597 - - - 21,597 Subscriptions in arrears 2,943 - - - 2,943 Receivables 14,880 - - - 14,880
$1,394,195 $159,612 $404,061 $144,834 $2,102,702
CCAARRIIBBBBEEAANN DDEEVVEELLOOPPMMEENNTT BBAANNKK OORRDDIINNAARRYY CCAAPPIITTAALL RREESSOOUURRCCEESS NNOOTTEESS TTOO TTHHEE FFIINNAANNCCIIAALL SSTTAATTEEMMEENNTTSS FFoorr tthhee yyeeaarr eennddeedd DDeecceemmbbeerr 3311,, 22002200 (expressed in thousands of United States dollars, unless otherwise stated)
- 27 -
NOTE 3 – RISK MANAGEMENT…continued
Credit risk…continued
Risk concentration of financial assets with exposure to credit risk …continued
Geographical sectors…continued 2019
Borrowing Member
Countries
Non-Regional Members
USA
Other
Total
Cash and cash equivalents $30,155 $10,442 $251,754 ($306) $292,045 Cash collateral on derivatives - - - 2,400 2,400 Debt securities at fair value through OCI 11,935 148,082 232,491 29,630 422,138 Sovereign loans outstanding 1,183,812 - - - 1,183,812 Non-sovereign loans outstanding 65,506 - - - 65,506 Derivative financial instruments -- 29,406 30,840 - 60,246 Maintenance of value on currency holdings 742 3,647 - - 4,389 Non-negotiable demand notes 32,963 5,549 - - 38,512 Subscriptions in arrears 1,936 - - - 1,936 Receivables 7,120 - - - 7,120
$1,334,169 $197,126 $515,085 $31,724 $2,078,104
Market risk CDB takes on exposure to market risks, which is the risk that the fair value or future cash flows of a financial instrument will fluctuate because of changes in market prices. CDB is exposed to two types of market risk - foreign currency risk and interest rate risk. Financial instruments affected by market risk include loans, debt securities at fair value through OCI, borrowings and derivative financial instruments. Foreign currency risk Foreign currency risk is the risk that the fair value or future cash flows of a financial instrument will fluctuate because of changes in foreign exchange rates. The Bank manages foreign currency risk by ensuring that all loans by the Bank are made either from currencies available from members’ subscriptions or from currencies borrowed, and the principal amounts are repayable to the Bank in the currencies lent. It also manages this risk by entering into currency swaps where borrowing currencies are not denominated in USD. The following table summarises the exposure to foreign currency exchange rate risk. Included in the table are the financial instruments at carrying amounts, categorised by currency. Management has considered the impact of non-freely convertible currencies and the risk is minimal. All of the Bank’s loans are denominated in United States dollars.
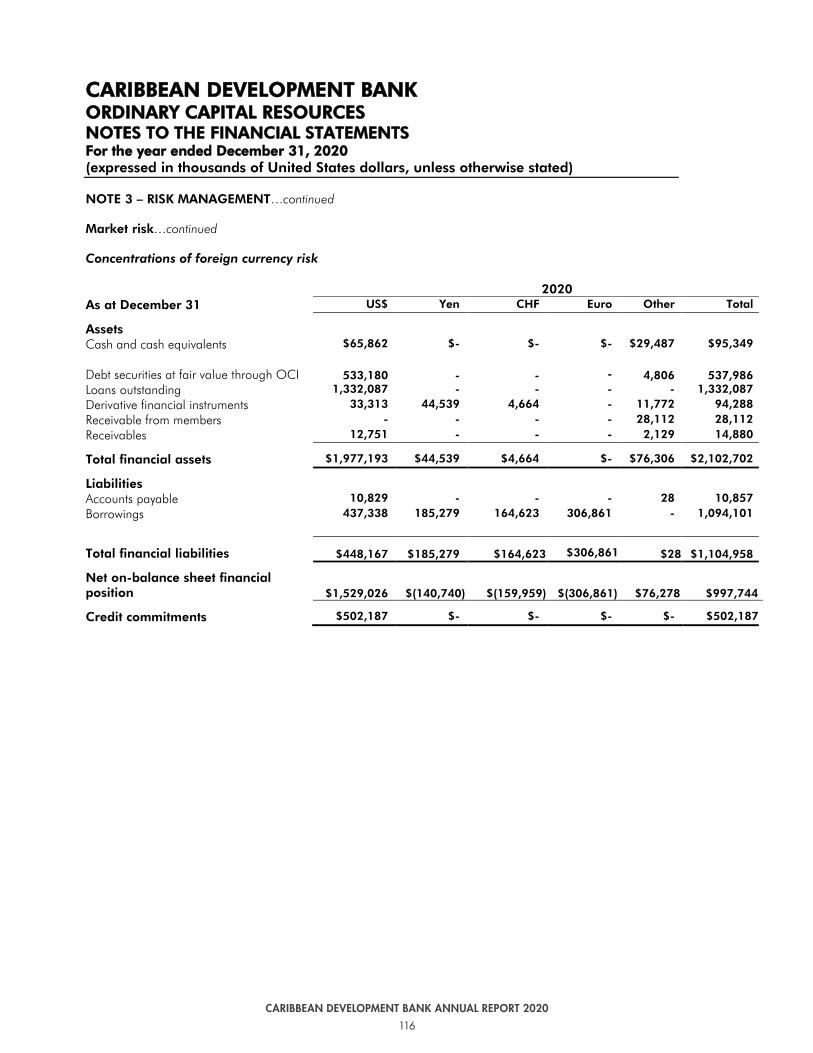
116
CARIBBEAN DEVELOPMENT BANK ANNUAL REPORT 2020
114 115
CARIBBEAN DEVELOPMENT BANK ANNUAL REPORT 2020 CARIBBEAN DEVELOPMENT BANK ANNUAL REPORT 2020
CCAARRIIBBBBEEAANN DDEEVVEELLOOPPMMEENNTT BBAANNKK OORRDDIINNAARRYY CCAAPPIITTAALL RREESSOOUURRCCEESS NNOOTTEESS TTOO TTHHEE FFIINNAANNCCIIAALL SSTTAATTEEMMEENNTTSS FFoorr tthhee yyeeaarr eennddeedd DDeecceemmbbeerr 3311,, 22002200 (expressed in thousands of United States dollars, unless otherwise stated)
- 28 -
NOTE 3 – RISK MANAGEMENT…continued
Market risk…continued
Concentrations of foreign currency risk
2020 As at December 31 US$ Yen CHF Euro Other Total
Assets Cash and cash equivalents $65,862 $- $- $- $29,487 $95,349 Debt securities at fair value through OCI 533,180 - - - 4,806 537,986 Loans outstanding 1,332,087 - - - - 1,332,087 Derivative financial instruments 33,313 44,539 4,664 - 11,772 94,288 Receivable from members - - - - 28,112 28,112 Receivables 12,751 - - - 2,129 14,880
Total financial assets $1,977,193 $44,539 $4,664 $- $76,306 $2,102,702
Liabilities Accounts payable 10,829 - - - 28 10,857 Borrowings 437,338 185,279 164,623 306,861 - 1,094,101
Total financial liabilities $448,167 $185,279 $164,623 $306,861 $28 $1,104,958
Net on-balance sheet financial position $1,529,026 $(140,740) $(159,959) $(306,861) $76,278
$997,744
Credit commitments $502,187 $- $- $- $- $502,187
CCAARRIIBBBBEEAANN DDEEVVEELLOOPPMMEENNTT BBAANNKK OORRDDIINNAARRYY CCAAPPIITTAALL RREESSOOUURRCCEESS NNOOTTEESS TTOO TTHHEE FFIINNAANNCCIIAALL SSTTAATTEEMMEENNTTSS FFoorr tthhee yyeeaarr eennddeedd DDeecceemmbbeerr 3311,, 22002200 (expressed in thousands of United States dollars, unless otherwise stated)
- 29 -
NOTE 3 – RISK MANAGEMENT…continued
Market risk…continued
Concentrations of foreign currency risk …continued
2019 As at December 31 US$ Yen CHF Euro Other Total
Assets Cash and cash equivalents $264,347 $- $- $- $27,698 $292,045 Cash collateral on derivatives 2,400 - - - - 2,400 Debt securities at fair value through OCI 417,709 - - - 4,429 422,138 Loans outstanding 1,249,318 - - - - 1,249,318 Derivative financial instruments 18,158 42,088 - - - 60,246 Receivable from members 26,184 - - - 18,653 44,837 Receivables 5,814 - - - 1,306 7,120
Total financial assets 1,983,930 42,088 - - 52,086 2,078,104
Liabilities Accounts payable 5,462 - - - (6) 5,456 Borrowings 495,264 177,019 150,166 280,741 - 1,103,190 Derivative financial instruments - - 12,622 - - 12,622
Total financial liabilities $500,726 $177,019 $162,788 $280,741 $(6) $1,121,268 Net on-balance sheet financial position $1,483,204 $(134,931) $(162,788)
$(280,741) $52,092 $956,836
Credit commitments $449,969 $- $- $- $- 449,969
Foreign currency sensitivity
In calculating these sensitivities management made the assumptions that the sensitivity of the relevant item within profit or loss is the effect of the assumed changes in respect of market risks based on the financial assets and liabilities at the reporting period. The Bank entered into currency swap agreements by which proceeds of two Yen, one Swiss Franc (CHF), and one Euro (EUR) denominated borrowing were converted into US dollars in order to hedge against ongoing operational currency and interest rate risks.

117
CARIBBEAN DEVELOPMENT BANK ANNUAL REPORT 2020
114 115
CARIBBEAN DEVELOPMENT BANK ANNUAL REPORT 2020 CARIBBEAN DEVELOPMENT BANK ANNUAL REPORT 2020
CCAARRIIBBBBEEAANN DDEEVVEELLOOPPMMEENNTT BBAANNKK OORRDDIINNAARRYY CCAAPPIITTAALL RREESSOOUURRCCEESS NNOOTTEESS TTOO TTHHEE FFIINNAANNCCIIAALL SSTTAATTEEMMEENNTTSS FFoorr tthhee yyeeaarr eennddeedd DDeecceemmbbeerr 3311,, 22002200 (expressed in thousands of United States dollars, unless otherwise stated)
- 28 -
NOTE 3 – RISK MANAGEMENT…continued
Market risk…continued
Concentrations of foreign currency risk
2020 As at December 31 US$ Yen CHF Euro Other Total
Assets Cash and cash equivalents $65,862 $- $- $- $29,487 $95,349 Debt securities at fair value through OCI 533,180 - - - 4,806 537,986 Loans outstanding 1,332,087 - - - - 1,332,087 Derivative financial instruments 33,313 44,539 4,664 - 11,772 94,288 Receivable from members - - - - 28,112 28,112 Receivables 12,751 - - - 2,129 14,880
Total financial assets $1,977,193 $44,539 $4,664 $- $76,306 $2,102,702
Liabilities Accounts payable 10,829 - - - 28 10,857 Borrowings 437,338 185,279 164,623 306,861 - 1,094,101
Total financial liabilities $448,167 $185,279 $164,623 $306,861 $28 $1,104,958
Net on-balance sheet financial position $1,529,026 $(140,740) $(159,959) $(306,861) $76,278
$997,744
Credit commitments $502,187 $- $- $- $- $502,187
CCAARRIIBBBBEEAANN DDEEVVEELLOOPPMMEENNTT BBAANNKK OORRDDIINNAARRYY CCAAPPIITTAALL RREESSOOUURRCCEESS NNOOTTEESS TTOO TTHHEE FFIINNAANNCCIIAALL SSTTAATTEEMMEENNTTSS FFoorr tthhee yyeeaarr eennddeedd DDeecceemmbbeerr 3311,, 22002200 (expressed in thousands of United States dollars, unless otherwise stated)
- 29 -
NOTE 3 – RISK MANAGEMENT…continued
Market risk…continued
Concentrations of foreign currency risk …continued
2019 As at December 31 US$ Yen CHF Euro Other Total
Assets Cash and cash equivalents $264,347 $- $- $- $27,698 $292,045 Cash collateral on derivatives 2,400 - - - - 2,400 Debt securities at fair value through OCI 417,709 - - - 4,429 422,138 Loans outstanding 1,249,318 - - - - 1,249,318 Derivative financial instruments 18,158 42,088 - - - 60,246 Receivable from members 26,184 - - - 18,653 44,837 Receivables 5,814 - - - 1,306 7,120
Total financial assets 1,983,930 42,088 - - 52,086 2,078,104
Liabilities Accounts payable 5,462 - - - (6) 5,456 Borrowings 495,264 177,019 150,166 280,741 - 1,103,190 Derivative financial instruments - - 12,622 - - 12,622
Total financial liabilities $500,726 $177,019 $162,788 $280,741 $(6) $1,121,268 Net on-balance sheet financial position $1,483,204 $(134,931) $(162,788)
$(280,741) $52,092 $956,836
Credit commitments $449,969 $- $- $- $- 449,969
Foreign currency sensitivity
In calculating these sensitivities management made the assumptions that the sensitivity of the relevant item within profit or loss is the effect of the assumed changes in respect of market risks based on the financial assets and liabilities at the reporting period. The Bank entered into currency swap agreements by which proceeds of two Yen, one Swiss Franc (CHF), and one Euro (EUR) denominated borrowing were converted into US dollars in order to hedge against ongoing operational currency and interest rate risks.

118
CARIBBEAN DEVELOPMENT BANK ANNUAL REPORT 2020
116 117
CARIBBEAN DEVELOPMENT BANK ANNUAL REPORT 2020 CARIBBEAN DEVELOPMENT BANK ANNUAL REPORT 2020
CCAARRIIBBBBEEAANN DDEEVVEELLOOPPMMEENNTT BBAANNKK OORRDDIINNAARRYY CCAAPPIITTAALL RREESSOOUURRCCEESS NNOOTTEESS TTOO TTHHEE FFIINNAANNCCIIAALL SSTTAATTEEMMEENNTTSS FFoorr tthhee yyeeaarr eennddeedd DDeecceemmbbeerr 3311,, 22002200 (expressed in thousands of United States dollars, unless otherwise stated)
- 30 -
NOTE 3 – RISK MANAGEMENT…continued
Market risk…continued Foreign currency sensitivity…continued The following is the estimated impact on profit or loss that would have resulted from management’s estimate of reasonable possible changes in the Yen and the CHF rates respectively:
YEN Effect on profit or loss (Income)/Expense
Exchange rate movements 2020 2019
Increase of 5%
$(13,994) $(8,327) Decrease of 5% $4,461 $9,203 Increase of 10% $(21,963) $(15,896) Decrease of 10% $15,227 $19,429
CHF Effect on profit or loss (Income)/Expense
Exchange rate movements 2020 2019
Increase of 5% $(2,611) $(7,151) Decrease of 5% $13,892 $7,903 Increase of 10% $(9,738) $(13,651) Decrease of 10% $23,520 $16,685 EURO Effect on profit or loss (Income)/Expense Exchange rate movements 2020 2019
Increase of 5% $(14,612) - Decrease of 5% $16,151 - Increase of 10% $(27,896) - Decrease of 10% $34,096 - The ‘Other’ currency category comprises various individual currencies which management does not consider to be material and therefore sensitivity analysis has not been applied.
Interest rate risk
Interest rate risk arises from the possibility that changes in interest rates will affect future cash flows on the fair value of financial instruments. CDB manages its interest rate exposure by ensuring that the changes in the cash flow of its assets closely match those of its liabilities. This relationship is maintained by the use of interest rate swaps which converts its liabilities from fixed rate into floating rate obligations where applicable.
CCAARRIIBBBBEEAANN DDEEVVEELLOOPPMMEENNTT BBAANNKK OORRDDIINNAARRYY CCAAPPIITTAALL RREESSOOUURRCCEESS NNOOTTEESS TTOO TTHHEE FFIINNAANNCCIIAALL SSTTAATTEEMMEENNTTSS FFoorr tthhee yyeeaarr eennddeedd DDeecceemmbbeerr 3311,, 22002200 (expressed in thousands of United States dollars, unless otherwise stated)
- 31 -
NOTE 3 – RISK MANAGEMENT…continued Market risk…continued Interest rate risk…continued The following table summarises the exposure to interest rate risks including financial instruments at carrying amounts, categorised by the earlier of contractual repricing or maturity dates. Exposure to interest rate risk
2020
At December 31 0-3
months 3-12
months 1-5 years Over 5
years
Non-interest generating/
bearing Total Assets Cash and cash equivalents $95,349 $- $- $- $- $95,349 Debt securities at fair value through OCI 42,632 43,657 230,075 221,622 - 537,986 Loans outstanding 1,332,087 - - - - 1,332,087 Derivative financial instruments 49,204 45,084 - - - 94,288 Receivable from members - - - - 28,112 28,112 Receivables - - - - 14,880 14,880
Total Assets $1,519,272 $88,741 $230,075 $221,622 $42,992 $2,102,702
Liabilities Accounts payable - - - - 6,970 6,970 Borrowings 4,315 12,946 431,638 645,202 - 1,094,101
Total Liabilities $4,315 $12,946 $431,638 $645,202 $6,970 $1,101,071
Total interest sensitivity Gap $1,514,957 $75,795 $(201,563) $(423,580)
CCAARRIIBBBBEEAANN DDEEVVEELLOOPPMMEENNTT BBAANNKK OORRDDIINNAARRYY CCAAPPIITTAALL RREESSOOUURRCCEESS NNOOTTEESS TTOO TTHHEE FFIINNAANNCCIIAALL SSTTAATTEEMMEENNTTSS FFoorr tthhee yyeeaarr eennddeedd DDeecceemmbbeerr 3311,, 22002200 (expressed in thousands of United States dollars, unless otherwise stated)
- 30 -
NOTE 3 – RISK MANAGEMENT…continued Market risk…continued Foreign currency sensitivity…continued The following is the estimated impact on profit or loss that would have resulted from management’s estimate of reasonable possible changes in the Yen and EUR and the CHF rates respectively: YEN Effect on profit or loss (Income)/Expense
Exchange rate movements 2020 2019
Increase of 5%
$(13,994) $(8,327) Decrease of 5% $4,461 $9,203 Increase of 10% $(21,963) $(15,896) Decrease of 10% $15,227 $19,429 CHF Effect on profit or loss (Income)/Expense
Exchange rate movements 2020 2019
Increase of 5% $(2,611) $(7,151) Decrease of 5% $13,892 $7,903 Increase of 10% $(9,738) $(13,651) Decrease of 10% $23,520 $16,685 EURO Effect on profit or loss (Income)/Expense Exchange rate movements 2020 2019 Increase of 5% $(14,612) - Decrease of 5% $16,151 - Increase of 10% $(27,896) - Decrease of 10% $34,096 - The ‘Other’ currency category comprises various individual currencies which management does not consider to be material and therefore sensitivity analysis has not been applied. Interest rate risk Interest rate risk arises from the possibility that changes in interest rates will affect future cash flows on the fair value of financial instruments. CDB manages its interest rate exposure by ensuring that the changes in the cash flow of its assets closely match those of its liabilities. This relationship is maintained by the use of interest rate swaps which converts its liabilities from fixed rate into floating rate obligations where applicable.
CCAARRIIBBBBEEAANN DDEEVVEELLOOPPMMEENNTT BBAANNKK OORRDDIINNAARRYY CCAAPPIITTAALL RREESSOOUURRCCEESS NNOOTTEESS TTOO TTHHEE FFIINNAANNCCIIAALL SSTTAATTEEMMEENNTTSS FFoorr tthhee yyeeaarr eennddeedd DDeecceemmbbeerr 3311,, 22002200 (expressed in thousands of United States dollars, unless otherwise stated)
- 31 -
NOTE 3 – RISK MANAGEMENT…continued Market risk…continued Interest rate risk…continued The following table summarises the exposure to interest rate risks including financial instruments at carrying amounts, categorised by the earlier of contractual repricing or maturity dates. Exposure to interest rate risk 2020
At December 31 0-3
months 3-12
months 1-5 years Over 5
years
Non-interest generating/
bearing Total Assets Cash and cash equivalents $95,349 $- $- $- $- $95,349 Debt securities at fair value through OCI 42,632 43,657 230,075 221,622 - 537,986 Loans outstanding 1,332,087 - - - - 1,332,087 Derivative financial instruments 49,204 45,084 - - - 94,288 Receivable from members - - - - 28,112 28,112 Receivables - - - - 14,880 14,880 Total Assets $1,519,272 $88,741 $230,075 $221,622 $42,992 $2,102,702 Liabilities Accounts payable - - - - 6,970 6,970 Borrowings 4,315 12,946 431,638 645,202 - 1,094,101 Total Liabilities $4,315 $12,946 $431,638 $645,202 $6,970 $1,101,071 Total interest sensitivity Gap $1,514,957 $75,795 $(201,563) $(423,580)

119
CARIBBEAN DEVELOPMENT BANK ANNUAL REPORT 2020
116 117
CARIBBEAN DEVELOPMENT BANK ANNUAL REPORT 2020 CARIBBEAN DEVELOPMENT BANK ANNUAL REPORT 2020
CCAARRIIBBBBEEAANN DDEEVVEELLOOPPMMEENNTT BBAANNKK OORRDDIINNAARRYY CCAAPPIITTAALL RREESSOOUURRCCEESS NNOOTTEESS TTOO TTHHEE FFIINNAANNCCIIAALL SSTTAATTEEMMEENNTTSS FFoorr tthhee yyeeaarr eennddeedd DDeecceemmbbeerr 3311,, 22002200 (expressed in thousands of United States dollars, unless otherwise stated)
- 30 -
NOTE 3 – RISK MANAGEMENT…continued
Market risk…continued Foreign currency sensitivity…continued The following is the estimated impact on profit or loss that would have resulted from management’s estimate of reasonable possible changes in the Yen and the CHF rates respectively:
YEN Effect on profit or loss (Income)/Expense
Exchange rate movements 2020 2019
Increase of 5%
$(13,994) $(8,327) Decrease of 5% $4,461 $9,203 Increase of 10% $(21,963) $(15,896) Decrease of 10% $15,227 $19,429
CHF Effect on profit or loss (Income)/Expense
Exchange rate movements 2020 2019
Increase of 5% $(2,611) $(7,151) Decrease of 5% $13,892 $7,903 Increase of 10% $(9,738) $(13,651) Decrease of 10% $23,520 $16,685 EURO Effect on profit or loss (Income)/Expense Exchange rate movements 2020 2019
Increase of 5% $(14,612) - Decrease of 5% $16,151 - Increase of 10% $(27,896) - Decrease of 10% $34,096 - The ‘Other’ currency category comprises various individual currencies which management does not consider to be material and therefore sensitivity analysis has not been applied.
Interest rate risk
Interest rate risk arises from the possibility that changes in interest rates will affect future cash flows on the fair value of financial instruments. CDB manages its interest rate exposure by ensuring that the changes in the cash flow of its assets closely match those of its liabilities. This relationship is maintained by the use of interest rate swaps which converts its liabilities from fixed rate into floating rate obligations where applicable.
CCAARRIIBBBBEEAANN DDEEVVEELLOOPPMMEENNTT BBAANNKK OORRDDIINNAARRYY CCAAPPIITTAALL RREESSOOUURRCCEESS NNOOTTEESS TTOO TTHHEE FFIINNAANNCCIIAALL SSTTAATTEEMMEENNTTSS FFoorr tthhee yyeeaarr eennddeedd DDeecceemmbbeerr 3311,, 22002200 (expressed in thousands of United States dollars, unless otherwise stated)
- 31 -
NOTE 3 – RISK MANAGEMENT…continued Market risk…continued Interest rate risk…continued The following table summarises the exposure to interest rate risks including financial instruments at carrying amounts, categorised by the earlier of contractual repricing or maturity dates. Exposure to interest rate risk
2020
At December 31 0-3
months 3-12
months 1-5 years Over 5
years
Non-interest generating/
bearing Total Assets Cash and cash equivalents $95,349 $- $- $- $- $95,349 Debt securities at fair value through OCI 42,632 43,657 230,075 221,622 - 537,986 Loans outstanding 1,332,087 - - - - 1,332,087 Derivative financial instruments 49,204 45,084 - - - 94,288 Receivable from members - - - - 28,112 28,112 Receivables - - - - 14,880 14,880
Total Assets $1,519,272 $88,741 $230,075 $221,622 $42,992 $2,102,702
Liabilities Accounts payable - - - - 6,970 6,970 Borrowings 4,315 12,946 431,638 645,202 - 1,094,101
Total Liabilities $4,315 $12,946 $431,638 $645,202 $6,970 $1,101,071
Total interest sensitivity Gap $1,514,957 $75,795 $(201,563) $(423,580)
CCAARRIIBBBBEEAANN DDEEVVEELLOOPPMMEENNTT BBAANNKK OORRDDIINNAARRYY CCAAPPIITTAALL RREESSOOUURRCCEESS NNOOTTEESS TTOO TTHHEE FFIINNAANNCCIIAALL SSTTAATTEEMMEENNTTSS FFoorr tthhee yyeeaarr eennddeedd DDeecceemmbbeerr 3311,, 22002200 (expressed in thousands of United States dollars, unless otherwise stated)
- 30 -
NOTE 3 – RISK MANAGEMENT…continued Market risk…continued Foreign currency sensitivity…continued The following is the estimated impact on profit or loss that would have resulted from management’s estimate of reasonable possible changes in the Yen and EUR and the CHF rates respectively: YEN Effect on profit or loss (Income)/Expense
Exchange rate movements 2020 2019
Increase of 5%
$(13,994) $(8,327) Decrease of 5% $4,461 $9,203 Increase of 10% $(21,963) $(15,896) Decrease of 10% $15,227 $19,429 CHF Effect on profit or loss (Income)/Expense
Exchange rate movements 2020 2019
Increase of 5% $(2,611) $(7,151) Decrease of 5% $13,892 $7,903 Increase of 10% $(9,738) $(13,651) Decrease of 10% $23,520 $16,685 EURO Effect on profit or loss (Income)/Expense Exchange rate movements 2020 2019 Increase of 5% $(14,612) - Decrease of 5% $16,151 - Increase of 10% $(27,896) - Decrease of 10% $34,096 - The ‘Other’ currency category comprises various individual currencies which management does not consider to be material and therefore sensitivity analysis has not been applied. Interest rate risk Interest rate risk arises from the possibility that changes in interest rates will affect future cash flows on the fair value of financial instruments. CDB manages its interest rate exposure by ensuring that the changes in the cash flow of its assets closely match those of its liabilities. This relationship is maintained by the use of interest rate swaps which converts its liabilities from fixed rate into floating rate obligations where applicable.
CCAARRIIBBBBEEAANN DDEEVVEELLOOPPMMEENNTT BBAANNKK OORRDDIINNAARRYY CCAAPPIITTAALL RREESSOOUURRCCEESS NNOOTTEESS TTOO TTHHEE FFIINNAANNCCIIAALL SSTTAATTEEMMEENNTTSS FFoorr tthhee yyeeaarr eennddeedd DDeecceemmbbeerr 3311,, 22002200 (expressed in thousands of United States dollars, unless otherwise stated)
- 31 -
NOTE 3 – RISK MANAGEMENT…continued Market risk…continued Interest rate risk…continued The following table summarises the exposure to interest rate risks including financial instruments at carrying amounts, categorised by the earlier of contractual repricing or maturity dates. Exposure to interest rate risk 2020
At December 31 0-3
months 3-12
months 1-5 years Over 5
years
Non-interest generating/
bearing Total Assets Cash and cash equivalents $95,349 $- $- $- $- $95,349 Debt securities at fair value through OCI 42,632 43,657 230,075 221,622 - 537,986 Loans outstanding 1,332,087 - - - - 1,332,087 Derivative financial instruments 49,204 45,084 - - - 94,288 Receivable from members - - - - 28,112 28,112 Receivables - - - - 14,880 14,880 Total Assets $1,519,272 $88,741 $230,075 $221,622 $42,992 $2,102,702 Liabilities Accounts payable - - - - 6,970 6,970 Borrowings 4,315 12,946 431,638 645,202 - 1,094,101 Total Liabilities $4,315 $12,946 $431,638 $645,202 $6,970 $1,101,071 Total interest sensitivity Gap $1,514,957 $75,795 $(201,563) $(423,580)

120
CARIBBEAN DEVELOPMENT BANK ANNUAL REPORT 2020
118 119
CARIBBEAN DEVELOPMENT BANK ANNUAL REPORT 2020 CARIBBEAN DEVELOPMENT BANK ANNUAL REPORT 2020
CCAARRIIBBBBEEAANN DDEEVVEELLOOPPMMEENNTT BBAANNKK OORRDDIINNAARRYY CCAAPPIITTAALL RREESSOOUURRCCEESS NNOOTTEESS TTOO TTHHEE FFIINNAANNCCIIAALL SSTTAATTEEMMEENNTTSS FFoorr tthhee yyeeaarr eennddeedd DDeecceemmbbeerr 3311,, 22002200 (expressed in thousands of United States dollars, unless otherwise stated)
- 32 -
NOTE 3 – RISK MANAGEMENT…continued
Market risk…continued
Exposure to interest rate risk…continued
2019
At December 31 0-3
months 3-12
months 1-5 years Over 5
years
Non-interest generating/
bearing Total Assets Cash and cash equivalents $292,045 $- $- $- $- $292,045 Cash collateral on derivatives 2,400 - - - - 2,400 Debt securities at fair value through OCI 76,347 113,388 211,656 20,747 - 422,138 Loans outstanding 1,249,318 - - - - 1,249,318 Derivative financial instruments 42,088 18,158 - - - 60,246 Receivable from members - - - - 44,837 44,837 Receivables - - - - 7,120 7,120
Total Assets $1,662,198 $131,546 $211,656 $20,747 $51,957 $2,078,104
Liabilities Accounts payable $- $- $- $- $5,456 $5,456 Borrowings 76,473 6,637 219,362 800,718 - 1,103,190 Derivative financial instruments 12,622 - - - - 12,622
Total Liabilities $89,095 $6,637 $219,362 $800,718 $5,456 $1,121,268
Total interest sensitivity Gap $1,573,103 $124,909 $(7,706) $(779,971)
Interest rate sensitivity
All other variables held constant (and excluding the effects of the derivative instruments), if interest rates had been 50 bps higher, net income for the year would have increased by $3,538 (2019: $4,788). Had interest rates been 50 bps lower, net income would have declined by the same amount. All other variables held constant and including the impact of the derivative instruments, if interest rates had been 50 bps higher, net income for the year would have decreased by $33,191 (2019: $13,014). Had interest rates been 50 bps lower, net income for the year would have increased by $46,689 (2019: $14,661). The sensitivity analyses have shown the exposure to interest rates for both derivatives and non-derivative instruments at the reporting date. For floating rate liabilities, the analysis is prepared assuming the amount of liability outstanding at the reporting date was outstanding for the whole year. The 50-bps movement represents management’s assessment of a reasonable possible change in interest rates.
CCAARRIIBBBBEEAANN DDEEVVEELLOOPPMMEENNTT BBAANNKK OORRDDIINNAARRYY CCAAPPIITTAALL RREESSOOUURRCCEESS NNOOTTEESS TTOO TTHHEE FFIINNAANNCCIIAALL SSTTAATTEEMMEENNTTSS FFoorr tthhee yyeeaarr eennddeedd DDeecceemmbbeerr 3311,, 22002200 (expressed in thousands of United States dollars, unless otherwise stated)
- 33 -
NOTE 3 – RISK MANAGEMENT…continued
Credit risk…continued
Credit quality…continued Liquidity risk Liquidity risk relates to the probability that the Bank will be unable to meet the payment obligations associated with its financial liabilities when they fall due. The consequence may be the failure to meet obligations or to disburse on its loan commitments. This risk is managed by conformity to the Bank’s policy of maintaining a net three years’ funding requirement of $489 million (2019: $538 million;) or 40% of undisbursed loan commitments and loans not yet effective (comprising loans approved by the BOD for which all conditions precedent have not yet been met) of $617 million (2019: $660 million), whichever is greater. The Bank holds a diversified portfolio of cash and securities to support payment obligations and contingent funding in the event of a highly stressed market environment. The Bank’s assets held for managing liquidity risk comprise:
• Cash and balances with commercial banks; • Time deposits; • Government bonds and other securities that can be readily liquidated; and • Secondary sources of liquidity including a line of credit with a commercial bank.
121
CARIBBEAN DEVELOPMENT BANK ANNUAL REPORT 2020
118 119
CARIBBEAN DEVELOPMENT BANK ANNUAL REPORT 2020 CARIBBEAN DEVELOPMENT BANK ANNUAL REPORT 2020
CCAARRIIBBBBEEAANN DDEEVVEELLOOPPMMEENNTT BBAANNKK OORRDDIINNAARRYY CCAAPPIITTAALL RREESSOOUURRCCEESS NNOOTTEESS TTOO TTHHEE FFIINNAANNCCIIAALL SSTTAATTEEMMEENNTTSS FFoorr tthhee yyeeaarr eennddeedd DDeecceemmbbeerr 3311,, 22002200 (expressed in thousands of United States dollars, unless otherwise stated)
- 32 -
NOTE 3 – RISK MANAGEMENT…continued
Market risk…continued
Exposure to interest rate risk…continued
2019
At December 31 0-3
months 3-12
months 1-5 years Over 5
years
Non-interest generating/
bearing Total Assets Cash and cash equivalents $292,045 $- $- $- $- $292,045 Cash collateral on derivatives 2,400 - - - - 2,400 Debt securities at fair value through OCI 76,347 113,388 211,656 20,747 - 422,138 Loans outstanding 1,249,318 - - - - 1,249,318 Derivative financial instruments 42,088 18,158 - - - 60,246 Receivable from members - - - - 44,837 44,837 Receivables - - - - 7,120 7,120
Total Assets $1,662,198 $131,546 $211,656 $20,747 $51,957 $2,078,104
Liabilities Accounts payable $- $- $- $- $5,456 $5,456 Borrowings 76,473 6,637 219,362 800,718 - 1,103,190 Derivative financial instruments 12,622 - - - - 12,622
Total Liabilities $89,095 $6,637 $219,362 $800,718 $5,456 $1,121,268
Total interest sensitivity Gap $1,573,103 $124,909 $(7,706) $(779,971)
Interest rate sensitivity
All other variables held constant (and excluding the effects of the derivative instruments), if interest rates had been 50 bps higher, net income for the year would have increased by $3,538 (2019: $4,788). Had interest rates been 50 bps lower, net income would have declined by the same amount. All other variables held constant and including the impact of the derivative instruments, if interest rates had been 50 bps higher, net income for the year would have decreased by $33,191 (2019: $13,014). Had interest rates been 50 bps lower, net income for the year would have increased by $46,689 (2019: $14,661). The sensitivity analyses have shown the exposure to interest rates for both derivatives and non-derivative instruments at the reporting date. For floating rate liabilities, the analysis is prepared assuming the amount of liability outstanding at the reporting date was outstanding for the whole year. The 50-bps movement represents management’s assessment of a reasonable possible change in interest rates.
CCAARRIIBBBBEEAANN DDEEVVEELLOOPPMMEENNTT BBAANNKK OORRDDIINNAARRYY CCAAPPIITTAALL RREESSOOUURRCCEESS NNOOTTEESS TTOO TTHHEE FFIINNAANNCCIIAALL SSTTAATTEEMMEENNTTSS FFoorr tthhee yyeeaarr eennddeedd DDeecceemmbbeerr 3311,, 22002200 (expressed in thousands of United States dollars, unless otherwise stated)
- 33 -
NOTE 3 – RISK MANAGEMENT…continued
Credit risk…continued
Credit quality…continued Liquidity risk Liquidity risk relates to the probability that the Bank will be unable to meet the payment obligations associated with its financial liabilities when they fall due. The consequence may be the failure to meet obligations or to disburse on its loan commitments. This risk is managed by conformity to the Bank’s policy of maintaining a net three years’ funding requirement of $489 million (2019: $538 million;) or 40% of undisbursed loan commitments and loans not yet effective (comprising loans approved by the BOD for which all conditions precedent have not yet been met) of $617 million (2019: $660 million), whichever is greater. The Bank holds a diversified portfolio of cash and securities to support payment obligations and contingent funding in the event of a highly stressed market environment. The Bank’s assets held for managing liquidity risk comprise:
• Cash and balances with commercial banks; • Time deposits; • Government bonds and other securities that can be readily liquidated; and • Secondary sources of liquidity including a line of credit with a commercial bank.

122
CARIBBEAN DEVELOPMENT BANK ANNUAL REPORT 2020
120 121
CARIBBEAN DEVELOPMENT BANK ANNUAL REPORT 2020 CARIBBEAN DEVELOPMENT BANK ANNUAL REPORT 2020
CCAARRIIBBBBEEAANN DDEEVVEELLOOPPMMEENNTT BBAANNKK OORRDDIINNAARRYY CCAAPPIITTAALL RREESSOOUURRCCEESS NNOOTTEESS TTOO TTHHEE FFIINNAANNCCIIAALL SSTTAATTEEMMEENNTTSS FFoorr tthhee yyeeaarr eennddeedd DDeecceemmbbeerr 3311,, 22002200 (expressed in thousands of United States dollars, unless otherwise stated)
- 34 -
NOTE 3 – RISK MANAGEMENT…continued
Liquidity risk …continued
Non-derivative cash flows
The table below presents the cash flows by remaining contractual maturities at the reporting date. The amounts disclosed in the table are the contractual undiscounted cash flows.
2020
At December 31 0 – 3
months 3-12
months 1-5
years Over
5 years
Total
Assets Cash and cash equivalents $95,349 $- $- $- $95,349 Debt securities at fair value through OCI 47,744 49,811 244,674 230,932 573,161 Loans outstanding 56,090 117,002 656,596 766,401 1,596,089 Receivable from members - 28,112 - - 28,112 Receivables 13,773 71 344 692 14,880
Total Assets 212,956 194,996 901,614 998,025 2,307,591
Liabilities Accounts payable 120 450 2,313 20 2,903 Borrowings 8,784 31,807 436,599 779,742 1,256,932
Total Liabilities 8,904 32,257 438,912 779,762 1,259,835
2019
At December 31 0 – 3
months 3-12
months 1-5
years Over
5 years
Total
Assets Cash and cash equivalents $292,045 $- $- $- $292,045 Cash collateral on derivatives 2,400 - - - 2,400 Debt securities at fair value through OCI 70,623 118,672 228,537 21,189 439,021 Loans outstanding 56,923 121,309 623,292 806,911 1,608,435 Receivable from members - 44,837 - - 44,837 Receivables 5,591 279 454 796 7,120
Total Assets $427,582 $285,097 $852,283 $828,896 $2,393,858
Liabilities Accounts payable $470 $2,522 $2,443 $21 $5,456 Borrowings 8,723 24,755 369,884 807,371 1,210,733
Total Liabilities $9,193 $27,277 $372,327 $807,392 $1,216,189
CCAARRIIBBBBEEAANN DDEEVVEELLOOPPMMEENNTT BBAANNKK OORRDDIINNAARRYY CCAAPPIITTAALL RREESSOOUURRCCEESS NNOOTTEESS TTOO TTHHEE FFIINNAANNCCIIAALL SSTTAATTEEMMEENNTTSS FFoorr tthhee yyeeaarr eennddeedd DDeecceemmbbeerr 3311,, 22002200 (expressed in thousands of United States dollars, unless otherwise stated)
- 35 -
NOTE 3 – RISK MANAGEMENT…continued
Liquidity risk …continued
Derivative cash flows
The following table shows the derivative financial instruments that will be settled on a net basis into relevant maturity groupings based on the remaining period at the reporting date to the contractual maturity date. The amounts disclosed in the table are contractual undiscounted cash flows. 2020 At December 31 0 - 3 months
3-12 months
1-5 years
Over 5 years
Total
Derivative asset: Derivative financial instruments $1,969 $7,379 $14,640 $67,833 $91,821 2019
At December 31 0 - 3 months 3 – 12
months 1 – 5 years Over 5
years Total Derivative asset: Derivative financial instruments $2,410 $3,052 $21,485 $8,691 $35,638 Derivative liability: Derivative financial instruments $3,001 $2,135 $19,054 $(12,350) $11,840

123
CARIBBEAN DEVELOPMENT BANK ANNUAL REPORT 2020
120 121
CARIBBEAN DEVELOPMENT BANK ANNUAL REPORT 2020 CARIBBEAN DEVELOPMENT BANK ANNUAL REPORT 2020
CCAARRIIBBBBEEAANN DDEEVVEELLOOPPMMEENNTT BBAANNKK OORRDDIINNAARRYY CCAAPPIITTAALL RREESSOOUURRCCEESS NNOOTTEESS TTOO TTHHEE FFIINNAANNCCIIAALL SSTTAATTEEMMEENNTTSS FFoorr tthhee yyeeaarr eennddeedd DDeecceemmbbeerr 3311,, 22002200 (expressed in thousands of United States dollars, unless otherwise stated)
- 34 -
NOTE 3 – RISK MANAGEMENT…continued
Liquidity risk …continued
Non-derivative cash flows
The table below presents the cash flows by remaining contractual maturities at the reporting date. The amounts disclosed in the table are the contractual undiscounted cash flows.
2020
At December 31 0 – 3
months 3-12
months 1-5
years Over
5 years
Total
Assets Cash and cash equivalents $95,349 $- $- $- $95,349 Debt securities at fair value through OCI 47,744 49,811 244,674 230,932 573,161 Loans outstanding 56,090 117,002 656,596 766,401 1,596,089 Receivable from members - 28,112 - - 28,112 Receivables 13,773 71 344 692 14,880
Total Assets 212,956 194,996 901,614 998,025 2,307,591
Liabilities Accounts payable 120 450 2,313 20 2,903 Borrowings 8,784 31,807 436,599 779,742 1,256,932
Total Liabilities 8,904 32,257 438,912 779,762 1,259,835
2019
At December 31 0 – 3
months 3-12
months 1-5
years Over
5 years
Total
Assets Cash and cash equivalents $292,045 $- $- $- $292,045 Cash collateral on derivatives 2,400 - - - 2,400 Debt securities at fair value through OCI 70,623 118,672 228,537 21,189 439,021 Loans outstanding 56,923 121,309 623,292 806,911 1,608,435 Receivable from members - 44,837 - - 44,837 Receivables 5,591 279 454 796 7,120
Total Assets $427,582 $285,097 $852,283 $828,896 $2,393,858
Liabilities Accounts payable $470 $2,522 $2,443 $21 $5,456 Borrowings 8,723 24,755 369,884 807,371 1,210,733
Total Liabilities $9,193 $27,277 $372,327 $807,392 $1,216,189
CCAARRIIBBBBEEAANN DDEEVVEELLOOPPMMEENNTT BBAANNKK OORRDDIINNAARRYY CCAAPPIITTAALL RREESSOOUURRCCEESS NNOOTTEESS TTOO TTHHEE FFIINNAANNCCIIAALL SSTTAATTEEMMEENNTTSS FFoorr tthhee yyeeaarr eennddeedd DDeecceemmbbeerr 3311,, 22002200 (expressed in thousands of United States dollars, unless otherwise stated)
- 35 -
NOTE 3 – RISK MANAGEMENT…continued
Liquidity risk …continued
Derivative cash flows
The following table shows the derivative financial instruments that will be settled on a net basis into relevant maturity groupings based on the remaining period at the reporting date to the contractual maturity date. The amounts disclosed in the table are contractual undiscounted cash flows. 2020 At December 31 0 - 3 months
3-12 months
1-5 years
Over 5 years
Total
Derivative asset: Derivative financial instruments $1,969 $7,379 $14,640 $67,833 $91,821 2019
At December 31 0 - 3 months 3 – 12
months 1 – 5 years Over 5
years Total Derivative asset: Derivative financial instruments $2,410 $3,052 $21,485 $8,691 $35,638 Derivative liability: Derivative financial instruments $3,001 $2,135 $19,054 $(12,350) $11,840

124
CARIBBEAN DEVELOPMENT BANK ANNUAL REPORT 2020
122 123
CARIBBEAN DEVELOPMENT BANK ANNUAL REPORT 2020 CARIBBEAN DEVELOPMENT BANK ANNUAL REPORT 2020
CCAARRIIBBBBEEAANN DDEEVVEELLOOPPMMEENNTT BBAANNKK OORRDDIINNAARRYY CCAAPPIITTAALL RREESSOOUURRCCEESS NNOOTTEESS TTOO TTHHEE FFIINNAANNCCIIAALL SSTTAATTEEMMEENNTTSS FFoorr tthhee yyeeaarr eennddeedd DDeecceemmbbeerr 3311,, 22002200 (expressed in thousands of United States dollars, unless otherwise stated)
- 36 -
NOTE 3 – RISK MANAGEMENT…continued
Liquidity risk …continued
Commitments, guarantees and contingent liabilities
Loan and capital commitments The table below summarises the amounts of the Bank’s commitments and guarantees to which it has committed for the extension of credit to its BMCs. Loan commitments represent amounts undrawn against loans approved by the BOD. Capital commitments represent obligations in respect of ongoing capital projects. Other commitments comprise a proposed allocation, subject to the approval of the Board of Governors of the Bank, from the net income of the OCR to the operations of the Special Development Fund [SDF (U)] in respect of the four (4) year cycle (Cycle 9) covering the period 2017 to 2020.
2020
At December 31 0-12 months 1-5 years
Total
Loan commitments $209,000 $266,188 $475,188 Other commitments 5,000 10,000 15,000 Guarantees 12,000 - 12,000
$226,000 $276,188 $502,188
2019
At December 31 0-12 months 1-5 years
Total
Loan commitments $259,000 $190,969 $449,969 Other commitments 10,000 5,000 15,000 Guarantees 12,000 - 12,000
$281,000 $195,969 $479,969
CCAARRIIBBBBEEAANN DDEEVVEELLOOPPMMEENNTT BBAANNKK OORRDDIINNAARRYY CCAAPPIITTAALL RREESSOOUURRCCEESS NNOOTTEESS TTOO TTHHEE FFIINNAANNCCIIAALL SSTTAATTEEMMEENNTTSS FFoorr tthhee yyeeaarr eennddeedd DDeecceemmbbeerr 3311,, 22002200 (expressed in thousands of United States dollars, unless otherwise stated)
- 37 -
NOTE 3 – RISK MANAGEMENT…continued
Fair value of financial assets and liabilities
Fair value hierarchy
IFRS 13 specifies a hierarchy of valuation techniques based on whether the inputs to those valuation techniques are observable or unobservable. Observable inputs reflect market data obtained from independent sources; unobservable inputs reflect the Bank’s market assumptions. These two types of inputs have created the following fair value hierarchy: Level 1 – Quoted (unadjusted) market prices in active markets for identical assets or liabilities. Level 2 – Inputs other than quoted prices included in Level 1 for which the lowest level input that is significant to the fair value measurement is directly or indirectly observable. Level 3 – Inputs for the asset or liability for which the lowest level input that is significant to the fair value measurement is unobservable. Financial assets and liabilities measured at fair value
All of the Bank’s financial assets which are measured at fair value are classified as Level 2 as follows: December 31 2020 2019 Financial assets at fair value through profit or loss
Derivative financial instruments $94,288 $60,246 Financial assets at fair value through OCI
Debt securities 537,986 422,138
$632,274 $482,384 Financial liabilities at fair value through profit or loss
Derivative financial instruments $- $12,622
$- $12,622 There were no transfers between Level 2 and Level 3 during the year.

125
CARIBBEAN DEVELOPMENT BANK ANNUAL REPORT 2020
122 123
CARIBBEAN DEVELOPMENT BANK ANNUAL REPORT 2020 CARIBBEAN DEVELOPMENT BANK ANNUAL REPORT 2020
CCAARRIIBBBBEEAANN DDEEVVEELLOOPPMMEENNTT BBAANNKK OORRDDIINNAARRYY CCAAPPIITTAALL RREESSOOUURRCCEESS NNOOTTEESS TTOO TTHHEE FFIINNAANNCCIIAALL SSTTAATTEEMMEENNTTSS FFoorr tthhee yyeeaarr eennddeedd DDeecceemmbbeerr 3311,, 22002200 (expressed in thousands of United States dollars, unless otherwise stated)
- 36 -
NOTE 3 – RISK MANAGEMENT…continued
Liquidity risk …continued
Commitments, guarantees and contingent liabilities
Loan and capital commitments The table below summarises the amounts of the Bank’s commitments and guarantees to which it has committed for the extension of credit to its BMCs. Loan commitments represent amounts undrawn against loans approved by the BOD. Capital commitments represent obligations in respect of ongoing capital projects. Other commitments comprise a proposed allocation, subject to the approval of the Board of Governors of the Bank, from the net income of the OCR to the operations of the Special Development Fund [SDF (U)] in respect of the four (4) year cycle (Cycle 9) covering the period 2017 to 2020.
2020
At December 31 0-12 months 1-5 years
Total
Loan commitments $209,000 $266,188 $475,188 Other commitments 5,000 10,000 15,000 Guarantees 12,000 - 12,000
$226,000 $276,188 $502,188
2019
At December 31 0-12 months 1-5 years
Total
Loan commitments $259,000 $190,969 $449,969 Other commitments 10,000 5,000 15,000 Guarantees 12,000 - 12,000
$281,000 $195,969 $479,969
CCAARRIIBBBBEEAANN DDEEVVEELLOOPPMMEENNTT BBAANNKK OORRDDIINNAARRYY CCAAPPIITTAALL RREESSOOUURRCCEESS NNOOTTEESS TTOO TTHHEE FFIINNAANNCCIIAALL SSTTAATTEEMMEENNTTSS FFoorr tthhee yyeeaarr eennddeedd DDeecceemmbbeerr 3311,, 22002200 (expressed in thousands of United States dollars, unless otherwise stated)
- 37 -
NOTE 3 – RISK MANAGEMENT…continued
Fair value of financial assets and liabilities
Fair value hierarchy
IFRS 13 specifies a hierarchy of valuation techniques based on whether the inputs to those valuation techniques are observable or unobservable. Observable inputs reflect market data obtained from independent sources; unobservable inputs reflect the Bank’s market assumptions. These two types of inputs have created the following fair value hierarchy: Level 1 – Quoted (unadjusted) market prices in active markets for identical assets or liabilities. Level 2 – Inputs other than quoted prices included in Level 1 for which the lowest level input that is significant to the fair value measurement is directly or indirectly observable. Level 3 – Inputs for the asset or liability for which the lowest level input that is significant to the fair value measurement is unobservable. Financial assets and liabilities measured at fair value
All of the Bank’s financial assets which are measured at fair value are classified as Level 2 as follows: December 31 2020 2019 Financial assets at fair value through profit or loss
Derivative financial instruments $94,288 $60,246 Financial assets at fair value through OCI
Debt securities 537,986 422,138
$632,274 $482,384 Financial liabilities at fair value through profit or loss
Derivative financial instruments $- $12,622
$- $12,622 There were no transfers between Level 2 and Level 3 during the year.
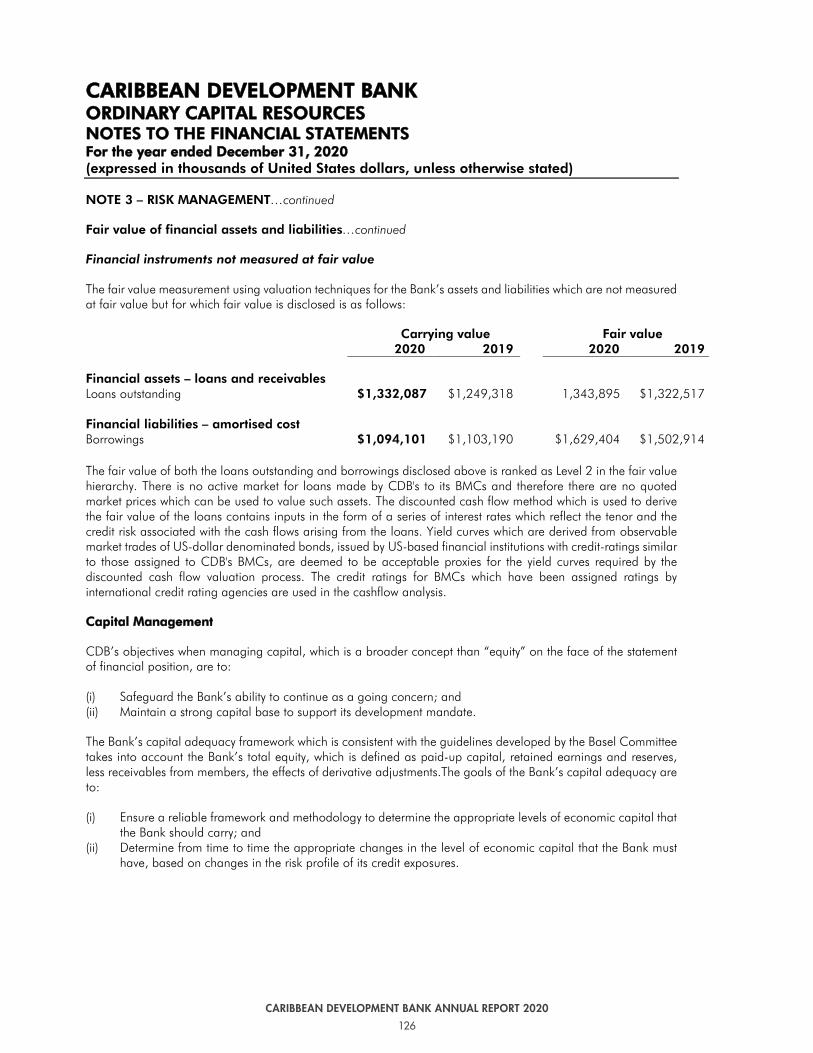
126
CARIBBEAN DEVELOPMENT BANK ANNUAL REPORT 2020
124 125
CARIBBEAN DEVELOPMENT BANK ANNUAL REPORT 2020 CARIBBEAN DEVELOPMENT BANK ANNUAL REPORT 2020
CCAARRIIBBBBEEAANN DDEEVVEELLOOPPMMEENNTT BBAANNKK OORRDDIINNAARRYY CCAAPPIITTAALL RREESSOOUURRCCEESS NNOOTTEESS TTOO TTHHEE FFIINNAANNCCIIAALL SSTTAATTEEMMEENNTTSS FFoorr tthhee yyeeaarr eennddeedd DDeecceemmbbeerr 3311,, 22002200 (expressed in thousands of United States dollars, unless otherwise stated)
- 38 -
NOTE 3 – RISK MANAGEMENT…continued
Fair value of financial assets and liabilities…continued
Financial instruments not measured at fair value
The fair value measurement using valuation techniques for the Bank’s assets and liabilities which are not measured at fair value but for which fair value is disclosed is as follows:
Carrying value Fair value 2020 2019 2020 2019
Financial assets – loans and receivables
Loans outstanding $1,332,087 $1,249,318 1,343,895 $1,322,517
Financial liabilities – amortised cost Borrowings $1,094,101 $1,103,190 $1,629,404 $1,502,914
The fair value of both the loans outstanding and borrowings disclosed above is ranked as Level 2 in the fair value hierarchy. There is no active market for loans made by CDB's to its BMCs and therefore there are no quoted market prices which can be used to value such assets. The discounted cash flow method which is used to derive the fair value of the loans contains inputs in the form of a series of interest rates which reflect the tenor and the credit risk associated with the cash flows arising from the loans. Yield curves which are derived from observable market trades of US-dollar denominated bonds, issued by US-based financial institutions with credit-ratings similar to those assigned to CDB's BMCs, are deemed to be acceptable proxies for the yield curves required by the discounted cash flow valuation process. The credit ratings for BMCs which have been assigned ratings by international credit rating agencies are used in the cashflow analysis.
CCaappiittaall MMaannaaggeemmeenntt
CDB’s objectives when managing capital, which is a broader concept than “equity” on the face of the statement of financial position, are to: (i) Safeguard the Bank’s ability to continue as a going concern; and (ii) Maintain a strong capital base to support its development mandate.
The Bank’s capital adequacy framework which is consistent with the guidelines developed by the Basel Committee takes into account the Bank’s total equity, which is defined as paid-up capital, retained earnings and reserves, less receivables from members, the effects of derivative adjustments.The goals of the Bank’s capital adequacy are to: (i) Ensure a reliable framework and methodology to determine the appropriate levels of economic capital that
the Bank should carry; and (ii) Determine from time to time the appropriate changes in the level of economic capital that the Bank must
have, based on changes in the risk profile of its credit exposures.
CCAARRIIBBBBEEAANN DDEEVVEELLOOPPMMEENNTT BBAANNKK OORRDDIINNAARRYY CCAAPPIITTAALL RREESSOOUURRCCEESS NNOOTTEESS TTOO TTHHEE FFIINNAANNCCIIAALL SSTTAATTEEMMEENNTTSS FFoorr tthhee yyeeaarr eennddeedd DDeecceemmbbeerr 3311,, 22002200 (expressed in thousands of United States dollars, unless otherwise stated)
- 39 -
NOTE 3 – RISK MANAGEMENT…continued
Capital Management…continued The Bank’s enhanced capital adequacy framework is supported by an income targeting policy that would enable the Bank not only to safeguard, but also to strengthen its level of capitalisation and to meet its commitments. The policy requires the Bank to maintain available capital (as defined in the Bank’s Board approved policy) at a minimum level of 150% of baseline economic capital (comprising a methodology for calculating capital requirements based on the types and levels of risks, such as borrower defaults, operational losses, or market changes). As at December 31, 2020 the Bank’s available capital was 211.0% (2019: 232.9%) of its economic capital. No changes were made to the objectives, policies or processes for managing capital during the year ended December 31, 2020.
NOTE 4 – SEGMENT ANALYSIS & REPORTING
Operating segments are reported in a manner consistent with the internal reporting provided to the chief operating decision maker which is the person or group that allocates resources to and assesses the performance of the operating segments of an entity. Under Article 33.4 of the Bank’s Charter, the President is the Chief Executive Officer (CEO) and is required to conduct, under the direction of the Board of Directors (BOD) the current business of the Bank. In accordance with IFRS 8 the Bank has one reportable segment, its OCR, since its operations are managed as a single business unit and it does not have multiple components for which discrete financial information is produced and reviewed by the chief operating decision maker for performance assessment and resource allocation.
The following table presents CDB’s outstanding loan balances inclusive of accrued interest and net of impairment provisions as of December 31, 2020 and 2019, and associated interest income by countries which generated in excess of 10% of the loan interest income for the years ended December 31, 2020 and 2019:
Interest income Loans outstanding Country 2020 2019 2020 2019
Barbados $10,898 $9,121 $262,075 $261,898 Jamaica 5,334 7,578 118,958 150,844 Antigua and Barbuda
5,370 6,242 115,787 117,384
Others 34,864 35,677 835,267 719,192
$56,466 $58,618 $1,332,087 $1,249,318

127
CARIBBEAN DEVELOPMENT BANK ANNUAL REPORT 2020
124 125
CARIBBEAN DEVELOPMENT BANK ANNUAL REPORT 2020 CARIBBEAN DEVELOPMENT BANK ANNUAL REPORT 2020
CCAARRIIBBBBEEAANN DDEEVVEELLOOPPMMEENNTT BBAANNKK OORRDDIINNAARRYY CCAAPPIITTAALL RREESSOOUURRCCEESS NNOOTTEESS TTOO TTHHEE FFIINNAANNCCIIAALL SSTTAATTEEMMEENNTTSS FFoorr tthhee yyeeaarr eennddeedd DDeecceemmbbeerr 3311,, 22002200 (expressed in thousands of United States dollars, unless otherwise stated)
- 38 -
NOTE 3 – RISK MANAGEMENT…continued
Fair value of financial assets and liabilities…continued
Financial instruments not measured at fair value
The fair value measurement using valuation techniques for the Bank’s assets and liabilities which are not measured at fair value but for which fair value is disclosed is as follows:
Carrying value Fair value 2020 2019 2020 2019
Financial assets – loans and receivables
Loans outstanding $1,332,087 $1,249,318 1,343,895 $1,322,517
Financial liabilities – amortised cost Borrowings $1,094,101 $1,103,190 $1,629,404 $1,502,914
The fair value of both the loans outstanding and borrowings disclosed above is ranked as Level 2 in the fair value hierarchy. There is no active market for loans made by CDB's to its BMCs and therefore there are no quoted market prices which can be used to value such assets. The discounted cash flow method which is used to derive the fair value of the loans contains inputs in the form of a series of interest rates which reflect the tenor and the credit risk associated with the cash flows arising from the loans. Yield curves which are derived from observable market trades of US-dollar denominated bonds, issued by US-based financial institutions with credit-ratings similar to those assigned to CDB's BMCs, are deemed to be acceptable proxies for the yield curves required by the discounted cash flow valuation process. The credit ratings for BMCs which have been assigned ratings by international credit rating agencies are used in the cashflow analysis.
CCaappiittaall MMaannaaggeemmeenntt
CDB’s objectives when managing capital, which is a broader concept than “equity” on the face of the statement of financial position, are to: (i) Safeguard the Bank’s ability to continue as a going concern; and (ii) Maintain a strong capital base to support its development mandate.
The Bank’s capital adequacy framework which is consistent with the guidelines developed by the Basel Committee takes into account the Bank’s total equity, which is defined as paid-up capital, retained earnings and reserves, less receivables from members, the effects of derivative adjustments.The goals of the Bank’s capital adequacy are to: (i) Ensure a reliable framework and methodology to determine the appropriate levels of economic capital that
the Bank should carry; and (ii) Determine from time to time the appropriate changes in the level of economic capital that the Bank must
have, based on changes in the risk profile of its credit exposures.
CCAARRIIBBBBEEAANN DDEEVVEELLOOPPMMEENNTT BBAANNKK OORRDDIINNAARRYY CCAAPPIITTAALL RREESSOOUURRCCEESS NNOOTTEESS TTOO TTHHEE FFIINNAANNCCIIAALL SSTTAATTEEMMEENNTTSS FFoorr tthhee yyeeaarr eennddeedd DDeecceemmbbeerr 3311,, 22002200 (expressed in thousands of United States dollars, unless otherwise stated)
- 39 -
NOTE 3 – RISK MANAGEMENT…continued
Capital Management…continued The Bank’s enhanced capital adequacy framework is supported by an income targeting policy that would enable the Bank not only to safeguard, but also to strengthen its level of capitalisation and to meet its commitments. The policy requires the Bank to maintain available capital (as defined in the Bank’s Board approved policy) at a minimum level of 150% of baseline economic capital (comprising a methodology for calculating capital requirements based on the types and levels of risks, such as borrower defaults, operational losses, or market changes). As at December 31, 2020 the Bank’s available capital was 211.0% (2019: 232.9%) of its economic capital. No changes were made to the objectives, policies or processes for managing capital during the year ended December 31, 2020.
NOTE 4 – SEGMENT ANALYSIS & REPORTING
Operating segments are reported in a manner consistent with the internal reporting provided to the chief operating decision maker which is the person or group that allocates resources to and assesses the performance of the operating segments of an entity. Under Article 33.4 of the Bank’s Charter, the President is the Chief Executive Officer (CEO) and is required to conduct, under the direction of the Board of Directors (BOD) the current business of the Bank. In accordance with IFRS 8 the Bank has one reportable segment, its OCR, since its operations are managed as a single business unit and it does not have multiple components for which discrete financial information is produced and reviewed by the chief operating decision maker for performance assessment and resource allocation.
The following table presents CDB’s outstanding loan balances inclusive of accrued interest and net of impairment provisions as of December 31, 2020 and 2019, and associated interest income by countries which generated in excess of 10% of the loan interest income for the years ended December 31, 2020 and 2019:
Interest income Loans outstanding Country 2020 2019 2020 2019
Barbados $10,898 $9,121 $262,075 $261,898 Jamaica 5,334 7,578 118,958 150,844 Antigua and Barbuda
5,370 6,242 115,787 117,384
Others 34,864 35,677 835,267 719,192
$56,466 $58,618 $1,332,087 $1,249,318

128
CARIBBEAN DEVELOPMENT BANK ANNUAL REPORT 2020
126 127
CARIBBEAN DEVELOPMENT BANK ANNUAL REPORT 2020 CARIBBEAN DEVELOPMENT BANK ANNUAL REPORT 2020
CCAARRIIBBBBEEAANN DDEEVVEELLOOPPMMEENNTT BBAANNKK OORRDDIINNAARRYY CCAAPPIITTAALL RREESSOOUURRCCEESS NNOOTTEESS TTOO TTHHEE FFIINNAANNCCIIAALL SSTTAATTEEMMEENNTTSS FFoorr tthhee yyeeaarr eennddeedd DDeecceemmbbeerr 3311,, 22002200 (expressed in thousands of United States dollars, unless otherwise stated)
- 40 -
NOTE 5 – FINANCIAL ASSETS
Initial recognition and measurement of financial assets Financial assets, with the exception of loans, are initially recognised on the settlement date, i.e., the date on which the transaction becomes final and payment must be made. This includes regular way trades - purchases or sales of financial assets that require delivery of assets within the time frame generally established by regulation or convention in the marketplace. Loans are recognised when funds are transferred to the customers’ accounts. The Bank recognises balances due to customers when funds are transferred to the Bank. Initial measurement of financial instruments The classification of financial instruments at initial recognition depends on their contractual terms and the business model for managing the instruments. Financial instruments are initially measured at their fair value. Trade receivables are measured at the transaction price.
Measurement categories of financial assets The Bank classifies all of its financial assets based on the business model for managing the assets and the asset’s contractual terms, measured at either:
• Amortised cost. • Fair value through other comprehensive income (FVOCI) • Fair value through profit and loss (FVPL)
The Bank classifies and measures its derivatives at FVPL. The Bank has not designated any financial instruments at FVPL in order to eliminate or significantly reduce measurement or recognition inconsistencies (accounting mismatches). Subsequent measurement
Loans outstanding, receivable from members and receivables Loans and receivables are non-derivative financial assets with fixed or determinable payments and are not quoted in an active market. After initial measurement, such financial assets are subsequently measured at amortised cost using the effective interest rate (EIR) method, less impairment. Amortised cost is calculated by taking into account any discount or premium on acquisition and fees or costs that are an integral part of the EIR. The EIR amortisation is included in ‘Interest and similar income’ in the statement of comprehensive income. The losses arising from impairment of loans and receivables are recognised in the statement of comprehensive income in ‘Impairment (recovery)/charges’.
CCAARRIIBBBBEEAANN DDEEVVEELLOOPPMMEENNTT BBAANNKK OORRDDIINNAARRYY CCAAPPIITTAALL RREESSOOUURRCCEESS NNOOTTEESS TTOO TTHHEE FFIINNAANNCCIIAALL SSTTAATTEEMMEENNTTSS FFoorr tthhee yyeeaarr eennddeedd DDeecceemmbbeerr 3311,, 22002200 (expressed in thousands of United States dollars, unless otherwise stated)
- 41 -
NOTE 5 – FINANCIAL ASSETS …continued Subsequent measurement…continued
Loans outstanding, receivable from members and receivables…continued The Bank measures loans outstanding, receivable from members and receivables at amortised cost having determined that both of the following conditions are met:
• The financial asset is held within a business model with the objective to hold financial assets in order to collect contractual cash flows; and
• The contractual terms of the financial asset give rise on specified dates to cash flows that are solely payments of principal and interest (SPPI) on the principal amount outstanding. The details of these conditions are outlined below.
The Bank determines its business model at the level that best reflects how it manages groups of financial assets to achieve its business objective and in which loans to members, receivables from members and receivables are assessed on a counterparty level having regard to the small number of borrowers in the portfolio. Assessment is based on observable factors such as:
• How the performance of the business model and the financial assets held within that business model are evaluated and reported to the Bank's key management personnel.
• The risks that affect the performance of the business model (and the financial assets held within that business model) of meeting and, in particular, the way those risks are managed.
The business model assessment is based on reasonably expected scenarios without taking 'worst case' or 'stress case’ scenarios into account. If cash flows after initial recognition are realised in a way that is different from the Bank's original expectations, the Bank does not change the classification of the remaining financial assets held in that business model, but incorporates such information when assessing newly originated or newly purchased financial assets going forward. The SPPI test As a second step of its classification process the Bank assesses the contractual terms of the financial asset to identify whether it meets the SPPI test. ‘Principal’ for the purpose of this test is defined as the fair value of the financial asset at initial recognition and may change over the life of the financial asset (for example, if there are repayments of principal or amortisation of the premium/discount, if applicable). The Bank’s loans are approved for fixed amounts with pre-determined repayment dates and other terms in settlement of principal and interest amounts. The receivables from members and receivables are for fixed amounts, but without pre-determined repayment dates. The most significant elements of interest within a lending arrangement are typically the consideration for the time value of money and credit risk. To make the SPPI assessment, the Bank applies judgement and considers relevant factors such as the currency in which the financial asset is denominated, and the period for which the interest rate is set. The Bank’s operating currency is US Dollars and interest rates for loans are set on a quarterly basis based on the cost of funds and an appropriate margin to cover operating expenditures and to realise a return. Receivables from members and receivables are interest free.
CCAARRIIBBBBEEAANN DDEEVVEELLOOPPMMEENNTT BBAANNKK OORRDDIINNAARRYY CCAAPPIITTAALL RREESSOOUURRCCEESS NNOOTTEESS TTOO TTHHEE FFIINNAANNCCIIAALL SSTTAATTEEMMEENNTTSS FFoorr tthhee yyeeaarr eennddeedd DDeecceemmbbeerr 3311,, 22002200 (expressed in thousands of United States dollars, unless otherwise stated)
- 40 -
NOTE 5 – FINANCIAL ASSETS Initial recognition and measurement of financial assets Financial assets, with the exception of loans, are initially recognised on the settlement date, i.e., the date on which the transaction becomes final and payment must be made. This includes regular way trades - purchases or sales of financial assets that require delivery of assets within the time frame generally established by regulation or convention in the marketplace. Loans are recognised when funds are transferred to the customers’ accounts. The Bank recognises balances due to customers when funds are transferred to the Bank. Initial measurement of financial instruments The classification of financial instruments at initial recognition depends on their contractual terms and the business model for managing the instruments. Financial instruments are initially measured at their fair value. Trade receivables are measured at the transaction price. Measurement categories of financial assets The Bank classifies all of its financial assets based on the business model for managing the assets and the asset’s contractual terms, measured at either:
• Amortised cost. • Fair value through other comprehensive income (FVOCI) • Fair value through profit and loss (FVPL)
The Bank classifies and measures its derivatives at FVPL. The debt securities are classified as FVOCI. The Bank has not designated any financial instruments at FVPL in order to eliminate or significantly reduce measurement or recognition inconsistencies (accounting mismatches). Subsequent measurement Loans outstanding, receivable from members and receivables Loans and receivables are non-derivative financial assets with fixed or determinable payments and are not quoted in an active market. After initial measurement, such financial assets are subsequently measured at amortised cost using the effective interest rate (EIR) method, less impairment. Amortised cost is calculated by taking into account any discount or premium on acquisition and fees or costs that are an integral part of the EIR. The EIR amortisation is included in ‘Interest and similar income’ in the statement of comprehensive income. The losses arising from impairment of loans and receivables are recognised in the statement of comprehensive income in ‘Impairment (recovery)/charges’.
CCAARRIIBBBBEEAANN DDEEVVEELLOOPPMMEENNTT BBAANNKK OORRDDIINNAARRYY CCAAPPIITTAALL RREESSOOUURRCCEESS NNOOTTEESS TTOO TTHHEE FFIINNAANNCCIIAALL SSTTAATTEEMMEENNTTSS FFoorr tthhee yyeeaarr eennddeedd DDeecceemmbbeerr 3311,, 22002200 (expressed in thousands of United States dollars, unless otherwise stated)
- 41 -
NOTE 5 – FINANCIAL ASSETS …continued Subsequent measurement…continued Loans outstanding, receivable from members and receivables…continued The Bank measures loans outstanding, receivable from members and receivables at amortised cost having determined that both of the following conditions are met:
• The financial asset is held within a business model with the objective to hold financial assets in order to collect contractual cash flows; and
• The contractual terms of the financial asset give rise on specified dates to cash flows that are solely payments of principal and interest (SPPI) on the principal amount outstanding. The details of these conditions are outlined below.
The Bank determines its business model at the level that best reflects how it manages groups of financial assets to achieve its business objective and in which loans to members, receivables from members and receivables are assessed on a counterparty level having regard to the small number of borrowers in the portfolio. Assessment is based on observable factors such as:
• How the performance of the business model and the financial assets held within that business model are evaluated and reported to the Bank's key management personnel.
• The risks that affect the performance of the business model (and the financial assets held within that business model) of meeting and, in particular, the way those risks are managed.
The business model assessment is based on reasonably expected scenarios without taking 'worst case' or 'stress case’ scenarios into account. If cash flows after initial recognition are realised in a way that is different from the Bank's original expectations, the Bank does not change the classification of the remaining financial assets held in that business model, but incorporates such information when assessing newly originated or newly purchased financial assets going forward. The SPPI test As a second step of its classification process the Bank assesses the contractual terms of the financial asset to identify whether it meets the SPPI test. ‘Principal’ for the purpose of this test is defined as the fair value of the financial asset at initial recognition and may change over the life of the financial asset (for example, if there are repayments of principal or amortisation of the premium/discount, if applicable). The Bank’s loans are approved for fixed amounts with pre-determined repayment dates and other terms in settlement of principal and interest amounts. The receivables from members and receivables are for fixed amounts, but without pre-determined repayment dates. The most significant elements of interest within a lending arrangement are typically the consideration for the time value of money and credit risk. To make the SPPI assessment, the Bank applies judgement and considers relevant factors such as the currency in which the financial asset is denominated, and the period for which the interest rate is set. The Bank’s operating currency is US Dollars and interest rates for loans are set on a quarterly basis based on the cost of funds and an appropriate margin to cover operating expenditures and to realise a return. Receivables from members and receivables are interest free.

129
CARIBBEAN DEVELOPMENT BANK ANNUAL REPORT 2020
126 127
CARIBBEAN DEVELOPMENT BANK ANNUAL REPORT 2020 CARIBBEAN DEVELOPMENT BANK ANNUAL REPORT 2020
CCAARRIIBBBBEEAANN DDEEVVEELLOOPPMMEENNTT BBAANNKK OORRDDIINNAARRYY CCAAPPIITTAALL RREESSOOUURRCCEESS NNOOTTEESS TTOO TTHHEE FFIINNAANNCCIIAALL SSTTAATTEEMMEENNTTSS FFoorr tthhee yyeeaarr eennddeedd DDeecceemmbbeerr 3311,, 22002200 (expressed in thousands of United States dollars, unless otherwise stated)
- 40 -
NOTE 5 – FINANCIAL ASSETS
Initial recognition and measurement of financial assets Financial assets, with the exception of loans, are initially recognised on the settlement date, i.e., the date on which the transaction becomes final and payment must be made. This includes regular way trades - purchases or sales of financial assets that require delivery of assets within the time frame generally established by regulation or convention in the marketplace. Loans are recognised when funds are transferred to the customers’ accounts. The Bank recognises balances due to customers when funds are transferred to the Bank. Initial measurement of financial instruments The classification of financial instruments at initial recognition depends on their contractual terms and the business model for managing the instruments. Financial instruments are initially measured at their fair value. Trade receivables are measured at the transaction price.
Measurement categories of financial assets The Bank classifies all of its financial assets based on the business model for managing the assets and the asset’s contractual terms, measured at either:
• Amortised cost. • Fair value through other comprehensive income (FVOCI) • Fair value through profit and loss (FVPL)
The Bank classifies and measures its derivatives at FVPL. The Bank has not designated any financial instruments at FVPL in order to eliminate or significantly reduce measurement or recognition inconsistencies (accounting mismatches). Subsequent measurement
Loans outstanding, receivable from members and receivables Loans and receivables are non-derivative financial assets with fixed or determinable payments and are not quoted in an active market. After initial measurement, such financial assets are subsequently measured at amortised cost using the effective interest rate (EIR) method, less impairment. Amortised cost is calculated by taking into account any discount or premium on acquisition and fees or costs that are an integral part of the EIR. The EIR amortisation is included in ‘Interest and similar income’ in the statement of comprehensive income. The losses arising from impairment of loans and receivables are recognised in the statement of comprehensive income in ‘Impairment (recovery)/charges’.
CCAARRIIBBBBEEAANN DDEEVVEELLOOPPMMEENNTT BBAANNKK OORRDDIINNAARRYY CCAAPPIITTAALL RREESSOOUURRCCEESS NNOOTTEESS TTOO TTHHEE FFIINNAANNCCIIAALL SSTTAATTEEMMEENNTTSS FFoorr tthhee yyeeaarr eennddeedd DDeecceemmbbeerr 3311,, 22002200 (expressed in thousands of United States dollars, unless otherwise stated)
- 41 -
NOTE 5 – FINANCIAL ASSETS …continued Subsequent measurement…continued
Loans outstanding, receivable from members and receivables…continued The Bank measures loans outstanding, receivable from members and receivables at amortised cost having determined that both of the following conditions are met:
• The financial asset is held within a business model with the objective to hold financial assets in order to collect contractual cash flows; and
• The contractual terms of the financial asset give rise on specified dates to cash flows that are solely payments of principal and interest (SPPI) on the principal amount outstanding. The details of these conditions are outlined below.
The Bank determines its business model at the level that best reflects how it manages groups of financial assets to achieve its business objective and in which loans to members, receivables from members and receivables are assessed on a counterparty level having regard to the small number of borrowers in the portfolio. Assessment is based on observable factors such as:
• How the performance of the business model and the financial assets held within that business model are evaluated and reported to the Bank's key management personnel.
• The risks that affect the performance of the business model (and the financial assets held within that business model) of meeting and, in particular, the way those risks are managed.
The business model assessment is based on reasonably expected scenarios without taking 'worst case' or 'stress case’ scenarios into account. If cash flows after initial recognition are realised in a way that is different from the Bank's original expectations, the Bank does not change the classification of the remaining financial assets held in that business model, but incorporates such information when assessing newly originated or newly purchased financial assets going forward. The SPPI test As a second step of its classification process the Bank assesses the contractual terms of the financial asset to identify whether it meets the SPPI test. ‘Principal’ for the purpose of this test is defined as the fair value of the financial asset at initial recognition and may change over the life of the financial asset (for example, if there are repayments of principal or amortisation of the premium/discount, if applicable). The Bank’s loans are approved for fixed amounts with pre-determined repayment dates and other terms in settlement of principal and interest amounts. The receivables from members and receivables are for fixed amounts, but without pre-determined repayment dates. The most significant elements of interest within a lending arrangement are typically the consideration for the time value of money and credit risk. To make the SPPI assessment, the Bank applies judgement and considers relevant factors such as the currency in which the financial asset is denominated, and the period for which the interest rate is set. The Bank’s operating currency is US Dollars and interest rates for loans are set on a quarterly basis based on the cost of funds and an appropriate margin to cover operating expenditures and to realise a return. Receivables from members and receivables are interest free.
CCAARRIIBBBBEEAANN DDEEVVEELLOOPPMMEENNTT BBAANNKK OORRDDIINNAARRYY CCAAPPIITTAALL RREESSOOUURRCCEESS NNOOTTEESS TTOO TTHHEE FFIINNAANNCCIIAALL SSTTAATTEEMMEENNTTSS FFoorr tthhee yyeeaarr eennddeedd DDeecceemmbbeerr 3311,, 22002200 (expressed in thousands of United States dollars, unless otherwise stated)
- 40 -
NOTE 5 – FINANCIAL ASSETS Initial recognition and measurement of financial assets Financial assets, with the exception of loans, are initially recognised on the settlement date, i.e., the date on which the transaction becomes final and payment must be made. This includes regular way trades - purchases or sales of financial assets that require delivery of assets within the time frame generally established by regulation or convention in the marketplace. Loans are recognised when funds are transferred to the customers’ accounts. The Bank recognises balances due to customers when funds are transferred to the Bank. Initial measurement of financial instruments The classification of financial instruments at initial recognition depends on their contractual terms and the business model for managing the instruments. Financial instruments are initially measured at their fair value. Trade receivables are measured at the transaction price. Measurement categories of financial assets The Bank classifies all of its financial assets based on the business model for managing the assets and the asset’s contractual terms, measured at either:
• Amortised cost. • Fair value through other comprehensive income (FVOCI) • Fair value through profit and loss (FVPL)
The Bank classifies and measures its derivatives at FVPL. The debt securities are classified as FVOCI. The Bank has not designated any financial instruments at FVPL in order to eliminate or significantly reduce measurement or recognition inconsistencies (accounting mismatches). Subsequent measurement Loans outstanding, receivable from members and receivables Loans and receivables are non-derivative financial assets with fixed or determinable payments and are not quoted in an active market. After initial measurement, such financial assets are subsequently measured at amortised cost using the effective interest rate (EIR) method, less impairment. Amortised cost is calculated by taking into account any discount or premium on acquisition and fees or costs that are an integral part of the EIR. The EIR amortisation is included in ‘Interest and similar income’ in the statement of comprehensive income. The losses arising from impairment of loans and receivables are recognised in the statement of comprehensive income in ‘Impairment (recovery)/charges’.
CCAARRIIBBBBEEAANN DDEEVVEELLOOPPMMEENNTT BBAANNKK OORRDDIINNAARRYY CCAAPPIITTAALL RREESSOOUURRCCEESS NNOOTTEESS TTOO TTHHEE FFIINNAANNCCIIAALL SSTTAATTEEMMEENNTTSS FFoorr tthhee yyeeaarr eennddeedd DDeecceemmbbeerr 3311,, 22002200 (expressed in thousands of United States dollars, unless otherwise stated)
- 41 -
NOTE 5 – FINANCIAL ASSETS …continued Subsequent measurement…continued Loans outstanding, receivable from members and receivables…continued The Bank measures loans outstanding, receivable from members and receivables at amortised cost having determined that both of the following conditions are met:
• The financial asset is held within a business model with the objective to hold financial assets in order to collect contractual cash flows; and
• The contractual terms of the financial asset give rise on specified dates to cash flows that are solely payments of principal and interest (SPPI) on the principal amount outstanding. The details of these conditions are outlined below.
The Bank determines its business model at the level that best reflects how it manages groups of financial assets to achieve its business objective and in which loans to members, receivables from members and receivables are assessed on a counterparty level having regard to the small number of borrowers in the portfolio. Assessment is based on observable factors such as:
• How the performance of the business model and the financial assets held within that business model are evaluated and reported to the Bank's key management personnel.
• The risks that affect the performance of the business model (and the financial assets held within that business model) of meeting and, in particular, the way those risks are managed.
The business model assessment is based on reasonably expected scenarios without taking 'worst case' or 'stress case’ scenarios into account. If cash flows after initial recognition are realised in a way that is different from the Bank's original expectations, the Bank does not change the classification of the remaining financial assets held in that business model, but incorporates such information when assessing newly originated or newly purchased financial assets going forward. The SPPI test As a second step of its classification process the Bank assesses the contractual terms of the financial asset to identify whether it meets the SPPI test. ‘Principal’ for the purpose of this test is defined as the fair value of the financial asset at initial recognition and may change over the life of the financial asset (for example, if there are repayments of principal or amortisation of the premium/discount, if applicable). The Bank’s loans are approved for fixed amounts with pre-determined repayment dates and other terms in settlement of principal and interest amounts. The receivables from members and receivables are for fixed amounts, but without pre-determined repayment dates. The most significant elements of interest within a lending arrangement are typically the consideration for the time value of money and credit risk. To make the SPPI assessment, the Bank applies judgement and considers relevant factors such as the currency in which the financial asset is denominated, and the period for which the interest rate is set. The Bank’s operating currency is US Dollars and interest rates for loans are set on a quarterly basis based on the cost of funds and an appropriate margin to cover operating expenditures and to realise a return. Receivables from members and receivables are interest free.

130
CARIBBEAN DEVELOPMENT BANK ANNUAL REPORT 2020
128 129
CARIBBEAN DEVELOPMENT BANK ANNUAL REPORT 2020 CARIBBEAN DEVELOPMENT BANK ANNUAL REPORT 2020
CCAARRIIBBBBEEAANN DDEEVVEELLOOPPMMEENNTT BBAANNKK OORRDDIINNAARRYY CCAAPPIITTAALL RREESSOOUURRCCEESS NNOOTTEESS TTOO TTHHEE FFIINNAANNCCIIAALL SSTTAATTEEMMEENNTTSS FFoorr tthhee yyeeaarr eennddeedd DDeecceemmbbeerr 3311,, 22002200 (expressed in thousands of United States dollars, unless otherwise stated)
- 42 -
NOTE 5 – FINANCIAL ASSETS …continued Subsequent measurement…continued
Debt securities The Bank classifies its debt securities at FVOCI when both of the following conditions are met:
• The instrument is held within a business model, the objective of which is achieved by both collecting contractual cash flows and selling financial assets.
• The contractual terms of the financial asset meet the SPPI test.
FVOCI debt instruments are subsequently measured at fair value with gains and losses arising due to changes in fair value recognised in OCI. Interest income and foreign exchange gains and losses are recognised in profit or loss in the same manner as for financial assets measured at amortised cost. The ECL calculation for Debt securities at FVOCI is explained below. Where the Bank holds more than one investment in the same security, they are deemed to be disposed of on a first–in first–out basis. On derecognition, cumulative gains or losses previously recognised in OCI are reclassified from OCI to profit or loss.
Derivatives recorded at fair value through profit or loss The Bank’s derivatives are classified at FVPL. The Bank enters into interest rate swaps and/or cross currency swaps with various counterparties and in accordance with approved policy. Derivatives are recorded at fair value and carried as assets when their fair value is positive and as liabilities when their fair value is negative. The notional amount and fair value of such derivatives are disclosed in Note 14. Changes in the fair value of derivatives are carried in the statement of financial position at fair value with net changes in fair value presented as ‘Derivative fair value adjustments’ in the statement of comprehensive income in the period during which they arise. Income and expenditures related to derivative financial instruments are shown as ‘Net interest income from derivatives’ in Note 22 (b) and are included in ‘Interest expense and similar charges’ in the statement of comprehensive income. Fair Value Measurement Fair value related disclosures for financial instruments and non-financial assets that are measured at fair value or those for which only fair values are disclosed, are itemised in Note 3 – Risk Management – “Fair value of financial assets and liabilities”. For financial instruments traded in active markets, the determination of fair value is the price that would be received to sell an asset in an orderly transaction between market participants at the measurement date. The fair value measurement is based on the presumption that the transaction to sell the asset takes place either in the principal market for the asset or in the absence of a principal market, in the most advantageous market for the asset or liability. The principal or most advantageous market must be accessible to the Bank. The fair value of an asset is measured using the assumptions that market participants would use when pricing the asset assuming that the market participants are acting in their economic best interest. The Bank uses widely recognised valuation models for determining fair values of non-standardised financial instruments for which the inputs into models are generally market observable. Models are also used to determine the fair value of financial instruments that are not quoted in active markets. All models are calibrated to ensure that outputs reflect actual data and comparative market prices. To the extent practical, models use only observable data; however, consideration of inputs such as credit risks, liquidity risks, volatilities and correlations require the inclusion of estimates by management. Changes in assumptions about these factors could affect the reported fair value of financial instruments.
CCAARRIIBBBBEEAANN DDEEVVEELLOOPPMMEENNTT BBAANNKK OORRDDIINNAARRYY CCAAPPIITTAALL RREESSOOUURRCCEESS NNOOTTEESS TTOO TTHHEE FFIINNAANNCCIIAALL SSTTAATTEEMMEENNTTSS FFoorr tthhee yyeeaarr eennddeedd DDeecceemmbbeerr 3311,, 22002200 (expressed in thousands of United States dollars, unless otherwise stated)
- 43 -
NOTE 5 – FINANCIAL ASSETS …continued Fair Value Measurement…continued Financial assets are allocated within the fair value hierarchy based on the lowest level input that is significant to the fair value measurement as a whole. For assets that are recognised in the financial statements on a recurring basis, the Bank determines whether transfers have occurred between Levels in the hierarchy by re-assessing categorisation (based on the lowest level input that is significant to the fair value measurement as a whole) at the end of each reporting period. Impairment of financial assets
Overview of the ECL principles The Bank records the allowance for expected credit losses for all loans and other financial assets not held at FVPL, together with loan commitments and financial guarantee contracts (all referred to as ‘financial instruments’ below). The ECL allowance is based on the credit losses expected to arise over the life of the asset (the lifetime expected credit loss or LTECL), unless there has been no significant increase in credit risk since origination, in which case, the allowance is based on the 12 months’ expected credit loss (12mECL) that represent the ECLs that result from default events on a financial instrument that are possible within the 12 months after the reporting date. Both LTECLs and 12mECLs are calculated on an individual basis. Determination of significant increase in credit risk The Bank has established a policy to perform an assessment, at the end of each reporting period, of whether a financial instrument’s credit risk has increased significantly since initial recognition, by considering the change in the risk of default occurring over the remaining life of the financial instrument. Based on the above process, the Bank groups its financial assets into Stage 1, Stage 2, Stage 3 as described below:
• Stage 1: When financial assets are first recognised, the Bank recognises an allowance based on 12mECLs. Stage 1 financial assets also include those assets where the credit risk has improved and the asset has then been reclassified from Stage 2. The 12mECL is calculated as the portion of LTECLs that represent the ECLs that result from default events on a financial instrument that are possible within the 12 months after the reporting date. The Bank calculates the 12mECL allowance based on the expectation of a default occurring in the 12 months following the reporting date. These expected 12-month default probabilities are applied to a forecast exposure at default (EAD) and multiplied by the expected loss given default (LGD) and discounted by an approximation to the original EIR. This calculation is made for each of three scenarios, as explained below.
• Stage 2: When a loan has shown a significant increase in credit risk since origination, the Bank records an allowance for the LTECLs. These also include assets for which the credit risk has improved and the loan has been reclassified from Stage 3. The mechanics are similar to those outlined above for Stage 1, including the use of multiple scenarios, but PDs and LGDs are estimated over the lifetime of the instrument. The expected cash shortfalls are discounted by an approximation to the original EIR.

131
CARIBBEAN DEVELOPMENT BANK ANNUAL REPORT 2020
128 129
CARIBBEAN DEVELOPMENT BANK ANNUAL REPORT 2020 CARIBBEAN DEVELOPMENT BANK ANNUAL REPORT 2020
CCAARRIIBBBBEEAANN DDEEVVEELLOOPPMMEENNTT BBAANNKK OORRDDIINNAARRYY CCAAPPIITTAALL RREESSOOUURRCCEESS NNOOTTEESS TTOO TTHHEE FFIINNAANNCCIIAALL SSTTAATTEEMMEENNTTSS FFoorr tthhee yyeeaarr eennddeedd DDeecceemmbbeerr 3311,, 22002200 (expressed in thousands of United States dollars, unless otherwise stated)
- 42 -
NOTE 5 – FINANCIAL ASSETS …continued Subsequent measurement…continued
Debt securities The Bank classifies its debt securities at FVOCI when both of the following conditions are met:
• The instrument is held within a business model, the objective of which is achieved by both collecting contractual cash flows and selling financial assets.
• The contractual terms of the financial asset meet the SPPI test.
FVOCI debt instruments are subsequently measured at fair value with gains and losses arising due to changes in fair value recognised in OCI. Interest income and foreign exchange gains and losses are recognised in profit or loss in the same manner as for financial assets measured at amortised cost. The ECL calculation for Debt securities at FVOCI is explained below. Where the Bank holds more than one investment in the same security, they are deemed to be disposed of on a first–in first–out basis. On derecognition, cumulative gains or losses previously recognised in OCI are reclassified from OCI to profit or loss.
Derivatives recorded at fair value through profit or loss The Bank’s derivatives are classified at FVPL. The Bank enters into interest rate swaps and/or cross currency swaps with various counterparties and in accordance with approved policy. Derivatives are recorded at fair value and carried as assets when their fair value is positive and as liabilities when their fair value is negative. The notional amount and fair value of such derivatives are disclosed in Note 14. Changes in the fair value of derivatives are carried in the statement of financial position at fair value with net changes in fair value presented as ‘Derivative fair value adjustments’ in the statement of comprehensive income in the period during which they arise. Income and expenditures related to derivative financial instruments are shown as ‘Net interest income from derivatives’ in Note 22 (b) and are included in ‘Interest expense and similar charges’ in the statement of comprehensive income. Fair Value Measurement Fair value related disclosures for financial instruments and non-financial assets that are measured at fair value or those for which only fair values are disclosed, are itemised in Note 3 – Risk Management – “Fair value of financial assets and liabilities”. For financial instruments traded in active markets, the determination of fair value is the price that would be received to sell an asset in an orderly transaction between market participants at the measurement date. The fair value measurement is based on the presumption that the transaction to sell the asset takes place either in the principal market for the asset or in the absence of a principal market, in the most advantageous market for the asset or liability. The principal or most advantageous market must be accessible to the Bank. The fair value of an asset is measured using the assumptions that market participants would use when pricing the asset assuming that the market participants are acting in their economic best interest. The Bank uses widely recognised valuation models for determining fair values of non-standardised financial instruments for which the inputs into models are generally market observable. Models are also used to determine the fair value of financial instruments that are not quoted in active markets. All models are calibrated to ensure that outputs reflect actual data and comparative market prices. To the extent practical, models use only observable data; however, consideration of inputs such as credit risks, liquidity risks, volatilities and correlations require the inclusion of estimates by management. Changes in assumptions about these factors could affect the reported fair value of financial instruments.
CCAARRIIBBBBEEAANN DDEEVVEELLOOPPMMEENNTT BBAANNKK OORRDDIINNAARRYY CCAAPPIITTAALL RREESSOOUURRCCEESS NNOOTTEESS TTOO TTHHEE FFIINNAANNCCIIAALL SSTTAATTEEMMEENNTTSS FFoorr tthhee yyeeaarr eennddeedd DDeecceemmbbeerr 3311,, 22002200 (expressed in thousands of United States dollars, unless otherwise stated)
- 43 -
NOTE 5 – FINANCIAL ASSETS …continued Fair Value Measurement…continued Financial assets are allocated within the fair value hierarchy based on the lowest level input that is significant to the fair value measurement as a whole. For assets that are recognised in the financial statements on a recurring basis, the Bank determines whether transfers have occurred between Levels in the hierarchy by re-assessing categorisation (based on the lowest level input that is significant to the fair value measurement as a whole) at the end of each reporting period. Impairment of financial assets
Overview of the ECL principles The Bank records the allowance for expected credit losses for all loans and other financial assets not held at FVPL, together with loan commitments and financial guarantee contracts (all referred to as ‘financial instruments’ below). The ECL allowance is based on the credit losses expected to arise over the life of the asset (the lifetime expected credit loss or LTECL), unless there has been no significant increase in credit risk since origination, in which case, the allowance is based on the 12 months’ expected credit loss (12mECL) that represent the ECLs that result from default events on a financial instrument that are possible within the 12 months after the reporting date. Both LTECLs and 12mECLs are calculated on an individual basis. Determination of significant increase in credit risk The Bank has established a policy to perform an assessment, at the end of each reporting period, of whether a financial instrument’s credit risk has increased significantly since initial recognition, by considering the change in the risk of default occurring over the remaining life of the financial instrument. Based on the above process, the Bank groups its financial assets into Stage 1, Stage 2, Stage 3 as described below:
• Stage 1: When financial assets are first recognised, the Bank recognises an allowance based on 12mECLs. Stage 1 financial assets also include those assets where the credit risk has improved and the asset has then been reclassified from Stage 2. The 12mECL is calculated as the portion of LTECLs that represent the ECLs that result from default events on a financial instrument that are possible within the 12 months after the reporting date. The Bank calculates the 12mECL allowance based on the expectation of a default occurring in the 12 months following the reporting date. These expected 12-month default probabilities are applied to a forecast exposure at default (EAD) and multiplied by the expected loss given default (LGD) and discounted by an approximation to the original EIR. This calculation is made for each of three scenarios, as explained below.
• Stage 2: When a loan has shown a significant increase in credit risk since origination, the Bank records an allowance for the LTECLs. These also include assets for which the credit risk has improved and the loan has been reclassified from Stage 3. The mechanics are similar to those outlined above for Stage 1, including the use of multiple scenarios, but PDs and LGDs are estimated over the lifetime of the instrument. The expected cash shortfalls are discounted by an approximation to the original EIR.

132
CARIBBEAN DEVELOPMENT BANK ANNUAL REPORT 2020
130 131
CARIBBEAN DEVELOPMENT BANK ANNUAL REPORT 2020 CARIBBEAN DEVELOPMENT BANK ANNUAL REPORT 2020
CCAARRIIBBBBEEAANN DDEEVVEELLOOPPMMEENNTT BBAANNKK OORRDDIINNAARRYY CCAAPPIITTAALL RREESSOOUURRCCEESS NNOOTTEESS TTOO TTHHEE FFIINNAANNCCIIAALL SSTTAATTEEMMEENNTTSS FFoorr tthhee yyeeaarr eennddeedd DDeecceemmbbeerr 3311,, 22002200 (expressed in thousands of United States dollars, unless otherwise stated)
- 44 -
NOTE 5 – FINANCIAL ASSETS …continued Impairment of financial assets…continued
• Stage 3: For loans considered credit-impaired the Bank recognises the lifetime expected credit losses for these loans. The method is similar to that for Stage 2 assets, with the probability of default [PD] set at 100%.
The calculation of ECLs The Bank calculates ECLs based on three probability-weighted scenarios to measure the expected cash shortfalls, discounted at an approximation to the EIR. A cash shortfall is the difference between the cash flows that are due to an entity in accordance with the contract and the cash flows that the entity expects to receive. The three probability weighted scenarios comprise a base case, an optimistic scenario and a pessimistic scenario each of which is associated with different PDs, Exposure at Default [EAD]s and Loss given default [LGD]s. The maximum period for which the credit losses are determined is the contractual life of a financial instrument unless the Bank has the legal right to call it earlier. The mechanics of the ECL calculations are outlined below:
• PD - The Probability of Default is an estimate of the likelihood of default over a given time horizon. A default may only happen at a certain time over the assessed period, if the facility has not been previously derecognised and is still in the portfolio.
• EAD - The Exposure at Default is an estimate of the exposure at a future default date, taking into account expected changes in the exposure after the reporting date, including repayments of principal and interest, whether scheduled by contract or otherwise, expected drawdowns on committed facilities, and accrued interest from missed payments.
• LGD - The Loss Given Default is an estimate of the loss arising in the case where a default occurs at a given time. It is based on the difference between the contractual cash flows due and those that the lender would expect to receive, including from the realisation of any collateral. It is usually expressed as a percentage of the EAD.
• PCT factor – The Preferred Creditor Treatment (PCT) factor is calculated as a mitigation of the total ECL computed in accordance with the standard formula, to reflect the status of the Bank as a preferred creditor by its sovereign borrowers. PCT treatment includes the obligation to meet the payments of all sovereign debts in full and on time, no re-negotiation or “hair-cuts” on outstanding amounts and the role of the Bank as a lender of last resort which rests in large part on the respect of PCT treatment to all institutions similar to the Bank.
Impairment losses and releases are accounted for and disclosed separately from modification losses or gains. The inputs and models used for calculating ECLs may not always capture all characteristics of the market, counterparties or business model at the date of the financial statements. To reflect this, adjustments or overlays are occasionally made when such differences are significantly material. This includes taking into account the Bank’s preferred creditor treatment (PCT) afforded by its borrowing members as well as forward looking information. Loans outstanding, receivables from members and receivables
The amount of the provision is the difference between the assets’ carrying value and the present value of expected cash flows including amounts recoverable from guarantees and collateral, discounted at the financial asset’s original effective interest rate. The carrying amount of the asset is reduced through the use of an allowance account and the amount of the loss is recognised in the statement of comprehensive income.
CCAARRIIBBBBEEAANN DDEEVVEELLOOPPMMEENNTT BBAANNKK OORRDDIINNAARRYY CCAAPPIITTAALL RREESSOOUURRCCEESS NNOOTTEESS TTOO TTHHEE FFIINNAANNCCIIAALL SSTTAATTEEMMEENNTTSS FFoorr tthhee yyeeaarr eennddeedd DDeecceemmbbeerr 3311,, 22002200 (expressed in thousands of United States dollars, unless otherwise stated)
- 45 -
NOTE 5 – FINANCIAL ASSETS …continued Impairment of financial assets…continued Debt instruments measured at fair value through OCI The ECLs for debt instruments measured at FVOCI do not reduce the carrying amount of these financial assets in the statement of financial position, which remains at fair value. Instead, an amount equal to the allowance that would arise if the assets were measured at amortised cost is recognised in OCI as an accumulated impairment amount, with a corresponding charge to the statement of comprehensive income. The accumulated loss recognised in OCI is recycled to the profit and loss upon derecognition of the assets. Forward looking information In its ECL models, the Bank relies on a broad range of forward-looking information as economic and financial inputs, more especially for its sovereign borrowers, such as:
• GDP growth projections • Unemployment rate trends • Debt profiles, debt management and projected levels • Foreign exchange reserves outlook • Political and social stability • Growth trends in significant economic sectors • External evaluation reports such as those of other IFIs such as the World Bank, IMF and internationally
recognised credit rating agencies The inputs and models used for calculating ECLs may not always capture all characteristics of the market and economy at the date of the financial statements. To reflect this, qualitative adjustments or overlays are occasionally made as temporary adjustments when such differences are significantly material. Definition of default and cure The Bank considers a loan defaulted and therefore Stage 3 (credit-impaired) for ECL calculations in all cases when the borrower becomes 180 days past due in the case of sovereign borrowers and 90 days past due in the case of non-sovereign on their contractual payments. Members receivables are considered defaulted when the payments are 180 days past due. Debt securities and other receivables are considered defaulted when the contractual payments are 90 days past due. As a part of a qualitative assessment of whether a sovereign or non-sovereign borrower is in default, the Bank also considers a variety of instances that may indicate inability to pay so as to determine whether the event should result in treating the customer as defaulted and therefore assessed as Stage 3 for ECL calculations or whether Stage 2 is appropriate. Such events (only some of which will be applicable to each type of borrower), include:
• External and Internal credit rating of the borrower • Prognosis of economic performance • Debt restructuring, consolidations or defaults to lenders • The borrower requesting emergency funding from the Bank or other sources • The borrower entering into a structured economic programme with other MDBs • The borrower having past due liabilities to public creditors or employees • A covenant breach not waived by the Bank • Breach of the Bank’s preferred creditor treatment
133
CARIBBEAN DEVELOPMENT BANK ANNUAL REPORT 2020
130 131
CARIBBEAN DEVELOPMENT BANK ANNUAL REPORT 2020 CARIBBEAN DEVELOPMENT BANK ANNUAL REPORT 2020
CCAARRIIBBBBEEAANN DDEEVVEELLOOPPMMEENNTT BBAANNKK OORRDDIINNAARRYY CCAAPPIITTAALL RREESSOOUURRCCEESS NNOOTTEESS TTOO TTHHEE FFIINNAANNCCIIAALL SSTTAATTEEMMEENNTTSS FFoorr tthhee yyeeaarr eennddeedd DDeecceemmbbeerr 3311,, 22002200 (expressed in thousands of United States dollars, unless otherwise stated)
- 44 -
NOTE 5 – FINANCIAL ASSETS …continued Impairment of financial assets…continued
• Stage 3: For loans considered credit-impaired the Bank recognises the lifetime expected credit losses for these loans. The method is similar to that for Stage 2 assets, with the probability of default [PD] set at 100%.
The calculation of ECLs The Bank calculates ECLs based on three probability-weighted scenarios to measure the expected cash shortfalls, discounted at an approximation to the EIR. A cash shortfall is the difference between the cash flows that are due to an entity in accordance with the contract and the cash flows that the entity expects to receive. The three probability weighted scenarios comprise a base case, an optimistic scenario and a pessimistic scenario each of which is associated with different PDs, Exposure at Default [EAD]s and Loss given default [LGD]s. The maximum period for which the credit losses are determined is the contractual life of a financial instrument unless the Bank has the legal right to call it earlier. The mechanics of the ECL calculations are outlined below:
• PD - The Probability of Default is an estimate of the likelihood of default over a given time horizon. A default may only happen at a certain time over the assessed period, if the facility has not been previously derecognised and is still in the portfolio.
• EAD - The Exposure at Default is an estimate of the exposure at a future default date, taking into account expected changes in the exposure after the reporting date, including repayments of principal and interest, whether scheduled by contract or otherwise, expected drawdowns on committed facilities, and accrued interest from missed payments.
• LGD - The Loss Given Default is an estimate of the loss arising in the case where a default occurs at a given time. It is based on the difference between the contractual cash flows due and those that the lender would expect to receive, including from the realisation of any collateral. It is usually expressed as a percentage of the EAD.
• PCT factor – The Preferred Creditor Treatment (PCT) factor is calculated as a mitigation of the total ECL computed in accordance with the standard formula, to reflect the status of the Bank as a preferred creditor by its sovereign borrowers. PCT treatment includes the obligation to meet the payments of all sovereign debts in full and on time, no re-negotiation or “hair-cuts” on outstanding amounts and the role of the Bank as a lender of last resort which rests in large part on the respect of PCT treatment to all institutions similar to the Bank.
Impairment losses and releases are accounted for and disclosed separately from modification losses or gains. The inputs and models used for calculating ECLs may not always capture all characteristics of the market, counterparties or business model at the date of the financial statements. To reflect this, adjustments or overlays are occasionally made when such differences are significantly material. This includes taking into account the Bank’s preferred creditor treatment (PCT) afforded by its borrowing members as well as forward looking information. Loans outstanding, receivables from members and receivables
The amount of the provision is the difference between the assets’ carrying value and the present value of expected cash flows including amounts recoverable from guarantees and collateral, discounted at the financial asset’s original effective interest rate. The carrying amount of the asset is reduced through the use of an allowance account and the amount of the loss is recognised in the statement of comprehensive income.
CCAARRIIBBBBEEAANN DDEEVVEELLOOPPMMEENNTT BBAANNKK OORRDDIINNAARRYY CCAAPPIITTAALL RREESSOOUURRCCEESS NNOOTTEESS TTOO TTHHEE FFIINNAANNCCIIAALL SSTTAATTEEMMEENNTTSS FFoorr tthhee yyeeaarr eennddeedd DDeecceemmbbeerr 3311,, 22002200 (expressed in thousands of United States dollars, unless otherwise stated)
- 45 -
NOTE 5 – FINANCIAL ASSETS …continued Impairment of financial assets…continued Debt instruments measured at fair value through OCI The ECLs for debt instruments measured at FVOCI do not reduce the carrying amount of these financial assets in the statement of financial position, which remains at fair value. Instead, an amount equal to the allowance that would arise if the assets were measured at amortised cost is recognised in OCI as an accumulated impairment amount, with a corresponding charge to the statement of comprehensive income. The accumulated loss recognised in OCI is recycled to the profit and loss upon derecognition of the assets. Forward looking information In its ECL models, the Bank relies on a broad range of forward-looking information as economic and financial inputs, more especially for its sovereign borrowers, such as:
• GDP growth projections • Unemployment rate trends • Debt profiles, debt management and projected levels • Foreign exchange reserves outlook • Political and social stability • Growth trends in significant economic sectors • External evaluation reports such as those of other IFIs such as the World Bank, IMF and internationally
recognised credit rating agencies The inputs and models used for calculating ECLs may not always capture all characteristics of the market and economy at the date of the financial statements. To reflect this, qualitative adjustments or overlays are occasionally made as temporary adjustments when such differences are significantly material. Definition of default and cure The Bank considers a loan defaulted and therefore Stage 3 (credit-impaired) for ECL calculations in all cases when the borrower becomes 180 days past due in the case of sovereign borrowers and 90 days past due in the case of non-sovereign on their contractual payments. Members receivables are considered defaulted when the payments are 180 days past due. Debt securities and other receivables are considered defaulted when the contractual payments are 90 days past due. As a part of a qualitative assessment of whether a sovereign or non-sovereign borrower is in default, the Bank also considers a variety of instances that may indicate inability to pay so as to determine whether the event should result in treating the customer as defaulted and therefore assessed as Stage 3 for ECL calculations or whether Stage 2 is appropriate. Such events (only some of which will be applicable to each type of borrower), include:
• External and Internal credit rating of the borrower • Prognosis of economic performance • Debt restructuring, consolidations or defaults to lenders • The borrower requesting emergency funding from the Bank or other sources • The borrower entering into a structured economic programme with other MDBs • The borrower having past due liabilities to public creditors or employees • A covenant breach not waived by the Bank • Breach of the Bank’s preferred creditor treatment

134
CARIBBEAN DEVELOPMENT BANK ANNUAL REPORT 2020
132 133
CARIBBEAN DEVELOPMENT BANK ANNUAL REPORT 2020 CARIBBEAN DEVELOPMENT BANK ANNUAL REPORT 2020
CCAARRIIBBBBEEAANN DDEEVVEELLOOPPMMEENNTT BBAANNKK OORRDDIINNAARRYY CCAAPPIITTAALL RREESSOOUURRCCEESS NNOOTTEESS TTOO TTHHEE FFIINNAANNCCIIAALL SSTTAATTEEMMEENNTTSS FFoorr tthhee yyeeaarr eennddeedd DDeecceemmbbeerr 3311,, 22002200 (expressed in thousands of United States dollars, unless otherwise stated)
- 46 -
NOTE 5 – FINANCIAL ASSETS …continued Impairment of financial assets…continued Definition of default and cure…continued
• The debtor (or any legal entity within the debtor’s group) filing for bankruptcy application/protection • Debtor’s listed debt or equity suspended at the primary exchange because of indicators or facts about
financial difficulties. It is the Bank’s policy to consider a financial instrument as ‘cured’ and therefore re-classified out of Stage 3, when none of the default criteria have been present for at least six consecutive months in the case of sovereign loans. In the case of non-sovereign loans and other financial assets the assessment period would be at least for a minimum period of one year. The decision whether to classify an asset as Stage 2 or Stage 1 once cured depends on the updated economic and financial performance at the time of the cure, and whether this indicates there has been a significant increase in credit risk compared to initial recognition. Write-offs The Bank does not write-off, renegotiate or take “haircuts” on its sovereign loans in accordance with its business model, polices and its legal status. Financial assets of a non-sovereign nature are written off either partially or in their entirety only when the Bank has stopped pursuing the recovery. If the amount to be written off is greater than the accumulated loss allowance, the difference is first treated as an addition to the allowance that is then applied against the gross carrying amount. Any subsequent recoveries are credited to credit loss expense. The Bank’s internal rating and PD estimation process The Bank’s ORM operates its internal rating models. The models incorporate both qualitative and quantitative information and, in addition to information specific to the borrower, utilise supplemental external information that could affect the borrower’s behaviour. Where practical, they also build on information from external rating agency action and information. These information sources are first used to determine the PDs within the Bank’s Basel III framework. The internal credit grades are assigned based on these Basel III grades. PDs are then adjusted to incorporate forward looking information and the stage classification of the exposure. This is repeated for each economic scenario as appropriate. Sovereign loans Due to the nature of its borrowers and guarantors and relevant aspects of the Bank’s business model, management expects that all of its sovereign and sovereign guaranteed loans will be repaid in full. The OCR has had a fully performing sovereign and sovereign guaranteed loan portfolio since its inception in 1970. Recognition of interest income on written-off loans Once a financial asset or a group of financial assets has been written down as a result of an impairment loss, interest income is recognised using the rate of interest used to discount the future cash flows for the purpose of measuring the impairment loss. The estimated future cash flows projected in the effective interest rate method consider all contractual terms but do not consider future credit losses that have not yet been incurred. Significant accounting judgements, estimates and assumptions The measurement of impairment losses across all categories of financial assets requires judgement, in particular, the estimation of the amount and timing of future cash flows and collateral values when determining impairment losses as well as the assessment of a significant increase in credit risk. These estimates are driven by a number of factors, changes in which can result in different allowance amounts.
CCAARRIIBBBBEEAANN DDEEVVEELLOOPPMMEENNTT BBAANNKK OORRDDIINNAARRYY CCAAPPIITTAALL RREESSOOUURRCCEESS NNOOTTEESS TTOO TTHHEE FFIINNAANNCCIIAALL SSTTAATTEEMMEENNTTSS FFoorr tthhee yyeeaarr eennddeedd DDeecceemmbbeerr 3311,, 22002200 (expressed in thousands of United States dollars, unless otherwise stated)
- 47 -
NOTE 5 – FINANCIAL ASSETS…continued
Impairment of financial assets…continued The Bank’s Expected Credit Loss (ECL) calculations are outputs of complex models with a number of underlying assumptions regarding the choice of variable inputs and their interdependencies. Elements of the ECL models that are considered accounting judgements and estimates include: • The Bank’s internal credit rating model, which assigns Probabilities of Default (PDs) to the individual ratings; • The Bank’s criteria for assessing if there has been a significant increase in credit risk and so allowances for
financial assets should be measured on a Lifetime ECL basis and the associated qualitative assessment; • Utilisation of appropriately tested ECL models, including the various formulas and the choice of inputs; • Determination of associations between macroeconomic scenarios and, economic inputs and the effect on
PDs, Exposure at Default (EADs) and Losses given Default (LGDs); • Selection of forward-looking macroeconomic scenarios and their probability weightings to derive the
economic inputs into the ECL models; • Evaluation of the impact of unique mitigating factors against credit losses based on the nature of the Bank,
its ownership, borrowers and its preferred creditor status. • Determination of the mitigating factor for the Bank’s PCT status Collateral valuation To mitigate its credit risks in its non-sovereign portfolio the Bank seeks to use collateral to secure or further secure its loans primarily in non-interest-bearing cash deposits and charges against trade assets in the non-sovereign portfolio. Non-cash collateral, unless repossessed, is not recorded on the Bank’s statement of financial position. However, the fair value of collateral affects the calculation of ECLs. It is generally assessed, at a minimum, at inception and re-assessed annually. The Bank held cash collateral with respect to two non-sovereign borrowers amounting to $3.2 million (2019: $2.3 million). Renegotiated loans It is the Bank’s policy not to renegotiate sovereign loans. In respect of its non-sovereign portfolio the Bank seeks to restructure loans in preference to taking possession of collateral. This may involve extending the payment arrangements and the agreement of new loan conditions. Once terms have been renegotiated any impairment is measured using the original effective interest rate as calculated before the modification of terms and the loan is no longer considered past due. There are no renegotiated loans in the Bank’s portfolio. De-recognition A financial asset (or, where applicable, a part of a financial asset or part of a group of similar financial assets) is primarily de-recognised (i.e., removed from the statement of financial position) when: (i) The rights to receive cash flows from the asset have expired; or (ii) The Bank has transferred its rights to receive cash flows from the asset or has assumed an obligation to pay
the received cash flows in full without material delay to a third party under a ‘pass-through’ arrangement; and either:
(a) the Bank has transferred substantially all the risks and rewards of the asset; or (b) the Bank has neither transferred nor retained substantially all the risks and rewards of the asset but has
transferred control of the asset.

135
CARIBBEAN DEVELOPMENT BANK ANNUAL REPORT 2020
132 133
CARIBBEAN DEVELOPMENT BANK ANNUAL REPORT 2020 CARIBBEAN DEVELOPMENT BANK ANNUAL REPORT 2020
CCAARRIIBBBBEEAANN DDEEVVEELLOOPPMMEENNTT BBAANNKK OORRDDIINNAARRYY CCAAPPIITTAALL RREESSOOUURRCCEESS NNOOTTEESS TTOO TTHHEE FFIINNAANNCCIIAALL SSTTAATTEEMMEENNTTSS FFoorr tthhee yyeeaarr eennddeedd DDeecceemmbbeerr 3311,, 22002200 (expressed in thousands of United States dollars, unless otherwise stated)
- 46 -
NOTE 5 – FINANCIAL ASSETS …continued Impairment of financial assets…continued Definition of default and cure…continued
• The debtor (or any legal entity within the debtor’s group) filing for bankruptcy application/protection • Debtor’s listed debt or equity suspended at the primary exchange because of indicators or facts about
financial difficulties. It is the Bank’s policy to consider a financial instrument as ‘cured’ and therefore re-classified out of Stage 3, when none of the default criteria have been present for at least six consecutive months in the case of sovereign loans. In the case of non-sovereign loans and other financial assets the assessment period would be at least for a minimum period of one year. The decision whether to classify an asset as Stage 2 or Stage 1 once cured depends on the updated economic and financial performance at the time of the cure, and whether this indicates there has been a significant increase in credit risk compared to initial recognition. Write-offs The Bank does not write-off, renegotiate or take “haircuts” on its sovereign loans in accordance with its business model, polices and its legal status. Financial assets of a non-sovereign nature are written off either partially or in their entirety only when the Bank has stopped pursuing the recovery. If the amount to be written off is greater than the accumulated loss allowance, the difference is first treated as an addition to the allowance that is then applied against the gross carrying amount. Any subsequent recoveries are credited to credit loss expense. The Bank’s internal rating and PD estimation process The Bank’s ORM operates its internal rating models. The models incorporate both qualitative and quantitative information and, in addition to information specific to the borrower, utilise supplemental external information that could affect the borrower’s behaviour. Where practical, they also build on information from external rating agency action and information. These information sources are first used to determine the PDs within the Bank’s Basel III framework. The internal credit grades are assigned based on these Basel III grades. PDs are then adjusted to incorporate forward looking information and the stage classification of the exposure. This is repeated for each economic scenario as appropriate. Sovereign loans Due to the nature of its borrowers and guarantors and relevant aspects of the Bank’s business model, management expects that all of its sovereign and sovereign guaranteed loans will be repaid in full. The OCR has had a fully performing sovereign and sovereign guaranteed loan portfolio since its inception in 1970. Recognition of interest income on written-off loans Once a financial asset or a group of financial assets has been written down as a result of an impairment loss, interest income is recognised using the rate of interest used to discount the future cash flows for the purpose of measuring the impairment loss. The estimated future cash flows projected in the effective interest rate method consider all contractual terms but do not consider future credit losses that have not yet been incurred. Significant accounting judgements, estimates and assumptions The measurement of impairment losses across all categories of financial assets requires judgement, in particular, the estimation of the amount and timing of future cash flows and collateral values when determining impairment losses as well as the assessment of a significant increase in credit risk. These estimates are driven by a number of factors, changes in which can result in different allowance amounts.
CCAARRIIBBBBEEAANN DDEEVVEELLOOPPMMEENNTT BBAANNKK OORRDDIINNAARRYY CCAAPPIITTAALL RREESSOOUURRCCEESS NNOOTTEESS TTOO TTHHEE FFIINNAANNCCIIAALL SSTTAATTEEMMEENNTTSS FFoorr tthhee yyeeaarr eennddeedd DDeecceemmbbeerr 3311,, 22002200 (expressed in thousands of United States dollars, unless otherwise stated)
- 47 -
NOTE 5 – FINANCIAL ASSETS…continued
Impairment of financial assets…continued The Bank’s Expected Credit Loss (ECL) calculations are outputs of complex models with a number of underlying assumptions regarding the choice of variable inputs and their interdependencies. Elements of the ECL models that are considered accounting judgements and estimates include: • The Bank’s internal credit rating model, which assigns Probabilities of Default (PDs) to the individual ratings; • The Bank’s criteria for assessing if there has been a significant increase in credit risk and so allowances for
financial assets should be measured on a Lifetime ECL basis and the associated qualitative assessment; • Utilisation of appropriately tested ECL models, including the various formulas and the choice of inputs; • Determination of associations between macroeconomic scenarios and, economic inputs and the effect on
PDs, Exposure at Default (EADs) and Losses given Default (LGDs); • Selection of forward-looking macroeconomic scenarios and their probability weightings to derive the
economic inputs into the ECL models; • Evaluation of the impact of unique mitigating factors against credit losses based on the nature of the Bank,
its ownership, borrowers and its preferred creditor status. • Determination of the mitigating factor for the Bank’s PCT status Collateral valuation To mitigate its credit risks in its non-sovereign portfolio the Bank seeks to use collateral to secure or further secure its loans primarily in non-interest-bearing cash deposits and charges against trade assets in the non-sovereign portfolio. Non-cash collateral, unless repossessed, is not recorded on the Bank’s statement of financial position. However, the fair value of collateral affects the calculation of ECLs. It is generally assessed, at a minimum, at inception and re-assessed annually. The Bank held cash collateral with respect to two non-sovereign borrowers amounting to $3.2 million (2019: $2.3 million). Renegotiated loans It is the Bank’s policy not to renegotiate sovereign loans. In respect of its non-sovereign portfolio the Bank seeks to restructure loans in preference to taking possession of collateral. This may involve extending the payment arrangements and the agreement of new loan conditions. Once terms have been renegotiated any impairment is measured using the original effective interest rate as calculated before the modification of terms and the loan is no longer considered past due. There are no renegotiated loans in the Bank’s portfolio. De-recognition A financial asset (or, where applicable, a part of a financial asset or part of a group of similar financial assets) is primarily de-recognised (i.e., removed from the statement of financial position) when: (i) The rights to receive cash flows from the asset have expired; or (ii) The Bank has transferred its rights to receive cash flows from the asset or has assumed an obligation to pay
the received cash flows in full without material delay to a third party under a ‘pass-through’ arrangement; and either:
(a) the Bank has transferred substantially all the risks and rewards of the asset; or (b) the Bank has neither transferred nor retained substantially all the risks and rewards of the asset but has
transferred control of the asset.
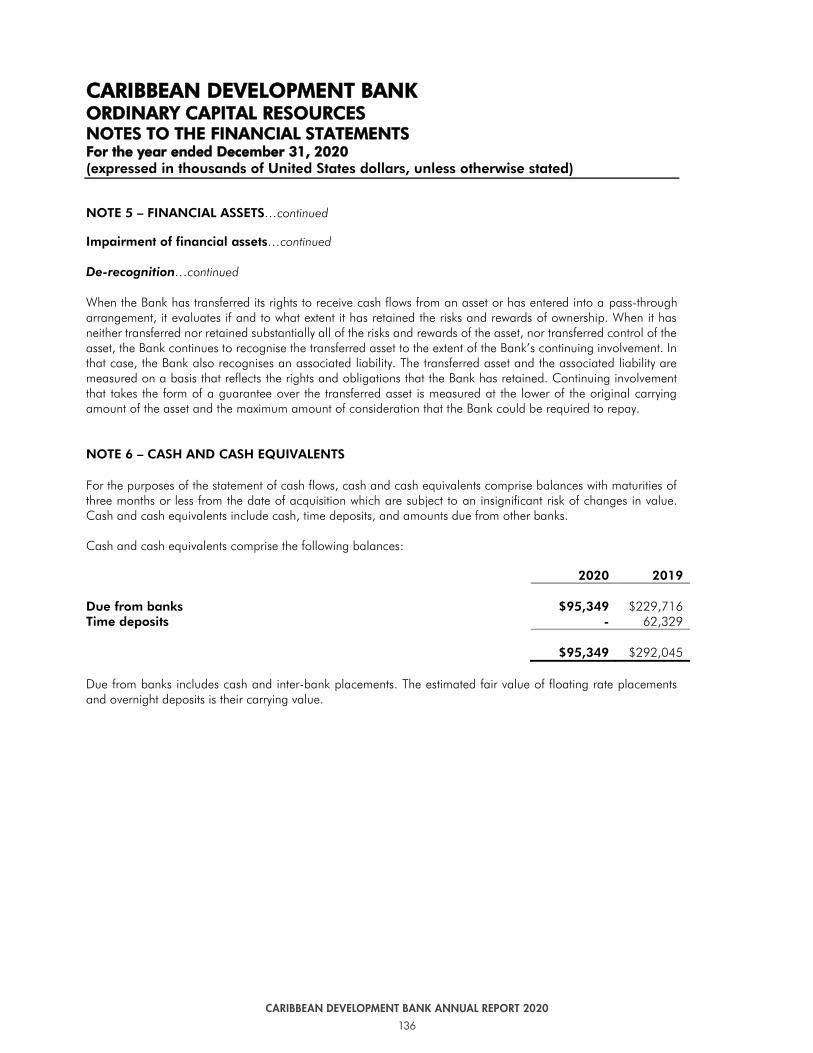
136
CARIBBEAN DEVELOPMENT BANK ANNUAL REPORT 2020
134 135
CARIBBEAN DEVELOPMENT BANK ANNUAL REPORT 2020 CARIBBEAN DEVELOPMENT BANK ANNUAL REPORT 2020
CCAARRIIBBBBEEAANN DDEEVVEELLOOPPMMEENNTT BBAANNKK OORRDDIINNAARRYY CCAAPPIITTAALL RREESSOOUURRCCEESS NNOOTTEESS TTOO TTHHEE FFIINNAANNCCIIAALL SSTTAATTEEMMEENNTTSS FFoorr tthhee yyeeaarr eennddeedd DDeecceemmbbeerr 3311,, 22002200 (expressed in thousands of United States dollars, unless otherwise stated)
- 48 -
NOTE 5 – FINANCIAL ASSETS…continued Impairment of financial assets…continued De-recognition…continued When the Bank has transferred its rights to receive cash flows from an asset or has entered into a pass-through arrangement, it evaluates if and to what extent it has retained the risks and rewards of ownership. When it has neither transferred nor retained substantially all of the risks and rewards of the asset, nor transferred control of the asset, the Bank continues to recognise the transferred asset to the extent of the Bank’s continuing involvement. In that case, the Bank also recognises an associated liability. The transferred asset and the associated liability are measured on a basis that reflects the rights and obligations that the Bank has retained. Continuing involvement that takes the form of a guarantee over the transferred asset is measured at the lower of the original carrying amount of the asset and the maximum amount of consideration that the Bank could be required to repay. NOTE 6 – CASH AND CASH EQUIVALENTS For the purposes of the statement of cash flows, cash and cash equivalents comprise balances with maturities of three months or less from the date of acquisition which are subject to an insignificant risk of changes in value. Cash and cash equivalents include cash and time deposits and other eligible bills, amounts due from other banks and short-term government securities. Cash and cash equivalents comprise the following balances: 2020 2019
Due from banks $95,349 $229,716 Time deposits - 62,329
$95,349 $292,045
Due from banks includes cash and inter-bank placements. The estimated fair value of floating rate placements and overnight deposits is their carrying value.
CCAARRIIBBBBEEAANN DDEEVVEELLOOPPMMEENNTT BBAANNKK OORRDDIINNAARRYY CCAAPPIITTAALL RREESSOOUURRCCEESS NNOOTTEESS TTOO TTHHEE FFIINNAANNCCIIAALL SSTTAATTEEMMEENNTTSS FFoorr tthhee yyeeaarr eennddeedd DDeecceemmbbeerr 3311,, 22002200 (expressed in thousands of United States dollars, unless otherwise stated)
- 49 -
NOTE 7 – DEBT SECURITIES AT FAIR VALUE THROUGH OTHER COMPREHENSIVE INCOME
The accounting policy is as defined in Note 5. (a) A summary of the Bank’s debt securities at fair value through other comprehensive income as at
December 31, 2020 is as follows:
1/ Freely convertible currencies in Government and Government-guaranteed obligations which are members of the G7 or EU and its agencies.
The ECL computed for debt securities at FVOCI was $18 as at December 31, 2020 (2019: nil). (b) A maturity analysis of debt securities at fair value through other comprehensive income as at December 31
is as follows:
2020 2019
Current $88,347 $181,718 Non-current 449,639 240,420
$537,986 $422,138
2020
USD CAD Other Total December 31 Obligations guaranteed by Governments1 $307,148 $$-- $$-- $307,148 Multilateral organisations 80,322 4,043 - 84,365 Corporations 145,711 - - 145,711 Time deposits - - 762 762
$533,181 $4,043 $762 $537,986
2019 USD CAD Other Total
December 31 Obligations guaranteed by Governments1 $230,527 $2,590 $- $233,117 Multilateral organisations 110,097 1,079 - 111,176 Corporations 77,085 - - 77,085 Time deposits - - 760 760
$417,709 $3,669 $760 $422,138
CCAARRIIBBBBEEAANN DDEEVVEELLOOPPMMEENNTT BBAANNKK OORRDDIINNAARRYY CCAAPPIITTAALL RREESSOOUURRCCEESS NNOOTTEESS TTOO TTHHEE FFIINNAANNCCIIAALL SSTTAATTEEMMEENNTTSS FFoorr tthhee yyeeaarr eennddeedd DDeecceemmbbeerr 3311,, 22002200 (expressed in thousands of United States dollars, unless otherwise stated)
- 48 -
NOTE 5 – FINANCIAL ASSETS…continued Impairment of financial assets…continued De-recognition…continued When the Bank has transferred its rights to receive cash flows from an asset or has entered into a pass-through arrangement, it evaluates if and to what extent it has retained the risks and rewards of ownership. When it has neither transferred nor retained substantially all of the risks and rewards of the asset, nor transferred control of the asset, the Bank continues to recognise the transferred asset to the extent of the Bank’s continuing involvement. In that case, the Bank also recognises an associated liability. The transferred asset and the associated liability are measured on a basis that reflects the rights and obligations that the Bank has retained. Continuing involvement that takes the form of a guarantee over the transferred asset is measured at the lower of the original carrying amount of the asset and the maximum amount of consideration that the Bank could be required to repay. NOTE 6 – CASH AND CASH EQUIVALENTS For the purposes of the statement of cash flows, cash and cash equivalents comprise balances with maturities of three months or less from the date of acquisition which are subject to an insignificant risk of changes in value. Cash and cash equivalents include cash, time deposits, and amounts due from other banks. Cash and cash equivalents comprise the following balances: 2020 2019
Due from banks $95,349 $229,716 Time deposits - 62,329
$95,349 $292,045
Due from banks includes cash and inter-bank placements. The estimated fair value of floating rate placements and overnight deposits is their carrying value.
CCAARRIIBBBBEEAANN DDEEVVEELLOOPPMMEENNTT BBAANNKK OORRDDIINNAARRYY CCAAPPIITTAALL RREESSOOUURRCCEESS NNOOTTEESS TTOO TTHHEE FFIINNAANNCCIIAALL SSTTAATTEEMMEENNTTSS FFoorr tthhee yyeeaarr eennddeedd DDeecceemmbbeerr 3311,, 22002200 (expressed in thousands of United States dollars, unless otherwise stated)
- 49 -
NOTE 7 – DEBT SECURITIES AT FAIR VALUE THROUGH OTHER COMPREHENSIVE INCOME The accounting policy is as defined in Note 5. (a) A summary of the Bank’s debt securities at fair value through other comprehensive income as at
December 31, 2020 is as follows:
1/ Freely convertible currencies in Government and Government-guaranteed obligations which are members of the G7 or EU and its agencies.
The ECL computed for debt securities at FVOCI was $18 as at December 31, 2020 (2019: nil). (b) A maturity analysis of debt securities at fair value through other comprehensive income as at December 31
is as follows: 2020 2019
Current $88,347 $181,718 Non-current 449,639 240,420 $537,986 $422,138
2020 USD CAD Other Total
December 31 Obligations guaranteed by Governments1 $307,148 $$-- $$-- $307,148 Multilateral organisations 80,322 4,043 - 84,365 Corporations 145,711 - - 145,711 Time deposits - - 762 762 $533,181 $4,043 $762 $537,986 2019 USD CAD Other Total
December 31 Obligations guaranteed by Governments1 $230,527 $2,590 $- $233,117 Multilateral organisations 110,097 1,079 - 111,176 Corporations 77,085 - - 77,085 Time deposits - - 760 760 $417,709 $3,669 $760 $422,138

137
CARIBBEAN DEVELOPMENT BANK ANNUAL REPORT 2020
134 135
CARIBBEAN DEVELOPMENT BANK ANNUAL REPORT 2020 CARIBBEAN DEVELOPMENT BANK ANNUAL REPORT 2020
CCAARRIIBBBBEEAANN DDEEVVEELLOOPPMMEENNTT BBAANNKK OORRDDIINNAARRYY CCAAPPIITTAALL RREESSOOUURRCCEESS NNOOTTEESS TTOO TTHHEE FFIINNAANNCCIIAALL SSTTAATTEEMMEENNTTSS FFoorr tthhee yyeeaarr eennddeedd DDeecceemmbbeerr 3311,, 22002200 (expressed in thousands of United States dollars, unless otherwise stated)
- 48 -
NOTE 5 – FINANCIAL ASSETS…continued Impairment of financial assets…continued De-recognition…continued When the Bank has transferred its rights to receive cash flows from an asset or has entered into a pass-through arrangement, it evaluates if and to what extent it has retained the risks and rewards of ownership. When it has neither transferred nor retained substantially all of the risks and rewards of the asset, nor transferred control of the asset, the Bank continues to recognise the transferred asset to the extent of the Bank’s continuing involvement. In that case, the Bank also recognises an associated liability. The transferred asset and the associated liability are measured on a basis that reflects the rights and obligations that the Bank has retained. Continuing involvement that takes the form of a guarantee over the transferred asset is measured at the lower of the original carrying amount of the asset and the maximum amount of consideration that the Bank could be required to repay. NOTE 6 – CASH AND CASH EQUIVALENTS For the purposes of the statement of cash flows, cash and cash equivalents comprise balances with maturities of three months or less from the date of acquisition which are subject to an insignificant risk of changes in value. Cash and cash equivalents include cash and time deposits and other eligible bills, amounts due from other banks and short-term government securities. Cash and cash equivalents comprise the following balances: 2020 2019
Due from banks $95,349 $229,716 Time deposits - 62,329
$95,349 $292,045
Due from banks includes cash and inter-bank placements. The estimated fair value of floating rate placements and overnight deposits is their carrying value.
CCAARRIIBBBBEEAANN DDEEVVEELLOOPPMMEENNTT BBAANNKK OORRDDIINNAARRYY CCAAPPIITTAALL RREESSOOUURRCCEESS NNOOTTEESS TTOO TTHHEE FFIINNAANNCCIIAALL SSTTAATTEEMMEENNTTSS FFoorr tthhee yyeeaarr eennddeedd DDeecceemmbbeerr 3311,, 22002200 (expressed in thousands of United States dollars, unless otherwise stated)
- 49 -
NOTE 7 – DEBT SECURITIES AT FAIR VALUE THROUGH OTHER COMPREHENSIVE INCOME
The accounting policy is as defined in Note 5. (a) A summary of the Bank’s debt securities at fair value through other comprehensive income as at
December 31, 2020 is as follows:
1/ Freely convertible currencies in Government and Government-guaranteed obligations which are members of the G7 or EU and its agencies.
The ECL computed for debt securities at FVOCI was $18 as at December 31, 2020 (2019: nil). (b) A maturity analysis of debt securities at fair value through other comprehensive income as at December 31
is as follows:
2020 2019
Current $88,347 $181,718 Non-current 449,639 240,420
$537,986 $422,138
2020
USD CAD Other Total December 31 Obligations guaranteed by Governments1 $307,148 $$-- $$-- $307,148 Multilateral organisations 80,322 4,043 - 84,365 Corporations 145,711 - - 145,711 Time deposits - - 762 762
$533,181 $4,043 $762 $537,986
2019 USD CAD Other Total
December 31 Obligations guaranteed by Governments1 $230,527 $2,590 $- $233,117 Multilateral organisations 110,097 1,079 - 111,176 Corporations 77,085 - - 77,085 Time deposits - - 760 760
$417,709 $3,669 $760 $422,138
CCAARRIIBBBBEEAANN DDEEVVEELLOOPPMMEENNTT BBAANNKK OORRDDIINNAARRYY CCAAPPIITTAALL RREESSOOUURRCCEESS NNOOTTEESS TTOO TTHHEE FFIINNAANNCCIIAALL SSTTAATTEEMMEENNTTSS FFoorr tthhee yyeeaarr eennddeedd DDeecceemmbbeerr 3311,, 22002200 (expressed in thousands of United States dollars, unless otherwise stated)
- 48 -
NOTE 5 – FINANCIAL ASSETS…continued Impairment of financial assets…continued De-recognition…continued When the Bank has transferred its rights to receive cash flows from an asset or has entered into a pass-through arrangement, it evaluates if and to what extent it has retained the risks and rewards of ownership. When it has neither transferred nor retained substantially all of the risks and rewards of the asset, nor transferred control of the asset, the Bank continues to recognise the transferred asset to the extent of the Bank’s continuing involvement. In that case, the Bank also recognises an associated liability. The transferred asset and the associated liability are measured on a basis that reflects the rights and obligations that the Bank has retained. Continuing involvement that takes the form of a guarantee over the transferred asset is measured at the lower of the original carrying amount of the asset and the maximum amount of consideration that the Bank could be required to repay. NOTE 6 – CASH AND CASH EQUIVALENTS For the purposes of the statement of cash flows, cash and cash equivalents comprise balances with maturities of three months or less from the date of acquisition which are subject to an insignificant risk of changes in value. Cash and cash equivalents include cash, time deposits, and amounts due from other banks. Cash and cash equivalents comprise the following balances: 2020 2019
Due from banks $95,349 $229,716 Time deposits - 62,329
$95,349 $292,045
Due from banks includes cash and inter-bank placements. The estimated fair value of floating rate placements and overnight deposits is their carrying value.
CCAARRIIBBBBEEAANN DDEEVVEELLOOPPMMEENNTT BBAANNKK OORRDDIINNAARRYY CCAAPPIITTAALL RREESSOOUURRCCEESS NNOOTTEESS TTOO TTHHEE FFIINNAANNCCIIAALL SSTTAATTEEMMEENNTTSS FFoorr tthhee yyeeaarr eennddeedd DDeecceemmbbeerr 3311,, 22002200 (expressed in thousands of United States dollars, unless otherwise stated)
- 49 -
NOTE 7 – DEBT SECURITIES AT FAIR VALUE THROUGH OTHER COMPREHENSIVE INCOME The accounting policy is as defined in Note 5. (a) A summary of the Bank’s debt securities at fair value through other comprehensive income as at
December 31, 2020 is as follows:
1/ Freely convertible currencies in Government and Government-guaranteed obligations which are members of the G7 or EU and its agencies.
The ECL computed for debt securities at FVOCI was $18 as at December 31, 2020 (2019: nil). (b) A maturity analysis of debt securities at fair value through other comprehensive income as at December 31
is as follows: 2020 2019
Current $88,347 $181,718 Non-current 449,639 240,420 $537,986 $422,138
2020 USD CAD Other Total
December 31 Obligations guaranteed by Governments1 $307,148 $$-- $$-- $307,148 Multilateral organisations 80,322 4,043 - 84,365 Corporations 145,711 - - 145,711 Time deposits - - 762 762 $533,181 $4,043 $762 $537,986 2019 USD CAD Other Total
December 31 Obligations guaranteed by Governments1 $230,527 $2,590 $- $233,117 Multilateral organisations 110,097 1,079 - 111,176 Corporations 77,085 - - 77,085 Time deposits - - 760 760 $417,709 $3,669 $760 $422,138

138
CARIBBEAN DEVELOPMENT BANK ANNUAL REPORT 2020
136 137
CARIBBEAN DEVELOPMENT BANK ANNUAL REPORT 2020 CARIBBEAN DEVELOPMENT BANK ANNUAL REPORT 2020
CCAARRIIBBBBEEAANN DDEEVVEELLOOPPMMEENNTT BBAANNKK OORRDDIINNAARRYY CCAAPPIITTAALL RREESSOOUURRCCEESS NNOOTTEESS TTOO TTHHEE FFIINNAANNCCIIAALL SSTTAATTEEMMEENNTTSS FFoorr tthhee yyeeaarr eennddeedd DDeecceemmbbeerr 3311,, 22002200 (expressed in thousands of United States dollars, unless otherwise stated)
- 50 -
NOTE 8 – RECEIVABLES AND PREPAID ASSETS
The accounting policy for receivables is as defined at Note 5. Prepaid assets are not financial assets and are recorded as assets on the statement of financial position when cash is paid and expensed to profit and loss over the relevant contract term. Due to the short-term nature of receivables and prepaid assets, fair value is assumed to be equal to carrying value. Receivables and prepaid assets comprise the following: 2020 2019
Inter-fund receivable –– Note 27 $13,566 $5,342 Staff loans and other receivables 654 710 Value added tax receivable 1012 1,263 Institutional receivables 192 231 Prepaid assets 663 535 16,087 8,081 Allowance for ECL (545) (426) $15,542 $7,655 An assessment of the allowance for ECL as at December 31 is as follows:
Stage 1 Stage 2 Stage 3 Total
Balance as at January 1, 2019 $1 $- $426 $427 Impairment charge (Note 24) (1) 83 (83) (1) Balance as at December 31, 2019
$-
$83
$343
$426
Impairment (recovery)/charge (Note 24) 4 (83) 198 119
Balance as at December 31, 2020
$4
$-
$541
$545 NOTE 9 – CASH COLLATERAL ON DERIVATIVES
The cash collateral on derivatives is a financial asset as defined in Note 5. The Bank attempts to reduce counterparty credit exposure in derivative transactions through bilateral collateral requirements. Under these arrangements collateral is not required to be posted up to an agreed valuation threshold beyond which collateral is posted in cash by either one of the parties based on the exposure that is in excess of the credit threshold. When the Bank’s derivative is in a liability position, it posts collateral to the counterparty and records the collateral posted as an asset receivable. When the Bank’s derivative is in a receivable position, it receives collateral from the counterparty and records the collateral received as a reduction in the receivable or an increase in the liability. The Bank is party to a currency swap with Credit Suisse International AG to convert $145 million CHF to USD at a fixed exchange rate on a fixed date and to exchange a fixed interest rate of 0.297% for a floating rate based on USD Libor.
CCAARRIIBBBBEEAANN DDEEVVEELLOOPPMMEENNTT BBAANNKK OORRDDIINNAARRYY CCAAPPIITTAALL RREESSOOUURRCCEESS NNOOTTEESS TTOO TTHHEE FFIINNAANNCCIIAALL SSTTAATTEEMMEENNTTSS FFoorr tthhee yyeeaarr eennddeedd DDeecceemmbbeerr 3311,, 22002200 (expressed in thousands of United States dollars, unless otherwise stated)
- 51 -
NOTE 9 – CASH COLLATERAL ON DERIVATIVES…continued As at December 31, 2020, the collateral receivable from Credit Suisse International in respect of this cross-currency interest rate swap was nil (2019: $2,400). Interest on this account is calculated at the daily US Federal Funds rate and the amounts earned for the year was $3 (2019: $125). These arrangements form part of the Credit Support Annex (“CSA”) to the ISDA Agreement and is an integral part of the valuation of the fair value of the underlying derivatives as disclosed Note 3 – Risk Management and Note 14 – Derivative financial instruments. NOTE 10 – LOANS OUTSTANDING
Loans outstanding are financial assets as defined in Note 5.
The Bank’s loan portfolio comprises loans granted to, or guaranteed by, its BMCs and are disbursed and repaid in US Dollars. Loans are granted for a maximum period of twenty-two years, including a grace period, which typically covers the period of the project implementation and are for the purpose of financing development projects and programmes, and are not intended for sale. Interest rates are reset quarterly. The interest rate prevailing as at December 31, 2020 was 3.75% (2019: 4.80%) The estimated fair values of the loans are based on discounted cash flow models using an estimated yield curve appropriate for the remaining term to maturity. The loans are evaluated based on parameters such as interest rates, specific country risk factors and individual credit worthiness.
Collateral CDB does not take collateral on its sovereign loans. The Loans (CDB) Acts or other applicable legislation are enacted in the various BMCs and authorise the governments to raise loans from CDB or guarantee loans provided by CDB to their statutory authorities. They also provide for repayment of any loan made by CDB to the Government or to any statutory corporation, to be charged upon and paid out of the consolidated fund. CDB also derives comfort from the negative pledge condition included in its loan agreements which prohibits, except with CDB’s written consent, the charging of Government assets to secure external indebtedness unless CDB is equally and ratably secured. Furthermore, CDB continues to be accorded preferred creditor treatment (PCT) by its BMCs by which, in applicable circumstances, the Bank’s loans are not included in any debt rescheduling arrangements and defaults of its BMCs and the Bank is also given preferential access to foreign currency.
With respect to non-sovereign loans, CDB requires its commitments to be secured, the nature and extent of which is determined on a case-by-case basis. The Bank secures non-interest-bearing cash collateral against certain non-sovereign loans the amounts of which are estimated to be sufficient to maintain the loan in a current status in the event that this would become a requirement. If not utilised the amounts are refundable to the borrower upon maturity of the loan. In addition to security pledged by the borrower, the security against the non-sovereign loans, where applicable, also comprises that pledged against sub-loans (comprising loans on-lent by the borrower in accordance with terms of the original loan agreement) assigned to trusts that are managed by the borrower at no cost to CDB. The fair value of the collateral held (off-balance sheet) for the impaired non-sovereign loans was not able to be valued due to the nature of the collateral and the cost effectiveness of establishing the value of the security, being the fair value of sub-loans and the Bank’s portion of the estimated realisable value of a property. These values would not, in management’s view, be material to the financial statements.
CCAARRIIBBBBEEAANN DDEEVVEELLOOPPMMEENNTT BBAANNKK OORRDDIINNAARRYY CCAAPPIITTAALL RREESSOOUURRCCEESS NNOOTTEESS TTOO TTHHEE FFIINNAANNCCIIAALL SSTTAATTEEMMEENNTTSS FFoorr tthhee yyeeaarr eennddeedd DDeecceemmbbeerr 3311,, 22002200 (expressed in thousands of United States dollars, unless otherwise stated)
- 50 -
NOTE 8 – RECEIVABLES AND PREPAID ASSETS The accounting policy for receivables is as defined at Note 5. Prepaid assets are not financial assets and are recorded as assets on the statement of financial position when cash is paid and expensed to profit and loss over the relevant contract term. Due to the short-term nature of receivables and prepaid assets, fair value is assumed to be equal to carrying value. Receivables and prepaid assets comprise the following: 2020 2019
Inter-fund receivable –– Note 27 $13,566 $5,342 Staff loans and other receivables 654 710 Value added tax receivable 1012 1,263 Institutional receivables 192 231 Prepaid assets 663 535 16,087 8,081 Allowance for ECL (545) (426) $15,542 $7,655 An assessment of the allowance for ECL as at December 31 is as follows:
Stage 1 Stage 2 Stage 3 Total
Balance as at January 1, 2019 $1 $- $426 $427 Impairment charge (Note 24) (1) 83 (83) (1) Balance as at December 31, 2019
$-
$83
$343
$426
Impairment (recovery)/charge (Note 24) 4 (83) 198 119
Balance as at December 31, 2020
$4
$-
$541
$545 NOTE 9 – CASH COLLATERAL ON DERIVATIVES The cash collateral on derivatives is a financial asset as defined in Note 5. The Bank attempts to reduce counterparty credit exposure in derivative transactions through bilateral collateral requirements. Under these arrangements collateral is not required to be posted up to an agreed valuation threshold beyond which collateral is posted in cash by either one of the parties based on the exposure that is in excess of the credit threshold. When the Bank’s derivative is in a liability position, it posts collateral to the counterparty and records the collateral posted as an asset receivable. When the Bank’s derivative is in a receivable position, it receives collateral from the counterparty and records the collateral received as a reduction in the receivable or an increase in the liability. The Bank is party to a currency swap with Credit Suisse International AG to convert $145 million CHF to USD at a fixed exchange rate on a fixed date and to exchange a fixed interest rate of 0.297% for a floating rate based on USD Libor.
CCAARRIIBBBBEEAANN DDEEVVEELLOOPPMMEENNTT BBAANNKK OORRDDIINNAARRYY CCAAPPIITTAALL RREESSOOUURRCCEESS NNOOTTEESS TTOO TTHHEE FFIINNAANNCCIIAALL SSTTAATTEEMMEENNTTSS FFoorr tthhee yyeeaarr eennddeedd DDeecceemmbbeerr 3311,, 22002200 (expressed in thousands of United States dollars, unless otherwise stated)
- 51 -
NOTE 9 – CASH COLLATERAL ON DERIVATIVES…continued As at December 31, 2020, the collateral receivable from Credit Suisse International in respect of this cross-currency interest rate swap was nil (2019: $2,400). Interest on this account is calculated at the daily US Federal Funds rate and the amounts earned for the year was $3 (2019: $125). These arrangements form part of the Credit Support Annex (“CSA”) to the ISDA Agreement and is an integral part of the valuation of the fair value of the underlying derivatives as disclosed in Note 3 – Risk Management and Note 14 – Derivative financial instruments. NOTE 10 – LOANS OUTSTANDING Loans outstanding are financial assets as defined in Note 5. The Bank’s loan portfolio comprises loans granted to, or guaranteed by, its BMCs and are disbursed and repaid in US Dollars. Loans are granted for a maximum period of twenty-two years, including a grace period, which typically covers the period of the project implementation and are for the purpose of financing development projects and programmes, and are not intended for sale. Interest rates are reset quarterly. The interest rate prevailing as at December 31, 2020 was 3.75% (2019: 4.80%) The estimated fair values of the loans are based on discounted cash flow models using an estimated yield curve appropriate for the remaining term to maturity. The loans are evaluated based on parameters such as interest rates, specific country risk factors and individual credit worthiness. Collateral CDB does not take collateral on its sovereign loans. The Loans (CDB) Acts or other applicable legislation are enacted in the various BMCs and authorise the governments to raise loans from CDB or guarantee loans provided by CDB to their statutory authorities. They also provide for repayment of any loan made by CDB to the Government or to any statutory corporation, to be charged upon and paid out of the consolidated fund. CDB also derives comfort from the negative pledge condition included in its loan agreements which prohibits, except with CDB’s written consent, the charging of Government assets to secure external indebtedness unless CDB is equally and ratably secured. Furthermore, CDB continues to be accorded preferred creditor treatment (PCT) by its BMCs by which, in applicable circumstances, the Bank’s loans are not included in any debt rescheduling arrangements and defaults of its BMCs and the Bank is also given preferential access to foreign currency. With respect to non-sovereign loans, CDB requires its commitments to be secured, the nature and extent of which is determined on a case-by-case basis. The Bank secures non-interest-bearing cash collateral against certain non-sovereign loans the amounts of which are estimated to be sufficient to maintain the loan in a current status in the event that this would become a requirement. If not utilised the amounts are refundable to the borrower upon maturity of the loan. In addition to security pledged by the borrower, the security against the non-sovereign loans, where applicable, also comprises that pledged against sub-loans (comprising loans on-lent by the borrower in accordance with terms of the original loan agreement) assigned to trusts that are managed by the borrower at no cost to CDB. The fair value of the collateral held (off-balance sheet) for the impaired non-sovereign loans was not able to be valued due to the nature of the collateral and the cost effectiveness of establishing the value of the security, being the fair value of sub-loans and the Bank’s portion of the estimated realisable value of a property. These values would not, in management’s view, be material to the financial statements.

139
CARIBBEAN DEVELOPMENT BANK ANNUAL REPORT 2020
136 137
CARIBBEAN DEVELOPMENT BANK ANNUAL REPORT 2020 CARIBBEAN DEVELOPMENT BANK ANNUAL REPORT 2020
CCAARRIIBBBBEEAANN DDEEVVEELLOOPPMMEENNTT BBAANNKK OORRDDIINNAARRYY CCAAPPIITTAALL RREESSOOUURRCCEESS NNOOTTEESS TTOO TTHHEE FFIINNAANNCCIIAALL SSTTAATTEEMMEENNTTSS FFoorr tthhee yyeeaarr eennddeedd DDeecceemmbbeerr 3311,, 22002200 (expressed in thousands of United States dollars, unless otherwise stated)
- 50 -
NOTE 8 – RECEIVABLES AND PREPAID ASSETS
The accounting policy for receivables is as defined at Note 5. Prepaid assets are not financial assets and are recorded as assets on the statement of financial position when cash is paid and expensed to profit and loss over the relevant contract term. Due to the short-term nature of receivables and prepaid assets, fair value is assumed to be equal to carrying value. Receivables and prepaid assets comprise the following: 2020 2019
Inter-fund receivable –– Note 27 $13,566 $5,342 Staff loans and other receivables 654 710 Value added tax receivable 1012 1,263 Institutional receivables 192 231 Prepaid assets 663 535 16,087 8,081 Allowance for ECL (545) (426) $15,542 $7,655 An assessment of the allowance for ECL as at December 31 is as follows:
Stage 1 Stage 2 Stage 3 Total
Balance as at January 1, 2019 $1 $- $426 $427 Impairment charge (Note 24) (1) 83 (83) (1) Balance as at December 31, 2019
$-
$83
$343
$426
Impairment (recovery)/charge (Note 24) 4 (83) 198 119
Balance as at December 31, 2020
$4
$-
$541
$545 NOTE 9 – CASH COLLATERAL ON DERIVATIVES
The cash collateral on derivatives is a financial asset as defined in Note 5. The Bank attempts to reduce counterparty credit exposure in derivative transactions through bilateral collateral requirements. Under these arrangements collateral is not required to be posted up to an agreed valuation threshold beyond which collateral is posted in cash by either one of the parties based on the exposure that is in excess of the credit threshold. When the Bank’s derivative is in a liability position, it posts collateral to the counterparty and records the collateral posted as an asset receivable. When the Bank’s derivative is in a receivable position, it receives collateral from the counterparty and records the collateral received as a reduction in the receivable or an increase in the liability. The Bank is party to a currency swap with Credit Suisse International AG to convert $145 million CHF to USD at a fixed exchange rate on a fixed date and to exchange a fixed interest rate of 0.297% for a floating rate based on USD Libor.
CCAARRIIBBBBEEAANN DDEEVVEELLOOPPMMEENNTT BBAANNKK OORRDDIINNAARRYY CCAAPPIITTAALL RREESSOOUURRCCEESS NNOOTTEESS TTOO TTHHEE FFIINNAANNCCIIAALL SSTTAATTEEMMEENNTTSS FFoorr tthhee yyeeaarr eennddeedd DDeecceemmbbeerr 3311,, 22002200 (expressed in thousands of United States dollars, unless otherwise stated)
- 51 -
NOTE 9 – CASH COLLATERAL ON DERIVATIVES…continued As at December 31, 2020, the collateral receivable from Credit Suisse International in respect of this cross-currency interest rate swap was nil (2019: $2,400). Interest on this account is calculated at the daily US Federal Funds rate and the amounts earned for the year was $3 (2019: $125). These arrangements form part of the Credit Support Annex (“CSA”) to the ISDA Agreement and is an integral part of the valuation of the fair value of the underlying derivatives as disclosed Note 3 – Risk Management and Note 14 – Derivative financial instruments. NOTE 10 – LOANS OUTSTANDING
Loans outstanding are financial assets as defined in Note 5.
The Bank’s loan portfolio comprises loans granted to, or guaranteed by, its BMCs and are disbursed and repaid in US Dollars. Loans are granted for a maximum period of twenty-two years, including a grace period, which typically covers the period of the project implementation and are for the purpose of financing development projects and programmes, and are not intended for sale. Interest rates are reset quarterly. The interest rate prevailing as at December 31, 2020 was 3.75% (2019: 4.80%) The estimated fair values of the loans are based on discounted cash flow models using an estimated yield curve appropriate for the remaining term to maturity. The loans are evaluated based on parameters such as interest rates, specific country risk factors and individual credit worthiness.
Collateral CDB does not take collateral on its sovereign loans. The Loans (CDB) Acts or other applicable legislation are enacted in the various BMCs and authorise the governments to raise loans from CDB or guarantee loans provided by CDB to their statutory authorities. They also provide for repayment of any loan made by CDB to the Government or to any statutory corporation, to be charged upon and paid out of the consolidated fund. CDB also derives comfort from the negative pledge condition included in its loan agreements which prohibits, except with CDB’s written consent, the charging of Government assets to secure external indebtedness unless CDB is equally and ratably secured. Furthermore, CDB continues to be accorded preferred creditor treatment (PCT) by its BMCs by which, in applicable circumstances, the Bank’s loans are not included in any debt rescheduling arrangements and defaults of its BMCs and the Bank is also given preferential access to foreign currency.
With respect to non-sovereign loans, CDB requires its commitments to be secured, the nature and extent of which is determined on a case-by-case basis. The Bank secures non-interest-bearing cash collateral against certain non-sovereign loans the amounts of which are estimated to be sufficient to maintain the loan in a current status in the event that this would become a requirement. If not utilised the amounts are refundable to the borrower upon maturity of the loan. In addition to security pledged by the borrower, the security against the non-sovereign loans, where applicable, also comprises that pledged against sub-loans (comprising loans on-lent by the borrower in accordance with terms of the original loan agreement) assigned to trusts that are managed by the borrower at no cost to CDB. The fair value of the collateral held (off-balance sheet) for the impaired non-sovereign loans was not able to be valued due to the nature of the collateral and the cost effectiveness of establishing the value of the security, being the fair value of sub-loans and the Bank’s portion of the estimated realisable value of a property. These values would not, in management’s view, be material to the financial statements.
CCAARRIIBBBBEEAANN DDEEVVEELLOOPPMMEENNTT BBAANNKK OORRDDIINNAARRYY CCAAPPIITTAALL RREESSOOUURRCCEESS NNOOTTEESS TTOO TTHHEE FFIINNAANNCCIIAALL SSTTAATTEEMMEENNTTSS FFoorr tthhee yyeeaarr eennddeedd DDeecceemmbbeerr 3311,, 22002200 (expressed in thousands of United States dollars, unless otherwise stated)
- 50 -
NOTE 8 – RECEIVABLES AND PREPAID ASSETS The accounting policy for receivables is as defined at Note 5. Prepaid assets are not financial assets and are recorded as assets on the statement of financial position when cash is paid and expensed to profit and loss over the relevant contract term. Due to the short-term nature of receivables and prepaid assets, fair value is assumed to be equal to carrying value. Receivables and prepaid assets comprise the following: 2020 2019
Inter-fund receivable –– Note 27 $13,566 $5,342 Staff loans and other receivables 654 710 Value added tax receivable 1012 1,263 Institutional receivables 192 231 Prepaid assets 663 535 16,087 8,081 Allowance for ECL (545) (426) $15,542 $7,655 An assessment of the allowance for ECL as at December 31 is as follows:
Stage 1 Stage 2 Stage 3 Total
Balance as at January 1, 2019 $1 $- $426 $427 Impairment charge (Note 24) (1) 83 (83) (1) Balance as at December 31, 2019
$-
$83
$343
$426
Impairment (recovery)/charge (Note 24) 4 (83) 198 119
Balance as at December 31, 2020
$4
$-
$541
$545 NOTE 9 – CASH COLLATERAL ON DERIVATIVES The cash collateral on derivatives is a financial asset as defined in Note 5. The Bank attempts to reduce counterparty credit exposure in derivative transactions through bilateral collateral requirements. Under these arrangements collateral is not required to be posted up to an agreed valuation threshold beyond which collateral is posted in cash by either one of the parties based on the exposure that is in excess of the credit threshold. When the Bank’s derivative is in a liability position, it posts collateral to the counterparty and records the collateral posted as an asset receivable. When the Bank’s derivative is in a receivable position, it receives collateral from the counterparty and records the collateral received as a reduction in the receivable or an increase in the liability. The Bank is party to a currency swap with Credit Suisse International AG to convert $145 million CHF to USD at a fixed exchange rate on a fixed date and to exchange a fixed interest rate of 0.297% for a floating rate based on USD Libor.
CCAARRIIBBBBEEAANN DDEEVVEELLOOPPMMEENNTT BBAANNKK OORRDDIINNAARRYY CCAAPPIITTAALL RREESSOOUURRCCEESS NNOOTTEESS TTOO TTHHEE FFIINNAANNCCIIAALL SSTTAATTEEMMEENNTTSS FFoorr tthhee yyeeaarr eennddeedd DDeecceemmbbeerr 3311,, 22002200 (expressed in thousands of United States dollars, unless otherwise stated)
- 51 -
NOTE 9 – CASH COLLATERAL ON DERIVATIVES…continued As at December 31, 2020, the collateral receivable from Credit Suisse International in respect of this cross-currency interest rate swap was nil (2019: $2,400). Interest on this account is calculated at the daily US Federal Funds rate and the amounts earned for the year was $3 (2019: $125). These arrangements form part of the Credit Support Annex (“CSA”) to the ISDA Agreement and is an integral part of the valuation of the fair value of the underlying derivatives as disclosed in Note 3 – Risk Management and Note 14 – Derivative financial instruments. NOTE 10 – LOANS OUTSTANDING Loans outstanding are financial assets as defined in Note 5. The Bank’s loan portfolio comprises loans granted to, or guaranteed by, its BMCs and are disbursed and repaid in US Dollars. Loans are granted for a maximum period of twenty-two years, including a grace period, which typically covers the period of the project implementation and are for the purpose of financing development projects and programmes, and are not intended for sale. Interest rates are reset quarterly. The interest rate prevailing as at December 31, 2020 was 3.75% (2019: 4.80%) The estimated fair values of the loans are based on discounted cash flow models using an estimated yield curve appropriate for the remaining term to maturity. The loans are evaluated based on parameters such as interest rates, specific country risk factors and individual credit worthiness. Collateral CDB does not take collateral on its sovereign loans. The Loans (CDB) Acts or other applicable legislation are enacted in the various BMCs and authorise the governments to raise loans from CDB or guarantee loans provided by CDB to their statutory authorities. They also provide for repayment of any loan made by CDB to the Government or to any statutory corporation, to be charged upon and paid out of the consolidated fund. CDB also derives comfort from the negative pledge condition included in its loan agreements which prohibits, except with CDB’s written consent, the charging of Government assets to secure external indebtedness unless CDB is equally and ratably secured. Furthermore, CDB continues to be accorded preferred creditor treatment (PCT) by its BMCs by which, in applicable circumstances, the Bank’s loans are not included in any debt rescheduling arrangements and defaults of its BMCs and the Bank is also given preferential access to foreign currency. With respect to non-sovereign loans, CDB requires its commitments to be secured, the nature and extent of which is determined on a case-by-case basis. The Bank secures non-interest-bearing cash collateral against certain non-sovereign loans the amounts of which are estimated to be sufficient to maintain the loan in a current status in the event that this would become a requirement. If not utilised the amounts are refundable to the borrower upon maturity of the loan. In addition to security pledged by the borrower, the security against the non-sovereign loans, where applicable, also comprises that pledged against sub-loans (comprising loans on-lent by the borrower in accordance with terms of the original loan agreement) assigned to trusts that are managed by the borrower at no cost to CDB. The fair value of the collateral held (off-balance sheet) for the impaired non-sovereign loans was not able to be valued due to the nature of the collateral and the cost effectiveness of establishing the value of the security, being the fair value of sub-loans and the Bank’s portion of the estimated realisable value of a property. These values would not, in management’s view, be material to the financial statements.

140
CARIBBEAN DEVELOPMENT BANK ANNUAL REPORT 2020
138 139
CARIBBEAN DEVELOPMENT BANK ANNUAL REPORT 2020 CARIBBEAN DEVELOPMENT BANK ANNUAL REPORT 2020
CCAARRIIBBBBEEAANN DDEEVVEELLOOPPMMEENNTT BBAANNKK OORRDDIINNAARRYY CCAAPPIITTAALL RREESSOOUURRCCEESS NNOOTTEESS TTOO TTHHEE FFIINNAANNCCIIAALL SSTTAATTEEMMEENNTTSS FFoorr tthhee yyeeaarr eennddeedd DDeecceemmbbeerr 3311,, 22002200 (expressed in thousands of United States dollars, unless otherwise stated)
- 52 -
NOTE 10 – LOANS OUTSTANDING…continued
(a) The following tables disclose the Bank’s credit exposures at their carrying amounts, as categorised by Borrowing Member Countries, regional institutions and non-sovereign entities as at December 31.
2020
Borrowers
Loans not yet
effective Undisbursed Outstanding % of Loans
outstanding
Anguilla $- $2,059 $74,809 5.6 Antigua and Barbuda - 60,372 114,620 8.7 Bahamas - 23,056 118,687 9.0 Barbados - 15,626 259,882 19.6 Belize 21,300 61,631 117,969 8.9 British Virgin Islands - 30,395 93,087 7.0 Dominica -- 6,651 25,229 1.9 Grenada - 5,877 39,286 3.0 Guyana 101,466 995 24,398 1.8 Jamaica - 1 117,726 8.9 St. Kitts and Nevis - 3,989 23,035 1.7 St. Lucia 7,378 30,221 79,742 6.0 St. Vincent and the Grenadines 12,003 134,090 63,611 4.8 Suriname - 87,234 56,051 4.2 Trinidad and Tobago - 6,337 28,149 2.1 Turks and Caicos Islands - 1,114 249 0.0 Regional - - 8,242 0.6 Non-sovereign - 5,540 79,389 6.0
Sub-total 142,147 475,188 1,324,161 100.0
Allowance for ECL - - (7,046) Accrued interest and other charges - - 14,972
$142,147 $475,187 $1,332,087
2020
Current $121,785 Non-current 1,210,302
$1,332,087
CCAARRIIBBBBEEAANN DDEEVVEELLOOPPMMEENNTT BBAANNKK OORRDDIINNAARRYY CCAAPPIITTAALL RREESSOOUURRCCEESS NNOOTTEESS TTOO TTHHEE FFIINNAANNCCIIAALL SSTTAATTEEMMEENNTTSS FFoorr tthhee yyeeaarr eennddeedd DDeecceemmbbeerr 3311,, 22002200 (expressed in thousands of United States dollars, unless otherwise stated)
- 53 -
NOTE 10 – LOANS OUTSTANDING…continued
(a) Credit exposures…continued2019
Borrowers
Loans not yet
effective Undisbursed Outstanding % of Loans
outstanding
Anguilla $6,230 $3,478 $80,524 6.5 Antigua and Barbuda - 65,371 116,193 9.3 Bahamas 52,893 28,177 24,154 1.9 Barbados 29,800 26,256 260,723 20.9 Belize - 78,635 115,022 9.3 British Virgin Islands 9,299 45,939 81,599 6.6 Dominica -- 8,083 18,472 1.5 Grenada - 11,120 38,126 3.1 Guyana - 1,303 26,964 2.2 Jamaica - 123 149,018 12.0 St. Kitts and Nevis - 4,099 26,693 2.1 St. Lucia 10,603 28,292 61,534 4.9 St. Vincent and the Grenadines 101,414 35,856 68,847 5.5 Suriname - 87,725 61,320 4.9 Trinidad and Tobago - 6,337 32,900 2.6 Turks and Caicos Islands - 1,114 1,307 0.1 Regional - - 8,968 0.7 Non-sovereign - 18,061 74,018 5.9
Sub-total 210,239 449,969 1,246,382 100.0
Allowance for ECL - - (12,920) Accrued interest and other charges - - 15,856
$210,239 $449,969 $1,249,318
2019
Current $114,392 Non-current 1,134,926
$1,249,318

141
CARIBBEAN DEVELOPMENT BANK ANNUAL REPORT 2020
138 139
CARIBBEAN DEVELOPMENT BANK ANNUAL REPORT 2020 CARIBBEAN DEVELOPMENT BANK ANNUAL REPORT 2020
CCAARRIIBBBBEEAANN DDEEVVEELLOOPPMMEENNTT BBAANNKK OORRDDIINNAARRYY CCAAPPIITTAALL RREESSOOUURRCCEESS NNOOTTEESS TTOO TTHHEE FFIINNAANNCCIIAALL SSTTAATTEEMMEENNTTSS FFoorr tthhee yyeeaarr eennddeedd DDeecceemmbbeerr 3311,, 22002200 (expressed in thousands of United States dollars, unless otherwise stated)
- 52 -
NOTE 10 – LOANS OUTSTANDING…continued
(a) The following tables disclose the Bank’s credit exposures at their carrying amounts, as categorised by Borrowing Member Countries, regional institutions and non-sovereign entities as at December 31.
2020
Borrowers
Loans not yet
effective Undisbursed Outstanding % of Loans
outstanding
Anguilla $- $2,059 $74,809 5.6 Antigua and Barbuda - 60,372 114,620 8.7 Bahamas - 23,056 118,687 9.0 Barbados - 15,626 259,882 19.6 Belize 21,300 61,631 117,969 8.9 British Virgin Islands - 30,395 93,087 7.0 Dominica -- 6,651 25,229 1.9 Grenada - 5,877 39,286 3.0 Guyana 101,466 995 24,398 1.8 Jamaica - 1 117,726 8.9 St. Kitts and Nevis - 3,989 23,035 1.7 St. Lucia 7,378 30,221 79,742 6.0 St. Vincent and the Grenadines 12,003 134,090 63,611 4.8 Suriname - 87,234 56,051 4.2 Trinidad and Tobago - 6,337 28,149 2.1 Turks and Caicos Islands - 1,114 249 0.0 Regional - - 8,242 0.6 Non-sovereign - 5,540 79,389 6.0
Sub-total 142,147 475,188 1,324,161 100.0
Allowance for ECL - - (7,046) Accrued interest and other charges - - 14,972
$142,147 $475,187 $1,332,087
2020
Current $121,785 Non-current 1,210,302
$1,332,087
CCAARRIIBBBBEEAANN DDEEVVEELLOOPPMMEENNTT BBAANNKK OORRDDIINNAARRYY CCAAPPIITTAALL RREESSOOUURRCCEESS NNOOTTEESS TTOO TTHHEE FFIINNAANNCCIIAALL SSTTAATTEEMMEENNTTSS FFoorr tthhee yyeeaarr eennddeedd DDeecceemmbbeerr 3311,, 22002200 (expressed in thousands of United States dollars, unless otherwise stated)
- 53 -
NOTE 10 – LOANS OUTSTANDING…continued
(a) Credit exposures…continued2019
Borrowers
Loans not yet
effective Undisbursed Outstanding % of Loans
outstanding
Anguilla $6,230 $3,478 $80,524 6.5 Antigua and Barbuda - 65,371 116,193 9.3 Bahamas 52,893 28,177 24,154 1.9 Barbados 29,800 26,256 260,723 20.9 Belize - 78,635 115,022 9.3 British Virgin Islands 9,299 45,939 81,599 6.6 Dominica -- 8,083 18,472 1.5 Grenada - 11,120 38,126 3.1 Guyana - 1,303 26,964 2.2 Jamaica - 123 149,018 12.0 St. Kitts and Nevis - 4,099 26,693 2.1 St. Lucia 10,603 28,292 61,534 4.9 St. Vincent and the Grenadines 101,414 35,856 68,847 5.5 Suriname - 87,725 61,320 4.9 Trinidad and Tobago - 6,337 32,900 2.6 Turks and Caicos Islands - 1,114 1,307 0.1 Regional - - 8,968 0.7 Non-sovereign - 18,061 74,018 5.9
Sub-total 210,239 449,969 1,246,382 100.0
Allowance for ECL - - (12,920) Accrued interest and other charges - - 15,856
$210,239 $449,969 $1,249,318
2019
Current $114,392 Non-current 1,134,926
$1,249,318

142
CARIBBEAN DEVELOPMENT BANK ANNUAL REPORT 2020
140 141
CARIBBEAN DEVELOPMENT BANK ANNUAL REPORT 2020 CARIBBEAN DEVELOPMENT BANK ANNUAL REPORT 2020
CCAA
RRIIBB
BBEEAA
NN DD
EEVVEELL
OOPPMM
EENNTT
BBAANN
KK
OORRDD
IINNAA
RRYY
CCAA
PPIITTAA
LL RREESS
OOUU
RRCC
EESS
NNOO
TTEESS
TTOO TT
HHEE
FFIINN
AANN
CCIIAA
LL SSTT
AATTEE
MMEENN
TTSS
FFoorr
tthhee
yyeeaarr
eenndd
eedd DD
eecceemm
bbeerr
3311,, 22002200
(exp
ress
ed in
th
ou
san
ds
of
Un
ited
Sta
tes
dolla
rs, u
nle
ss o
ther
wis
e st
ate
d)
-54
-
NO
TE 1
0 –
LO
AN
S O
UTS
TAN
DIN
G…
cont
inue
d
(b)
An
anal
ysis
of t
he c
ompo
sitio
n of
out
stan
ding
loan
s w
as a
s fo
llow
s :
2
02
0
Cu
rren
cies
rec
eiva
ble
Loa
ns
ou
t-
sta
nd
ing
1 J
an
ua
ry
20
20
Net
in
tere
st
D
isb
urs
emen
ts
Rep
aym
ents
Im
pa
irm
ent
cha
rge
Loa
ns
ou
t-st
an
din
g
31
Dec
emb
er
20
20
Uni
ted
Stat
es d
olla
rs
$1
,24
6,3
82
$-
$1
95
,88
1
$(1
18
,10
2)
$-
$1
,32
4,1
61
Sub-
tota
l1
,24
6,3
82
- 1
95
,88
1
(11
8,1
02
) -
1,3
24
,16
1
Allo
wan
ce fo
r EC
L (1
2,9
20
) -
- -
5,8
74
(7
,04
6)
Acc
rued
inte
rest
1
5,8
56
(8
84
) -
- -
14
,97
2
Tota
l –
Dec
emb
er 3
1
$1
,24
9,3
18
$(8
84
) $
19
5,8
81
$(1
18
,10
2)
$5
,87
4
$1
,33
2,0
87
2
01
9
Cu
rren
cies
rec
eiva
ble
Loa
ns
ou
t-st
an
din
g
1
Ja
nu
ary
2
01
9
N
et in
tere
st
D
isb
urs
emen
ts
Rep
aym
ents
Im
pa
irm
ent
cha
rge
Loa
ns
ou
t-st
an
din
g
31
Dec
emb
er
20
19
Uni
ted
Stat
es d
olla
rs
$1,1
58,6
40
$-
$197
,922
$(
110,
180)
$-
$1
,246
,382
Su
b-to
tal
1,15
8,64
0 -
197,
922
(110
,180
) -
1,24
6,38
2 A
llow
ance
for
ECL
(9,9
78)
- -
-
(
2,94
2)
(12,
920)
A
ccru
ed in
tere
st
14,8
80
976
- -
- 15
,856
To
tal –
Dec
emb
er 3
1
$1
,16
3,5
42
$9
76
$
19
7,9
22
$
(11
0,1
80
) $
(2,9
42
) $
1,2
49
,31
8
CCAARRIIBBBBEEAANN DDEEVVEELLOOPPMMEENNTT BBAANNKK OORRDDIINNAARRYY CCAAPPIITTAALL RREESSOOUURRCCEESS NNOOTTEESS TTOO TTHHEE FFIINNAANNCCIIAALL SSTTAATTEEMMEENNTTSS FFoorr tthhee yyeeaarr eennddeedd DDeecceemmbbeerr 3311,, 22002200 (expressed in thousands of United States dollars, unless otherwise stated)
- 55 -
NOTE 10 – LOANS OUTSTANDING…continued (c) Reconciliation of the allowance account for ECL on loans is as follows:
Stage 1 Stage 2 Stage 3 Total
Balance as at January 1, 2019 $4,338 $796 $4,844 $9,978
Impairment charge (Note 24) 4,164 380 (1,602) 2,942 Balance as at December 31, 2019
$8,502
$1,176
$3,242
$12,920
Impairment charge (Note 24) (3,869) (389) (1,616) (5,874) Balance as at December 31, 2020
$4,633
$787
$1,626
$7,046
NOTE 11 – NON-NEGOTIABLE DEMAND NOTES Non-negotiable demand notes are financial assets as defined in Note 5. Under the provisions of its Charter the Bank shall accept, in place of any part of the members’ currency paid or to be paid with respect to capital subscriptions, promissory notes issued by the Government of the member or by the depository designated by the member, subject to such currency not being required by the Bank for the conduct of its operations. These notes are non-negotiable, non-interest bearing and payable at their par value on demand. They are classified as current assets and their fair value is therefore estimated to be their carrying value. As at December 31, the non-negotiable demand notes were comprised as follows: - 2020 2019 Gross carrying amount $21,818 $39,989 Allowance for ECL
(221) (1,477)
$21,597
$38,512
An assessment of the allowance for ECL as at December 31 is as follows: Stage 1 Stage 2 Stage 3 Total
Balance as at January 1, 2019 $6,627 $- $- $6,627 Impairment recovery (Note 24) – included in “Receivable from members” line)
(6,166)
24
992
(5,150)
Balance as at December 31, 2019
$461
$24
$992
$1,477
Impairment (recovery)/charge (Note 24) – included in “Receivable from members” line)
(240)
(24)
(992)
(1,256)
Balance as at December 31, 2020
$221
$-
$-
$221
CCAA
RRIIBB
BBEEAA
NN DD
EEVVEELL
OOPPMM
EENNTT
BBAANN
KK
OORRDD
IINNAA
RRYY
CCAA
PPIITTAA
LL RREESS
OOUU
RRCC
EESS
NNOO
TTEESS
TTOO TT
HHEE
FFIINN
AANN
CCIIAA
LL SSTT
AATTEE
MMEENN
TTSS
FFoorr
tthhee
yyeeaarr
eenndd
eedd DD
eecceemm
bbeerr
3311,, 2200
2200
(exp
ress
ed in
th
ou
san
ds
of
Un
ited
Sta
tes
dolla
rs, u
nle
ss o
ther
wis
e st
ate
d)
- 54
-
NO
TE 1
0 –
LO
AN
S O
UTS
TAN
DIN
G…
cont
inue
d (b
) A
n an
alys
is o
f the
com
posi
tion
of o
utst
andi
ng lo
ans
was
as
follo
ws:
20
20
Curr
enci
es r
ecei
vab
le
Loans
out-
st
and
ing
1 J
anuary
2
02
0
N
et inte
rest
Dis
bu
rsem
ents
Rep
aym
ents
Im
pair
men
t ch
arg
e
Loans
out-
stand
ing
31 D
ecem
ber
2
02
0
U
nite
d St
ates
dol
lars
$1,2
46
,382
$
- $19
5,8
81
$(1
18,1
02
) $
- $1,3
24
,161
Sub-
tota
l 1,2
46
,382
-
195
,881
(1
18,1
02
) -
1,3
24
,161
A
llow
ance
for
ECL
(12
,920
) -
- -
5,8
74
(7
,046
) A
ccru
ed in
tere
st
15,8
56
(8
84
) -
- -
14,9
72
Tota
l –
Dec
emb
er 3
1
$1,2
49
,318
$
(88
4)
$19
5,8
81
$(1
18,1
02
) $
5,8
74
$1,3
32
,087
20
19
Curr
enci
es r
ecei
vab
le
Loans
out-
stand
ing
1 J
anuary
2
01
9
N
et inte
rest
Dis
bu
rsem
ents
Rep
aym
ents
Im
pair
men
t ch
arg
e
Loans
out-
stand
ing
31 D
ecem
ber
2
01
9
U
nite
d St
ates
dol
lars
$1
,158
,640
$-
$1
97,9
22
$(11
0,18
0)
$-
$1,2
46,3
82
Su
b-to
tal
1,15
8,64
0 -
197,
922
(110
,180
) -
1,24
6,38
2 A
llow
ance
for
ECL
(9,9
78)
- -
-
(
2,94
2)
(12,
920)
A
ccru
ed in
tere
st
14,8
80
976
- -
- 15
,856
Tota
l –
Dec
emb
er 3
1
$1,1
63
,542
$
97
6
$19
7,9
22
$(1
10,1
80
) $(2
,942
) $1,2
49
,318
CCAARRIIBBBBEEAANN DDEEVVEELLOOPPMMEENNTT BBAANNKK OORRDDIINNAARRYY CCAAPPIITTAALL RREESSOOUURRCCEESS NNOOTTEESS TTOO TTHHEE FFIINNAANNCCIIAALL SSTTAATTEEMMEENNTTSS FFoorr tthhee yyeeaarr eennddeedd DDeecceemmbbeerr 3311,, 22002200 (expressed in thousands of United States dollars, unless otherwise stated)
- 55 -
NOTE 10 – LOANS OUTSTANDING…continued (c) Reconciliation of the allowance account for ECL on loans is as follows:
Stage 1 Stage 2 Stage 3 Total
Balance as at January 1, 2019 $4,338 $796 $4,844 $9,978
Impairment charge (Note 24) 4,164 380 (1,602) 2,942 Balance as at December 31, 2019
$8,502
$1,176
$3,242
$12,920
Impairment charge (Note 24) (3,869) (389) (1,616) (5,874) Balance as at December 31, 2020
$4,633
$787
$1,626
$7,046
NOTE 11 – NON-NEGOTIABLE DEMAND NOTES Non-negotiable demand notes are financial assets as defined in Note 5. Under the provisions of its Charter the Bank shall accept, in place of any part of the members’ currency paid or to be paid with respect to capital subscriptions, promissory notes issued by the Government of the member or by the depository designated by the member, subject to such currency not being required by the Bank for the conduct of its operations. These notes are non-negotiable, non-interest bearing and payable at their par value on demand. They are classified as current assets and their fair value is therefore estimated to be their carrying value. As at December 31, the non-negotiable demand notes were comprised as follows: - 2020 2019 Gross carrying amount $21,818 $39,989 Allowance for ECL (221) (1,477)
$21,597
$38,512 An assessment of the allowance for ECL as at December 31 is as follows: Stage 1 Stage 2 Stage 3 Total
Balance as at January 1, 2019 $6,627 $- $- $6,627 Impairment (recovery)/charge (Note 24) – included in “Receivable from members” line)
(6,166)
24
992
(5,150)
Balance as at December 31, 2019
$461
$24
$992
$1,477
Impairment (recovery)/charge (Note 24) – included in “Receivable from members” line)
(240)
(24)
(992)
(1,256)
Balance as at December 31, 2020
$221
$-
$-
$221
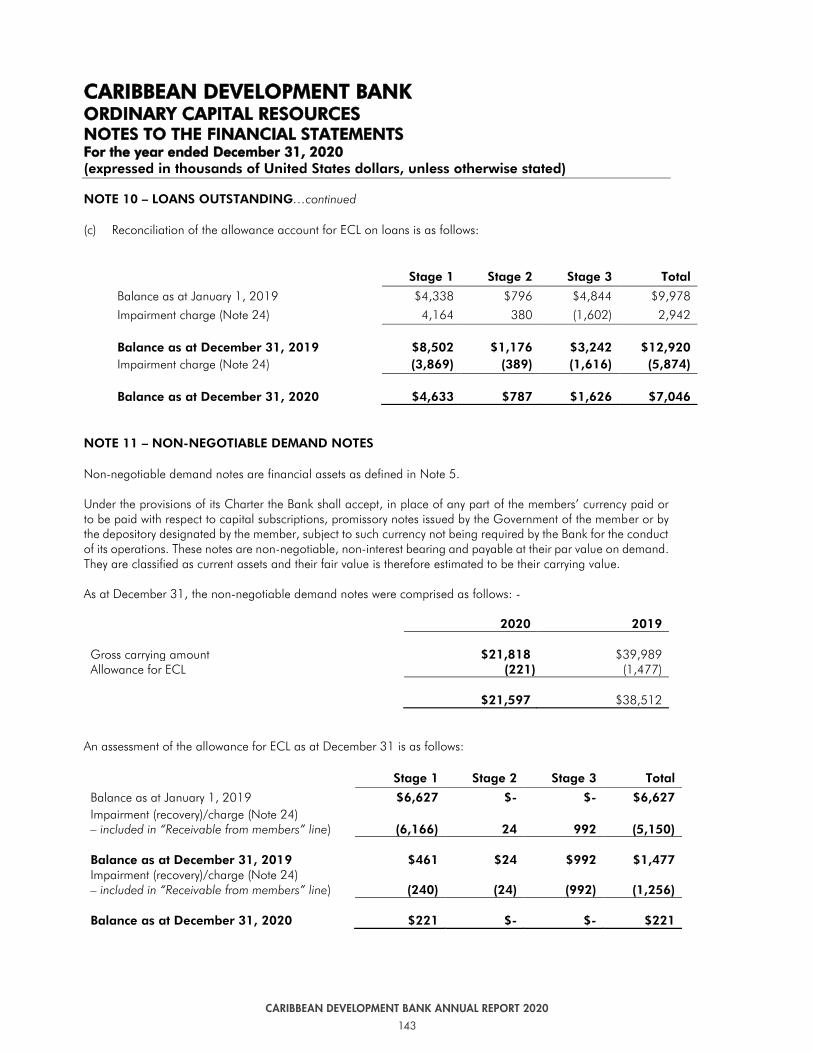
143
CARIBBEAN DEVELOPMENT BANK ANNUAL REPORT 2020
140 141
CARIBBEAN DEVELOPMENT BANK ANNUAL REPORT 2020 CARIBBEAN DEVELOPMENT BANK ANNUAL REPORT 2020
CCAA
RRIIBB
BBEEAA
NN DD
EEVVEELL
OOPPMM
EENNTT
BBAANN
KK
OORRDD
IINNAA
RRYY
CCAA
PPIITTAA
LL RREESS
OOUU
RRCC
EESS
NNOO
TTEESS
TTOO TT
HHEE
FFIINN
AANN
CCIIAA
LL SSTT
AATTEE
MMEENN
TTSS
FFoorr
tthhee
yyeeaarr
eenndd
eedd DD
eecceemm
bbeerr
3311,, 22002200
(exp
ress
ed in
th
ou
san
ds
of
Un
ited
Sta
tes
dolla
rs, u
nle
ss o
ther
wis
e st
ate
d)
-54
-
NO
TE 1
0 –
LO
AN
S O
UTS
TAN
DIN
G…
cont
inue
d
(b)
An
anal
ysis
of t
he c
ompo
sitio
n of
out
stan
ding
loan
s w
as a
s fo
llow
s :
2
02
0
Cu
rren
cies
rec
eiva
ble
Loa
ns
ou
t-
sta
nd
ing
1 J
an
ua
ry
20
20
Net
in
tere
st
D
isb
urs
emen
ts
Rep
aym
ents
Im
pa
irm
ent
cha
rge
Loa
ns
ou
t-st
an
din
g
31
Dec
emb
er
20
20
Uni
ted
Stat
es d
olla
rs
$1
,24
6,3
82
$-
$1
95
,88
1
$(1
18
,10
2)
$-
$1
,32
4,1
61
Sub-
tota
l1
,24
6,3
82
- 1
95
,88
1
(11
8,1
02
) -
1,3
24
,16
1
Allo
wan
ce fo
r EC
L (1
2,9
20
) -
- -
5,8
74
(7
,04
6)
Acc
rued
inte
rest
1
5,8
56
(8
84
) -
- -
14
,97
2
Tota
l –
Dec
emb
er 3
1
$1
,24
9,3
18
$(8
84
) $
19
5,8
81
$(1
18
,10
2)
$5
,87
4
$1
,33
2,0
87
2
01
9
Cu
rren
cies
rec
eiva
ble
Loa
ns
ou
t-st
an
din
g
1
Ja
nu
ary
2
01
9
N
et in
tere
st
D
isb
urs
emen
ts
Rep
aym
ents
Im
pa
irm
ent
cha
rge
Loa
ns
ou
t-st
an
din
g
31
Dec
emb
er
20
19
Uni
ted
Stat
es d
olla
rs
$1,1
58,6
40
$-
$197
,922
$(
110,
180)
$-
$1
,246
,382
Su
b-to
tal
1,15
8,64
0 -
197,
922
(110
,180
) -
1,24
6,38
2 A
llow
ance
for
ECL
(9,9
78)
- -
-
(
2,94
2)
(12,
920)
A
ccru
ed in
tere
st
14,8
80
976
- -
- 15
,856
To
tal –
Dec
emb
er 3
1
$1
,16
3,5
42
$9
76
$
19
7,9
22
$
(11
0,1
80
) $
(2,9
42
) $
1,2
49
,31
8
CCAARRIIBBBBEEAANN DDEEVVEELLOOPPMMEENNTT BBAANNKK OORRDDIINNAARRYY CCAAPPIITTAALL RREESSOOUURRCCEESS NNOOTTEESS TTOO TTHHEE FFIINNAANNCCIIAALL SSTTAATTEEMMEENNTTSS FFoorr tthhee yyeeaarr eennddeedd DDeecceemmbbeerr 3311,, 22002200 (expressed in thousands of United States dollars, unless otherwise stated)
- 55 -
NOTE 10 – LOANS OUTSTANDING…continued (c) Reconciliation of the allowance account for ECL on loans is as follows:
Stage 1 Stage 2 Stage 3 Total
Balance as at January 1, 2019 $4,338 $796 $4,844 $9,978
Impairment charge (Note 24) 4,164 380 (1,602) 2,942 Balance as at December 31, 2019
$8,502
$1,176
$3,242
$12,920
Impairment charge (Note 24) (3,869) (389) (1,616) (5,874) Balance as at December 31, 2020
$4,633
$787
$1,626
$7,046
NOTE 11 – NON-NEGOTIABLE DEMAND NOTES Non-negotiable demand notes are financial assets as defined in Note 5. Under the provisions of its Charter the Bank shall accept, in place of any part of the members’ currency paid or to be paid with respect to capital subscriptions, promissory notes issued by the Government of the member or by the depository designated by the member, subject to such currency not being required by the Bank for the conduct of its operations. These notes are non-negotiable, non-interest bearing and payable at their par value on demand. They are classified as current assets and their fair value is therefore estimated to be their carrying value. As at December 31, the non-negotiable demand notes were comprised as follows: - 2020 2019 Gross carrying amount $21,818 $39,989 Allowance for ECL
(221) (1,477)
$21,597
$38,512
An assessment of the allowance for ECL as at December 31 is as follows: Stage 1 Stage 2 Stage 3 Total
Balance as at January 1, 2019 $6,627 $- $- $6,627 Impairment recovery (Note 24) – included in “Receivable from members” line)
(6,166)
24
992
(5,150)
Balance as at December 31, 2019
$461
$24
$992
$1,477
Impairment (recovery)/charge (Note 24) – included in “Receivable from members” line)
(240)
(24)
(992)
(1,256)
Balance as at December 31, 2020
$221
$-
$-
$221
CCAA
RRIIBB
BBEEAA
NN DD
EEVVEELL
OOPPMM
EENNTT
BBAANN
KK
OORRDD
IINNAA
RRYY
CCAA
PPIITTAA
LL RREESS
OOUU
RRCC
EESS
NNOO
TTEESS
TTOO TT
HHEE
FFIINN
AANN
CCIIAA
LL SSTT
AATTEE
MMEENN
TTSS
FFoorr
tthhee
yyeeaarr
eenndd
eedd DD
eecceemm
bbeerr
3311,, 2200
2200
(exp
ress
ed in
th
ou
san
ds
of
Un
ited
Sta
tes
dolla
rs, u
nle
ss o
ther
wis
e st
ate
d)
- 54
-
NO
TE 1
0 –
LO
AN
S O
UTS
TAN
DIN
G…
cont
inue
d (b
) A
n an
alys
is o
f the
com
posi
tion
of o
utst
andi
ng lo
ans
was
as
follo
ws:
20
20
Curr
enci
es r
ecei
vab
le
Loans
out-
st
and
ing
1 J
anuary
2
02
0
N
et inte
rest
Dis
bu
rsem
ents
Rep
aym
ents
Im
pair
men
t ch
arg
e
Loans
out-
stand
ing
31 D
ecem
ber
2
02
0
U
nite
d St
ates
dol
lars
$1,2
46
,382
$
- $19
5,8
81
$(1
18,1
02
) $
- $1,3
24
,161
Sub-
tota
l 1,2
46
,382
-
195
,881
(1
18,1
02
) -
1,3
24
,161
A
llow
ance
for
ECL
(12
,920
) -
- -
5,8
74
(7
,046
) A
ccru
ed in
tere
st
15,8
56
(8
84
) -
- -
14,9
72
Tota
l –
Dec
emb
er 3
1
$1,2
49
,318
$
(88
4)
$19
5,8
81
$(1
18,1
02
) $
5,8
74
$1,3
32
,087
20
19
Curr
enci
es r
ecei
vab
le
Loans
out-
stand
ing
1 J
anuary
2
01
9
N
et inte
rest
Dis
bu
rsem
ents
Rep
aym
ents
Im
pair
men
t ch
arg
e
Loans
out-
stand
ing
31 D
ecem
ber
2
01
9
U
nite
d St
ates
dol
lars
$1
,158
,640
$-
$1
97,9
22
$(11
0,18
0)
$-
$1,2
46,3
82
Su
b-to
tal
1,15
8,64
0 -
197,
922
(110
,180
) -
1,24
6,38
2 A
llow
ance
for
ECL
(9,9
78)
- -
-
(
2,94
2)
(12,
920)
A
ccru
ed in
tere
st
14,8
80
976
- -
- 15
,856
Tota
l –
Dec
emb
er 3
1
$1,1
63
,542
$
97
6
$19
7,9
22
$(1
10,1
80
) $(2
,942
) $1,2
49
,318
CCAARRIIBBBBEEAANN DDEEVVEELLOOPPMMEENNTT BBAANNKK OORRDDIINNAARRYY CCAAPPIITTAALL RREESSOOUURRCCEESS NNOOTTEESS TTOO TTHHEE FFIINNAANNCCIIAALL SSTTAATTEEMMEENNTTSS FFoorr tthhee yyeeaarr eennddeedd DDeecceemmbbeerr 3311,, 22002200 (expressed in thousands of United States dollars, unless otherwise stated)
- 55 -
NOTE 10 – LOANS OUTSTANDING…continued (c) Reconciliation of the allowance account for ECL on loans is as follows:
Stage 1 Stage 2 Stage 3 Total
Balance as at January 1, 2019 $4,338 $796 $4,844 $9,978
Impairment charge (Note 24) 4,164 380 (1,602) 2,942 Balance as at December 31, 2019
$8,502
$1,176
$3,242
$12,920
Impairment charge (Note 24) (3,869) (389) (1,616) (5,874) Balance as at December 31, 2020
$4,633
$787
$1,626
$7,046
NOTE 11 – NON-NEGOTIABLE DEMAND NOTES Non-negotiable demand notes are financial assets as defined in Note 5. Under the provisions of its Charter the Bank shall accept, in place of any part of the members’ currency paid or to be paid with respect to capital subscriptions, promissory notes issued by the Government of the member or by the depository designated by the member, subject to such currency not being required by the Bank for the conduct of its operations. These notes are non-negotiable, non-interest bearing and payable at their par value on demand. They are classified as current assets and their fair value is therefore estimated to be their carrying value. As at December 31, the non-negotiable demand notes were comprised as follows: - 2020 2019 Gross carrying amount $21,818 $39,989 Allowance for ECL (221) (1,477)
$21,597
$38,512 An assessment of the allowance for ECL as at December 31 is as follows: Stage 1 Stage 2 Stage 3 Total
Balance as at January 1, 2019 $6,627 $- $- $6,627 Impairment (recovery)/charge (Note 24) – included in “Receivable from members” line)
(6,166)
24
992
(5,150)
Balance as at December 31, 2019
$461
$24
$992
$1,477
Impairment (recovery)/charge (Note 24) – included in “Receivable from members” line)
(240)
(24)
(992)
(1,256)
Balance as at December 31, 2020
$221
$-
$-
$221

144
CARIBBEAN DEVELOPMENT BANK ANNUAL REPORT 2020
142 143
CARIBBEAN DEVELOPMENT BANK ANNUAL REPORT 2020 CARIBBEAN DEVELOPMENT BANK ANNUAL REPORT 2020
CCAARRIIBBBBEEAANN DDEEVVEELLOOPPMMEENNTT BBAANNKK OORRDDIINNAARRYY CCAAPPIITTAALL RREESSOOUURRCCEESS NNOOTTEESS TTOO TTHHEE FFIINNAANNCCIIAALL SSTTAATTEEMMEENNTTSS FFoorr tthhee yyeeaarr eennddeedd DDeecceemmbbeerr 3311,, 22002200 (expressed in thousands of United States dollars, unless otherwise stated)
- 56 -
NOTE 12 – MAINTENANCE OF VALUE (MOV) ON CURRENCY HOLDINGS
MOV receivables are financial assets as defined in Note 5. In order to ensure that receipts for capital subscriptions originally paid in currencies other than US dollars retain at a minimum their value as determined in accordance with Article 24 of the Charter, each member is required to maintain the value of its currency held by the Bank. If in the opinion of the Bank, the value of a Member’s currency depreciates or appreciates to a significant extent, the Bank or Member may be required to repay an amount of currency equal to the increase or decrease in the value of its currency which is held by the Bank in respect of capital subscriptions. For the purposes of effecting settlement, MOV obligations are established at December 31 in each year. The Board of Directors has agreed that MOV obligations on any part of a member’s paid-up capital which is represented by loans outstanding be postponed and become payable on each portion of the principal of such loans when such portion is repaid to the Bank. MOV obligations that are not so deferred are due for settlement within 12 months of the date established. The regime approved by the Board with respect to MOV payments does not allow for the making of MOV payments by the Bank where circumstances are unfavorable to the Bank. In particular, it permits the offsetting of Notes and will allow the encashment of Notes only with the prior and specific approval of the Board.
Member countries, whose currencies do not have a fixed relationship with the US dollar but for which there have been adjustments to the exchange rate, are obliged to maintain the value of their currencies in respect of capital contributions if such currencies depreciate. These adjustments are made to maintain the value of the member’s subscriptions received by the Bank and are based on the prevailing exchange rates at the end of each reporting period, therefore reflecting fair value and can constitute a liability of the member or the Bank. As at December 31 maintenance of value on currency holdings was comprised as follows: 2020 2019 Gross carrying amount $3,572 $4,389 Allowance for ECL - -
$3,572 $4,389 An assessment of the allowance for ECL as at December 31 is as follows: Stage 1
Balance as at January 1, 2019 $651 Impairment charge (Note 24 – included in “Receivable from members” line)
(651)
Balance as at December 31, 2019
$- Impairment recovery (Note 24 – included in “Receivable from members” line)
-
Balance as at December 31, 2020
$-
As at December 31, 2020 $317 (2019: $498) was due by the Bank.
CCAARRIIBBBBEEAANN DDEEVVEELLOOPPMMEENNTT BBAANNKK OORRDDIINNAARRYY CCAAPPIITTAALL RREESSOOUURRCCEESS NNOOTTEESS TTOO TTHHEE FFIINNAANNCCIIAALL SSTTAATTEEMMEENNTTSS FFoorr tthhee yyeeaarr eennddeedd DDeecceemmbbeerr 3311,, 22002200 (expressed in thousands of United States dollars, unless otherwise stated)
- 57 -
NOTE 13 – SUBSCRIPTIONS IN ARREARS
Subscriptions in arrears are financial assets as defined in Note 5. Member countries are required to meet their obligations for paid-in shares in six instalments. The values below represent amounts that are due and not yet paid by certain members.
The amount reported as subscriptions in arrears is comprised as follows: 2020 2019 Gross carrying amount $2,970 $1,981 Allowance for ECL (27) (45)
$2,943
$1,936
An assessment of the allowance for ECL as at December 31 is as follows: Stage 1
Balance as at January 1, 2019 $327 Impairment recovery (Note 24) – included in “Receivable from members” line) (282)
Balance as at December 31, 2019 $45
Impairment recovery (Note 24) – included in “Receivable from members” line)
(18)
Balance as at December 31, 2020
$27
CCAARRIIBBBBEEAANN DDEEVVEELLOOPPMMEENNTT BBAANNKK OORRDDIINNAARRYY CCAAPPIITTAALL RREESSOOUURRCCEESS NNOOTTEESS TTOO TTHHEE FFIINNAANNCCIIAALL SSTTAATTEEMMEENNTTSS FFoorr tthhee yyeeaarr eennddeedd DDeecceemmbbeerr 3311,, 22002200 (expressed in thousands of United States dollars, unless otherwise stated)
- 56 -
NOTE 12 – MAINTENANCE OF VALUE (MOV) ON CURRENCY HOLDINGS MOV receivables are financial assets as defined in Note 5. In order to ensure that receipts for capital subscriptions originally paid in currencies other than US dollars retain at a minimum their value as determined in accordance with Article 24 of the Charter, each member is required to maintain the value of its currency held by the Bank. If in the opinion of the Bank, the value of a Member’s currency depreciates or appreciates to a significant extent, the Bank or Member may be required to repay an amount of currency equal to the increase or decrease in the value of its currency which is held by the Bank in respect of capital subscriptions. For the purposes of effecting settlement, MOV obligations are established at December 31 in each year. The Board of Directors has agreed that MOV obligations on any part of a member’s paid-up capital which is represented by loans outstanding be postponed and become payable on each portion of the principal of such loans when such portion is repaid to the Bank. MOV obligations that are not so deferred are due for settlement within 12 months of the date established. The regime approved by the Board with respect to MOV payments does not allow for the making of MOV payments by the Bank where circumstances are unfavorable to the Bank. In particular, it permits the offsetting of Notes and will allow the encashment of Notes only with the prior and specific approval of the Board.
Member countries, whose currencies do not have a fixed relationship with the US dollar but for which there have been adjustments to the exchange rate, are obliged to maintain the value of their currencies in respect of capital contributions if such currencies depreciate. These adjustments are made to maintain the value of the member’s subscriptions received by the Bank and are based on the prevailing exchange rates at the end of each reporting period, therefore reflecting fair value and can constitute a liability of the member or the Bank. As at December 31 maintenance of value on currency holdings was comprised as follows: 2020 2019 Gross carrying amount $3,572 $4,389 Allowance for ECL - -
$3,572 $4,389 An assessment of the allowance for ECL as at December 31 is as follows: Stage 1
Balance as at January 1, 2019 $651 Impairment recovery (Note 24 – included in “Receivable from members” line)
(651)
Balance as at December 31, 2019
$- Impairment recovery (Note 24 – included in “Receivable from members” line)
-
Balance as at December 31, 2020
$- As at December 31, 2020 $317 (2019: $498) was due by the Bank.
CCAARRIIBBBBEEAANN DDEEVVEELLOOPPMMEENNTT BBAANNKK OORRDDIINNAARRYY CCAAPPIITTAALL RREESSOOUURRCCEESS NNOOTTEESS TTOO TTHHEE FFIINNAANNCCIIAALL SSTTAATTEEMMEENNTTSS FFoorr tthhee yyeeaarr eennddeedd DDeecceemmbbeerr 3311,, 22002200 (expressed in thousands of United States dollars, unless otherwise stated)
- 57 -
NOTE 13 – SUBSCRIPTIONS IN ARREARS Subscriptions in arrears are financial assets as defined in Note 5. Member countries are required to meet their obligations for paid-in shares in six instalments. The values below represent amounts that are due and not yet paid by certain members. The amount reported as subscriptions in arrears is comprised as follows: 2020 2019 Gross carrying amount $2,970 $1,981 Allowance for ECL (27) (45)
$2,943
$1,936 An assessment of the allowance for ECL as at December 31 is as follows: Stage 1
Balance as at January 1, 2019 $327 Impairment recovery (Note 24) – included in “Receivable from members” line) (282)
Balance as at December 31, 2019 $45
Impairment recovery (Note 24) – included in “Receivable from members” line)
(18)
Balance as at December 31, 2020
$27

145
CARIBBEAN DEVELOPMENT BANK ANNUAL REPORT 2020
142 143
CARIBBEAN DEVELOPMENT BANK ANNUAL REPORT 2020 CARIBBEAN DEVELOPMENT BANK ANNUAL REPORT 2020
CCAARRIIBBBBEEAANN DDEEVVEELLOOPPMMEENNTT BBAANNKK OORRDDIINNAARRYY CCAAPPIITTAALL RREESSOOUURRCCEESS NNOOTTEESS TTOO TTHHEE FFIINNAANNCCIIAALL SSTTAATTEEMMEENNTTSS FFoorr tthhee yyeeaarr eennddeedd DDeecceemmbbeerr 3311,, 22002200 (expressed in thousands of United States dollars, unless otherwise stated)
- 56 -
NOTE 12 – MAINTENANCE OF VALUE (MOV) ON CURRENCY HOLDINGS
MOV receivables are financial assets as defined in Note 5. In order to ensure that receipts for capital subscriptions originally paid in currencies other than US dollars retain at a minimum their value as determined in accordance with Article 24 of the Charter, each member is required to maintain the value of its currency held by the Bank. If in the opinion of the Bank, the value of a Member’s currency depreciates or appreciates to a significant extent, the Bank or Member may be required to repay an amount of currency equal to the increase or decrease in the value of its currency which is held by the Bank in respect of capital subscriptions. For the purposes of effecting settlement, MOV obligations are established at December 31 in each year. The Board of Directors has agreed that MOV obligations on any part of a member’s paid-up capital which is represented by loans outstanding be postponed and become payable on each portion of the principal of such loans when such portion is repaid to the Bank. MOV obligations that are not so deferred are due for settlement within 12 months of the date established. The regime approved by the Board with respect to MOV payments does not allow for the making of MOV payments by the Bank where circumstances are unfavorable to the Bank. In particular, it permits the offsetting of Notes and will allow the encashment of Notes only with the prior and specific approval of the Board.
Member countries, whose currencies do not have a fixed relationship with the US dollar but for which there have been adjustments to the exchange rate, are obliged to maintain the value of their currencies in respect of capital contributions if such currencies depreciate. These adjustments are made to maintain the value of the member’s subscriptions received by the Bank and are based on the prevailing exchange rates at the end of each reporting period, therefore reflecting fair value and can constitute a liability of the member or the Bank. As at December 31 maintenance of value on currency holdings was comprised as follows: 2020 2019 Gross carrying amount $3,572 $4,389 Allowance for ECL - -
$3,572 $4,389 An assessment of the allowance for ECL as at December 31 is as follows: Stage 1
Balance as at January 1, 2019 $651 Impairment charge (Note 24 – included in “Receivable from members” line)
(651)
Balance as at December 31, 2019
$- Impairment recovery (Note 24 – included in “Receivable from members” line)
-
Balance as at December 31, 2020
$-
As at December 31, 2020 $317 (2019: $498) was due by the Bank.
CCAARRIIBBBBEEAANN DDEEVVEELLOOPPMMEENNTT BBAANNKK OORRDDIINNAARRYY CCAAPPIITTAALL RREESSOOUURRCCEESS NNOOTTEESS TTOO TTHHEE FFIINNAANNCCIIAALL SSTTAATTEEMMEENNTTSS FFoorr tthhee yyeeaarr eennddeedd DDeecceemmbbeerr 3311,, 22002200 (expressed in thousands of United States dollars, unless otherwise stated)
- 57 -
NOTE 13 – SUBSCRIPTIONS IN ARREARS
Subscriptions in arrears are financial assets as defined in Note 5. Member countries are required to meet their obligations for paid-in shares in six instalments. The values below represent amounts that are due and not yet paid by certain members.
The amount reported as subscriptions in arrears is comprised as follows: 2020 2019 Gross carrying amount $2,970 $1,981 Allowance for ECL (27) (45)
$2,943
$1,936
An assessment of the allowance for ECL as at December 31 is as follows: Stage 1
Balance as at January 1, 2019 $327 Impairment recovery (Note 24) – included in “Receivable from members” line) (282)
Balance as at December 31, 2019 $45
Impairment recovery (Note 24) – included in “Receivable from members” line)
(18)
Balance as at December 31, 2020
$27
CCAARRIIBBBBEEAANN DDEEVVEELLOOPPMMEENNTT BBAANNKK OORRDDIINNAARRYY CCAAPPIITTAALL RREESSOOUURRCCEESS NNOOTTEESS TTOO TTHHEE FFIINNAANNCCIIAALL SSTTAATTEEMMEENNTTSS FFoorr tthhee yyeeaarr eennddeedd DDeecceemmbbeerr 3311,, 22002200 (expressed in thousands of United States dollars, unless otherwise stated)
- 56 -
NOTE 12 – MAINTENANCE OF VALUE (MOV) ON CURRENCY HOLDINGS MOV receivables are financial assets as defined in Note 5. In order to ensure that receipts for capital subscriptions originally paid in currencies other than US dollars retain at a minimum their value as determined in accordance with Article 24 of the Charter, each member is required to maintain the value of its currency held by the Bank. If in the opinion of the Bank, the value of a Member’s currency depreciates or appreciates to a significant extent, the Bank or Member may be required to repay an amount of currency equal to the increase or decrease in the value of its currency which is held by the Bank in respect of capital subscriptions. For the purposes of effecting settlement, MOV obligations are established at December 31 in each year. The Board of Directors has agreed that MOV obligations on any part of a member’s paid-up capital which is represented by loans outstanding be postponed and become payable on each portion of the principal of such loans when such portion is repaid to the Bank. MOV obligations that are not so deferred are due for settlement within 12 months of the date established. The regime approved by the Board with respect to MOV payments does not allow for the making of MOV payments by the Bank where circumstances are unfavorable to the Bank. In particular, it permits the offsetting of Notes and will allow the encashment of Notes only with the prior and specific approval of the Board.
Member countries, whose currencies do not have a fixed relationship with the US dollar but for which there have been adjustments to the exchange rate, are obliged to maintain the value of their currencies in respect of capital contributions if such currencies depreciate. These adjustments are made to maintain the value of the member’s subscriptions received by the Bank and are based on the prevailing exchange rates at the end of each reporting period, therefore reflecting fair value and can constitute a liability of the member or the Bank. As at December 31 maintenance of value on currency holdings was comprised as follows: 2020 2019 Gross carrying amount $3,572 $4,389 Allowance for ECL - -
$3,572 $4,389 An assessment of the allowance for ECL as at December 31 is as follows: Stage 1
Balance as at January 1, 2019 $651 Impairment recovery (Note 24 – included in “Receivable from members” line)
(651)
Balance as at December 31, 2019
$- Impairment recovery (Note 24 – included in “Receivable from members” line)
-
Balance as at December 31, 2020
$- As at December 31, 2020 $317 (2019: $498) was due by the Bank.
CCAARRIIBBBBEEAANN DDEEVVEELLOOPPMMEENNTT BBAANNKK OORRDDIINNAARRYY CCAAPPIITTAALL RREESSOOUURRCCEESS NNOOTTEESS TTOO TTHHEE FFIINNAANNCCIIAALL SSTTAATTEEMMEENNTTSS FFoorr tthhee yyeeaarr eennddeedd DDeecceemmbbeerr 3311,, 22002200 (expressed in thousands of United States dollars, unless otherwise stated)
- 57 -
NOTE 13 – SUBSCRIPTIONS IN ARREARS Subscriptions in arrears are financial assets as defined in Note 5. Member countries are required to meet their obligations for paid-in shares in six instalments. The values below represent amounts that are due and not yet paid by certain members. The amount reported as subscriptions in arrears is comprised as follows: 2020 2019 Gross carrying amount $2,970 $1,981 Allowance for ECL (27) (45)
$2,943
$1,936 An assessment of the allowance for ECL as at December 31 is as follows: Stage 1
Balance as at January 1, 2019 $327 Impairment recovery (Note 24) – included in “Receivable from members” line) (282)
Balance as at December 31, 2019 $45
Impairment recovery (Note 24) – included in “Receivable from members” line)
(18)
Balance as at December 31, 2020
$27

146
CARIBBEAN DEVELOPMENT BANK ANNUAL REPORT 2020
144 145
CARIBBEAN DEVELOPMENT BANK ANNUAL REPORT 2020 CARIBBEAN DEVELOPMENT BANK ANNUAL REPORT 2020
CCAARRIIBBBBEEAANN DDEEVVEELLOOPPMMEENNTT BBAANNKK OORRDDIINNAARRYY CCAAPPIITTAALL RREESSOOUURRCCEESS NNOOTTEESS TTOO TTHHEE FFIINNAANNCCIIAALL SSTTAATTEEMMEENNTTSS FFoorr tthhee yyeeaarr eennddeedd DDeecceemmbbeerr 3311,, 22002200 (expressed in thousands of United States dollars, unless otherwise stated)
- 58 -
NOTE 14 – DERIVATIVE FINANCIAL INSTRUMENTS
The accounting policy is as defined in Note 5. The Bank is party to six swaps with four counterparties. Two swaps were used to transform underlying fixed rate borrowings in Japanese Yen to floating rate obligations in USD. One of these swaps has subsequently been modified to reinstate fixed rate exposure, at a rate lower than that of the original underlying note. The two fixed rate Japanese Yen notes which mature in 2022 and 2030 carry interest rates of 2.75% and 4.35%, respectively. The principal amounts due on maturity are in Japanese Yen, while the interest payments are due in USD. Two interest rate swaps were executed in August 2013 and September 2014, which transformed a fixed rate borrowing of 300 million USD into obligations with LIBOR based floating rates of interest. Both swaps mature in November 2027. A cross currency interest rate swap was also executed in July 2016 related to a bond issue of 145 million Swiss Francs. The swap was used to transform the underlying 0.297% fixed rate borrowing in Swiss Francs to LIBOR based floating rate obligations in USD. The swap matures concurrently with the borrowing in 2028. A cross currency interest rate swap was also executed in September 2020 related to a bond issue of 250 million Euros. The swap was used to transform the underlying fixed rate borrowing in Euros to LIBOR based floating rate obligations in USD. The swap matures concurrently with the borrowing in 2039. Counterparties to derivative contracts are selected in accordance with the Bank’s approved policy. In accordance with this policy, engaging in speculative activities is prohibited and all derivative financial instruments are held to maturity but may be terminated in those instances where the contract no longer satisfies the purpose for which it was intended, or is detrimental to the Bank’s profitability in any way. Derivatives are recorded at fair value and carried as assets when their fair value is positive and as liabilities when it is negative. The fair values of derivative financial instruments held at December 31, were as follows:
2020 2019 Fair values
Notional Amount
Derivative financial asset Cross currency interest rate swaps $525,467 $68,620 $42,252 Interest rate swaps $300,000 33,696 18,961 Bilateral non-performance risk adjustment (8,028) (967)
$94,288 $60,246
Derivative financial liability Cross currency interest rate swap $151,341 $- $12,765 Bilateral non-performance risk adjustment - (143)
$- $12,622
CCAARRIIBBBBEEAANN DDEEVVEELLOOPPMMEENNTT BBAANNKK OORRDDIINNAARRYY CCAAPPIITTAALL RREESSOOUURRCCEESS NNOOTTEESS TTOO TTHHEE FFIINNAANNCCIIAALL SSTTAATTEEMMEENNTTSS FFoorr tthhee yyeeaarr eennddeedd DDeecceemmbbeerr 3311,, 22002200 (expressed in thousands of United States dollars, unless otherwise stated)
- 59 -
NOTE 15 – PROPERTY AND EQUIPMENT
Property and equipment are stated at historical cost less accumulated depreciation. Historical cost includes expenditures that are directly attributable to the acquisition of the assets. Subsequent costs are included in the asset’s carrying amount or are recognised as a separate asset, as appropriate, only when it is probable that future economic benefits associated with the item will flow to the Bank and the cost of the item can be reliably measured. All repairs and maintenance are charged to operating expenses during the financial year in which they are incurred. Land is not depreciated as it is deemed to have an indefinite life. Depreciation of other assets is computed on the straight-line basis at rates considered adequate to write-off the cost of these assets over their useful lives as follows:
Years Buildings and ancillary works 15-25 Furniture and equipment 4-8 Computers 4 Motor vehicles 4 The assets’ residual value and useful lives are reviewed and adjusted if appropriate at each reporting date. Assets that are subject to depreciation are reviewed for impairment whenever events or changes in circumstances indicate that the carrying amount may not be recoverable. Where the carrying amount of an asset is greater than its estimated recoverable amount, it is written down immediately to its recoverable amount. The asset’s recoverable amount is the higher of the impaired asset’s fair value less costs to sell and its value in use. During the year the Bank undertook an assessment of the economic life of its computer assets for accounting purposes and it was determined that the current policy was still applicable. Gains or losses on disposals are determined by comparing proceeds with the carrying amount and costs to sell. These are included in the statement of comprehensive income. Under the Headquarters’ Agreement with the host country, Bank owned buildings in the host country are intended to be used for the purposes of the Bank. Land totaling 2.2 hectares and the associated buildings were conveyed to the Bank by the Government of Barbados in 1983. These assets are not accounted for by the Bank and therefore do not form part of the Bank’s financial records. Management does not consider the historical cost to be material and is in the process of obtaining legal vesting of the asset to the Bank.

147
CARIBBEAN DEVELOPMENT BANK ANNUAL REPORT 2020
144 145
CARIBBEAN DEVELOPMENT BANK ANNUAL REPORT 2020 CARIBBEAN DEVELOPMENT BANK ANNUAL REPORT 2020
CCAARRIIBBBBEEAANN DDEEVVEELLOOPPMMEENNTT BBAANNKK OORRDDIINNAARRYY CCAAPPIITTAALL RREESSOOUURRCCEESS NNOOTTEESS TTOO TTHHEE FFIINNAANNCCIIAALL SSTTAATTEEMMEENNTTSS FFoorr tthhee yyeeaarr eennddeedd DDeecceemmbbeerr 3311,, 22002200 (expressed in thousands of United States dollars, unless otherwise stated)
- 58 -
NOTE 14 – DERIVATIVE FINANCIAL INSTRUMENTS
The accounting policy is as defined in Note 5. The Bank is party to six swaps with four counterparties. Two swaps were used to transform underlying fixed rate borrowings in Japanese Yen to floating rate obligations in USD. One of these swaps has subsequently been modified to reinstate fixed rate exposure, at a rate lower than that of the original underlying note. The two fixed rate Japanese Yen notes which mature in 2022 and 2030 carry interest rates of 2.75% and 4.35%, respectively. The principal amounts due on maturity are in Japanese Yen, while the interest payments are due in USD. Two interest rate swaps were executed in August 2013 and September 2014, which transformed a fixed rate borrowing of 300 million USD into obligations with LIBOR based floating rates of interest. Both swaps mature in November 2027. A cross currency interest rate swap was also executed in July 2016 related to a bond issue of 145 million Swiss Francs. The swap was used to transform the underlying 0.297% fixed rate borrowing in Swiss Francs to LIBOR based floating rate obligations in USD. The swap matures concurrently with the borrowing in 2028. A cross currency interest rate swap was also executed in September 2020 related to a bond issue of 250 million Euros. The swap was used to transform the underlying fixed rate borrowing in Euros to LIBOR based floating rate obligations in USD. The swap matures concurrently with the borrowing in 2039. Counterparties to derivative contracts are selected in accordance with the Bank’s approved policy. In accordance with this policy, engaging in speculative activities is prohibited and all derivative financial instruments are held to maturity but may be terminated in those instances where the contract no longer satisfies the purpose for which it was intended, or is detrimental to the Bank’s profitability in any way. Derivatives are recorded at fair value and carried as assets when their fair value is positive and as liabilities when it is negative. The fair values of derivative financial instruments held at December 31, were as follows:
2020 2019 Fair values
Notional Amount
Derivative financial asset Cross currency interest rate swaps $525,467 $68,620 $42,252 Interest rate swaps $300,000 33,696 18,961 Bilateral non-performance risk adjustment (8,028) (967)
$94,288 $60,246
Derivative financial liability Cross currency interest rate swap $151,341 $- $12,765 Bilateral non-performance risk adjustment - (143)
$- $12,622
CCAARRIIBBBBEEAANN DDEEVVEELLOOPPMMEENNTT BBAANNKK OORRDDIINNAARRYY CCAAPPIITTAALL RREESSOOUURRCCEESS NNOOTTEESS TTOO TTHHEE FFIINNAANNCCIIAALL SSTTAATTEEMMEENNTTSS FFoorr tthhee yyeeaarr eennddeedd DDeecceemmbbeerr 3311,, 22002200 (expressed in thousands of United States dollars, unless otherwise stated)
- 59 -
NOTE 15 – PROPERTY AND EQUIPMENT
Property and equipment are stated at historical cost less accumulated depreciation. Historical cost includes expenditures that are directly attributable to the acquisition of the assets. Subsequent costs are included in the asset’s carrying amount or are recognised as a separate asset, as appropriate, only when it is probable that future economic benefits associated with the item will flow to the Bank and the cost of the item can be reliably measured. All repairs and maintenance are charged to operating expenses during the financial year in which they are incurred. Land is not depreciated as it is deemed to have an indefinite life. Depreciation of other assets is computed on the straight-line basis at rates considered adequate to write-off the cost of these assets over their useful lives as follows:
Years Buildings and ancillary works 15-25 Furniture and equipment 4-8 Computers 4 Motor vehicles 4 The assets’ residual value and useful lives are reviewed and adjusted if appropriate at each reporting date. Assets that are subject to depreciation are reviewed for impairment whenever events or changes in circumstances indicate that the carrying amount may not be recoverable. Where the carrying amount of an asset is greater than its estimated recoverable amount, it is written down immediately to its recoverable amount. The asset’s recoverable amount is the higher of the impaired asset’s fair value less costs to sell and its value in use. During the year the Bank undertook an assessment of the economic life of its computer assets for accounting purposes and it was determined that the current policy was still applicable. Gains or losses on disposals are determined by comparing proceeds with the carrying amount and costs to sell. These are included in the statement of comprehensive income. Under the Headquarters’ Agreement with the host country, Bank owned buildings in the host country are intended to be used for the purposes of the Bank. Land totaling 2.2 hectares and the associated buildings were conveyed to the Bank by the Government of Barbados in 1983. These assets are not accounted for by the Bank and therefore do not form part of the Bank’s financial records. Management does not consider the historical cost to be material and is in the process of obtaining legal vesting of the asset to the Bank.

148
CARIBBEAN DEVELOPMENT BANK ANNUAL REPORT 2020
146 147
CARIBBEAN DEVELOPMENT BANK ANNUAL REPORT 2020 CARIBBEAN DEVELOPMENT BANK ANNUAL REPORT 2020
CCAARRIIBBBBEEAANN DDEEVVEELLOOPPMMEENNTT BBAANNKK OORRDDIINNAARRYY CCAAPPIITTAALL RREESSOOUURRCCEESS NNOOTTEESS TTOO TTHHEE FFIINNAANNCCIIAALL SSTTAATTEEMMEENNTTSS FFoorr tthhee yyeeaarr eennddeedd DDeecceemmbbeerr 3311,, 22002200 (expressed in thousands of United States dollars, unless otherwise stated)
- 60 -
NOTE 15 – PROPERTY AND EQUIPMENT…continued The carrying values of property and equipment were as follows:
2020
Projects in
Progress
Land, Buildings
and Ancillary
Works Computers
Furniture and
Equipment Motor
Vehicles Total
Opening net book value $10,349 $4,687 $1,277 $549 $13 $16,875
Adjustments to opening cost of Motor Vehicles
-
-
-
-
(2)
(2)
Additions 3,131 - 161 24 113 3,429 Transfers from projects in progress (1,106) - - 42 - (1,064)
Depreciation expense - (303) (645) (287) (19) (1,254)
Closing net book value $12,374 $4,384 $793 $328 $105 $17,984
At December 31 Cost $12,374 $12,335 $12,898 $6,966 $378 $44,951 Accumulated depreciation - (7,951) (12,105) (6,638) (273) (26,967)
Closing net book value $12,374 $4,384 $793 $328 $105 $17,984
CCAARRIIBBBBEEAANN DDEEVVEELLOOPPMMEENNTT BBAANNKK OORRDDIINNAARRYY CCAAPPIITTAALL RREESSOOUURRCCEESS NNOOTTEESS TTOO TTHHEE FFIINNAANNCCIIAALL SSTTAATTEEMMEENNTTSS FFoorr tthhee yyeeaarr eennddeedd DDeecceemmbbeerr 3311,, 22002200 (expressed in thousands of United States dollars, unless otherwise stated)
- 61 -
NOTE 15 – PROPERTY AND EQUIPMENT…continued
2019
Projects in
Progress
Land, Buildings
and Ancillary
Works Computers
Furniture and
Equipment Motor
Vehicles Total
Opening net book value $5,285 $4,958 $2,245 $819 $53 $13,360
Adjustments to opening cost of computers
674
-
(674)
-
-
-
Additions 4,553 - 341 52 - 4,946 Transfers from projects in progress (163) 36 97 30 - - Disposals – cost - - (43) (22) - (65) Disposals - accumulated depreciation - - 43 19 - 62 Depreciation expense - (307) (732) (349) (40) (1,428)
Closing net book value $10,349 $4,687 $1,277 $549 $13 $16,875
At December 31 Cost $10,349 $12,335 $12,737 $6,900 $267 $42,588 Accumulated depreciation - (7,648) (11,460) (6,351) (254) (25,713)
Closing net book value $10,349 $4,687 $1,277 $549 $13 $16,875
NOTE 16 – FINANCIAL LIABILITIES
Financial liabilities are recognised on the statement of financial position when the Bank becomes a party to the contractual provisions of an instrument. Management determines the classification of its financial instruments at initial recognition. The Bank’s financial liabilities include accounts payable and borrowings. Further information is included at Notes 17 and 20 respectively. All financial liabilities are recognised initially at fair value and, in the case of borrowings and payables, net of directly attributable transaction costs. After initial recognition, the fair value option is not applied, and interest-bearing borrowings are subsequently measured at amortised cost using the effective interest rate (EIR) method. Gains and losses are recognised in profit and loss when the liabilities are de-recognised. Amortised cost is calculated by taking into account any discount or premium on acquisition, and fees or costs that are an integral part of the EIR. The EIR amortisation is included as a borrowing expense in the statement of comprehensive income. This category generally applies to interest-bearing borrowings.
CCAARRIIBBBBEEAANN DDEEVVEELLOOPPMMEENNTT BBAANNKK OORRDDIINNAARRYY CCAAPPIITTAALL RREESSOOUURRCCEESS NNOOTTEESS TTOO TTHHEE FFIINNAANNCCIIAALL SSTTAATTEEMMEENNTTSS FFoorr tthhee yyeeaarr eennddeedd DDeecceemmbbeerr 3311,, 22002200 (expressed in thousands of United States dollars, unless otherwise stated)
- 60 -
NOTE 15 – PROPERTY AND EQUIPMENT…continued The carrying values of property and equipment were as follows: 2020
Projects in
Progress
Land, Buildings
and Ancillary
Works Computers
Furniture and
Equipment Motor
Vehicles Total Opening net book value $10,349 $4,687 $1,277 $549 $13 $16,875
Adjustments to opening cost of Motor Vehicles
-
-
-
-
(2)
(2)
Additions 3,131 - 161 24 113 3,429 Transfers from projects in progress (1,106) - - 42 - (1,064)
Depreciation expense - (303) (645) (287) (19) (1,254) Closing net book value $12,374 $4,384 $793 $328 $105 $17,984 At December 31 Cost $12,374 $12,335 $12,898 $6,966 $378 $44,951 Accumulated depreciation - (7,951) (12,105) (6,638) (273) (26,967) Closing net book value $12,374 $4,384 $793 $328 $105 $17,984
CCAARRIIBBBBEEAANN DDEEVVEELLOOPPMMEENNTT BBAANNKK OORRDDIINNAARRYY CCAAPPIITTAALL RREESSOOUURRCCEESS NNOOTTEESS TTOO TTHHEE FFIINNAANNCCIIAALL SSTTAATTEEMMEENNTTSS FFoorr tthhee yyeeaarr eennddeedd DDeecceemmbbeerr 3311,, 22002200 (expressed in thousands of United States dollars, unless otherwise stated)
- 61 -
NOTE 15 – PROPERTY AND EQUIPMENT…continued 2019
Projects in
Progress
Land, Buildings
and Ancillary
Works Computers
Furniture and
Equipment Motor
Vehicles Total Opening net book value $5,285 $4,958 $2,245 $819 $53 $13,360
Adjustments to opening cost of computers
674
-
(674)
-
-
-
Additions 4,553 - 341 52 - 4,946 Transfers from projects in progress (163) 36 97 30 - - Disposals – cost - - (43) (22) - (65) Disposals - accumulated depreciation - - 43 19 - 62 Depreciation expense - (307) (732) (349) (40) (1,428) Closing net book value $10,349 $4,687 $1,277 $549 $13 $16,875 At December 31 Cost $10,349 $12,335 $12,737 $6,900 $267 $42,588 Accumulated depreciation - (7,648) (11,460) (6,351) (254) (25,713) Closing net book value $10,349 $4,687 $1,277 $549 $13 $16,875
NOTE 16 – FINANCIAL LIABILITIES Financial liabilities are recognised on the statement of financial position when the Bank becomes a party to the contractual provisions of an instrument. Management determines the classification of its financial instruments at initial recognition. The Bank’s financial liabilities include accounts payable, borrowings, employee benefits and MOV. Further information is included at Notes 17 and 20 respectively. All financial liabilities are recognised initially at fair value and, in the case of borrowings and payables, net of directly attributable transaction costs. After initial recognition, the fair value option is not applied, and interest-bearing borrowings are subsequently measured at amortised cost using the effective interest rate (EIR) method. Gains and losses are recognised in profit and loss when the liabilities are de-recognised. Amortised cost is calculated by taking into account any discount or premium on acquisition, and fees or costs that are an integral part of the EIR. The EIR amortisation is included as a borrowing expense in the statement of comprehensive income. This category generally applies to interest-bearing borrowings.

149
CARIBBEAN DEVELOPMENT BANK ANNUAL REPORT 2020
146 147
CARIBBEAN DEVELOPMENT BANK ANNUAL REPORT 2020 CARIBBEAN DEVELOPMENT BANK ANNUAL REPORT 2020
CCAARRIIBBBBEEAANN DDEEVVEELLOOPPMMEENNTT BBAANNKK OORRDDIINNAARRYY CCAAPPIITTAALL RREESSOOUURRCCEESS NNOOTTEESS TTOO TTHHEE FFIINNAANNCCIIAALL SSTTAATTEEMMEENNTTSS FFoorr tthhee yyeeaarr eennddeedd DDeecceemmbbeerr 3311,, 22002200 (expressed in thousands of United States dollars, unless otherwise stated)
- 60 -
NOTE 15 – PROPERTY AND EQUIPMENT…continued The carrying values of property and equipment were as follows:
2020
Projects in
Progress
Land, Buildings
and Ancillary
Works Computers
Furniture and
Equipment Motor
Vehicles Total
Opening net book value $10,349 $4,687 $1,277 $549 $13 $16,875
Adjustments to opening cost of Motor Vehicles
-
-
-
-
(2)
(2)
Additions 3,131 - 161 24 113 3,429 Transfers from projects in progress (1,106) - - 42 - (1,064)
Depreciation expense - (303) (645) (287) (19) (1,254)
Closing net book value $12,374 $4,384 $793 $328 $105 $17,984
At December 31 Cost $12,374 $12,335 $12,898 $6,966 $378 $44,951 Accumulated depreciation - (7,951) (12,105) (6,638) (273) (26,967)
Closing net book value $12,374 $4,384 $793 $328 $105 $17,984
CCAARRIIBBBBEEAANN DDEEVVEELLOOPPMMEENNTT BBAANNKK OORRDDIINNAARRYY CCAAPPIITTAALL RREESSOOUURRCCEESS NNOOTTEESS TTOO TTHHEE FFIINNAANNCCIIAALL SSTTAATTEEMMEENNTTSS FFoorr tthhee yyeeaarr eennddeedd DDeecceemmbbeerr 3311,, 22002200 (expressed in thousands of United States dollars, unless otherwise stated)
- 61 -
NOTE 15 – PROPERTY AND EQUIPMENT…continued
2019
Projects in
Progress
Land, Buildings
and Ancillary
Works Computers
Furniture and
Equipment Motor
Vehicles Total
Opening net book value $5,285 $4,958 $2,245 $819 $53 $13,360
Adjustments to opening cost of computers
674
-
(674)
-
-
-
Additions 4,553 - 341 52 - 4,946 Transfers from projects in progress (163) 36 97 30 - - Disposals – cost - - (43) (22) - (65) Disposals - accumulated depreciation - - 43 19 - 62 Depreciation expense - (307) (732) (349) (40) (1,428)
Closing net book value $10,349 $4,687 $1,277 $549 $13 $16,875
At December 31 Cost $10,349 $12,335 $12,737 $6,900 $267 $42,588 Accumulated depreciation - (7,648) (11,460) (6,351) (254) (25,713)
Closing net book value $10,349 $4,687 $1,277 $549 $13 $16,875
NOTE 16 – FINANCIAL LIABILITIES
Financial liabilities are recognised on the statement of financial position when the Bank becomes a party to the contractual provisions of an instrument. Management determines the classification of its financial instruments at initial recognition. The Bank’s financial liabilities include accounts payable and borrowings. Further information is included at Notes 17 and 20 respectively. All financial liabilities are recognised initially at fair value and, in the case of borrowings and payables, net of directly attributable transaction costs. After initial recognition, the fair value option is not applied, and interest-bearing borrowings are subsequently measured at amortised cost using the effective interest rate (EIR) method. Gains and losses are recognised in profit and loss when the liabilities are de-recognised. Amortised cost is calculated by taking into account any discount or premium on acquisition, and fees or costs that are an integral part of the EIR. The EIR amortisation is included as a borrowing expense in the statement of comprehensive income. This category generally applies to interest-bearing borrowings.
CCAARRIIBBBBEEAANN DDEEVVEELLOOPPMMEENNTT BBAANNKK OORRDDIINNAARRYY CCAAPPIITTAALL RREESSOOUURRCCEESS NNOOTTEESS TTOO TTHHEE FFIINNAANNCCIIAALL SSTTAATTEEMMEENNTTSS FFoorr tthhee yyeeaarr eennddeedd DDeecceemmbbeerr 3311,, 22002200 (expressed in thousands of United States dollars, unless otherwise stated)
- 60 -
NOTE 15 – PROPERTY AND EQUIPMENT…continued The carrying values of property and equipment were as follows: 2020
Projects in
Progress
Land, Buildings
and Ancillary
Works Computers
Furniture and
Equipment Motor
Vehicles Total Opening net book value $10,349 $4,687 $1,277 $549 $13 $16,875
Adjustments to opening cost of Motor Vehicles
-
-
-
-
(2)
(2)
Additions 3,131 - 161 24 113 3,429 Transfers from projects in progress (1,106) - - 42 - (1,064)
Depreciation expense - (303) (645) (287) (19) (1,254) Closing net book value $12,374 $4,384 $793 $328 $105 $17,984 At December 31 Cost $12,374 $12,335 $12,898 $6,966 $378 $44,951 Accumulated depreciation - (7,951) (12,105) (6,638) (273) (26,967) Closing net book value $12,374 $4,384 $793 $328 $105 $17,984
CCAARRIIBBBBEEAANN DDEEVVEELLOOPPMMEENNTT BBAANNKK OORRDDIINNAARRYY CCAAPPIITTAALL RREESSOOUURRCCEESS NNOOTTEESS TTOO TTHHEE FFIINNAANNCCIIAALL SSTTAATTEEMMEENNTTSS FFoorr tthhee yyeeaarr eennddeedd DDeecceemmbbeerr 3311,, 22002200 (expressed in thousands of United States dollars, unless otherwise stated)
- 61 -
NOTE 15 – PROPERTY AND EQUIPMENT…continued 2019
Projects in
Progress
Land, Buildings
and Ancillary
Works Computers
Furniture and
Equipment Motor
Vehicles Total Opening net book value $5,285 $4,958 $2,245 $819 $53 $13,360
Adjustments to opening cost of computers
674
-
(674)
-
-
-
Additions 4,553 - 341 52 - 4,946 Transfers from projects in progress (163) 36 97 30 - - Disposals – cost - - (43) (22) - (65) Disposals - accumulated depreciation - - 43 19 - 62 Depreciation expense - (307) (732) (349) (40) (1,428) Closing net book value $10,349 $4,687 $1,277 $549 $13 $16,875 At December 31 Cost $10,349 $12,335 $12,737 $6,900 $267 $42,588 Accumulated depreciation - (7,648) (11,460) (6,351) (254) (25,713) Closing net book value $10,349 $4,687 $1,277 $549 $13 $16,875
NOTE 16 – FINANCIAL LIABILITIES Financial liabilities are recognised on the statement of financial position when the Bank becomes a party to the contractual provisions of an instrument. Management determines the classification of its financial instruments at initial recognition. The Bank’s financial liabilities include accounts payable, borrowings, employee benefits and MOV. Further information is included at Notes 17 and 20 respectively. All financial liabilities are recognised initially at fair value and, in the case of borrowings and payables, net of directly attributable transaction costs. After initial recognition, the fair value option is not applied, and interest-bearing borrowings are subsequently measured at amortised cost using the effective interest rate (EIR) method. Gains and losses are recognised in profit and loss when the liabilities are de-recognised. Amortised cost is calculated by taking into account any discount or premium on acquisition, and fees or costs that are an integral part of the EIR. The EIR amortisation is included as a borrowing expense in the statement of comprehensive income. This category generally applies to interest-bearing borrowings.

150
CARIBBEAN DEVELOPMENT BANK ANNUAL REPORT 2020
148 149
CARIBBEAN DEVELOPMENT BANK ANNUAL REPORT 2020 CARIBBEAN DEVELOPMENT BANK ANNUAL REPORT 2020
CCAARRIIBBBBEEAANN DDEEVVEELLOOPPMMEENNTT BBAANNKK OORRDDIINNAARRYY CCAAPPIITTAALL RREESSOOUURRCCEESS NNOOTTEESS TTOO TTHHEE FFIINNAANNCCIIAALL SSTTAATTEEMMEENNTTSS FFoorr tthhee yyeeaarr eennddeedd DDeecceemmbbeerr 3311,, 22002200 (expressed in thousands of United States dollars, unless otherwise stated)
- 62 -
NOTE 16 – FINANCIAL LIABILITIES…continued Fair value measurement Fair value disclosures for financial liabilities are contained in Note 3 – Risk Management - “Fair value of financial assets and liabilities”. Fair value is determined using valuation techniques and are estimated from observable data in respect of similar financial instruments, using models to estimate the present value of future cash flows, or other valuation techniques using inputs. The Bank uses valuation techniques that are appropriate in the circumstances and for which sufficient data is available to measure fair value, maximizing the use of relevant observable inputs and minimising the use of unobservable inputs. De-recognition A financial liability is de-recognised when the obligation under the liability is discharged or cancelled or expired. When an existing financial liability is replaced by another from the same lender on substantially different terms, or the terms of an existing liability are substantially modified, such an exchange or modification is treated as the de-recognition of the original liability and the recognition of a new liability. The difference in the respective carrying amounts is recognised in the statement of comprehensive income. NOTE 17 – ACCOUNTS PAYABLE AND ACCRUED LIABILITIES The accounting policy for accounts payable is as defined at Note 16. Accrued liabilities are not financial liabilities. These are recorded as liabilities on the statement of financial position when the OCR has a present obligation (legal or constructive) as a result of a past event, it is probable that an outflow of resources embodying economic benefits will be required to settle the obligation, and a reliable estimate can be made of the amount of the obligation. Due to the short-term nature of these liabilities with no stated maturity, fair value is assumed to be equal to carrying value which is the amount payable on demand. The carrying values of accounts payable and accrued liabilities is as follows: 2020 2019
Accounts payable $6,971 $5,456 Accrued liabilities 3,886 2,795 $10,857 $8,251
NOTE 18 – DEFERRED INCOME Deferred income comprises freehold land donated to the Bank as a Government grant and is stated at historical value of $875 (2019: $875). The grant was recorded using the income approach and will be recognised in profit and loss in line with the useful life of the assets scheduled for construction on the property, approval for which was given by the Bank’s BOD and preliminary undertakings are in process.
CCAARRIIBBBBEEAANN DDEEVVEELLOOPPMMEENNTT BBAANNKK OORRDDIINNAARRYY CCAAPPIITTAALL RREESSOOUURRCCEESS NNOOTTEESS TTOO TTHHEE FFIINNAANNCCIIAALL SSTTAATTEEMMEENNTTSS FFoorr tthhee yyeeaarr eennddeedd DDeecceemmbbeerr 3311,, 22002200 (expressed in thousands of United States dollars, unless otherwise stated)
- 63 -
NOTE 19 – POST-EMPLOYMENT OBLIGATIONS
Pension obligations CDB has both a contributory defined benefit New Pension Plan (“the Plan” or “NPP”) and a hybrid Old Pension Scheme (“the Scheme” or “OPS”) to secure pensions for eligible employees of the Bank. Both the Plan and the Scheme are final salary defined benefit and are managed by independent Trustees who are appointed by representatives from the management and staff respectively and operated under the rules of respective Trust Deeds. A defined benefit plan is a pension plan having terms that specify the amount of pension benefits to be provided at a future date or after a certain period of time. The amount specified usually is a function of one or more factors such as age, years of service, and compensation prior to retirement. The cost of providing benefits under the defined benefit plan is determined using the projected unit credit method. Current service costs, past service costs and gain or loss on settlement and net interest expense or income on the net defined liability are recognised immediately in profit and loss under “Operating expenses”. Net interest is calculated by applying the discount rate to the net defined liability or asset. Re-measurements of the net defined liability/(asset) comprising actuarial gains and losses, return on plan assets excluding amounts included in net interest on the net defined liability/(asset) and any change in the effect of the asset ceiling (if applicable) excluding amounts included in net interest on the net defined liability (asset), are recognised immediately in the statement of financial position with a corresponding debit or credit to equity through other comprehensive income (“OCI”) in the period in which they occur. Re-measurements are not reclassified to profit or loss in subsequent periods.
Other post-retirement obligations The Bank provides post-retirement medical benefits to its retirees. The expected costs of these benefits are accrued over the period using an accounting methodology similar to that for defined benefit pension plans. The present value of the post-retirement obligation is determined by discounting the estimated future cash outflows (relating to service accrued to the reporting date) using the yields available on high-quality corporate bonds.
Description of the plans The plans require contributions to be made to independent investment managers under respective management agreements and who are authorised to exercise complete discretion over the investment and reinvestment of the plans’ assets and the reinvestment of the proceeds of sale and the variation of investments made.
The solvency of the plans is assessed by independent actuaries every three years to determine the funding requirements for the plans. The most recent actuarial valuation was performed as at January 1, 2020. The financial statements of the plans are audited annually by independent external auditors. The level of contributions necessary to meet future obligations is approved by the Trustees acting on professional advice.

151
CARIBBEAN DEVELOPMENT BANK ANNUAL REPORT 2020
148 149
CARIBBEAN DEVELOPMENT BANK ANNUAL REPORT 2020 CARIBBEAN DEVELOPMENT BANK ANNUAL REPORT 2020
CCAARRIIBBBBEEAANN DDEEVVEELLOOPPMMEENNTT BBAANNKK OORRDDIINNAARRYY CCAAPPIITTAALL RREESSOOUURRCCEESS NNOOTTEESS TTOO TTHHEE FFIINNAANNCCIIAALL SSTTAATTEEMMEENNTTSS FFoorr tthhee yyeeaarr eennddeedd DDeecceemmbbeerr 3311,, 22002200 (expressed in thousands of United States dollars, unless otherwise stated)
- 62 -
NOTE 16 – FINANCIAL LIABILITIES…continued Fair value measurement Fair value disclosures for financial liabilities are contained in Note 3 – Risk Management - “Fair value of financial assets and liabilities”. Fair value is determined using valuation techniques and are estimated from observable data in respect of similar financial instruments, using models to estimate the present value of future cash flows, or other valuation techniques using inputs. The Bank uses valuation techniques that are appropriate in the circumstances and for which sufficient data is available to measure fair value, maximizing the use of relevant observable inputs and minimising the use of unobservable inputs. De-recognition A financial liability is de-recognised when the obligation under the liability is discharged or cancelled or expired. When an existing financial liability is replaced by another from the same lender on substantially different terms, or the terms of an existing liability are substantially modified, such an exchange or modification is treated as the de-recognition of the original liability and the recognition of a new liability. The difference in the respective carrying amounts is recognised in the statement of comprehensive income. NOTE 17 – ACCOUNTS PAYABLE AND ACCRUED LIABILITIES The accounting policy for accounts payable is as defined at Note 16. Accrued liabilities are not financial liabilities. These are recorded as liabilities on the statement of financial position when the OCR has a present obligation (legal or constructive) as a result of a past event, it is probable that an outflow of resources embodying economic benefits will be required to settle the obligation, and a reliable estimate can be made of the amount of the obligation. Due to the short-term nature of these liabilities with no stated maturity, fair value is assumed to be equal to carrying value which is the amount payable on demand. The carrying values of accounts payable and accrued liabilities is as follows: 2020 2019
Accounts payable $6,971 $5,456 Accrued liabilities 3,886 2,795 $10,857 $8,251
NOTE 18 – DEFERRED INCOME Deferred income comprises freehold land donated to the Bank as a Government grant and is stated at historical value of $875 (2019: $875). The grant was recorded using the income approach and will be recognised in profit and loss in line with the useful life of the assets scheduled for construction on the property, approval for which was given by the Bank’s BOD and preliminary undertakings are in process.
CCAARRIIBBBBEEAANN DDEEVVEELLOOPPMMEENNTT BBAANNKK OORRDDIINNAARRYY CCAAPPIITTAALL RREESSOOUURRCCEESS NNOOTTEESS TTOO TTHHEE FFIINNAANNCCIIAALL SSTTAATTEEMMEENNTTSS FFoorr tthhee yyeeaarr eennddeedd DDeecceemmbbeerr 3311,, 22002200 (expressed in thousands of United States dollars, unless otherwise stated)
- 63 -
NOTE 19 – POST-EMPLOYMENT OBLIGATIONS
Pension obligations CDB has both a contributory defined benefit New Pension Plan (“the Plan” or “NPP”) and a hybrid Old Pension Scheme (“the Scheme” or “OPS”) to secure pensions for eligible employees of the Bank. Both the Plan and the Scheme are final salary defined benefit and are managed by independent Trustees who are appointed by representatives from the management and staff respectively and operated under the rules of respective Trust Deeds. A defined benefit plan is a pension plan having terms that specify the amount of pension benefits to be provided at a future date or after a certain period of time. The amount specified usually is a function of one or more factors such as age, years of service, and compensation prior to retirement. The cost of providing benefits under the defined benefit plan is determined using the projected unit credit method. Current service costs, past service costs and gain or loss on settlement and net interest expense or income on the net defined liability are recognised immediately in profit and loss under “Operating expenses”. Net interest is calculated by applying the discount rate to the net defined liability or asset. Re-measurements of the net defined liability/(asset) comprising actuarial gains and losses, return on plan assets excluding amounts included in net interest on the net defined liability/(asset) and any change in the effect of the asset ceiling (if applicable) excluding amounts included in net interest on the net defined liability (asset), are recognised immediately in the statement of financial position with a corresponding debit or credit to equity through other comprehensive income (“OCI”) in the period in which they occur. Re-measurements are not reclassified to profit or loss in subsequent periods.
Other post-retirement obligations The Bank provides post-retirement medical benefits to its retirees. The expected costs of these benefits are accrued over the period using an accounting methodology similar to that for defined benefit pension plans. The present value of the post-retirement obligation is determined by discounting the estimated future cash outflows (relating to service accrued to the reporting date) using the yields available on high-quality corporate bonds.
Description of the plans The plans require contributions to be made to independent investment managers under respective management agreements and who are authorised to exercise complete discretion over the investment and reinvestment of the plans’ assets and the reinvestment of the proceeds of sale and the variation of investments made.
The solvency of the plans is assessed by independent actuaries every three years to determine the funding requirements for the plans. The most recent actuarial valuation was performed as at January 1, 2020. The financial statements of the plans are audited annually by independent external auditors. The level of contributions necessary to meet future obligations is approved by the Trustees acting on professional advice.

152
CARIBBEAN DEVELOPMENT BANK ANNUAL REPORT 2020
150 151
CARIBBEAN DEVELOPMENT BANK ANNUAL REPORT 2020 CARIBBEAN DEVELOPMENT BANK ANNUAL REPORT 2020
CCAARRIIBBBBEEAANN DDEEVVEELLOOPPMMEENNTT BBAANNKK OORRDDIINNAARRYY CCAAPPIITTAALL RREESSOOUURRCCEESS NNOOTTEESS TTOO TTHHEE FFIINNAANNCCIIAALL SSTTAATTEEMMEENNTTSS FFoorr tthhee yyeeaarr eennddeedd DDeecceemmbbeerr 3311,, 22002200 (expressed in thousands of United States dollars, unless otherwise stated)
- 64 -
NOTE 19 – POST-EMPLOYMENT OBLIGATIONS...continued Description of the plans…continued With respect to the hybrid pension scheme, members other than those of the NPP or those who have completed 33 1/3 years of pensionable service, pay regular contributions of 5% of salaries. The Bank meets the balance of the cost of funding the defined benefits and must pay contributions at least equal to 16.9% of contributing members’ salaries and fund any deficit over a maximum period of 40 years. In accordance with the rules of the NPP, members contribute 7% of their annual salary and the Bank contributes such sums as are certified by the Actuary to be sufficient together with the existing assets of the plan to provide the benefits payable and preserve the solvency of the plan. The current contribution rate effective January 1, 2020 as certified by the Actuary and applied by the Bank is 31.1% (2019: 30.7%) of the aggregate amount of the annual salaries of eligible employees. All contributions (initially determined in Barbados dollars) are immediately converted to United States dollars and held or invested in that currency. The latest changes to the Plan were approved by the BOD in 2014 and in 2019. The post-retirement medical benefit is provided through a group insurance contract which is available to all defined benefit pension plan and hybrid pension scheme retirees (including those who took their hybrid pension scheme entitlement as a lump sum) provided they retired from the service of the Bank after completing at least 10 years’ service. It is not available to persons who leave the service of the Bank before retirement. The Bank and the retirees share the burden of the medical premiums using a predetermined ratio of 65% and 35% respectively. Key assumptions and quantitative sensitivity analyses The cost of the defined benefit pension plan and other post-employment medical benefits and the present value of the pension obligation are determined using independent actuarial valuations. An actuarial valuation involves making various assumptions that may differ from actual developments in the future. These include the determination of the applicable discount rate, future salary increases, mortality rates and future pension increases. Due to the complexities involved in the valuation and its long-term nature, a defined benefit obligation is highly sensitive to changes in these assumptions. All assumptions are reviewed and approved by management at each reporting date.
The parameter most subject to change is the discount rate. In determining the appropriate discount rate, Management considers the interest rates of corporate bonds in currencies consistent with the currencies of the post-employment benefit obligation with at least an ‘AA’ rating or above, as set by an internationally acknowledged rating agency, and applying a single weighted average discount rate that reflects the estimated timing and amounts of benefit payments and the currency in which the benefits are to be paid, extrapolated as needed, along the yield curve to correspond with the average expected term of the defined benefit obligation. With respect to the Post-Retirement Medical Plan, the appropriate discount rate has been determined to be based on the yield on Government of Barbados long term Bonds since there is no deep market in Barbados Dollar denominated long term Corporate Bonds. Barbados Dollar Bonds are used as the liability is denominated in that currency. The mortality rate is based on publicly available mortality tables for the specific countries. Those mortality tables tend to change only at intervals in response to demographic changes.
CCAARRIIBBBBEEAANN DDEEVVEELLOOPPMMEENNTT BBAANNKK OORRDDIINNAARRYY CCAAPPIITTAALL RREESSOOUURRCCEESS NNOOTTEESS TTOO TTHHEE FFIINNAANNCCIIAALL SSTTAATTEEMMEENNTTSS FFoorr tthhee yyeeaarr eennddeedd DDeecceemmbbeerr 3311,, 22002200 (expressed in thousands of United States dollars, unless otherwise stated)
- 65 -
NOTE 19 – POST-EMPLOYMENT OBLIGATIONS...continued Key assumptions and quantitative sensitivity analyses...continued Future salary increases and pension increases are based on expected future inflation rates of the country of the Bank’s location. The key assumptions and their sensitivity analyses are discussed further below. Risks factors that may impact the Bank The defined benefit new pension plan exposes the Bank to:
• longevity risk, • inflation risk since although pension increases are capped, the benefits to current employees are based on
final average salaries, • interest rate risk due to the liabilities being of longer duration than the dated securities; • investment risk in order to counter the inflation risk and improve the investment return. As at the reporting
date 55.45% (2019: 52.13%) of the plan assets were invested in equities. The hybrid pension scheme also exposes the Bank to the same longevity, inflation and interest rate risks. The investment risk inherent in the cash balance option has been managed by concentrating on short and medium term, high quality securities, leaving the Bank exposed to the inflation and interest rate risks in the pension option.
Net post-employment obligations 2020 2019
Defined benefit pension liability $31,337 $25,098 Hybrid pension liability 12,758 8,812 Post-retirement medical obligation 2,712 2,585
$46,807 $36,495
Net pension costs recognised in profit or loss
Defined benefit pension liability $6,517 $5,447 Hybrid pension liability 334 314 Post-retirement medical obligation 265 246
$7,116 $6,007
Net re-measurement loss/(gain) recognised in other comprehensive income
Defined benefit obligation $4,378 $8,787 Hybrid pension liability 4,706 2,866 Post-retirement medical obligation (13) 241
$9,071 $11,894

153
CARIBBEAN DEVELOPMENT BANK ANNUAL REPORT 2020
150 151
CARIBBEAN DEVELOPMENT BANK ANNUAL REPORT 2020 CARIBBEAN DEVELOPMENT BANK ANNUAL REPORT 2020
CCAARRIIBBBBEEAANN DDEEVVEELLOOPPMMEENNTT BBAANNKK OORRDDIINNAARRYY CCAAPPIITTAALL RREESSOOUURRCCEESS NNOOTTEESS TTOO TTHHEE FFIINNAANNCCIIAALL SSTTAATTEEMMEENNTTSS FFoorr tthhee yyeeaarr eennddeedd DDeecceemmbbeerr 3311,, 22002200 (expressed in thousands of United States dollars, unless otherwise stated)
- 64 -
NOTE 19 – POST-EMPLOYMENT OBLIGATIONS...continued Description of the plans…continued With respect to the hybrid pension scheme, members other than those of the NPP or those who have completed 33 1/3 years of pensionable service, pay regular contributions of 5% of salaries. The Bank meets the balance of the cost of funding the defined benefits and must pay contributions at least equal to 16.9% of contributing members’ salaries and fund any deficit over a maximum period of 40 years. In accordance with the rules of the NPP, members contribute 7% of their annual salary and the Bank contributes such sums as are certified by the Actuary to be sufficient together with the existing assets of the plan to provide the benefits payable and preserve the solvency of the plan. The current contribution rate effective January 1, 2020 as certified by the Actuary and applied by the Bank is 31.1% (2019: 30.7%) of the aggregate amount of the annual salaries of eligible employees. All contributions (initially determined in Barbados dollars) are immediately converted to United States dollars and held or invested in that currency. The latest changes to the Plan were approved by the BOD in 2014 and in 2019. The post-retirement medical benefit is provided through a group insurance contract which is available to all defined benefit pension plan and hybrid pension scheme retirees (including those who took their hybrid pension scheme entitlement as a lump sum) provided they retired from the service of the Bank after completing at least 10 years’ service. It is not available to persons who leave the service of the Bank before retirement. The Bank and the retirees share the burden of the medical premiums using a predetermined ratio of 65% and 35% respectively. Key assumptions and quantitative sensitivity analyses The cost of the defined benefit pension plan and other post-employment medical benefits and the present value of the pension obligation are determined using independent actuarial valuations. An actuarial valuation involves making various assumptions that may differ from actual developments in the future. These include the determination of the applicable discount rate, future salary increases, mortality rates and future pension increases. Due to the complexities involved in the valuation and its long-term nature, a defined benefit obligation is highly sensitive to changes in these assumptions. All assumptions are reviewed and approved by management at each reporting date.
The parameter most subject to change is the discount rate. In determining the appropriate discount rate, Management considers the interest rates of corporate bonds in currencies consistent with the currencies of the post-employment benefit obligation with at least an ‘AA’ rating or above, as set by an internationally acknowledged rating agency, and applying a single weighted average discount rate that reflects the estimated timing and amounts of benefit payments and the currency in which the benefits are to be paid, extrapolated as needed, along the yield curve to correspond with the average expected term of the defined benefit obligation. With respect to the Post-Retirement Medical Plan, the appropriate discount rate has been determined to be based on the yield on Government of Barbados long term Bonds since there is no deep market in Barbados Dollar denominated long term Corporate Bonds. Barbados Dollar Bonds are used as the liability is denominated in that currency. The mortality rate is based on publicly available mortality tables for the specific countries. Those mortality tables tend to change only at intervals in response to demographic changes.
CCAARRIIBBBBEEAANN DDEEVVEELLOOPPMMEENNTT BBAANNKK OORRDDIINNAARRYY CCAAPPIITTAALL RREESSOOUURRCCEESS NNOOTTEESS TTOO TTHHEE FFIINNAANNCCIIAALL SSTTAATTEEMMEENNTTSS FFoorr tthhee yyeeaarr eennddeedd DDeecceemmbbeerr 3311,, 22002200 (expressed in thousands of United States dollars, unless otherwise stated)
- 65 -
NOTE 19 – POST-EMPLOYMENT OBLIGATIONS...continued Key assumptions and quantitative sensitivity analyses...continued Future salary increases and pension increases are based on expected future inflation rates of the country of the Bank’s location. The key assumptions and their sensitivity analyses are discussed further below. Risks factors that may impact the Bank The defined benefit new pension plan exposes the Bank to:
• longevity risk, • inflation risk since although pension increases are capped, the benefits to current employees are based on
final average salaries, • interest rate risk due to the liabilities being of longer duration than the dated securities; • investment risk in order to counter the inflation risk and improve the investment return. As at the reporting
date 55.45% (2019: 52.13%) of the plan assets were invested in equities. The hybrid pension scheme also exposes the Bank to the same longevity, inflation and interest rate risks. The investment risk inherent in the cash balance option has been managed by concentrating on short and medium term, high quality securities, leaving the Bank exposed to the inflation and interest rate risks in the pension option.
Net post-employment obligations 2020 2019
Defined benefit pension liability $31,337 $25,098 Hybrid pension liability 12,758 8,812 Post-retirement medical obligation 2,712 2,585
$46,807 $36,495
Net pension costs recognised in profit or loss
Defined benefit pension liability $6,517 $5,447 Hybrid pension liability 334 314 Post-retirement medical obligation 265 246
$7,116 $6,007
Net re-measurement loss/(gain) recognised in other comprehensive income
Defined benefit obligation $4,378 $8,787 Hybrid pension liability 4,706 2,866 Post-retirement medical obligation (13) 241
$9,071 $11,894

154
CARIBBEAN DEVELOPMENT BANK ANNUAL REPORT 2020
152 153
CARIBBEAN DEVELOPMENT BANK ANNUAL REPORT 2020 CARIBBEAN DEVELOPMENT BANK ANNUAL REPORT 2020
CCAARRIIBBBBEEAANN DDEEVVEELLOOPPMMEENNTT BBAANNKK OORRDDIINNAARRYY CCAAPPIITTAALL RREESSOOUURRCCEESS NNOOTTEESS TTOO TTHHEE FFIINNAANNCCIIAALL SSTTAATTEEMMEENNTTSS FFoorr tthhee yyeeaarr eennddeedd DDeecceemmbbeerr 3311,, 22002200 (expressed in thousands of United States dollars, unless otherwise stated)
- 66 -
NOTE 19 – POST-EMPLOYMENT OBLIGATIONS...continued
The amounts recognised in the statement of financial position for the individual plans are determined as follows:
Pensions
Defined Benefit Pension Plan
Hybrid Pension Scheme
2020 2019 2020 2019
Present value of funded obligations $111,853 $95,943 $30,881 $27,457 Fair value of plan assets (80,516) (70,845) (18,123) (18,645) Net defined benefit liability $31,337 $25,098 $12,758 $8,812 The amounts recognised in profit or loss are as follows:
Pensions Defined Benefit Pension
Plan Hybrid Pension
Scheme
2020 2019 2020 2019
Current service costs $5,658 $4,945 $90 $84 Net interest on net defined benefit liability 859 502 244 230 Net pension cost $6,517 $5,447 $334 $314
Re-measurements recognised in other comprehensive income are as follows:
Pensions
Defined Benefit Pension Plan
Hybrid Pension
Scheme 2020 2019 2020 2019
Experience (gains)/losses $4,378 $8,787 $4,706 $2,866 Total amount recognised in other comprehensive income $4,378 $8,787 $4,706 $2,866
CCAARRIIBBBBEEAANN DDEEVVEELLOOPPMMEENNTT BBAANNKK OORRDDIINNAARRYY CCAAPPIITTAALL RREESSOOUURRCCEESS NNOOTTEESS TTOO TTHHEE FFIINNAANNCCIIAALL SSTTAATTEEMMEENNTTSS FFoorr tthhee yyeeaarr eennddeedd DDeecceemmbbeerr 3311,, 22002200 (expressed in thousands of United States dollars, unless otherwise stated)
- 67 -
NOTE 19 – POST-EMPLOYMENT OBLIGATIONS...continued
Movement in the liability recognised in the statement of financial position was as follows:
Pensions
Defined Benefit Pension Plan
Hybrid Pension Scheme
2020 2019 2020 2019
Opening defined benefit liability $25,098 $15,203 $8,812 $6,336 Net pension cost 6,517 5,447 334 314 Re-measurements recognised in other comprehensive income 4,378 8,787 4,706 2,866 Bank contributions paid (4,656) (4,339) (1,094) (704)
Balance as at December 31 $31,337 $25,098 $12,758 $8,812
Movement in the defined benefit obligation over the year was as follows:
Pensions
Defined Benefit Pension Plan
Hybrid Pension
Scheme 2020 2019 2020 2019
Balance at January 1 $95,943 $75,277 $27,457 $24,204 Current service costs 5,658 4,945 90 84 Interest costs 2,975 2,964 752 947 Members’ contributions 983 989 496 469 Re-measurements Experience adjustments (2,979) (3,245) 438 (836) Actuarial losses from changes in demographic assumptions 7,751 2,873 2,454 560 Actuarial losses) from changes in financial assumptions 6,348 14,513 2,152 3,098
Benefits paid (4,826) (2,373) (2,958) (1,069)
Balance as at December 31 $111,853 $95,943 $30,881 $27,457

155
CARIBBEAN DEVELOPMENT BANK ANNUAL REPORT 2020
152 153
CARIBBEAN DEVELOPMENT BANK ANNUAL REPORT 2020 CARIBBEAN DEVELOPMENT BANK ANNUAL REPORT 2020
CCAARRIIBBBBEEAANN DDEEVVEELLOOPPMMEENNTT BBAANNKK OORRDDIINNAARRYY CCAAPPIITTAALL RREESSOOUURRCCEESS NNOOTTEESS TTOO TTHHEE FFIINNAANNCCIIAALL SSTTAATTEEMMEENNTTSS FFoorr tthhee yyeeaarr eennddeedd DDeecceemmbbeerr 3311,, 22002200 (expressed in thousands of United States dollars, unless otherwise stated)
- 66 -
NOTE 19 – POST-EMPLOYMENT OBLIGATIONS...continued
The amounts recognised in the statement of financial position for the individual plans are determined as follows:
Pensions
Defined Benefit Pension Plan
Hybrid Pension Scheme
2020 2019 2020 2019
Present value of funded obligations $111,853 $95,943 $30,881 $27,457 Fair value of plan assets (80,516) (70,845) (18,123) (18,645) Net defined benefit liability $31,337 $25,098 $12,758 $8,812 The amounts recognised in profit or loss are as follows:
Pensions Defined Benefit Pension
Plan Hybrid Pension
Scheme
2020 2019 2020 2019
Current service costs $5,658 $4,945 $90 $84 Net interest on net defined benefit liability 859 502 244 230 Net pension cost $6,517 $5,447 $334 $314
Re-measurements recognised in other comprehensive income are as follows:
Pensions
Defined Benefit Pension Plan
Hybrid Pension
Scheme 2020 2019 2020 2019
Experience (gains)/losses $4,378 $8,787 $4,706 $2,866 Total amount recognised in other comprehensive income $4,378 $8,787 $4,706 $2,866
CCAARRIIBBBBEEAANN DDEEVVEELLOOPPMMEENNTT BBAANNKK OORRDDIINNAARRYY CCAAPPIITTAALL RREESSOOUURRCCEESS NNOOTTEESS TTOO TTHHEE FFIINNAANNCCIIAALL SSTTAATTEEMMEENNTTSS FFoorr tthhee yyeeaarr eennddeedd DDeecceemmbbeerr 3311,, 22002200 (expressed in thousands of United States dollars, unless otherwise stated)
- 67 -
NOTE 19 – POST-EMPLOYMENT OBLIGATIONS...continued
Movement in the liability recognised in the statement of financial position was as follows:
Pensions
Defined Benefit Pension Plan
Hybrid Pension Scheme
2020 2019 2020 2019
Opening defined benefit liability $25,098 $15,203 $8,812 $6,336 Net pension cost 6,517 5,447 334 314 Re-measurements recognised in other comprehensive income 4,378 8,787 4,706 2,866 Bank contributions paid (4,656) (4,339) (1,094) (704)
Balance as at December 31 $31,337 $25,098 $12,758 $8,812
Movement in the defined benefit obligation over the year was as follows:
Pensions
Defined Benefit Pension Plan
Hybrid Pension
Scheme 2020 2019 2020 2019
Balance at January 1 $95,943 $75,277 $27,457 $24,204 Current service costs 5,658 4,945 90 84 Interest costs 2,975 2,964 752 947 Members’ contributions 983 989 496 469 Re-measurements Experience adjustments (2,979) (3,245) 438 (836) Actuarial losses from changes in demographic assumptions 7,751 2,873 2,454 560 Actuarial losses) from changes in financial assumptions 6,348 14,513 2,152 3,098
Benefits paid (4,826) (2,373) (2,958) (1,069)
Balance as at December 31 $111,853 $95,943 $30,881 $27,457

156
CARIBBEAN DEVELOPMENT BANK ANNUAL REPORT 2020
154 155
CARIBBEAN DEVELOPMENT BANK ANNUAL REPORT 2020 CARIBBEAN DEVELOPMENT BANK ANNUAL REPORT 2020
CCAARRIIBBBBEEAANN DDEEVVEELLOOPPMMEENNTT BBAANNKK OORRDDIINNAARRYY CCAAPPIITTAALL RREESSOOUURRCCEESS NNOOTTEESS TTOO TTHHEE FFIINNAANNCCIIAALL SSTTAATTEEMMEENNTTSS FFoorr tthhee yyeeaarr eennddeedd DDeecceemmbbeerr 3311,, 22002200 (expressed in thousands of United States dollars, unless otherwise stated)
- 68 -
NOTE 19 – POST-EMPLOYMENT OBLIGATIONS...continued Movement in the fair value of plan assets over the year was as follows:
Pensions
Defined Benefit Pension Plan
Hybrid Pension
Scheme 2020 2019 2020 2019
Balance at January 1 $70,845 $60,074 $18,645 $17,868 Interest income 2,116 2,462 508 717 Return on plan assets, excluding interest 6,742 5,354 338 (44) Bank contributions 4,656 4,339 1,094 704 Members’ contributions 983 989 497 469 Benefits paid (4,826) (2,373) (2,959) (1,069)
Balance as at December 31 $80,516 $70,845 $18,123 $18,645
The asset allocation as at December 31 for the Defined benefit pension plan is as follows:
2020 2019 Quoted in active markets Equity securities $45,527 $36,928
$45,527 $36,928 Unquoted investments Cash and cash equivalents 2,493 2,198 Debt securities 35,202 32,878
$37,696 $35,076
Net accruals (2,706) (1,159) Total
$80,516 $70,845
The asset allocation as at December 31 for the Hybrid pension scheme is as follows:
2020 2019 Unquoted investments Government and Government guaranteed bonds $10,934 $11,113 Supranational bonds 4,608 4,539 Corporate bonds 2,273 1,515 Cash, cash equivalents and net accruals 308 1,478
Total $18,123 $18,645
CCAARRIIBBBBEEAANN DDEEVVEELLOOPPMMEENNTT BBAANNKK OORRDDIINNAARRYY CCAAPPIITTAALL RREESSOOUURRCCEESS NNOOTTEESS TTOO TTHHEE FFIINNAANNCCIIAALL SSTTAATTEEMMEENNTTSS FFoorr tthhee yyeeaarr eennddeedd DDeecceemmbbeerr 3311,, 22002200 (expressed in thousands of United States dollars, unless otherwise stated)
- 69 -
NOTE 19 – POST-EMPLOYMENT OBLIGATIONS...continued
The principal actuarial assumptions used for accounting purposes are:
Defined Benefit Pension Plans
2020 2019
Discount rate – Defined benefit pension plan 2.37% 2.97% Discount rate – Hybrid pension scheme 2.10% 2.83% Future salary increases 3.00% 4.00% Future pension increases – Defined benefit pension plan 2.00% 2.00% It was assumed that there would be no future pension increases with respect to the hybrid pension scheme.
The proportion of the defined benefit pension plan preserved members opting for pension was assumed to be 75% (2019: 75%). The proportion of other members opting for pension was assumed to be 75% (2019: 75%).
Mortality rate
Assumptions regarding future mortality experience are set based on actuarial advice, published statistics and experience. The average life expectancy in years of a pensioner retiring at age 60 for current pensioners as at the reporting date is as follows:
2020 2019
Male 24.94 years 21.7 years Female 26.99 years 26.0 years
The average life expectancy at age 60 for current members age 40 as at the reporting date is as follows:
2020 2019
Male 26.53 years 22.6 years Female 27.82 years 26.9 years
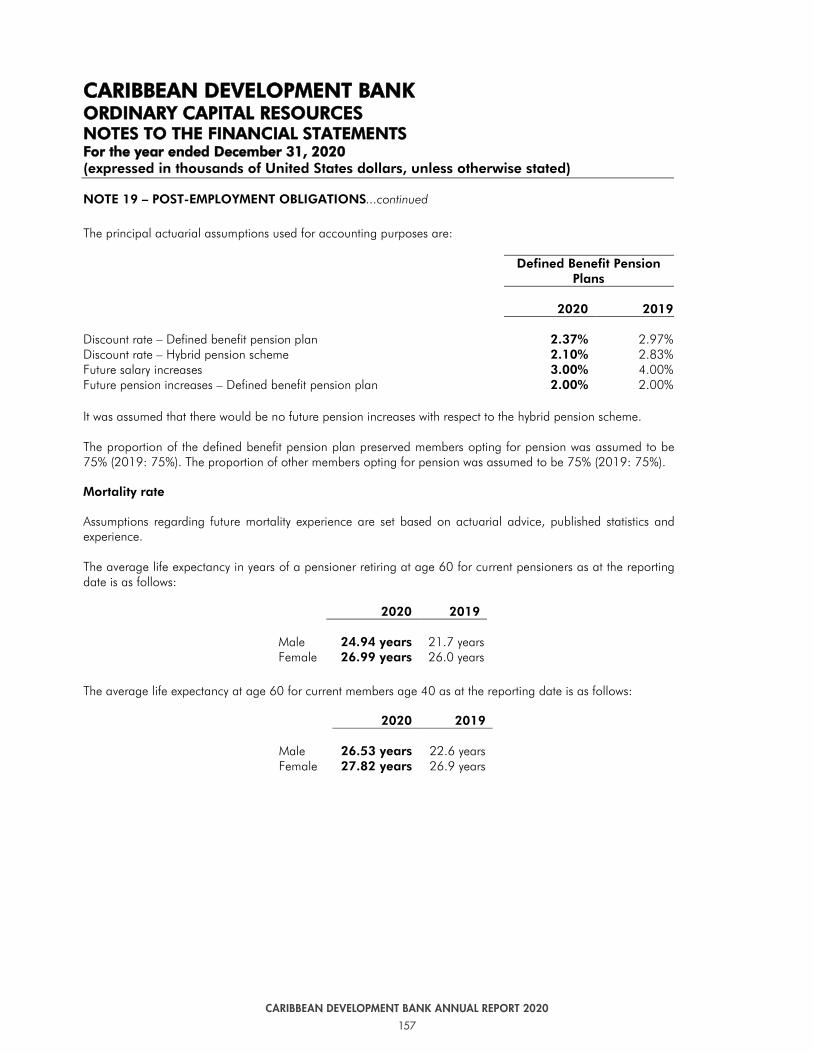
157
CARIBBEAN DEVELOPMENT BANK ANNUAL REPORT 2020
154 155
CARIBBEAN DEVELOPMENT BANK ANNUAL REPORT 2020 CARIBBEAN DEVELOPMENT BANK ANNUAL REPORT 2020
CCAARRIIBBBBEEAANN DDEEVVEELLOOPPMMEENNTT BBAANNKK OORRDDIINNAARRYY CCAAPPIITTAALL RREESSOOUURRCCEESS NNOOTTEESS TTOO TTHHEE FFIINNAANNCCIIAALL SSTTAATTEEMMEENNTTSS FFoorr tthhee yyeeaarr eennddeedd DDeecceemmbbeerr 3311,, 22002200 (expressed in thousands of United States dollars, unless otherwise stated)
- 68 -
NOTE 19 – POST-EMPLOYMENT OBLIGATIONS...continued Movement in the fair value of plan assets over the year was as follows:
Pensions
Defined Benefit Pension Plan
Hybrid Pension
Scheme 2020 2019 2020 2019
Balance at January 1 $70,845 $60,074 $18,645 $17,868 Interest income 2,116 2,462 508 717 Return on plan assets, excluding interest 6,742 5,354 338 (44) Bank contributions 4,656 4,339 1,094 704 Members’ contributions 983 989 497 469 Benefits paid (4,826) (2,373) (2,959) (1,069)
Balance as at December 31 $80,516 $70,845 $18,123 $18,645
The asset allocation as at December 31 for the Defined benefit pension plan is as follows:
2020 2019 Quoted in active markets Equity securities $45,527 $36,928
$45,527 $36,928 Unquoted investments Cash and cash equivalents 2,493 2,198 Debt securities 35,202 32,878
$37,696 $35,076
Net accruals (2,706) (1,159) Total
$80,516 $70,845
The asset allocation as at December 31 for the Hybrid pension scheme is as follows:
2020 2019 Unquoted investments Government and Government guaranteed bonds $10,934 $11,113 Supranational bonds 4,608 4,539 Corporate bonds 2,273 1,515 Cash, cash equivalents and net accruals 308 1,478
Total $18,123 $18,645
CCAARRIIBBBBEEAANN DDEEVVEELLOOPPMMEENNTT BBAANNKK OORRDDIINNAARRYY CCAAPPIITTAALL RREESSOOUURRCCEESS NNOOTTEESS TTOO TTHHEE FFIINNAANNCCIIAALL SSTTAATTEEMMEENNTTSS FFoorr tthhee yyeeaarr eennddeedd DDeecceemmbbeerr 3311,, 22002200 (expressed in thousands of United States dollars, unless otherwise stated)
- 69 -
NOTE 19 – POST-EMPLOYMENT OBLIGATIONS...continued
The principal actuarial assumptions used for accounting purposes are:
Defined Benefit Pension Plans
2020 2019
Discount rate – Defined benefit pension plan 2.37% 2.97% Discount rate – Hybrid pension scheme 2.10% 2.83% Future salary increases 3.00% 4.00% Future pension increases – Defined benefit pension plan 2.00% 2.00% It was assumed that there would be no future pension increases with respect to the hybrid pension scheme.
The proportion of the defined benefit pension plan preserved members opting for pension was assumed to be 75% (2019: 75%). The proportion of other members opting for pension was assumed to be 75% (2019: 75%).
Mortality rate
Assumptions regarding future mortality experience are set based on actuarial advice, published statistics and experience. The average life expectancy in years of a pensioner retiring at age 60 for current pensioners as at the reporting date is as follows:
2020 2019
Male 24.94 years 21.7 years Female 26.99 years 26.0 years
The average life expectancy at age 60 for current members age 40 as at the reporting date is as follows:
2020 2019
Male 26.53 years 22.6 years Female 27.82 years 26.9 years

158
CARIBBEAN DEVELOPMENT BANK ANNUAL REPORT 2020
156 157
CARIBBEAN DEVELOPMENT BANK ANNUAL REPORT 2020 CARIBBEAN DEVELOPMENT BANK ANNUAL REPORT 2020
CCAARRIIBBBBEEAANN DDEEVVEELLOOPPMMEENNTT BBAANNKK OORRDDIINNAARRYY CCAAPPIITTAALL RREESSOOUURRCCEESS NNOOTTEESS TTOO TTHHEE FFIINNAANNCCIIAALL SSTTAATTEEMMEENNTTSS FFoorr tthhee yyeeaarr eennddeedd DDeecceemmbbeerr 3311,, 22002200 (expressed in thousands of United States dollars, unless otherwise stated)
- 70 -
NOTE 19 – POST-EMPLOYMENT OBLIGATIONS...continued
Sensitivity analysis and liability profile
(a) Defined benefit pension plan
A quantitative sensitivity analysis for significant assumptions as at December 31, 2020 is as shown below:
Discount rate Future salary
increases Pension increases 1% p.a. increase
1% p.a. decrease
1% p.a. increase
1% p.a. decrease
1% p.a. increase
1% p.a. decrease
Impact on the defined benefit obligation $(17,310) $22,567 $5,333 $(4,650) $14,707 $(12,206)
Life expectancy of male pensioners
Life expectancy of female pensioners
Increase by 1 year
Decrease by 1 year
Increase by 1 year
Decrease by 1 year
Impact on the defined benefit obligation $1,818,502 $(277,925) $1,971,249 $(1,866,450)
The sensitivity analyses disclosed have been determined based on a method which extrapolates the impact on the net defined benefit obligation as a result of reasonable changes in key assumptions occurring at the end of the reporting period. The following payments are expected contributions to be made in the future years to the defined benefit obligation:
2020 2019
Within the next 12 months (annual reporting period) $3,651 $4,408 Between 1 year and 2 years $3,484 $4,366
The defined benefit obligation is allocated among the plan members as follows:
Active members………………. 52% (2019: 63%) Deferred members………………1% (2019: 1%) Pensioners…….………………..47% (2019: 36%)
The weighted average duration of the defined benefit obligation was 17.7 years (2019: 17.2 years). 89% (2019: 91%) of the benefits for active members were vested, 21% (2019: 21%) of the defined benefit obligation for active members was conditional on future salary increases.
CCAARRIIBBBBEEAANN DDEEVVEELLOOPPMMEENNTT BBAANNKK OORRDDIINNAARRYY CCAAPPIITTAALL RREESSOOUURRCCEESS NNOOTTEESS TTOO TTHHEE FFIINNAANNCCIIAALL SSTTAATTEEMMEENNTTSS FFoorr tthhee yyeeaarr eennddeedd DDeecceemmbbeerr 3311,, 22002200 (expressed in thousands of United States dollars, unless otherwise stated)
- 71 -
NOTE 19 – POST-EMPLOYMENT OBLIGATIONS…continued
Sensitivity analysis and liability profile…continued
(b) Hybrid pension scheme
A quantitative sensitivity analysis for significant assumptions as at December 31, 2020 is as shown below:
Discount rate Future salary increases 1% p.a. increase
1% p.a. decrease
1% p.a. increase
1% p.a. decrease
Impact on hybrid pension scheme $(3,122) $3,963 $258 $(244)
Life expectancy of male pensioners
Life expectancy of female pensioners
Increase by 1 year
Decrease by 1 year
Increase by 1 year
Decrease by 1 year
Impact on the hybrid pension scheme $312,365 $(277,925) $361,346 $(335,817)
The sensitivity analyses disclosed have been determined based on a method which extrapolates the impact on the net defined benefit obligation as a result of reasonable changes in key assumptions occurring at the end of the reporting period.
The following payments are expected contributions to be made in the future years to the defined benefit obligation:
2020 2019
Within the next 12 months $1,0941 $705 Between 1 year and 2 years $31,053 $706
The defined benefit obligation is allocated among the plan members as follows:
Active members………………….42% (2019: 53%) Pensioners………………………...58% (2019: 47%)
The weighted average duration of the hybrid pension scheme was 12.33 years (2019:11 years). 100% (2019: 100%) of the benefits for active members were vested, 8% (2019: 8%) of the hybrid pension scheme for active members is conditional on future salary increases.
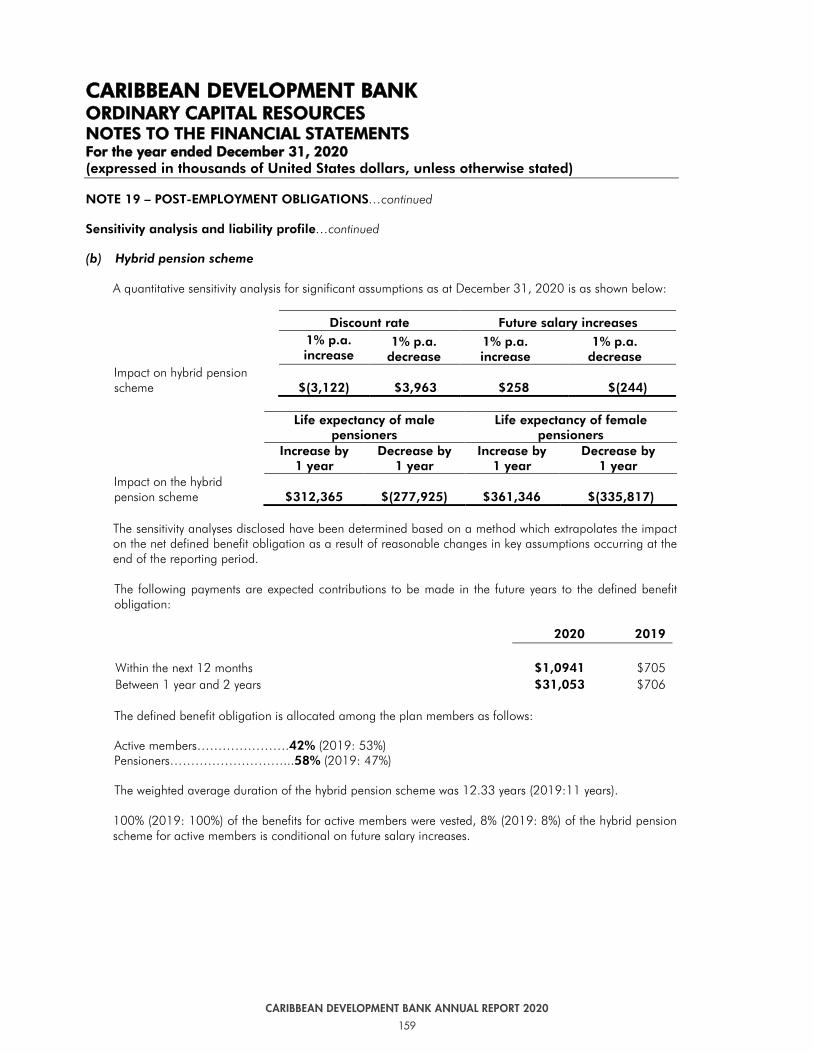
159
CARIBBEAN DEVELOPMENT BANK ANNUAL REPORT 2020
156 157
CARIBBEAN DEVELOPMENT BANK ANNUAL REPORT 2020 CARIBBEAN DEVELOPMENT BANK ANNUAL REPORT 2020
CCAARRIIBBBBEEAANN DDEEVVEELLOOPPMMEENNTT BBAANNKK OORRDDIINNAARRYY CCAAPPIITTAALL RREESSOOUURRCCEESS NNOOTTEESS TTOO TTHHEE FFIINNAANNCCIIAALL SSTTAATTEEMMEENNTTSS FFoorr tthhee yyeeaarr eennddeedd DDeecceemmbbeerr 3311,, 22002200 (expressed in thousands of United States dollars, unless otherwise stated)
- 70 -
NOTE 19 – POST-EMPLOYMENT OBLIGATIONS...continued
Sensitivity analysis and liability profile
(a) Defined benefit pension plan
A quantitative sensitivity analysis for significant assumptions as at December 31, 2020 is as shown below:
Discount rate Future salary
increases Pension increases 1% p.a. increase
1% p.a. decrease
1% p.a. increase
1% p.a. decrease
1% p.a. increase
1% p.a. decrease
Impact on the defined benefit obligation $(17,310) $22,567 $5,333 $(4,650) $14,707 $(12,206)
Life expectancy of male pensioners
Life expectancy of female pensioners
Increase by 1 year
Decrease by 1 year
Increase by 1 year
Decrease by 1 year
Impact on the defined benefit obligation $1,818,502 $(277,925) $1,971,249 $(1,866,450)
The sensitivity analyses disclosed have been determined based on a method which extrapolates the impact on the net defined benefit obligation as a result of reasonable changes in key assumptions occurring at the end of the reporting period. The following payments are expected contributions to be made in the future years to the defined benefit obligation:
2020 2019
Within the next 12 months (annual reporting period) $3,651 $4,408 Between 1 year and 2 years $3,484 $4,366
The defined benefit obligation is allocated among the plan members as follows:
Active members………………. 52% (2019: 63%) Deferred members………………1% (2019: 1%) Pensioners…….………………..47% (2019: 36%)
The weighted average duration of the defined benefit obligation was 17.7 years (2019: 17.2 years). 89% (2019: 91%) of the benefits for active members were vested, 21% (2019: 21%) of the defined benefit obligation for active members was conditional on future salary increases.
CCAARRIIBBBBEEAANN DDEEVVEELLOOPPMMEENNTT BBAANNKK OORRDDIINNAARRYY CCAAPPIITTAALL RREESSOOUURRCCEESS NNOOTTEESS TTOO TTHHEE FFIINNAANNCCIIAALL SSTTAATTEEMMEENNTTSS FFoorr tthhee yyeeaarr eennddeedd DDeecceemmbbeerr 3311,, 22002200 (expressed in thousands of United States dollars, unless otherwise stated)
- 71 -
NOTE 19 – POST-EMPLOYMENT OBLIGATIONS…continued
Sensitivity analysis and liability profile…continued
(b) Hybrid pension scheme
A quantitative sensitivity analysis for significant assumptions as at December 31, 2020 is as shown below:
Discount rate Future salary increases 1% p.a. increase
1% p.a. decrease
1% p.a. increase
1% p.a. decrease
Impact on hybrid pension scheme $(3,122) $3,963 $258 $(244)
Life expectancy of male pensioners
Life expectancy of female pensioners
Increase by 1 year
Decrease by 1 year
Increase by 1 year
Decrease by 1 year
Impact on the hybrid pension scheme $312,365 $(277,925) $361,346 $(335,817)
The sensitivity analyses disclosed have been determined based on a method which extrapolates the impact on the net defined benefit obligation as a result of reasonable changes in key assumptions occurring at the end of the reporting period.
The following payments are expected contributions to be made in the future years to the defined benefit obligation:
2020 2019
Within the next 12 months $1,0941 $705 Between 1 year and 2 years $31,053 $706
The defined benefit obligation is allocated among the plan members as follows:
Active members………………….42% (2019: 53%) Pensioners………………………...58% (2019: 47%)
The weighted average duration of the hybrid pension scheme was 12.33 years (2019:11 years). 100% (2019: 100%) of the benefits for active members were vested, 8% (2019: 8%) of the hybrid pension scheme for active members is conditional on future salary increases.

160
CARIBBEAN DEVELOPMENT BANK ANNUAL REPORT 2020
158 159
CARIBBEAN DEVELOPMENT BANK ANNUAL REPORT 2020 CARIBBEAN DEVELOPMENT BANK ANNUAL REPORT 2020
CCAA
RRIIBB
BBEEAA
NN DD
EEVVEELL
OOPPMM
EENNTT
BBAANN
KK
OORRDD
IINNAA
RRYY
CCAA
PPIITTAA
LL RREESS
OOUU
RRCC
EESS
NNOO
TTEESS
TTOO TT
HHEE
FFIINN
AANN
CCIIAA
LL SSTT
AATTEE
MMEENN
TTSS
FFoorr
tthhee
yyeeaarr
eenndd
eedd DD
eecceemm
bbeerr
3311,, 22002200
(exp
ress
ed in
th
ou
san
ds
of
Un
ited
Sta
tes
dolla
rs, u
nle
ss o
ther
wis
e st
ate
d)
-72
-
NO
TE 1
9 –
PO
ST-E
MPL
OYM
ENT
OBLI
GA
TIO
NS…
con
tin
ued
Po
st-r
etir
emen
t m
edic
al pla
n
Cha
nges
to th
e m
edic
al o
blig
atio
n ar
e de
term
ined
as
follo
ws:
Pe
nsi
on
ch
arg
e to
pro
fit &
lo
ss
Rem
easu
rem
ent
(ga
ins)
/lo
sses
in
OC
I
1-J
an
-2
0
Cu
rren
t Se
rvic
e C
ost
Net
in
tere
st
cost
Sub
-to
tal
incl
uded
in
p
rofi
t o
r lo
ss
Exp
erie
nce
a
dju
stm
ents
Net
ga
in f
rom
ch
an
ge
in f
ina
nci
al &
dem
ogra
ph
ic
ass
um
ptio
ns
Sub
-to
tal
incl
uded
in
OC
I
Prem
ium
s pa
id b
y th
e b
ank
31
-Dec
-2
0
M
edic
al
oblig
atio
n $
2,5
85
$7
1 $1
95
$266
$188
$(
201)
$(
13)
$(13
8)
$2
,71
3
Pe
nsi
on
ch
arg
e to
pro
fit &
lo
ss
Rem
easu
rem
ent
(ga
ins)
/lo
sses
in
OC
I
1-J
an
-1
9
Cu
rren
t Se
rvic
e C
ost
Net
in
tere
st
cost
Sub
-to
tal
incl
uded
in
p
rofi
t o
r lo
ss
Exp
erie
nce
a
dju
stm
ents
Loss
fro
m
ch
an
ge
in f
ina
nci
al
ass
um
ptio
ns
Sub
-to
tal
incl
uded
in
OC
I
Prem
ium
s pa
id b
y th
e b
ank
31
-Dec
-1
9
M
edic
al
oblig
atio
n $2
,210
$8
4 $1
62
$246
$492
$(
251)
$2
41
$(11
2)
$2,5
85
CCAARRIIBBBBEEAANN DDEEVVEELLOOPPMMEENNTT BBAANNKK OORRDDIINNAARRYY CCAAPPIITTAALL RREESSOOUURRCCEESS NNOOTTEESS TTOO TTHHEE FFIINNAANNCCIIAALL SSTTAATTEEMMEENNTTSS FFoorr tthhee yyeeaarr eennddeedd DDeecceemmbbeerr 3311,, 22002200 (expressed in thousands of United States dollars, unless otherwise stated)
- 73 -
NOTE 19 – POST-EMPLOYMENT OBLIGATIONS…continued Post-Retirement Medical Plan…continued
Principal actuarial assumptions
The principal actuarial assumptions used for accounting purposes are:
Post-employment medical obligation
2020 2019
Discount rate 7.50% 7.50% Medical cost increase 4.00% 4.00%
Mortality Rate
Assumptions regarding future mortality experience are set based on actuarial advice, based on published statistics and experience. The same assumptions used for the pension plans regarding mortality rates were used for the medical plan. An increase of 1 year in the assumed life expectancies would increase the medical obligation at the reporting date by $71 (2019: $75).
Sensitivity analysis
A quantitative sensitivity analysis for significant assumptions as at December 31, 2020 is as shown below:
Discount rate Medical cost increases 1% p.a. increase
1% p.a. decrease
1% p.a. increase
1% p.a. decrease
Impact on medical obligation $(285) $343 $353 $(296)
The expected contributions to be made to the post-retirement medical obligation within the next twelve months is $125 (2019: $123). Liability profile
The post-retirement medical obligation is allocated among the plan members as follows:
Active members………………..32% (2019: 38%) Pensioners……………………...68% (2019: 62%)
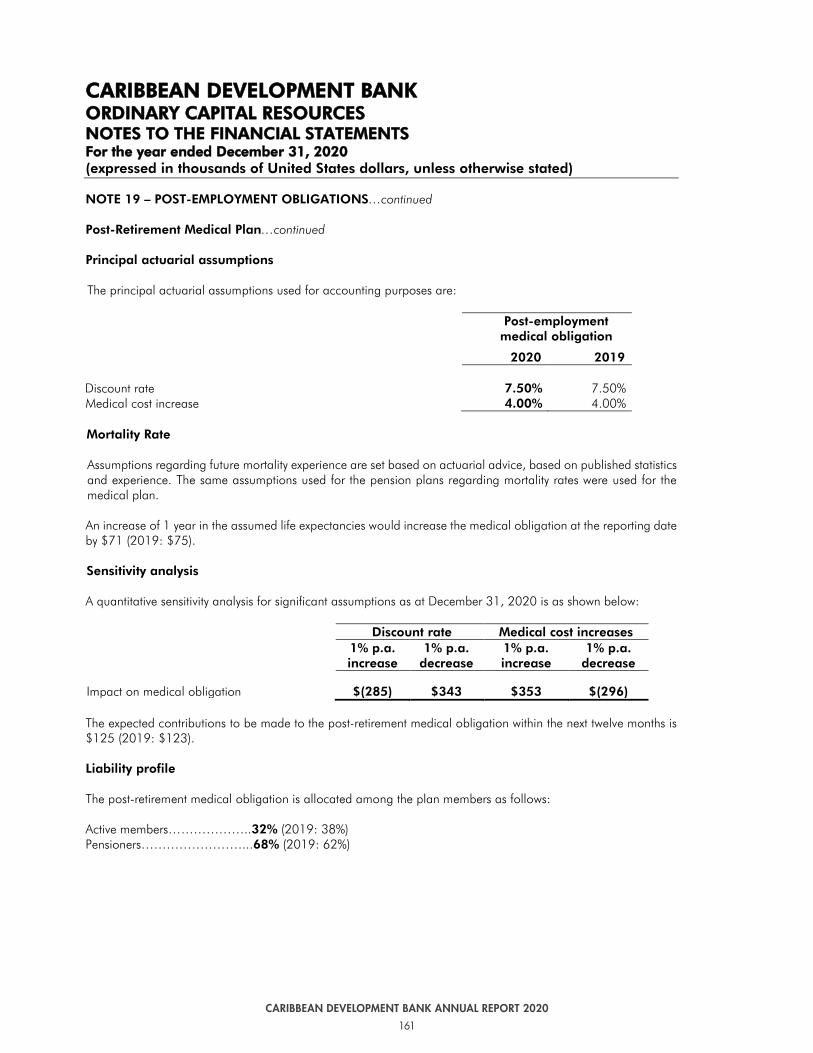
161
CARIBBEAN DEVELOPMENT BANK ANNUAL REPORT 2020
158 159
CARIBBEAN DEVELOPMENT BANK ANNUAL REPORT 2020 CARIBBEAN DEVELOPMENT BANK ANNUAL REPORT 2020
CCAA
RRIIBB
BBEEAA
NN DD
EEVVEELL
OOPPMM
EENNTT
BBAANN
KK
OORRDD
IINNAA
RRYY
CCAA
PPIITTAA
LL RREESS
OOUU
RRCC
EESS
NNOO
TTEESS
TTOO TT
HHEE
FFIINN
AANN
CCIIAA
LL SSTT
AATTEE
MMEENN
TTSS
FFoorr
tthhee
yyeeaarr
eenndd
eedd DD
eecceemm
bbeerr
3311,, 22002200
(exp
ress
ed in
th
ou
san
ds
of
Un
ited
Sta
tes
dolla
rs, u
nle
ss o
ther
wis
e st
ate
d)
-72
-
NO
TE 1
9 –
PO
ST-E
MPL
OYM
ENT
OBLI
GA
TIO
NS…
con
tin
ued
Po
st-r
etir
emen
t m
edic
al pla
n
Cha
nges
to th
e m
edic
al o
blig
atio
n ar
e de
term
ined
as
follo
ws:
Pe
nsi
on
ch
arg
e to
pro
fit &
lo
ss
Rem
easu
rem
ent
(ga
ins)
/lo
sses
in
OC
I
1-J
an
-2
0
Cu
rren
t Se
rvic
e C
ost
Net
in
tere
st
cost
Sub
-to
tal
incl
uded
in
p
rofi
t o
r lo
ss
Exp
erie
nce
a
dju
stm
ents
Net
ga
in f
rom
ch
an
ge
in f
ina
nci
al &
dem
ogra
ph
ic
ass
um
ptio
ns
Sub
-to
tal
incl
uded
in
OC
I
Prem
ium
s pa
id b
y th
e b
ank
31
-Dec
-2
0
M
edic
al
oblig
atio
n $
2,5
85
$7
1 $1
95
$266
$188
$(
201)
$(
13)
$(13
8)
$2
,71
3
Pe
nsi
on
ch
arg
e to
pro
fit &
lo
ss
Rem
easu
rem
ent
(ga
ins)
/lo
sses
in
OC
I
1-J
an
-1
9
Cu
rren
t Se
rvic
e C
ost
Net
in
tere
st
cost
Sub
-to
tal
incl
uded
in
p
rofi
t o
r lo
ss
Exp
erie
nce
a
dju
stm
ents
Loss
fro
m
ch
an
ge
in f
ina
nci
al
ass
um
ptio
ns
Sub
-to
tal
incl
uded
in
OC
I
Prem
ium
s pa
id b
y th
e b
ank
31
-Dec
-1
9
M
edic
al
oblig
atio
n $2
,210
$8
4 $1
62
$246
$492
$(
251)
$2
41
$(11
2)
$2,5
85
CCAARRIIBBBBEEAANN DDEEVVEELLOOPPMMEENNTT BBAANNKK OORRDDIINNAARRYY CCAAPPIITTAALL RREESSOOUURRCCEESS NNOOTTEESS TTOO TTHHEE FFIINNAANNCCIIAALL SSTTAATTEEMMEENNTTSS FFoorr tthhee yyeeaarr eennddeedd DDeecceemmbbeerr 3311,, 22002200 (expressed in thousands of United States dollars, unless otherwise stated)
- 73 -
NOTE 19 – POST-EMPLOYMENT OBLIGATIONS…continued Post-Retirement Medical Plan…continued
Principal actuarial assumptions
The principal actuarial assumptions used for accounting purposes are:
Post-employment medical obligation
2020 2019
Discount rate 7.50% 7.50% Medical cost increase 4.00% 4.00%
Mortality Rate
Assumptions regarding future mortality experience are set based on actuarial advice, based on published statistics and experience. The same assumptions used for the pension plans regarding mortality rates were used for the medical plan. An increase of 1 year in the assumed life expectancies would increase the medical obligation at the reporting date by $71 (2019: $75).
Sensitivity analysis
A quantitative sensitivity analysis for significant assumptions as at December 31, 2020 is as shown below:
Discount rate Medical cost increases 1% p.a. increase
1% p.a. decrease
1% p.a. increase
1% p.a. decrease
Impact on medical obligation $(285) $343 $353 $(296)
The expected contributions to be made to the post-retirement medical obligation within the next twelve months is $125 (2019: $123). Liability profile
The post-retirement medical obligation is allocated among the plan members as follows:
Active members………………..32% (2019: 38%) Pensioners……………………...68% (2019: 62%)

162
CARIBBEAN DEVELOPMENT BANK ANNUAL REPORT 2020
160 161
CARIBBEAN DEVELOPMENT BANK ANNUAL REPORT 2020 CARIBBEAN DEVELOPMENT BANK ANNUAL REPORT 2020
CCAARRIIBBBBEEAANN DDEEVVEELLOOPPMMEENNTT BBAANNKK OORRDDIINNAARRYY CCAAPPIITTAALL RREESSOOUURRCCEESS NNOOTTEESS TTOO TTHHEE FFIINNAANNCCIIAALL SSTTAATTEEMMEENNTTSS FFoorr tthhee yyeeaarr eennddeedd DDeecceemmbbeerr 3311,, 22002200 (expressed in thousands of United States dollars, unless otherwise stated)
- 74 -
NOTE 19 – POST-EMPLOYMENT OBLIGATIONS…continued Post-retirement medical plan…continued
Liability profile…continued
The weighted average duration of the post-retirement medical obligation was 11.6 years (2019: 12.4 years). 62% (2019: 59%) of the benefits of active members were vested.
NOTE 20 – BORROWINGS
The accounting policy for borrowings is as defined at Note 16. It is the Bank’s policy to limit borrowing and guarantees chargeable to the Bank’s Ordinary Capital Resources to 100% of the callable capital of its investment grade non-borrowing members plus the paid in capital and retained earnings less receivables from members (cash reserves). As of December 31, 2020, total borrowings amounted to $1,094,101 (2019: $1,103,190 ). The aggregate fair values are based on discounted cash flow models using a current yield curve appropriate for the remaining term to maturity, similar terms and credit risk. As of December 31, 2020, the ratio of total outstanding borrowings and undrawn commitments of $1,195,871 (2019: $1,235,556 ) to the borrowing limit of $1,505,018 (2019: $1,458,567) was 79.5% (2019: 84.72%).
CCAA
RRIIBB
BBEEAA
NN DD
EEVVEELL
OOPPMM
EENNTT
BBAANN
KK
OORRDD
IINNAA
RRYY
CCAA
PPIITTAA
LL RREESS
OOUU
RRCC
EESS
NNOO
TTEESS
TTOO TT
HHEE
FFIINN
AANN
CCIIAA
LL SSTT
AATTEE
MMEENN
TTSS
FFoorr
tthhee
yyeeaarr
eenndd
eedd DD
eecceemm
bbeerr
3311,, 22002200
(exp
ress
ed in
th
ou
san
ds
of
Un
ited
Sta
tes
dolla
rs, u
nle
ss o
ther
wis
e st
ate
d)
-75
-
NO
TE 2
0 –
BO
RR
OW
ING
S…co
ntin
ued
(a)
A s
umm
ary
of th
e bo
rrow
ings
was
as
follo
ws:
2020
Ori
gin
al
am
ounts
1/
Transl
atio
n
adju
stm
ents
&
oth
er
Rep
aym
ents
to
date
C
urr
ency
sw
ap
2/
Undra
wn
Outs
tandin
g
D
ue
date
s Sh
ort
ter
m B
orr
ow
ing
Line
of c
redi
t $75,0
00
$-
$(7
5,0
00)
$-
$-
$-
2020
75,0
00
-
(75,0
00)
-
-
-
CD
B M
ark
et B
orr
ow
ings
4.
35%
Not
es –
Yen
60,0
00
2,8
12
-- --
-- 62,8
12
2030
2.75
% N
otes
– Y
en
100,0
00
21,2
77
- --
-- 121,2
77
2022
4.37
5% B
onds
– U
S$
300,0
00
- -
-- --
300,0
00
2027
0.29
7% B
onds
– C
HF
151,3
41
13,2
82
- --
-- 164,6
23
2028
0.87
5% N
otes
– E
UR
275,5
50
31,3
11
- --
-- 306,8
61
2039
Una
mor
tised
tran
sact
ion
cost
s (1
6,5
19)
(1,4
34)
-- --
-- (1
7,9
53)
U
nam
ortis
ed c
urre
ncy
swap
2,1
58
- --
(969)
-- 1,1
89
872,5
30
67,2
48
-- (9
69)
-- 938,8
09
Euro
pea
n I
nve
stm
ent Bank
Glo
bal L
oan
111
– U
S$
13,2
78
- (3
,319)
-- --
9,9
59
2023
Clim
ate
Act
ion
Cre
dit I
– U
S$
65,3
20
- (2
,099)
- -
63,2
21
2032
Clim
ate
Act
ion
Cre
dit I
I– U
S$
115,8
21
- -
- (8
6,7
91)
29,0
30
2033
Una
mor
tised
tran
sact
ion
cost
s (2
40)
- -
- -
(240)
194,1
79
- (5
,418)
- (8
6,7
91)
101,9
70
Inte
r-A
mer
ican D
evel
opm
ent
Bank
Loan
926
/OC
-RG
-US$
19,3
47
- (1
8,7
91)
- --
556
2021
Loan
279
8/BL
-RG
14,0
00
- (8
46)
- (2
,198)
10,9
56
2043
Loan
356
1/O
C –
RG
20,0
00
- -
- (1
2,7
81)
7,2
19
2037
53,3
47
- (1
9,6
37)
- (1
4,9
79)
18,7
31
Agen
ce F
ranca
ise
de
Dev
eloppem
ent
33,0
00
- (2
,062)
-- -
30,9
38
2028
Su
b-t
ota
l 1,2
28,0
56
67,2
48
(102,1
17)
(969)
((101,7
70)
1,0
90,4
48
A
ccru
ed in
tere
st
3,6
53
- -
- -
3,6
53
Tota
l – D
ecem
ber
31
$1,2
31,7
09
$67,2
48
$(1
00,0
55)
$(9
69)
$(1
01,7
70)
$1,0
94,1
01
1 /
Net
of c
ance
llatio
ns a
nd b
orro
win
gs fu
lly p
aid.
2/ U
nwin
ding
of t
erm
inat
ed fa
ir va
lue
hedg
e.

163
CARIBBEAN DEVELOPMENT BANK ANNUAL REPORT 2020
160 161
CARIBBEAN DEVELOPMENT BANK ANNUAL REPORT 2020 CARIBBEAN DEVELOPMENT BANK ANNUAL REPORT 2020
CCAARRIIBBBBEEAANN DDEEVVEELLOOPPMMEENNTT BBAANNKK OORRDDIINNAARRYY CCAAPPIITTAALL RREESSOOUURRCCEESS NNOOTTEESS TTOO TTHHEE FFIINNAANNCCIIAALL SSTTAATTEEMMEENNTTSS FFoorr tthhee yyeeaarr eennddeedd DDeecceemmbbeerr 3311,, 22002200 (expressed in thousands of United States dollars, unless otherwise stated)
- 74 -
NOTE 19 – POST-EMPLOYMENT OBLIGATIONS…continued Post-retirement medical plan…continued
Liability profile…continued
The weighted average duration of the post-retirement medical obligation was 11.6 years (2019: 12.4 years). 62% (2019: 59%) of the benefits of active members were vested.
NOTE 20 – BORROWINGS
The accounting policy for borrowings is as defined at Note 16. It is the Bank’s policy to limit borrowing and guarantees chargeable to the Bank’s Ordinary Capital Resources to 100% of the callable capital of its investment grade non-borrowing members plus the paid in capital and retained earnings less receivables from members (cash reserves). As of December 31, 2020, total borrowings amounted to $1,094,101 (2019: $1,103,190 ). The aggregate fair values are based on discounted cash flow models using a current yield curve appropriate for the remaining term to maturity, similar terms and credit risk. As of December 31, 2020, the ratio of total outstanding borrowings and undrawn commitments of $1,195,871 (2019: $1,235,556 ) to the borrowing limit of $1,505,018 (2019: $1,458,567) was 79.5% (2019: 84.72%).
CCAA
RRIIBB
BBEEAA
NN DD
EEVVEELL
OOPPMM
EENNTT
BBAANN
KK
OORRDD
IINNAA
RRYY
CCAA
PPIITTAA
LL RREESS
OOUU
RRCC
EESS
NNOO
TTEESS
TTOO TT
HHEE
FFIINN
AANN
CCIIAA
LL SSTT
AATTEE
MMEENN
TTSS
FFoorr
tthhee
yyeeaarr
eenndd
eedd DD
eecceemm
bbeerr
3311,, 22002200
(exp
ress
ed in
th
ou
san
ds
of
Un
ited
Sta
tes
dolla
rs, u
nle
ss o
ther
wis
e st
ate
d)
-75
-
NO
TE 2
0 –
BO
RR
OW
ING
S…co
ntin
ued
(a)
A s
umm
ary
of th
e bo
rrow
ings
was
as
follo
ws:
2020
Ori
gin
al
am
ounts
1/
Transl
atio
n
adju
stm
ents
&
oth
er
Rep
aym
ents
to
date
C
urr
ency
sw
ap
2/
Undra
wn
Outs
tandin
g
D
ue
date
s Sh
ort
ter
m B
orr
ow
ing
Line
of c
redi
t $75,0
00
$-
$(7
5,0
00)
$-
$-
$-
2020
75,0
00
-
(75,0
00)
-
-
-
CD
B M
ark
et B
orr
ow
ings
4.
35%
Not
es –
Yen
60,0
00
2,8
12
-- --
-- 62,8
12
2030
2.75
% N
otes
– Y
en
100,0
00
21,2
77
- --
-- 121,2
77
2022
4.37
5% B
onds
– U
S$
300,0
00
- -
-- --
300,0
00
2027
0.29
7% B
onds
– C
HF
151,3
41
13,2
82
- --
-- 164,6
23
2028
0.87
5% N
otes
– E
UR
275,5
50
31,3
11
- --
-- 306,8
61
2039
Una
mor
tised
tran
sact
ion
cost
s (1
6,5
19)
(1,4
34)
-- --
-- (1
7,9
53)
U
nam
ortis
ed c
urre
ncy
swap
2,1
58
- --
(969)
-- 1,1
89
872,5
30
67,2
48
-- (9
69)
-- 938,8
09
Euro
pea
n I
nve
stm
ent Bank
Glo
bal L
oan
111
– U
S$
13,2
78
- (3
,319)
-- --
9,9
59
2023
Clim
ate
Act
ion
Cre
dit I
– U
S$
65,3
20
- (2
,099)
- -
63,2
21
2032
Clim
ate
Act
ion
Cre
dit I
I– U
S$
115,8
21
- -
- (8
6,7
91)
29,0
30
2033
Una
mor
tised
tran
sact
ion
cost
s (2
40)
- -
- -
(240)
194,1
79
- (5
,418)
- (8
6,7
91)
101,9
70
Inte
r-A
mer
ican D
evel
opm
ent
Bank
Loan
926
/OC
-RG
-US$
19,3
47
- (1
8,7
91)
- --
556
2021
Loan
279
8/BL
-RG
14,0
00
- (8
46)
- (2
,198)
10,9
56
2043
Loan
356
1/O
C –
RG
20,0
00
- -
- (1
2,7
81)
7,2
19
2037
53,3
47
- (1
9,6
37)
- (1
4,9
79)
18,7
31
Agen
ce F
ranca
ise
de
Dev
eloppem
ent
33,0
00
- (2
,062)
-- -
30,9
38
2028
Su
b-t
ota
l 1,2
28,0
56
67,2
48
(102,1
17)
(969)
((101,7
70)
1,0
90,4
48
A
ccru
ed in
tere
st
3,6
53
- -
- -
3,6
53
Tota
l – D
ecem
ber
31
$1,2
31,7
09
$67,2
48
$(1
00,0
55)
$(9
69)
$(1
01,7
70)
$1,0
94,1
01
1 /
Net
of c
ance
llatio
ns a
nd b
orro
win
gs fu
lly p
aid.
2/ U
nwin
ding
of t
erm
inat
ed fa
ir va
lue
hedg
e.

164
CARIBBEAN DEVELOPMENT BANK ANNUAL REPORT 2020
162 163
CARIBBEAN DEVELOPMENT BANK ANNUAL REPORT 2020 CARIBBEAN DEVELOPMENT BANK ANNUAL REPORT 2020
CCAA
RRIIBB
BBEEAA
NN DD
EEVVEELL
OOPPMM
EENNTT
BBAANN
KK
OORRDD
IINNAA
RRYY
CCAA
PPIITTAA
LL RREESS
OOUU
RRCC
EESS
NNOO
TTEESS
TTOO TT
HHEE
FFIINN
AANN
CCIIAA
LL SSTT
AATTEE
MMEENN
TTSS
FFoorr
tthhee
yyeeaarr
eenndd
eedd DD
eecceemm
bbeerr
3311,, 22002200
(exp
ress
ed in
th
ou
san
ds
of
Un
ited
Sta
tes
dolla
rs, u
nle
ss o
ther
wis
e st
ate
d)
-76
-
NO
TE 2
0 –
BO
RR
OW
ING
S…co
ntin
ued
2019
Ori
gin
al
am
ounts
1/
Transl
atio
n
adju
stm
ents
&
oth
er
Rep
aym
ents
to
date
C
urr
ency
sw
ap
2/
Undra
wn
Outs
tandin
g
D
ue
date
s Sh
ort
ter
m B
orr
ow
ing
Line
of c
redi
t $7
5,00
0 $-
$-
$-
$-
75
,000
20
20
75,0
00
- --
-- --
75,0
00
CD
B M
ark
et B
orr
ow
ings
4.
35%
Not
es –
Yen
60
,000
(3
37)
-- --
-- 59
,663
20
30
2.75
% N
otes
– Y
en
100,
000
15,1
97
- --
-- 11
5,19
7 20
22
4.37
5% B
onds
– U
S$
300,
000
- -
-- --
300,
000
2027
0.
297%
Bon
ds –
CH
F 15
1,34
1 (1
,175
) -
-- --
150,
166
2028
0.
875%
Not
es -
EU
R 27
5,55
0 5,
191
-- --
-- 28
0,74
1 20
39
Una
mor
tised
tran
sact
ion
cost
s (1
7,19
8)
(341
) --
-- --
(17,
539)
Una
mor
tised
cur
renc
y sw
ap
3,12
6 -
-- (9
68)
-- 2,
158
872,
819
18,5
35
-- (9
68)
-- 89
0,38
6
Euro
pea
n I
nve
stm
ent Bank
Glo
bal L
oan
111
– U
S$
34,8
57
- (2
1,57
8)
-- --
13,2
79
2023
C
limat
e A
ctio
n C
redi
t I–
US$
65
,320
-
(573
) -
(9,1
78)
55,5
69
2032
C
limat
e A
ctio
n C
redi
t II–
US$
11
8,13
3 -
- -
(89,
103)
29
,030
20
33
Una
mor
tised
tran
sact
ion
cost
s (2
59)
- -
- -
(259
)
218,
051
- (2
2,15
1)
- (9
8,28
1)
97,6
19
Inte
r-A
mer
ican D
evel
opm
ent
Bank
Loan
926
/OC
-RG
-US$
19
,347
-
(17,
679)
-
-- 1,
668
2021
Lo
an 2
798/
BL-R
G
14,0
00
- (4
07)
- (3
,274
) 10
,319
20
43
Loan
356
1/O
C –
RG
20
,000
-
- -
(12,
781)
7,
219
2037
53,3
47
- (1
8,08
6)
- (1
6,05
5 19
,206
Agen
ce F
ranca
ise
de
Dev
eloppem
ent
33,0
00
- -
-- (1
8,00
0)
15,0
00
2028
Sub-t
ota
l 1,
252,
217
18,5
35
(40,
237)
(9
68)
(132
,336
) 1,
097,
211
A
ccru
ed in
tere
st
5,97
9 -
- --
-- 5,
979
Tota
l – D
ecem
ber
31
$1,2
58,1
96
$18,5
35
$(4
0,2
37
) $(
968)
$(1
32,3
36)
$1,1
03,1
90
1 / N
et o
f can
cella
tions
and
bor
row
ings
fully
pai
d.
2/ U
nwin
ding
of t
erm
inat
ed fa
ir va
lue
hedg
e.
CCAARRIIBBBBEEAANN DDEEVVEELLOOPPMMEENNTT BBAANNKK OORRDDIINNAARRYY CCAAPPIITTAALL RREESSOOUURRCCEESS NNOOTTEESS TTOO TTHHEE FFIINNAANNCCIIAALL SSTTAATTEEMMEENNTTSS FFoorr tthhee yyeeaarr eennddeedd DDeecceemmbbeerr 3311,, 22002200 (expressed in thousands of United States dollars, unless otherwise stated)
- 77 -
NOTE 20 – BORROWINGS…continued (b) Currencies repayable on outstanding borrowings were as follows:
2020
Currencies Repayable
Outstanding at December
2019 Translation adjustment
Net interest
expense/ paid
Draw-downs
Currency swap
amortisation1/
Repayments
Outstanding at December
2020 United States Dollars $507,083 $- $- $28,256 $- $(83,460) $451,879 Swiss Francs 150,166 14,457 - - - - 164,623 Euro 280,741 26,120 - - - - 306,861 Japanese Yen 177,019 9,229 - - (969) - 185,279 Sub-total 1,115,009 49,806 - 28,256 (969) (83,460) $1,108,642 Amortised borrowing costs (17,798) (1,434) - 1,038 - - (18,194) Accrued interest 5,979 - (2,326) - - - 3,653 Total – December 31 $1,103,190 $48,3722/ $(2,326) $29,294 $(969) $(83,460) $1,094,101
2019
Currencies Repayable
Outstanding at
December 2018
Translation adjustment
Net interest
expense/ paid
Draw-downs
Currency swap
amortisation1/
Repayments
Outstanding at December
2019 United States Dollars $468,946 $- $- $83,549 $- $(45,412) $507,083 Swiss Francs 147,358 2,808 - - - - 150,166 Euro - - - 280,741 - - 280,741 Japanese Yen 175,822 2,165 - - (968) - 177,019 Sub-total 792,126 4,973 - 364,290 (968) (45,412) $1,115,009 Amortised borrowing costs (2,304) (10) - (15,484) - - (17,798) Accrued interest 6,456 - (477) - - - 5,979 Total – December 31 $796,278 $4,963 $(477) $348,806 $(968) $(45,412) $1,103,190 1/Unwinding of terminated fair value hedge. 2/ Includes translation amount of $7,313 recorded in foreign exchange translation operating expenses detailed at Note 23.

165
CARIBBEAN DEVELOPMENT BANK ANNUAL REPORT 2020
162 163
CARIBBEAN DEVELOPMENT BANK ANNUAL REPORT 2020 CARIBBEAN DEVELOPMENT BANK ANNUAL REPORT 2020
CCAA
RRIIBB
BBEEAA
NN DD
EEVVEELL
OOPPMM
EENNTT
BBAANN
KK
OORRDD
IINNAA
RRYY
CCAA
PPIITTAA
LL RREESS
OOUU
RRCC
EESS
NNOO
TTEESS
TTOO TT
HHEE
FFIINN
AANN
CCIIAA
LL SSTT
AATTEE
MMEENN
TTSS
FFoorr
tthhee
yyeeaarr
eenndd
eedd DD
eecceemm
bbeerr
3311,, 22002200
(exp
ress
ed in
th
ou
san
ds
of
Un
ited
Sta
tes
dolla
rs, u
nle
ss o
ther
wis
e st
ate
d)
-76
-
NO
TE 2
0 –
BO
RR
OW
ING
S…co
ntin
ued
2019
Ori
gin
al
am
ounts
1/
Transl
atio
n
adju
stm
ents
&
oth
er
Rep
aym
ents
to
date
C
urr
ency
sw
ap
2/
Undra
wn
Outs
tandin
g
D
ue
date
s Sh
ort
ter
m B
orr
ow
ing
Line
of c
redi
t $7
5,00
0 $-
$-
$-
$-
75
,000
20
20
75,0
00
- --
-- --
75,0
00
CD
B M
ark
et B
orr
ow
ings
4.
35%
Not
es –
Yen
60
,000
(3
37)
-- --
-- 59
,663
20
30
2.75
% N
otes
– Y
en
100,
000
15,1
97
- --
-- 11
5,19
7 20
22
4.37
5% B
onds
– U
S$
300,
000
- -
-- --
300,
000
2027
0.
297%
Bon
ds –
CH
F 15
1,34
1 (1
,175
) -
-- --
150,
166
2028
0.
875%
Not
es -
EU
R 27
5,55
0 5,
191
-- --
-- 28
0,74
1 20
39
Una
mor
tised
tran
sact
ion
cost
s (1
7,19
8)
(341
) --
-- --
(17,
539)
Una
mor
tised
cur
renc
y sw
ap
3,12
6 -
-- (9
68)
-- 2,
158
872,
819
18,5
35
-- (9
68)
-- 89
0,38
6
Euro
pea
n I
nve
stm
ent Bank
Glo
bal L
oan
111
– U
S$
34,8
57
- (2
1,57
8)
-- --
13,2
79
2023
C
limat
e A
ctio
n C
redi
t I–
US$
65
,320
-
(573
) -
(9,1
78)
55,5
69
2032
C
limat
e A
ctio
n C
redi
t II–
US$
11
8,13
3 -
- -
(89,
103)
29
,030
20
33
Una
mor
tised
tran
sact
ion
cost
s (2
59)
- -
- -
(259
)
218,
051
- (2
2,15
1)
- (9
8,28
1)
97,6
19
Inte
r-A
mer
ican D
evel
opm
ent
Bank
Loan
926
/OC
-RG
-US$
19
,347
-
(17,
679)
-
-- 1,
668
2021
Lo
an 2
798/
BL-R
G
14,0
00
- (4
07)
- (3
,274
) 10
,319
20
43
Loan
356
1/O
C –
RG
20
,000
-
- -
(12,
781)
7,
219
2037
53,3
47
- (1
8,08
6)
- (1
6,05
5 19
,206
Agen
ce F
ranca
ise
de
Dev
eloppem
ent
33,0
00
- -
-- (1
8,00
0)
15,0
00
2028
Sub-t
ota
l 1,
252,
217
18,5
35
(40,
237)
(9
68)
(132
,336
) 1,
097,
211
A
ccru
ed in
tere
st
5,97
9 -
- --
-- 5,
979
Tota
l – D
ecem
ber
31
$1,2
58,1
96
$18,5
35
$(4
0,2
37
) $(
968)
$(1
32,3
36)
$1,1
03,1
90
1 / N
et o
f can
cella
tions
and
bor
row
ings
fully
pai
d.
2/ U
nwin
ding
of t
erm
inat
ed fa
ir va
lue
hedg
e.
CCAARRIIBBBBEEAANN DDEEVVEELLOOPPMMEENNTT BBAANNKK OORRDDIINNAARRYY CCAAPPIITTAALL RREESSOOUURRCCEESS NNOOTTEESS TTOO TTHHEE FFIINNAANNCCIIAALL SSTTAATTEEMMEENNTTSS FFoorr tthhee yyeeaarr eennddeedd DDeecceemmbbeerr 3311,, 22002200 (expressed in thousands of United States dollars, unless otherwise stated)
- 77 -
NOTE 20 – BORROWINGS…continued (b) Currencies repayable on outstanding borrowings were as follows:
2020
Currencies Repayable
Outstanding at December
2019 Translation adjustment
Net interest
expense/ paid
Draw-downs
Currency swap
amortisation1/
Repayments
Outstanding at December
2020 United States Dollars $507,083 $- $- $28,256 $- $(83,460) $451,879 Swiss Francs 150,166 14,457 - - - - 164,623 Euro 280,741 26,120 - - - - 306,861 Japanese Yen 177,019 9,229 - - (969) - 185,279 Sub-total 1,115,009 49,806 - 28,256 (969) (83,460) $1,108,642 Amortised borrowing costs (17,798) (1,434) - 1,038 - - (18,194) Accrued interest 5,979 - (2,326) - - - 3,653 Total – December 31 $1,103,190 $48,3722/ $(2,326) $29,294 $(969) $(83,460) $1,094,101
2019
Currencies Repayable
Outstanding at
December 2018
Translation adjustment
Net interest
expense/ paid
Draw-downs
Currency swap
amortisation1/
Repayments
Outstanding at December
2019 United States Dollars $468,946 $- $- $83,549 $- $(45,412) $507,083 Swiss Francs 147,358 2,808 - - - - 150,166 Euro - - - 280,741 - - 280,741 Japanese Yen 175,822 2,165 - - (968) - 177,019 Sub-total 792,126 4,973 - 364,290 (968) (45,412) $1,115,009 Amortised borrowing costs (2,304) (10) - (15,484) - - (17,798) Accrued interest 6,456 - (477) - - - 5,979 Total – December 31 $796,278 $4,963 $(477) $348,806 $(968) $(45,412) $1,103,190 1/Unwinding of terminated fair value hedge. 2/ Includes translation amount of $7,313 recorded in foreign exchange translation operating expenses detailed at Note 23.

166
CARIBBEAN DEVELOPMENT BANK ANNUAL REPORT 2020
164 165
CARIBBEAN DEVELOPMENT BANK ANNUAL REPORT 2020 CARIBBEAN DEVELOPMENT BANK ANNUAL REPORT 2020
CCAARRIIBBBBEEAANN DDEEVVEELLOOPPMMEENNTT BBAANNKK OORRDDIINNAARRYY CCAAPPIITTAALL RREESSOOUURRCCEESS NNOOTTEESS TTOO TTHHEE FFIINNAANNCCIIAALL SSTTAATTEEMMEENNTTSS FFoorr tthhee yyeeaarr eennddeedd DDeecceemmbbeerr 3311,, 22002200 (expressed in thousands of United States dollars, unless otherwise stated)
- 78 -
NOTE 20 – BORROWINGS…continued A maturity analysis of borrowings as at December 31 is as follows: 2020 2019
Current $17,261 $88,002 Non-current 1,076,840 1,015,188 $1,094,101 $1,103,190
On May 26, 2020 Standard & Poor’s reaffirmed the Bank’s long-term issuer credit rating of ‘AA+’ and its short-term credit rating of 'A-1+', both with a Stable outlook. On November 20, 2020 Moody’s Investors Service reaffirmed the Bank’s long-term issuer rating at ‘Aa1’ and maintained the Stable outlook. On March 4, 2020 Fitch Ratings Limited affirmed the Bank’s Long-Term Issuer Default rating of ‘AA+’ with a Stable Outlook and a Short-Term Issuer Default rating of ‘F1+’. NOTE 21 – EQUITY
Equity is comprised of capital stock, retained earnings and reserves. The capital stock of the Bank was initially expressed in terms of United States dollars of the weight and fineness in effect on September 1, 1969 (“the 1969 dollar”). However, with effect from April 1, 1978, the Second Amendment to the Articles of Agreement of the International Monetary Fund came into force, as a result of which currencies no longer have par values in terms of gold. Prior to December 1986, the Bank had not taken a decision on the implications of this change on the valuation of its capital stock and had translated its capital stock into current United States dollars at the rate of 1.206348 current United States dollars (“current dollars”) per 1969 dollar. On December 11, 1986, the Board of Directors of the Bank agreed that, until such time as the Charter may be amended in respect of the standard of value, the expression "United States dollars of the weight and fineness in effect on September 1, 1969" be interpreted, pursuant to Article 59 of the Charter, to mean the "Special Drawing Right" (SDR) introduced by the International Monetary Fund as the SDR was valued in terms of United States dollars immediately before the introduction of the basket method of valuing the SDR on July 1, 1974, such value being 1.206348 current dollars for one SDR as at June 30, 1974 (“the 1974 SDR”). For the purposes of the financial statements, the Bank has expressed the value of its capital stock on the basis of the 1974 SDR. The Bank’s capital stock is divided into paid-in shares and callable shares. Payment of the amount subscribed to the callable capital is subject to call by the Bank to meet its obligations as and when required by the Bank subject to certain conditions. Payment for paid-in shares subscribed by its members is made over six (6) annual instalments. Of each installment, up to 50 percent is payable in non-negotiable, non-interest-bearing promissory notes or other obligations issued by the subscribing member and payable at their par value upon demand. Subscriptions that are not yet payable are presented as subscriptions not yet matured. Amounts paid in advance of the due dates by members are treated as a liability and classified as subscriptions in advance. The Charter states that payment of the amount subscribed to the callable capital is subject to call by the Bank to meet its obligations incurred pursuant to Article 7, paragraph 6 taking into account paragraphs (b) and (d) of Article 13 on borrowings of funds or on guarantees, only as and when required by the Bank.
CCAARRIIBBBBEEAANN DDEEVVEELLOOPPMMEENNTT BBAANNKK OORRDDIINNAARRYY CCAAPPIITTAALL RREESSOOUURRCCEESS NNOOTTEESS TTOO TTHHEE FFIINNAANNCCIIAALL SSTTAATTEEMMEENNTTSS FFoorr tthhee yyeeaarr eennddeedd DDeecceemmbbeerr 3311,, 22002200 (expressed in thousands of United States dollars, unless otherwise stated)
- 79 -
NOTE 21 – EQUITY…continued
The Charter also allows for a member country to withdraw from the Bank, at which time the Bank is required to arrange for the repurchase of the former member’s shares. There has been only one occurrence of membership withdrawal in the Bank’s existence which occurred in 2000, and no other member has indicated to the Bank that it intends to withdraw its membership. The stability in the membership reflects the fact that the purpose of the Bank is to contribute to the harmonious economic growth and development of its BMCs individually and jointly. Moreover, there is a significant financial disincentive to withdrawing membership. The repurchase price of the shares is the value shown on the books of the Bank on the date a country ceases to be a member. However, the former member shall remain liable for direct obligations and contingent liabilities to the Bank for so long as any part of the loans or guarantees contracted before the date of withdrawal are outstanding. The Bank may partially or fully offset amounts due for shares purchased against the member’s liabilities on loans and guarantees due to the Bank. Were a member to withdraw, the Bank may set the dates in respect of payments for shares repurchased. In the instance where paying a former member would have adverse consequences for the Bank’s financial position, the Bank can exercise its option to defer payment until the risk has passed, and indefinitely if appropriate.
If the Bank were to terminate its operations, within six months of the termination date all liabilities of the Bank would first be settled out of the assets of the Bank and then, if necessary, out of members’ callable capital, before any distribution could be made to any member country, including the withdrawing member. Management has therefore determined that members’ shares are deemed to be a permanent investment in the Bank and are appropriately classified as equity. (a) At the fortieth meeting of the Board of Governors in May 2010, a general capital increase of 150% was
approved. The Bank’s capital as at December 31 was as follows:
2020 2019 Authorised capital: 312,971 shares (2019: 312,971) shares Subscribed capital 279,399 shares (2019: 279,399) shares $1,763,656 $1,763,656 Less callable capital: 218,050 shares (2019: 218,050) shares (1,375,135) (1,375,135)
Paid-up capital: 61,349 shares (2019: 61,349) shares $388,521 $388,521 Less: Prepayment discount (344) (1,334)
$388,177 $387,187

167
CARIBBEAN DEVELOPMENT BANK ANNUAL REPORT 2020
164 165
CARIBBEAN DEVELOPMENT BANK ANNUAL REPORT 2020 CARIBBEAN DEVELOPMENT BANK ANNUAL REPORT 2020
CCAARRIIBBBBEEAANN DDEEVVEELLOOPPMMEENNTT BBAANNKK OORRDDIINNAARRYY CCAAPPIITTAALL RREESSOOUURRCCEESS NNOOTTEESS TTOO TTHHEE FFIINNAANNCCIIAALL SSTTAATTEEMMEENNTTSS FFoorr tthhee yyeeaarr eennddeedd DDeecceemmbbeerr 3311,, 22002200 (expressed in thousands of United States dollars, unless otherwise stated)
- 78 -
NOTE 20 – BORROWINGS…continued A maturity analysis of borrowings as at December 31 is as follows: 2020 2019
Current $17,261 $88,002 Non-current 1,076,840 1,015,188 $1,094,101 $1,103,190
On May 26, 2020 Standard & Poor’s reaffirmed the Bank’s long-term issuer credit rating of ‘AA+’ and its short-term credit rating of 'A-1+', both with a Stable outlook. On November 20, 2020 Moody’s Investors Service reaffirmed the Bank’s long-term issuer rating at ‘Aa1’ and maintained the Stable outlook. On March 4, 2020 Fitch Ratings Limited affirmed the Bank’s Long-Term Issuer Default rating of ‘AA+’ with a Stable Outlook and a Short-Term Issuer Default rating of ‘F1+’. NOTE 21 – EQUITY
Equity is comprised of capital stock, retained earnings and reserves. The capital stock of the Bank was initially expressed in terms of United States dollars of the weight and fineness in effect on September 1, 1969 (“the 1969 dollar”). However, with effect from April 1, 1978, the Second Amendment to the Articles of Agreement of the International Monetary Fund came into force, as a result of which currencies no longer have par values in terms of gold. Prior to December 1986, the Bank had not taken a decision on the implications of this change on the valuation of its capital stock and had translated its capital stock into current United States dollars at the rate of 1.206348 current United States dollars (“current dollars”) per 1969 dollar. On December 11, 1986, the Board of Directors of the Bank agreed that, until such time as the Charter may be amended in respect of the standard of value, the expression "United States dollars of the weight and fineness in effect on September 1, 1969" be interpreted, pursuant to Article 59 of the Charter, to mean the "Special Drawing Right" (SDR) introduced by the International Monetary Fund as the SDR was valued in terms of United States dollars immediately before the introduction of the basket method of valuing the SDR on July 1, 1974, such value being 1.206348 current dollars for one SDR as at June 30, 1974 (“the 1974 SDR”). For the purposes of the financial statements, the Bank has expressed the value of its capital stock on the basis of the 1974 SDR. The Bank’s capital stock is divided into paid-in shares and callable shares. Payment of the amount subscribed to the callable capital is subject to call by the Bank to meet its obligations as and when required by the Bank subject to certain conditions. Payment for paid-in shares subscribed by its members is made over six (6) annual instalments. Of each installment, up to 50 percent is payable in non-negotiable, non-interest-bearing promissory notes or other obligations issued by the subscribing member and payable at their par value upon demand. Subscriptions that are not yet payable are presented as subscriptions not yet matured. Amounts paid in advance of the due dates by members are treated as a liability and classified as subscriptions in advance. The Charter states that payment of the amount subscribed to the callable capital is subject to call by the Bank to meet its obligations incurred pursuant to Article 7, paragraph 6 taking into account paragraphs (b) and (d) of Article 13 on borrowings of funds or on guarantees, only as and when required by the Bank.
CCAARRIIBBBBEEAANN DDEEVVEELLOOPPMMEENNTT BBAANNKK OORRDDIINNAARRYY CCAAPPIITTAALL RREESSOOUURRCCEESS NNOOTTEESS TTOO TTHHEE FFIINNAANNCCIIAALL SSTTAATTEEMMEENNTTSS FFoorr tthhee yyeeaarr eennddeedd DDeecceemmbbeerr 3311,, 22002200 (expressed in thousands of United States dollars, unless otherwise stated)
- 79 -
NOTE 21 – EQUITY…continued
The Charter also allows for a member country to withdraw from the Bank, at which time the Bank is required to arrange for the repurchase of the former member’s shares. There has been only one occurrence of membership withdrawal in the Bank’s existence which occurred in 2000, and no other member has indicated to the Bank that it intends to withdraw its membership. The stability in the membership reflects the fact that the purpose of the Bank is to contribute to the harmonious economic growth and development of its BMCs individually and jointly. Moreover, there is a significant financial disincentive to withdrawing membership. The repurchase price of the shares is the value shown on the books of the Bank on the date a country ceases to be a member. However, the former member shall remain liable for direct obligations and contingent liabilities to the Bank for so long as any part of the loans or guarantees contracted before the date of withdrawal are outstanding. The Bank may partially or fully offset amounts due for shares purchased against the member’s liabilities on loans and guarantees due to the Bank. Were a member to withdraw, the Bank may set the dates in respect of payments for shares repurchased. In the instance where paying a former member would have adverse consequences for the Bank’s financial position, the Bank can exercise its option to defer payment until the risk has passed, and indefinitely if appropriate.
If the Bank were to terminate its operations, within six months of the termination date all liabilities of the Bank would first be settled out of the assets of the Bank and then, if necessary, out of members’ callable capital, before any distribution could be made to any member country, including the withdrawing member. Management has therefore determined that members’ shares are deemed to be a permanent investment in the Bank and are appropriately classified as equity. (a) At the fortieth meeting of the Board of Governors in May 2010, a general capital increase of 150% was
approved. The Bank’s capital as at December 31 was as follows:
2020 2019 Authorised capital: 312,971 shares (2019: 312,971) shares Subscribed capital 279,399 shares (2019: 279,399) shares $1,763,656 $1,763,656 Less callable capital: 218,050 shares (2019: 218,050) shares (1,375,135) (1,375,135)
Paid-up capital: 61,349 shares (2019: 61,349) shares $388,521 $388,521 Less: Prepayment discount (344) (1,334)
$388,177 $387,187

168
CARIBBEAN DEVELOPMENT BANK ANNUAL REPORT 2020
166 167
CARIBBEAN DEVELOPMENT BANK ANNUAL REPORT 2020 CARIBBEAN DEVELOPMENT BANK ANNUAL REPORT 2020
CCAARRIIBBBBEEAANN DDEEVVEELLOOPPMMEENNTT BBAANNKK OORRDDIINNAARRYY CCAAPPIITTAALL RREESSOOUURRCCEESS NNOOTTEESS TTOO TTHHEE FFIINNAANNCCIIAALL SSTTAATTEEMMEENNTTSS FFoorr tthhee yyeeaarr eennddeedd DDeecceemmbbeerr 3311,, 22002200 (expressed in thousands of United States dollars, unless otherwise stated)
- 80 -
NOTE 21 – EQUITY…continued
(b) The movement in the Bank’s paid-up capital during the year was as follows:
2020 2019
No. of shares No. of shares
Balance at January 1 and December 31 61,349 61,349
The movement in subscriptions matured during the year was as follows:
2020 2019
Balance at January 1 387,187 $386,199
Regional States and Territories Subscriptions maturing during the year 990 988
Balance at December 31 $388,177 $387,187
The determination of the par value of the Bank’s shares is as disclosed hereto.
CCAA
RRIIBB
BBEEAA
NN DD
EEVVEELL
OOPPMM
EENNTT
BBAANN
KK
OORRDD
IINNAA
RRYY
CCAA
PPIITTAA
LL RREESS
OOUU
RRCC
EESS
NNOO
TTEESS
TTOO TT
HHEE
FFIINN
AANN
CCIIAA
LL SSTT
AATTEE
MMEENN
TTSS
FFoorr
tthhee
yyeeaarr
eenndd
eedd DD
eecceemm
bbeerr
3311,, 22002200
(exp
ress
ed in
th
ou
san
ds
of
Un
ited
Sta
tes
dolla
rs, u
nle
ss o
ther
wis
e st
ate
d)
-81
-
NO
TE 2
1 –
EQ
UIT
Y…
cont
inue
d
(c)
The
subs
crip
tions
by
mem
ber
coun
tries
and
thei
r vo
ting
pow
er a
t Dec
embe
r 31
wer
e as
follo
ws:
202
0
V
otin
g P
ow
er
N
o.
of
% o
f
Tota
l su
bsc
rib
ed
Calla
ble
Pa
id-u
p
Sub
scri
ptio
ns
N
o.
of
% o
f to
tal
Gro
ss2
/ Rec
eiva
ble
fr
om
mem
ber
s
non
-n
egotia
ble
M
ember
Sh
are
s To
tal
ca
pita
l ca
pita
l ca
pita
l M
atu
red
vo
tes
vote
s
dem
and
note
s
Regi
onal
Sta
tes
and
Terr
itorie
s:
Jam
aica
48
,354
17
.31
$2
91,6
59
$227
,614
$6
4,04
5 $6
4,04
5
48,5
04
17.1
4
9,38
5
Trin
idad
and
Tob
ago
48,3
54
17.3
1
291,
659
227,
614
64,0
45
64,0
45
48
,504
17
.14
6,
403
Baha
mas
14
,258
5.
10
86
,001
67
,115
18
,886
18
,885
14,4
08
5.09
1,61
2 G
uyan
a 10
,417
3.
73
62
,833
49
,038
13
,795
13
,795
10,5
67
3.73
1,02
2 C
olom
bia
7,79
5 2.
79
47
,017
36
,691
10
,326
10
,326
7,94
5 2.
81
-
Mex
ico
7,79
5 2.
79
47
,017
36
,691
10
,326
10
,326
7,94
5 2.
81
-
Vene
zuel
a 7,
795
2.79
47,0
17
36,6
91
10,3
26
10,3
26
7,
945
2.81
- Ba
rbad
os
9,07
4 3.
25
54
,732
42
,717
12
,015
12
,015
9,22
4 3.
26
-
Surin
ame
4,16
6 1.
49
25
,128
19
,627
5,
501
5,50
1
4,31
6 1.
53
2,
806
Beliz
e 2,
148
0.77
12,9
56
10,1
09
2,84
7 2,
847
2,
298
0.81
- D
omin
ica
2,14
8 0.
77
12
,956
10
,109
2,
847
2,84
7
2,29
8 0.
81
28
6 G
rena
da
1,83
9 0.
66
11
,093
8,
661
2,43
2 2,
431
1,
989
0.70
- St
. Luc
ia
2,14
8 0.
77
12
,956
10
,109
2,
847
2,84
7
2,29
8 0.
81
-
St. V
ince
nt a
nd th
e G
rena
dine
s 2,
148
0.77
12,9
56
10,1
09
2,84
7 2,
847
2,
298
0.81
- An
tigua
and
Bar
buda
2,
148
0.77
12,9
56
10,1
09
2,84
7 2,
847
2,
298
0.81
296
St. K
itts
and
Nev
is
2,14
8 0.
77
12
,956
10
,109
2,
847
2,84
7
2,29
8 0.
81
-
Angu
illa1/
45
5 0.
16
2,
744
2,14
1 60
3 60
3
-
Mon
tser
rat1/
53
3 0.
19
3,
215
2,50
9 70
6 70
6
-
Briti
sh V
irgin
Isla
nds1/
53
3 0.
19
3,
215
2,50
9 70
6 70
6
2,73
7 0.
97
-
Cay
man
Isla
nds1/
53
3 0.
19
3,
215
2,50
9 70
6 70
6
8
Turk
s an
d C
aico
s Is
land
s1/
533
0.19
3,21
5 2,
509
706
706
- H
aiti
2,18
7 0.
78
13
,191
10
,296
2,
894
2,89
4
2,33
7 0.
83
-
Braz
il 3,
118
1.12
18,8
07
14,6
87
4,12
0 4,
120
3,
268
1.15
-
1
80
,627
64
.65
1
,089
,494
850
,273
239
,220
239
,218
1
83
,477
64
.83
2
1,8
18
1 /
In a
ccor
danc
e w
ith A
rticl
e 3
of th
e C
harte
r an
d Bo
ard
of G
over
nors
Res
olut
ion
No.
4/8
1, th
ese
terr
itorie
s ar
e co
nsid
ered
as
a si
ngle
mem
ber
of th
e Ba
nk fo
r th
e pu
rpos
e of
Arti
cles
26
and
32 o
f the
Cha
rter.
2/G
ross
of E
CL.

169
CARIBBEAN DEVELOPMENT BANK ANNUAL REPORT 2020
166 167
CARIBBEAN DEVELOPMENT BANK ANNUAL REPORT 2020 CARIBBEAN DEVELOPMENT BANK ANNUAL REPORT 2020
CCAARRIIBBBBEEAANN DDEEVVEELLOOPPMMEENNTT BBAANNKK OORRDDIINNAARRYY CCAAPPIITTAALL RREESSOOUURRCCEESS NNOOTTEESS TTOO TTHHEE FFIINNAANNCCIIAALL SSTTAATTEEMMEENNTTSS FFoorr tthhee yyeeaarr eennddeedd DDeecceemmbbeerr 3311,, 22002200 (expressed in thousands of United States dollars, unless otherwise stated)
- 80 -
NOTE 21 – EQUITY…continued
(b) The movement in the Bank’s paid-up capital during the year was as follows:
2020 2019
No. of shares No. of shares
Balance at January 1 and December 31 61,349 61,349
The movement in subscriptions matured during the year was as follows:
2020 2019
Balance at January 1 387,187 $386,199
Regional States and Territories Subscriptions maturing during the year 990 988
Balance at December 31 $388,177 $387,187
The determination of the par value of the Bank’s shares is as disclosed hereto.
CCAA
RRIIBB
BBEEAA
NN DD
EEVVEELL
OOPPMM
EENNTT
BBAANN
KK
OORRDD
IINNAA
RRYY
CCAA
PPIITTAA
LL RREESS
OOUU
RRCC
EESS
NNOO
TTEESS
TTOO TT
HHEE
FFIINN
AANN
CCIIAA
LL SSTT
AATTEE
MMEENN
TTSS
FFoorr
tthhee
yyeeaarr
eenndd
eedd DD
eecceemm
bbeerr
3311,, 22002200
(exp
ress
ed in
th
ou
san
ds
of
Un
ited
Sta
tes
dolla
rs, u
nle
ss o
ther
wis
e st
ate
d)
-81
-
NO
TE 2
1 –
EQ
UIT
Y…
cont
inue
d
(c)
The
subs
crip
tions
by
mem
ber
coun
tries
and
thei
r vo
ting
pow
er a
t Dec
embe
r 31
wer
e as
follo
ws:
202
0
V
otin
g P
ow
er
N
o.
of
% o
f
Tota
l su
bsc
rib
ed
Calla
ble
Pa
id-u
p
Sub
scri
ptio
ns
N
o.
of
% o
f to
tal
Gro
ss2
/ Rec
eiva
ble
fr
om
mem
ber
s
non
-n
egotia
ble
M
ember
Sh
are
s To
tal
ca
pita
l ca
pita
l ca
pita
l M
atu
red
vo
tes
vote
s
dem
and
note
s
Regi
onal
Sta
tes
and
Terr
itorie
s:
Jam
aica
48
,354
17
.31
$2
91,6
59
$227
,614
$6
4,04
5 $6
4,04
5
48,5
04
17.1
4
9,38
5
Trin
idad
and
Tob
ago
48,3
54
17.3
1
291,
659
227,
614
64,0
45
64,0
45
48
,504
17
.14
6,
403
Baha
mas
14
,258
5.
10
86
,001
67
,115
18
,886
18
,885
14,4
08
5.09
1,61
2 G
uyan
a 10
,417
3.
73
62
,833
49
,038
13
,795
13
,795
10,5
67
3.73
1,02
2 C
olom
bia
7,79
5 2.
79
47
,017
36
,691
10
,326
10
,326
7,94
5 2.
81
-
Mex
ico
7,79
5 2.
79
47
,017
36
,691
10
,326
10
,326
7,94
5 2.
81
-
Vene
zuel
a 7,
795
2.79
47,0
17
36,6
91
10,3
26
10,3
26
7,
945
2.81
- Ba
rbad
os
9,07
4 3.
25
54
,732
42
,717
12
,015
12
,015
9,22
4 3.
26
-
Surin
ame
4,16
6 1.
49
25
,128
19
,627
5,
501
5,50
1
4,31
6 1.
53
2,
806
Beliz
e 2,
148
0.77
12,9
56
10,1
09
2,84
7 2,
847
2,
298
0.81
- D
omin
ica
2,14
8 0.
77
12
,956
10
,109
2,
847
2,84
7
2,29
8 0.
81
28
6 G
rena
da
1,83
9 0.
66
11
,093
8,
661
2,43
2 2,
431
1,
989
0.70
- St
. Luc
ia
2,14
8 0.
77
12
,956
10
,109
2,
847
2,84
7
2,29
8 0.
81
-
St. V
ince
nt a
nd th
e G
rena
dine
s 2,
148
0.77
12,9
56
10,1
09
2,84
7 2,
847
2,
298
0.81
- An
tigua
and
Bar
buda
2,
148
0.77
12,9
56
10,1
09
2,84
7 2,
847
2,
298
0.81
296
St. K
itts
and
Nev
is
2,14
8 0.
77
12
,956
10
,109
2,
847
2,84
7
2,29
8 0.
81
-
Angu
illa1/
45
5 0.
16
2,
744
2,14
1 60
3 60
3
-
Mon
tser
rat1/
53
3 0.
19
3,
215
2,50
9 70
6 70
6
-
Briti
sh V
irgin
Isla
nds1/
53
3 0.
19
3,
215
2,50
9 70
6 70
6
2,73
7 0.
97
-
Cay
man
Isla
nds1/
53
3 0.
19
3,
215
2,50
9 70
6 70
6
8
Turk
s an
d C
aico
s Is
land
s1/
533
0.19
3,21
5 2,
509
706
706
- H
aiti
2,18
7 0.
78
13
,191
10
,296
2,
894
2,89
4
2,33
7 0.
83
-
Braz
il 3,
118
1.12
18,8
07
14,6
87
4,12
0 4,
120
3,
268
1.15
-
1
80
,627
64
.65
1
,089
,494
850
,273
239
,220
239
,218
1
83
,477
64
.83
2
1,8
18
1 /
In a
ccor
danc
e w
ith A
rticl
e 3
of th
e C
harte
r an
d Bo
ard
of G
over
nors
Res
olut
ion
No.
4/8
1, th
ese
terr
itorie
s ar
e co
nsid
ered
as
a si
ngle
mem
ber
of th
e Ba
nk fo
r th
e pu
rpos
e of
Arti
cles
26
and
32 o
f the
Cha
rter.
2/G
ross
of E
CL.

170
CARIBBEAN DEVELOPMENT BANK ANNUAL REPORT 2020
168 169
CARIBBEAN DEVELOPMENT BANK ANNUAL REPORT 2020 CARIBBEAN DEVELOPMENT BANK ANNUAL REPORT 2020
CCAA
RRIIBB
BBEEAA
NN DD
EEVVEELL
OOPPMM
EENNTT
BBAANN
KK
OORRDD
IINNAA
RRYY
CCAA
PPIITTAA
LL RREESS
OOUU
RRCC
EESS
NNOO
TTEESS
TTOO TT
HHEE
FFIINN
AANN
CCIIAA
LL SSTT
AATTEE
MMEENN
TTSS
FFoorr
tthhee
yyeeaarr
eenndd
eedd DD
eecceemm
bbeerr
3311,, 22002200
(exp
ress
ed in
th
ou
san
ds
of
Un
ited
Sta
tes
dolla
rs, u
nle
ss o
ther
wis
e st
ate
d)
-82
-
NO
TE 2
1 –
EQ
UIT
Y…
cont
inue
d
Votin
g P
ow
er
Gro
ss2
/ Rec
eiva
ble
To
tal
sub
scri
bed
ca
pita
l
fr
om
mem
ber
s
N
o.
of
Share
s
% o
f
T
ota
l
Calla
ble
ca
pita
l Pa
id-u
p
cap
ital
Sub
scri
ptio
ns
Matu
red
N
o.
of
vote
s %
of
tota
l vote
s
non
-n
egotia
ble
M
ember
Dem
an
d n
ote
s
Non
-Reg
iona
l Sta
tes:
C
anad
a 26
,004
9.
31
15
6,84
9 12
2,40
8 34
,441
34
,441
26,1
54
9.24
- U
nite
d Ki
ngdo
m
26,0
04
9.31
156,
849
122,
408
34,4
41
34,4
41
26
,154
9.
24
-
Italy
15
,588
5.
58
94
,023
73
,376
20
,647
20
,647
15,7
38
5.56
- G
erm
any
15,5
88
5.58
94,0
23
73,3
76
20,6
47
20,6
47
15
,738
5.
56
-
Chi
na
15,5
88
5.58
94,0
23
73,3
76
20,6
47
20,6
47
15
,738
5.
56
-
98
,772
35
.36
59
5,76
7 46
4,94
4 13
0,82
3 13
0,82
3
99,5
22
35.1
6
- Su
b-t
ota
l 2
79
,399
100
.0
1
,685
,261
1,3
15
,217
370
,044
370
,041
2
82
,999
100
.0
2
1,8
18
A
dd
ition
al s
ub
scri
ptio
ns
C
hina
-
-
18,8
04
14,6
88
4,11
6 4,
116
-
-
- C
olom
bia
- -
1,
810
905
905
905
-
-
- G
erm
any
- -
12
,546
9,
681
2,86
5 2,
865
-
-
- Ita
ly
- -
12
,546
9,
681
2,86
5 2,
865
-
-
- M
exic
o -
-
6,27
3 4,
841
1,43
2 1,
432
-
-
- Ve
nezu
ela
- -
1,
810
905
905
905
-
-
- H
aiti
- -
2,
639
2,06
0 57
9 57
9
- -
-
Surin
ame
- -
12
,564
9,
814
2,75
0 2,
750
-
-
- Br
azil
- -
9,
403
7,34
3 2,
060
2,06
0
- -
-
Sub
-tota
l -
-
78,3
95
59,9
18
18,4
77
18,4
77
-
-
-
Prep
aym
ent d
isco
unt
-- --
--
-- --
(341
)
-- --
--
Tota
l - D
ecem
ber
31
279
,399
100
.0
$
1,7
63
,65
6
$1
,37
5,1
35
$38
8,5
21
$38
8,1
77
2
82
,999
100
.0
$
21
,818
CCAA
RRIIBB
BBEEAA
NN DD
EEVVEELL
OOPPMM
EENNTT
BBAANN
KK
OORRDD
IINNAA
RRYY
CCAA
PPIITTAA
LL RREESS
OOUU
RRCC
EESS
NNOO
TTEESS
TTOO TT
HHEE
FFIINN
AANN
CCIIAA
LL SSTT
AATTEE
MMEENN
TTSS
FFoorr
tthhee
yyeeaarr
eenndd
eedd DD
eecceemm
bbeerr
3311,, 22002200
(exp
ress
ed in
th
ou
san
ds
of
Un
ited
Sta
tes
dolla
rs, u
nle
ss o
ther
wis
e st
ate
d)
-83
-
NO
TE 2
1 –
EQ
UIT
Y…
cont
inue
d (d
)Th
e su
bscr
iptio
ns b
y m
embe
r co
untri
es a
nd th
eir
votin
g po
wer
at D
ecem
ber
31 w
ere
as fo
llow
s:
2
01
9
V
otin
g P
ow
er
N
o.
of
% o
f
Tota
l su
bsc
rib
ed
Calla
ble
Pa
id-u
p
Sub
scri
ptio
ns
N
o.
of
% o
f to
tal
Gro
ss2
Rec
eiva
ble
fr
om
mem
ber
s
non
-n
egotia
ble
M
ember
Sh
are
s To
tal
ca
pita
l ca
pita
l ca
pita
l M
atu
red
vo
tes
vote
s
dem
and
note
s
Regi
onal
Sta
tes
and
Terr
itorie
s:
Jam
aica
48
,354
17
.31
$2
91,6
59
$227
,614
$6
4,04
5 $6
4,04
5
48,5
04
17.1
4
$11,
848
Trin
idad
and
Tob
ago
48,3
54
17.3
1
291,
659
227,
614
64,0
45
64,0
45
48
,504
17
.14
10
,637
Ba
ham
as
14,2
58
5.10
86,0
01
67,1
15
18,8
86
18,8
85
14
,408
5.
09
1,
612
Guy
ana
10,4
17
3.72
62,8
33
49,0
38
13,7
95
13,7
95
10
,567
3.
74
2,
081
Col
ombi
a 7,
795
2.79
47,0
17
36,6
91
10,3
26
10,3
26
7,
945
2.81
- M
exic
o 7,
795
2.79
47,0
17
36,6
91
10,3
26
10,3
26
7,
945
2.81
- Ve
nezu
ela
7,79
5 2.
79
47
,017
36
,691
10
,326
10
,326
7,94
5 2.
81
3,
203
Barb
ados
9,
074
3.24
54,7
32
42,7
17
12,0
15
12,0
15
9,
224
3.26
1,07
0 Su
rinam
e 4,
166
1.49
25,1
28
19,6
27
5,50
1 5,
501
4,
316
1.53
2,80
6 Be
lize
2,14
8 0.
77
12
,956
10
,109
2,
847
2,84
7
2,29
8 0.
81
-
Dom
inic
a 2,
148
0.77
12,9
56
10,1
09
2,84
7 2,
847
2,
298
0.81
286
Gre
nada
1,
839
0.66
11,0
93
8,66
1 2,
432
2,43
1
1,98
9 0.
70
10
6 St
. Luc
ia
2,14
8 0.
77
12
,956
10
,109
2,
847
2,84
7
2,29
8 0.
81
36
0 St
. Vin
cent
and
the
Gre
nadi
nes
2,
148
0.
77
12,9
56
10
,109
2,84
7
2,84
7
2,
298
0.
81
-
Antig
ua a
nd B
arbu
da
2,14
8 0.
77
12
,956
10
,109
2,
847
2,84
7
2,29
8 0.
81
29
6 St
. Kitt
s an
d N
evis
2,
148
0.77
12,9
56
10,1
09
2,84
7 2,
847
2,
298
0.81
127
Angu
illa1/
45
5 0.
16
2,
744
2,14
1 60
3 60
3
-
Mon
tser
rat1/
53
3 0.
19
3,
215
2,50
9 70
6 70
6
-
Briti
sh V
irgin
Isla
nds1/
53
3 0.
19
3,
215
2,50
9 70
6 70
6
2,73
7 0.
97
-
Cay
man
Isla
nds1/
53
3 0.
19
3,
215
2,50
9 70
6 70
6
8
Turk
s an
d C
aico
s Is
land
s1/
533
0.19
3,21
5 2,
509
706
706
- H
aiti
2,18
7 0.
78
13
,191
10
,296
2,
895
2,89
5
2,33
7 0.
83
-
Braz
il 3,
118
1.12
18,8
07
14,6
87
4,12
0 3,
459
3,
268
1.15
-
1
80
,627
64
.64
1
,089
,494
850
,273
239
,221
238
,558
1
83
,477
64
.84
3
4,4
40
1/
In a
ccor
danc
e w
ith A
rticl
e 3
of th
e C
harte
r an
d Bo
ard
of G
over
nors
Res
olut
ion
No.
4/8
1, th
ese
terr
itorie
s ar
e co
nsid
ered
as
a si
ngle
mem
ber
of th
e Ba
nk fo
r th
e pu
rpos
e of
Arti
cles
26
and
32 o
f the
Cha
rter.
2/
Gro
ss o
f EC
L.
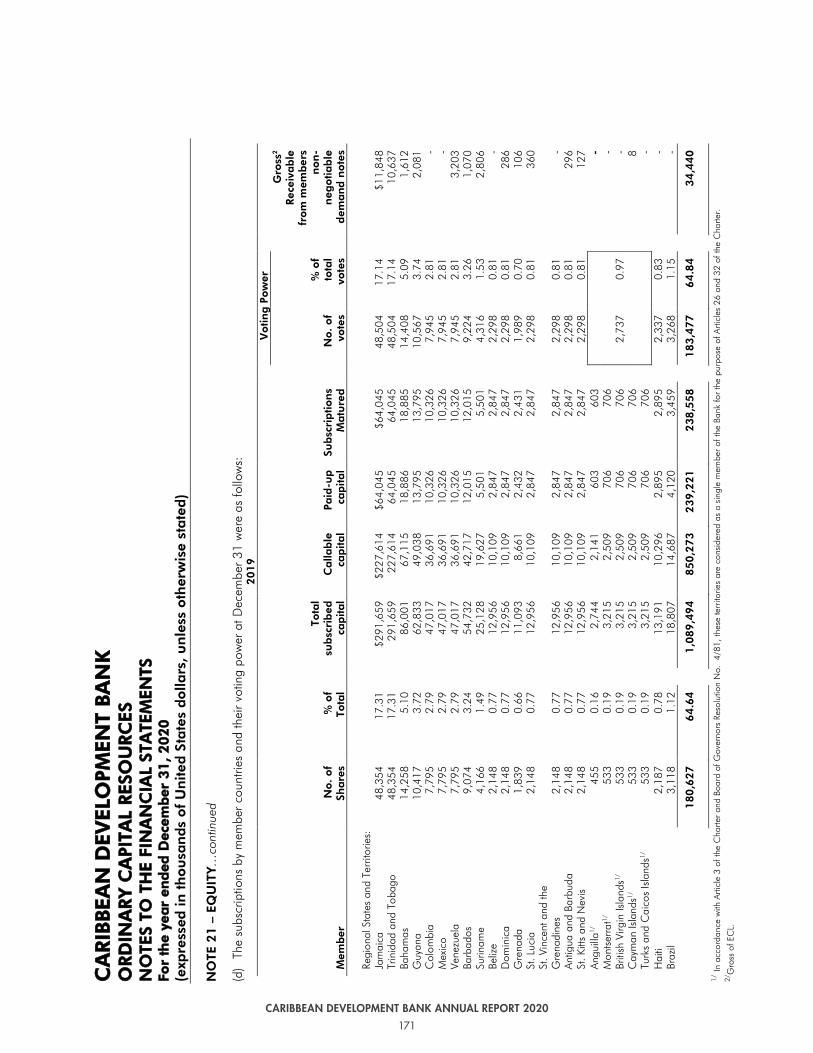
171
CARIBBEAN DEVELOPMENT BANK ANNUAL REPORT 2020
168 169
CARIBBEAN DEVELOPMENT BANK ANNUAL REPORT 2020 CARIBBEAN DEVELOPMENT BANK ANNUAL REPORT 2020
CCAA
RRIIBB
BBEEAA
NN DD
EEVVEELL
OOPPMM
EENNTT
BBAANN
KK
OORRDD
IINNAA
RRYY
CCAA
PPIITTAA
LL RREESS
OOUU
RRCC
EESS
NNOO
TTEESS
TTOO TT
HHEE
FFIINN
AANN
CCIIAA
LL SSTT
AATTEE
MMEENN
TTSS
FFoorr
tthhee
yyeeaarr
eenndd
eedd DD
eecceemm
bbeerr
3311,, 22002200
(exp
ress
ed in
th
ou
san
ds
of
Un
ited
Sta
tes
dolla
rs, u
nle
ss o
ther
wis
e st
ate
d)
-82
-
NO
TE 2
1 –
EQ
UIT
Y…
cont
inue
d
Votin
g P
ow
er
Gro
ss2
/ Rec
eiva
ble
To
tal
sub
scri
bed
ca
pita
l
fr
om
mem
ber
s
N
o.
of
Share
s
% o
f
T
ota
l
Calla
ble
ca
pita
l Pa
id-u
p
cap
ital
Sub
scri
ptio
ns
Matu
red
N
o.
of
vote
s %
of
tota
l vote
s
non
-n
egotia
ble
M
ember
Dem
an
d n
ote
s
Non
-Reg
iona
l Sta
tes:
C
anad
a 26
,004
9.
31
15
6,84
9 12
2,40
8 34
,441
34
,441
26,1
54
9.24
- U
nite
d Ki
ngdo
m
26,0
04
9.31
156,
849
122,
408
34,4
41
34,4
41
26
,154
9.
24
-
Italy
15
,588
5.
58
94
,023
73
,376
20
,647
20
,647
15,7
38
5.56
- G
erm
any
15,5
88
5.58
94,0
23
73,3
76
20,6
47
20,6
47
15
,738
5.
56
-
Chi
na
15,5
88
5.58
94,0
23
73,3
76
20,6
47
20,6
47
15
,738
5.
56
-
98
,772
35
.36
59
5,76
7 46
4,94
4 13
0,82
3 13
0,82
3
99,5
22
35.1
6
- Su
b-t
ota
l 2
79
,399
100
.0
1
,685
,261
1,3
15
,217
370
,044
370
,041
2
82
,999
100
.0
2
1,8
18
A
dd
ition
al s
ub
scri
ptio
ns
C
hina
-
-
18,8
04
14,6
88
4,11
6 4,
116
-
-
- C
olom
bia
- -
1,
810
905
905
905
-
-
- G
erm
any
- -
12
,546
9,
681
2,86
5 2,
865
-
-
- Ita
ly
- -
12
,546
9,
681
2,86
5 2,
865
-
-
- M
exic
o -
-
6,27
3 4,
841
1,43
2 1,
432
-
-
- Ve
nezu
ela
- -
1,
810
905
905
905
-
-
- H
aiti
- -
2,
639
2,06
0 57
9 57
9
- -
-
Surin
ame
- -
12
,564
9,
814
2,75
0 2,
750
-
-
- Br
azil
- -
9,
403
7,34
3 2,
060
2,06
0
- -
-
Sub
-tota
l -
-
78,3
95
59,9
18
18,4
77
18,4
77
-
-
-
Prep
aym
ent d
isco
unt
-- --
--
-- --
(341
)
-- --
--
Tota
l - D
ecem
ber
31
279
,399
100
.0
$
1,7
63
,65
6
$1
,37
5,1
35
$38
8,5
21
$38
8,1
77
2
82
,999
100
.0
$
21
,818
CCAA
RRIIBB
BBEEAA
NN DD
EEVVEELL
OOPPMM
EENNTT
BBAANN
KK
OORRDD
IINNAA
RRYY
CCAA
PPIITTAA
LL RREESS
OOUU
RRCC
EESS
NNOO
TTEESS
TTOO TT
HHEE
FFIINN
AANN
CCIIAA
LL SSTT
AATTEE
MMEENN
TTSS
FFoorr
tthhee
yyeeaarr
eenndd
eedd DD
eecceemm
bbeerr
3311,, 22002200
(exp
ress
ed in
th
ou
san
ds
of
Un
ited
Sta
tes
dolla
rs, u
nle
ss o
ther
wis
e st
ate
d)
-83
-
NO
TE 2
1 –
EQ
UIT
Y…
cont
inue
d (d
)Th
e su
bscr
iptio
ns b
y m
embe
r co
untri
es a
nd th
eir
votin
g po
wer
at D
ecem
ber
31 w
ere
as fo
llow
s:
2
01
9
V
otin
g P
ow
er
N
o.
of
% o
f
Tota
l su
bsc
rib
ed
Calla
ble
Pa
id-u
p
Sub
scri
ptio
ns
N
o.
of
% o
f to
tal
Gro
ss2
Rec
eiva
ble
fr
om
mem
ber
s
non
-n
egotia
ble
M
ember
Sh
are
s To
tal
ca
pita
l ca
pita
l ca
pita
l M
atu
red
vo
tes
vote
s
dem
and
note
s
Regi
onal
Sta
tes
and
Terr
itorie
s:
Jam
aica
48
,354
17
.31
$2
91,6
59
$227
,614
$6
4,04
5 $6
4,04
5
48,5
04
17.1
4
$11,
848
Trin
idad
and
Tob
ago
48,3
54
17.3
1
291,
659
227,
614
64,0
45
64,0
45
48
,504
17
.14
10
,637
Ba
ham
as
14,2
58
5.10
86,0
01
67,1
15
18,8
86
18,8
85
14
,408
5.
09
1,
612
Guy
ana
10,4
17
3.72
62,8
33
49,0
38
13,7
95
13,7
95
10
,567
3.
74
2,
081
Col
ombi
a 7,
795
2.79
47,0
17
36,6
91
10,3
26
10,3
26
7,
945
2.81
- M
exic
o 7,
795
2.79
47,0
17
36,6
91
10,3
26
10,3
26
7,
945
2.81
- Ve
nezu
ela
7,79
5 2.
79
47
,017
36
,691
10
,326
10
,326
7,94
5 2.
81
3,
203
Barb
ados
9,
074
3.24
54,7
32
42,7
17
12,0
15
12,0
15
9,
224
3.26
1,07
0 Su
rinam
e 4,
166
1.49
25,1
28
19,6
27
5,50
1 5,
501
4,
316
1.53
2,80
6 Be
lize
2,14
8 0.
77
12
,956
10
,109
2,
847
2,84
7
2,29
8 0.
81
-
Dom
inic
a 2,
148
0.77
12,9
56
10,1
09
2,84
7 2,
847
2,
298
0.81
286
Gre
nada
1,
839
0.66
11,0
93
8,66
1 2,
432
2,43
1
1,98
9 0.
70
10
6 St
. Luc
ia
2,14
8 0.
77
12
,956
10
,109
2,
847
2,84
7
2,29
8 0.
81
36
0 St
. Vin
cent
and
the
Gre
nadi
nes
2,
148
0.
77
12,9
56
10
,109
2,84
7
2,84
7
2,
298
0.
81
-
Antig
ua a
nd B
arbu
da
2,14
8 0.
77
12
,956
10
,109
2,
847
2,84
7
2,29
8 0.
81
29
6 St
. Kitt
s an
d N
evis
2,
148
0.77
12,9
56
10,1
09
2,84
7 2,
847
2,
298
0.81
127
Angu
illa1/
45
5 0.
16
2,
744
2,14
1 60
3 60
3
-
Mon
tser
rat1/
53
3 0.
19
3,
215
2,50
9 70
6 70
6
-
Briti
sh V
irgin
Isla
nds1/
53
3 0.
19
3,
215
2,50
9 70
6 70
6
2,73
7 0.
97
-
Cay
man
Isla
nds1/
53
3 0.
19
3,
215
2,50
9 70
6 70
6
8
Turk
s an
d C
aico
s Is
land
s1/
533
0.19
3,21
5 2,
509
706
706
- H
aiti
2,18
7 0.
78
13
,191
10
,296
2,
895
2,89
5
2,33
7 0.
83
-
Braz
il 3,
118
1.12
18,8
07
14,6
87
4,12
0 3,
459
3,
268
1.15
-
1
80
,627
64
.64
1
,089
,494
850
,273
239
,221
238
,558
1
83
,477
64
.84
3
4,4
40
1/
In a
ccor
danc
e w
ith A
rticl
e 3
of th
e C
harte
r an
d Bo
ard
of G
over
nors
Res
olut
ion
No.
4/8
1, th
ese
terr
itorie
s ar
e co
nsid
ered
as
a si
ngle
mem
ber
of th
e Ba
nk fo
r th
e pu
rpos
e of
Arti
cles
26
and
32 o
f the
Cha
rter.
2/
Gro
ss o
f EC
L.

172
CARIBBEAN DEVELOPMENT BANK ANNUAL REPORT 2020
170 171
CARIBBEAN DEVELOPMENT BANK ANNUAL REPORT 2020 CARIBBEAN DEVELOPMENT BANK ANNUAL REPORT 2020
CCAA
RRIIBB
BBEEAA
NN DD
EEVVEELL
OOPPMM
EENNTT
BBAANN
KK
OORRDD
IINNAA
RRYY
CCAA
PPIITTAA
LL RREESS
OOUU
RRCC
EESS
NNOO
TTEESS
TTOO TT
HHEE
FFIINN
AANN
CCIIAA
LL SSTT
AATTEE
MMEENN
TTSS
FFoorr
tthhee
yyeeaarr
eenndd
eedd DD
eecceemm
bbeerr
3311,, 22002200
(exp
ress
ed in
th
ou
san
ds
of
Un
ited
Sta
tes
dolla
rs, u
nle
ss o
ther
wis
e st
ate
d)
-84
-
NO
TE 2
1 –
EQ
UIT
Y…
cont
inue
d
Votin
g P
ow
er
Gro
ss2
Rec
eiva
ble
To
tal
sub
scri
bed
ca
pita
l
fr
om
mem
ber
s
N
o.
of
Share
s
% o
f
T
ota
l
Calla
ble
ca
pita
l Pa
id-u
p
cap
ital
Sub
scri
ptio
ns
Matu
red
N
o.
of
vote
s %
of
tota
l vote
s
non
-n
egotia
ble
M
ember
Dem
an
d n
ote
s
Non
-Reg
iona
l Sta
tes:
C
anad
a 26
,004
9.
31
15
6,84
9 12
2,40
8 34
,441
34
,441
26,1
54
9.24
- U
nite
d Ki
ngdo
m
26,0
04
9.31
156,
849
122,
408
34,4
41
34,4
41
26
,154
9.
24
-
Italy
15
,588
5.
58
94
,023
73
,376
20
,647
20
,647
15,7
38
5.56
- G
erm
any
15,5
88
5.58
94,0
23
73,3
76
20,6
47
20,6
47
15
,738
5.
56
5,
549
Chi
na
15,5
88
5.58
94,0
23
73,3
76
20,6
47
20,6
47
15
,738
5.
56
-
98
,772
35
.36
59
5,76
7 46
4,94
4 13
0,82
3 13
0,82
3
99,5
22
35.1
6
5,54
9 Su
b-t
ota
l 2
79
,399
100
.0
1
,685
,261
1,3
15
,217
370
,044
369
,381
2
82
,999
100
.0
3
9,9
89
A
dd
ition
al s
ub
scri
ptio
ns
C
hina
-
-
18,8
04
14,6
88
4,11
6 4,
116
-
-
- C
olom
bia
- -
1,
810
905
905
905
-
-
- G
erm
any
- -
12
,546
9,
681
2,86
5 2,
865
-
-
- Ita
ly
- -
12
,546
9,
681
2,86
5 2,
865
-
-
- M
exic
o -
-
6,27
3 4,
841
1,43
2 1,
432
-
-
- Ve
nezu
ela
- -
1,
810
905
905
905
-
-
- H
aiti
- -
2,
639
2,06
0 57
9 57
9
- -
-
Surin
ame
- -
12
,564
9,
814
2,75
0 2,
750
-
-
- Br
azil
- -
9,
403
7,34
3 2,
060
1,73
0
- -
-
Sub
-tota
l -
-
78,3
95
59,9
18
18,4
77
18,1
47
-
-
-
Prep
aym
ent d
isco
unt
-- --
--
-- --
(341
)
-- --
--
Tota
l - D
ecem
ber
31
279
,399
100
.0
$
1,7
63
,65
6
$1
,37
5,1
35
$38
8,5
21
$38
7,1
87
2
82
,999
100
.0
$
39
,989
CCAARRIIBBBBEEAANN DDEEVVEELLOOPPMMEENNTT BBAANNKK OORRDDIINNAARRYY CCAAPPIITTAALL RREESSOOUURRCCEESS
NNOOTTEESS TTOO TTHHEE FFIINNAANNCCIIAALL SSTTAATTEEMMEENNTTSS FFoorr tthhee yyeeaarr eennddeedd DDeecceemmbbeerr 3311,, 22002200
(expressed in thousands of United States dollars, unless otherwise stated)
- 85 -
NOTE 21 – EQUITY…continued
(d) Prepayment discounts
The Board of Governors of the Bank approved a “Variation of conditions of subscription of shares to permit a discount for prepayment” policy. The provision of this policy is that members are entitled to a discount from the Bank for prepayment of an instalment or part thereof (including those members which have already made prepayments) only if the prepayment is received more than three months prior to the date of the scheduled General Capital Increase (GCI) payments. The discount is computed based on a present value methodology and is disclosed as a charge against equity. During the year, no discounts were provided to members. The cumulative discount provided to date is $341 (2019: $341).
(e) Retained earnings and reserves
Retained earnings and reserves is comprised of:
2020 2019
Opening retained earnings $546,396 $512,371 Net income for the year 36,093 40,271 Actuarial (losses)/gains
(9,071) (11,894)
Net change in fair value reserve 6,796
5,648
$580,214 $546,396
(f) Other reserves
Special reserve In accordance with Article 18 of the Charter, commissions and guarantee fees received on loans made out of OCR are required to be set aside in a Special Reserve which shall be kept for meeting liabilities of the Bank. The assets of the Special Reserve are to be held in such liquid form as the BOD may decide. At the One Hundred and Nineteenth Meeting of the Board of Directors held on July 21, 1988, the Board decided that appropriations to the Special Reserve should be discontinued with effect from January 1, 1989. Pursuant thereto, no commission is charged on loans approved after January 1, 1989, and all amounts received after that date as commission on loans approved before that date are treated as interest and accounted for as such. During 1993, the Special Reserve was converted into United States dollars and is valued at $6,254 (2019: $6,254).
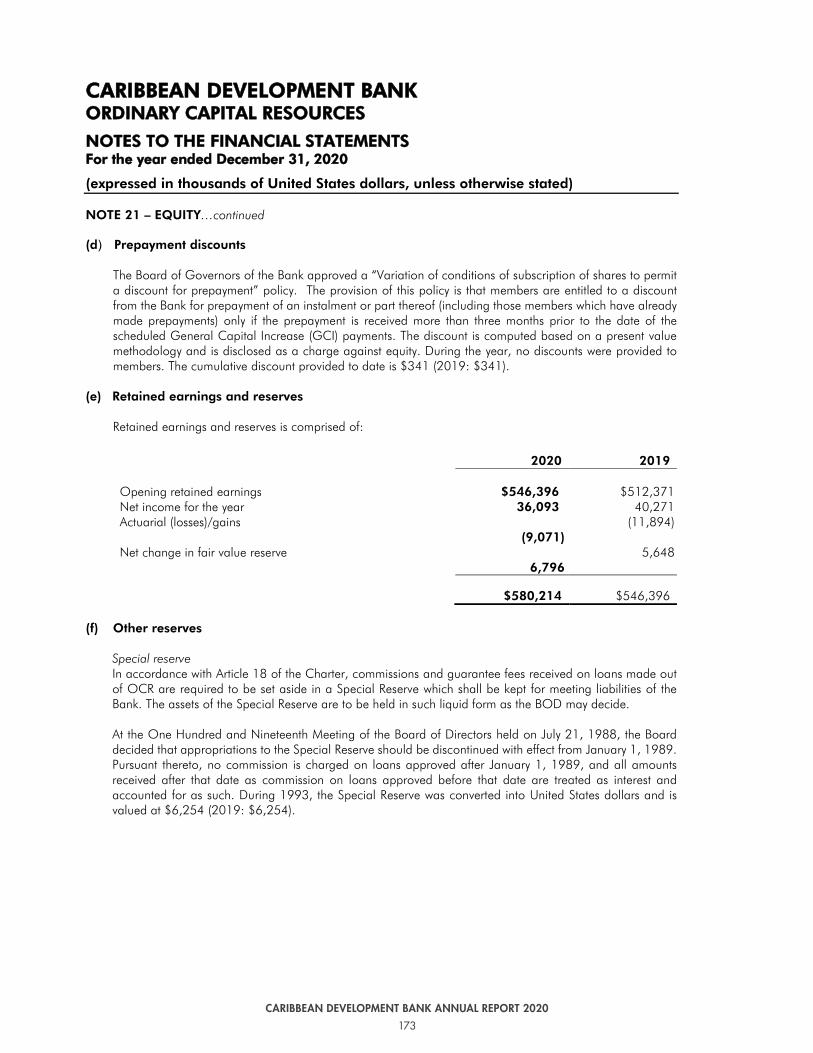
173
CARIBBEAN DEVELOPMENT BANK ANNUAL REPORT 2020
170 171
CARIBBEAN DEVELOPMENT BANK ANNUAL REPORT 2020 CARIBBEAN DEVELOPMENT BANK ANNUAL REPORT 2020
CCAA
RRIIBB
BBEEAA
NN DD
EEVVEELL
OOPPMM
EENNTT
BBAANN
KK
OORRDD
IINNAA
RRYY
CCAA
PPIITTAA
LL RREESS
OOUU
RRCC
EESS
NNOO
TTEESS
TTOO TT
HHEE
FFIINN
AANN
CCIIAA
LL SSTT
AATTEE
MMEENN
TTSS
FFoorr
tthhee
yyeeaarr
eenndd
eedd DD
eecceemm
bbeerr
3311,, 22002200
(exp
ress
ed in
th
ou
san
ds
of
Un
ited
Sta
tes
dolla
rs, u
nle
ss o
ther
wis
e st
ate
d)
-84
-
NO
TE 2
1 –
EQ
UIT
Y…
cont
inue
d
Votin
g P
ow
er
Gro
ss2
Rec
eiva
ble
To
tal
sub
scri
bed
ca
pita
l
fr
om
mem
ber
s
N
o.
of
Share
s
% o
f
T
ota
l
Calla
ble
ca
pita
l Pa
id-u
p
cap
ital
Sub
scri
ptio
ns
Matu
red
N
o.
of
vote
s %
of
tota
l vote
s
non
-n
egotia
ble
M
ember
Dem
an
d n
ote
s
Non
-Reg
iona
l Sta
tes:
C
anad
a 26
,004
9.
31
15
6,84
9 12
2,40
8 34
,441
34
,441
26,1
54
9.24
- U
nite
d Ki
ngdo
m
26,0
04
9.31
156,
849
122,
408
34,4
41
34,4
41
26
,154
9.
24
-
Italy
15
,588
5.
58
94
,023
73
,376
20
,647
20
,647
15,7
38
5.56
- G
erm
any
15,5
88
5.58
94,0
23
73,3
76
20,6
47
20,6
47
15
,738
5.
56
5,
549
Chi
na
15,5
88
5.58
94,0
23
73,3
76
20,6
47
20,6
47
15
,738
5.
56
-
98
,772
35
.36
59
5,76
7 46
4,94
4 13
0,82
3 13
0,82
3
99,5
22
35.1
6
5,54
9 Su
b-t
ota
l 2
79
,399
100
.0
1
,685
,261
1,3
15
,217
370
,044
369
,381
2
82
,999
100
.0
3
9,9
89
A
dd
ition
al s
ub
scri
ptio
ns
C
hina
-
-
18,8
04
14,6
88
4,11
6 4,
116
-
-
- C
olom
bia
- -
1,
810
905
905
905
-
-
- G
erm
any
- -
12
,546
9,
681
2,86
5 2,
865
-
-
- Ita
ly
- -
12
,546
9,
681
2,86
5 2,
865
-
-
- M
exic
o -
-
6,27
3 4,
841
1,43
2 1,
432
-
-
- Ve
nezu
ela
- -
1,
810
905
905
905
-
-
- H
aiti
- -
2,
639
2,06
0 57
9 57
9
- -
-
Surin
ame
- -
12
,564
9,
814
2,75
0 2,
750
-
-
- Br
azil
- -
9,
403
7,34
3 2,
060
1,73
0
- -
-
Sub
-tota
l -
-
78,3
95
59,9
18
18,4
77
18,1
47
-
-
-
Prep
aym
ent d
isco
unt
-- --
--
-- --
(341
)
-- --
--
Tota
l - D
ecem
ber
31
279
,399
100
.0
$
1,7
63
,65
6
$1
,37
5,1
35
$38
8,5
21
$38
7,1
87
2
82
,999
100
.0
$
39
,989
CCAARRIIBBBBEEAANN DDEEVVEELLOOPPMMEENNTT BBAANNKK OORRDDIINNAARRYY CCAAPPIITTAALL RREESSOOUURRCCEESS
NNOOTTEESS TTOO TTHHEE FFIINNAANNCCIIAALL SSTTAATTEEMMEENNTTSS FFoorr tthhee yyeeaarr eennddeedd DDeecceemmbbeerr 3311,, 22002200
(expressed in thousands of United States dollars, unless otherwise stated)
- 85 -
NOTE 21 – EQUITY…continued
(d) Prepayment discounts
The Board of Governors of the Bank approved a “Variation of conditions of subscription of shares to permit a discount for prepayment” policy. The provision of this policy is that members are entitled to a discount from the Bank for prepayment of an instalment or part thereof (including those members which have already made prepayments) only if the prepayment is received more than three months prior to the date of the scheduled General Capital Increase (GCI) payments. The discount is computed based on a present value methodology and is disclosed as a charge against equity. During the year, no discounts were provided to members. The cumulative discount provided to date is $341 (2019: $341).
(e) Retained earnings and reserves
Retained earnings and reserves is comprised of:
2020 2019
Opening retained earnings $546,396 $512,371 Net income for the year 36,093 40,271 Actuarial (losses)/gains
(9,071) (11,894)
Net change in fair value reserve 6,796
5,648
$580,214 $546,396
(f) Other reserves
Special reserve In accordance with Article 18 of the Charter, commissions and guarantee fees received on loans made out of OCR are required to be set aside in a Special Reserve which shall be kept for meeting liabilities of the Bank. The assets of the Special Reserve are to be held in such liquid form as the BOD may decide. At the One Hundred and Nineteenth Meeting of the Board of Directors held on July 21, 1988, the Board decided that appropriations to the Special Reserve should be discontinued with effect from January 1, 1989. Pursuant thereto, no commission is charged on loans approved after January 1, 1989, and all amounts received after that date as commission on loans approved before that date are treated as interest and accounted for as such. During 1993, the Special Reserve was converted into United States dollars and is valued at $6,254 (2019: $6,254).

174
CARIBBEAN DEVELOPMENT BANK ANNUAL REPORT 2020
172 173
CARIBBEAN DEVELOPMENT BANK ANNUAL REPORT 2020 CARIBBEAN DEVELOPMENT BANK ANNUAL REPORT 2020
CCAARRIIBBBBEEAANN DDEEVVEELLOOPPMMEENNTT BBAANNKK OORRDDIINNAARRYY CCAAPPIITTAALL RREESSOOUURRCCEESS NNOOTTEESS TTOO TTHHEE FFIINNAANNCCIIAALL SSTTAATTEEMMEENNTTSS FFoorr tthhee yyeeaarr eennddeedd DDeecceemmbbeerr 3311,, 22002200 (expressed in thousands of United States dollars, unless otherwise stated)
- 86 -
NOTE 21 – EQUITY…continued (f) Other reserves…continued
Post-employment obligations reserve The post-employment obligations reserve comprises various gains/(losses) arising from the actuarial valuation where actual performance results differ from projected results due to changes in assumptions and in differences between actual investment returns and assumed returns from the previous year’s calculations. These differences are classified as experience gains/(losses). A reconciliation of the cumulative loss of $34,730 (2019: $20,448) is shown in the statement of changes in equity. Fair value reserves The Bank’s debt securities are classified as fair value through other comprehensive income (FVOCI). As a result, all fair value gains or losses are accounted for through a fair value reserve in equity. As at December 31, 2020, the cumulative fair value reserve amounted to $8,451 (2019: ($1,655). An unrealised gain of $6,250 was recorded as at December 31, 2020 (2019 - $4,759) as a result of changes in the fair vaue of debt securities. For securities which were sold or which matured during the year, a fair value loss of $546 (2019 - $889) was reclassified to realised fair value (gains)/losses included in ‘Operating expense’ in the statement of comprehensive income.
NOTE 22 – INTEREST INCOME/EXPENSE AND SIMILAR INCOME/CHARGES
Interest income and expense For instruments carried at amortised cost, interest income and expense are recognised in the statement of comprehensive income using the EIR method. Interest income and expense are recognised on a level yield basis for items classified as fair value through profit or loss. In the event of an asset becoming credit-impaired and therefore being regarded as ‘Stage 3’, the Bank calculates interest income by applying the effective interest rate to the net amortised cost of the financial asset. If the financial asset cures and is no longer credit-impaired, the Bank reverts to calculating interest income on a gross basis.
Other fees and charges Fees and other income are recognised on an accrual basis when the service has been provided.
CCAARRIIBBBBEEAANN DDEEVVEELLOOPPMMEENNTT BBAANNKK OORRDDIINNAARRYY CCAAPPIITTAALL RREESSOOUURRCCEESS NNOOTTEESS TTOO TTHHEE FFIINNAANNCCIIAALL SSTTAATTEEMMEENNTTSS FFoorr tthhee yyeeaarr eennddeedd DDeecceemmbbeerr 3311,, 22002200 (expressed in thousands of United States dollars, unless otherwise stated)
- 87 -
NOTE 22 – INTEREST INCOME/EXPENSE AND SIMILAR INCOME/CHARGES…continued
(a) Interest and similar income
Interest income earned from loans outstanding and debt securities at FVOCI was as follows:
2020 2019
Interest income $51,597 $53,952 Other fees and charges 4,869 4,666 Income from loans and receivables 56,466 58,618 Bonds 7,946 6,001 US Treasuries 202 887 Treasury bills 279 69 Time deposits 437 993 Cash 59 285 Cash collateral balance 3 125 Management fees (53) (51)
Interest and similar income $65,339 $66,927
(b) Interest (income)/expense and similar charges
Interest expense and other charges from borrowings and interest income and expense from derivative financial instrument swaps were as follows:
2020 2019
Financial liabilities carried at amortised cost (borrowings) Gross interest expense $26,475 $24,212
Other finance charges 1,562 772
Borrowings $28,037 $24,984
Financial assets at fair value through profit and loss (derivatives)
Interest income from derivative financial instruments $(19,465) $(18,958) Interest expense from derivative financial instruments 13,002 20,932
Net interest (income)/expense from derivatives $(6,463) $1,974
Interest expense and similar charges $21,574 $26,958
CCAARRIIBBBBEEAANN DDEEVVEELLOOPPMMEENNTT BBAANNKK OORRDDIINNAARRYY CCAAPPIITTAALL RREESSOOUURRCCEESS NNOOTTEESS TTOO TTHHEE FFIINNAANNCCIIAALL SSTTAATTEEMMEENNTTSS FFoorr tthhee yyeeaarr eennddeedd DDeecceemmbbeerr 3311,, 22002200 (expressed in thousands of United States dollars, unless otherwise stated)
- 87 -
NOTE 22 – INTEREST INCOME/EXPENSE AND SIMILAR INCOME/CHARGES…continued (a) Interest and similar income
Interest income earned from loans outstanding and debt securities at FVOCI was as follows:
2020 2019
Interest income $51,597 $53,952 Other fees and charges 4,869 4,666 Income from loans and receivables 56,466 58,618 Bonds 7,946 6,001 US Treasuries 202 887 Treasury bills 279 69 Time deposits 437 993 Cash 59 285 Cash collateral balance 3 125 Management fees (53) (51) Interest and similar income $65,339 $66,927
(b) Interest expense and similar charges
Interest expense and other charges from borrowings and interest income and expense from derivative financial instrument swaps were as follows:
2020 2019
Financial liabilities carried at amortised cost (borrowings) Gross interest expense $26,475 $24,212
Other finance charges 1,562 772
Borrowings
$28,037 $24,984 Financial assets at fair value through profit and loss (derivatives)
Interest income from derivative financial instruments $(19,465) $(18,958) Interest expense from derivative financial instruments 13,002 20,932
Net interest (income)/expense from derivatives $(6,463) $1,974
Interest expense and similar charges $21,574 $26,958
CCAARRIIBBBBEEAANN DDEEVVEELLOOPPMMEENNTT BBAANNKK OORRDDIINNAARRYY CCAAPPIITTAALL RREESSOOUURRCCEESS NNOOTTEESS TTOO TTHHEE FFIINNAANNCCIIAALL SSTTAATTEEMMEENNTTSS FFoorr tthhee yyeeaarr eennddeedd DDeecceemmbbeerr 3311,, 22002200 (expressed in thousands of United States dollars, unless otherwise stated)
- 86 -
NOTE 21 – EQUITY…continued (f) Other reserves…continued Post-employment obligations reserve
The post-employment obligations reserve comprises various gains/(losses) arising from the actuarial valuation where actual performance results differ from projected results due to changes in assumptions and in differences between actual investment returns and assumed returns from the previous year’s calculations. These differences are classified as experience gains/(losses). A reconciliation of the cumulative loss of $29,519 (2019: $20,448) is shown in the statement of changes in equity. Fair value reserves The Bank’s debt securities are classified as fair value through other comprehensive income (FVOCI). As a result, all fair value gains or losses are accounted for through a fair value reserve in equity. As at December 31, 2020, the cumulative fair value reserve amounted to $8,451 (2019: ($1,655). An unrealised gain of $6,250 was recorded as at December 31, 2020 (2019 - $4,759) as a result of changes in the fair vaue of debt securities. For securities which were sold or which matured during the year, a fair value loss of $546 (2019 - $889) was reclassified to realised fair value (gains)/losses included in ‘Operating expense’ in the statement of comprehensive income.
NOTE 22 – INTEREST INCOME/EXPENSE AND SIMILAR INCOME/CHARGES Interest income and expense For instruments carried at amortised cost, interest income and expense are recognised in the statement of comprehensive income using the EIR method. Interest income and expense are recognised on a level yield basis for items classified as fair value through profit or loss. In the event of an asset becoming credit-impaired and therefore being regarded as ‘Stage 3’, the Bank calculates interest income by applying the effective interest rate to the net amortised cost of the financial asset. If the financial asset cures and is no longer credit-impaired, the Bank reverts to calculating interest income on a gross basis. Other fees and charges Fees and other income are recognised on an accrual basis when the service has been provided.

175
CARIBBEAN DEVELOPMENT BANK ANNUAL REPORT 2020
172 173
CARIBBEAN DEVELOPMENT BANK ANNUAL REPORT 2020 CARIBBEAN DEVELOPMENT BANK ANNUAL REPORT 2020
CCAARRIIBBBBEEAANN DDEEVVEELLOOPPMMEENNTT BBAANNKK OORRDDIINNAARRYY CCAAPPIITTAALL RREESSOOUURRCCEESS NNOOTTEESS TTOO TTHHEE FFIINNAANNCCIIAALL SSTTAATTEEMMEENNTTSS FFoorr tthhee yyeeaarr eennddeedd DDeecceemmbbeerr 3311,, 22002200 (expressed in thousands of United States dollars, unless otherwise stated)
- 86 -
NOTE 21 – EQUITY…continued (f) Other reserves…continued
Post-employment obligations reserve The post-employment obligations reserve comprises various gains/(losses) arising from the actuarial valuation where actual performance results differ from projected results due to changes in assumptions and in differences between actual investment returns and assumed returns from the previous year’s calculations. These differences are classified as experience gains/(losses). A reconciliation of the cumulative loss of $34,730 (2019: $20,448) is shown in the statement of changes in equity. Fair value reserves The Bank’s debt securities are classified as fair value through other comprehensive income (FVOCI). As a result, all fair value gains or losses are accounted for through a fair value reserve in equity. As at December 31, 2020, the cumulative fair value reserve amounted to $8,451 (2019: ($1,655). An unrealised gain of $6,250 was recorded as at December 31, 2020 (2019 - $4,759) as a result of changes in the fair vaue of debt securities. For securities which were sold or which matured during the year, a fair value loss of $546 (2019 - $889) was reclassified to realised fair value (gains)/losses included in ‘Operating expense’ in the statement of comprehensive income.
NOTE 22 – INTEREST INCOME/EXPENSE AND SIMILAR INCOME/CHARGES
Interest income and expense For instruments carried at amortised cost, interest income and expense are recognised in the statement of comprehensive income using the EIR method. Interest income and expense are recognised on a level yield basis for items classified as fair value through profit or loss. In the event of an asset becoming credit-impaired and therefore being regarded as ‘Stage 3’, the Bank calculates interest income by applying the effective interest rate to the net amortised cost of the financial asset. If the financial asset cures and is no longer credit-impaired, the Bank reverts to calculating interest income on a gross basis.
Other fees and charges Fees and other income are recognised on an accrual basis when the service has been provided.
CCAARRIIBBBBEEAANN DDEEVVEELLOOPPMMEENNTT BBAANNKK OORRDDIINNAARRYY CCAAPPIITTAALL RREESSOOUURRCCEESS NNOOTTEESS TTOO TTHHEE FFIINNAANNCCIIAALL SSTTAATTEEMMEENNTTSS FFoorr tthhee yyeeaarr eennddeedd DDeecceemmbbeerr 3311,, 22002200 (expressed in thousands of United States dollars, unless otherwise stated)
- 87 -
NOTE 22 – INTEREST INCOME/EXPENSE AND SIMILAR INCOME/CHARGES…continued
(a) Interest and similar income
Interest income earned from loans outstanding and debt securities at FVOCI was as follows:
2020 2019
Interest income $51,597 $53,952 Other fees and charges 4,869 4,666 Income from loans and receivables 56,466 58,618 Bonds 7,946 6,001 US Treasuries 202 887 Treasury bills 279 69 Time deposits 437 993 Cash 59 285 Cash collateral balance 3 125 Management fees (53) (51)
Interest and similar income $65,339 $66,927
(b) Interest (income)/expense and similar charges
Interest expense and other charges from borrowings and interest income and expense from derivative financial instrument swaps were as follows:
2020 2019
Financial liabilities carried at amortised cost (borrowings) Gross interest expense $26,475 $24,212
Other finance charges 1,562 772
Borrowings $28,037 $24,984
Financial assets at fair value through profit and loss (derivatives)
Interest income from derivative financial instruments $(19,465) $(18,958) Interest expense from derivative financial instruments 13,002 20,932
Net interest (income)/expense from derivatives $(6,463) $1,974
Interest expense and similar charges $21,574 $26,958
CCAARRIIBBBBEEAANN DDEEVVEELLOOPPMMEENNTT BBAANNKK OORRDDIINNAARRYY CCAAPPIITTAALL RREESSOOUURRCCEESS NNOOTTEESS TTOO TTHHEE FFIINNAANNCCIIAALL SSTTAATTEEMMEENNTTSS FFoorr tthhee yyeeaarr eennddeedd DDeecceemmbbeerr 3311,, 22002200 (expressed in thousands of United States dollars, unless otherwise stated)
- 87 -
NOTE 22 – INTEREST INCOME/EXPENSE AND SIMILAR INCOME/CHARGES…continued (a) Interest and similar income
Interest income earned from loans outstanding and debt securities at FVOCI was as follows:
2020 2019
Interest income $51,597 $53,952 Other fees and charges 4,869 4,666 Income from loans and receivables 56,466 58,618 Bonds 7,946 6,001 US Treasuries 202 887 Treasury bills 279 69 Time deposits 437 993 Cash 59 285 Cash collateral balance 3 125 Management fees (53) (51) Interest and similar income $65,339 $66,927
(b) Interest expense and similar charges
Interest expense and other charges from borrowings and interest income and expense from derivative financial instrument swaps were as follows:
2020 2019
Financial liabilities carried at amortised cost (borrowings) Gross interest expense $26,475 $24,212
Other finance charges 1,562 772
Borrowings
$28,037 $24,984 Financial assets at fair value through profit and loss (derivatives)
Interest income from derivative financial instruments $(19,465) $(18,958) Interest expense from derivative financial instruments 13,002 20,932
Net interest (income)/expense from derivatives $(6,463) $1,974
Interest expense and similar charges $21,574 $26,958
CCAARRIIBBBBEEAANN DDEEVVEELLOOPPMMEENNTT BBAANNKK OORRDDIINNAARRYY CCAAPPIITTAALL RREESSOOUURRCCEESS NNOOTTEESS TTOO TTHHEE FFIINNAANNCCIIAALL SSTTAATTEEMMEENNTTSS FFoorr tthhee yyeeaarr eennddeedd DDeecceemmbbeerr 3311,, 22002200 (expressed in thousands of United States dollars, unless otherwise stated)
- 86 -
NOTE 21 – EQUITY…continued (f) Other reserves…continued Post-employment obligations reserve
The post-employment obligations reserve comprises various gains/(losses) arising from the actuarial valuation where actual performance results differ from projected results due to changes in assumptions and in differences between actual investment returns and assumed returns from the previous year’s calculations. These differences are classified as experience gains/(losses). A reconciliation of the cumulative loss of $29,519 (2019: $20,448) is shown in the statement of changes in equity. Fair value reserves The Bank’s debt securities are classified as fair value through other comprehensive income (FVOCI). As a result, all fair value gains or losses are accounted for through a fair value reserve in equity. As at December 31, 2020, the cumulative fair value reserve amounted to $8,451 (2019: ($1,655). An unrealised gain of $6,250 was recorded as at December 31, 2020 (2019 - $4,759) as a result of changes in the fair vaue of debt securities. For securities which were sold or which matured during the year, a fair value loss of $546 (2019 - $889) was reclassified to realised fair value (gains)/losses included in ‘Operating expense’ in the statement of comprehensive income.
NOTE 22 – INTEREST INCOME/EXPENSE AND SIMILAR INCOME/CHARGES Interest income and expense For instruments carried at amortised cost, interest income and expense are recognised in the statement of comprehensive income using the EIR method. Interest income and expense are recognised on a level yield basis for items classified as fair value through profit or loss. In the event of an asset becoming credit-impaired and therefore being regarded as ‘Stage 3’, the Bank calculates interest income by applying the effective interest rate to the net amortised cost of the financial asset. If the financial asset cures and is no longer credit-impaired, the Bank reverts to calculating interest income on a gross basis. Other fees and charges Fees and other income are recognised on an accrual basis when the service has been provided.
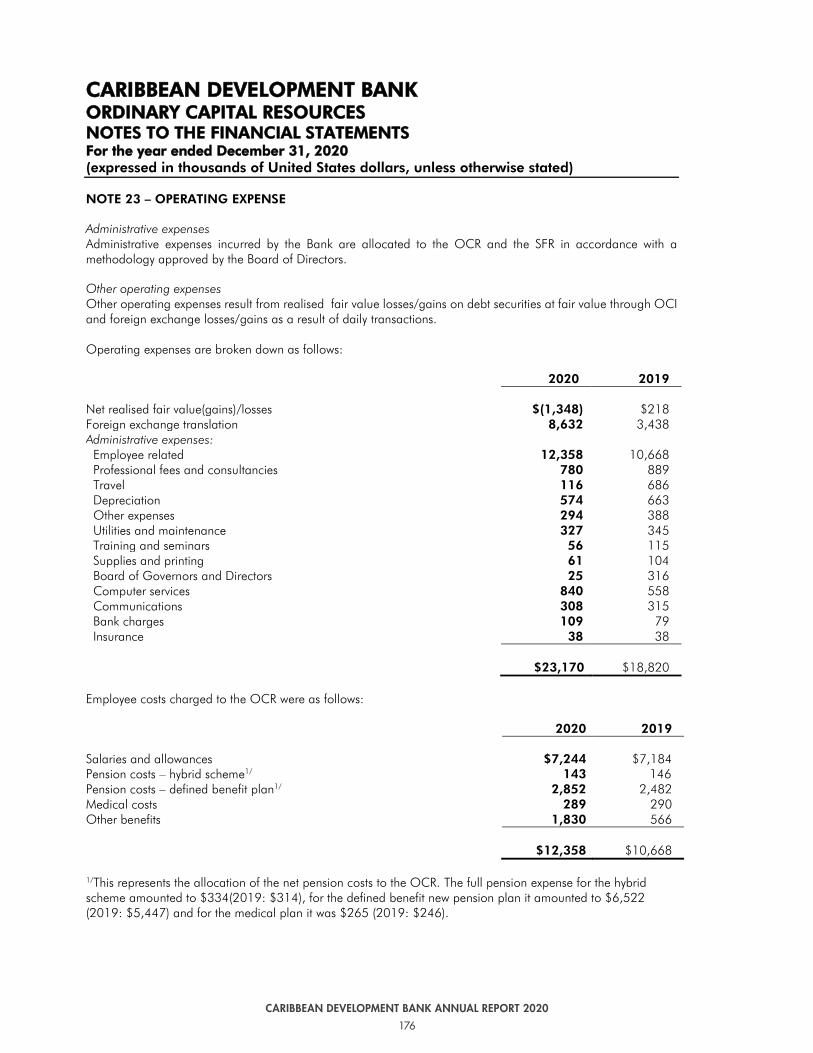
176
CARIBBEAN DEVELOPMENT BANK ANNUAL REPORT 2020
174 175
CARIBBEAN DEVELOPMENT BANK ANNUAL REPORT 2020 CARIBBEAN DEVELOPMENT BANK ANNUAL REPORT 2020
CCAARRIIBBBBEEAANN DDEEVVEELLOOPPMMEENNTT BBAANNKK OORRDDIINNAARRYY CCAAPPIITTAALL RREESSOOUURRCCEESS NNOOTTEESS TTOO TTHHEE FFIINNAANNCCIIAALL SSTTAATTEEMMEENNTTSS FFoorr tthhee yyeeaarr eennddeedd DDeecceemmbbeerr 3311,, 22002200 (expressed in thousands of United States dollars, unless otherwise stated)
- 88 -
NOTE 23 – OPERATING EXPENSE
Administrative expenses Administrative expenses incurred by the Bank are allocated to the OCR and the SFR in accordance with a methodology approved by the Board of Directors.
Other operating expenses Other operating expenses result from realised fair value losses/gains on debt securities at fair value through OCI and foreign exchange losses/gains as a result of daily transactions. Operating expenses are broken down as follows:
2020 2019
Net realised fair value(gains)/losses $(1,348) $218 Foreign exchange translation 8,632 3,438 Administrative expenses: Employee related 12,358 10,668 Professional fees and consultancies 780 889 Travel 116 686 Depreciation 574 663 Other expenses 294 388 Utilities and maintenance 327 345 Training and seminars 56 115 Supplies and printing 61 104 Board of Governors and Directors 25 316 Computer services 840 558 Communications 308 315 Bank charges 109 79 Insurance 38 38
$23,170 $18,820
Employee costs charged to the OCR were as follows:
2020 2019
Salaries and allowances $7,244 $7,184 Pension costs – hybrid scheme1/ 143 146 Pension costs – defined benefit plan1/ 2,852 2,482 Medical costs 289 290 Other benefits 1,830 566
$12,358 $10,668
1/This represents the allocation of the net pension costs to the OCR. The full pension expense for the hybrid scheme amounted to $334(2019: $314), for the defined benefit new pension plan it amounted to $6,522 (2019: $5,447) and for the medical plan it was $265 (2019: $246).
CCAARRIIBBBBEEAANN DDEEVVEELLOOPPMMEENNTT BBAANNKK OORRDDIINNAARRYY CCAAPPIITTAALL RREESSOOUURRCCEESS NNOOTTEESS TTOO TTHHEE FFIINNAANNCCIIAALL SSTTAATTEEMMEENNTTSS FFoorr tthhee yyeeaarr eennddeedd DDeecceemmbbeerr 3311,, 22002200 (expressed in thousands of United States dollars, unless otherwise stated)
- 89 -
NOTE 24 – IMPAIRMENT RECOVERY/(CHARGES) (ECL)
The table below shows the ECL (recoveries)/charges on financial assets recorded in profit or loss in the statement of comprehensive income.
2020 Stage 1
12month ECL
Stage 2 Lifetime ECL
Stage 3 Impaired
Total
Loans outstanding $(3,869) $(389) $(1,616) $(5,874) Debt Securities 18 - - 18 Receivables 4 (83) 198 119 Receivable from members (258) (24) (992) (1,274) Total Impairment recovery $(4,105) $(496) $(2,410) $(7,011)
2019 Stage 1
12month ECL Stage 2
Lifetime ECL Stage 3
Impaired Total
Loans outstanding $4,164 $380 $(1,602) $2,942 Receivables (1) 83 (83) (1) Receivable from members (7,099) 24 992 (6,083) Total Impairment (recovery)/charges
$(2,936) $487 $(693) $(3,142)
NOTE 25 – ALLOCATION FROM NET INCOME In accordance with Article 39 of the Charter, the Board of Governors shall determine at least annually the disposition of the net income of the Bank arising from its OCR (“operating income”). The OCR net income is typically allocated to the Ordinary Reserves. These reserves are available to meet possible future losses on loans and guarantees made by the Bank in its Ordinary operations and possible future losses from currency devaluations.
As part of the Agreement governing the new Special Development Fund Cycle (SDF 9) which forms part of the Bank’s SFR, an allocation of $15 million has been committed but not yet settled from the net income of the OCR to SDF 9 to be met over the 4-year cycle.

177
CARIBBEAN DEVELOPMENT BANK ANNUAL REPORT 2020
174 175
CARIBBEAN DEVELOPMENT BANK ANNUAL REPORT 2020 CARIBBEAN DEVELOPMENT BANK ANNUAL REPORT 2020
CCAARRIIBBBBEEAANN DDEEVVEELLOOPPMMEENNTT BBAANNKK OORRDDIINNAARRYY CCAAPPIITTAALL RREESSOOUURRCCEESS NNOOTTEESS TTOO TTHHEE FFIINNAANNCCIIAALL SSTTAATTEEMMEENNTTSS FFoorr tthhee yyeeaarr eennddeedd DDeecceemmbbeerr 3311,, 22002200 (expressed in thousands of United States dollars, unless otherwise stated)
- 88 -
NOTE 23 – OPERATING EXPENSE
Administrative expenses Administrative expenses incurred by the Bank are allocated to the OCR and the SFR in accordance with a methodology approved by the Board of Directors.
Other operating expenses Other operating expenses result from realised fair value losses/gains on debt securities at fair value through OCI and foreign exchange losses/gains as a result of daily transactions. Operating expenses are broken down as follows:
2020 2019
Net realised fair value(gains)/losses $(1,348) $218 Foreign exchange translation 8,632 3,438 Administrative expenses: Employee related 12,358 10,668 Professional fees and consultancies 780 889 Travel 116 686 Depreciation 574 663 Other expenses 294 388 Utilities and maintenance 327 345 Training and seminars 56 115 Supplies and printing 61 104 Board of Governors and Directors 25 316 Computer services 840 558 Communications 308 315 Bank charges 109 79 Insurance 38 38
$23,170 $18,820
Employee costs charged to the OCR were as follows:
2020 2019
Salaries and allowances $7,244 $7,184 Pension costs – hybrid scheme1/ 143 146 Pension costs – defined benefit plan1/ 2,852 2,482 Medical costs 289 290 Other benefits 1,830 566
$12,358 $10,668
1/This represents the allocation of the net pension costs to the OCR. The full pension expense for the hybrid scheme amounted to $334(2019: $314), for the defined benefit new pension plan it amounted to $6,522 (2019: $5,447) and for the medical plan it was $265 (2019: $246).
CCAARRIIBBBBEEAANN DDEEVVEELLOOPPMMEENNTT BBAANNKK OORRDDIINNAARRYY CCAAPPIITTAALL RREESSOOUURRCCEESS NNOOTTEESS TTOO TTHHEE FFIINNAANNCCIIAALL SSTTAATTEEMMEENNTTSS FFoorr tthhee yyeeaarr eennddeedd DDeecceemmbbeerr 3311,, 22002200 (expressed in thousands of United States dollars, unless otherwise stated)
- 89 -
NOTE 24 – IMPAIRMENT RECOVERY/(CHARGES) (ECL)
The table below shows the ECL (recoveries)/charges on financial assets recorded in profit or loss in the statement of comprehensive income.
2020 Stage 1
12month ECL
Stage 2 Lifetime ECL
Stage 3 Impaired
Total
Loans outstanding $(3,869) $(389) $(1,616) $(5,874) Debt Securities 18 - - 18 Receivables 4 (83) 198 119 Receivable from members (258) (24) (992) (1,274) Total Impairment recovery $(4,105) $(496) $(2,410) $(7,011)
2019 Stage 1
12month ECL Stage 2
Lifetime ECL Stage 3
Impaired Total
Loans outstanding $4,164 $380 $(1,602) $2,942 Receivables (1) 83 (83) (1) Receivable from members (7,099) 24 992 (6,083) Total Impairment (recovery)/charges
$(2,936) $487 $(693) $(3,142)
NOTE 25 – ALLOCATION FROM NET INCOME In accordance with Article 39 of the Charter, the Board of Governors shall determine at least annually the disposition of the net income of the Bank arising from its OCR (“operating income”). The OCR net income is typically allocated to the Ordinary Reserves. These reserves are available to meet possible future losses on loans and guarantees made by the Bank in its Ordinary operations and possible future losses from currency devaluations.
As part of the Agreement governing the new Special Development Fund Cycle (SDF 9) which forms part of the Bank’s SFR, an allocation of $15 million has been committed but not yet settled from the net income of the OCR to SDF 9 to be met over the 4-year cycle.
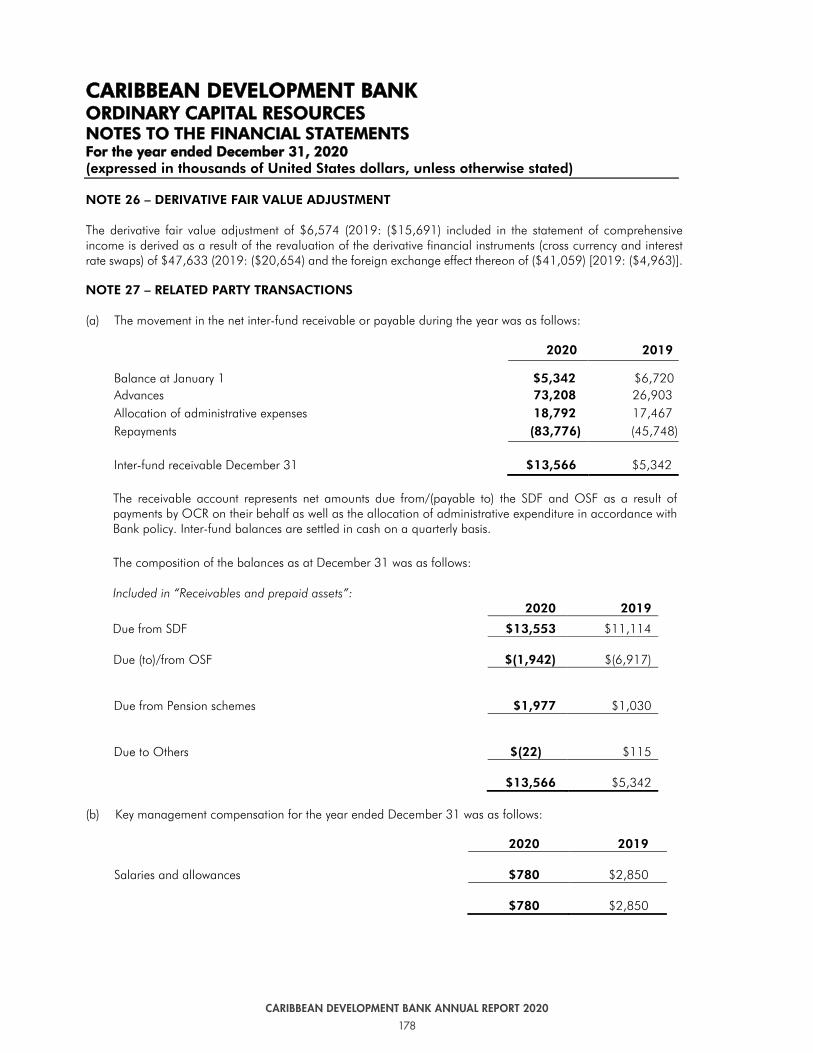
178
CARIBBEAN DEVELOPMENT BANK ANNUAL REPORT 2020
176 177
CARIBBEAN DEVELOPMENT BANK ANNUAL REPORT 2020 CARIBBEAN DEVELOPMENT BANK ANNUAL REPORT 2020
CCAARRIIBBBBEEAANN DDEEVVEELLOOPPMMEENNTT BBAANNKK OORRDDIINNAARRYY CCAAPPIITTAALL RREESSOOUURRCCEESS NNOOTTEESS TTOO TTHHEE FFIINNAANNCCIIAALL SSTTAATTEEMMEENNTTSS FFoorr tthhee yyeeaarr eennddeedd DDeecceemmbbeerr 3311,, 22002200 (expressed in thousands of United States dollars, unless otherwise stated)
- 90 -
NOTE 26 – DERIVATIVE FAIR VALUE ADJUSTMENT The derivative fair value adjustment of $6,574 (2019: ($15,691) included in the statement of comprehensive income is derived as a result of the revaluation of the derivative financial instruments (cross currency and interest rate swaps) of $47,633 (2019: ($20,654) and the foreign exchange effect thereon of ($41,059) [2019: ($4,963)].
NOTE 27 – RELATED PARTY TRANSACTIONS (a) The movement in the net inter-fund receivable or payable during the year was as follows:
2020 2019
Balance at January 1 $5,342 $6,720 Advances 73,208 26,903 Allocation of administrative expenses 18,792 17,467 Repayments (83,776) (45,748) Inter-fund receivable December 31 $13,566 $5,342
The receivable account represents net amounts due from/(payable to) the SDF and OSF as a result of payments by OCR on their behalf as well as the allocation of administrative expenditure in accordance with Bank policy. Inter-fund balances are settled in cash on a quarterly basis.
The composition of the balances as at December 31 was as follows:
Included in “Receivables and prepaid assets”: 2020 2019
Due from SDF $13,553 $11,114
Due (to)/from OSF $(1,942) $(6,917)
Due from Pension schemes
$1,977 $1,030
Due to Others
$(22) $115
$13,566 $5,342
(b) Key management compensation for the year ended December 31 was as follows:
2020 2019
Salaries and allowances $780 $2,850
$780 $2,850
CCAARRIIBBBBEEAANN DDEEVVEELLOOPPMMEENNTT BBAANNKK OORRDDIINNAARRYY CCAAPPIITTAALL RREESSOOUURRCCEESS NNOOTTEESS TTOO TTHHEE FFIINNAANNCCIIAALL SSTTAATTEEMMEENNTTSS FFoorr tthhee yyeeaarr eennddeedd DDeecceemmbbeerr 3311,, 22002200 (expressed in thousands of United States dollars, unless otherwise stated)
- 91 -
NOTE 27 – RELATED PARTY TRANSACTIONS…continued
(c) Interest subsidy fund
In 2008, the interest subsidy fund was established by the Board of Directors of the Bank to subsidise part of the interest payments for which certain borrowers are liable on loans from the OCR. During the reporting period $319 (2019: $359) was received from the OSF in interest on behalf of the borrowers. The fund balance is included in Receivable and prepaid assets in the statement of financial position.
NOTE 28 – COMMITMENTS AND GUARANTEES Legal claims are recognised when the Bank has a present legal or constructive obligation as a result of past events, and it is more likely than not that an outflow of resources will be required to settle the obligation and the amount has been reliably estimated. The Bank recognises no provisions for future operating expenses. Commitments The Bank’s commitments are represented by loan disbursement obligations to its borrowers up to the approved amount of these loans (Refer to Note 10 – Loans outstanding) and OCR commitments to the operations of the SDF(U) (Refer to Note 3: Risk Management). Guarantees Financial guarantee contracts are contracts that require the issuer to make specified payments to reimburse the holder for a loss it incurs because a specified debtor fails to make payments when due, in accordance with the terms of a debt instrument. Financial guarantees are initially recognised as a liability in the financial statements at fair value, adjusted for transaction costs that are directly attributable to the issuance of the guarantee, on the date the guarantee was given. Subsequently, the liability is measured at the higher of the best estimate of the expenditure required to settle the present obligation at the reporting date and the amount initially recognised less cumulative amortisation. At its two hundred and forty-ninth meeting held on December 8, 2011, the Bank issued a guarantee in an amount not exceeding the equivalent of $12 million with respect to Bonds issued by the Government of St. Kitts and Nevis (GOSKN) on a rolling, re-instatable and non-accelerable basis. The guarantee contains a Counter Guarantee and Indemnity clause whereby the GOSKN undertakes irrevocably and unconditionally agrees to reimburse the Bank for any amount paid under the guarantee together with interest and other charges at a rate specified by the Bank. Where reimbursement to the Bank is not made (in whole or in part) within a period of 90 days of such amounts being paid the Bank such unreimbursed amounts shall be converted to a loan due by the GOSKN to the Bank’s OCR.

179
CARIBBEAN DEVELOPMENT BANK ANNUAL REPORT 2020
176 177
CARIBBEAN DEVELOPMENT BANK ANNUAL REPORT 2020 CARIBBEAN DEVELOPMENT BANK ANNUAL REPORT 2020
CCAARRIIBBBBEEAANN DDEEVVEELLOOPPMMEENNTT BBAANNKK OORRDDIINNAARRYY CCAAPPIITTAALL RREESSOOUURRCCEESS NNOOTTEESS TTOO TTHHEE FFIINNAANNCCIIAALL SSTTAATTEEMMEENNTTSS FFoorr tthhee yyeeaarr eennddeedd DDeecceemmbbeerr 3311,, 22002200 (expressed in thousands of United States dollars, unless otherwise stated)
- 90 -
NOTE 26 – DERIVATIVE FAIR VALUE ADJUSTMENT The derivative fair value adjustment of $6,574 (2019: ($15,691) included in the statement of comprehensive income is derived as a result of the revaluation of the derivative financial instruments (cross currency and interest rate swaps) of $47,633 (2019: ($20,654) and the foreign exchange effect thereon of ($41,059) [2019: ($4,963)].
NOTE 27 – RELATED PARTY TRANSACTIONS (a) The movement in the net inter-fund receivable or payable during the year was as follows:
2020 2019
Balance at January 1 $5,342 $6,720 Advances 73,208 26,903 Allocation of administrative expenses 18,792 17,467 Repayments (83,776) (45,748) Inter-fund receivable December 31 $13,566 $5,342
The receivable account represents net amounts due from/(payable to) the SDF and OSF as a result of payments by OCR on their behalf as well as the allocation of administrative expenditure in accordance with Bank policy. Inter-fund balances are settled in cash on a quarterly basis.
The composition of the balances as at December 31 was as follows:
Included in “Receivables and prepaid assets”: 2020 2019
Due from SDF $13,553 $11,114
Due (to)/from OSF $(1,942) $(6,917)
Due from Pension schemes
$1,977 $1,030
Due to Others
$(22) $115
$13,566 $5,342
(b) Key management compensation for the year ended December 31 was as follows:
2020 2019
Salaries and allowances $780 $2,850
$780 $2,850
CCAARRIIBBBBEEAANN DDEEVVEELLOOPPMMEENNTT BBAANNKK OORRDDIINNAARRYY CCAAPPIITTAALL RREESSOOUURRCCEESS NNOOTTEESS TTOO TTHHEE FFIINNAANNCCIIAALL SSTTAATTEEMMEENNTTSS FFoorr tthhee yyeeaarr eennddeedd DDeecceemmbbeerr 3311,, 22002200 (expressed in thousands of United States dollars, unless otherwise stated)
- 91 -
NOTE 27 – RELATED PARTY TRANSACTIONS…continued
(c) Interest subsidy fund
In 2008, the interest subsidy fund was established by the Board of Directors of the Bank to subsidise part of the interest payments for which certain borrowers are liable on loans from the OCR. During the reporting period $319 (2019: $359) was received from the OSF in interest on behalf of the borrowers. The fund balance is included in Receivable and prepaid assets in the statement of financial position.
NOTE 28 – COMMITMENTS AND GUARANTEES Legal claims are recognised when the Bank has a present legal or constructive obligation as a result of past events, and it is more likely than not that an outflow of resources will be required to settle the obligation and the amount has been reliably estimated. The Bank recognises no provisions for future operating expenses. Commitments The Bank’s commitments are represented by loan disbursement obligations to its borrowers up to the approved amount of these loans (Refer to Note 10 – Loans outstanding) and OCR commitments to the operations of the SDF(U) (Refer to Note 3: Risk Management). Guarantees Financial guarantee contracts are contracts that require the issuer to make specified payments to reimburse the holder for a loss it incurs because a specified debtor fails to make payments when due, in accordance with the terms of a debt instrument. Financial guarantees are initially recognised as a liability in the financial statements at fair value, adjusted for transaction costs that are directly attributable to the issuance of the guarantee, on the date the guarantee was given. Subsequently, the liability is measured at the higher of the best estimate of the expenditure required to settle the present obligation at the reporting date and the amount initially recognised less cumulative amortisation. At its two hundred and forty-ninth meeting held on December 8, 2011, the Bank issued a guarantee in an amount not exceeding the equivalent of $12 million with respect to Bonds issued by the Government of St. Kitts and Nevis (GOSKN) on a rolling, re-instatable and non-accelerable basis. The guarantee contains a Counter Guarantee and Indemnity clause whereby the GOSKN undertakes irrevocably and unconditionally agrees to reimburse the Bank for any amount paid under the guarantee together with interest and other charges at a rate specified by the Bank. Where reimbursement to the Bank is not made (in whole or in part) within a period of 90 days of such amounts being paid the Bank such unreimbursed amounts shall be converted to a loan due by the GOSKN to the Bank’s OCR.

180
CARIBBEAN DEVELOPMENT BANK ANNUAL REPORT 2020
178 179
CARIBBEAN DEVELOPMENT BANK ANNUAL REPORT 2020 CARIBBEAN DEVELOPMENT BANK ANNUAL REPORT 2020
CCAARRIIBBBBEEAANN DDEEVVEELLOOPPMMEENNTT BBAANNKK OORRDDIINNAARRYY CCAAPPIITTAALL RREESSOOUURRCCEESS NNOOTTEESS TTOO TTHHEE FFIINNAANNCCIIAALL SSTTAATTEEMMEENNTTSS FFoorr tthhee yyeeaarr eennddeedd DDeecceemmbbeerr 3311,, 22002200 (expressed in thousands of United States dollars, unless otherwise stated)
- 92 -
NOTE 29 – SUBSEQUENT EVENTS Subsequent to the end of the financial year, the COVID-19 pandemic continued to have an effect on economic and social conditions in the Bank’s member countries. The development and distribution of vaccines, and continuing concerted efforts to fight the disease are expected to reduce gradually its ongoing impact. Consistent with its mandate, the Bank continues to take various actions to assist its BMCs such as the provision of grants for personal protective equipment and other equipment and for technical assistance, both from its own resources and in conjunction with regional and international agencies including international financial institutions. The Bank has also made additional resources available from its concessionary window (Special Funds Resources) to qualifying BMCs, to address certain specific needs and has increased the volume of resources available for Policy Based Loans (PBLs) to deal with exogenous shocks such as natural disasters or COVID-19 or macro-economic issues. The Bank is also discussing with its BMCs the repurposing of existing loans and the application of undisbursed balances to appropriate COVID-19 related activities. The Bank will continue to monitor developments in its BMCs and to mobilise resources aggressively to enable it to assist its members in these challenging times. On May 20, 2021 Moody’s Ratings affirmed the Bank’s Long-Term Issuer Default Rating (IDR) of ‘Aa1’ with a Stable outlook. On May 24, 2021 S&P Global Ratings affirmed the Bank’s Long-Term IDR of ‘AA+’ and its Short-Term IDR of ‘A-1+’ with a Stable outlook. On March 3, 2021 Fitch Ratings affirmed the Bank’s Long-Term IDR of ‘AA+’ and its Short-Term IDR of ‘F1+’. The outlook was lowered to Negative.
Caribbean Development BankSSppeecciiaall FFuunnddss RReessoouurrcceess –– SSppeecciiaall DDeevveellooppmmeenntt FFuunndd Financial Statements For the year ended December 31, 2020 (Expressed in thousands of United States dollars unless otherwise stated)

181
CARIBBEAN DEVELOPMENT BANK ANNUAL REPORT 2020
Caribbean Development BankSSppeecciiaall FFuunnddss RReessoouurrcceess –– SSppeecciiaall DDeevveellooppmmeenntt FFuunndd Financial Statements For the year ended December 31, 2020 (Expressed in thousands of United States dollars unless otherwise stated)

182
CARIBBEAN DEVELOPMENT BANK ANNUAL REPORT 2020
CCAARRIIBBBBEEAANN DDEEVVEELLOOPPMMEENNTT BBAANNKK SSPPEECCIIAALL FFUUNNDDSS RREESSOOUURRCCEESS –– SSPPEECCIIAALL DDEEVVEELLOOPPMMEENNTT FFUUNNDD IINNDDEEXX TTOO TTHHEE FFIINNAANNCCIIAALL SSTTAATTEEMMEENNTTSS PPaaggeess Independent Auditor’s Report 2 - 4 Statement of Financial Position 5 - 6 Statement of Comprehensive Income and Accumulated Net Income 7 Statement of Cash Flows 8 - 9 Summary Statement of Investments 10 Summary Statement of Loans 11 - 17 Statement of Contributed Resources 18 - 23 Statement of Accumulated Net Income 24 - 25 Notes to the Financial Statements 26 - 33
Independent Auditor's Report
Statement of Financial Position
Statement of Comprehensive Income and Accumulated Net Income
Statement of Cash Flows
Summary Statement of Investments
Summary Statement of Loans
Statement of Contributed Resources
Statement of Accumulated Net Income
Notes to the Financial Statements
Page
183
188-189
190
191-192
193
194-200
201-206
207-208
209-216

183
CARIBBEAN DEVELOPMENT BANK ANNUAL REPORT 2020
KPMG Hastings Christ Church, BB 15154 Barbados West Indies Telephone: (246) 434-3900 Fax: (246) 427-7123 P. O. Box 690C Bridgetown, Barbados
- 1 - KPMG in Barbados and the Eastern Caribbean, a partnership registered in Barbados, Antigua and Barbuda, Saint Lucia and St. Vincent and the Grenadines, and a member firm of the KPMG global organization of independent member firms affiliated with KPMG International Limited, a private English company limited by guarantee.
INDEPENDENT AUDITOR’S REPORT
To the Board of Governors of Caribbean Development Bank
Report on the Audit of the Financial Statements
Qualified Opinion We have audited the financial statements of the Special Development Fund (“the Fund”) of the Caribbean Development Bank (“the Bank”), which comprise the statement of financial position as of December 31, 2020, and the statement of comprehensive income and accumulated net income and statement of cash flows for the year then ended, and notes to the financial statements, including a summary of significant accounting policies. In our opinion, except for the possible effects of the matter described in the Basis for Qualified Opinion section of our report, the accompanying financial statements present fairly, in all material respects, the financial position of the Fund as of December 31, 2020, and its financial performance and its cash flows for the year then ended in accordance with the basis of accounting described in Note 2. Basis for Qualified Opinion As part of our procedures we have sought to obtain direct confirmation from the counterparty in relation to cash equivalents totaling USD$12.266M as at December 31, 2020. This is our initial audit engagement, and we are required to perform procedures on opening balances. In view of the modification of the report by the predecessor auditor on the same balance as December 31, 2019 (refer to the other matter paragraph), we have also sought to obtain direct confirmation from the counterparty in relation to that balance. We were unable to confirm or verify by alternative means the carrying amount of the balance as at December 31, 2020 and December 31, 2019. Accordingly, we were not able to determine whether any adjustments might be necessary to the amounts shown in the financial statements for the Fund for those periods and related corresponding entries in the statement of financial position and statement of comprehensive income, the statement of cashflow and/or the disclosure notes.
184
CARIBBEAN DEVELOPMENT BANK ANNUAL REPORT 2020
- 2 -
INDEPENDENT AUDITOR’S REPORT (CONTINUED)
To the Board of Governors of Caribbean Development Bank (continued)
Report on the Audit of the Financial Statements (continued)
Basis for Qualified Opinion (continued) We conducted our audit in accordance with International Standards on Auditing (“ISAs”). Our responsibilities under those standards are further described in the Auditors’ Responsibilities for the Audit of the Financial Statements section of our report. We are independent of the Fund in accordance with the International Ethics Standards Board for Accountants’ International Code of Ethics for Professional Accountants (“IESBA Code”), together with the ethical requirements that are relevant to our audit of the financial statements in Barbados and we have fulfilled our other ethical responsibilities in accordance with these requirements and the IESBA Code. We believe that the audit evidence we have obtained is sufficient and appropriate to provide a basis for our qualified opinion. Emphasis of Matter – Basis of Accounting We draw attention to Note 2 of the financial statements which describes the basis of accounting. The financial statements are prepared for the specific purpose of reflecting the sources and applications of member subscriptions and contributions and other development resources and as a result, may not be suitable for another purpose. Our opinion is not modified in respect of this matter. Other Matter The financial statements of the Fund as at and for the year ended December 31, 2019 were audited by another auditor who expressed a modified opinion on June 30, 2020. The opinion was qualified due to the possible impact on the financial statements as a result of the inability to obtain sufficient appropriate audit evidence on investments totaling USD$12.266M.

185
CARIBBEAN DEVELOPMENT BANK ANNUAL REPORT 2020
- 3 -
INDEPENDENT AUDITOR’S REPORT (CONTINUED)
To the Board of Governors of Caribbean Development Bank (continued)
Report on the Audit of the Financial Statements (continued)
Other information included in the Bank’s 2020 Annual Report
Management is responsible for the other information. The other information comprises the Management’s Discussion and Analysis but does not include the financial statements and our auditors’ report thereon.
Our opinion on the financial statements does not cover the other information and we do not express any form of assurance conclusion thereon.
In connection with our audit of the financial statements, our responsibility is to read the other information and, in doing so, consider whether the other information is materially inconsistent with the financial statements or our knowledge obtained in the audit, or otherwise appears to be materially misstated. If, based on the work we have performed, we conclude that there is a material misstatement of this other information, we are required to report that fact. We have nothing to report in this regard.
Responsibilities of Management and the Oversight and Assurance Committee for the Financial Statements Management is responsible for the preparation and fair presentation of the financial statements in accordance with select accounting policies as described in Note 2, and for such internal control as management determines is necessary to enable the preparation of financial statements that are free from material misstatement, whether due to fraud or error. In preparing the financial statements, management is responsible for assessing the Fund’s ability to continue as a going concern, disclosing, as applicable, matters related to going concern and using the going concern basis of accounting unless management either intends to liquidate the Fund or to cease operations, or has no realistic alternative but to do so. The Oversight and Assurance Committee is responsible for overseeing the Fund’s financial reporting process.

186
CARIBBEAN DEVELOPMENT BANK ANNUAL REPORT 2020
- 4 -
INDEPENDENT AUDITOR’S REPORT (CONTINUED)
To the Board of Governors of Caribbean Development Bank (continued)
Report on the Audit of the Financial Statements (continued)
Auditors’ Responsibilities for the Audit of the Financial Statements Our objectives are to obtain reasonable assurance about whether the financial statements as a whole are free from material misstatement, whether due to fraud or error, and to issue an auditors’ report that includes our opinion. Reasonable assurance is a high level of assurance, but is not a guarantee that an audit conducted in accordance with ISAs will always detect a material misstatement when it exists. Misstatements can arise from fraud or error and are considered material if, individually or in the aggregate, they could reasonably be expected to influence the economic decisions of users taken on the basis of these financial statements. As part of an audit in accordance with ISAs, we exercise professional judgment and maintain professional skepticism throughout the audit. We also:
• Identify and assess the risks of material misstatement of the financial statements,
whether due to fraud or error, design and perform audit procedures responsive to those risks, and obtain audit evidence that is sufficient and appropriate to provide a basis for our opinion. The risk of not detecting a material misstatement resulting from fraud is higher than for one resulting from error, as fraud may involve collusion, forgery, intentional omissions, misrepresentations, or the override of internal control.
• Obtain an understanding of internal control relevant to the audit in order to design audit procedures that are appropriate in the circumstances, but not for the purpose of expressing an opinion on the effectiveness of the Fund’s internal control.
• Evaluate the appropriateness of accounting policies used and the reasonableness of accounting estimates and related disclosures made by management.
• Conclude on the appropriateness of management’s use of the going concern basis of accounting and based on the audit evidence obtained, whether a material uncertainty exists related to events or conditions that may cast significant doubt on the Fund’s ability to continue as a going concern. If we conclude that a material uncertainty exists, we are required to draw attention in our auditor’s report to the related disclosures in the financial statements or, if such disclosures are inadequate, to modify our opinion. Our conclusions are based on the audit evidence obtained up to the date of our auditor’s report. However, future events or conditions may cause the Fund to cease to continue as a going concern.

187
CARIBBEAN DEVELOPMENT BANK ANNUAL REPORT 2020
- 5 -
INDEPENDENT AUDITOR’S REPORT (CONTINUED)
To the Board of Governors of Caribbean Development Bank (continued)
Report on the Audit of the Financial Statements (continued)
Auditor’s Responsibilities for the Audit of the Financial Statements (continued)
• Evaluate the overall presentation, structure and content of the financial
statements, including the disclosures, and whether the financial statements represent the underlying transactions and events in a manner that achieves fair presentation.
We communicate with the Oversight and Assurance Committee regarding, among other matters, the planned scope and timing of the audit and significant audit findings, including any significant deficiencies in internal control that we identify during our audit. Other matter – the purpose of our audit work and to whom we owe responsibility This report is made solely to the Fund’s contributors, as a body, in accordance with Article 38, sub-section 2 of the Agreement establishing the Caribbean Development Bank which entered into force on January 26, 1970. Our audit work has been undertaken so that we might state to the Fund’s contributors those matters we are required to state to them in an auditor’s report and for no other purpose. To the fullest extent permitted by law, we do not accept or assume responsibility to anyone other than the Fund and the Fund’s contributors as a body, for our audit work, for this report, or for the opinion we have formed.
Chartered Accountants Bridgetown, Barbados June 30, 2021

188
CARIBBEAN DEVELOPMENT BANK ANNUAL REPORT 2020
184 185
CARIBBEAN DEVELOPMENT BANK ANNUAL REPORT 2020 CARIBBEAN DEVELOPMENT BANK ANNUAL REPORT 2020
CCAARRIIBBBBEEAANN DDEEVVEELLOOPPMMEENNTT BBAANNKK SSPPEECCIIAALL FFUUNNDDSS RREESSOOUURRCCEESS –– SSPPEECCIIAALL DDEEVVEELLOOPPMMEENNTT FFUUNNDD
SSTTAATTEEMMEENNTT OOFF FFIINNAANNCCIIAALL PPOOSSIITTIIOONN AAss ooff DDeecceemmbbeerr 3311,, 22002200
(expressed in thousands of United States dollars, unless otherwise stated)
- 5 -
2020 2019 Unified Other Total Unified Other Total
Assets
Cash and cash equivalents – Note 3 $- $13,142 $13,142 $47,136 $11,429 $58,565 Debt securities at fair value through profit or loss (Schedule 1) 333,440 13,128 346,568 310,078 22,647 332,725 Loans outstanding (Schedule 2) 593,239 21,589 614,828 537,444 22,769 560,213 Receivables Accounts receivable 206 - 206 535 - 535
926,885 47,859 974,744 895,193 56,845 952,038
Receivable from contributors
Non-negotiable demand notes (Schedule 3) 68,222
- 68,222 71,526 - 71,526
Contribution in arrears 22,361 - 22,361 16,671 - 16,671
90,583 - 90,583 88,197 - 88,197
Total assets $1,017,468 $47,859 $1,065,327 $983,390 $56,845 $1,040,235
Liabilities and Funds
Liabilities Due to Bank (Note 3) $11,618 $- $11,618 $- $5,552 $5,552 Accounts payable – Note 9
46,488
1,157
47,645 40,279 791 41,070
Subscriptions in advance - - - 3,328 - 3,328
$58,106 $1,157 $59,263 $43,607 $6,343 $49,950 The accompanying schedules and notes form an integral part of these financial statements.
CCAARRIIBBBBEEAANN DDEEVVEELLOOPPMMEENNTT BBAANNKK SSPPEECCIIAALL FFUUNNDDSS RREESSOOUURRCCEESS –– SSPPEECCIIAALL DDEEVVEELLOOPPMMEENNTT FFUUNNDD
SSTTAATTEEMMEENNTT OOFF FFIINNAANNCCIIAALL PPOOSSIITTIIOONN… continued AAss ooff DDeecceemmbbeerr 3311,, 22002200
(expressed in thousands of United States dollars, unless otherwise stated)
- 6 -
2020 2019 Unified Other Total Unified Other Total
Funds – Note 5 Contributed resources (Schedule 3)
Contributions $1,324,213 $38,723 $1,362,936 $1,319,655 $38,335 $1,357,990 Less amounts not yet made available (2,216) - (2,216) (34,116) - (34,116) Amounts made available 1,321,997 38,723 1,360,720 1,285,539 38,335 1,323,874 Allocation to technical assistance and grant resources
(574,600)
(10,000)
(584,600) (544,850) (10,000) (554,850)
747,397 28,723 776,120 740,689 28,335 769,024 Accumulated net income (Schedule 4) 64,002 17,054 81,056 55,468 21,242 76,710 Technical assistance and grant resources – Note 7
147,963
925
148,888
143,626 925 144,551
959,362 46,702 1,006,064 939,783 50,502 990,285 Total liabilities and funds $1,017,468 $47,859 $1,065,327 $983,390 $56,845 $1,040,235
The accompanying notes form an integral part of these financial statements.
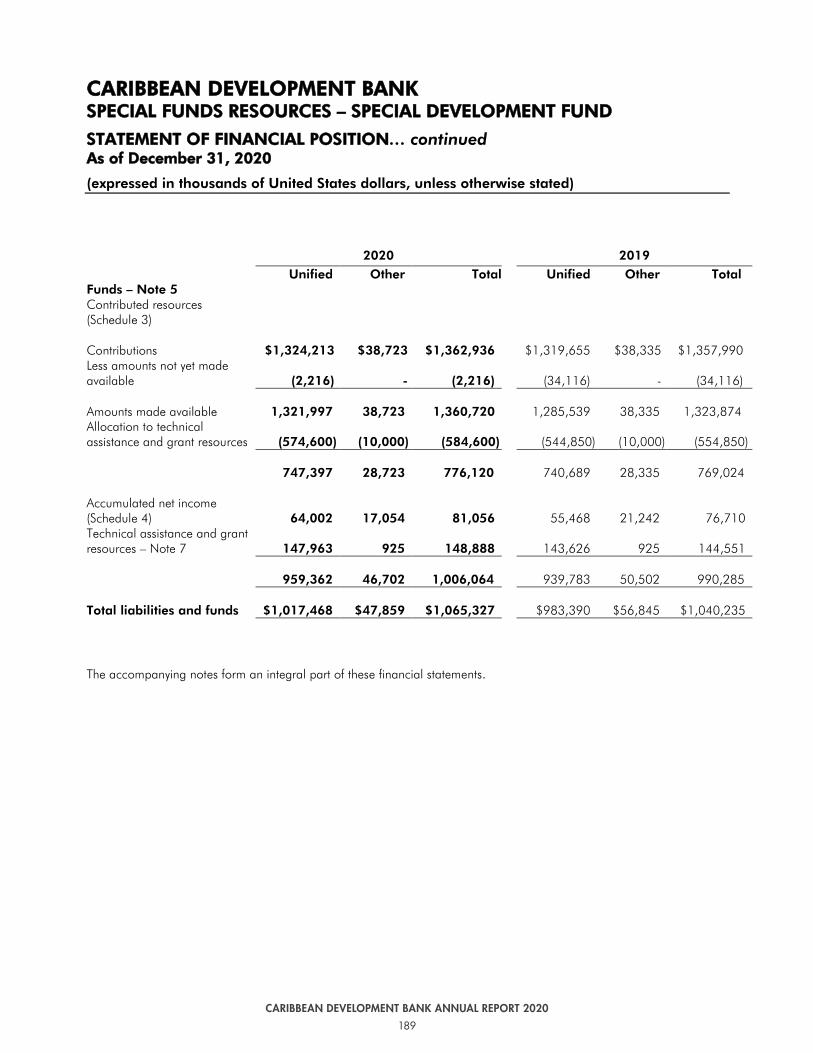
189
CARIBBEAN DEVELOPMENT BANK ANNUAL REPORT 2020
184 185
CARIBBEAN DEVELOPMENT BANK ANNUAL REPORT 2020 CARIBBEAN DEVELOPMENT BANK ANNUAL REPORT 2020
CCAARRIIBBBBEEAANN DDEEVVEELLOOPPMMEENNTT BBAANNKK SSPPEECCIIAALL FFUUNNDDSS RREESSOOUURRCCEESS –– SSPPEECCIIAALL DDEEVVEELLOOPPMMEENNTT FFUUNNDD
SSTTAATTEEMMEENNTT OOFF FFIINNAANNCCIIAALL PPOOSSIITTIIOONN AAss ooff DDeecceemmbbeerr 3311,, 22002200
(expressed in thousands of United States dollars, unless otherwise stated)
- 5 -
2020 2019 Unified Other Total Unified Other Total
Assets
Cash and cash equivalents – Note 3 $- $13,142 $13,142 $47,136 $11,429 $58,565 Debt securities at fair value through profit or loss (Schedule 1) 333,440 13,128 346,568 310,078 22,647 332,725 Loans outstanding (Schedule 2) 593,239 21,589 614,828 537,444 22,769 560,213 Receivables Accounts receivable 206 - 206 535 - 535
926,885 47,859 974,744 895,193 56,845 952,038
Receivable from contributors
Non-negotiable demand notes (Schedule 3) 68,222
- 68,222 71,526 - 71,526
Contribution in arrears 22,361 - 22,361 16,671 - 16,671
90,583 - 90,583 88,197 - 88,197
Total assets $1,017,468 $47,859 $1,065,327 $983,390 $56,845 $1,040,235
Liabilities and Funds
Liabilities Due to Bank (Note 3) $11,618 $- $11,618 $- $5,552 $5,552 Accounts payable – Note 9
46,488
1,157
47,645 40,279 791 41,070
Subscriptions in advance - - - 3,328 - 3,328
$58,106 $1,157 $59,263 $43,607 $6,343 $49,950 The accompanying schedules and notes form an integral part of these financial statements.
CCAARRIIBBBBEEAANN DDEEVVEELLOOPPMMEENNTT BBAANNKK SSPPEECCIIAALL FFUUNNDDSS RREESSOOUURRCCEESS –– SSPPEECCIIAALL DDEEVVEELLOOPPMMEENNTT FFUUNNDD
SSTTAATTEEMMEENNTT OOFF FFIINNAANNCCIIAALL PPOOSSIITTIIOONN… continued AAss ooff DDeecceemmbbeerr 3311,, 22002200
(expressed in thousands of United States dollars, unless otherwise stated)
- 6 -
2020 2019 Unified Other Total Unified Other Total
Funds – Note 5 Contributed resources (Schedule 3)
Contributions $1,324,213 $38,723 $1,362,936 $1,319,655 $38,335 $1,357,990 Less amounts not yet made available (2,216) - (2,216) (34,116) - (34,116) Amounts made available 1,321,997 38,723 1,360,720 1,285,539 38,335 1,323,874 Allocation to technical assistance and grant resources
(574,600)
(10,000)
(584,600) (544,850) (10,000) (554,850)
747,397 28,723 776,120 740,689 28,335 769,024 Accumulated net income (Schedule 4) 64,002 17,054 81,056 55,468 21,242 76,710 Technical assistance and grant resources – Note 7
147,963
925
148,888
143,626 925 144,551
959,362 46,702 1,006,064 939,783 50,502 990,285 Total liabilities and funds $1,017,468 $47,859 $1,065,327 $983,390 $56,845 $1,040,235
The accompanying notes form an integral part of these financial statements.

190
CARIBBEAN DEVELOPMENT BANK ANNUAL REPORT 2020
186 187
CARIBBEAN DEVELOPMENT BANK ANNUAL REPORT 2020 CARIBBEAN DEVELOPMENT BANK ANNUAL REPORT 2020
CCAARRIIBBBBEEAANN DDEEVVEELLOOPPMMEENNTT BBAANNKK SSPPEECCIIAALL FFUUNNDDSS RREESSOOUURRCCEESS –– SSPPEECCIIAALL DDEEVVEELLOOPPMMEENNTT FFUUNNDD SSTTAATTEEMMEENNTT OOFF CCOOMMPPRREEHHEENNSSIIVVEE IINNCCOOMMEE AANNDD AACCCCUUMMUULLAATTEEDD NNEETT IINNCCOOMMEE FFoorr tthhee yyeeaarr eennddeedd DDeecceemmbbeerr 3311,, 22002200
(expressed in thousands of United States dollars, unless otherwise stated)
- 7 -
2020 2019 Unified Other Total Unified Other Total Interest and similar income Loans $12,190 $354 $12,544 $12,114 $381 $12,495 Investments and cash balances 11,895 306 12,201 13,029 782 13,811 24,085 660 24,745 25,143 1,163 26,306 Expenses Administrative expenses 16,495 1,205 17,700 15,407 1,060 16,467 Foreign exchange translation (944) 440 (504) 1,210 (104) 1,106 15,551 1,645 17,196 16,617 956 17,573 Total comprehensive income for the year $8,534 $(985) $7,549 $8,526 $207 $8,733
Accumulated net income Accumulated net income – beginning of year $55,468 $21,242 $76,710 $46,942 $21,035 $67,977 Appropriations for technical assistance - (3,203) (3,203) - - - Total comprehensive income for the year 8,534 (985) 7,549 8,526 207 8,733 Accumulated net income – end of year $64,002 $17,054 $81,056 $55,468 $21,242 $76,710
The accompanying notes form an integral part of these financial statements.
CCAARRIIBBBBEEAANN DDEEVVEELLOOPPMMEENNTT BBAANNKK SSPPEECCIIAALL FFUUNNDDSS RREESSOOUURRCCEESS –– SSPPEECCIIAALL DDEEVVEELLOOPPMMEENNTT FFUUNNDD ((UUNNIIFFIIEEDD))
SSTTAATTEEMMEENNTT OOFF CCAASSHH FFLLOOWWSS FFoorr tthhee yyeeaarr eennddeedd DDeecceemmbbeerr 3311,, 22002200
(expressed in thousands of United States dollars, unless otherwise stated)
- 8 -
2020 2019 Operating activities
Total comprehensive income for the year $8,534 $8,526 Adjustments for non-cash items Unrealised gain on debt securities at fair value through profit or loss (5,593) (5,895)
Interest income (18,492) (18,773) Unrealised net foreign exchange loss 1,181 310
Total cash flows used in operating activities before changes in operating assets and liabilities (14,370) (15,832)
Changes in operating assets and liabilities
Decrease/(Increase) in accounts receivable 329 (364) Increase in accounts payable 6,209 6,835 Cash used in operating activities (7,832) (9,361) Disbursements on loans (87,287) (32,234) Principal repayments to the Bank on loans 31,559 29,988 Interest received 18,517 18,456 Net increase in debt securities at fair value through profit or loss
(17,861)
(10,740) Technical assistance disbursements (15,414) (18,369) Net cash used in operating activities (78,318) (22,260)
Financing activities
Increase in contributions to be on-lent to BMCs 5,527 9,693 (Increase)/decrease in receivables from contributors (2,386) 1,668 Decrease in subscriptions in advance (3,328) (3,025) Technical assistance allocation 19,751 19,750
Net cash provided by financing activities 19,564 28,086
Net (decrease)/ increase in cash and cash equivalents (58,754) 5,826 Cash and cash equivalents - beginning of year 47,136 41,310
Cash and cash equivalents - end of year $(11,618) $47,136
The accompanying notes form an integral part of these financial statements.

191
CARIBBEAN DEVELOPMENT BANK ANNUAL REPORT 2020
186 187
CARIBBEAN DEVELOPMENT BANK ANNUAL REPORT 2020 CARIBBEAN DEVELOPMENT BANK ANNUAL REPORT 2020
CCAARRIIBBBBEEAANN DDEEVVEELLOOPPMMEENNTT BBAANNKK SSPPEECCIIAALL FFUUNNDDSS RREESSOOUURRCCEESS –– SSPPEECCIIAALL DDEEVVEELLOOPPMMEENNTT FFUUNNDD SSTTAATTEEMMEENNTT OOFF CCOOMMPPRREEHHEENNSSIIVVEE IINNCCOOMMEE AANNDD AACCCCUUMMUULLAATTEEDD NNEETT IINNCCOOMMEE FFoorr tthhee yyeeaarr eennddeedd DDeecceemmbbeerr 3311,, 22002200
(expressed in thousands of United States dollars, unless otherwise stated)
- 7 -
2020 2019 Unified Other Total Unified Other Total Interest and similar income Loans $12,190 $354 $12,544 $12,114 $381 $12,495 Investments and cash balances 11,895 306 12,201 13,029 782 13,811 24,085 660 24,745 25,143 1,163 26,306 Expenses Administrative expenses 16,495 1,205 17,700 15,407 1,060 16,467 Foreign exchange translation (944) 440 (504) 1,210 (104) 1,106 15,551 1,645 17,196 16,617 956 17,573 Total comprehensive income for the year $8,534 $(985) $7,549 $8,526 $207 $8,733
Accumulated net income Accumulated net income – beginning of year $55,468 $21,242 $76,710 $46,942 $21,035 $67,977 Appropriations for technical assistance - (3,203) (3,203) - - - Total comprehensive income for the year 8,534 (985) 7,549 8,526 207 8,733 Accumulated net income – end of year $64,002 $17,054 $81,056 $55,468 $21,242 $76,710
The accompanying notes form an integral part of these financial statements.
CCAARRIIBBBBEEAANN DDEEVVEELLOOPPMMEENNTT BBAANNKK SSPPEECCIIAALL FFUUNNDDSS RREESSOOUURRCCEESS –– SSPPEECCIIAALL DDEEVVEELLOOPPMMEENNTT FFUUNNDD ((UUNNIIFFIIEEDD))
SSTTAATTEEMMEENNTT OOFF CCAASSHH FFLLOOWWSS FFoorr tthhee yyeeaarr eennddeedd DDeecceemmbbeerr 3311,, 22002200
(expressed in thousands of United States dollars, unless otherwise stated)
- 8 -
2020 2019 Operating activities
Total comprehensive income for the year $8,534 $8,526 Adjustments for non-cash items Unrealised gain on debt securities at fair value through profit or loss (5,593) (5,895)
Interest income (18,492) (18,773) Unrealised net foreign exchange loss 1,181 310
Total cash flows used in operating activities before changes in operating assets and liabilities (14,370) (15,832)
Changes in operating assets and liabilities
Decrease/(Increase) in accounts receivable 329 (364) Increase in accounts payable 6,209 6,835 Cash used in operating activities (7,832) (9,361) Disbursements on loans (87,287) (32,234) Principal repayments to the Bank on loans 31,559 29,988 Interest received 18,517 18,456 Net increase in debt securities at fair value through profit or loss
(17,861)
(10,740) Technical assistance disbursements (15,414) (18,369) Net cash used in operating activities (78,318) (22,260)
Financing activities
Increase in contributions to be on-lent to BMCs 5,527 9,693 (Increase)/decrease in receivables from contributors (2,386) 1,668 Decrease in subscriptions in advance (3,328) (3,025) Technical assistance allocation 19,751 19,750
Net cash provided by financing activities 19,564 28,086
Net (decrease)/ increase in cash and cash equivalents (58,754) 5,826 Cash and cash equivalents - beginning of year 47,136 41,310
Cash and cash equivalents - end of year $(11,618) $47,136
The accompanying notes form an integral part of these financial statements.
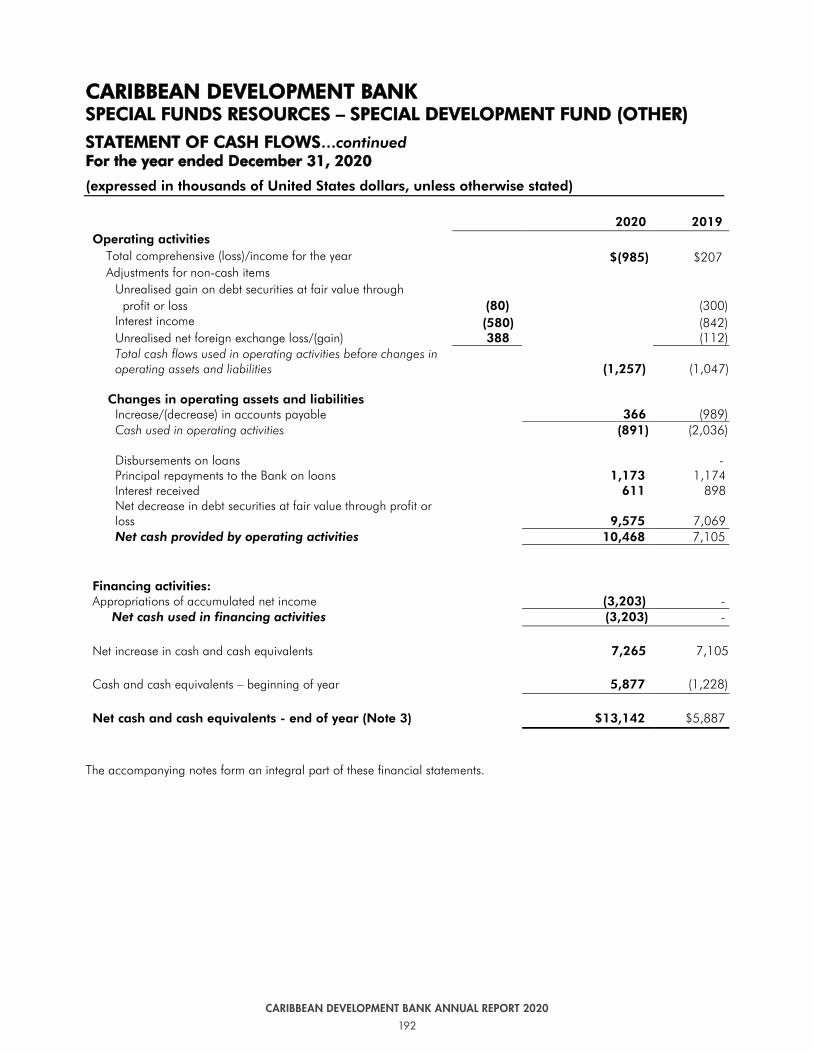
192
CARIBBEAN DEVELOPMENT BANK ANNUAL REPORT 2020
188 189
CARIBBEAN DEVELOPMENT BANK ANNUAL REPORT 2020 CARIBBEAN DEVELOPMENT BANK ANNUAL REPORT 2020
CCAARRIIBBBBEEAANN DDEEVVEELLOOPPMMEENNTT BBAANNKK SSPPEECCIIAALL FFUUNNDDSS RREESSOOUURRCCEESS –– SSPPEECCIIAALL DDEEVVEELLOOPPMMEENNTT FFUUNNDD ((OOTTHHEERR))
SSTTAATTEEMMEENNTT OOFF CCAASSHH FFLLOOWWSS…continued FFoorr tthhee yyeeaarr eennddeedd DDeecceemmbbeerr 3311,, 22002200
(expressed in thousands of United States dollars, unless otherwise stated)
- 9 -
2020 2019 Operating activities
Total comprehensive (loss)/income for the year $(985) $207 Adjustments for non-cash items
Unrealised gain on debt securities at fair value through profit or loss (80) (300)
Interest income (580) (842) Unrealised net foreign exchange loss/(gain) 388 (112) Total cash flows used in operating activities before changes in operating assets and liabilities
(1,257)
(1,047)
Changes in operating assets and liabilities
Increase/(decrease) in accounts payable 366 (989) Cash used in operating activities (891) (2,036) Disbursements on loans - Principal repayments to the Bank on loans 1,173 1,174 Interest received 611 898 Net decrease in debt securities at fair value through profit or loss
9,575 7,069
Net cash provided by operating activities 10,468 7,105
Financing activities: Appropriations of accumulated net income (3,203) -
Net cash used in financing activities (3,203) -
Net increase in cash and cash equivalents 7,265 7,105 Cash and cash equivalents – beginning of year 5,877 (1,228)
Net cash and cash equivalents - end of year (Note 3) $13,142 $5,887
The accompanying notes form an integral part of these financial statements.
CCAARRIIBBBBEEAANN DDEEVVEELLOOPPMMEENNTT BBAANNKK SSPPEECCIIAALL FFUUNNDD RREESSOOUURRCCEESS –– SSPPEECCIIAALL DDEEVVEELLOOPPMMEENNTT FFUUNNDD
SSUUMMMMAARRYY SSTTAATTEEMMEENNTT OOFF IINNVVEESSTTMMEENNTTSS AAss ooff DDeecceemmbbeerr 3311,, 22002200
(expressed in thousands of United States dollars, unless otherwise stated)
- 10 -
SCHEDULE 1
2020 2019 Debt securities at fair value through profit or loss – Note 4 Market value Market value Unified Other Total Unified Other Total Government and Agency Obligations $160,309 $8,618 $168,927 $135,876 $15,739 $151,615 Supranationals 81,578 4,485 86,063 91,647 6,859 98,506 Corporate Bonds 89,836 - 89,836 80,746 - 80,746 Sub-total 331,723 13,103 344,826 308,269 22,598 330,867 Accrued interest 1,717 25 1,742 1,809 49 1,858 Total – December 31 $333,440 $13,128 $346,568 $310,078 $22,647 $332,725
Residual term to contractual maturity 2020 2019 One month to three months $33,023 $18,443 Over three months to one year 25,586 89,175 From one year to five years 196,271 198,691 From five years to ten years 78,871 26,416 From ten years to twenty years 12,440 - From twenty years to thirty years 377 - Total – December 31 $346,568 $332,725

193
CARIBBEAN DEVELOPMENT BANK ANNUAL REPORT 2020
188 189
CARIBBEAN DEVELOPMENT BANK ANNUAL REPORT 2020 CARIBBEAN DEVELOPMENT BANK ANNUAL REPORT 2020
CCAARRIIBBBBEEAANN DDEEVVEELLOOPPMMEENNTT BBAANNKK SSPPEECCIIAALL FFUUNNDDSS RREESSOOUURRCCEESS –– SSPPEECCIIAALL DDEEVVEELLOOPPMMEENNTT FFUUNNDD ((OOTTHHEERR))
SSTTAATTEEMMEENNTT OOFF CCAASSHH FFLLOOWWSS…continued FFoorr tthhee yyeeaarr eennddeedd DDeecceemmbbeerr 3311,, 22002200
(expressed in thousands of United States dollars, unless otherwise stated)
- 9 -
2020 2019 Operating activities
Total comprehensive (loss)/income for the year $(985) $207 Adjustments for non-cash items
Unrealised gain on debt securities at fair value through profit or loss (80) (300)
Interest income (580) (842) Unrealised net foreign exchange loss/(gain) 388 (112) Total cash flows used in operating activities before changes in operating assets and liabilities
(1,257)
(1,047)
Changes in operating assets and liabilities
Increase/(decrease) in accounts payable 366 (989) Cash used in operating activities (891) (2,036) Disbursements on loans - Principal repayments to the Bank on loans 1,173 1,174 Interest received 611 898 Net decrease in debt securities at fair value through profit or loss
9,575 7,069
Net cash provided by operating activities 10,468 7,105
Financing activities: Appropriations of accumulated net income (3,203) -
Net cash used in financing activities (3,203) -
Net increase in cash and cash equivalents 7,265 7,105 Cash and cash equivalents – beginning of year 5,877 (1,228)
Net cash and cash equivalents - end of year (Note 3) $13,142 $5,887
The accompanying notes form an integral part of these financial statements.
CCAARRIIBBBBEEAANN DDEEVVEELLOOPPMMEENNTT BBAANNKK SSPPEECCIIAALL FFUUNNDD RREESSOOUURRCCEESS –– SSPPEECCIIAALL DDEEVVEELLOOPPMMEENNTT FFUUNNDD
SSUUMMMMAARRYY SSTTAATTEEMMEENNTT OOFF IINNVVEESSTTMMEENNTTSS AAss ooff DDeecceemmbbeerr 3311,, 22002200
(expressed in thousands of United States dollars, unless otherwise stated)
- 10 -
SCHEDULE 1
2020 2019 Debt securities at fair value through profit or loss – Note 4 Market value Market value Unified Other Total Unified Other Total Government and Agency Obligations $160,309 $8,618 $168,927 $135,876 $15,739 $151,615 Supranationals 81,578 4,485 86,063 91,647 6,859 98,506 Corporate Bonds 89,836 - 89,836 80,746 - 80,746 Sub-total 331,723 13,103 344,826 308,269 22,598 330,867 Accrued interest 1,717 25 1,742 1,809 49 1,858 Total – December 31 $333,440 $13,128 $346,568 $310,078 $22,647 $332,725
Residual term to contractual maturity 2020 2019 One month to three months $33,023 $18,443 Over three months to one year 25,586 89,175 From one year to five years 196,271 198,691 From five years to ten years 78,871 26,416 From ten years to twenty years 12,440 - From twenty years to thirty years 377 - Total – December 31 $346,568 $332,725

194
CARIBBEAN DEVELOPMENT BANK ANNUAL REPORT 2020
190 191
CARIBBEAN DEVELOPMENT BANK ANNUAL REPORT 2020 CARIBBEAN DEVELOPMENT BANK ANNUAL REPORT 2020
CCAARRIIBBBBEEAANN DDEEVVEELLOOPPMMEENNTT BBAANNKK SSPPEECCIIAALL FFUUNNDDSS RREESSOOUURRCCEESS –– SSPPEECCIIAALL DDEEVVEELLOOPPMMEENNTT FFUUNNDD ((UUNNIIFFIIEEDD)) SSUUMMMMAARRYY SSTTAATTEEMMEENNTT OOFF LLOOAANNSS…continued AAss ooff DDeecceemmbbeerr 3311,, 22002200
(expressed in thousands of United States dollars, unless otherwise stated)
- 12 -
1/ There are no overdue installments of principal.
2019
Member countries in which loans have been made
Loans approved
but not yet effective Undisbursed Outstanding1/
% of Total Loans
Outstanding Anguilla $425 $- $1,477 0.3 Antigua and Barbuda - 6,119 947 0.2 Bahamas 750 - 309 0.1 Barbados - - 31 0.0 Belize - 37,143 46,209 8.6 British Virgin Islands - 5,000 3,352 0.6 Dominica - 14,150 49,371 9.2 Grenada - 25,001 71,923 13.5 Guyana - 26,454 121,882 22.7 Jamaica - 5,045 100,010 18.7 Montserrat - 321 3,570 0.7 St. Kitts and Nevis - 5,516 35,508 6.6 St. Lucia - 33,968 50,524 9.5 St. Vincent and the Grenadines 10,000 29,490 40,441 7.6 Suriname - 9,271 1,441 0.3 Trinidad and Tobago 1,000 - - 0.0 Turks and Caicos Islands - - 753 0.1 Regional - 815 6,707 1.3 Sub-total 12,175 198,293 534,455 100.0 Accrued interest - - 2,989 Total – December 31 $12,175 $198,293 $537,444
CCAARRIIBBBBEEAANN DDEEVVEELLOOPPMMEENNTT BBAANNKK SSPPEECCIIAALL FFUUNNDDSS RREESSOOUURRCCEESS –– SSPPEECCIIAALL DDEEVVEELLOOPPMMEENNTT FFUUNNDD ((UUNNIIFFIIEEDD)) SSUUMMMMAARRYY SSTTAATTEEMMEENNTT OOFF LLOOAANNSS AAss ooff DDeecceemmbbeerr 3311,, 22002200
(expressed in thousands of United States dollars, unless otherwise stated)
- 11 -
SCHEDULE 2
2020
Member countries in which loans have been made
Loans approved
but not yet effective Undisbursed Outstanding1/
% of Total Loans
Outstanding Anguilla $- $- $1,258 0.2 Antigua and Barbuda - 9,724 10,086 1.7 Bahamas - - 227 0.0 Belize 13,000 35,994 56,531 9.6 British Virgin Islands - 5,000 2,965 0.5 Dominica - 14,068 61,547 10.4 Grenada - 24,877 74,525 12.6 Guyana 20,746 20,418 123,091 20.9 Jamaica 30,000 4,684 92,114 15.6 Montserrat - - 3,383 0.6 St. Kitts and Nevis - 3,580 34,631 5.9 St. Lucia - 36,176 66,677 11.4 St. Vincent and the Grenadines 8,573 44,154 45,074 7.6 Suriname - 8,586 10,326 1.7 Turks and Caicos Islands - - 652 0.1 Regional - - 7,096 1.2 Sub-total 72,319 207,261 590,183 100.0 Accrued interest - - 3,056 Total – December 31 $72,319 $207,261 $593,239
1/ There are no overdue installments of principal (2019 - nil).

195
CARIBBEAN DEVELOPMENT BANK ANNUAL REPORT 2020
190 191
CARIBBEAN DEVELOPMENT BANK ANNUAL REPORT 2020 CARIBBEAN DEVELOPMENT BANK ANNUAL REPORT 2020
CCAARRIIBBBBEEAANN DDEEVVEELLOOPPMMEENNTT BBAANNKK SSPPEECCIIAALL FFUUNNDDSS RREESSOOUURRCCEESS –– SSPPEECCIIAALL DDEEVVEELLOOPPMMEENNTT FFUUNNDD ((UUNNIIFFIIEEDD)) SSUUMMMMAARRYY SSTTAATTEEMMEENNTT OOFF LLOOAANNSS…continued AAss ooff DDeecceemmbbeerr 3311,, 22002200
(expressed in thousands of United States dollars, unless otherwise stated)
- 12 -
1/ There are no overdue installments of principal.
2019
Member countries in which loans have been made
Loans approved
but not yet effective Undisbursed Outstanding1/
% of Total Loans
Outstanding Anguilla $425 $- $1,477 0.3 Antigua and Barbuda - 6,119 947 0.2 Bahamas 750 - 309 0.1 Barbados - - 31 0.0 Belize - 37,143 46,209 8.6 British Virgin Islands - 5,000 3,352 0.6 Dominica - 14,150 49,371 9.2 Grenada - 25,001 71,923 13.5 Guyana - 26,454 121,882 22.7 Jamaica - 5,045 100,010 18.7 Montserrat - 321 3,570 0.7 St. Kitts and Nevis - 5,516 35,508 6.6 St. Lucia - 33,968 50,524 9.5 St. Vincent and the Grenadines 10,000 29,490 40,441 7.6 Suriname - 9,271 1,441 0.3 Trinidad and Tobago 1,000 - - 0.0 Turks and Caicos Islands - - 753 0.1 Regional - 815 6,707 1.3 Sub-total 12,175 198,293 534,455 100.0 Accrued interest - - 2,989 Total – December 31 $12,175 $198,293 $537,444
CCAARRIIBBBBEEAANN DDEEVVEELLOOPPMMEENNTT BBAANNKK SSPPEECCIIAALL FFUUNNDDSS RREESSOOUURRCCEESS –– SSPPEECCIIAALL DDEEVVEELLOOPPMMEENNTT FFUUNNDD ((UUNNIIFFIIEEDD)) SSUUMMMMAARRYY SSTTAATTEEMMEENNTT OOFF LLOOAANNSS AAss ooff DDeecceemmbbeerr 3311,, 22002200
(expressed in thousands of United States dollars, unless otherwise stated)
- 11 -
SCHEDULE 2
2020
Member countries in which loans have been made
Loans approved
but not yet effective Undisbursed Outstanding1/
% of Total Loans
Outstanding Anguilla $- $- $1,258 0.2 Antigua and Barbuda - 9,724 10,086 1.7 Bahamas - - 227 0.0 Belize 13,000 35,994 56,531 9.6 British Virgin Islands - 5,000 2,965 0.5 Dominica - 14,068 61,547 10.4 Grenada - 24,877 74,525 12.6 Guyana 20,746 20,418 123,091 20.9 Jamaica 30,000 4,684 92,114 15.6 Montserrat - - 3,383 0.6 St. Kitts and Nevis - 3,580 34,631 5.9 St. Lucia - 36,176 66,677 11.4 St. Vincent and the Grenadines 8,573 44,154 45,074 7.6 Suriname - 8,586 10,326 1.7 Turks and Caicos Islands - - 652 0.1 Regional - - 7,096 1.2 Sub-total 72,319 207,261 590,183 100.0 Accrued interest - - 3,056 Total – December 31 $72,319 $207,261 $593,239
1/ There are no overdue installments of principal (2019 - nil).

196
CARIBBEAN DEVELOPMENT BANK ANNUAL REPORT 2020
192 193
CARIBBEAN DEVELOPMENT BANK ANNUAL REPORT 2020 CARIBBEAN DEVELOPMENT BANK ANNUAL REPORT 2020
CCAARRIIBBBBEEAANN DDEEVVEELLOOPPMMEENNTT BBAANNKK SSPPEECCIIAALL FFUUNNDDSS RREESSOOUURRCCEESS –– SSPPEECCIIAALL DDEEVVEELLOOPPMMEENNTT FFUUNNDD ((OOTTHHEERR))
SSUUMMMMAARRYY SSTTAATTEEMMEENNTT OOFF LLOOAANNSS…continued AAss ooff DDeecceemmbbeerr 3311,, 22002200
(expressed in thousands of United States dollars, unless otherwise stated)
- 13 -
SCHEDULE 2 2020
Member countries in which loans have been made
Loans approved but
not yet effective Outstanding1/
% of Total Loans
Outstanding Antigua and Barbuda $- $12,040 56.0 Belize - 3,861 18.0 Dominica - 1,218 5.8 Grenada - 107 0.5 Jamaica - 500 2.3 St. Kitts and Nevis - 2,919 13.6 St. Lucia - 184 0.9 St. Vincent and the Grenadines - 674 3.1 Sub-total - 21,503 100.0 Accrued interest - 86 Total $- $21,589
1/ There were no overdue installments of principal (2018 - nil). There were also no amounts undisbursed at December 31, 2019.
.
2019
Member countries in which loans have been made
Loans approved but
not yet effective Outstanding1/
% of Total Loans
Outstanding
Antigua and Barbuda $- $12,068 53.3 Belize - 4,336 19.1 Dominica - 1,323 5.8 Grenada - 116 0.5 Jamaica - 633 2.8 St. Kitts and Nevis - 3,228 14.2 St. Lucia - 227 1.0 St. Vincent and the Grenadines - 746 3.3 Sub-total - 22,677 100.0 Accrued interest - 92 Total $- $22,769
CCAARRIIBBBBEEAANN DDEEVVEELLOOPPMMEENNTT BBAANNKK SSPPEECCIIAALL FFUUNNDDSS RREESSOOUURRCCEESS –– SSPPEECCIIAALL DDEEVVEELLOOPPMMEENNTT FFUUNNDD
SSUUMMMMAARRYY SSTTAATTEEMMEENNTT OOFF LLOOAANNSS…continued AAss ooff DDeecceemmbbeerr 3311,, 22002200
(expressed in thousands of United States dollars, unless otherwise stated)
- 14 -
SCHEDULE 2
2020
Analysis by Contributor
Loans approved
but not yet effective Undisbursed
Out-standing1/
% of total loans
outstanding Special Development Fund (Unified) Members/Contributors $72,319 $207,260 $590,183 100.0 Accrued interest - - 3,056 Total - Special Development Fund (Unified) $72,319 $207,260 $593,239 Special Development Fund (Other) Members Germany $- $- $84 0.4 Mexico - - 1,077 5.0 Venezuela - - 8,521 39.6
-
-
9,682
Other contributors Sweden - - 21 0.1 United States of America - - 11,800 54.9 Sub-total – SDF (Other) - - 11,821 100.0 Accrued interest - - 86 Total – Special Development Fund (Other) $- $- $21,589 Total Special Development Fund $72,319 $207,260 $614,828
1/There were no overdue installments of principal (2019- nil).
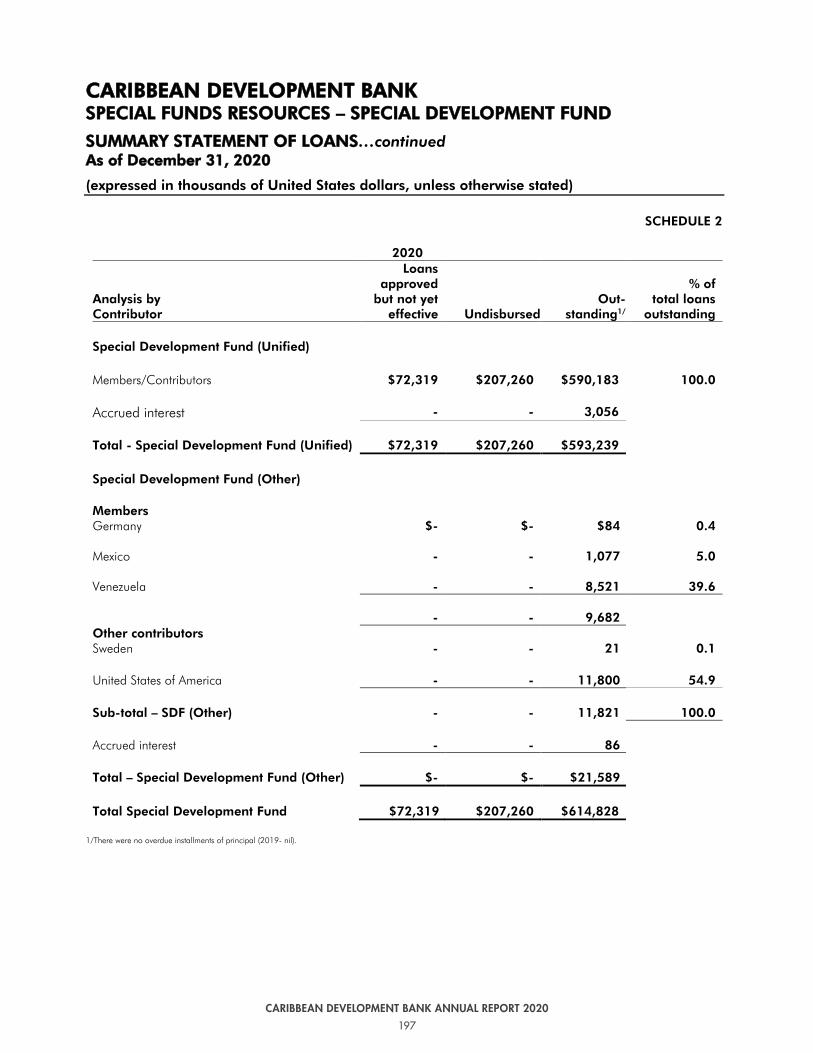
197
CARIBBEAN DEVELOPMENT BANK ANNUAL REPORT 2020
192 193
CARIBBEAN DEVELOPMENT BANK ANNUAL REPORT 2020 CARIBBEAN DEVELOPMENT BANK ANNUAL REPORT 2020
CCAARRIIBBBBEEAANN DDEEVVEELLOOPPMMEENNTT BBAANNKK SSPPEECCIIAALL FFUUNNDDSS RREESSOOUURRCCEESS –– SSPPEECCIIAALL DDEEVVEELLOOPPMMEENNTT FFUUNNDD ((OOTTHHEERR))
SSUUMMMMAARRYY SSTTAATTEEMMEENNTT OOFF LLOOAANNSS…continued AAss ooff DDeecceemmbbeerr 3311,, 22002200
(expressed in thousands of United States dollars, unless otherwise stated)
- 13 -
SCHEDULE 2 2020
Member countries in which loans have been made
Loans approved but
not yet effective Outstanding1/
% of Total Loans
Outstanding Antigua and Barbuda $- $12,040 56.0 Belize - 3,861 18.0 Dominica - 1,218 5.8 Grenada - 107 0.5 Jamaica - 500 2.3 St. Kitts and Nevis - 2,919 13.6 St. Lucia - 184 0.9 St. Vincent and the Grenadines - 674 3.1 Sub-total - 21,503 100.0 Accrued interest - 86 Total $- $21,589
1/ There were no overdue installments of principal (2018 - nil). There were also no amounts undisbursed at December 31, 2019.
.
2019
Member countries in which loans have been made
Loans approved but
not yet effective Outstanding1/
% of Total Loans
Outstanding
Antigua and Barbuda $- $12,068 53.3 Belize - 4,336 19.1 Dominica - 1,323 5.8 Grenada - 116 0.5 Jamaica - 633 2.8 St. Kitts and Nevis - 3,228 14.2 St. Lucia - 227 1.0 St. Vincent and the Grenadines - 746 3.3 Sub-total - 22,677 100.0 Accrued interest - 92 Total $- $22,769
CCAARRIIBBBBEEAANN DDEEVVEELLOOPPMMEENNTT BBAANNKK SSPPEECCIIAALL FFUUNNDDSS RREESSOOUURRCCEESS –– SSPPEECCIIAALL DDEEVVEELLOOPPMMEENNTT FFUUNNDD
SSUUMMMMAARRYY SSTTAATTEEMMEENNTT OOFF LLOOAANNSS…continued AAss ooff DDeecceemmbbeerr 3311,, 22002200
(expressed in thousands of United States dollars, unless otherwise stated)
- 14 -
SCHEDULE 2
2020
Analysis by Contributor
Loans approved
but not yet effective Undisbursed
Out-standing1/
% of total loans
outstanding Special Development Fund (Unified) Members/Contributors $72,319 $207,260 $590,183 100.0 Accrued interest - - 3,056 Total - Special Development Fund (Unified) $72,319 $207,260 $593,239 Special Development Fund (Other) Members Germany $- $- $84 0.4 Mexico - - 1,077 5.0 Venezuela - - 8,521 39.6
-
-
9,682
Other contributors Sweden - - 21 0.1 United States of America - - 11,800 54.9 Sub-total – SDF (Other) - - 11,821 100.0 Accrued interest - - 86 Total – Special Development Fund (Other) $- $- $21,589 Total Special Development Fund $72,319 $207,260 $614,828
1/There were no overdue installments of principal (2019- nil).

198
CARIBBEAN DEVELOPMENT BANK ANNUAL REPORT 2020
194 195
CARIBBEAN DEVELOPMENT BANK ANNUAL REPORT 2020 CARIBBEAN DEVELOPMENT BANK ANNUAL REPORT 2020
CCAARRIIBBBBEEAANN DDEEVVEELLOOPPMMEENNTT BBAANNKK SSPPEECCIIAALL FFUUNNDDSS RREESSOOUURRCCEESS –– SSPPEECCIIAALL DDEEVVEELLOOPPMMEENNTT FFUUNNDD SSUUMMMMAARRYY SSTTAATTEEMMEENNTT OOFF LLOOAANNSS…continued AAss ooff DDeecceemmbbeerr 3311,, 22002200
(expressed in thousands of United States dollars, unless otherwise stated)
- 15 -
SCHEDULE 2
2019
Analysis by Contributor
Loans approved
but not yet effective Undisbursed
Out-standing1/
% of total loans
outstanding Special Development Fund (Unified) Members/Contributors $12,175 $198,293 $534,455 100.0 Accrued interest - - 2,989 Total - Special Development Fund (Unified) $12,175 $198,293 $537,444 Special Development Fund (Other) Members Germany $- $- $90 0.4 Mexico - - 1,207 5.3 Venezuela - - 9,557 42.2
-
-
10,854
Other contributors Sweden - - 23 0.1 United States of America - - 11,800 52.0 Sub-total – SDF (Other) - - 22,677 100.0 Accrued interest - - 92 Total – Special Development Fund (Other) - - $22,769 Total Special Development Fund $12,175 $198,293 $560,213
1/There were no overdue installments of principal.
CCAARRIIBBBBEEAANN DDEEVVEELLOOPPMMEENNTT BBAANNKK SSPPEECCIIAALL FFUUNNDDSS RREESSOOUURRCCEESS –– SSPPEECCIIAALL DDEEVVEELLOOPPMMEENNTT FFUUNNDD SSUUMMMMAARRYY SSTTAATTEEMMEENNTT OOFF LLOOAANNSS…continued AAss ooff DDeecceemmbbeerr 3311,, 22002200
(expressed in thousands of United States dollars, unless otherwise stated)
- 16 -
SCHEDULE 2
1/Relates to amounts disbursed and outstanding.
2020 Currencies Receivable
Loans
outstanding 2019
Net interest earned
Disburse-ments
Repay-ments
Loans
outstanding 2020
(a) Special Development Fund
(Unified) United States dollars $534,455 $- $87,287 $(31,559) $590,183 Accrued interest 2,989 67 - - 3,056 Total – December 31 $537,444 $67 $87,287 $(31,559) $593,239
(b) Special Development Fund (Other) United States dollars $22,676 $- $- $(1,173) $21,503 Accrued interest1 93 - (7) - 86 Total – December 31 $22,769 $- $(7) $(1,173) $21,589
January 1, 2020 to December 31, 2020 $38,481 January 1, 2021 to December 31, 2021 35,712 January 1, 2022 to December 31, 2022 36,905 January 1, 2023 to December 31, 2023 37,189 January 1, 2024 to December 31, 2024 37,389 January 1, 2025 to December 31, 2029 184,741 January 1, 2030 to December 31, 2034 130,426 January 1, 2035 to December 31, 2039 83,843 January 1, 2040 to December 31, 2044 29,830 January 1, 2045 to December 31, 2047 312
Total – December 31 $614,828

199
CARIBBEAN DEVELOPMENT BANK ANNUAL REPORT 2020
194 195
CARIBBEAN DEVELOPMENT BANK ANNUAL REPORT 2020 CARIBBEAN DEVELOPMENT BANK ANNUAL REPORT 2020
CCAARRIIBBBBEEAANN DDEEVVEELLOOPPMMEENNTT BBAANNKK SSPPEECCIIAALL FFUUNNDDSS RREESSOOUURRCCEESS –– SSPPEECCIIAALL DDEEVVEELLOOPPMMEENNTT FFUUNNDD SSUUMMMMAARRYY SSTTAATTEEMMEENNTT OOFF LLOOAANNSS…continued AAss ooff DDeecceemmbbeerr 3311,, 22002200
(expressed in thousands of United States dollars, unless otherwise stated)
- 15 -
SCHEDULE 2
2019
Analysis by Contributor
Loans approved
but not yet effective Undisbursed
Out-standing1/
% of total loans
outstanding Special Development Fund (Unified) Members/Contributors $12,175 $198,293 $534,455 100.0 Accrued interest - - 2,989 Total - Special Development Fund (Unified) $12,175 $198,293 $537,444 Special Development Fund (Other) Members Germany $- $- $90 0.4 Mexico - - 1,207 5.3 Venezuela - - 9,557 42.2
-
-
10,854
Other contributors Sweden - - 23 0.1 United States of America - - 11,800 52.0 Sub-total – SDF (Other) - - 22,677 100.0 Accrued interest - - 92 Total – Special Development Fund (Other) - - $22,769 Total Special Development Fund $12,175 $198,293 $560,213
1/There were no overdue installments of principal.
CCAARRIIBBBBEEAANN DDEEVVEELLOOPPMMEENNTT BBAANNKK SSPPEECCIIAALL FFUUNNDDSS RREESSOOUURRCCEESS –– SSPPEECCIIAALL DDEEVVEELLOOPPMMEENNTT FFUUNNDD SSUUMMMMAARRYY SSTTAATTEEMMEENNTT OOFF LLOOAANNSS…continued AAss ooff DDeecceemmbbeerr 3311,, 22002200
(expressed in thousands of United States dollars, unless otherwise stated)
- 16 -
SCHEDULE 2
1/Relates to amounts disbursed and outstanding.
2020 Currencies Receivable
Loans
outstanding 2019
Net interest earned
Disburse-ments
Repay-ments
Loans
outstanding 2020
(a) Special Development Fund
(Unified) United States dollars $534,455 $- $87,287 $(31,559) $590,183 Accrued interest 2,989 67 - - 3,056 Total – December 31 $537,444 $67 $87,287 $(31,559) $593,239
(b) Special Development Fund (Other) United States dollars $22,676 $- $- $(1,173) $21,503 Accrued interest1 93 - (7) - 86 Total – December 31 $22,769 $- $(7) $(1,173) $21,589
January 1, 2020 to December 31, 2020 $38,481 January 1, 2021 to December 31, 2021 35,712 January 1, 2022 to December 31, 2022 36,905 January 1, 2023 to December 31, 2023 37,189 January 1, 2024 to December 31, 2024 37,389 January 1, 2025 to December 31, 2029 184,741 January 1, 2030 to December 31, 2034 130,426 January 1, 2035 to December 31, 2039 83,843 January 1, 2040 to December 31, 2044 29,830 January 1, 2045 to December 31, 2047 312
Total – December 31 $614,828

200
CARIBBEAN DEVELOPMENT BANK ANNUAL REPORT 2020
196 197
CARIBBEAN DEVELOPMENT BANK ANNUAL REPORT 2020 CARIBBEAN DEVELOPMENT BANK ANNUAL REPORT 2020
CCAARRIIBBBBEEAANN DDEEVVEELLOOPPMMEENNTT BBAANNKK SSPPEECCIIAALL FFUUNNDDSS RREESSOOUURRCCEESS –– SSPPEECCIIAALL DDEEVVEELLOOPPMMEENNTT FFUUNNDD SSUUMMMMAARRYY SSTTAATTEEMMEENNTT OOFF LLOOAANNSS…continued AAss ooff DDeecceemmbbeerr 3311,, 22002200
(expressed in thousands of United States dollars, unless otherwise stated)
- 17 -
SCHEDULE 2
1/Relates to amounts disbursed and outstanding.
2019 Currencies Receivable
Loans
outstanding 2018
Net interest earned
Disburse-ments
Repay-ments
Loans
outstanding 2019
(a) Special Development Fund
(Unified) United States dollars $532,209 $- $32,234 $(29,988) $534,455 Accrued interest 2,996 (7) - - 2,989 Total – December 31 $535,205 $(7) $32,234 $(29,988) $537,444
(b) Special Development Fund (Other) United States dollars $23,850 $- $- $(1,174) $22,676 Accrued interest1 98 (5) - - 93 Total – December 31 $23,948 $(5) $- $(1,174) $22,769
January 1, 2020 to December 31, 2020 $35,707 January 1, 2021 to December 31, 2021 34,460 January 1, 2022 to December 31, 2022 34,699 January 1, 2023 to December 31, 2023 35,583 January 1, 2024 to December 31, 2024 35,661 January 1, 2025 to December 31, 2029 167,603 January 1, 2030 to December 31, 2034 123,127 January 1, 2035 to December 31, 2039 70,474 January 1, 2040 to December 31, 2044 22,148 January 1, 2045 to December 31, 2047 751
Total – December 31 $560,213
CCAARRIIBBBBEEAANN DDEEVVEELLOOPPMMEENNTT BBAANNKK SSPPEECCIIAALL FFUUNNDDSS RREESSOOUURRCCEESS –– SSPPEECCIIAALL DDEEVVEELLOOPPMMEENNTT FFUUNNDD
SSTTAATTEEMMEENNTT OOFF CCOONNTTRRIIBBUUTTEEDD RREESSOOUURRCCEESS
AAss ooff DDeecceemmbbeerr 3311,, 22002200
(expressed in thousands of United States dollars, unless otherwise stated)
- 18 -
SCHEDULE 3
2020
Contributors
Total approved1/
Approved but not yet effective2/
Total contribution
agreed
Amounts made
available
Receivable from members
non-negotiable
demand notes Special Development Fund (Unified) Members
Trinidad and Tobago $57,014 $- $57,014 $54,798 $7,784 Bahamas 31,855 - 31,855 31,855 14,908 Barbados 31,851 6,170 25,681 25,681 2,833 Brazil 5,000 - 5,000 5,000 - Jamaica 54,834 - 54,834 54,834 16,223 Guyana 31,856 - 31,856 31,856 1,654 Antigua and Barbuda 3,553 664 2,889 2,889 777 Belize 8,088 - 8,088 8,088 3,788 Dominica 7,828 - 7,828 7,828 2,065 St. Kitts and Nevis 8,088 2,954 5,134 5,134 2,494 St. Lucia 8,088 - 8,088 8,088 1,819 St. Vincent and the Grenadines 8,101 - 8,101 8,101 1,441 Grenada 5,490 - 5,490 5,490 2,967 Montserrat 3,341 - 3,341 3,341 - British Virgin Islands 3,341 - 3,341 3,341 - Turks and Caicos Islands 3,341 - 3,341 3,341 - Cayman Islands 3,241 1,901 1,340 1,340 - Anguilla 3,341 1,296 2,045 2,045 571 Colombia 34,157 - 34,157 34,157 - Venezuela 29,006 7,024 21,982 21,982 - Canada 375,867 - 375,867 375,867 - United Kingdom 283,185 - 283,185 283,185 6,140 Germany 110,474 - 110,474 110,474 - Italy 68,905 - 68,905 68,905 - China 54,321 - 54,321 54,321 - Haiti 3,497 1,937 1,560 1,560 - Suriname 8,330 - 8,330 8,330 2,758 Mexico 24,024 7,024 17,000 17,000 - $1,270,017 $28,970 $1,241,047 $1,238,831 $68,222 Other contributors France 58,254 - 58,254 58,254 - Chile 10 - 10 10 - Netherlands 24,902 - 24,902 24,902 - 1,353,183 28,970 1,324,213 1,321,997 68,222 Technical assistance allocation (574,600) - (574,600) (574,600) - $778,583 $28,970 $749,613 $747,397 $68,222
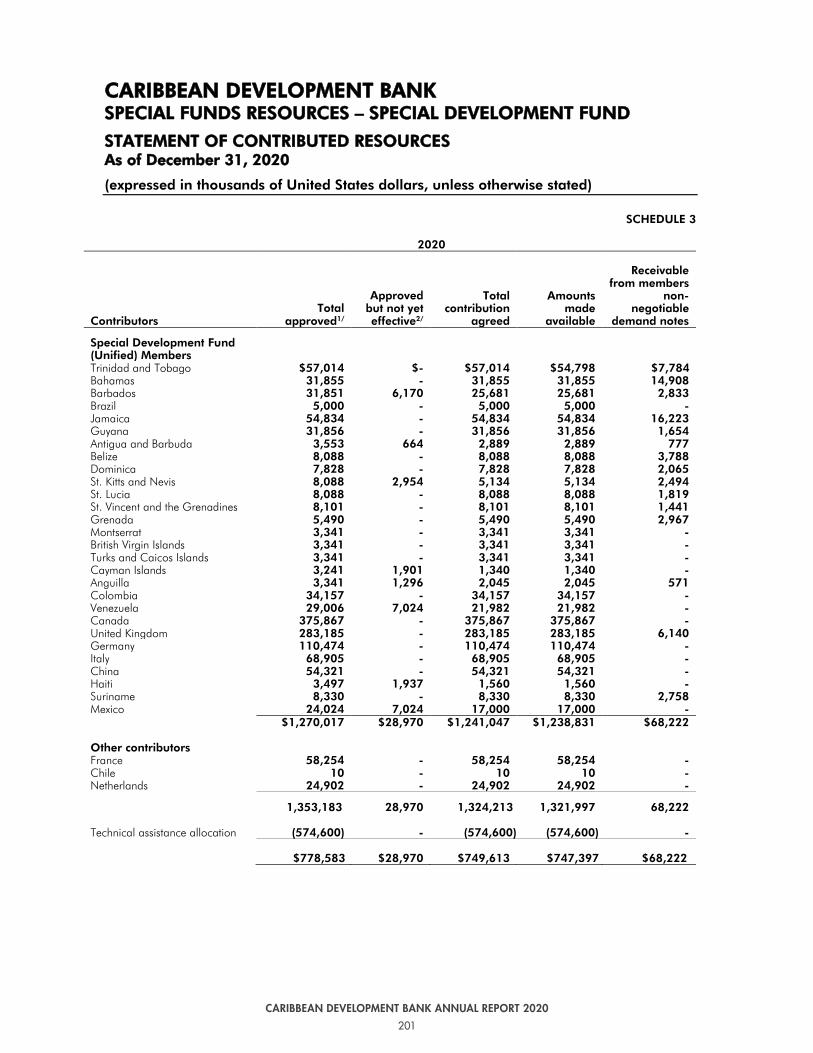
201
CARIBBEAN DEVELOPMENT BANK ANNUAL REPORT 2020
196 197
CARIBBEAN DEVELOPMENT BANK ANNUAL REPORT 2020 CARIBBEAN DEVELOPMENT BANK ANNUAL REPORT 2020
CCAARRIIBBBBEEAANN DDEEVVEELLOOPPMMEENNTT BBAANNKK SSPPEECCIIAALL FFUUNNDDSS RREESSOOUURRCCEESS –– SSPPEECCIIAALL DDEEVVEELLOOPPMMEENNTT FFUUNNDD SSUUMMMMAARRYY SSTTAATTEEMMEENNTT OOFF LLOOAANNSS…continued AAss ooff DDeecceemmbbeerr 3311,, 22002200
(expressed in thousands of United States dollars, unless otherwise stated)
- 17 -
SCHEDULE 2
1/Relates to amounts disbursed and outstanding.
2019 Currencies Receivable
Loans
outstanding 2018
Net interest earned
Disburse-ments
Repay-ments
Loans
outstanding 2019
(a) Special Development Fund
(Unified) United States dollars $532,209 $- $32,234 $(29,988) $534,455 Accrued interest 2,996 (7) - - 2,989 Total – December 31 $535,205 $(7) $32,234 $(29,988) $537,444
(b) Special Development Fund (Other) United States dollars $23,850 $- $- $(1,174) $22,676 Accrued interest1 98 (5) - - 93 Total – December 31 $23,948 $(5) $- $(1,174) $22,769
January 1, 2020 to December 31, 2020 $35,707 January 1, 2021 to December 31, 2021 34,460 January 1, 2022 to December 31, 2022 34,699 January 1, 2023 to December 31, 2023 35,583 January 1, 2024 to December 31, 2024 35,661 January 1, 2025 to December 31, 2029 167,603 January 1, 2030 to December 31, 2034 123,127 January 1, 2035 to December 31, 2039 70,474 January 1, 2040 to December 31, 2044 22,148 January 1, 2045 to December 31, 2047 751
Total – December 31 $560,213
CCAARRIIBBBBEEAANN DDEEVVEELLOOPPMMEENNTT BBAANNKK SSPPEECCIIAALL FFUUNNDDSS RREESSOOUURRCCEESS –– SSPPEECCIIAALL DDEEVVEELLOOPPMMEENNTT FFUUNNDD
SSTTAATTEEMMEENNTT OOFF CCOONNTTRRIIBBUUTTEEDD RREESSOOUURRCCEESS
AAss ooff DDeecceemmbbeerr 3311,, 22002200
(expressed in thousands of United States dollars, unless otherwise stated)
- 18 -
SCHEDULE 3
2020
Contributors
Total approved1/
Approved but not yet effective2/
Total contribution
agreed
Amounts made
available
Receivable from members
non-negotiable
demand notes Special Development Fund (Unified) Members
Trinidad and Tobago $57,014 $- $57,014 $54,798 $7,784 Bahamas 31,855 - 31,855 31,855 14,908 Barbados 31,851 6,170 25,681 25,681 2,833 Brazil 5,000 - 5,000 5,000 - Jamaica 54,834 - 54,834 54,834 16,223 Guyana 31,856 - 31,856 31,856 1,654 Antigua and Barbuda 3,553 664 2,889 2,889 777 Belize 8,088 - 8,088 8,088 3,788 Dominica 7,828 - 7,828 7,828 2,065 St. Kitts and Nevis 8,088 2,954 5,134 5,134 2,494 St. Lucia 8,088 - 8,088 8,088 1,819 St. Vincent and the Grenadines 8,101 - 8,101 8,101 1,441 Grenada 5,490 - 5,490 5,490 2,967 Montserrat 3,341 - 3,341 3,341 - British Virgin Islands 3,341 - 3,341 3,341 - Turks and Caicos Islands 3,341 - 3,341 3,341 - Cayman Islands 3,241 1,901 1,340 1,340 - Anguilla 3,341 1,296 2,045 2,045 571 Colombia 34,157 - 34,157 34,157 - Venezuela 29,006 7,024 21,982 21,982 - Canada 375,867 - 375,867 375,867 - United Kingdom 283,185 - 283,185 283,185 6,140 Germany 110,474 - 110,474 110,474 - Italy 68,905 - 68,905 68,905 - China 54,321 - 54,321 54,321 - Haiti 3,497 1,937 1,560 1,560 - Suriname 8,330 - 8,330 8,330 2,758 Mexico 24,024 7,024 17,000 17,000 - $1,270,017 $28,970 $1,241,047 $1,238,831 $68,222 Other contributors France 58,254 - 58,254 58,254 - Chile 10 - 10 10 - Netherlands 24,902 - 24,902 24,902 - 1,353,183 28,970 1,324,213 1,321,997 68,222 Technical assistance allocation (574,600) - (574,600) (574,600) - $778,583 $28,970 $749,613 $747,397 $68,222

202
CARIBBEAN DEVELOPMENT BANK ANNUAL REPORT 2020
198 199
CARIBBEAN DEVELOPMENT BANK ANNUAL REPORT 2020 CARIBBEAN DEVELOPMENT BANK ANNUAL REPORT 2020
CCAARRIIBBBBEEAANN DDEEVVEELLOOPPMMEENNTT BBAANNKK SSPPEECCIIAALL FFUUNNDDSS RREESSOOUURRCCEESS –– SSPPEECCIIAALL DDEEVVEELLOOPPMMEENNTT FFUUNNDD
SSTTAATTEEMMEENNTT OOFF CCOONNTTRRIIBBUUTTEEDD RREESSOOUURRCCEESS…continued AAss ooff DDeecceemmbbeerr 3311,, 22002200
(expressed in thousands of United States dollars, unless otherwise stated)
- 19 -
SCHEDULE 3
2020
Contributors
Total approved 1/
Approved but not yet effective 2/
Total
contribution agreed
Amounts
made available 3/
Receivable from
members non-
negotiable demand
notes Sub-total brought forward – SDF –Unified
$778,583
$28,970
$749,613
$747,397
$68,222
Special Development Fund – Other
Members Colombia 5,000 - 5,000 5,000 - Mexico 13,067 - 13,067 13,067 - Venezuela 17,473 - 17,473 17,473 - 35,540 - 35,540 35,540 - Other contributors Sweden 3,183 - 3,183 3,183 - 3,183 - 3,183 3,183 - Technical Assistance Allocation
(10,000)
-
(10,000)
(10,000)
-
Sub-total – SDF - Other 28,723 - 28,723 28,723 -
Total SDF $807,306 $28,970 $778,336 $776,120 $68,222 Summary Members $702,957 $28,970 $691,987 $689,771 $68,222 Other contributors 86,349 - 86,349 86,349 - Total SDF $807,306 $28,970 $778,336 $776,120 $68,222
1/Net of repayments
2/Contributions not yet firmly pledged by Governments
3/ There were no amounts not yet made available
CCAARRIIBBBBEEAANN DDEEVVEELLOOPPMMEENNTT BBAANNKK SSPPEECCIIAALL FFUUNNDDSS RREESSOOUURRCCEESS –– SSPPEECCIIAALL DDEEVVEELLOOPPMMEENNTT FFUUNNDD
SSTTAATTEEMMEENNTT OOFF CCOONNTTRRIIBBUUTTEEDD RREESSOOUURRCCEESS…continued AAss ooff DDeecceemmbbeerr 3311,, 22002200
(expressed in thousands of United States dollars, unless otherwise stated)
- 20 -
SCHEDULE 3
2019
Contributors
Total approved
1/
Approved but not
yet effective
2/
Total contribution
agreed
Amounts made
available3/
Receivable from
members non-
negotiable demand
notes Special Development Fund (Unified) Members
Trinidad and Tobago $57,014 $- $57,014 $52,582 $7,784 Bahamas 31,855 - 31,855 30,312 14,908 Barbados 31,851 6,170 25,681 25,681 2,833 Brazil 5,000 - 5,000 5,000 - Jamaica 54,834 - 54,834 52,064 16,055 Guyana 31,856 - 31,856 30,313 2,889 Antigua and Barbuda 3,553 664 2,889 2,889 777 Belize 8,088 - 8,088 7,710 3,380 Dominica 7,828 - 7,828 7,450 2,064 St. Kitts and Nevis 8,088 2,954 5,134 5,134 2,494 St. Lucia 8,088 - 8,088 7,710 2,168 St. Vincent and the Grenadines 8,101 - 8,101 7,723 2,487 Grenada 5,490 - 5,490 5,112 3,269 Montserrat 3,341 - 3,341 3,175 - British Virgin Islands 3,341 - 3,341 3,175 - Turks and Caicos Islands 3,341 - 3,341 3,175 - Cayman Islands 3,241 1,901 1,340 1,340 - Anguilla 3,341 1,296 2,045 2,045 571 Colombia 34,157 - 34,157 33,282 - Venezuela 29,006 7,024 21,982 21,982 - Canada 374,703 - 374,703 362,784 - United Kingdom 280,368 - 280,368 278,371 5,939 Germany 109,903 - 109,903 106,733 1,151 Italy 68,647 - 68,647 68,023 - China 54,573 - 54,573 52,856 - Haiti 3,497 1,937 1,560 1,560 - Suriname 8,330 - 8,330 7,192 2,757 Mexico 24,024 7,024 17,000 17,000 - $1,265,459 $28,970 $1,236,489 $1,202,373 $71,526 Other contributors France 58,254 - 58,254 58,254 - Chile 10 - 10 10 - Netherlands 24,902 - 24,902 24,902 - 1,348,625 28,970 1,319,655 1,285,539 71,526 Technical assistance allocation (544,850) - (544,850) (544,850) - $803,775 $28,970 $774,805 $740,689 $71,526

203
CARIBBEAN DEVELOPMENT BANK ANNUAL REPORT 2020
198 199
CARIBBEAN DEVELOPMENT BANK ANNUAL REPORT 2020 CARIBBEAN DEVELOPMENT BANK ANNUAL REPORT 2020
CCAARRIIBBBBEEAANN DDEEVVEELLOOPPMMEENNTT BBAANNKK SSPPEECCIIAALL FFUUNNDDSS RREESSOOUURRCCEESS –– SSPPEECCIIAALL DDEEVVEELLOOPPMMEENNTT FFUUNNDD
SSTTAATTEEMMEENNTT OOFF CCOONNTTRRIIBBUUTTEEDD RREESSOOUURRCCEESS…continued AAss ooff DDeecceemmbbeerr 3311,, 22002200
(expressed in thousands of United States dollars, unless otherwise stated)
- 19 -
SCHEDULE 3
2020
Contributors
Total approved 1/
Approved but not yet effective 2/
Total
contribution agreed
Amounts
made available 3/
Receivable from
members non-
negotiable demand
notes Sub-total brought forward – SDF –Unified
$778,583
$28,970
$749,613
$747,397
$68,222
Special Development Fund – Other
Members Colombia 5,000 - 5,000 5,000 - Mexico 13,067 - 13,067 13,067 - Venezuela 17,473 - 17,473 17,473 - 35,540 - 35,540 35,540 - Other contributors Sweden 3,183 - 3,183 3,183 - 3,183 - 3,183 3,183 - Technical Assistance Allocation
(10,000)
-
(10,000)
(10,000)
-
Sub-total – SDF - Other 28,723 - 28,723 28,723 -
Total SDF $807,306 $28,970 $778,336 $776,120 $68,222 Summary Members $702,957 $28,970 $691,987 $689,771 $68,222 Other contributors 86,349 - 86,349 86,349 - Total SDF $807,306 $28,970 $778,336 $776,120 $68,222
1/Net of repayments
2/Contributions not yet firmly pledged by Governments
3/ There were no amounts not yet made available
CCAARRIIBBBBEEAANN DDEEVVEELLOOPPMMEENNTT BBAANNKK SSPPEECCIIAALL FFUUNNDDSS RREESSOOUURRCCEESS –– SSPPEECCIIAALL DDEEVVEELLOOPPMMEENNTT FFUUNNDD
SSTTAATTEEMMEENNTT OOFF CCOONNTTRRIIBBUUTTEEDD RREESSOOUURRCCEESS…continued AAss ooff DDeecceemmbbeerr 3311,, 22002200
(expressed in thousands of United States dollars, unless otherwise stated)
- 20 -
SCHEDULE 3
2019
Contributors
Total approved
1/
Approved but not
yet effective
2/
Total contribution
agreed
Amounts made
available3/
Receivable from
members non-
negotiable demand
notes Special Development Fund (Unified) Members
Trinidad and Tobago $57,014 $- $57,014 $52,582 $7,784 Bahamas 31,855 - 31,855 30,312 14,908 Barbados 31,851 6,170 25,681 25,681 2,833 Brazil 5,000 - 5,000 5,000 - Jamaica 54,834 - 54,834 52,064 16,055 Guyana 31,856 - 31,856 30,313 2,889 Antigua and Barbuda 3,553 664 2,889 2,889 777 Belize 8,088 - 8,088 7,710 3,380 Dominica 7,828 - 7,828 7,450 2,064 St. Kitts and Nevis 8,088 2,954 5,134 5,134 2,494 St. Lucia 8,088 - 8,088 7,710 2,168 St. Vincent and the Grenadines 8,101 - 8,101 7,723 2,487 Grenada 5,490 - 5,490 5,112 3,269 Montserrat 3,341 - 3,341 3,175 - British Virgin Islands 3,341 - 3,341 3,175 - Turks and Caicos Islands 3,341 - 3,341 3,175 - Cayman Islands 3,241 1,901 1,340 1,340 - Anguilla 3,341 1,296 2,045 2,045 571 Colombia 34,157 - 34,157 33,282 - Venezuela 29,006 7,024 21,982 21,982 - Canada 374,703 - 374,703 362,784 - United Kingdom 280,368 - 280,368 278,371 5,939 Germany 109,903 - 109,903 106,733 1,151 Italy 68,647 - 68,647 68,023 - China 54,573 - 54,573 52,856 - Haiti 3,497 1,937 1,560 1,560 - Suriname 8,330 - 8,330 7,192 2,757 Mexico 24,024 7,024 17,000 17,000 - $1,265,459 $28,970 $1,236,489 $1,202,373 $71,526 Other contributors France 58,254 - 58,254 58,254 - Chile 10 - 10 10 - Netherlands 24,902 - 24,902 24,902 - 1,348,625 28,970 1,319,655 1,285,539 71,526 Technical assistance allocation (544,850) - (544,850) (544,850) - $803,775 $28,970 $774,805 $740,689 $71,526

204
CARIBBEAN DEVELOPMENT BANK ANNUAL REPORT 2020
200 201
CARIBBEAN DEVELOPMENT BANK ANNUAL REPORT 2020 CARIBBEAN DEVELOPMENT BANK ANNUAL REPORT 2020
CCAARRIIBBBBEEAANN DDEEVVEELLOOPPMMEENNTT BBAANNKK SSPPEECCIIAALL FFUUNNDDSS RREESSOOUURRCCEESS –– SSPPEECCIIAALL DDEEVVEELLOOPPMMEENNTT FFUUNNDD
SSTTAATTEEMMEENNTT OOFF CCOONNTTRRIIBBUUTTEEDD RREESSOOUURRCCEESS…continued AAss ooff DDeecceemmbbeerr 3311,, 22002200
(expressed in thousands of United States dollars, unless otherwise stated)
- 21 -
SCHEDULE 3
2019
Contributors
Total approved 1/
Approved but not yet effective 2/
Total
contribution agreed
Amounts
made available 3/
Receivable from
members non-
negotiable demand
notes Sub-total brought forward – SDF –Unified
$803,775
$28,970
$774805
$740,689
$71,526
Special Development Fund – Other
Members Colombia 5,000 - 5,000 5,000 - Mexico 13,067 - 13,067 13,067 - Venezuela 17,473 - 17,473 17,473 - 35,540 - 35,540 35,540 - Other contributors Sweden 2,795 - 2,795 2,795 - 2,795 - 2,795 2,795 - Technical Assistance Allocation
(10,000)
-
(10,000)
(10,000)
- Sub-total – SDF - Other 28,335 - 28,335 28,335 -
Total SDF $832,110 $28,970 $803,140 $769,024 $71,526 Summary Members $746,149 $28,970 $717,179 $683,063 $71,526 Other contributors 85,961 - 85,961 85,961 - Total SDF $832,110 $28,970 $803,140 $769,024 $71,526 1/Net of repayments
2/Contributions not yet firmly pledged by Governments
3/ There were no amounts not yet made available
CCAARRIIBBBBEEAANN DDEEVVEELLOOPPMMEENNTT BBAANNKK SSPPEECCIIAALL FFUUNNDDSS RREESSOOUURRCCEESS –– SSPPEECCIIAALL DDEEVVEELLOOPPMMEENNTT FFUUNNDD
SSTTAATTEEMMEENNTT OOFF CCOONNTTRRIIBBUUTTEEDD RREESSOOUURRCCEESS…continued AAss ooff DDeecceemmbbeerr 3311,, 22002200
(expressed in thousands of United States dollars, unless otherwise stated)
- 22 -
SCHEDULE 3
2020
Currencies
Amounts made
available 2019
Translation adjustment
Drawdowns/ appropriations
from capital1/
Repayments
Amounts made
available 2020
(a) Special
Development Fund (Unified)
Euros $1,895 $176 $(444) $- $1,627 Pounds sterling 29,695 1,005 (24,560) - 6,140 United States dollar 709,099 - 30,531 - 739,630 $740,689 $1,181 $5,527 $- $747,397
(b) Special
Development Fund (Other)
Swedish kroners $2,795 $388 $- $- $3,183 United States dollars 25,540 - - - 25,540 $28,335 $388 $- $- $28,723
1/Net of conversations to United States dollars in accordance with the funding Rules of the Unified Special Development Fund.
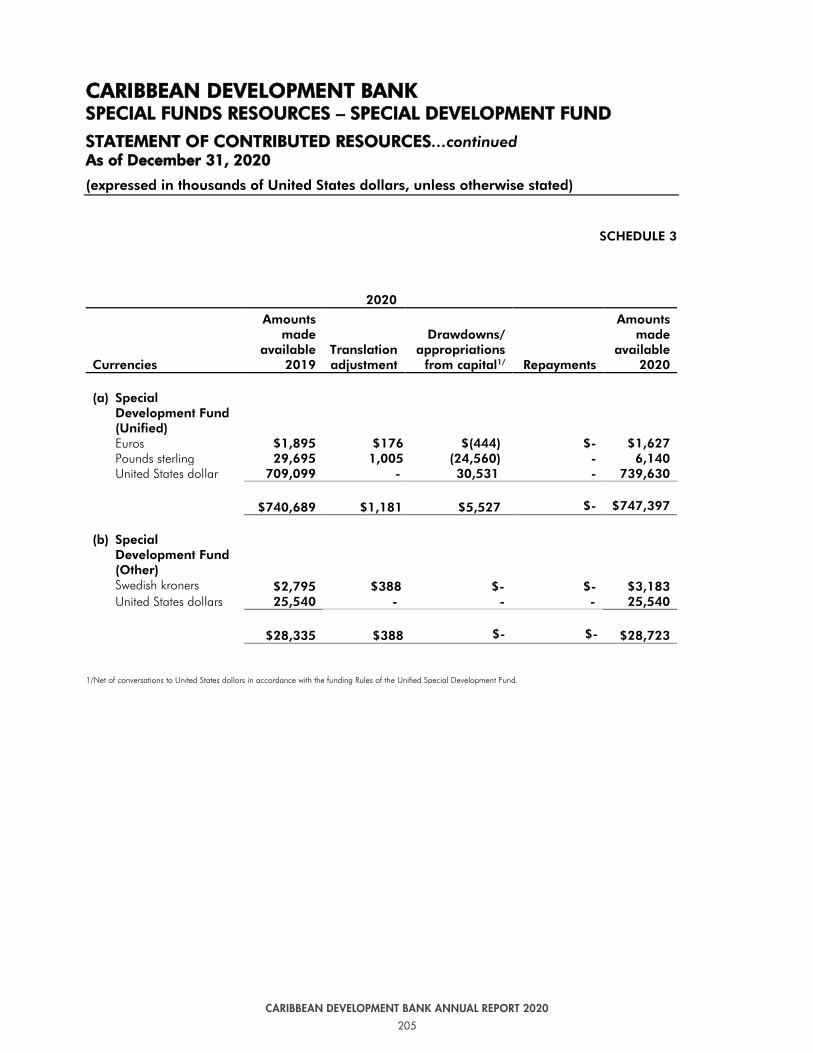
205
CARIBBEAN DEVELOPMENT BANK ANNUAL REPORT 2020
200 201
CARIBBEAN DEVELOPMENT BANK ANNUAL REPORT 2020 CARIBBEAN DEVELOPMENT BANK ANNUAL REPORT 2020
CCAARRIIBBBBEEAANN DDEEVVEELLOOPPMMEENNTT BBAANNKK SSPPEECCIIAALL FFUUNNDDSS RREESSOOUURRCCEESS –– SSPPEECCIIAALL DDEEVVEELLOOPPMMEENNTT FFUUNNDD
SSTTAATTEEMMEENNTT OOFF CCOONNTTRRIIBBUUTTEEDD RREESSOOUURRCCEESS…continued AAss ooff DDeecceemmbbeerr 3311,, 22002200
(expressed in thousands of United States dollars, unless otherwise stated)
- 21 -
SCHEDULE 3
2019
Contributors
Total approved 1/
Approved but not yet effective 2/
Total
contribution agreed
Amounts
made available 3/
Receivable from
members non-
negotiable demand
notes Sub-total brought forward – SDF –Unified
$803,775
$28,970
$774805
$740,689
$71,526
Special Development Fund – Other
Members Colombia 5,000 - 5,000 5,000 - Mexico 13,067 - 13,067 13,067 - Venezuela 17,473 - 17,473 17,473 - 35,540 - 35,540 35,540 - Other contributors Sweden 2,795 - 2,795 2,795 - 2,795 - 2,795 2,795 - Technical Assistance Allocation
(10,000)
-
(10,000)
(10,000)
- Sub-total – SDF - Other 28,335 - 28,335 28,335 -
Total SDF $832,110 $28,970 $803,140 $769,024 $71,526 Summary Members $746,149 $28,970 $717,179 $683,063 $71,526 Other contributors 85,961 - 85,961 85,961 - Total SDF $832,110 $28,970 $803,140 $769,024 $71,526 1/Net of repayments
2/Contributions not yet firmly pledged by Governments
3/ There were no amounts not yet made available
CCAARRIIBBBBEEAANN DDEEVVEELLOOPPMMEENNTT BBAANNKK SSPPEECCIIAALL FFUUNNDDSS RREESSOOUURRCCEESS –– SSPPEECCIIAALL DDEEVVEELLOOPPMMEENNTT FFUUNNDD
SSTTAATTEEMMEENNTT OOFF CCOONNTTRRIIBBUUTTEEDD RREESSOOUURRCCEESS…continued AAss ooff DDeecceemmbbeerr 3311,, 22002200
(expressed in thousands of United States dollars, unless otherwise stated)
- 22 -
SCHEDULE 3
2020
Currencies
Amounts made
available 2019
Translation adjustment
Drawdowns/ appropriations
from capital1/
Repayments
Amounts made
available 2020
(a) Special
Development Fund (Unified)
Euros $1,895 $176 $(444) $- $1,627 Pounds sterling 29,695 1,005 (24,560) - 6,140 United States dollar 709,099 - 30,531 - 739,630 $740,689 $1,181 $5,527 $- $747,397
(b) Special
Development Fund (Other)
Swedish kroners $2,795 $388 $- $- $3,183 United States dollars 25,540 - - - 25,540 $28,335 $388 $- $- $28,723
1/Net of conversations to United States dollars in accordance with the funding Rules of the Unified Special Development Fund.
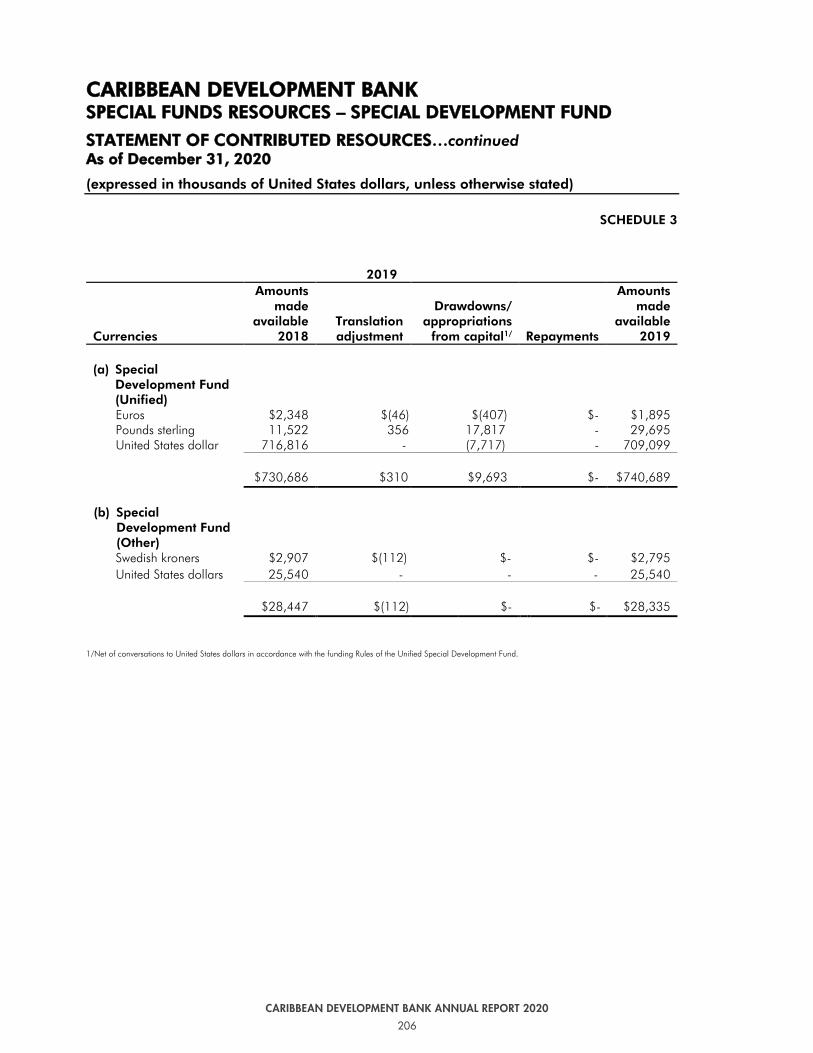
206
CARIBBEAN DEVELOPMENT BANK ANNUAL REPORT 2020
202 203
CARIBBEAN DEVELOPMENT BANK ANNUAL REPORT 2020 CARIBBEAN DEVELOPMENT BANK ANNUAL REPORT 2020
CCAARRIIBBBBEEAANN DDEEVVEELLOOPPMMEENNTT BBAANNKK SSPPEECCIIAALL FFUUNNDDSS RREESSOOUURRCCEESS –– SSPPEECCIIAALL DDEEVVEELLOOPPMMEENNTT FFUUNNDD
SSTTAATTEEMMEENNTT OOFF CCOONNTTRRIIBBUUTTEEDD RREESSOOUURRCCEESS…continued AAss ooff DDeecceemmbbeerr 3311,, 22002200
(expressed in thousands of United States dollars, unless otherwise stated)
- 23 -
SCHEDULE 3
2019 Currencies
Amounts made
available 2018
Translation adjustment
Drawdowns/ appropriations
from capital1/
Repayments
Amounts made
available 2019
(a) Special
Development Fund (Unified)
Euros $2,348 $(46) $(407) $- $1,895 Pounds sterling 11,522 356 17,817 - 29,695 United States dollar 716,816 - (7,717) - 709,099 $730,686 $310 $9,693 $- $740,689
(b) Special
Development Fund (Other)
Swedish kroners $2,907 $(112) $- $- $2,795 United States dollars 25,540 - - - 25,540 $28,447 $(112) $- $- $28,335
1/Net of conversations to United States dollars in accordance with the funding Rules of the Unified Special Development Fund.
CCAARRIIBBBBEEAANN DDEEVVEELLOOPPMMEENNTT BBAANNKK SSPPEECCIIAALL FFUUNNDDSS RREESSOOUURRCCEESS –– SSPPEECCIIAALL DDEEVVEELLOOPPMMEENNTT FFUUNNDD
SSTTAATTEEMMEENNTT OOFF AACCCCUUMMUULLAATTEEDD NNEETT IINNCCOOMMEE AAss ooff DDeecceemmbbeerr 3311,, 22002200
(expressed in thousands of United States dollars, unless otherwise stated)
- 24 -
SCHEDULE 4
2020 Contributors
Brought forward
2019
Net
income 2019
Appro-
priations
Carried forward
2020 Special Development Fund (Unified) $55,468 $8,534 $- $64,002 Special Development Fund (Other) Members Colombia 1,408 48 - 1,456 Germany (1,705) (176) - (1,881) Mexico 506 (74) - 432 Venezuela 7,566 (284) (3,203) 4,079 $7,775 $(486) $(3,203) $4,086 Other contributors Sweden $2,019 (412) $- $1,607 United States of America 11,448 (87) - 11,361 13,467 (499) - 12,968 Sub-total – SDF - Other 21,242 (985) - 17,054 Total Special Development Fund $76,710 $7,549 $- $81,056 Summary
Members $63,243 $8,048 $(3,203) $68,088 Other contributors 13,467 (499) - 12,968 Total Special Development Fund $76,710 $7,549 $(3,203) $81,056

207
CARIBBEAN DEVELOPMENT BANK ANNUAL REPORT 2020
202 203
CARIBBEAN DEVELOPMENT BANK ANNUAL REPORT 2020 CARIBBEAN DEVELOPMENT BANK ANNUAL REPORT 2020
CCAARRIIBBBBEEAANN DDEEVVEELLOOPPMMEENNTT BBAANNKK SSPPEECCIIAALL FFUUNNDDSS RREESSOOUURRCCEESS –– SSPPEECCIIAALL DDEEVVEELLOOPPMMEENNTT FFUUNNDD
SSTTAATTEEMMEENNTT OOFF CCOONNTTRRIIBBUUTTEEDD RREESSOOUURRCCEESS…continued AAss ooff DDeecceemmbbeerr 3311,, 22002200
(expressed in thousands of United States dollars, unless otherwise stated)
- 23 -
SCHEDULE 3
2019 Currencies
Amounts made
available 2018
Translation adjustment
Drawdowns/ appropriations
from capital1/
Repayments
Amounts made
available 2019
(a) Special
Development Fund (Unified)
Euros $2,348 $(46) $(407) $- $1,895 Pounds sterling 11,522 356 17,817 - 29,695 United States dollar 716,816 - (7,717) - 709,099 $730,686 $310 $9,693 $- $740,689
(b) Special
Development Fund (Other)
Swedish kroners $2,907 $(112) $- $- $2,795 United States dollars 25,540 - - - 25,540 $28,447 $(112) $- $- $28,335
1/Net of conversations to United States dollars in accordance with the funding Rules of the Unified Special Development Fund.
CCAARRIIBBBBEEAANN DDEEVVEELLOOPPMMEENNTT BBAANNKK SSPPEECCIIAALL FFUUNNDDSS RREESSOOUURRCCEESS –– SSPPEECCIIAALL DDEEVVEELLOOPPMMEENNTT FFUUNNDD
SSTTAATTEEMMEENNTT OOFF AACCCCUUMMUULLAATTEEDD NNEETT IINNCCOOMMEE AAss ooff DDeecceemmbbeerr 3311,, 22002200
(expressed in thousands of United States dollars, unless otherwise stated)
- 24 -
SCHEDULE 4
2020 Contributors
Brought forward
2019
Net
income 2019
Appro-
priations
Carried forward
2020 Special Development Fund (Unified) $55,468 $8,534 $- $64,002 Special Development Fund (Other) Members Colombia 1,408 48 - 1,456 Germany (1,705) (176) - (1,881) Mexico 506 (74) - 432 Venezuela 7,566 (284) (3,203) 4,079 $7,775 $(486) $(3,203) $4,086 Other contributors Sweden $2,019 (412) $- $1,607 United States of America 11,448 (87) - 11,361 13,467 (499) - 12,968 Sub-total – SDF - Other 21,242 (985) - 17,054 Total Special Development Fund $76,710 $7,549 $- $81,056 Summary
Members $63,243 $8,048 $(3,203) $68,088 Other contributors 13,467 (499) - 12,968 Total Special Development Fund $76,710 $7,549 $(3,203) $81,056

208
CARIBBEAN DEVELOPMENT BANK ANNUAL REPORT 2020
204 205
CARIBBEAN DEVELOPMENT BANK ANNUAL REPORT 2020 CARIBBEAN DEVELOPMENT BANK ANNUAL REPORT 2020
CCAARRIIBBBBEEAANN DDEEVVEELLOOPPMMEENNTT BBAANNKK SSPPEECCIIAALL FFUUNNDDSS RREESSOOUURRCCEESS –– SSPPEECCIIAALL DDEEVVEELLOOPPMMEENNTT FFUUNNDD
SSTTAATTEEMMEENNTT OOFF AACCCCUUMMUULLAATTEEDD NNEETT IINNCCOOMMEE…continued AAss ooff DDeecceemmbbeerr 3311,, 22002200
(expressed in thousands of United States dollars, unless otherwise stated)
- 25 -
SCHEDULE 4
2019 Contributors
Brought forward
2018
Net
income 2018
Appro-
Priations
Carried forward
2019 Special Development Fund (Unified) $46,942 $8,526 $- $55,468 Special Development Fund (Other) Members Colombia 1,249 159 - 1,408 Germany (1,603) (102) - (1,705) Mexico 406 100 - 506 Venezuela 7,625 (59) - 7,566 $7,677 $98 $- $7,775 Other contributors Sweden $1,974 $45 $- $2,019 United States of America 11,384 64 - 11,448 13,358 109 - 13,467 Sub-total – SDF - Other 21,035 207 - 21,242 Total Special Development Fund $67,977 $8,733 $- $76,710 Summary
Members $54,619 $8,624 $- $63,243 Other contributors 13,358 109 - 13,467 Total Special Development Fund $67,977 $8,733 $- $76,710
CCAARRIIBBBBEEAANN DDEEVVEELLOOPPMMEENNTT BBAANNKK SSPPEECCIIAALL FFUUNNDDSS RREESSOOUURRCCEESS –– SSPPEECCIIAALL DDEEVVEELLOOPPMMEENNTT FFUUNNDD
NNOOTTEESS TTOO TTHHEE FFIINNAANNCCIIAALL SSTTAATTEEMMEENNTTSS FFoorr tthhee yyeeaarr eennddeedd DDeecceemmbbeerr 3311,, 22002200
(expressed in thousands of United States dollars, unless otherwise stated)
- 26 -
1. NATURE OF OPERATIONS The Special Development Fund (SDF) was established to carry out the special operations of the Caribbean Development Bank (the Bank) by providing resources on concessional terms to assist borrowing members primarily for poverty reduction. Resources are provided by contributions from members and other contributors.
2. SUMMARY OF SIGNIFICANT ACCOUNTING POLICIES Due to the nature of the SDF, these financial statements have been prepared for the specific purpose of reflecting the sources and applications of member subscriptions and contributions and other development resources. These financial statements are not intended to be presented in accordance with International Financial Reporting Standards (IFRS) and have been prepared in accordance with the accounting policies outlined below. Preparation of these financial statements requires management to make estimates and assumptions that affect the reported amounts of assets and liabilities and disclosure of contingent assets and liabilities at the date of the financial statements and the reported amounts of revenue and expenses during the reported period. Actual results could differ from these estimates. Foreign currency translation Functional and presentation currency The functional and presentation currency of the Fund is the United States dollar (USD$) and the Fund’s financial statements are rounded to the nearest thousand. Monetary assets and liabilities in currencies other than United States dollars are translated at market rates of exchange prevailing at the reporting date. Non-monetary items measured at historical cost in currencies other than United States dollars are translated using the exchange rates at the dates of the initial transactions. Foreign currency transactions are initially translated into United States dollars at applicable rates of exchange on the transaction dates. Any gains or losses arising as a result of differences in rates applied to income and expenses and to assets and liabilities are shown as an exchange gain or loss in the statement of total comprehensive income for the year. Debt securities at fair value through profit or loss All debt securities are in a portfolio designated at fair value through the profit or loss and reported at fair market value. Securities are recognised on the statement of financial position when the Fund assumes related contractual rights and de-recognised when the rights to secure cash flows from the financial asset expire or when all risks and rewards of ownership have been substantially transferred.

209
CARIBBEAN DEVELOPMENT BANK ANNUAL REPORT 2020
204 205
CARIBBEAN DEVELOPMENT BANK ANNUAL REPORT 2020 CARIBBEAN DEVELOPMENT BANK ANNUAL REPORT 2020
CCAARRIIBBBBEEAANN DDEEVVEELLOOPPMMEENNTT BBAANNKK SSPPEECCIIAALL FFUUNNDDSS RREESSOOUURRCCEESS –– SSPPEECCIIAALL DDEEVVEELLOOPPMMEENNTT FFUUNNDD
SSTTAATTEEMMEENNTT OOFF AACCCCUUMMUULLAATTEEDD NNEETT IINNCCOOMMEE…continued AAss ooff DDeecceemmbbeerr 3311,, 22002200
(expressed in thousands of United States dollars, unless otherwise stated)
- 25 -
SCHEDULE 4
2019 Contributors
Brought forward
2018
Net
income 2018
Appro-
Priations
Carried forward
2019 Special Development Fund (Unified) $46,942 $8,526 $- $55,468 Special Development Fund (Other) Members Colombia 1,249 159 - 1,408 Germany (1,603) (102) - (1,705) Mexico 406 100 - 506 Venezuela 7,625 (59) - 7,566 $7,677 $98 $- $7,775 Other contributors Sweden $1,974 $45 $- $2,019 United States of America 11,384 64 - 11,448 13,358 109 - 13,467 Sub-total – SDF - Other 21,035 207 - 21,242 Total Special Development Fund $67,977 $8,733 $- $76,710 Summary
Members $54,619 $8,624 $- $63,243 Other contributors 13,358 109 - 13,467 Total Special Development Fund $67,977 $8,733 $- $76,710
CCAARRIIBBBBEEAANN DDEEVVEELLOOPPMMEENNTT BBAANNKK SSPPEECCIIAALL FFUUNNDDSS RREESSOOUURRCCEESS –– SSPPEECCIIAALL DDEEVVEELLOOPPMMEENNTT FFUUNNDD
NNOOTTEESS TTOO TTHHEE FFIINNAANNCCIIAALL SSTTAATTEEMMEENNTTSS FFoorr tthhee yyeeaarr eennddeedd DDeecceemmbbeerr 3311,, 22002200
(expressed in thousands of United States dollars, unless otherwise stated)
- 26 -
1. NATURE OF OPERATIONS The Special Development Fund (SDF) was established to carry out the special operations of the Caribbean Development Bank (the Bank) by providing resources on concessional terms to assist borrowing members primarily for poverty reduction. Resources are provided by contributions from members and other contributors.
2. SUMMARY OF SIGNIFICANT ACCOUNTING POLICIES Due to the nature of the SDF, these financial statements have been prepared for the specific purpose of reflecting the sources and applications of member subscriptions and contributions and other development resources. These financial statements are not intended to be presented in accordance with International Financial Reporting Standards (IFRS) and have been prepared in accordance with the accounting policies outlined below. Preparation of these financial statements requires management to make estimates and assumptions that affect the reported amounts of assets and liabilities and disclosure of contingent assets and liabilities at the date of the financial statements and the reported amounts of revenue and expenses during the reported period. Actual results could differ from these estimates. Foreign currency translation Functional and presentation currency The functional and presentation currency of the Fund is the United States dollar (USD$) and the Fund’s financial statements are rounded to the nearest thousand. Monetary assets and liabilities in currencies other than United States dollars are translated at market rates of exchange prevailing at the reporting date. Non-monetary items measured at historical cost in currencies other than United States dollars are translated using the exchange rates at the dates of the initial transactions. Foreign currency transactions are initially translated into United States dollars at applicable rates of exchange on the transaction dates. Any gains or losses arising as a result of differences in rates applied to income and expenses and to assets and liabilities are shown as an exchange gain or loss in the statement of total comprehensive income for the year. Debt securities at fair value through profit or loss All debt securities are in a portfolio designated at fair value through the profit or loss and reported at fair market value. Securities are recognised on the statement of financial position when the Fund assumes related contractual rights and de-recognised when the rights to secure cash flows from the financial asset expire or when all risks and rewards of ownership have been substantially transferred.
210
CARIBBEAN DEVELOPMENT BANK ANNUAL REPORT 2020
206 207
CARIBBEAN DEVELOPMENT BANK ANNUAL REPORT 2020 CARIBBEAN DEVELOPMENT BANK ANNUAL REPORT 2020
CCAARRIIBBBBEEAANN DDEEVVEELLOOPPMMEENNTT BBAANNKK SSPPEECCIIAALL FFUUNNDDSS RREESSOOUURRCCEESS –– SSPPEECCIIAALL DDEEVVEELLOOPPMMEENNTT FFUUNNDD
NNOOTTEESS TTOO TTHHEE FFIINNAANNCCIIAALL SSTTAATTEEMMEENNTTSS FFoorr tthhee yyeeaarr eennddeedd DDeecceemmbbeerr 3311,, 22002200
(expressed in thousands of United States dollars, unless otherwise stated)
- 27 -
2. SUMMARY OF SIGNIFICANT ACCOUNTING POLICIES…continued Debt securities at fair value through profit or loss…continued Regular way purchases and sales of financial assets are recognised on the settlement date which is the date the Fund becomes a party to the contractual provisions of the instrument. All securities are initially recognised at fair value, and transaction costs are expensed in the statement of comprehensive income and accumulated net income. Gains and losses arising from changes in the fair value of debt securities through profit or loss are included in the profit for the year in the statement of comprehensive income and accumulated net income in the period in which they arise. Interest income earned whilst holding securities is reported as “Interest and similar income - investments and cash balances” in the statement of comprehensive income and accumulated net income. Determination of fair value For securities traded in active markets, the determination of fair values is based on quoted market prices or dealer price quotations. A security is regarded as quoted in an active market if prices are readily and regularly available from an exchange, dealer, broker, industry group, pricing service or regulatory agency, and those prices represent actual and regularly occurring market transactions on an arm’s length basis. If the above criteria are not met, the market is regarded as being inactive. For securities in inactive markets, fair values are determined using valuation techniques. In these techniques, fair values are estimated from observable data in respect of similar financial instruments, using models to estimate the present value of expected future cash flows, or other valuation techniques, using inputs (for example, LIBOR yield curves, FX rates, volatilities and counterparty spreads) existing at the reporting date. The Fund uses widely recognised valuation models for determining fair values of non-standardised financial instruments. For these securities, inputs into models are generally market observable.
CCAARRIIBBBBEEAANN DDEEVVEELLOOPPMMEENNTT BBAANNKK SSPPEECCIIAALL FFUUNNDDSS RREESSOOUURRCCEESS –– SSPPEECCIIAALL DDEEVVEELLOOPPMMEENNTT FFUUNNDD
NNOOTTEESS TTOO TTHHEE FFIINNAANNCCIIAALL SSTTAATTEEMMEENNTTSS FFoorr tthhee yyeeaarr eennddeedd DDeecceemmbbeerr 3311,, 22002200
(expressed in thousands of United States dollars, unless otherwise stated)
- 28 -
2. SUMMARY OF SIGNIFICANT ACCOUNTING POLICIES…continued Loans Loans and receivables are non-derivative financial assets that have fixed or determinable payments that are not quoted in an active market. After initial measurement, loans and receivables are subsequently measured at amortised cost using the effective interest rate method net of impairments if any. All loans by the Fund are made either from currencies available from members’ subscriptions or from currencies borrowed and the principal amounts are repayable to the Fund in the currencies lent. The balances outstanding on loans to members and their agencies are secured by guarantees of the Governments of the member countries in which the loans are made. The Fund is one of very few lenders of development and structural adjustment loans to Caribbean countries. There is no secondary market for development loans nor does the Fund intend to sell these loans and as a result, the use of market data to arrive at the fair value of loans will not yield any meaningful results. The Fund does not make provisions for impairment on loans as any loss that may occur is taken in the statement of comprehensive income and accumulated net income for that year. Cash and cash equivalents For the purposes of the statement of cash flows, cash and cash equivalents comprise balances with maturities of three months or less from the date of acquisition.
Technical assistance and grants Technical assistance and grants for capital projects to borrowing member countries are provided either from grants received from contributors or from other resources specifically allocated for this purpose. The contributions from donors are included in the financial statements from the date of the contribution agreement. Technical assistance is recognised when the project is approved and becomes effective. Interest income and charges on contributions For instruments carried at amortised cost, interest income and expense are recognised in the statement of comprehensive income and accumulated net income using the effective interest rate method. Interest income and expense are recognised as earned for items classified as fair value through profit or loss. The effective interest rate is the rate that exactly discounts estimated future cash payments or receipts through the expected life of the financial instrument or, when appropriate, a shorter period to the net carrying amount of the financial asset or financial liability.

211
CARIBBEAN DEVELOPMENT BANK ANNUAL REPORT 2020
206 207
CARIBBEAN DEVELOPMENT BANK ANNUAL REPORT 2020 CARIBBEAN DEVELOPMENT BANK ANNUAL REPORT 2020
CCAARRIIBBBBEEAANN DDEEVVEELLOOPPMMEENNTT BBAANNKK SSPPEECCIIAALL FFUUNNDDSS RREESSOOUURRCCEESS –– SSPPEECCIIAALL DDEEVVEELLOOPPMMEENNTT FFUUNNDD
NNOOTTEESS TTOO TTHHEE FFIINNAANNCCIIAALL SSTTAATTEEMMEENNTTSS FFoorr tthhee yyeeaarr eennddeedd DDeecceemmbbeerr 3311,, 22002200
(expressed in thousands of United States dollars, unless otherwise stated)
- 27 -
2. SUMMARY OF SIGNIFICANT ACCOUNTING POLICIES…continued Debt securities at fair value through profit or loss…continued Regular way purchases and sales of financial assets are recognised on the settlement date which is the date the Fund becomes a party to the contractual provisions of the instrument. All securities are initially recognised at fair value, and transaction costs are expensed in the statement of comprehensive income and accumulated net income. Gains and losses arising from changes in the fair value of debt securities through profit or loss are included in the profit for the year in the statement of comprehensive income and accumulated net income in the period in which they arise. Interest income earned whilst holding securities is reported as “Interest and similar income - investments and cash balances” in the statement of comprehensive income and accumulated net income. Determination of fair value For securities traded in active markets, the determination of fair values is based on quoted market prices or dealer price quotations. A security is regarded as quoted in an active market if prices are readily and regularly available from an exchange, dealer, broker, industry group, pricing service or regulatory agency, and those prices represent actual and regularly occurring market transactions on an arm’s length basis. If the above criteria are not met, the market is regarded as being inactive. For securities in inactive markets, fair values are determined using valuation techniques. In these techniques, fair values are estimated from observable data in respect of similar financial instruments, using models to estimate the present value of expected future cash flows, or other valuation techniques, using inputs (for example, LIBOR yield curves, FX rates, volatilities and counterparty spreads) existing at the reporting date. The Fund uses widely recognised valuation models for determining fair values of non-standardised financial instruments. For these securities, inputs into models are generally market observable.
CCAARRIIBBBBEEAANN DDEEVVEELLOOPPMMEENNTT BBAANNKK SSPPEECCIIAALL FFUUNNDDSS RREESSOOUURRCCEESS –– SSPPEECCIIAALL DDEEVVEELLOOPPMMEENNTT FFUUNNDD
NNOOTTEESS TTOO TTHHEE FFIINNAANNCCIIAALL SSTTAATTEEMMEENNTTSS FFoorr tthhee yyeeaarr eennddeedd DDeecceemmbbeerr 3311,, 22002200
(expressed in thousands of United States dollars, unless otherwise stated)
- 28 -
2. SUMMARY OF SIGNIFICANT ACCOUNTING POLICIES…continued Loans Loans and receivables are non-derivative financial assets that have fixed or determinable payments that are not quoted in an active market. After initial measurement, loans and receivables are subsequently measured at amortised cost using the effective interest rate method net of impairments if any. All loans by the Fund are made either from currencies available from members’ subscriptions or from currencies borrowed and the principal amounts are repayable to the Fund in the currencies lent. The balances outstanding on loans to members and their agencies are secured by guarantees of the Governments of the member countries in which the loans are made. The Fund is one of very few lenders of development and structural adjustment loans to Caribbean countries. There is no secondary market for development loans nor does the Fund intend to sell these loans and as a result, the use of market data to arrive at the fair value of loans will not yield any meaningful results. The Fund does not make provisions for impairment on loans as any loss that may occur is taken in the statement of comprehensive income and accumulated net income for that year. Cash and cash equivalents For the purposes of the statement of cash flows, cash and cash equivalents comprise balances with maturities of three months or less from the date of acquisition.
Technical assistance and grants Technical assistance and grants for capital projects to borrowing member countries are provided either from grants received from contributors or from other resources specifically allocated for this purpose. The contributions from donors are included in the financial statements from the date of the contribution agreement. Technical assistance is recognised when the project is approved and becomes effective. Interest income and charges on contributions For instruments carried at amortised cost, interest income and expense are recognised in the statement of comprehensive income and accumulated net income using the effective interest rate method. Interest income and expense are recognised as earned for items classified as fair value through profit or loss. The effective interest rate is the rate that exactly discounts estimated future cash payments or receipts through the expected life of the financial instrument or, when appropriate, a shorter period to the net carrying amount of the financial asset or financial liability.

212
CARIBBEAN DEVELOPMENT BANK ANNUAL REPORT 2020
208 209
CARIBBEAN DEVELOPMENT BANK ANNUAL REPORT 2020 CARIBBEAN DEVELOPMENT BANK ANNUAL REPORT 2020
CCAARRIIBBBBEEAANN DDEEVVEELLOOPPMMEENNTT BBAANNKK SSPPEECCIIAALL FFUUNNDDSS RREESSOOUURRCCEESS –– SSPPEECCIIAALL DDEEVVEELLOOPPMMEENNTT FFUUNNDD
NNOOTTEESS TTOO TTHHEE FFIINNAANNCCIIAALL SSTTAATTEEMMEENNTTSS FFoorr tthhee yyeeaarr eennddeedd DDeecceemmbbeerr 3311,, 22002200
(expressed in thousands of United States dollars, unless otherwise stated)
- 29 -
2. SUMMARY OF SIGNIFICANT ACCOUNTING POLICIES…continued
Administrative expenses Administrative expenses incurred by the Bank which cannot be directly charged to individual funds are allocated between the Ordinary Capital Resources (“OCR), the Other Special Funds (“OSF”) and the SDF in accordance with a method of allocation approved by the Board of Directors.
3. CASH AND CASH EQUIVALENTS Cash and cash equivalents comprise: SDF Unified SDF Other 2020 2019 2020 2019
Due to Banks $(11,618) $- - $(5,552) Due from banks - 22,582 3,221 - Time deposits - 24,554 9,921 11,429 $(11,618) $47,136 $13,142 $5,877
The amount shown as Due to Banks comprises the net balance of items in transit and was cleared subsequent to the year end.
4. DEBT SECURITIES AT FAIR VALUE THROUGH PROFIT OR LOSS As part of its overall portfolio management strategy, the Bank invests in Government, agency, supranational and bank obligations, including time deposits and euro commercial paper as well as corporate bonds. The Bank limits its activities of investing in securities to well established dealers and counterparties meeting minimum credit rating standards set by the Bank. The annualised rate of return on the average investments held during the year, including realised and unrealised gains and losses was 1.67% (2019: 3.64%). Net realised gains on investments traded during 2020 for the Unified and Other funds amounted to $425 (2019: $495) and net unrealised gains were $5,720 (2019: Losses of $6,195).
CCAARRIIBBBBEEAANN DDEEVVEELLOOPPMMEENNTT BBAANNKK SSPPEECCIIAALL FFUUNNDDSS RREESSOOUURRCCEESS –– SSPPEECCIIAALL DDEEVVEELLOOPPMMEENNTT FFUUNNDD
NNOOTTEESS TTOO TTHHEE FFIINNAANNCCIIAALL SSTTAATTEEMMEENNTTSS FFoorr tthhee yyeeaarr eennddeedd DDeecceemmbbeerr 3311,, 22002200
(expressed in thousands of United States dollars, unless otherwise stated)
- 30 -
5. FUNDS In accordance with the Agreement establishing the Bank (the Charter), Special Funds Resources comprise the Special Development Fund and Other Special Funds established or administered by the Bank, including technical assistance and other grant resources contributed on a non-reimbursable basis. The Special Development Fund was established to receive contributions or loans which may be used to make or guarantee loans of high developmental priority, comprising longer maturities, longer deferred commencement of repayment and lower interest rates than those determined by the Bank in its Ordinary Operations. As a result of Rules adopted by the Bank in May 1983 for the Special Development Fund, contributions to the Special Development Fund currently comprise funds made available to the Bank under the rules applicable to the old Special Development Fund (referred to herein as “Other”) and shown separately from funds made available to the Bank from the Unified SDF (referred to herein as “Unified”).
Details of contributions and loan resources to the Special Development Fund are stated at the equivalent in thousands of United States dollars where such contributions and loans have been made in currencies other than United States dollars, and are as follows:
(i) Special Development Fund – Unified
2020 2019 Contributions (as per Schedule 3) $747,397 $740,689
All contributions to the Special Development Fund - Unified are interest-free with no date for repayment.
Effective October 27, 2000, France ceased to be a member of the Bank, however under the Rules of the Special Development Fund, its contributions are non-reimbursable.
(ii) Special Development Fund – Other
2020 2019 Colombia (as per Schedule 3) $5,000 $5,000
The contribution is interest-free and was not repayable before 2000. The agreement with the contributor provides that not less than 5% or more than 10% of the contribution may be used for technical assistance.

213
CARIBBEAN DEVELOPMENT BANK ANNUAL REPORT 2020
208 209
CARIBBEAN DEVELOPMENT BANK ANNUAL REPORT 2020 CARIBBEAN DEVELOPMENT BANK ANNUAL REPORT 2020
CCAARRIIBBBBEEAANN DDEEVVEELLOOPPMMEENNTT BBAANNKK SSPPEECCIIAALL FFUUNNDDSS RREESSOOUURRCCEESS –– SSPPEECCIIAALL DDEEVVEELLOOPPMMEENNTT FFUUNNDD
NNOOTTEESS TTOO TTHHEE FFIINNAANNCCIIAALL SSTTAATTEEMMEENNTTSS FFoorr tthhee yyeeaarr eennddeedd DDeecceemmbbeerr 3311,, 22002200
(expressed in thousands of United States dollars, unless otherwise stated)
- 29 -
2. SUMMARY OF SIGNIFICANT ACCOUNTING POLICIES…continued
Administrative expenses Administrative expenses incurred by the Bank which cannot be directly charged to individual funds are allocated between the Ordinary Capital Resources (“OCR), the Other Special Funds (“OSF”) and the SDF in accordance with a method of allocation approved by the Board of Directors.
3. CASH AND CASH EQUIVALENTS Cash and cash equivalents comprise: SDF Unified SDF Other 2020 2019 2020 2019
Due to Banks $(11,618) $- - $(5,552) Due from banks - 22,582 3,221 - Time deposits - 24,554 9,921 11,429 $(11,618) $47,136 $13,142 $5,877
The amount shown as Due to Banks comprises the net balance of items in transit and was cleared subsequent to the year end.
4. DEBT SECURITIES AT FAIR VALUE THROUGH PROFIT OR LOSS As part of its overall portfolio management strategy, the Bank invests in Government, agency, supranational and bank obligations, including time deposits and euro commercial paper as well as corporate bonds. The Bank limits its activities of investing in securities to well established dealers and counterparties meeting minimum credit rating standards set by the Bank. The annualised rate of return on the average investments held during the year, including realised and unrealised gains and losses was 1.67% (2019: 3.64%). Net realised gains on investments traded during 2020 for the Unified and Other funds amounted to $425 (2019: $495) and net unrealised gains were $5,720 (2019: Losses of $6,195).
CCAARRIIBBBBEEAANN DDEEVVEELLOOPPMMEENNTT BBAANNKK SSPPEECCIIAALL FFUUNNDDSS RREESSOOUURRCCEESS –– SSPPEECCIIAALL DDEEVVEELLOOPPMMEENNTT FFUUNNDD
NNOOTTEESS TTOO TTHHEE FFIINNAANNCCIIAALL SSTTAATTEEMMEENNTTSS FFoorr tthhee yyeeaarr eennddeedd DDeecceemmbbeerr 3311,, 22002200
(expressed in thousands of United States dollars, unless otherwise stated)
- 30 -
5. FUNDS In accordance with the Agreement establishing the Bank (the Charter), Special Funds Resources comprise the Special Development Fund and Other Special Funds established or administered by the Bank, including technical assistance and other grant resources contributed on a non-reimbursable basis. The Special Development Fund was established to receive contributions or loans which may be used to make or guarantee loans of high developmental priority, comprising longer maturities, longer deferred commencement of repayment and lower interest rates than those determined by the Bank in its Ordinary Operations. As a result of Rules adopted by the Bank in May 1983 for the Special Development Fund, contributions to the Special Development Fund currently comprise funds made available to the Bank under the rules applicable to the old Special Development Fund (referred to herein as “Other”) and shown separately from funds made available to the Bank from the Unified SDF (referred to herein as “Unified”).
Details of contributions and loan resources to the Special Development Fund are stated at the equivalent in thousands of United States dollars where such contributions and loans have been made in currencies other than United States dollars, and are as follows:
(i) Special Development Fund – Unified
2020 2019 Contributions (as per Schedule 3) $747,397 $740,689
All contributions to the Special Development Fund - Unified are interest-free with no date for repayment.
Effective October 27, 2000, France ceased to be a member of the Bank, however under the Rules of the Special Development Fund, its contributions are non-reimbursable.
(ii) Special Development Fund – Other
2020 2019 Colombia (as per Schedule 3) $5,000 $5,000
The contribution is interest-free and was not repayable before 2000. The agreement with the contributor provides that not less than 5% or more than 10% of the contribution may be used for technical assistance.

214
CARIBBEAN DEVELOPMENT BANK ANNUAL REPORT 2020
210 211
CARIBBEAN DEVELOPMENT BANK ANNUAL REPORT 2020 CARIBBEAN DEVELOPMENT BANK ANNUAL REPORT 2020
CCAARRIIBBBBEEAANN DDEEVVEELLOOPPMMEENNTT BBAANNKK SSPPEECCIIAALL FFUUNNDDSS RREESSOOUURRCCEESS –– SSPPEECCIIAALL DDEEVVEELLOOPPMMEENNTT FFUUNNDD
NNOOTTEESS TTOO TTHHEE FFIINNAANNCCIIAALL SSTTAATTEEMMEENNTTSS FFoorr tthhee yyeeaarr eennddeedd DDeecceemmbbeerr 3311,, 22002200
(expressed in thousands of United States dollars, unless otherwise stated)
- 31 -
5. FUNDS…continued
(ii) Special Development Fund – Other …continued
2020 2019 Mexico First contribution $7,000 $7,000 Second contribution 5,000 5,000 Third contribution 3,333 3,333 15,333 15,333 Less technical assistance (12,266) (12,266) 3,067 3,067 Technical assistance resources $16,285 $16,285
The contributions are interest-free and were not subject to call before 2009.
2020 2019 Venezuela First contribution $10,000 $10,000 Less technical assistance (177) (177) 9,823 9,823 Second contribution 7,650 7,650 Sub-total (as per Schedule 3) $17,473 $17,473
The contributions are interest-free and were not subject to call before 1999 and 2006, respectively. The agreement with the contributor provides that up to 10% of the first contribution may be used to finance technical assistance on the basis of contingent recovery.
CCAARRIIBBBBEEAANN DDEEVVEELLOOPPMMEENNTT BBAANNKK SSPPEECCIIAALL FFUUNNDDSS RREESSOOUURRCCEESS –– SSPPEECCIIAALL DDEEVVEELLOOPPMMEENNTT FFUUNNDD
NNOOTTEESS TTOO TTHHEE FFIINNAANNCCIIAALL SSTTAATTEEMMEENNTTSS FFoorr tthhee yyeeaarr eennddeedd DDeecceemmbbeerr 3311,, 22002200
(expressed in thousands of United States dollars, unless otherwise stated)
- 32 -
5. FUNDS…continued
(ii) Special Development Fund – Other…continued
2020 2019 Sweden (as per Schedule 3) $3,183 $2,795
The contribution is interest-free with no definite date for repayment.
2020 2019 United States of America First contribution $10,000 $10,000 Less repayments (10,000) (10,000) $- $- Second contribution 12,000 12,000 Less repayments (12,000) (12,000) $- $- Technical Assistance $302 $302
6. ACCUMULATED NET INCOME AND TOTAL COMPREHENSIVE INCOME FOR THE YEAR
In accordance with the rules of the Special Development Fund, the accumulated net income and total comprehensive income for the current year form part of the contributed resources of the fund and are not available for allocation by the Board of Governors.

215
CARIBBEAN DEVELOPMENT BANK ANNUAL REPORT 2020
210 211
CARIBBEAN DEVELOPMENT BANK ANNUAL REPORT 2020 CARIBBEAN DEVELOPMENT BANK ANNUAL REPORT 2020
CCAARRIIBBBBEEAANN DDEEVVEELLOOPPMMEENNTT BBAANNKK SSPPEECCIIAALL FFUUNNDDSS RREESSOOUURRCCEESS –– SSPPEECCIIAALL DDEEVVEELLOOPPMMEENNTT FFUUNNDD
NNOOTTEESS TTOO TTHHEE FFIINNAANNCCIIAALL SSTTAATTEEMMEENNTTSS FFoorr tthhee yyeeaarr eennddeedd DDeecceemmbbeerr 3311,, 22002200
(expressed in thousands of United States dollars, unless otherwise stated)
- 31 -
5. FUNDS…continued
(ii) Special Development Fund – Other …continued
2020 2019 Mexico First contribution $7,000 $7,000 Second contribution 5,000 5,000 Third contribution 3,333 3,333 15,333 15,333 Less technical assistance (12,266) (12,266) 3,067 3,067 Technical assistance resources $16,285 $16,285
The contributions are interest-free and were not subject to call before 2009.
2020 2019 Venezuela First contribution $10,000 $10,000 Less technical assistance (177) (177) 9,823 9,823 Second contribution 7,650 7,650 Sub-total (as per Schedule 3) $17,473 $17,473
The contributions are interest-free and were not subject to call before 1999 and 2006, respectively. The agreement with the contributor provides that up to 10% of the first contribution may be used to finance technical assistance on the basis of contingent recovery.
CCAARRIIBBBBEEAANN DDEEVVEELLOOPPMMEENNTT BBAANNKK SSPPEECCIIAALL FFUUNNDDSS RREESSOOUURRCCEESS –– SSPPEECCIIAALL DDEEVVEELLOOPPMMEENNTT FFUUNNDD
NNOOTTEESS TTOO TTHHEE FFIINNAANNCCIIAALL SSTTAATTEEMMEENNTTSS FFoorr tthhee yyeeaarr eennddeedd DDeecceemmbbeerr 3311,, 22002200
(expressed in thousands of United States dollars, unless otherwise stated)
- 32 -
5. FUNDS…continued
(ii) Special Development Fund – Other…continued
2020 2019 Sweden (as per Schedule 3) $3,183 $2,795
The contribution is interest-free with no definite date for repayment.
2020 2019 United States of America First contribution $10,000 $10,000 Less repayments (10,000) (10,000) $- $- Second contribution 12,000 12,000 Less repayments (12,000) (12,000) $- $- Technical Assistance $302 $302
6. ACCUMULATED NET INCOME AND TOTAL COMPREHENSIVE INCOME FOR THE YEAR
In accordance with the rules of the Special Development Fund, the accumulated net income and total comprehensive income for the current year form part of the contributed resources of the fund and are not available for allocation by the Board of Governors.
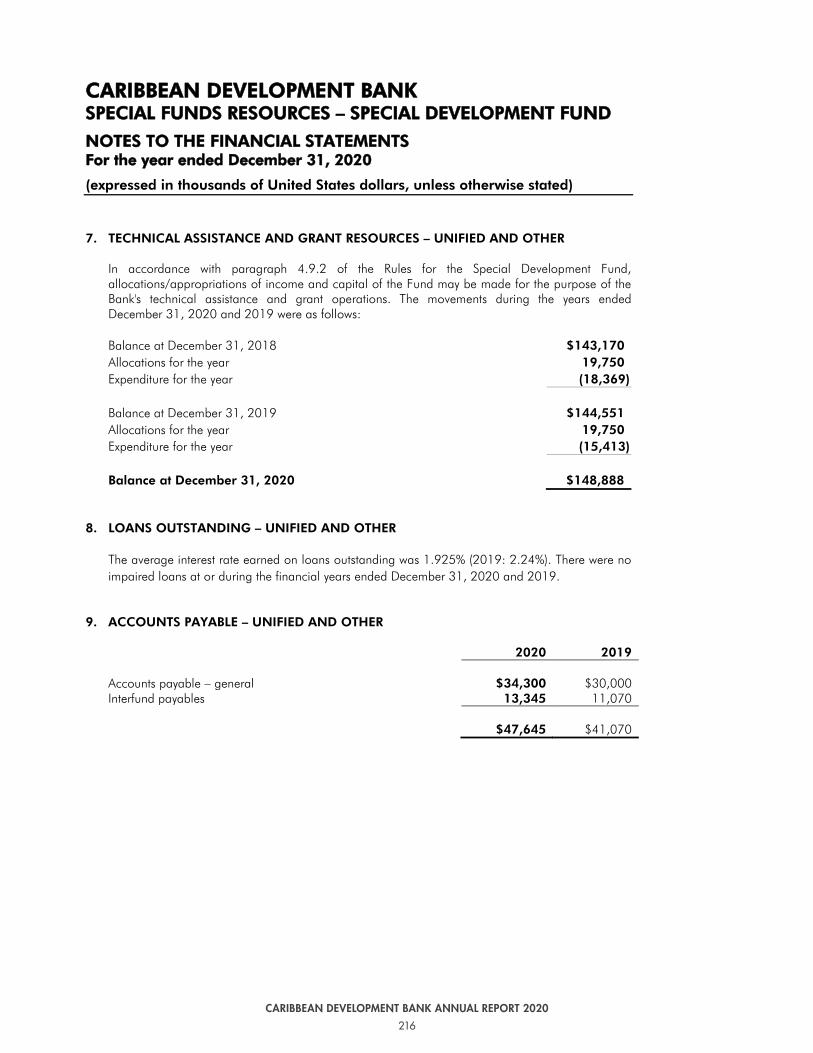
216
CARIBBEAN DEVELOPMENT BANK ANNUAL REPORT 2020
212 213
CARIBBEAN DEVELOPMENT BANK ANNUAL REPORT 2020 CARIBBEAN DEVELOPMENT BANK ANNUAL REPORT 2020
CCAARRIIBBBBEEAANN DDEEVVEELLOOPPMMEENNTT BBAANNKK SSPPEECCIIAALL FFUUNNDDSS RREESSOOUURRCCEESS –– SSPPEECCIIAALL DDEEVVEELLOOPPMMEENNTT FFUUNNDD
NNOOTTEESS TTOO TTHHEE FFIINNAANNCCIIAALL SSTTAATTEEMMEENNTTSS FFoorr tthhee yyeeaarr eennddeedd DDeecceemmbbeerr 3311,, 22002200
(expressed in thousands of United States dollars, unless otherwise stated)
- 33 -
7. TECHNICAL ASSISTANCE AND GRANT RESOURCES – UNIFIED AND OTHER
In accordance with paragraph 4.9.2 of the Rules for the Special Development Fund, allocations/appropriations of income and capital of the Fund may be made for the purpose of the Bank's technical assistance and grant operations. The movements during the years ended December 31, 2020 and 2019 were as follows:
Balance at December 31, 2018 $143,170 Allocations for the year 19,750 Expenditure for the year (18,369) Balance at December 31, 2019 $144,551 Allocations for the year 19,750 Expenditure for the year (15,413) Balance at December 31, 2020 $148,888
8. LOANS OUTSTANDING – UNIFIED AND OTHER
The average interest rate earned on loans outstanding was 1.925% (2019: 2.24%). There were no impaired loans at or during the financial years ended December 31, 2020 and 2019.
9. ACCOUNTS PAYABLE – UNIFIED AND OTHER
2020 2019
Accounts payable – general $34,300 $30,000 Interfund payables 13,345 11,070 $47,645 $41,070
Caribbean Development BankSpecial Funds Resources - Other Special Funds
Financial Statements
For the year ended December 31, 2020 (Expressed in thousands of United States Dollars unless otherwise stated)

217
CARIBBEAN DEVELOPMENT BANK ANNUAL REPORT 2020

218
CARIBBEAN DEVELOPMENT BANK ANNUAL REPORT 2020
Caribbean Development BankSpecial Funds Resources - Other Special Funds
Financial Statements
For the year ended December 31, 2020 (Expressed in thousands of United States Dollars unless otherwise stated)

219
CARIBBEAN DEVELOPMENT BANK ANNUAL REPORT 2020
CARIBBEAN DEVELOPMENT BANKSPECIAL FUNDS RESOURCES - OTHER SPECIAL FUNDSINDEX TO THE FINANCIAL STATEMENTS
Page
Independent Auditor's Report 1 - 3
Statement of Financial Position 4
Statement of Comprehensive Income and Accumulated Net Income 5
Statement of Cash Flows 6
Summary Statement of Investments 7
Summary Statement of Loans 8 - 13
Summary Statement of Contributions 14 - 16
Statement of Accumulated Net Income 17
Statement of Technical Assistance and other Grant Resources 18 - 19
Notes to the Financial Statements 20 - 30
Independent Auditor's Report
Statement of Financial Position
Statement of Comprehensive Income and Accumulated Net Income
Statement of Cash Flows
Summary Statement of Investments
Summary Statement of Loans
Summary Statement of Contributions
Statement of Accumulated Net Income
Statement of Technical Assistance and other Grant Resources
Notes to the Financial Statements
Page
220-223
224
225
226
227
228-233
234-236
237
238-239
240-250

220
CARIBBEAN DEVELOPMENT BANK ANNUAL REPORT 2020
KPMG Hastings Christ Church, BB 15154 Barbados West Indies Telephone: (246) 434-3900 Fax: (246) 427-7123 P. O. Box 690C Bridgetown, Barbados
- 1 - KPMG in Barbados and the Eastern Caribbean, a partnership registered in Barbados, Antigua and Barbuda, Saint Lucia and St. Vincent and the Grenadines, and a member firm of the KPMG global organization of independent member firms affiliated with KPMG International Limited, a private English company limited by guarantee.
INDEPENDENT AUDITOR’S REPORT
To the Board of Governors of Caribbean Development Bank
Report on the Audit of the Financial Statements
Opinion We have audited the financial statements of the Other Special Funds (“the Funds”) of the Caribbean Development Bank (“the Bank”), which comprise the statement of financial position as of December 31, 2020, and the statement of comprehensive income and accumulated net income and statement of cash flows for the year then ended, and notes to the financial statements, including a summary of significant accounting policies. In our opinion, the accompanying financial statements present fairly, in all material respects, the financial position of the Funds as of December 31, 2020 and its financial performance and its cash flows for the year then ended in accordance with the basis of accounting described in Note 2. Basis for Opinion We conducted our audit in accordance with International Standards on Auditing (“ISAs”). Our responsibilities under those standards are further described in the Auditor’s Responsibilities for the Audit of the Financial Statements section of our report. We are independent of the Funds in accordance with International Ethics Standards Board for Accountants’ Code of Ethics for Professional Accountants (including International Independence Standards) (“IESBA Code”), together with the ethical requirements that are relevant to our audit of the financial statements in Barbados and we have fulfilled our other ethical responsibilities in accordance with the IESBA Code. We believe that the audit evidence we have obtained is sufficient and appropriate to provide a basis for our opinion.
Other Matter
The financial statements of the Funds for the year ended December 31, 2019, were audited by another auditor who expressed an unmodified opinion on those financial statements on June 30, 2020.

221
CARIBBEAN DEVELOPMENT BANK ANNUAL REPORT 2020
- 2 -
INDEPENDENT AUDITOR’S REPORT (CONTINUED)
To the Board of Governors of Caribbean Development Bank (continued)
Report on the Audit of the Financial Statements (continued)
Emphasis of Matter – Basis of Accounting We draw attention to Note 2 of the financial statements which describes the basis of accounting. The financial statements are prepared for the specific purpose of reflecting the sources and applications of member subscriptions and contributions and other development resources and as a result, may not be suitable for any other purpose. Our opinion is not modified in respect of this matter. Other information included in the Bank’s 2020 Annual Report Management is responsible for the other information. The other information comprises the Management’s Discussion and Analysis but does not include the financial statements and our auditors’ report thereon. Our opinion on the financial statements does not cover the other information and we will not express any form of assurance conclusion thereon.
In connection with our audit of the financial statements, our responsibility is to read the other information and, in doing so, consider whether the other information is materially inconsistent with the financial statements or our knowledge obtained in the audit or otherwise appears to be materially misstated. If, based on the work we have performed, we conclude that there is a material misstatement of this other information, we are required to report that fact. We have nothing to report in this regard.
Responsibilities of Management and the Oversight and Assurance Committee for the Financial Statements Management is responsible for the preparation and fair presentation of the financial statements in accordance with the basis of accounting as described in Note 2, and for such internal control as management determines is necessary to enable the preparation of financial statements that are free from material misstatement, whether due to fraud or error. In preparing the financial statements, management is responsible for assessing the Funds’ ability to continue as a going concern, disclosing, as applicable, matters related to going concern and using the going concern basis of accounting unless management either intends to liquidate the Funds or to cease operations, or has no realistic alternative but to do so.

222
CARIBBEAN DEVELOPMENT BANK ANNUAL REPORT 2020
- 3 -
INDEPENDENT AUDITOR’S REPORT (CONTINUED)
To the Board of Governors of Caribbean Development Bank (continued)
Report on the Audit of the Financial Statements (continued)
Responsibilities of Management and the Oversight and Assurance Committee for the Financial Statements (continued) The Oversight and Assurance Committee is responsible for overseeing the Funds’ financial reporting process. Auditor’s Responsibilities for the Audit of the Financial Statements Our objectives are to obtain reasonable assurance about whether the financial statements as a whole are free from material misstatement, whether due to fraud or error, and to issue an auditor’s report that includes our opinion. Reasonable assurance is a high level of assurance but is not a guarantee that an audit conducted in accordance with ISAs will always detect a material misstatement when it exists. Misstatements can arise from fraud or error and are considered material if, individually or in the aggregate, they could reasonably be expected to influence the economic decisions of users taken on the basis of these financial statements. As part of an audit in accordance with ISAs, we exercise professional judgment and maintain professional skepticism throughout the audit. We also:
• Identify and assess the risks of material misstatement of the financial statements,
whether due to fraud or error, design and perform audit procedures responsive to those risks, and obtain audit evidence that is sufficient and appropriate to provide a basis for our opinion. The risk of not detecting a material misstatement resulting from fraud is higher than for one resulting from error, as fraud may involve collusion, forgery, intentional omissions, misrepresentations, or the override of internal control.
• Obtain an understanding of internal control relevant to the audit in order to design audit procedures that are appropriate in the circumstances, but not for the purpose of expressing an opinion on the effectiveness of the Funds’ internal control.
• Evaluate the appropriateness of accounting policies used and the reasonableness
of accounting estimates and related disclosures made by management.
223
CARIBBEAN DEVELOPMENT BANK ANNUAL REPORT 2020
- 4 -
INDEPENDENT AUDITOR’S REPORT (CONTINUED)
To the Board of Governors of Caribbean Development Bank (continued)
Report on the Audit of the Financial Statements (continued)
Auditor’s Responsibilities for the Audit of the Financial Statements (continued)
• Conclude on the appropriateness of management’s use of the going concern basis of accounting and based on the audit evidence obtained, whether a material uncertainty exists related to events or conditions that may cast significant doubt on the Funds’ ability to continue as a going concern. If we conclude that a material uncertainty exists, we are required to draw attention in our auditor’s report to the related disclosures in the financial statements or, if such disclosures are inadequate, to modify our opinion. Our conclusions are based on the audit evidence obtained up to the date of our auditor’s report. However, future events or conditions may cause the Funds to cease to continue as a going concern.
• Evaluate the overall presentation, structure and content of the financial statements, including the disclosures, and whether the financial statements represent the underlying transactions and events in a manner that achieves fair presentation.
We communicate with the Oversight and Assurance Committee regarding, among other matters, the planned scope and timing of the audit and significant audit findings, including any significant deficiencies in internal control that we identify during our audit. Other Matter This report is made solely to the Funds’ contributors, as a body, in accordance with Article 38, sub-section 2 of the Agreement establishing the Caribbean Development Bank entered into force on January 26, 1970. Our audit work has been undertaken so that we might state to the Funds’ contributors those matters we are required to state to them in an auditor’s report and for no other purpose. To the fullest extent permitted by law, we do not accept or assume responsibility to anyone other than the Funds and the Funds’ contributors as a body, for our audit work, for this report, or for the opinion we have formed.
Chartered Accountants Bridgetown, Barbados June 30, 2021

224
CARIBBEAN DEVELOPMENT BANK ANNUAL REPORT 2020
218 219
CARIBBEAN DEVELOPMENT BANK ANNUAL REPORT 2020 CARIBBEAN DEVELOPMENT BANK ANNUAL REPORT 2020
CCAARRIIBBBBEEAANN DDEEVVEELLOOPPMMEENNTT BBAANNKK SSPPEECCIIAALL FFUUNNDDSS RREESSOOUURRCCEESS –– OOTTHHEERR SSPPEECCIIAALL FFUUNNDDSS SSTTAATTEEMMEENNTT OOFF FFIINNAANNCCIIAALL PPOOSSIITTIIOONN AAss ooff DDeecceemmbbeerr 3311,, 22002200
(expressed in thousands of United States dollars, unless otherwise stated)
- 4 -
2020 2019
Assets Cash and cash equivalents – Note 3 $52,192 $42,931 Investments (Schedule 1) 47,615 39,708 Loans outstanding (Schedule 2) 78,594 85,105
Receivable from members Non-negotiable demand notes – Note 8 235,647 246,569 Accounts receivable – Note 9 36,119 37,047
Total assets $450,167 $451,360
Liabilities and Funds
Liabilities Accrued charges on contributions repayable 194 206
194 206
Funds Contributed resources (Schedule 3) 52,678 54,602 Accumulated net income (Schedule 4) 68,506 65,027 121,184 119,629 Technical assistance and other grant resources (Schedule 5) 328,789 331,525
Total liabilities and funds $450,167 $451,360
The accompanying schedules and notes and schedules form an integral part of these financial statements.
CCAARRIIBBBBEEAANN DDEEVVEELLOOPPMMEENNTT BBAANNKK SSPPEECCIIAALL FFUUNNDDSS RREESSOOUURRCCEESS –– OOTTHHEERR SSPPEECCIIAALL FFUUNNDDSS SSTTAATTEEMMEENNTT OOFF CCOOMMPPRREEHHEENNSSIIVVEE IINNCCOOMMEE AANNDD AACCCCUUMMUULLAATTEEDD NNEETT IINNCCOOMMEE FFoorr tthhee yyeeaarr eennddeedd DDeecceemmbbeerr 3311,, 22002200
(expressed in thousands of United States dollars, unless otherwise stated)
- 5 -
2020 2019
Interest and similar income Loans $1,718 $1,864 Investments and cash balances 862 1,874
2,580 3,738
Expenses
Administrative expenses 1,118 991 Charges on contributions repayable 952 745 Foreign exchange translation (2,969) (887)
Total expenses (899) 849 Total comprehensive income for the year $3,479 $2,889
Accumulated net income Accumulated net income – beginning of year $65,027 $62,170 Appropriations - -
Total comprehensive income for the year 3,479 2,889 Reimbursement of retained earnings on repayable contributions - (32)
Accumulated net income – end of year $68,506 $65,027
The accompanying schedules and notes form an integral part of these financial statements.

225
CARIBBEAN DEVELOPMENT BANK ANNUAL REPORT 2020
218 219
CARIBBEAN DEVELOPMENT BANK ANNUAL REPORT 2020 CARIBBEAN DEVELOPMENT BANK ANNUAL REPORT 2020
CCAARRIIBBBBEEAANN DDEEVVEELLOOPPMMEENNTT BBAANNKK SSPPEECCIIAALL FFUUNNDDSS RREESSOOUURRCCEESS –– OOTTHHEERR SSPPEECCIIAALL FFUUNNDDSS SSTTAATTEEMMEENNTT OOFF FFIINNAANNCCIIAALL PPOOSSIITTIIOONN AAss ooff DDeecceemmbbeerr 3311,, 22002200
(expressed in thousands of United States dollars, unless otherwise stated)
- 4 -
2020 2019
Assets Cash and cash equivalents – Note 3 $52,192 $42,931 Investments (Schedule 1) 47,615 39,708 Loans outstanding (Schedule 2) 78,594 85,105
Receivable from members Non-negotiable demand notes – Note 8 235,647 246,569 Accounts receivable – Note 9 36,119 37,047
Total assets $450,167 $451,360
Liabilities and Funds
Liabilities Accrued charges on contributions repayable 194 206
194 206
Funds Contributed resources (Schedule 3) 52,678 54,602 Accumulated net income (Schedule 4) 68,506 65,027 121,184 119,629 Technical assistance and other grant resources (Schedule 5) 328,789 331,525
Total liabilities and funds $450,167 $451,360
The accompanying schedules and notes and schedules form an integral part of these financial statements.
CCAARRIIBBBBEEAANN DDEEVVEELLOOPPMMEENNTT BBAANNKK SSPPEECCIIAALL FFUUNNDDSS RREESSOOUURRCCEESS –– OOTTHHEERR SSPPEECCIIAALL FFUUNNDDSS SSTTAATTEEMMEENNTT OOFF CCOOMMPPRREEHHEENNSSIIVVEE IINNCCOOMMEE AANNDD AACCCCUUMMUULLAATTEEDD NNEETT IINNCCOOMMEE FFoorr tthhee yyeeaarr eennddeedd DDeecceemmbbeerr 3311,, 22002200
(expressed in thousands of United States dollars, unless otherwise stated)
- 5 -
2020 2019
Interest and similar income Loans $1,718 $1,864 Investments and cash balances 862 1,874
2,580 3,738
Expenses
Administrative expenses 1,118 991 Charges on contributions repayable 952 745 Foreign exchange translation (2,969) (887)
Total expenses (899) 849 Total comprehensive income for the year $3,479 $2,889
Accumulated net income Accumulated net income – beginning of year $65,027 $62,170 Appropriations - -
Total comprehensive income for the year 3,479 2,889 Reimbursement of retained earnings on repayable contributions - (32)
Accumulated net income – end of year $68,506 $65,027
The accompanying schedules and notes form an integral part of these financial statements.

226
CARIBBEAN DEVELOPMENT BANK ANNUAL REPORT 2020
220 221
CARIBBEAN DEVELOPMENT BANK ANNUAL REPORT 2020 CARIBBEAN DEVELOPMENT BANK ANNUAL REPORT 2020
CCAARRIIBBBBEEAANN DDEEVVEELLOOPPMMEENNTT BBAANNKK SSPPEECCIIAALL FFUUNNDDSS RREESSOOUURRCCEESS -- OOTTHHEERR SSPPEECCIIAALL FFUUNNDDSS
SSTTAATTEEMMEENNTT OOFF CCAASSHH FFLLOOWWSS FFoorr tthhee yyeeaarr eennddeedd DDeecceemmbbeerr 3311,, 22002200
(expressed in thousands of United States dollars, unless otherwise stated)
- 6 -
2020 2019
Operating activities Total comprehensive income for the year $3,479 $2,889 Adjustments for non-cash items Net unrealised gain on investments (295) (935) Interest income (2,285) (2,773) Interest expense 952 745 Unrealised net foreign exchange losses (gains) 129 54
Total cash flow provided by (used in) operating activities before changes in operating assets and liabilities 1,980 (20)
Changes in operating assets and liabilities Decrease/(increase) in accounts receivable 928 (6,795) Decrease in non-negotiable demand notes 10,922 3,164 Decrease in accounts payable - (1,055)
Cash provided by (used in) operating activities 13,830 (4,706) Disbursements on loans (57) (1,322) Principal repayments to the Bank on loans 6,925 6,871
Technical assistance disbursements
(62,623) (55,917)
Interest received
2,322 2,840 Net (increase) decrease in investments (7,611) 3,693
Net cash used in operating activities (47,214) (48,541)
Financing activities Interest paid (964) (760) Contributions: Increase in contributions to fund loans 461 669
Reimbursement of repayable contributions (2,909) (3,001) Technical assistance contributions 59,887 37,225 Refund of retained earnings on repayable contributions - (32)
Net cash provided by financing activities 56,475 34,101
Net increase (decrease) in cash and cash equivalents 9,261 (14,440) Cash and cash equivalents at beginning of year 42,931 57,371
Cash and cash equivalents at end of year $52,192 $42,931
The accompanying schedules and notes form an integral part of these financial statements.
CCAARRIIBBBBEEAANN DDEEVVEELLOOPPMMEENNTT BBAANNKK SSPPEECCIIAALL FFUUNNDDSS RREESSOOUURRCCEESS -- OOTTHHEERR SSPPEECCIIAALL FFUUNNDDSS
SSUUMMMMAARRYY SSTTAATTEEMMEENNTT OOFF IINNVVEESSTTMMEENNTTSS AAss ooff DDeecceemmbbeerr 3311,, 22002200
(expressed in thousands of United States dollars, unless otherwise stated)
- 7 -
SCHEDULE 1
Investments 2020 2019
Debt securities at fair value through profit or loss – Note 4
Government and Agency obligations $17,777 $15,369 Supranationals 13,851 8,549
Other securities Mutual Funds 2,961 2,906 Equity Investments 12,938 12,797
Sub-total 47,527 39,621
Accrued interest 88 87
$47,615 $39,708
Residual Term to Contractual Maturity
2020 2019
1 – 3 months $15,987 $31,175 3 months - 1 year 1,500 7,034 1 year - 5 years 30,128 1,499
$47,615 $39,708

227
CARIBBEAN DEVELOPMENT BANK ANNUAL REPORT 2020
220 221
CARIBBEAN DEVELOPMENT BANK ANNUAL REPORT 2020 CARIBBEAN DEVELOPMENT BANK ANNUAL REPORT 2020
CCAARRIIBBBBEEAANN DDEEVVEELLOOPPMMEENNTT BBAANNKK SSPPEECCIIAALL FFUUNNDDSS RREESSOOUURRCCEESS -- OOTTHHEERR SSPPEECCIIAALL FFUUNNDDSS
SSTTAATTEEMMEENNTT OOFF CCAASSHH FFLLOOWWSS FFoorr tthhee yyeeaarr eennddeedd DDeecceemmbbeerr 3311,, 22002200
(expressed in thousands of United States dollars, unless otherwise stated)
- 6 -
2020 2019
Operating activities Total comprehensive income for the year $3,479 $2,889 Adjustments for non-cash items Net unrealised gain on investments (295) (935) Interest income (2,285) (2,773) Interest expense 952 745 Unrealised net foreign exchange losses (gains) 129 54
Total cash flow provided by (used in) operating activities before changes in operating assets and liabilities 1,980 (20)
Changes in operating assets and liabilities Decrease/(increase) in accounts receivable 928 (6,795) Decrease in non-negotiable demand notes 10,922 3,164 Decrease in accounts payable - (1,055)
Cash provided by (used in) operating activities 13,830 (4,706) Disbursements on loans (57) (1,322) Principal repayments to the Bank on loans 6,925 6,871
Technical assistance disbursements
(62,623) (55,917)
Interest received
2,322 2,840 Net (increase) decrease in investments (7,611) 3,693
Net cash used in operating activities (47,214) (48,541)
Financing activities Interest paid (964) (760) Contributions: Increase in contributions to fund loans 461 669
Reimbursement of repayable contributions (2,909) (3,001) Technical assistance contributions 59,887 37,225 Refund of retained earnings on repayable contributions - (32)
Net cash provided by financing activities 56,475 34,101
Net increase (decrease) in cash and cash equivalents 9,261 (14,440) Cash and cash equivalents at beginning of year 42,931 57,371
Cash and cash equivalents at end of year $52,192 $42,931
The accompanying schedules and notes form an integral part of these financial statements.
CCAARRIIBBBBEEAANN DDEEVVEELLOOPPMMEENNTT BBAANNKK SSPPEECCIIAALL FFUUNNDDSS RREESSOOUURRCCEESS -- OOTTHHEERR SSPPEECCIIAALL FFUUNNDDSS
SSUUMMMMAARRYY SSTTAATTEEMMEENNTT OOFF IINNVVEESSTTMMEENNTTSS AAss ooff DDeecceemmbbeerr 3311,, 22002200
(expressed in thousands of United States dollars, unless otherwise stated)
- 7 -
SCHEDULE 1
Investments 2020 2019
Debt securities at fair value through profit or loss – Note 4
Government and Agency obligations $17,777 $15,369 Supranationals 13,851 8,549
Other securities Mutual Funds 2,961 2,906 Equity Investments 12,938 12,797
Sub-total 47,527 39,621
Accrued interest 88 87
$47,615 $39,708
Residual Term to Contractual Maturity
2020 2019
1 – 3 months $15,987 $31,175 3 months - 1 year 1,500 7,034 1 year - 5 years 30,128 1,499
$47,615 $39,708

228
CARIBBEAN DEVELOPMENT BANK ANNUAL REPORT 2020
222 223
CARIBBEAN DEVELOPMENT BANK ANNUAL REPORT 2020 CARIBBEAN DEVELOPMENT BANK ANNUAL REPORT 2020
CCAARRIIBBBBEEAANN DDEEVVEELLOOPPMMEENNTT BBAANNKK SSPPEECCIIAALL FFUUNNDDSS RREESSOOUURRCCEESS -- OOTTHHEERR SSPPEECCIIAALL FFUUNNDDSS
SSUUMMMMAARRYY SSTTAATTEEMMEENNTT OOFF LLOOAANNSS AAss ooff DDeecceemmbbeerr 3311,, 22002200
(expressed in thousands of United States dollars, unless otherwise stated)
- 8 -
SCHEDULE 2
2020
Member countries in which loans have been made
Loans
approved but not yet
effective
Undisbursed Outstanding1/
% of Total Loans
Outstanding
Antigua and Barbuda $- $- $2,130 2.7 Barbados - 6,000 3,468 4.4 Dominica - 3 13,981 17.9 Grenada - - 16,528 21.1 Guyana - - 1,981 2.5 Jamaica - - 20,127 25.7 St. Kitts and Nevis - - 1,446 1.9 St. Lucia - 923 12,581 16.1 St. Vincent and the Grenadines - 1 5,710 7.3 Trinidad and Tobago - - 223 0.3
Sub-total - 6,927 78,175 100.0
Accrued interest - - 419
$- $6,927 $78,594
1/There were no overdue installments of principal at December 31, 2020 (2019 - nil).
CCAARRIIBBBBEEAANN DDEEVVEELLOOPPMMEENNTT BBAANNKK SSPPEECCIIAALL FFUUNNDDSS RREESSOOUURRCCEESS -- OOTTHHEERR SSPPEECCIIAALL FFUUNNDDSS
SSUUMMMMAARRYY SSTTAATTEEMMEENNTT OOFF LLOOAANNSS…continued AAss ooff DDeecceemmbbeerr 3311,, 22002200
(expressed in thousands of United States dollars, unless otherwise stated)
- 9 -
SCHEDULE 2
2019
Member countries in which loans have been made
Loans
approved but not yet
effective
Undisbursed Outstanding1/
% of Total Loans
Outstanding
Antigua and Barbuda $- $- $2,476 2.9 Barbados - 6,000 3,977 4.7 Dominica - 10 14,927 17.6 Grenada - - 17,637 20.8 Guyana - - 2,221 2.6 Jamaica - - 21,732 25.7 St. Kitts and Nevis - - 1,616 1.9 St. Lucia - 974 13,612 16.1 St. Vincent and the Grenadines - 1 6,145 7.3 Trinidad and Tobago - - 305 0.4
Sub-total - 6,985 84,648 100.0
Accrued interest - - 457
$- $6,985 $85,105
1/There were no overdue installments of principal at December 31, 2019.

229
CARIBBEAN DEVELOPMENT BANK ANNUAL REPORT 2020
222 223
CARIBBEAN DEVELOPMENT BANK ANNUAL REPORT 2020 CARIBBEAN DEVELOPMENT BANK ANNUAL REPORT 2020
CCAARRIIBBBBEEAANN DDEEVVEELLOOPPMMEENNTT BBAANNKK SSPPEECCIIAALL FFUUNNDDSS RREESSOOUURRCCEESS -- OOTTHHEERR SSPPEECCIIAALL FFUUNNDDSS
SSUUMMMMAARRYY SSTTAATTEEMMEENNTT OOFF LLOOAANNSS AAss ooff DDeecceemmbbeerr 3311,, 22002200
(expressed in thousands of United States dollars, unless otherwise stated)
- 8 -
SCHEDULE 2
2020
Member countries in which loans have been made
Loans
approved but not yet
effective
Undisbursed Outstanding1/
% of Total Loans
Outstanding
Antigua and Barbuda $- $- $2,130 2.7 Barbados - 6,000 3,468 4.4 Dominica - 3 13,981 17.9 Grenada - - 16,528 21.1 Guyana - - 1,981 2.5 Jamaica - - 20,127 25.7 St. Kitts and Nevis - - 1,446 1.9 St. Lucia - 923 12,581 16.1 St. Vincent and the Grenadines - 1 5,710 7.3 Trinidad and Tobago - - 223 0.3
Sub-total - 6,927 78,175 100.0
Accrued interest - - 419
$- $6,927 $78,594
1/There were no overdue installments of principal at December 31, 2020 (2019 - nil).
CCAARRIIBBBBEEAANN DDEEVVEELLOOPPMMEENNTT BBAANNKK SSPPEECCIIAALL FFUUNNDDSS RREESSOOUURRCCEESS -- OOTTHHEERR SSPPEECCIIAALL FFUUNNDDSS
SSUUMMMMAARRYY SSTTAATTEEMMEENNTT OOFF LLOOAANNSS…continued AAss ooff DDeecceemmbbeerr 3311,, 22002200
(expressed in thousands of United States dollars, unless otherwise stated)
- 9 -
SCHEDULE 2
2019
Member countries in which loans have been made
Loans
approved but not yet
effective
Undisbursed Outstanding1/
% of Total Loans
Outstanding
Antigua and Barbuda $- $- $2,476 2.9 Barbados - 6,000 3,977 4.7 Dominica - 10 14,927 17.6 Grenada - - 17,637 20.8 Guyana - - 2,221 2.6 Jamaica - - 21,732 25.7 St. Kitts and Nevis - - 1,616 1.9 St. Lucia - 974 13,612 16.1 St. Vincent and the Grenadines - 1 6,145 7.3 Trinidad and Tobago - - 305 0.4
Sub-total - 6,985 84,648 100.0
Accrued interest - - 457
$- $6,985 $85,105
1/There were no overdue installments of principal at December 31, 2019.

230
CARIBBEAN DEVELOPMENT BANK ANNUAL REPORT 2020
224 225
CARIBBEAN DEVELOPMENT BANK ANNUAL REPORT 2020 CARIBBEAN DEVELOPMENT BANK ANNUAL REPORT 2020
CCAARRIIBBBBEEAANN DDEEVVEELLOOPPMMEENNTT BBAANNKK SSPPEECCIIAALL FFUUNNDDSS RREESSOOUURRCCEESS -- OOTTHHEERR SSPPEECCIIAALL FFUUNNDDSS
SSUUMMMMAARRYY SSTTAATTEEMMEENNTT OOFF LLOOAANNSS…continued AAss ooff DDeecceemmbbeerr 3311,, 22002200
(expressed in thousands of United States dollars, unless otherwise stated)
- 10 -
SCHEDULE 2 2020
Analysis by Contributor
Loans approved
but not yet effective Undisbursed Outstanding1/
% of Total Loans Outstanding
Members Trinidad and Tobago $- $- $2 0.0 Other contributors Caribbean Development Bank - 6,000 37,488 48.0 Nigeria - - 2,014 2.6 Inter-American Development Bank - 927 28,962 37.0 European Union - - 520 0.7 International Development Association - - 9,189 11.8 Sub-total - 6,927 78,175 100.0 Accrued interest - - 419 $- $6,927 $78,594
1/ There were no overdue installments of principal at December 31, 2020 (2019 – nil).
CCAARRIIBBBBEEAANN DDEEVVEELLOOPPMMEENNTT BBAANNKK SSPPEECCIIAALL FFUUNNDDSS RREESSOOUURRCCEESS -- OOTTHHEERR SSPPEECCIIAALL FFUUNNDDSS
SSUUMMMMAARRYY SSTTAATTEEMMEENNTT OOFF LLOOAANNSS…continued AAss ooff DDeecceemmbbeerr 3311,, 22002200
(expressed in thousands of United States dollars, unless otherwise stated)
- 11 -
SCHEDULE 2
2019
Analysis by Contributor
Loans approved
but not yet effective Undisbursed Outstanding1/
% of Total Loans Outstanding
Members
Trinidad and Tobago $- $- $2 0.0
Other contributors
Caribbean Development Bank - 6,000 40,705 48.1 Nigeria - - 2,261 2.7 Inter-American Development Bank - 985 31,110 36.8 European Union - - 710 0.8 International Development Association - - 9,860 11.6
Sub-total $- $6,985 $84,648 100.0
Accrued interest - - 457
$- $6,985 $85,105
1/ There were no overdue installments of principal at December 31, 2019.
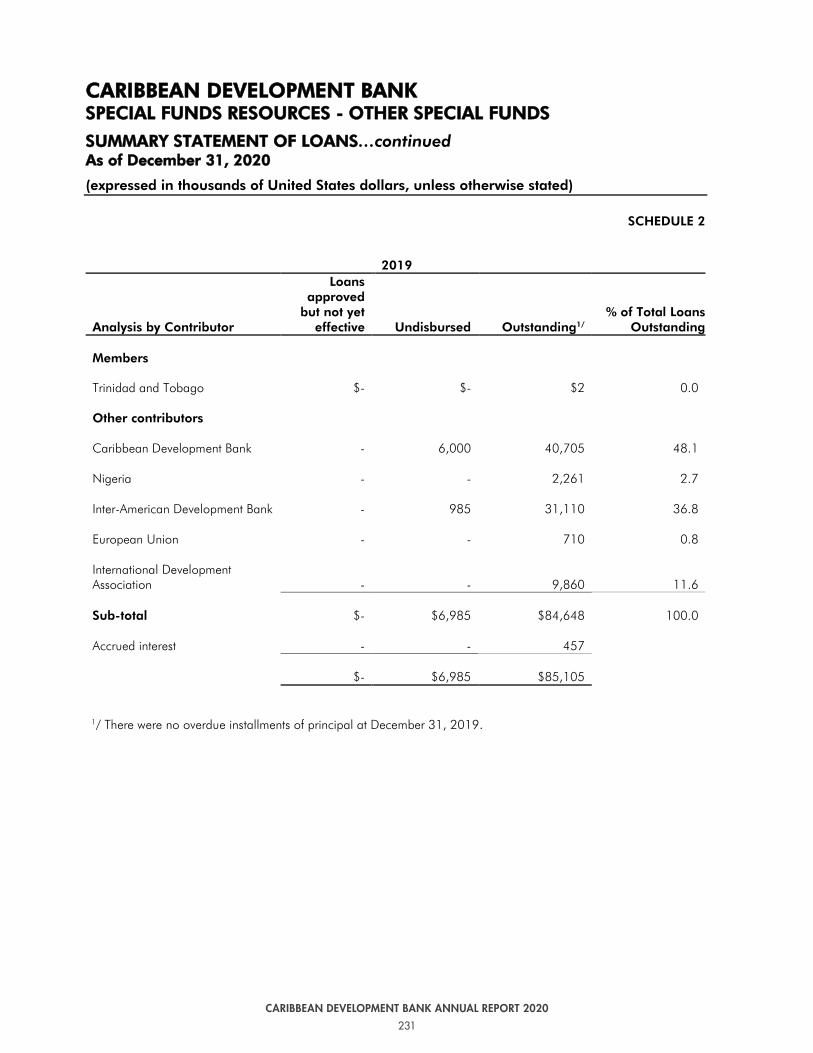
231
CARIBBEAN DEVELOPMENT BANK ANNUAL REPORT 2020
224 225
CARIBBEAN DEVELOPMENT BANK ANNUAL REPORT 2020 CARIBBEAN DEVELOPMENT BANK ANNUAL REPORT 2020
CCAARRIIBBBBEEAANN DDEEVVEELLOOPPMMEENNTT BBAANNKK SSPPEECCIIAALL FFUUNNDDSS RREESSOOUURRCCEESS -- OOTTHHEERR SSPPEECCIIAALL FFUUNNDDSS
SSUUMMMMAARRYY SSTTAATTEEMMEENNTT OOFF LLOOAANNSS…continued AAss ooff DDeecceemmbbeerr 3311,, 22002200
(expressed in thousands of United States dollars, unless otherwise stated)
- 10 -
SCHEDULE 2 2020
Analysis by Contributor
Loans approved
but not yet effective Undisbursed Outstanding1/
% of Total Loans Outstanding
Members Trinidad and Tobago $- $- $2 0.0 Other contributors Caribbean Development Bank - 6,000 37,488 48.0 Nigeria - - 2,014 2.6 Inter-American Development Bank - 927 28,962 37.0 European Union - - 520 0.7 International Development Association - - 9,189 11.8 Sub-total - 6,927 78,175 100.0 Accrued interest - - 419 $- $6,927 $78,594
1/ There were no overdue installments of principal at December 31, 2020 (2019 – nil).
CCAARRIIBBBBEEAANN DDEEVVEELLOOPPMMEENNTT BBAANNKK SSPPEECCIIAALL FFUUNNDDSS RREESSOOUURRCCEESS -- OOTTHHEERR SSPPEECCIIAALL FFUUNNDDSS
SSUUMMMMAARRYY SSTTAATTEEMMEENNTT OOFF LLOOAANNSS…continued AAss ooff DDeecceemmbbeerr 3311,, 22002200
(expressed in thousands of United States dollars, unless otherwise stated)
- 11 -
SCHEDULE 2
2019
Analysis by Contributor
Loans approved
but not yet effective Undisbursed Outstanding1/
% of Total Loans Outstanding
Members
Trinidad and Tobago $- $- $2 0.0
Other contributors
Caribbean Development Bank - 6,000 40,705 48.1 Nigeria - - 2,261 2.7 Inter-American Development Bank - 985 31,110 36.8 European Union - - 710 0.8 International Development Association - - 9,860 11.6
Sub-total $- $6,985 $84,648 100.0
Accrued interest - - 457
$- $6,985 $85,105
1/ There were no overdue installments of principal at December 31, 2019.

232
CARIBBEAN DEVELOPMENT BANK ANNUAL REPORT 2020
226 227
CARIBBEAN DEVELOPMENT BANK ANNUAL REPORT 2020 CARIBBEAN DEVELOPMENT BANK ANNUAL REPORT 2020
CCAARRIIBBBBEEAANN DDEEVVEELLOOPPMMEENNTT BBAANNKK SSPPEECCIIAALL FFUUNNDDSS RREESSOOUURRCCEESS -- OOTTHHEERR SSPPEECCIIAALL FFUUNNDDSS
SSUUMMMMAARRYY SSTTAATTEEMMEENNTT OOFF LLOOAANNSS…continued AAss ooff DDeecceemmbbeerr 3311,, 22002200
(expressed in thousands of United States dollars, unless otherwise stated)
- 13 -
SCHEDULE 2
2019
Currencies receivable
Loans out-
standing 2018
Translation adjustment
Net interest earned
Disburse-ments
Repay-ments
Loans out-
standing 2019
Euros $961 $(19) $- $- $(232) $710 Special Drawing Rights 8,712 (48) - - (772) 7,892 United States dollars 80,591 - - 1,322 (5,867) 76,046
Sub-total 90,264 (67) - 1,322 (6,871) 84,648
Accrued interest1 494 - (37) - - 457
$90,758 $(67) $(37) $1,322 $(6,871) $85,105
1/ Relates to amounts disbursed and outstanding.
Maturity structure of loans outstanding
January 1, 2020 to December 31, 2020 $7,326 January 1, 2021 to December 31, 2021 6,858 January 1, 2022 to December 31, 2022 6,860 January 1, 2023 to December 31, 2023 6,622 January 1, 2024 to December 31, 2024 6,601 January 1, 2025 to December 31, 2029 26,242 January 1, 2030 to December 31, 2034 16,605 January 1, 2035 to December 31, 2039 2,168 January 1, 2040 to December 31, 2044 654 January 1, 2045 to December 31, 2049 147 January 1, 2050 to December 31, 2054 5,022
$85,105
CCAARRIIBBBBEEAANN DDEEVVEELLOOPPMMEENNTT BBAANNKK SSPPEECCIIAALL FFUUNNDDSS RREESSOOUURRCCEESS -- OOTTHHEERR SSPPEECCIIAALL FFUUNNDDSS
SSUUMMMMAARRYY SSTTAATTEEMMEENNTT OOFF LLOOAANNSS…continued AAss ooff DDeecceemmbbeerr 3311,, 22002200
(expressed in thousands of United States dollars, unless otherwise stated)
- 12 -
SCHEDULE 2
2020
Currencies receivable
Loans out-
standing 2019
Translation adjustment
Net Interest earned
Disburse- ments
Repay- ments
Loans out-
standing 2020
Euros $710 $66 $- $- $(256) $520 Special Drawing Rights 7,892 329 - - (803) 7,418 United States dollars 76,046 - - 57 (5,866) 70,237 Sub-total 84,648 395 - 57 (6,925) 78,175 Accrued interest1 457 - (38) - - 419 $85,105 $395 $(38) $57 $(6,925) $78,594
1/ Relates to amounts disbursed and outstanding.
Maturity structure of loans outstanding
January 1, 2021 to December 31, 2021 $7,332
January 1, 2022 to December 31, 2022 6,915
January 1, 2023 to December 31, 2023 6,654
January 1, 2024 to December 31, 2024 6,633
January 1, 2025 to December 31, 2029 26,329
January 1, 2030 to December 31, 2034 16,673
January 1, 2035 to December 31, 2039 2,181
January 1, 2040 to December 31, 2044 653
January 1, 2045 to December 31, 2049 147
January 1, 2050 to December 31, 2054 5,077
$78,594

233
CARIBBEAN DEVELOPMENT BANK ANNUAL REPORT 2020
226 227
CARIBBEAN DEVELOPMENT BANK ANNUAL REPORT 2020 CARIBBEAN DEVELOPMENT BANK ANNUAL REPORT 2020
CCAARRIIBBBBEEAANN DDEEVVEELLOOPPMMEENNTT BBAANNKK SSPPEECCIIAALL FFUUNNDDSS RREESSOOUURRCCEESS -- OOTTHHEERR SSPPEECCIIAALL FFUUNNDDSS
SSUUMMMMAARRYY SSTTAATTEEMMEENNTT OOFF LLOOAANNSS…continued AAss ooff DDeecceemmbbeerr 3311,, 22002200
(expressed in thousands of United States dollars, unless otherwise stated)
- 13 -
SCHEDULE 2
2019
Currencies receivable
Loans out-
standing 2018
Translation adjustment
Net interest earned
Disburse-ments
Repay-ments
Loans out-
standing 2019
Euros $961 $(19) $- $- $(232) $710 Special Drawing Rights 8,712 (48) - - (772) 7,892 United States dollars 80,591 - - 1,322 (5,867) 76,046
Sub-total 90,264 (67) - 1,322 (6,871) 84,648
Accrued interest1 494 - (37) - - 457
$90,758 $(67) $(37) $1,322 $(6,871) $85,105
1/ Relates to amounts disbursed and outstanding.
Maturity structure of loans outstanding
January 1, 2020 to December 31, 2020 $7,326 January 1, 2021 to December 31, 2021 6,858 January 1, 2022 to December 31, 2022 6,860 January 1, 2023 to December 31, 2023 6,622 January 1, 2024 to December 31, 2024 6,601 January 1, 2025 to December 31, 2029 26,242 January 1, 2030 to December 31, 2034 16,605 January 1, 2035 to December 31, 2039 2,168 January 1, 2040 to December 31, 2044 654 January 1, 2045 to December 31, 2049 147 January 1, 2050 to December 31, 2054 5,022
$85,105
CCAARRIIBBBBEEAANN DDEEVVEELLOOPPMMEENNTT BBAANNKK SSPPEECCIIAALL FFUUNNDDSS RREESSOOUURRCCEESS -- OOTTHHEERR SSPPEECCIIAALL FFUUNNDDSS
SSUUMMMMAARRYY SSTTAATTEEMMEENNTT OOFF LLOOAANNSS…continued AAss ooff DDeecceemmbbeerr 3311,, 22002200
(expressed in thousands of United States dollars, unless otherwise stated)
- 12 -
SCHEDULE 2
2020
Currencies receivable
Loans out-
standing 2019
Translation adjustment
Net Interest earned
Disburse- ments
Repay- ments
Loans out-
standing 2020
Euros $710 $66 $- $- $(256) $520 Special Drawing Rights 7,892 329 - - (803) 7,418 United States dollars 76,046 - - 57 (5,866) 70,237 Sub-total 84,648 395 - 57 (6,925) 78,175 Accrued interest1 457 - (38) - - 419 $85,105 $395 $(38) $57 $(6,925) $78,594
1/ Relates to amounts disbursed and outstanding.
Maturity structure of loans outstanding
January 1, 2021 to December 31, 2021 $7,332
January 1, 2022 to December 31, 2022 6,915
January 1, 2023 to December 31, 2023 6,654
January 1, 2024 to December 31, 2024 6,633
January 1, 2025 to December 31, 2029 26,329
January 1, 2030 to December 31, 2034 16,673
January 1, 2035 to December 31, 2039 2,181
January 1, 2040 to December 31, 2044 653
January 1, 2045 to December 31, 2049 147
January 1, 2050 to December 31, 2054 5,077
$78,594

234
CARIBBEAN DEVELOPMENT BANK ANNUAL REPORT 2020
228 229
CARIBBEAN DEVELOPMENT BANK ANNUAL REPORT 2020 CARIBBEAN DEVELOPMENT BANK ANNUAL REPORT 2020
CCAARRIIBBBBEEAANN DDEEVVEELLOOPPMMEENNTT BBAANNKK SSPPEECCIIAALL FFUUNNDDSS RREESSOOUURRCCEESS -- OOTTHHEERR SSPPEECCIIAALL FFUUNNDDSS
SSUUMMMMAARRYY SSTTAATTEEMMEENNTT OOFF CCOONNTTRRIIBBUUTTIIOONNSS AAss ooff DDeecceemmbbeerr 3311,, 22002200
(expressed in thousands of United States dollars, unless otherwise stated)
- 14 -
SCHEDULE 3
1/Net of cancellations and repayments.
Maturity structure of repayable contributions outstanding
January 1, 2021 to December 31, 2021 $2,745 January 1, 2022 to December 31, 2022 2,471 January 1, 2023 to December 31, 2023 2,471 January 1, 2024 to December 31, 2024 2,414 January 1, 2025 to December 31, 2025 2,355 January 1, 2026 to December 31, 2030 11,423 January 1, 2031 to December 31, 2035 8,615 January 1, 2036 to December 31, 2040 5,443 January 1, 2041 to December 31, 2045 2,965 January 1, 2046 to December 31, 2053 5,058
$45,960
2020 Contributions
Contributors Total1/
Amounts made
available
Members Canada $6,570 $6,570 Other contributors Inter-American Development Bank 148 148 Contributed resources 6,718 6,718
Other contributors Inter-American Development Bank 1/ 34,248 34,248 United States Agency for International Development - - European Union 680 680 International Development Association 11,032 11,032
Repayable contributions 45,960 45,960
$52,678 $52,678
CCAARRIIBBBBEEAANN DDEEVVEELLOOPPMMEENNTT BBAANNKK SSPPEECCIIAALL FFUUNNDDSS RREESSOOUURRCCEESS -- OOTTHHEERR SSPPEECCIIAALL FFUUNNDDSS
SSUUMMMMAARRYY SSTTAATTEEMMEENNTT OOFF CCOONNTTRRIIBBUUTTIIOONNSS…continued AAss ooff DDeecceemmbbeerr 3311,, 22002200
(expressed in thousands of United States dollars, unless otherwise stated)
- 15 -
SCHEDULE 3
1/Net of cancellations and repayments.
Maturity structure of repayable contributions outstanding
January 1, 2020 to December 31, 2020 $2,683 January 1, 2021 to December 31, 2021 2,688 January 1, 2022 to December 31, 2022 2,437 January 1, 2023 to December 31, 2023 2,438 January 1, 2024 to December 31, 2024 2,386 January 1, 2025 to December 31, 2029 11,659 January 1, 2030 to December 31, 2034 8,963 January 1, 2035 to December 31, 2039 6,074 January 1, 2040 to December 31, 2044 3,654 January 1, 2045 to December 31, 2053 4,934
$47,916
2019 Contributions
Contributors Total1/ Amounts made
available
Members Canada $6,538 $6,538
Other contributors Inter-American Development Bank 148 148 Contributed resources 6,686 6,686
Other contributors Inter-American Development Bank 1/ 35,193 35,193 United States Agency for International Development 167 167 European Union 975 975 International Development Association 11,581 11,581
Repayable contributions 47,916 47,916
$54,602 $54,602
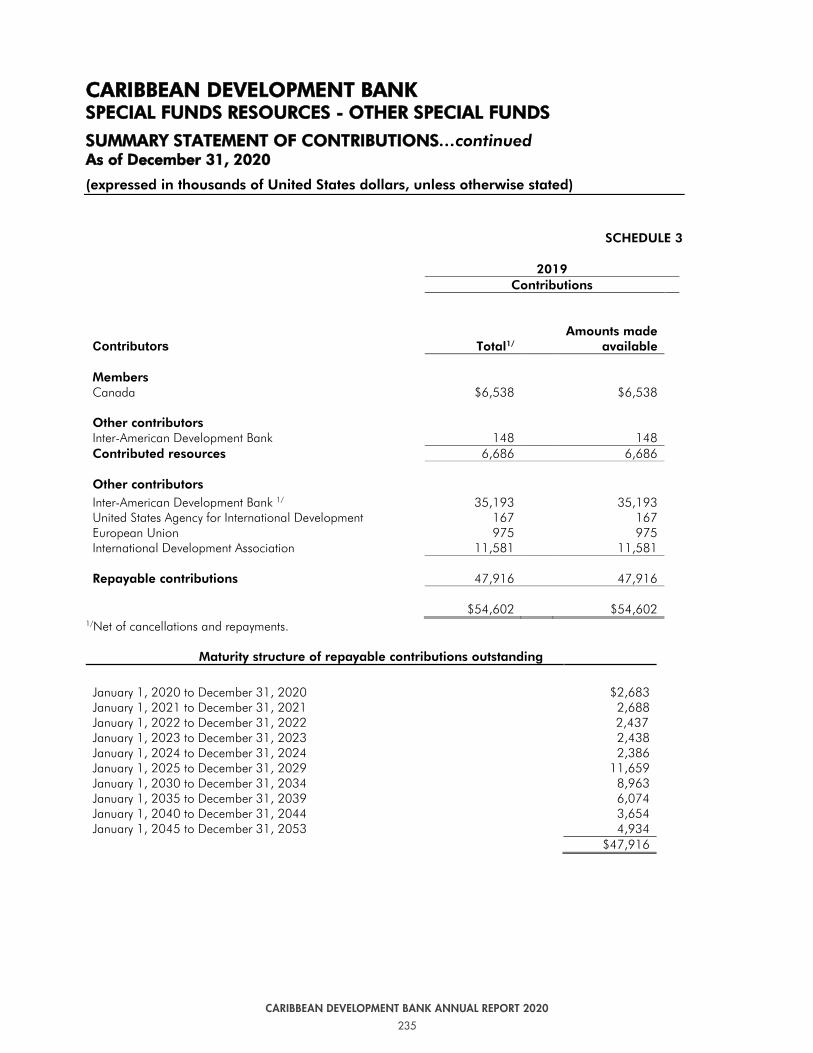
235
CARIBBEAN DEVELOPMENT BANK ANNUAL REPORT 2020
228 229
CARIBBEAN DEVELOPMENT BANK ANNUAL REPORT 2020 CARIBBEAN DEVELOPMENT BANK ANNUAL REPORT 2020
CCAARRIIBBBBEEAANN DDEEVVEELLOOPPMMEENNTT BBAANNKK SSPPEECCIIAALL FFUUNNDDSS RREESSOOUURRCCEESS -- OOTTHHEERR SSPPEECCIIAALL FFUUNNDDSS
SSUUMMMMAARRYY SSTTAATTEEMMEENNTT OOFF CCOONNTTRRIIBBUUTTIIOONNSS AAss ooff DDeecceemmbbeerr 3311,, 22002200
(expressed in thousands of United States dollars, unless otherwise stated)
- 14 -
SCHEDULE 3
1/Net of cancellations and repayments.
Maturity structure of repayable contributions outstanding
January 1, 2021 to December 31, 2021 $2,745 January 1, 2022 to December 31, 2022 2,471 January 1, 2023 to December 31, 2023 2,471 January 1, 2024 to December 31, 2024 2,414 January 1, 2025 to December 31, 2025 2,355 January 1, 2026 to December 31, 2030 11,423 January 1, 2031 to December 31, 2035 8,615 January 1, 2036 to December 31, 2040 5,443 January 1, 2041 to December 31, 2045 2,965 January 1, 2046 to December 31, 2053 5,058
$45,960
2020 Contributions
Contributors Total1/
Amounts made
available
Members Canada $6,570 $6,570 Other contributors Inter-American Development Bank 148 148 Contributed resources 6,718 6,718
Other contributors Inter-American Development Bank 1/ 34,248 34,248 United States Agency for International Development - - European Union 680 680 International Development Association 11,032 11,032
Repayable contributions 45,960 45,960
$52,678 $52,678
CCAARRIIBBBBEEAANN DDEEVVEELLOOPPMMEENNTT BBAANNKK SSPPEECCIIAALL FFUUNNDDSS RREESSOOUURRCCEESS -- OOTTHHEERR SSPPEECCIIAALL FFUUNNDDSS
SSUUMMMMAARRYY SSTTAATTEEMMEENNTT OOFF CCOONNTTRRIIBBUUTTIIOONNSS…continued AAss ooff DDeecceemmbbeerr 3311,, 22002200
(expressed in thousands of United States dollars, unless otherwise stated)
- 15 -
SCHEDULE 3
1/Net of cancellations and repayments.
Maturity structure of repayable contributions outstanding
January 1, 2020 to December 31, 2020 $2,683 January 1, 2021 to December 31, 2021 2,688 January 1, 2022 to December 31, 2022 2,437 January 1, 2023 to December 31, 2023 2,438 January 1, 2024 to December 31, 2024 2,386 January 1, 2025 to December 31, 2029 11,659 January 1, 2030 to December 31, 2034 8,963 January 1, 2035 to December 31, 2039 6,074 January 1, 2040 to December 31, 2044 3,654 January 1, 2045 to December 31, 2053 4,934
$47,916
2019 Contributions
Contributors Total1/ Amounts made
available
Members Canada $6,538 $6,538
Other contributors Inter-American Development Bank 148 148 Contributed resources 6,686 6,686
Other contributors Inter-American Development Bank 1/ 35,193 35,193 United States Agency for International Development 167 167 European Union 975 975 International Development Association 11,581 11,581
Repayable contributions 47,916 47,916
$54,602 $54,602

236
CARIBBEAN DEVELOPMENT BANK ANNUAL REPORT 2020
230 231
CARIBBEAN DEVELOPMENT BANK ANNUAL REPORT 2020 CARIBBEAN DEVELOPMENT BANK ANNUAL REPORT 2020
CCAARRIIBBBBEEAANN DDEEVVEELLOOPPMMEENNTT BBAANNKK SSPPEECCIIAALL FFUUNNDDSS RREESSOOUURRCCEESS -- OOTTHHEERR SSPPEECCIIAALL FFUUNNDDSS
SSUUMMMMAARRYY SSTTAATTEEMMEENNTT OOFF CCOONNTTRRIIBBUUTTIIOONNSS…continued AAss ooff DDeecceemmbbeerr 3311,, 22002200
(expressed in thousands of United States dollars, unless otherwise stated)
- 16 -
SCHEDULE 3
2020
Currencies Repayable
Contribu-tions made
available 2019
Translation adjustment
Draw-downs/ appro-
priations from capital
Repayments
Contribu-tions made
available 2020
Canadian dollars $1,538 $32 $- $- $1,570 Euros 975 91 - (386) 680 Special Drawing Rights 9,637 401 - (756) 9,282 United States dollars 42,452 - 461 (1,767) 41,146
$54,602 $524 $461 $(2,909) $52,678
2019
Currencies Repayable
Contribu-tions made
available 2018
Translation adjustment
Draw-downs/ appro-
priations from capital Repayments
Contribu-tions made
available 2019
Canadian dollars $1,467 $71 $- $- $1,538 Euros 1,351 (26) - (350) 975 Special Drawing Rights 10,420 (58) - (725) 9,637 United States dollars 43,709 - 669 (1,926) 42,452
$56,947 $(13) $669 $(3,001) $54,602
CCAARRIIBBBBEEAANN DDEEVVEELLOOPPMMEENNTT BBAANNKK SSPPEECCIIAALL FFUUNNDDSS RREESSOOUURRCCEESS -- OOTTHHEERR SSPPEECCIIAALL FFUUNNDDSS
SSTTAATTEEMMEENNTT OOFF AACCCCUUMMUULLAATTEEDD NNEETT IINNCCOOMMEE FFoorr tthhee yyeeaarr eennddeedd DDeecceemmbbeerr 3311,, 22002200
(expressed in thousands of United States dollars, unless otherwise stated)
- 17 -
SCHEDULE 4 2020
Contributors
Brought forward
2019
Net Income/(Loss)
2019
Appropriations
Carried forward
2020
General Funds $56,075 $1,430 $- $57,478 European Investment Bank (763) 23 - (740) European Union 2,560 66 - 2,626 Inter-American Development Bank (1,909) (636) - (2,545) International Development Association 341 (72) - 269 Nigeria 5,778 (65) - 5,713 United States of America 1,893 39 - 1,932 United Kingdom 736 2,040 - 2,776 Venezuela 41 5 - 46 European Commission 273 710 - 983 BMZ/ The Federal Government of Germany 2 11 - 13 Agence Francaise de Developpement - (45) - (45)
$65,027 $3,479 $- $68,506
2019
Contributors
Brought forward
2018
Net Income/(Loss)
2019
Appropriations
Carried forward
2019 General Funds $54,014 $2,061 $- $56,075 European Investment Bank (757) (6) - (763) European Union 2,541 19 - 2,560 Inter-American Development Bank (1,700) (209) - (1,909) International Development Association 323 18 - 341 Nigeria 5,791 (13) - 5,778 United States of America 1,823 70 - 1,893 United Kingdom (76) 812 - 736 Venezuela 24 17 - 41 European Commission 187 118 (32) 273 BMZ/ The Federal Government of Germany - 2 - 2 $62,170 $2,889 $(32) $65,027

237
CARIBBEAN DEVELOPMENT BANK ANNUAL REPORT 2020
230 231
CARIBBEAN DEVELOPMENT BANK ANNUAL REPORT 2020 CARIBBEAN DEVELOPMENT BANK ANNUAL REPORT 2020
CCAARRIIBBBBEEAANN DDEEVVEELLOOPPMMEENNTT BBAANNKK SSPPEECCIIAALL FFUUNNDDSS RREESSOOUURRCCEESS -- OOTTHHEERR SSPPEECCIIAALL FFUUNNDDSS
SSUUMMMMAARRYY SSTTAATTEEMMEENNTT OOFF CCOONNTTRRIIBBUUTTIIOONNSS…continued AAss ooff DDeecceemmbbeerr 3311,, 22002200
(expressed in thousands of United States dollars, unless otherwise stated)
- 16 -
SCHEDULE 3
2020
Currencies Repayable
Contribu-tions made
available 2019
Translation adjustment
Draw-downs/ appro-
priations from capital
Repayments
Contribu-tions made
available 2020
Canadian dollars $1,538 $32 $- $- $1,570 Euros 975 91 - (386) 680 Special Drawing Rights 9,637 401 - (756) 9,282 United States dollars 42,452 - 461 (1,767) 41,146
$54,602 $524 $461 $(2,909) $52,678
2019
Currencies Repayable
Contribu-tions made
available 2018
Translation adjustment
Draw-downs/ appro-
priations from capital Repayments
Contribu-tions made
available 2019
Canadian dollars $1,467 $71 $- $- $1,538 Euros 1,351 (26) - (350) 975 Special Drawing Rights 10,420 (58) - (725) 9,637 United States dollars 43,709 - 669 (1,926) 42,452
$56,947 $(13) $669 $(3,001) $54,602
CCAARRIIBBBBEEAANN DDEEVVEELLOOPPMMEENNTT BBAANNKK SSPPEECCIIAALL FFUUNNDDSS RREESSOOUURRCCEESS -- OOTTHHEERR SSPPEECCIIAALL FFUUNNDDSS
SSTTAATTEEMMEENNTT OOFF AACCCCUUMMUULLAATTEEDD NNEETT IINNCCOOMMEE FFoorr tthhee yyeeaarr eennddeedd DDeecceemmbbeerr 3311,, 22002200
(expressed in thousands of United States dollars, unless otherwise stated)
- 17 -
SCHEDULE 4 2020
Contributors
Brought forward
2019
Net Income/(Loss)
2019
Appropriations
Carried forward
2020
General Funds $56,075 $1,430 $- $57,478 European Investment Bank (763) 23 - (740) European Union 2,560 66 - 2,626 Inter-American Development Bank (1,909) (636) - (2,545) International Development Association 341 (72) - 269 Nigeria 5,778 (65) - 5,713 United States of America 1,893 39 - 1,932 United Kingdom 736 2,040 - 2,776 Venezuela 41 5 - 46 European Commission 273 710 - 983 BMZ/ The Federal Government of Germany 2 11 - 13 Agence Francaise de Developpement - (45) - (45)
$65,027 $3,479 $- $68,506
2019
Contributors
Brought forward
2018
Net Income/(Loss)
2019
Appropriations
Carried forward
2019 General Funds $54,014 $2,061 $- $56,075 European Investment Bank (757) (6) - (763) European Union 2,541 19 - 2,560 Inter-American Development Bank (1,700) (209) - (1,909) International Development Association 323 18 - 341 Nigeria 5,791 (13) - 5,778 United States of America 1,823 70 - 1,893 United Kingdom (76) 812 - 736 Venezuela 24 17 - 41 European Commission 187 118 (32) 273 BMZ/ The Federal Government of Germany - 2 - 2 $62,170 $2,889 $(32) $65,027

238
CARIBBEAN DEVELOPMENT BANK ANNUAL REPORT 2020
232 233
CARIBBEAN DEVELOPMENT BANK ANNUAL REPORT 2020 CARIBBEAN DEVELOPMENT BANK ANNUAL REPORT 2020
CCAARRIIBBBBEEAANN DDEEVVEELLOOPPMMEENNTT BBAANNKK SSPPEECCIIAALL FFUUNNDDSS RREESSOOUURRCCEESS -- OOTTHHEERR SSPPEECCIIAALL FFUUNNDDSS
SSTTAATTEEMMEENNTT OOFF TTEECCHHNNIICCAALL AASSSSIISSTTAANNCCEE AANNDD OOTTHHEERR GGRRAANNTT RREESSOOUURRCCEESS AAss ooff DDeecceemmbbeerr 3311,, 22002200
(expressed in thousands of United States dollars, unless otherwise stated)
- 18 -
SCHEDULE 5
2020 Contributors
Contributors Total1/
Amounts made
available Amounts
utilised
Net Amounts available
Members Canada $83,796 $83,796 $67,094 $16,702 United Kingdom 303,143 303,143 74,293 228,850 Italy 522 522 252 270 China 677 677 270 407 Venezuela 586 586 - 586 Germany 496 496 498 (2)
389,220 389,220 142,407 246,813
Other contributors Caribbean Development Bank 275,639 275,639 210,593 $65,046 United States of America 1,407 1,407 1,407 - Inter-American Development Bank 26,455 26,455 23,662 2,793 Nigeria 193 193 148 45 European Commission 41,138 41,138 29,662 11,476 European Investment Bank Climate Action Support 2,184 2,184 590 $1,594 Agence Francaise de Developpement 1,172 1,172 150 $1,022 Improve Public Investment Management through Procurement
320
320
320
-
Sub-total 348,508 348,508 266,532 81,976
Total – December 31 $737,718 $737,728 $408,939 $328,789
Summary Basic Needs Trust Fund $199,750 $199,750 $170,928 $28,822 Other resources 537,978 $537,978 238,011 299,967
$737,718 $737,728 $408,939 $328,789
1/Net of cancellation and resources fully utilized and expended in non-reimbursable operations.
CCAARRIIBBBBEEAANN DDEEVVEELLOOPPMMEENNTT BBAANNKK SSPPEECCIIAALL FFUUNNDDSS RREESSOOUURRCCEESS -- OOTTHHEERR SSPPEECCIIAALL FFUUNNDDSS
SSTTAATTEEMMEENNTT OOFF TTEECCHHNNIICCAALL AASSSSIISSTTAANNCCEE AANNDD OOTTHHEERR GGRRAANNTT RREESSOOUURRCCEESS…continued AAss ooff DDeecceemmbbeerr 3311,, 22002200
(expressed in thousands of United States dollars, unless otherwise stated)
- 19 -
SCHEDULE 5
2019 Contributors
Contributors Total1/
Amounts made
available Amounts
utilised
Net Amounts available
Members Canada $61,702 $61,702 $51,890 $9,812 United Kingdom 292,974 292,974 50,191 242,783 Italy 522 522 252 270 China 677 677 270 407 Venezuela 586 586 - 586 Germany 476 476 405 71
356,937 356,937 103,008 253,929
Other contributors Caribbean Development Bank 265,636 265,636 195,913 69,723 United States of America 1,407 1,407 1,407 - Inter-American Development Bank 17,903 17,903 19,296 (1,393)2/ Nigeria 193 193 148 45 European Commission 33,261 33,261 25,704 7,557 European Investment Bank Climate Action Support 2,184 2,184 504 1,680 Agence Francaise de Developpement - - 16 (16)3/ Improve Public Investment Management through Procurement 320 320 320 -
Sub-total 320,904 320,904 243,308 77,596
Total – December 31 $677,841 $677,841 $346,316 $331,525
Summary Basic Needs Trust Fund $189,750 $189,750 $158,333 $31,417 Other resources 488,091 488,091 187,983 300,108
$677,841 $677,841 $346,316 $331,525
1/ Net of cancellation and resources fully utilized and expended in non-reimbursable operations. 2/ Expenditure to be reimbursed. 3/ Approved grant of EUR 3,000,000. Expenditure to be reimbursed.

239
CARIBBEAN DEVELOPMENT BANK ANNUAL REPORT 2020
232 233
CARIBBEAN DEVELOPMENT BANK ANNUAL REPORT 2020 CARIBBEAN DEVELOPMENT BANK ANNUAL REPORT 2020
CCAARRIIBBBBEEAANN DDEEVVEELLOOPPMMEENNTT BBAANNKK SSPPEECCIIAALL FFUUNNDDSS RREESSOOUURRCCEESS -- OOTTHHEERR SSPPEECCIIAALL FFUUNNDDSS
SSTTAATTEEMMEENNTT OOFF TTEECCHHNNIICCAALL AASSSSIISSTTAANNCCEE AANNDD OOTTHHEERR GGRRAANNTT RREESSOOUURRCCEESS AAss ooff DDeecceemmbbeerr 3311,, 22002200
(expressed in thousands of United States dollars, unless otherwise stated)
- 18 -
SCHEDULE 5
2020 Contributors
Contributors Total1/
Amounts made
available Amounts
utilised
Net Amounts available
Members Canada $83,796 $83,796 $67,094 $16,702 United Kingdom 303,143 303,143 74,293 228,850 Italy 522 522 252 270 China 677 677 270 407 Venezuela 586 586 - 586 Germany 496 496 498 (2)
389,220 389,220 142,407 246,813
Other contributors Caribbean Development Bank 275,639 275,639 210,593 $65,046 United States of America 1,407 1,407 1,407 - Inter-American Development Bank 26,455 26,455 23,662 2,793 Nigeria 193 193 148 45 European Commission 41,138 41,138 29,662 11,476 European Investment Bank Climate Action Support 2,184 2,184 590 $1,594 Agence Francaise de Developpement 1,172 1,172 150 $1,022 Improve Public Investment Management through Procurement
320
320
320
-
Sub-total 348,508 348,508 266,532 81,976
Total – December 31 $737,718 $737,728 $408,939 $328,789
Summary Basic Needs Trust Fund $199,750 $199,750 $170,928 $28,822 Other resources 537,978 $537,978 238,011 299,967
$737,718 $737,728 $408,939 $328,789
1/Net of cancellation and resources fully utilized and expended in non-reimbursable operations.
CCAARRIIBBBBEEAANN DDEEVVEELLOOPPMMEENNTT BBAANNKK SSPPEECCIIAALL FFUUNNDDSS RREESSOOUURRCCEESS -- OOTTHHEERR SSPPEECCIIAALL FFUUNNDDSS
SSTTAATTEEMMEENNTT OOFF TTEECCHHNNIICCAALL AASSSSIISSTTAANNCCEE AANNDD OOTTHHEERR GGRRAANNTT RREESSOOUURRCCEESS…continued AAss ooff DDeecceemmbbeerr 3311,, 22002200
(expressed in thousands of United States dollars, unless otherwise stated)
- 19 -
SCHEDULE 5
2019 Contributors
Contributors Total1/
Amounts made
available Amounts
utilised
Net Amounts available
Members Canada $61,702 $61,702 $51,890 $9,812 United Kingdom 292,974 292,974 50,191 242,783 Italy 522 522 252 270 China 677 677 270 407 Venezuela 586 586 - 586 Germany 476 476 405 71
356,937 356,937 103,008 253,929
Other contributors Caribbean Development Bank 265,636 265,636 195,913 69,723 United States of America 1,407 1,407 1,407 - Inter-American Development Bank 17,903 17,903 19,296 (1,393)2/ Nigeria 193 193 148 45 European Commission 33,261 33,261 25,704 7,557 European Investment Bank Climate Action Support 2,184 2,184 504 1,680 Agence Francaise de Developpement - - 16 (16)3/ Improve Public Investment Management through Procurement 320 320 320 -
Sub-total 320,904 320,904 243,308 77,596
Total – December 31 $677,841 $677,841 $346,316 $331,525
Summary Basic Needs Trust Fund $189,750 $189,750 $158,333 $31,417 Other resources 488,091 488,091 187,983 300,108
$677,841 $677,841 $346,316 $331,525
1/ Net of cancellation and resources fully utilized and expended in non-reimbursable operations. 2/ Expenditure to be reimbursed. 3/ Approved grant of EUR 3,000,000. Expenditure to be reimbursed.
240
CARIBBEAN DEVELOPMENT BANK ANNUAL REPORT 2020
234 235
CARIBBEAN DEVELOPMENT BANK ANNUAL REPORT 2020 CARIBBEAN DEVELOPMENT BANK ANNUAL REPORT 2020
CCAARRIIBBBBEEAANN DDEEVVEELLOOPPMMEENNTT BBAANNKK SSPPEECCIIAALL FFUUNNDDSS RREESSOOUURRCCEESS -- OOTTHHEERR SSPPEECCIIAALL FFUUNNDDSS
NNOOTTEESS TTOO TTHHEE FFIINNAANNCCIIAALL SSTTAATTEEMMEENNTTSS
FFOORR TTHHEE YYEEAARR EENNDDEEDD DDEECCEEMMBBEERR 3311,, 22002200
(expressed in thousands of United States dollars, unless otherwise stated)
- 20 -
1. NATURE OF OPERATIONS
The Other Special Fund Group (“OSF” or “the Fund”) was established to carry out the special operations of the Caribbean Development Bank (“the Bank”) by providing resources on concessional terms to assist borrowing members primarily for poverty reduction. Resources are provided by contributions from members and other contributors.
2. SUMMARY OF SIGNIFICANT ACCOUNTING POLICIES
Due to the nature of the OSF, these financial statements have been prepared for the specific purpose of reflecting the sources and applications of member subscriptions and contributions and other development resources. These financial statements are not intended to be presented in accordance with International Financial Reporting Standards (IFRS). These financial statements have been prepared in accordance with the accounting policies outlined below. Preparation of these financial statements requires management to make estimates and assumptions that affect the reported amounts of assets and liabilities and disclosure of contingent assets and liabilities at the date of the financial statements and the reported amounts of revenue and expenses during the reported period. Actual results could differ from these estimates.
Foreign currency translation Functional and presentation currency The functional and presentation currency of the Fund is the United States dollar (US$) and the Fund’s financial statements are rounded to the nearest thousand. Monetary assets and liabilities in currencies other than United States dollars are translated at market rates of exchange prevailing at the reporting date. Non-monetary items measured at historical cost in currencies other than United States dollars are translated using the exchange rates at the dates of the initial transactions. Foreign currency transactions are initially translated into United States dollars at applicable rates of exchange on the transaction dates. Any gains or losses arising as a result of differences in rates applied to income and expenses and to assets and liabilities are shown as an exchange gain or loss in profit or loss in the statement of comprehensive income and accumulated net income for the year.
Investments All investment securities with the exception of equities are in a portfolio designated at fair value through profit or loss and reported at fair market value. Securities are recognised on the statement of financial position when the Fund assumes related contractual rights and de-recognised when the rights to secure cash flows from the financial asset expire or when all risks and rewards of ownership have been substantially transferred. Equity instruments are carried at cost where they do not have a quoted market price in an active market and their fair value cannot be reliably measured.
CCAARRIIBBBBEEAANN DDEEVVEELLOOPPMMEENNTT BBAANNKK SSPPEECCIIAALL FFUUNNDDSS RREESSOOUURRCCEESS -- OOTTHHEERR SSPPEECCIIAALL FFUUNNDDSS
NNOOTTEESS TTOO TTHHEE FFIINNAANNCCIIAALL SSTTAATTEEMMEENNTTSS FFoorr tthhee yyeeaarr eennddeedd DDeecceemmbbeerr 3311,, 22002200
(expressed in thousands of United States dollars, unless otherwise stated)
- 21 -
2. SUMMARY OF SIGNIFICANT ACCOUNTING POLICIES…continued
Regular way purchases and sales of financial assets are recognised on the settlement date which is the date the Fund becomes a party to the contractual provisions of the instrument. All securities are initially recognised at fair value, and transaction costs are expensed in the statement of comprehensive income and accumulated net income in the period during which they arise. Gains and losses arising from changes in the fair value of securities designated at fair value through profit or loss are included in technical assistance (TA) contributions/expenses for the year based on the terms of the specific fund. Interest or dividend income earned whilst holding securities is reported as “Interest and similar income - investments and cash balances” in the statement of comprehensive income and accumulated net income. Equity investments are assessed for impairment annually. The impairment assessment is based on the net book value of the underlying asset and adjusted if the carrying value is less than the Fund’s proportionate share of net assets. Impairment losses are recorded within “Interest and similar income - investments and cash balances” in the statement of comprehensive income and accumulated net income. Amounts distributed to the Fund are recorded as a return on investment until such investments are disposed and recorded as gains or losses.
DDeetteerrmmiinnaattiioonn ooff ffaaiirr vvaalluuee For securities traded in active markets, the determination of fair values is based on quoted market prices or dealer price quotations. A security is regarded as quoted in an active market if prices are readily and regularly available from an exchange, dealer, broker, industry group, pricing service or regulatory agency, and those prices represent actual and regularly occurring market transactions on an arm’s length basis. If the above criteria are not met, the market is regarded as being inactive. For debt securities in inactive markets fair value is determined using valuation techniques. In these techniques, fair values are estimated from observable data in respect of similar financial instruments, using models to estimate the present value of expected future cash flows, or other valuation techniques, using inputs (for example, LIBOR yield curves, FX rates, volatilities and counterparty spreads) existing at the reporting date. The Fund uses widely recognised valuation models for determining fair values of non-standardised financial instruments. For these securities, inputs into models are generally market-observable. Loans Loans and receivables are non-derivative financial assets that have fixed or determinable payments that are not quoted in an active market. After initial measurement, loans and receivables are subsequently measured at amortised cost using the effective interest rate method less any impairment. All loans by the Fund are made either from currencies available from members’ subscriptions or from currencies borrowed and the principal amounts are payable to the Fund in the currencies lent. The balances outstanding on loans to members and their agencies are secured by guarantees of the Governments of the member countries in which the loans are made.

241
CARIBBEAN DEVELOPMENT BANK ANNUAL REPORT 2020
234 235
CARIBBEAN DEVELOPMENT BANK ANNUAL REPORT 2020 CARIBBEAN DEVELOPMENT BANK ANNUAL REPORT 2020
CCAARRIIBBBBEEAANN DDEEVVEELLOOPPMMEENNTT BBAANNKK SSPPEECCIIAALL FFUUNNDDSS RREESSOOUURRCCEESS -- OOTTHHEERR SSPPEECCIIAALL FFUUNNDDSS
NNOOTTEESS TTOO TTHHEE FFIINNAANNCCIIAALL SSTTAATTEEMMEENNTTSS
FFOORR TTHHEE YYEEAARR EENNDDEEDD DDEECCEEMMBBEERR 3311,, 22002200
(expressed in thousands of United States dollars, unless otherwise stated)
- 20 -
1. NATURE OF OPERATIONS
The Other Special Fund Group (“OSF” or “the Fund”) was established to carry out the special operations of the Caribbean Development Bank (“the Bank”) by providing resources on concessional terms to assist borrowing members primarily for poverty reduction. Resources are provided by contributions from members and other contributors.
2. SUMMARY OF SIGNIFICANT ACCOUNTING POLICIES
Due to the nature of the OSF, these financial statements have been prepared for the specific purpose of reflecting the sources and applications of member subscriptions and contributions and other development resources. These financial statements are not intended to be presented in accordance with International Financial Reporting Standards (IFRS). These financial statements have been prepared in accordance with the accounting policies outlined below. Preparation of these financial statements requires management to make estimates and assumptions that affect the reported amounts of assets and liabilities and disclosure of contingent assets and liabilities at the date of the financial statements and the reported amounts of revenue and expenses during the reported period. Actual results could differ from these estimates.
Foreign currency translation Functional and presentation currency The functional and presentation currency of the Fund is the United States dollar (US$) and the Fund’s financial statements are rounded to the nearest thousand. Monetary assets and liabilities in currencies other than United States dollars are translated at market rates of exchange prevailing at the reporting date. Non-monetary items measured at historical cost in currencies other than United States dollars are translated using the exchange rates at the dates of the initial transactions. Foreign currency transactions are initially translated into United States dollars at applicable rates of exchange on the transaction dates. Any gains or losses arising as a result of differences in rates applied to income and expenses and to assets and liabilities are shown as an exchange gain or loss in profit or loss in the statement of comprehensive income and accumulated net income for the year.
Investments All investment securities with the exception of equities are in a portfolio designated at fair value through profit or loss and reported at fair market value. Securities are recognised on the statement of financial position when the Fund assumes related contractual rights and de-recognised when the rights to secure cash flows from the financial asset expire or when all risks and rewards of ownership have been substantially transferred. Equity instruments are carried at cost where they do not have a quoted market price in an active market and their fair value cannot be reliably measured.
CCAARRIIBBBBEEAANN DDEEVVEELLOOPPMMEENNTT BBAANNKK SSPPEECCIIAALL FFUUNNDDSS RREESSOOUURRCCEESS -- OOTTHHEERR SSPPEECCIIAALL FFUUNNDDSS
NNOOTTEESS TTOO TTHHEE FFIINNAANNCCIIAALL SSTTAATTEEMMEENNTTSS FFoorr tthhee yyeeaarr eennddeedd DDeecceemmbbeerr 3311,, 22002200
(expressed in thousands of United States dollars, unless otherwise stated)
- 21 -
2. SUMMARY OF SIGNIFICANT ACCOUNTING POLICIES…continued
Regular way purchases and sales of financial assets are recognised on the settlement date which is the date the Fund becomes a party to the contractual provisions of the instrument. All securities are initially recognised at fair value, and transaction costs are expensed in the statement of comprehensive income and accumulated net income in the period during which they arise. Gains and losses arising from changes in the fair value of securities designated at fair value through profit or loss are included in technical assistance (TA) contributions/expenses for the year based on the terms of the specific fund. Interest or dividend income earned whilst holding securities is reported as “Interest and similar income - investments and cash balances” in the statement of comprehensive income and accumulated net income. Equity investments are assessed for impairment annually. The impairment assessment is based on the net book value of the underlying asset and adjusted if the carrying value is less than the Fund’s proportionate share of net assets. Impairment losses are recorded within “Interest and similar income - investments and cash balances” in the statement of comprehensive income and accumulated net income. Amounts distributed to the Fund are recorded as a return on investment until such investments are disposed and recorded as gains or losses.
DDeetteerrmmiinnaattiioonn ooff ffaaiirr vvaalluuee For securities traded in active markets, the determination of fair values is based on quoted market prices or dealer price quotations. A security is regarded as quoted in an active market if prices are readily and regularly available from an exchange, dealer, broker, industry group, pricing service or regulatory agency, and those prices represent actual and regularly occurring market transactions on an arm’s length basis. If the above criteria are not met, the market is regarded as being inactive. For debt securities in inactive markets fair value is determined using valuation techniques. In these techniques, fair values are estimated from observable data in respect of similar financial instruments, using models to estimate the present value of expected future cash flows, or other valuation techniques, using inputs (for example, LIBOR yield curves, FX rates, volatilities and counterparty spreads) existing at the reporting date. The Fund uses widely recognised valuation models for determining fair values of non-standardised financial instruments. For these securities, inputs into models are generally market-observable. Loans Loans and receivables are non-derivative financial assets that have fixed or determinable payments that are not quoted in an active market. After initial measurement, loans and receivables are subsequently measured at amortised cost using the effective interest rate method less any impairment. All loans by the Fund are made either from currencies available from members’ subscriptions or from currencies borrowed and the principal amounts are payable to the Fund in the currencies lent. The balances outstanding on loans to members and their agencies are secured by guarantees of the Governments of the member countries in which the loans are made.

242
CARIBBEAN DEVELOPMENT BANK ANNUAL REPORT 2020
236 237
CARIBBEAN DEVELOPMENT BANK ANNUAL REPORT 2020 CARIBBEAN DEVELOPMENT BANK ANNUAL REPORT 2020
CCAARRIIBBBBEEAANN DDEEVVEELLOOPPMMEENNTT BBAANNKK SSPPEECCIIAALL FFUUNNDDSS RREESSOOUURRCCEESS -- OOTTHHEERR SSPPEECCIIAALL FFUUNNDDSS
NNOOTTEESS TTOO TTHHEE FFIINNAANNCCIIAALL SSTTAATTEEMMEENNTTSS FFoorr tthhee yyeeaarr eennddeedd DDeecceemmbbeerr 3311,, 22002200
(expressed in thousands of United States dollars, unless otherwise stated)
- 22 -
2. SUMMARY OF SIGNIFICANT ACCOUNTING POLICIES…continued
The Fund is one of very few lenders of development and structural adjustment loans to Caribbean countries. There is no secondary market for development loans nor does the Fund intend to sell these loans. As a result, the use of market data to arrive at the fair value of loans will not yield any meaningful results. The Fund does not make provisions for impairment on loans as in the event of any such occurrences, the impairment would be taken into the statement of comprehensive income and accumulated net income in the year that it occurred. Cash and cash equivalents For the purposes of the statement of cash flows, cash and cash equivalents comprise balances with maturities of three months or less from the date of acquisition.
Technical assistance and grants Technical assistance and grants for capital projects to borrowing member countries are provided either from non-reimbursable grants received from contributors or from other resources specifically allocated for this purpose. The contributions from donors are included in the financial statements from the date of the contribution agreement. Technical assistance is recognised when the project is approved and becomes effective.
Interest income and charges on contributions Interest income and charges on contributions are recognised in the statement of comprehensive income and accumulated net income for all interest-bearing instruments carried at amortised cost using the effective interest rate method. The effective interest rate is the rate that exactly discounts estimated future cash payments or receipts through the expected life of the financial instrument or, when appropriate, a shorter period to the net carrying amount of the financial asset or financial liability. Administrative expenses Administrative expenses incurred by the Bank which cannot be directly charged to individual funds are allocated between the Ordinary Capital Resources (OCR), the Other Special Funds (OSF) and the Special Development Fund (SDF) in accordance with a method of allocation which is approved by the Board of Directors.
3. CASH AND CASH EQUIVALENTS
Cash and cash equivalents comprise: 2020 2019
Due from banks $45,660 $30,731 Time deposits - 5,682 Money Market Instruments 6,532 6,518
$52,192 $42,931
CCAARRIIBBBBEEAANN DDEEVVEELLOOPPMMEENNTT BBAANNKK SSPPEECCIIAALL FFUUNNDDSS RREESSOOUURRCCEESS -- OOTTHHEERR SSPPEECCIIAALL FFUUNNDDSS
NNOOTTEESS TTOO TTHHEE FFIINNAANNCCIIAALL SSTTAATTEEMMEENNTTSS FFoorr tthhee yyeeaarr eennddeedd DDeecceemmbbeerr 3311,, 22002200
(expressed in thousands of United States dollars, unless otherwise stated)
- 23 -
4. INVESTMENTS
As part of its overall portfolio management strategy, the Fund invests in Government agency, supranational and bank obligations, including time deposits. The Fund limits its activities of investing in securities to well established dealers and counterparties meeting minimum credit rating standards set by the Fund. The annualized rate of return on the average investments held during the year, including realised and unrealised gains and losses was 1.31%. Net realised gains on investments traded during 2020 amounted to $38 and net unrealised gains $295.
5. FUNDS
In accordance with the Agreement establishing the Bank (the Charter), Special Funds Resources comprise the SDF and OSF established or administered by the Bank, including technical assistance and other grant resources contributed on a non-reimbursable basis. For the purposes of these financial statements, the OSF have been presented separately from the SDF. The OSF are established in accordance with agreements between the Bank and the contributors and are for specific types of projects as agreed between the Bank and the contributors. In accordance with the Agreement, each Special Fund, its resources and accounts are kept entirely separate from other Special Funds, their resources and accounts. These financial statements reflect the aggregated position of all the funds that comprise the OSF. Technical assistance and other grant resources include resources for the Basic Needs Trust Fund and other resources established for specific purposes as determined between the Bank and contributors.

243
CARIBBEAN DEVELOPMENT BANK ANNUAL REPORT 2020
236 237
CARIBBEAN DEVELOPMENT BANK ANNUAL REPORT 2020 CARIBBEAN DEVELOPMENT BANK ANNUAL REPORT 2020
CCAARRIIBBBBEEAANN DDEEVVEELLOOPPMMEENNTT BBAANNKK SSPPEECCIIAALL FFUUNNDDSS RREESSOOUURRCCEESS -- OOTTHHEERR SSPPEECCIIAALL FFUUNNDDSS
NNOOTTEESS TTOO TTHHEE FFIINNAANNCCIIAALL SSTTAATTEEMMEENNTTSS FFoorr tthhee yyeeaarr eennddeedd DDeecceemmbbeerr 3311,, 22002200
(expressed in thousands of United States dollars, unless otherwise stated)
- 22 -
2. SUMMARY OF SIGNIFICANT ACCOUNTING POLICIES…continued
The Fund is one of very few lenders of development and structural adjustment loans to Caribbean countries. There is no secondary market for development loans nor does the Fund intend to sell these loans. As a result, the use of market data to arrive at the fair value of loans will not yield any meaningful results. The Fund does not make provisions for impairment on loans as in the event of any such occurrences, the impairment would be taken into the statement of comprehensive income and accumulated net income in the year that it occurred. Cash and cash equivalents For the purposes of the statement of cash flows, cash and cash equivalents comprise balances with maturities of three months or less from the date of acquisition.
Technical assistance and grants Technical assistance and grants for capital projects to borrowing member countries are provided either from non-reimbursable grants received from contributors or from other resources specifically allocated for this purpose. The contributions from donors are included in the financial statements from the date of the contribution agreement. Technical assistance is recognised when the project is approved and becomes effective.
Interest income and charges on contributions Interest income and charges on contributions are recognised in the statement of comprehensive income and accumulated net income for all interest-bearing instruments carried at amortised cost using the effective interest rate method. The effective interest rate is the rate that exactly discounts estimated future cash payments or receipts through the expected life of the financial instrument or, when appropriate, a shorter period to the net carrying amount of the financial asset or financial liability. Administrative expenses Administrative expenses incurred by the Bank which cannot be directly charged to individual funds are allocated between the Ordinary Capital Resources (OCR), the Other Special Funds (OSF) and the Special Development Fund (SDF) in accordance with a method of allocation which is approved by the Board of Directors.
3. CASH AND CASH EQUIVALENTS
Cash and cash equivalents comprise: 2020 2019
Due from banks $45,660 $30,731 Time deposits - 5,682 Money Market Instruments 6,532 6,518
$52,192 $42,931
CCAARRIIBBBBEEAANN DDEEVVEELLOOPPMMEENNTT BBAANNKK SSPPEECCIIAALL FFUUNNDDSS RREESSOOUURRCCEESS -- OOTTHHEERR SSPPEECCIIAALL FFUUNNDDSS
NNOOTTEESS TTOO TTHHEE FFIINNAANNCCIIAALL SSTTAATTEEMMEENNTTSS FFoorr tthhee yyeeaarr eennddeedd DDeecceemmbbeerr 3311,, 22002200
(expressed in thousands of United States dollars, unless otherwise stated)
- 23 -
4. INVESTMENTS
As part of its overall portfolio management strategy, the Fund invests in Government agency, supranational and bank obligations, including time deposits. The Fund limits its activities of investing in securities to well established dealers and counterparties meeting minimum credit rating standards set by the Fund. The annualized rate of return on the average investments held during the year, including realised and unrealised gains and losses was 1.31%. Net realised gains on investments traded during 2020 amounted to $38 and net unrealised gains $295.
5. FUNDS
In accordance with the Agreement establishing the Bank (the Charter), Special Funds Resources comprise the SDF and OSF established or administered by the Bank, including technical assistance and other grant resources contributed on a non-reimbursable basis. For the purposes of these financial statements, the OSF have been presented separately from the SDF. The OSF are established in accordance with agreements between the Bank and the contributors and are for specific types of projects as agreed between the Bank and the contributors. In accordance with the Agreement, each Special Fund, its resources and accounts are kept entirely separate from other Special Funds, their resources and accounts. These financial statements reflect the aggregated position of all the funds that comprise the OSF. Technical assistance and other grant resources include resources for the Basic Needs Trust Fund and other resources established for specific purposes as determined between the Bank and contributors.

244
CARIBBEAN DEVELOPMENT BANK ANNUAL REPORT 2020
238 239
CARIBBEAN DEVELOPMENT BANK ANNUAL REPORT 2020 CARIBBEAN DEVELOPMENT BANK ANNUAL REPORT 2020
CCAARRIIBBBBEEAANN DDEEVVEELLOOPPMMEENNTT BBAANNKK SSPPEECCIIAALL FFUUNNDDSS RREESSOOUURRCCEESS -- OOTTHHEERR SSPPEECCIIAALL FFUUNNDDSS
NNOOTTEESS TTOO TTHHEE FFIINNAANNCCIIAALL SSTTAATTEEMMEENNTTSS
FFOORR TTHHEE YYEEAARR EENNDDEEDD DDEECCEEMMBBEERR 3311,, 22002200
(expressed in thousands of United States dollars, unless otherwise stated)
- 24 -
5. FUNDS…continued
Details of contributions, loans and technical assistance resources of the OSF are stated at the equivalent in thousands of United States dollars where such contributions, loans and technical assistance grants have been made in currencies other than United States dollars and are as follows:
2020 2019 Canada Agricultural1/ (Schedule 3) $6,570 $6,538 Technical assistance resources (Schedule 5) 83,796 61,702
Italy Technical assistance resources (Schedule 5) $522 $522
China Technical assistance resources (Schedule 5) $677 $677
Venezuela Technical assistance resources (Schedule 5) $586 $586
Nigeria Technical assistance resources (Schedule 5) $193 $193
United Kingdom Technical assistance resources (Schedule 5) $303,143 $292,974
Inter-American Development Bank 975/SF-RG $14,211 $14,211 Less repayments (7,717) (7,298)
$6,494 $6,913
1108/SF-RG Global Credit $20,000 $20,000 Less repayments (5,573) (4,917)
$14,427 $15,083
1/ The contributions are interest-free with no date for repayment.
CCAARRIIBBBBEEAANN DDEEVVEELLOOPPMMEENNTT BBAANNKK SSPPEECCIIAALL FFUUNNDDSS RREESSOOUURRCCEESS -- OOTTHHEERR SSPPEECCIIAALL FFUUNNDDSS
NNOOTTEESS TTOO TTHHEE FFIINNAANNCCIIAALL SSTTAATTEEMMEENNTTSS FFoorr tthhee yyeeaarr eennddeedd DDeecceemmbbeerr 3311,, 22002200
(expressed in thousands of United States dollars, unless otherwise stated)
- 25 -
5. FUNDS…continued
Inter-American Development Bank…continued2020 2019
1637/SF-RG Credit $9,923 $9,923 Less repayments (1,654) (1,323) 8,269 8,600 2798/BL Regional Global Loan - OECS 5,058 4,597 Repayable contributions (Schedule 3) $34,248 $35,193 Technical assistance resources (Schedule 5) $26,455 $17,903
Loan 975/SF-RG is subject to interest at the rate of 1% per annum until 2006 and thereafter at 2% per annum and is repayable during the period 2003 to 2036. Global Credit 1108/SF-RG was subject to interest at the rate of 1% for the first ten years and 2% thereafter and is repayable during the period 2012 to 2042. Grenada Reconstruction 1637/SF-RG is subject to interest at the rate of 1% per annum until 2015 and thereafter at 2% per annum and is repayable during the period 2016 to 2045. 2798/BL Regional Global Loan is subject to interest at the rate of 0.5% fixed and is repayable in 2053. The loans are subject to a credit fee of 0.5% per annum on any undrawn balance.

245
CARIBBEAN DEVELOPMENT BANK ANNUAL REPORT 2020
238 239
CARIBBEAN DEVELOPMENT BANK ANNUAL REPORT 2020 CARIBBEAN DEVELOPMENT BANK ANNUAL REPORT 2020
CCAARRIIBBBBEEAANN DDEEVVEELLOOPPMMEENNTT BBAANNKK SSPPEECCIIAALL FFUUNNDDSS RREESSOOUURRCCEESS -- OOTTHHEERR SSPPEECCIIAALL FFUUNNDDSS
NNOOTTEESS TTOO TTHHEE FFIINNAANNCCIIAALL SSTTAATTEEMMEENNTTSS
FFOORR TTHHEE YYEEAARR EENNDDEEDD DDEECCEEMMBBEERR 3311,, 22002200
(expressed in thousands of United States dollars, unless otherwise stated)
- 24 -
5. FUNDS…continued
Details of contributions, loans and technical assistance resources of the OSF are stated at the equivalent in thousands of United States dollars where such contributions, loans and technical assistance grants have been made in currencies other than United States dollars and are as follows:
2020 2019 Canada Agricultural1/ (Schedule 3) $6,570 $6,538 Technical assistance resources (Schedule 5) 83,796 61,702
Italy Technical assistance resources (Schedule 5) $522 $522
China Technical assistance resources (Schedule 5) $677 $677
Venezuela Technical assistance resources (Schedule 5) $586 $586
Nigeria Technical assistance resources (Schedule 5) $193 $193
United Kingdom Technical assistance resources (Schedule 5) $303,143 $292,974
Inter-American Development Bank 975/SF-RG $14,211 $14,211 Less repayments (7,717) (7,298)
$6,494 $6,913
1108/SF-RG Global Credit $20,000 $20,000 Less repayments (5,573) (4,917)
$14,427 $15,083
1/ The contributions are interest-free with no date for repayment.
CCAARRIIBBBBEEAANN DDEEVVEELLOOPPMMEENNTT BBAANNKK SSPPEECCIIAALL FFUUNNDDSS RREESSOOUURRCCEESS -- OOTTHHEERR SSPPEECCIIAALL FFUUNNDDSS
NNOOTTEESS TTOO TTHHEE FFIINNAANNCCIIAALL SSTTAATTEEMMEENNTTSS FFoorr tthhee yyeeaarr eennddeedd DDeecceemmbbeerr 3311,, 22002200
(expressed in thousands of United States dollars, unless otherwise stated)
- 25 -
5. FUNDS…continued
Inter-American Development Bank…continued2020 2019
1637/SF-RG Credit $9,923 $9,923 Less repayments (1,654) (1,323) 8,269 8,600 2798/BL Regional Global Loan - OECS 5,058 4,597 Repayable contributions (Schedule 3) $34,248 $35,193 Technical assistance resources (Schedule 5) $26,455 $17,903
Loan 975/SF-RG is subject to interest at the rate of 1% per annum until 2006 and thereafter at 2% per annum and is repayable during the period 2003 to 2036. Global Credit 1108/SF-RG was subject to interest at the rate of 1% for the first ten years and 2% thereafter and is repayable during the period 2012 to 2042. Grenada Reconstruction 1637/SF-RG is subject to interest at the rate of 1% per annum until 2015 and thereafter at 2% per annum and is repayable during the period 2016 to 2045. 2798/BL Regional Global Loan is subject to interest at the rate of 0.5% fixed and is repayable in 2053. The loans are subject to a credit fee of 0.5% per annum on any undrawn balance.
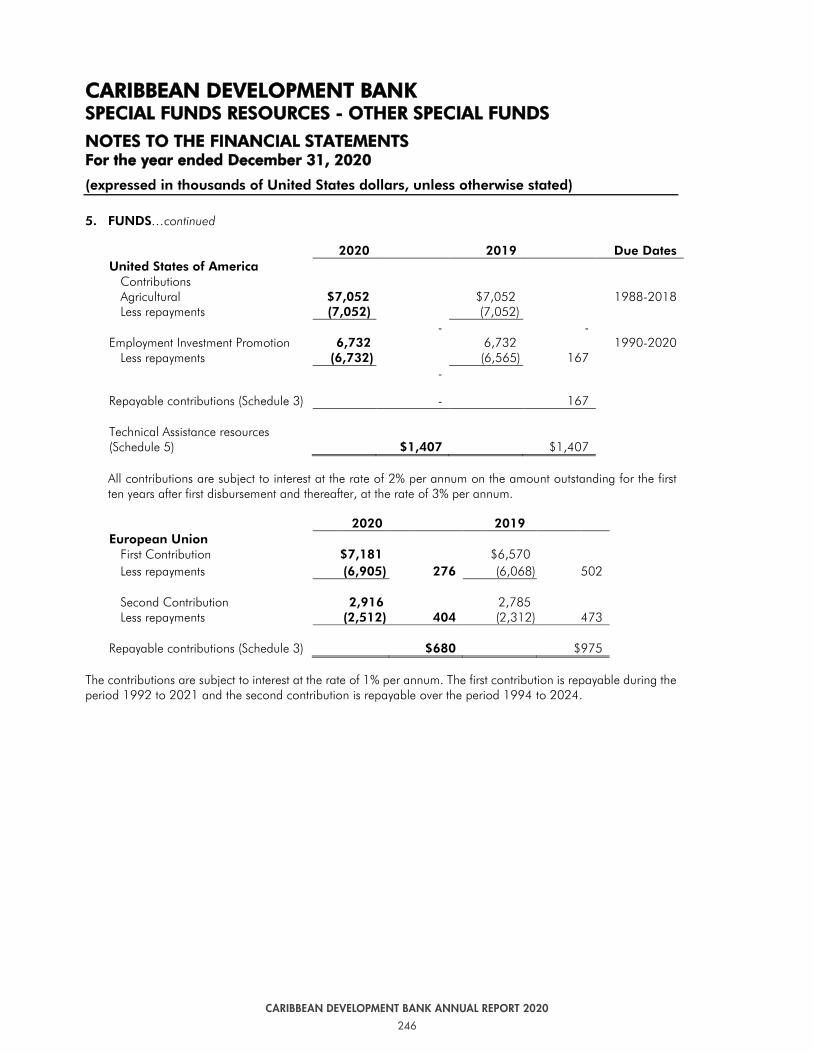
246
CARIBBEAN DEVELOPMENT BANK ANNUAL REPORT 2020
240 241
CARIBBEAN DEVELOPMENT BANK ANNUAL REPORT 2020 CARIBBEAN DEVELOPMENT BANK ANNUAL REPORT 2020
CCAARRIIBBBBEEAANN DDEEVVEELLOOPPMMEENNTT BBAANNKK SSPPEECCIIAALL FFUUNNDDSS RREESSOOUURRCCEESS -- OOTTHHEERR SSPPEECCIIAALL FFUUNNDDSS
NNOOTTEESS TTOO TTHHEE FFIINNAANNCCIIAALL SSTTAATTEEMMEENNTTSS FFoorr tthhee yyeeaarr eennddeedd DDeecceemmbbeerr 3311,, 22002200
(expressed in thousands of United States dollars, unless otherwise stated)
- 26 -
5. FUNDS…continued
2020 2019 Due Dates United States of America
Contributions Agricultural $7,052 $7,052 1988-2018 Less repayments (7,052) (7,052)
- - Employment Investment Promotion 6,732 6,732 1990-2020
Less repayments (6,732) (6,565) 167 -
Repayable contributions (Schedule 3) - 167 Technical Assistance resources (Schedule 5) $1,407 $1,407
All contributions are subject to interest at the rate of 2% per annum on the amount outstanding for the first ten years after first disbursement and thereafter, at the rate of 3% per annum.
2020 2019 European Union
First Contribution $7,181 $6,570 Less repayments (6,905) 276 (6,068) 502
Second Contribution 2,916 2,785 Less repayments (2,512) 404 (2,312) 473
Repayable contributions (Schedule 3) $680 $975
The contributions are subject to interest at the rate of 1% per annum. The first contribution is repayable during the period 1992 to 2021 and the second contribution is repayable over the period 1994 to 2024.
CCAARRIIBBBBEEAANN DDEEVVEELLOOPPMMEENNTT BBAANNKK SSPPEECCIIAALL FFUUNNDDSS RREESSOOUURRCCEESS -- OOTTHHEERR SSPPEECCIIAALL FFUUNNDDSS
NNOOTTEESS TTOO TTHHEE FFIINNAANNCCIIAALL SSTTAATTEEMMEENNTTSS FFoorr tthhee yyeeaarr eennddeedd DDeecceemmbbeerr 3311,, 22002200
(expressed in thousands of United States dollars, unless otherwise stated)
- 27 -
5. FUNDS…continued
International Development Association 2020 2019 Due dates
Credit No. 960/CRG $6,480
$6,480
1990-2029
Less repayments (4,730) 1,750 (4,536) 1,944 Credit No. 1364/CRG 7,813 7,501 Less repayments (4,883) 2,930 (4,463) 3,038 1993-2033 Credit No. 1785/CRG 6,673 6,407 Less repayments (3,370) 3,303 (3,043) 3,364 1997-2030 Credit No. 2135/CRG 8,023 7,702 Less repayments (4,974) 3,049 (4,467) 3,235 2000-2030 Repayable contributions (Schedule 3)
$11,032 $11,581
The credits are subject to a service charge of 0.75% per annum on amounts outstanding.
2020 2019 Caribbean Development Bank Technical assistance resources (Schedule 5) $275,639 $265,636
BMZ/ The Federal Government of Germany
Technical assistance resources (Schedule 5) $496 $476
European Investment Bank Climate Action SupportTechnical assistance resources (Schedule 5) $2,184 $2,184
European Commission Technical assistance resources (Schedule 5) $41,138 $33,261

247
CARIBBEAN DEVELOPMENT BANK ANNUAL REPORT 2020
240 241
CARIBBEAN DEVELOPMENT BANK ANNUAL REPORT 2020 CARIBBEAN DEVELOPMENT BANK ANNUAL REPORT 2020
CCAARRIIBBBBEEAANN DDEEVVEELLOOPPMMEENNTT BBAANNKK SSPPEECCIIAALL FFUUNNDDSS RREESSOOUURRCCEESS -- OOTTHHEERR SSPPEECCIIAALL FFUUNNDDSS
NNOOTTEESS TTOO TTHHEE FFIINNAANNCCIIAALL SSTTAATTEEMMEENNTTSS FFoorr tthhee yyeeaarr eennddeedd DDeecceemmbbeerr 3311,, 22002200
(expressed in thousands of United States dollars, unless otherwise stated)
- 26 -
5. FUNDS…continued
2020 2019 Due Dates United States of America
Contributions Agricultural $7,052 $7,052 1988-2018 Less repayments (7,052) (7,052)
- - Employment Investment Promotion 6,732 6,732 1990-2020
Less repayments (6,732) (6,565) 167 -
Repayable contributions (Schedule 3) - 167 Technical Assistance resources (Schedule 5) $1,407 $1,407
All contributions are subject to interest at the rate of 2% per annum on the amount outstanding for the first ten years after first disbursement and thereafter, at the rate of 3% per annum.
2020 2019 European Union
First Contribution $7,181 $6,570 Less repayments (6,905) 276 (6,068) 502
Second Contribution 2,916 2,785 Less repayments (2,512) 404 (2,312) 473
Repayable contributions (Schedule 3) $680 $975
The contributions are subject to interest at the rate of 1% per annum. The first contribution is repayable during the period 1992 to 2021 and the second contribution is repayable over the period 1994 to 2024.
CCAARRIIBBBBEEAANN DDEEVVEELLOOPPMMEENNTT BBAANNKK SSPPEECCIIAALL FFUUNNDDSS RREESSOOUURRCCEESS -- OOTTHHEERR SSPPEECCIIAALL FFUUNNDDSS
NNOOTTEESS TTOO TTHHEE FFIINNAANNCCIIAALL SSTTAATTEEMMEENNTTSS FFoorr tthhee yyeeaarr eennddeedd DDeecceemmbbeerr 3311,, 22002200
(expressed in thousands of United States dollars, unless otherwise stated)
- 27 -
5. FUNDS…continued
International Development Association 2020 2019 Due dates
Credit No. 960/CRG $6,480
$6,480
1990-2029
Less repayments (4,730) 1,750 (4,536) 1,944 Credit No. 1364/CRG 7,813 7,501 Less repayments (4,883) 2,930 (4,463) 3,038 1993-2033 Credit No. 1785/CRG 6,673 6,407 Less repayments (3,370) 3,303 (3,043) 3,364 1997-2030 Credit No. 2135/CRG 8,023 7,702 Less repayments (4,974) 3,049 (4,467) 3,235 2000-2030 Repayable contributions (Schedule 3)
$11,032 $11,581
The credits are subject to a service charge of 0.75% per annum on amounts outstanding.
2020 2019 Caribbean Development Bank Technical assistance resources (Schedule 5) $275,639 $265,636
BMZ/ The Federal Government of Germany
Technical assistance resources (Schedule 5) $496 $476
European Investment Bank Climate Action SupportTechnical assistance resources (Schedule 5) $2,184 $2,184
European Commission Technical assistance resources (Schedule 5) $41,138 $33,261

248
CARIBBEAN DEVELOPMENT BANK ANNUAL REPORT 2020
242 243
CARIBBEAN DEVELOPMENT BANK ANNUAL REPORT 2020 CARIBBEAN DEVELOPMENT BANK ANNUAL REPORT 2020
CCAARRIIBBBBEEAANN DDEEVVEELLOOPPMMEENNTT BBAANNKK SSPPEECCIIAALL FFUUNNDDSS RREESSOOUURRCCEESS -- OOTTHHEERR SSPPEECCIIAALL FFUUNNDDSS
NNOOTTEESS TTOO TTHHEE FFIINNAANNCCIIAALL SSTTAATTEEMMEENNTTSS FFoorr tthhee yyeeaarr eennddeedd DDeecceemmbbeerr 3311,, 22002200
(expressed in thousands of United States dollars, unless otherwise stated)
- 28 -
5. FUNDS…continued
2020 2019 Improve Public Investment Management through Procurement Technical assistance resources (Schedule 5) $320 $320
Included in the amounts shown against each contributor in Schedule 5 – “Statement of Technical Assistance & Other Grant Resources” are the following programmes for which specific disclosures are included in these financial statements.
2020
Approved amount
Amounts made
available Amounts
utilised
Net Amounts available
European Union Sustainable Energy for the Eastern Caribbean (SEEC) €4,450 $4,477 $1,115 $3,362 Geothermal Risk Mitigation for the Eastern Caribbean (EU-CIF) €12,350 $6,849 $6,517 $332
United Kingdom Increasing Renewable Energy and Energy Efficiency in the Eastern Caribbean £4,305 $5,873 $5,790 $83 Sustainable Energy for the Eastern Caribbean (SEEC) £2,500 $2,200 $1,014 $1,186
Inter-American Development Bank [Acting as Administrator for the Global Environment Facility (GEF)] Sustainable Energy Facility for the Eastern Caribbean (SEF) $3,014 $1,856 $1,258 $598
Inter-American Development Bank [Acting as Implementing entity for the Clean Technology Fund (CTF)] Sustainable Energy Facility for the Eastern Caribbean (SEF) $19,050 $19,050 $19,050 $-
Canada Canadian Support to the Energy Sector in the Caribbean Fund (CSES-C) CAD5,000 $3,841 $2,091 $1,750
CCAARRIIBBBBEEAANN DDEEVVEELLOOPPMMEENNTT BBAANNKK SSPPEECCIIAALL FFUUNNDDSS RREESSOOUURRCCEESS -- OOTTHHEERR SSPPEECCIIAALL FFUUNNDDSS
NNOOTTEESS TTOO TTHHEE FFIINNAANNCCIIAALL SSTTAATTEEMMEENNTTSS FFoorr tthhee yyeeaarr eennddeedd DDeecceemmbbeerr 3311,, 22002200
(expressed in thousands of United States dollars, unless otherwise stated)
- 29 -
5. FUNDS…continued
2019
Approved amount
Amounts made
available Amounts
utilised
Net Amounts available
European Union Sustainable Energy for the Eastern Caribbean (SEEC) €4,450 $1,303 $1,038 $265 Geothermal Risk Mitigation for the Eastern Caribbean (EU-CIF) €12,350 $3,473 $5,995 $(2,522)1/
United Kingdom Increasing Renewable Energy and Energy Efficiency in the Eastern Caribbean £4,200 $5,681 $5,354 $327 Sustainable Energy for the Eastern Caribbean (SEEC) £2,500 $1,597 $975 $622
Inter-American Development Bank [Acting as Administrator for the Global Environment Facility (GEF)] Sustainable Energy Facility for the Eastern Caribbean (SEF) $3,014 $346 $442 $(96)
Inter-American Development Bank [Acting as Implementing entity for the Clean Technology Fund (CTF)] Sustainable Energy Facility for the Eastern Caribbean (SEF) $19,050 $14,008 $15,500 $(1,492)
Canada Canadian Support to the Energy Sector in the Caribbean Fund (CSES-C) CAD5,000 $2,605 $1,507 $1,098
1/ Expenditure to be reimbursed.
6. TOTAL ACCUMULATED INCOME AND TOTAL COMPREHENSIVE INCOME FOR THE YEAR On an annual basis the Board of Governors determine the disposition of the accumulated net income and net income for the current year of each of the OSF, subject to any rules and regulations governing each Fund and any agreement relating thereto.

249
CARIBBEAN DEVELOPMENT BANK ANNUAL REPORT 2020
242 243
CARIBBEAN DEVELOPMENT BANK ANNUAL REPORT 2020 CARIBBEAN DEVELOPMENT BANK ANNUAL REPORT 2020
CCAARRIIBBBBEEAANN DDEEVVEELLOOPPMMEENNTT BBAANNKK SSPPEECCIIAALL FFUUNNDDSS RREESSOOUURRCCEESS -- OOTTHHEERR SSPPEECCIIAALL FFUUNNDDSS
NNOOTTEESS TTOO TTHHEE FFIINNAANNCCIIAALL SSTTAATTEEMMEENNTTSS FFoorr tthhee yyeeaarr eennddeedd DDeecceemmbbeerr 3311,, 22002200
(expressed in thousands of United States dollars, unless otherwise stated)
- 28 -
5. FUNDS…continued
2020 2019 Improve Public Investment Management through Procurement Technical assistance resources (Schedule 5) $320 $320
Included in the amounts shown against each contributor in Schedule 5 – “Statement of Technical Assistance & Other Grant Resources” are the following programmes for which specific disclosures are included in these financial statements.
2020
Approved amount
Amounts made
available Amounts
utilised
Net Amounts available
European Union Sustainable Energy for the Eastern Caribbean (SEEC) €4,450 $4,477 $1,115 $3,362 Geothermal Risk Mitigation for the Eastern Caribbean (EU-CIF) €12,350 $6,849 $6,517 $332
United Kingdom Increasing Renewable Energy and Energy Efficiency in the Eastern Caribbean £4,305 $5,873 $5,790 $83 Sustainable Energy for the Eastern Caribbean (SEEC) £2,500 $2,200 $1,014 $1,186
Inter-American Development Bank [Acting as Administrator for the Global Environment Facility (GEF)] Sustainable Energy Facility for the Eastern Caribbean (SEF) $3,014 $1,856 $1,258 $598
Inter-American Development Bank [Acting as Implementing entity for the Clean Technology Fund (CTF)] Sustainable Energy Facility for the Eastern Caribbean (SEF) $19,050 $19,050 $19,050 $-
Canada Canadian Support to the Energy Sector in the Caribbean Fund (CSES-C) CAD5,000 $3,841 $2,091 $1,750
CCAARRIIBBBBEEAANN DDEEVVEELLOOPPMMEENNTT BBAANNKK SSPPEECCIIAALL FFUUNNDDSS RREESSOOUURRCCEESS -- OOTTHHEERR SSPPEECCIIAALL FFUUNNDDSS
NNOOTTEESS TTOO TTHHEE FFIINNAANNCCIIAALL SSTTAATTEEMMEENNTTSS FFoorr tthhee yyeeaarr eennddeedd DDeecceemmbbeerr 3311,, 22002200
(expressed in thousands of United States dollars, unless otherwise stated)
- 29 -
5. FUNDS…continued
2019
Approved amount
Amounts made
available Amounts
utilised
Net Amounts available
European Union Sustainable Energy for the Eastern Caribbean (SEEC) €4,450 $1,303 $1,038 $265 Geothermal Risk Mitigation for the Eastern Caribbean (EU-CIF) €12,350 $3,473 $5,995 $(2,522)1/
United Kingdom Increasing Renewable Energy and Energy Efficiency in the Eastern Caribbean £4,200 $5,681 $5,354 $327 Sustainable Energy for the Eastern Caribbean (SEEC) £2,500 $1,597 $975 $622
Inter-American Development Bank [Acting as Administrator for the Global Environment Facility (GEF)] Sustainable Energy Facility for the Eastern Caribbean (SEF) $3,014 $346 $442 $(96)
Inter-American Development Bank [Acting as Implementing entity for the Clean Technology Fund (CTF)] Sustainable Energy Facility for the Eastern Caribbean (SEF) $19,050 $14,008 $15,500 $(1,492)
Canada Canadian Support to the Energy Sector in the Caribbean Fund (CSES-C) CAD5,000 $2,605 $1,507 $1,098
1/ Expenditure to be reimbursed.
6. TOTAL ACCUMULATED INCOME AND TOTAL COMPREHENSIVE INCOME FOR THE YEAR On an annual basis the Board of Governors determine the disposition of the accumulated net income and net income for the current year of each of the OSF, subject to any rules and regulations governing each Fund and any agreement relating thereto.
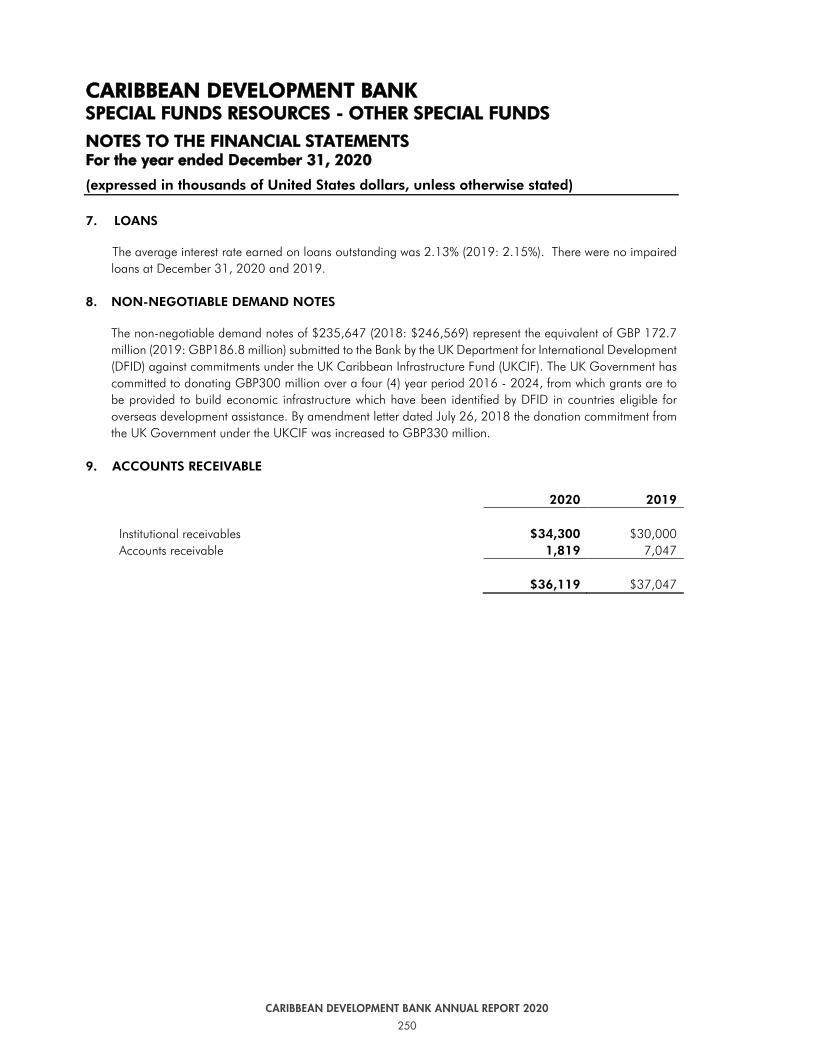
250
CARIBBEAN DEVELOPMENT BANK ANNUAL REPORT 2020 CARIBBEAN DEVELOPMENT BANK ANNUAL REPORT 2020 | 245
244
CARIBBEAN DEVELOPMENT BANK ANNUAL REPORT 2020
CCAARRIIBBBBEEAANN DDEEVVEELLOOPPMMEENNTT BBAANNKK SSPPEECCIIAALL FFUUNNDDSS RREESSOOUURRCCEESS -- OOTTHHEERR SSPPEECCIIAALL FFUUNNDDSS
NNOOTTEESS TTOO TTHHEE FFIINNAANNCCIIAALL SSTTAATTEEMMEENNTTSS FFoorr tthhee yyeeaarr eennddeedd DDeecceemmbbeerr 3311,, 22002200
(expressed in thousands of United States dollars, unless otherwise stated)
- 30 -
7. LOANS
The average interest rate earned on loans outstanding was 2.13% (2019: 2.15%). There were no impaired loans at December 31, 2020 and 2019.
8. NON-NEGOTIABLE DEMAND NOTES
The non-negotiable demand notes of $235,647 (2018: $246,569) represent the equivalent of GBP 172.7 million (2019: GBP186.8 million) submitted to the Bank by the UK Department for International Development (DFID) against commitments under the UK Caribbean Infrastructure Fund (UKCIF). The UK Government has committed to donating GBP300 million over a four (4) year period 2016 - 2024, from which grants are to be provided to build economic infrastructure which have been identified by DFID in countries eligible for overseas development assistance. By amendment letter dated July 26, 2018 the donation commitment from the UK Government under the UKCIF was increased to GBP330 million.
9. ACCOUNTS RECEIVABLE
2020 2019
Institutional receivables $34,300 $30,000 Accounts receivable 1,819 7,047
$36,119 $37,047
APPENDICES
BOARD OF GOVERNORS
CHAIR AND VICE-CHAIR 2020-2021
Barbados Hon. Mia Amor Mottley, QC, MP Chairman
People’s Republic of China Mr. Yi Gang Vice-Chairman
Mexico Mr. Arturo Herrera Gutiérrez Vice-Chairman
COUNTRY GOVERNOR ALTERNATE GOVERNOR
Anguilla, Cayman Islands, Montserrat, Turks and Caicos Islands and Virgin Islands,
Dr. the Hon. Ellis Lorenzo WebsterPremier and Minister of Finance and HealthOf� ce of the PremierGovernment Headquarters
Antigua and Barbuda Hon. Gaston A. BrownePrime Minister and Minister of Finance and Corporate Governance Of� ce of the Prime MinisterGovernment ComplexQueen Elizabeth Highway, St. John's
Mr. Whit� eld Harris, Jr.Financial SecretaryOf� ce of the Financial Secretary,Ministry of Finance, the Economy and Public AdministrationParliament DriveSt. John's
Bahamas Sen. the Hon. James Kwasi ThompsonMinister of State for FinanceMinistry of FinanceP.O. Box N-3017Cable BeachNassau

CARIBBEAN DEVELOPMENT BANK ANNUAL REPORT 2020 | 251
APPENDICES
BOARD OF GOVERNORS
CHAIR AND VICE-CHAIR 2020-2021
Barbados Hon. Mia Amor Mottley, QC, MP Chairman
People’s Republic of China Mr. Yi Gang Vice-Chairman
Mexico Mr. Arturo Herrera Gutiérrez Vice-Chairman
COUNTRY GOVERNOR ALTERNATE GOVERNOR
Anguilla, Cayman Islands, Montserrat, Turks and Caicos Islands and Virgin Islands,
Dr. the Hon. Ellis Lorenzo WebsterPremier and Minister of Finance and HealthOffice of the PremierGovernment Headquarters
Antigua and Barbuda Hon. Gaston A. BrownePrime Minister and Minister of Finance and Corporate Governance Office of the Prime MinisterGovernment ComplexQueen Elizabeth Highway, St. John's
Mr. Whitfield Harris, Jr.Financial SecretaryOffice of the Financial Secretary,Ministry of Finance, the Economy and Public AdministrationParliament DriveSt. John's
Bahamas Sen. the Hon. James Kwasi ThompsonMinister of State for FinanceMinistry of FinanceP.O. Box N-3017Cable BeachNassau

CARIBBEAN DEVELOPMENT BANK ANNUAL REPORT 2020 | 252
COUNTRY GOVERNOR ALTERNATE GOVERNOR
Barbados Hon. Mia Amor Mottley, Q.C., M.PPrime Minister and Minister of Finance, Economic Affairs and InvestmentOffice of the Prime MinisterGovernment HeadquartersBay StreetSt. Michael
Mr. Ian St. C. CarringtonDirector of Finance and Economic AffairsMinistry of Finance, Economic Affairs and Investment Government HeadquartersBay Street, St. Michael
Belize Hon. John Antonio BriceñoPrime Minister and Minister of Finance, Economic Development and InvestmentOffice of the Prime MinisterNew Administration BuildingBelmopan
Hon. Christopher CoyeMinister of StateMinistry of FinanceNew Administration Building,Belmopan
Brazil Mr. Roberto Fendt JuniorDeputy Minister for Foreign Trade and International AffairsMinistry of the EconomyEsplanada dos MinisteriosBlock K, 8° andar, CEP 70040-906
Mr. Erivaldo Alfredo GomesSecretary of International Affairs Ministry of Economy Esplanada dos Ministerios,Bloco K - 8° AndarCEP 70040-906 - Brasilia/DF
Canada Hon. Karina Gould, MP Minister of International DevelopmentOffice of the Minister Global Affairs Canada 125 Sussex Drive Ottawa K1A 0G2
Mr. Rick Stewart Assistant Deputy MinisterInt. Trade and Finance BranchDepartment of Finance CanadaJames Michael Flaherty Building90 Elgin Street, 14th Floor,Ottawa, Canada K1A 0G5
Colombia Dr. the Hon. Alberto Carrasquilla BarreraMinister of Finance and Public CreditMinistry of Finance and Public CreditCarrera 7a, Numero 6-64Bogota
Mr. Juan Jose Echavarría Governor Banco de la RepublicaBanco de la Republica Carrera 7aNumero 14-18 Officina Principal Bogota
Dominica Hon. Roosevelt SkerritPrime Minister and Minister for Finance, Foeign Affairs and Information Technology Office of the Prime MinisterFinancial Centre Kennedy AvenueRoseau

CARIBBEAN DEVELOPMENT BANK ANNUAL REPORT 2020 | 253
COUNTRY GOVERNOR ALTERNATE GOVERNOR
Germany Mr. Norbert BarthleParliamentary State SecretaryFederal Ministry for Economic Cooperation and DevelopmentEurophaus, Stresemanstr. 9410963 Berlin
Ms. Marianne KothéDeputy Director General International Financial and Monetary PolicyFederal Ministry of FinanceWilhelmstraBe 97, 10117 Berlin
Grenada Dr. the Rt. Hon. Keith MitchellPrime Minister and Minister of FinanceOffice of the Prime MinisterFinancial Complex The CarenageSt. George's
Guyana Hon. Dr. Bharrat JagdeoVice PresidentOffice of the Vice PresidentMinistry of Finance49 Main & Urquhart StreetsGeorgetown
Hon. Dr. Ashni K. SinghSenior Minister in the Office of the President with responsibility for Finance Office of the MinisterMinistry of Finance49 Main & Urquhart StreetsGeorgetown
Haiti Hon. Michel Patrick BoisvertMinister of Economy and FinanceMinistry of Economy and Finance#5 Avenue Charles SummerPort-au-Prince
Mr. Jean Baden DuboisGovernor Bank of the Republic of HaitiAngle rues Pavée et du QuaiRue de QuaiPort-au-Prince
Italy Hon. Roberto GualtierMinister of Economy and FinanceMinistry of Economy and FinanceDirezione III Ufficio VIIIVia XX Settembre 97Rome 00187
Ms. Gelsomina VigliottiHead of International Financial RelationsTreasury Department, Ministry of Economy and FinanceDirezione III Ufficio VIII Via XX Settembre 97 00187 Roma

CARIBBEAN DEVELOPMENT BANK ANNUAL REPORT 2020 | 254
COUNTRY GOVERNOR ALTERNATE GOVERNOR
Jamaica Hon. Nigel Clarke, DPhil, MP Minister of Finance and the Public Service Ministry of Finance and the Public Service30 National Heroes CircleP.O. Box 512Kingston 4
Ms. Darlene MorrisonFinancial Secretary (Ag.)Ministry of Finance and the Public Service30 National Heroes Circle, P.O. Box 512, Kingston
Mexico Mr. Arturo Herrera GutiérrezMinister of Finance and Public CreditSecretariat of Finance and Public Credit Insurgentes Sur no. 1971Torre III, Piso 3, Col. Guadalupe Inn Del. Alvaro Obregón C.P. 010200
Mr. Gabriel Yorio GonzalezDeputy Minister of Finance and Public CreditSecretaria de Hacienda y Credito PublicoInsurgentes Sur 1971Torre III, Piso 13, Col. Guadalupe InnAlc. Alvaro Obregon, Ciudad de Mexico 01020
People’s Republic of China Mr. Yi GangGovernorPeople's Bank of China32 Cheng Fang StreetWest DistrictBeijing 10080
St. Kitts and Nevis Dr. the Hon. Timothy HarrisPrime Minister and Minister of Finance Office of the Prime MinisterGovernment HeadquartersGolden RockBasseterre
Mrs. Hilary HazelFinancial SecretaryMinistry of FinanceGolden Rock Basseterre
Saint Lucia Hon. Guy JosephMinister of Economic Development, Housing, Urban Renewal, Transport and Civil AviationOffice of the Minister3rd Floor Greaham Louisy Administrative BuildingCastries

CARIBBEAN DEVELOPMENT BANK ANNUAL REPORT 2020 | 255
COUNTRY GOVERNOR ALTERNATE GOVERNOR
St. Vincent and the Grenadines
Hon. Camillo GonsalvesMinister of Economic Planning, Sustainable Development,Industry, Internal Trade, Information and LabourMinistry of Economic Planning and Sustainable Development1st Floor Administrative BuildingBay StreetKingstown
Suriname Hon. Armand K Achaibersing Minister of Finance and PlanningMinistry of FinanceTamarindelaan #3,Paramaribo
Trinidad and Tobago Hon. Camille Robinson-RegisOffice of the MinisterMinister of Planning and DevelopmentLevel 14 Eric Williams Finance BuildingPort of Spain
Hon. Colm ImbertMinister of FinanceOffice of the MinisterMinistry of FinanceEric Williams Finance BuildingIndependence SquarePort of Spain
United Kingdom The Rt. Hon. Dominic Raab, MPFirst Secretary and Secretary of State for Foreign Commonwealth and Development Affairs Foreign, Commonwealth & Development Office22 Whitehall London SW1A 2EG
Baroness Sugg, CBE Minister for Overseas Territories and Sustainable Development Foreign, Commonwealth & Development Office22 WhitehallLondon SW1A 2EG
Venezuela Mr. Simon Alejandro Zerpa DelgadoPresidentVenezuela Economic and Social Development Bank (BANDES)Avenida UniversidadTraposos a Colon, Torre BANDESCaracas 1010
Ambassador Raul IcausiDirector for Latin America and the CaribbeanMinistry of Popular Power for Foreign AffairsCaracas 1010

CARIBBEAN DEVELOPMENT BANK ANNUAL REPORT 2020 | 256
BOARD OF DIRECTORS AND ALTERNATES 2020-2022
DIRECTOR ALTERNATE DIRECTOR
Jamaica
Ms. Dian BlackPrincipal Director for Debt Management BranchEconomic Management DivisionMinistry of Finance and the Public Service30 National Heroes CircleP.O. Box 512KingstonJAMAICA
TEL: (876) 932-5402FAX: (876) 922-5975Email: [email protected]
Mr. Trevor AndersonChief Fiscal EconomistMinistry of Finance and the Public Service30 National Heroes CircleP.O. Box 512Kingston JAMAICA
TEL: (876) 932-5441FAX: (876) 932-5975EMAIL: [email protected]
Trinidad and Tobago, and Haiti
Mrs. Joanne DeorajPermanent SecretaryMinistry of Planning and DevelopmentLevel 14 Eric Williams Financial ComplexIndependence SquarePort-of-SpainTRINIDAD AND TOBAGO
TEL: (868) 627-9700/612-3000 Ext. 2015EMAIL: [email protected]
ADVISERDr. Pierre Marie Du MényMinistry of the Economy and Finance, #5 Avenue Charles Sumner Port-au-Prince, HAITI
TEL: (509) 3818-4444 EMAIL: [email protected]
Ms. Suzette Taylor Lee CheePermanent SecretaryMinistry of FinanceLevel II Eric Williams Finance BuildingIndependence SquarePort of Spain TRINIDAD AND TOBAGO
TEL: (868) 627-9700 Ext. 5132-4FAX: (868) 627-6108EMAIL: [email protected]

CARIBBEAN DEVELOPMENT BANK ANNUAL REPORT 2020 | 257
DIRECTOR ALTERNATE DIRECTOR
Bahamas
Mr. Marlon JohnsonFinancial Secretary Ministry of FinanceP.O. Box N-3017NassauBAHAMAS
TEL: (242) 327-1530FAX: (242) 327-1618/1620EMAIL: [email protected]
Mr. Anthony A. Cartwright Jr.DirectorInt. Financial Institutions Management UnitMinistry of FinanceP.O. Box CB-10980West Bay StreetNassau, BAHAMAS
TEL: (242) 702-1549FAX: (242) 327-1618/1620EMAIL: [email protected]
Guyana
Ms. Denise Dawn DeSouzaHead, Multilateral Financial Institutions DepartmentMinistry of Finance49 Main & Urquhart StreetsGeorgetownGUYANA
TEL: (592) 225-4834FAX: (592) 227-1114 EMAIL: [email protected]
Ms. Donna LeviHeadBilateral DepartmentMinistry of Finance49 Main and Urquhart StreetGeorgetownGUYANA
TEL: (592) 227-2440EMAIL: [email protected]
Barbados
Mr. Ian St. C CarringtonDirector of Finance and Economic Affairs Ministry of Finance, Economic Affairs and InvestmentGovernment HeadquartersBay Street St. MichaelBARBADOS
TEL: (246) 535-5668FAX: (246) 535 5630EMAIL: [email protected]
Ms. Nancy HeadleyPermanent Secretary (Finance)Economic Affairs DivisionMinistry of Finance and Economic Affairs 3rd Floor Warrens Office ComplexWarrensSt. MichaelBARBADOS
TEL: (246) 535-5336/7EMAIL: [email protected]

CARIBBEAN DEVELOPMENT BANK ANNUAL REPORT 2020 | 258
DIRECTOR ALTERNATE DIRECTOR
Dominica and Saint Lucia
Ms. Denise EdwardsFinancial SecretaryMinistry of Finance and Planning, 5th Floor, Financial Centre, Kennedy Avenue, Roseau, DOMINICA
TEL: (767) 266-3221/448-1868 FAX: (767) 448-0054 EMAIL: [email protected]
Mr. Claudius EmmanuelPermanent SecretaryDepartment of Economic Development, Transport and Civil Aviation, First Floor Financial Complex,Castries, SAINT LUCIA
TEL: (758) 468-5825 FAX: (758) 451-9706EMAIL: [email protected]
Grenada, and St. Vincent and the Grenadines
Mr. Recardo Frederick Director of Economic Planning Ministry of Finance, Economic Planning, Sustainable Development and Information Technology1st Floor Administrative CentreKingstownST. VINCENT AND THE GRENADINES
TEL: (784) 457-1746FAX: (784) 456-2430 EMAIL: [email protected]
Mrs. Ophelia Wells-CornwallPermanent Secretary (Ag.)Ministry of Finance, Planning, Economic Development and Physical Development Financial Complex The CarenageSt. George’sGRENADA
TEL: (473) 440-2928FAX: (473) 440-4115EMAIL: [email protected]
Belize and Anguilla, Cayman Islands, Montserrat, Turks and Caicos Islands and Virgin Islands
Mrs. Yvette AlvarezSenior AdvisorGovernment of BelizeMinistry of FinanceBelmopanBELIZE
TEL: (501) 822-3866FAX: (501) 822-2886EMAIL: [email protected]
Mr. Glenroy ForbesDirector, FinanceMinistry of FinanceCentral Administration ComplexRoad TownTortolaVIRGIN ISLANDS
TEL: (284) 494-3701 EMAIL: [email protected]

CARIBBEAN DEVELOPMENT BANK ANNUAL REPORT 2020 | 259
DIRECTOR ALTERNATE DIRECTOR
Antigua and Barbuda, and St. Kitts and Nevis
Mrs. Hilary HazelFinancial SecretaryMinistry of FinanceP.O. Box 186BasseterreST. KITTS AND NEVIS
TEL: (869) 467- 1091FAX: (869) 465-1532EMAIL: [email protected] / [email protected]
Mr. Whitfield Harris, Jr.Financial SecretaryMinistry of Finance and Corporate GovernanceGovernment Office ComplexParliament DriveSt. John’sANTIGUA AND BARBUDA
TEL: (268) 462-5002FAX: (268) 462-5093EMAIL: [email protected]
Suriname
Mrs. Iris SandelDirector, Development PlanningMinistry of FinanceTamarindelaan #3ParamariboSURINAME
TEL: (597) 472610EMAIL: [email protected], [email protected]
Brazil
Mr. Marcos Machado GuimaraesDirector of the Department for Development FinanceMinistry of EconomyEsplanada dos Ministerios Block K, 8 CEP 70040-906 – Brasília,DFBRAZIL
TEL: +55 61 2020–4827EMAIL: [email protected]
Mr. Eduardo Rolim de Pontes VieiraGeneral Coordinator of Relations with International OrganisationsSecretariat of Foreign AffairsEsplanada dos Ministerios, Bloco KCEP 70040-906 – Brasilia,DFBRAZIL
TEL: +55 61 2020-4876EMAIL: [email protected]
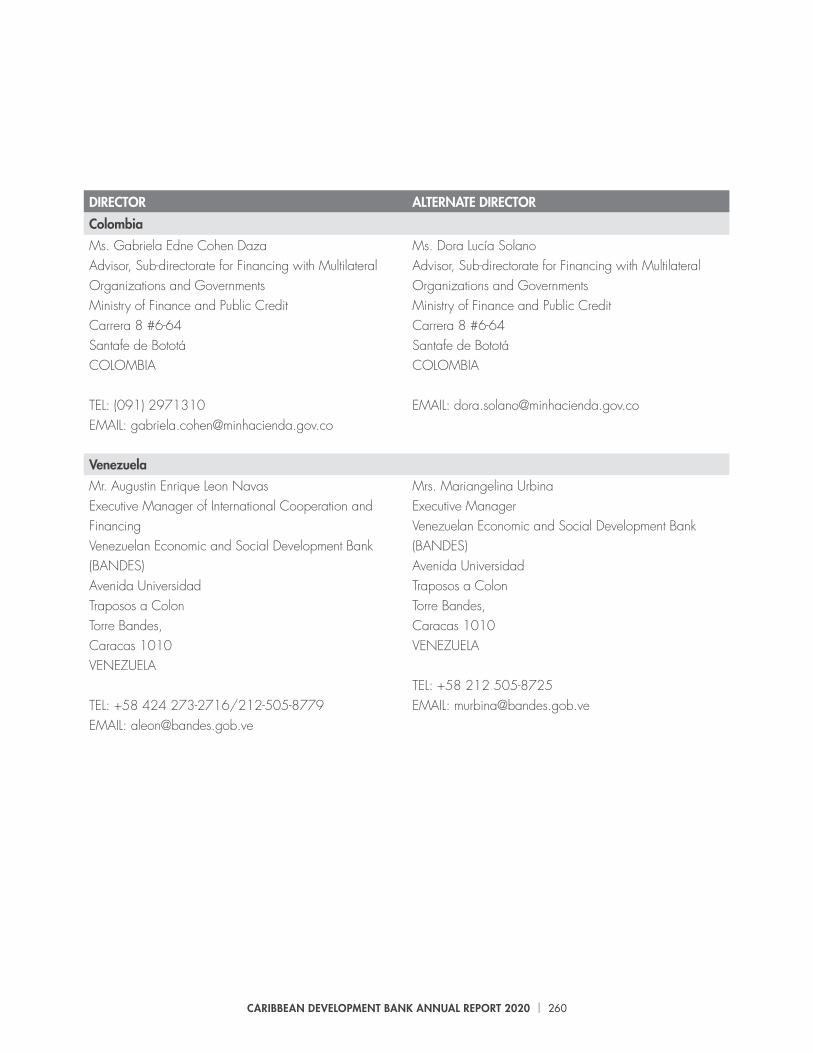
CARIBBEAN DEVELOPMENT BANK ANNUAL REPORT 2020 | 260
DIRECTOR ALTERNATE DIRECTOR
Colombia
Ms. Gabriela Edne Cohen DazaAdvisor, Sub-directorate for Financing with Multilateral Organizations and GovernmentsMinistry of Finance and Public Credit Carrera 8 #6-64 Santafe de BototáCOLOMBIA
TEL: (091) 2971310EMAIL: [email protected]
Ms. Dora Lucía SolanoAdvisor, Sub-directorate for Financing with Multilateral Organizations and GovernmentsMinistry of Finance and Public Credit Carrera 8 #6-64 Santafe de BototáCOLOMBIA
EMAIL: [email protected]
Venezuela
Mr. Augustin Enrique Leon NavasExecutive Manager of International Cooperation and FinancingVenezuelan Economic and Social Development Bank (BANDES)Avenida UniversidadTraposos a ColonTorre Bandes, Caracas 1010VENEZUELA
TEL: +58 424 273-2716/212-505-8779EMAIL: [email protected]
Mrs. Mariangelina UrbinaExecutive Manager Venezuelan Economic and Social Development Bank (BANDES)Avenida UniversidadTraposos a ColonTorre Bandes, Caracas 1010VENEZUELA
TEL: +58 212 505-8725EMAIL: [email protected]

CARIBBEAN DEVELOPMENT BANK ANNUAL REPORT 2020 | 261
DIRECTOR ALTERNATE DIRECTOR
Mexico
Mr. José De Luna MartínezHead of Public Credit UnitMinistry of Finance and Public CreditInsurgentes Sur 1971Torre III, Piso 7Col. Guadalupe InnC. P. 01020Ciudad de MéxicoMEXICO
EMAIL: [email protected]
Ms. Brenda Guadalupe Ciuk Cano.General Director of the International Financial InstitutionsMinistry of Finance and Public CreditInsurgentes Sur 1971Torre III, Piso 3Col. Guadalupe InnC. P. 01020Ciudad de MéxicoMEXICO
TEL: +52 553 688-2610EMAIL: [email protected]
Canada
Ms. Patricia McCullaghExecutive Director Haiti Division Canadian Director to the Caribbean Development Bank Global Affairs Canada
TEL: (613) 371-3244Email: [email protected]
Mr. Matthew StraubFirst Secretary (Development)High Commission of CanadaBishop’s Court HillP.O. Box 404BridgetownBARBADOS
TEL: (246) 629-3586FAX: (246) 629-3623Email: [email protected]
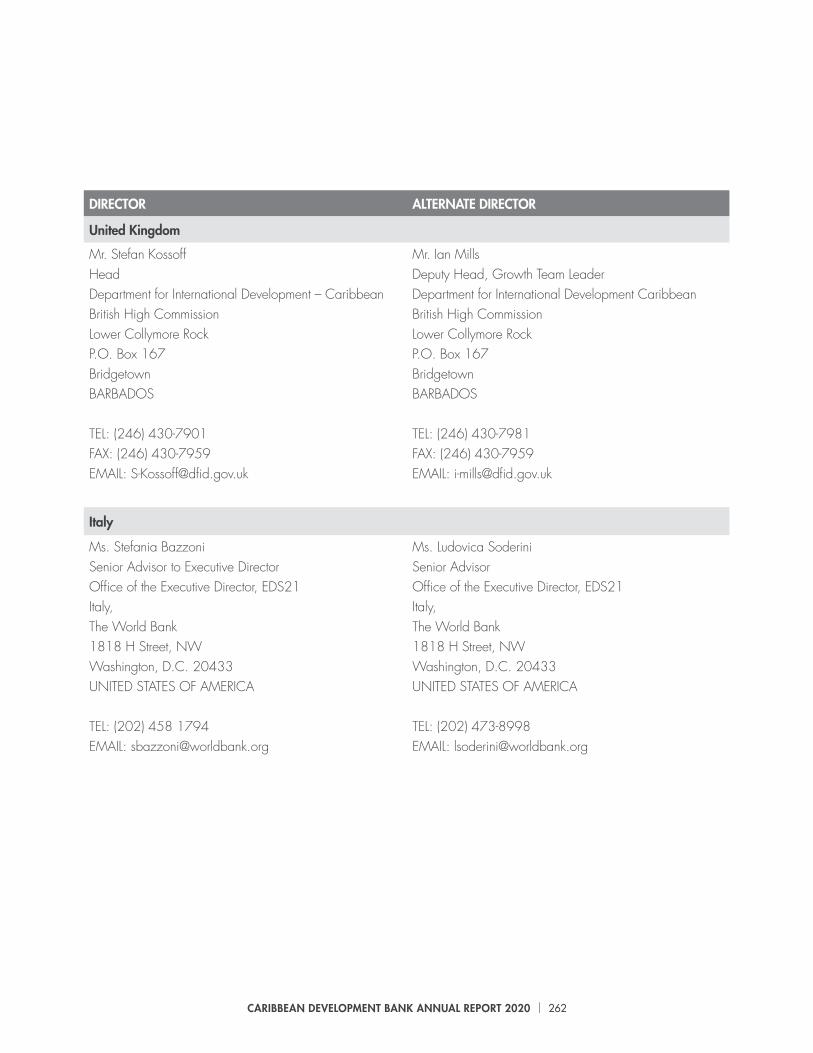
CARIBBEAN DEVELOPMENT BANK ANNUAL REPORT 2020 | 262
DIRECTOR ALTERNATE DIRECTOR
United Kingdom
Mr. Stefan KossoffHeadDepartment for International Development – CaribbeanBritish High CommissionLower Collymore RockP.O. Box 167BridgetownBARBADOS
TEL: (246) 430-7901FAX: (246) 430-7959EMAIL: [email protected]
Mr. Ian MillsDeputy Head, Growth Team LeaderDepartment for International Development CaribbeanBritish High CommissionLower Collymore RockP.O. Box 167BridgetownBARBADOS
TEL: (246) 430-7981FAX: (246) 430-7959EMAIL: [email protected]
Italy
Ms. Stefania BazzoniSenior Advisor to Executive DirectorOffice of the Executive Director, EDS21Italy, The World Bank1818 H Street, NW Washington, D.C. 20433UNITED STATES OF AMERICA
TEL: (202) 458 1794EMAIL: [email protected]
Ms. Ludovica SoderiniSenior AdvisorOffice of the Executive Director, EDS21Italy, The World Bank1818 H Street, NW Washington, D.C. 20433UNITED STATES OF AMERICA
TEL: (202) 473-8998EMAIL: [email protected]

CARIBBEAN DEVELOPMENT BANK ANNUAL REPORT 2020 | 263
DIRECTOR ALTERNATE DIRECTOR
Germany
Mr. Christian Thiel CDB’s Director for GermanyOffice of the Directorc/o World Bank1818 H Street NWWashington DC 20433UNITED STATES OF AMERICA
TEL: (202) 458-1182FAX: (202) 522-0222EMAIL: [email protected]
Mrs. Louisa FreySenior Policy Officer, Division of Regional Development Banks and IFADFederal Ministry for Economic Cooperation and Development Stresemannstraße 94 10963 BerlinGERMANY
EMAIL: [email protected]
People’s Republic of China
Ms. Zhu JunDirector-GeneralInternational DepartmentThe People’s Bank of China32 Cheng Fang StreetWest DistrictBeijing 100800PEOPLE’S REPUBLIC OF CHINA
TEL: +86 10 6619-4266FAX: +86 10 6601-6725EMAIL: [email protected]
Mr. Zhou YeChief Representative of the Liaison Officeof the People’s Bank of China andCDB’s Alternate Director for ChinaEmbassy of the People’s Republic of China25 FoursquareRockley Golf & Country ClubGolf Club RoadChrist ChurchBARBADOS
TEL: (246) 435-9702FAX: (246) 435-9702EMAILl: [email protected]

CARIBBEAN DEVELOPMENT BANK ANNUAL REPORT 2020 | 264
Office of the President
President Wm Warren Smith, Ph.D., CD*
Chief Risk Officer Mr. Malcolm Buamah**
Chief Transformation Officer Deputy Director, Internal Audit Division
Mr. Phillip Brown** Mr. Denis Bergevin
Head, Office of Integrity, Compliance and Accountability Dr. Toussant Boyce
Head of Evaluation, Office of Independent EvaluationHead, Corporate Communications
Mr. James MelansonMiss Camille Taylor
Corporate Services
Vice-President (Corporate Services) and Bank Secretary Mrs. Yvette Lemonias Seale**
Director, Finance and Information Technology Solutions Mr. Earl Estrado (Ag.) **
Deputy Director, FinanceChief Information Officer
Mrs. Faye Hardy (Ag.)Mr. Julio Cesar Goncalves Lima
Director, Human Resources and Administration Mrs. Katrina Sam-Prescod (Ag.) **
General Counsel Mrs. S. Nicole Jordan (Ag.) **
Deputy General Counsel Mr. Dave Waithe (Ag.)
Operations
Vice-President (Operations) Mrs. Diana Wilson Patrick (Ag.) **
Director, Economics Mr. Ian Durant (Ag.) **
Deputy Director, Economics Mrs. Christine Dawson (Ag.)
Director, Projects Mr. Daniel Best**
Division Chief, Social Sector Ms. Deidre Clarendon
Head of Procurement, Procurement Policy Mr. Douglas Fraser
Division Chief, Economic Infrastructure Mr. L. O’Reilly Lewis
Division Chief, Technical Cooperation Dr. Darran Newman (Ag.)
Head, Infrastructure Partnerships Mr. Andrew Dupigny
Head, Renewable Energy/Energy Efficiency Unit Mr. Joseph Williams (Ag.)
Deputy Director, Corporate Strategy
*Chairman, Advisory Management Team**Member, Advisory Management Team
Ms. Ann-Marie Warner (Ag)
PRINCIPAL OFFICERS OF THE BANK AS AT DECEMBER 31, 2020

CARIBBEAN DEVELOPMENT BANK ANNUAL REPORT 2020 | 265
APPENDIX I-ADISTRIBUTION OF LOANS, SECONDARY MORTGAGE, EQUITY AND GRANTS APPROVED (NET)BY COUNTRY AND BY FUND - 2020 ($’000)
CountryOrdinary Capital
ResourcesSpecial Development
FundOther Special
FundTotal Percentage of
Total
Antigua and Barbuda - 13,000 616 13,616 2.6%
Bahamas 40,000 - 750 40,750 7.8%
Barbados (31,468) 150 - (31,318) -6.0%
Belize 16,691 28,564 19,706 64,961 12.5%
Dominica 7,000 15,677 1,701 24,378 4.7%
Grenada 7,590 14,900 1,555 24,045 4.6%
Guyana 101,466 20,509 66,025 188,000 36.1%
Haiti - 11,811 - 11,811 2.3%
Jamaica - 30,069 4,555 34,624 6.7%
St. Kitts and Nevis - - (235) (235) 0.0%
St. Lucia 34,523 21,959 38,120 94,602 18.2%
Montserrat - (321) - (321) -0.1%
Suriname - 8,200 - 8,200 1.6%
Trinidad and Tobago - - 248 248 0.0%
St. Vincent and the Grenadines 12,002 20,212 4,578 36,792 7.1%
Virgin Islands - - 250 250 0.0%
Regional (2,201) 6,909 5,129 9,837 1.9%
Total 185,603 191,639 142,998 520,240
Percentage of Total 35.7 36.8 27.5 100.0
LDCs 77,806 134,002 66,291 278,099 53.5%
MDCs 109,998 50,728 71,578 232,304 44.7%
Regional (2,201) 6,909 5,129 9,837 1.9%

CARIBBEAN DEVELOPMENT BANK ANNUAL REPORT 2020 | 266
APPENDIX I-BDISTRIBUTION OF LOANS, SECONDARY MORTGAGE, EQUITY AND GRANTS APPROVED (NET) BY SECTOR AND BY FUND - 2020 ($’000)
Sector Ordinary Capital Resources
Special Development Fund
Other SpecialFunds
Total
Total All Sectors 185,603 191,639 142,998 520,240
Agriculture and Rural Development - 10,190 - 10,190
Agriculture (excluding Crop Farming) - 580 - 580
Irrigation, Drainage and Land Reclamation - 1,013 - 1,013
Feeder Roads and Bridges - 8,597 - 8,597
Manufacturing and Industry - (5) - (5)
Micro and Small-Scale Enterprises - (5) - (5)
Tourism - 125 - 125
Tourism - 125 - 125
Transportation and Communication 126,102 25,575 121,325 273,002
Transport Policy and Administrative Management - 1,573 516 2,089
Road Transport 126,102 24,002 120,809 270,913
Power, Energy, Water and Sanitation 12,831 30,721 6,250 49,802
Power and Energy 5,453 748 4,535 10,736
Electric Power - (321) - (321)
Water and Sanitation 7,378 30,294 1,715 39,387
Social Infrastructure and Services 11,938 31,003 3,014 45,955
Education - General 14,139 26,249 - 40,388
Education - Post Secondary (2,201) - - (2,201)
Other Social Infrastructure and Services - 4,754 3,014 7,768
Environmental Sustainability and Disaster Risk Reduction
- 3,123 - 3,123
Environmental Sustainability - 123 - 123
Disaster Prevention and Preparedness - 3,000 - 3,000
Financial, Business and Other Services - 176 - 176
Financial Policy and Administrative Management - 176 - 176
Multi-Sector and Other 34,732 90,731 12,409 137,872
Government and Civil Society - (88) 750 662
Policy-Based Loans/Structural Adjustment Programme 66,200 90,400 - 156,600
Regional/Multilateral Trade Agreements - 419 1,213 1,632
Other (31,468) - 10,446 (21,022)
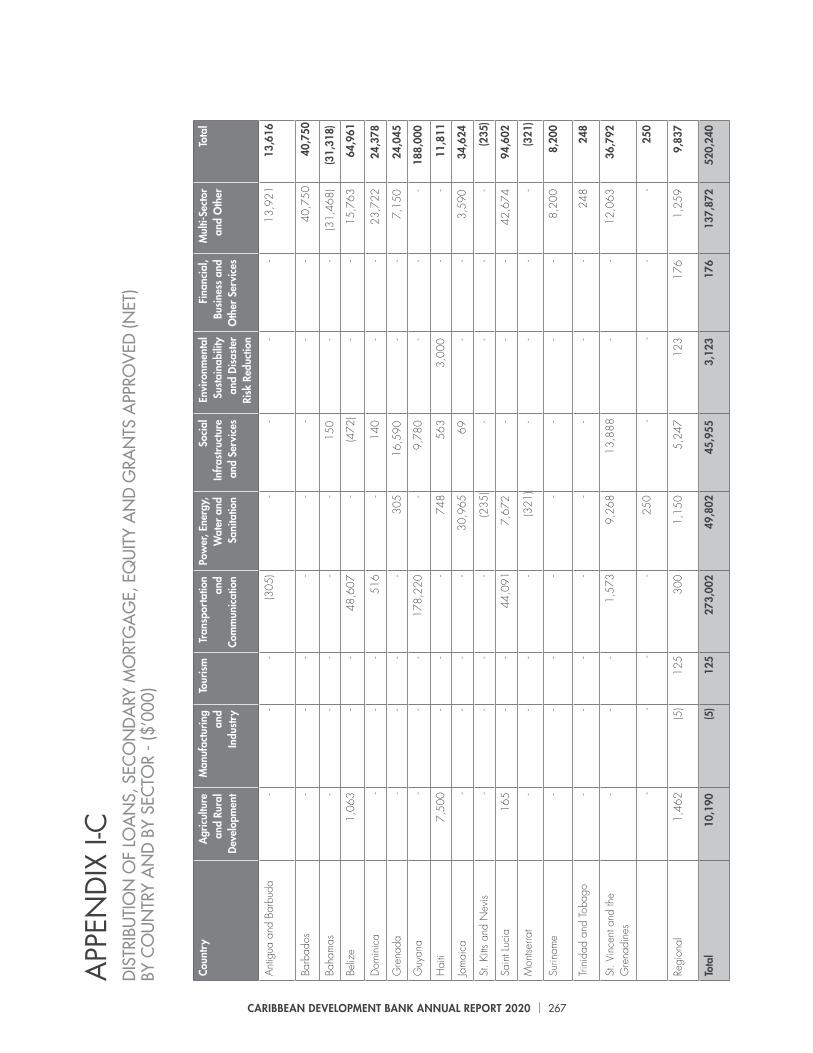
CARIBBEAN DEVELOPMENT BANK ANNUAL REPORT 2020 | 267
Coun
try
Agr
icul
ture
an
d Ru
ral
Dev
elop
men
t
Man
ufac
turin
g an
d In
dust
ry
Tour
ism
Tran
spor
tatio
n an
d Co
mm
unic
atio
n
Pow
er, E
nerg
y,
Wat
er a
nd
Sani
tatio
n
Soci
al
Infr
astr
uctu
re
and
Serv
ices
Envi
ronm
enta
l Su
stai
nabi
lity
and
Dis
aste
r Ri
sk R
educ
tion
Fina
ncia
l, Bu
sine
ss a
nd
Oth
er S
ervi
ces
Mul
ti-Se
ctor
an
d O
ther
Tota
l
Ant
igua
and
Bar
buda
--
-(3
05)
--
--
13,9
2113
,616
Barb
ados
--
--
--
--
40,7
5040
,750
Baha
mas
--
--
-15
0-
-(3
1,46
8)(3
1,31
8)
Beliz
e1,
063
--
48,6
07-
(472
)-
-15
,763
64,9
61
Dom
inic
a-
--
516
-14
0-
-23
,722
24,3
78
Gre
nada
--
--
305
16,5
90-
-7,
150
24,0
45
Guy
ana
--
-17
8,22
0-
9,78
0-
--
188,
000
Hai
ti7,
500
--
-74
856
33,
000
--
11,8
11
Jam
aica
--
--
30,9
6569
--
3,59
034
,624
St. K
itts
and
Nev
is-
--
-(2
35)
--
--
(235
)
Sain
t Luc
ia16
5-
-44
,091
7,67
2-
--
42,6
7494
,602
Mon
tserra
t-
--
-(3
21)
--
--
(321
)
Surin
ame
--
--
--
--
8,20
08,
200
Trin
idad
and
Tob
ago
--
--
--
--
248
248
St. V
ince
nt a
nd th
e G
rena
dine
s-
--
1,57
39,
268
13,8
88-
-12
,063
36,7
92
--
--
250
--
--
250
Regi
onal
1,46
2(5
)12
530
01,
150
5,24
712
317
61,
259
9,83
7
Tota
l10
,190
(5)
125
273,
002
49,8
0245
,955
3,12
317
613
7,87
252
0,24
0
APP
END
IX I-
CD
ISTR
IBU
TIO
N O
F LO
AN
S, S
ECO
ND
ARY
MO
RTG
AG
E, E
QU
ITY
AN
D G
RAN
TS A
PPRO
VED
(NET
)BY
CO
UN
TRY
AN
D B
Y SE
CTO
R - (
$’00
0)

CARIBBEAN DEVELOPMENT BANK ANNUAL REPORT 2020 | 268
APPENDIX I-DDISTRIBUTION OF LOANS APPROVED (NET)BY COUNTRY AND BY FUND - 2020 ($’000)
CountryOrdinary Capital
ResourcesSpecial Development
FundOther Special
Funds Total Percentage of Total
Antigua and Barbuda - 13,000 - 13,000 3.6%
Barbados (31,468) - - (31,468) -8.8%
Bahamas 40,000 - - 40,000 11.2%
Belize 16,691 28,414 - 45,105 12.6%
Dominica 7,000 15,500 - 22,500 6.3%
Grenada 7,590 14,900 - 22,490 6.3%
Guyana 101,466 20,709 - 122,175 34.2%
Jamaica - 30,000 - 30,000 8.4%
Saint Lucia 34,523 21,794 - 56,317 15.7%
Montserrat - (321) - (321) -0.1%
Suriname - 8,200 - 8,200 2.3%
St. Vincent and the Grenadines
12,002 19,873 - 31,875 8.9%
Regional (2,201) - - (2,201) -0.6%
Total 185,603 172,069 - 357,672
Percentage of Total 51.9 48.1 0.0 100.0
LDCs 77,806 121,360 0 199,166 55.7%
MDCs 109,998 50,709 0 160,707 44.9%
Regional -2,201 0 0 -2,201 -0.6%

CARIBBEAN DEVELOPMENT BANK ANNUAL REPORT 2020 | 269
APPENDIX I-EDISTRIBUTION OF LOANS APPROVED (NET)BY SECTOR AND BY FUND - 2020 ($’000)
Sector Ordinary Capital Resources Special Development Fund Other Special Funds Total
Total All Sectors 185,603 172,069 - 357,672
Agriculture and Rural Development - 1,013 - 1,013
Irrigation, Drainage and Land Reclamation
- 1,013 - 1,013
Transportation and Communication 126,102 25,375 - 151,477
Transport Policy and Administrative Management
- 1,573 - 1,573
Road Transport 126,102 23,802 - 149,904
Power, Energy, Water and Sanitation 12,831 29,973 - 42,804
Power and Energy 5,453 - - 5,453
Electric Power - (321) - (321)
Water and Sanitation 7,378 30,294 - 37,672
Social Infrastructure and Services 11,938 25,308 - 37,246
Education - General 14,139 25,308 - 39,447
Education - Post Secondary (2,201) - - (2,201)
Multi-Sector and Other 34,732 90,400 - 125,132
Policy-Based Loans/Structural Adjustment Programme
66,200 90,400 - 156,600
Other (31,468) - - (31,468)

CARIBBEAN DEVELOPMENT BANK ANNUAL REPORT 2020 | 270
APPENDIX I-FLOAN APPROVALS - 2020 ($’000)
Country No. of Loan Projects CDB Public Private Unknown
Antigua and Barbuda 1 13,000 13,000 - -
Bahamas 1 40,000 40,000 - -
Belize 3 50,313 50,313 - -
Dominica 3 22,500 22,500 - -
Grenada 2 22,490 22,490 - -
Guyana 2 122,212 122,212 - -
Jamaica 1 30,000 30,000 - -
St. Lucia 5 56,317 56,317 - -
St. Vincent and the Grenadines 6 31,875 31,875 - -
Suriname 1 8,200 8,200 - -
Total 25 396,907 396,907 - -
LDCs 15 204,695 204,695 - -
MDCs 4 192,212 192,212 - -

CARIBBEAN DEVELOPMENT BANK ANNUAL REPORT 2020 | 271
APPENDIX I-GGROSS LOANS APPROVALS BY PROJECT AND LOAN EQUIVALENT - 2020 ($’000)
OCR SDF OSF
Project Name Country AmountLoan
Equivalent AmountLoan
Equivalent Amount Loan Equivalent
Total
1Coronavirus Disease 2019 Emergency Response Support Loan
Antigua and Barbuda - - 13,000 1.00 - - 13,000
2
Second Programmatic Fiscal Stability and Resilience Building Policy-Based Loan With Supplementary Financingfor the Coronavirus Disease 2019
Bahamas 40,000 1.00 - - - - 40,000
3Coronavirus Disease 2019 Emergency Response Support Loan
Belize - - 15,000 1.00 - - 15,000
4Enhancing Sugarcane Farmers Resilience To Natural Hazard Events
Belize - - 1,013 1.00 - - 1,013
5Philip Goldson Highway and Remate Bypass Upgrading Project
Belize 21,300 0.62 13,000 0.38 - - 34,300
6Coronavirus Disease 2019 Emergency Response Support Loan
Dominica - - 2,500 1.00 - - 2,500
7Strengthening Resilience and Recovery Crisis Response Policy-Based Loan
Dominica - - 13,000 1.00 - - 13,000
8Strengthening Resilience And Recovery Crisis Response Policy-Based Loan
Dominica 7,000 1.00 - - - - 7,000
9Coronavirus Disease 2019 Emergency Response Support Loan
Grenada - - 5,900 1.00 - - 5,900
10 Grenada Education Enhancement Project - Phase Ii Grenada 7,590 0.46 9,000 0.54 - - 16,590
11 Hospitality and Tourism Training Institute Project Guyana - - 9,780 1.00 - - 9,780
12 Linden To Mabura Hill Road Upgrade Guyana 101,466 0.90 10,966 0.10 - - 112,432
13 Rural Water Supply Programme Jamaica - - 30,000 1.00 - - 30,000
14Coronavirus Disease 2019 Crisis Response Policy-Based Loan
St. Lucia 19,200 0.64 10,800 0.36 - - 30,000
15Coronavirus Disease 2019 Emergency Response Support Loan
St. Lucia - - 10,700 1.00 - - 10,700

CARIBBEAN DEVELOPMENT BANK ANNUAL REPORT 2020 | 272
APPENDIX I-G continued
GROSS LOANS APPROVALS BY PROJECT AND LOAN EQUIVALENT - 2020 ($’000)
OCR SDF OSF
Project Name Country AmountLoan
Equivalent AmountLoan
Equivalent Amount Loan Equivalent
Total
16 Millennium Highway And West Coast Road Reconstruction St. Lucia 7,945 1.00 - - - - 7,945
17Sixth Water - Vieux Fort Water Supply Redevelopment - additional Loan
St. Lucia 7,378 1.00 - - - - 7,378
18 Taln - Closure Plan for Vieux Fort Landfill- St. Lucia St. Lucia - - 294 1.00 - - 294
19Coronavirus Disease 2019 Emergency Response Support Loan
St. Vincent and the Grenadines - - 11,300 1.00 - - 11,300
20Coronavirus Disease 2019 Emergency Response Support Loan
St. Vincent and the Grenadines 6,549 1.00 - - - - 6,549
21 School Improvement Project - Phase 1
St. Vincent and the Grenadines - - 7,000 1.00 - - 7,000
22 School Improvement Project - Phase 1
St. Vincent and the Grenadines 3,415 1.00 - - - - 3,415
23
St. Vincent Electricity Services Ltd. Utility Battery Storage and Grid-Connected Solar Photovoltaic Project
St. Vincent and the Grenadines 2,038 1.00 - - - - 2,038
24
St. Vincent Electricity Services Ltd. Utility Battery Storage and Grid-Connected Solar Photovoltaic Project
St. Vincent and the Grenadines - - 1,573 1.00 - - 1,573
25
Taln - Project Management Support for the Ministryof Transport, Works, Urban Development and Local Government
Suriname - - 8,200 1.00 - - 8,200
Total 223,881 173,026 - 396,907
LDCs 82,415 0.40 122,280 0.60 - - 204,695
MDCs 141,466 0.74 50,746 0.26 - - 192,212
LDCs 0.37 0.71 - 0.52
MDCs 0.63 0.29 - 0.48
Total 0.56 0.44
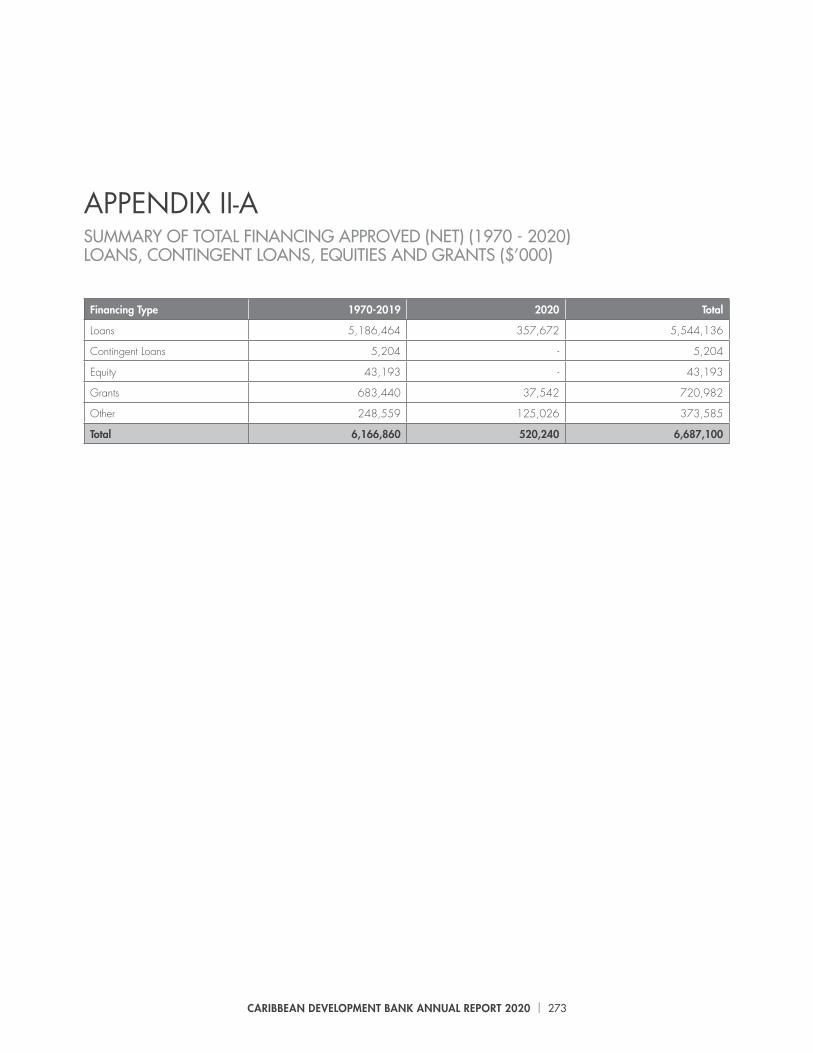
CARIBBEAN DEVELOPMENT BANK ANNUAL REPORT 2020 | 273
APPENDIX II-ASUMMARY OF TOTAL FINANCING APPROVED (NET) (1970 - 2020)LOANS, CONTINGENT LOANS, EQUITIES AND GRANTS ($’000)
Financing Type 1970-2019 2020 Total
Loans 5,186,464 357,672 5,544,136
Contingent Loans 5,204 - 5,204
Equity 43,193 - 43,193
Grants 683,440 37,542 720,982
Other 248,559 125,026 373,585
Total 6,166,860 520,240 6,687,100

CARIBBEAN DEVELOPMENT BANK ANNUAL REPORT 2020 | 274
APPENDIX II-BSUMMARY OF TOTAL FINANCING APPROVED (NET) BY SECTOR (1970 - 2020)LOANS, CONTINGENT LOANS, EQUITIES AND GRANTS ($’000)
Sector 1970-2019 2020 Total
Agriculture and Rural Development 453,542 10,190 463,732
Environmental Sustainability and Disaster Risk Reduction 602,235 3,123 605,358
Financial, Business and Other Services 172,705 176 172,881
Manufacturing and Industry 344,204 (5) 344,199
Mining and Quarrying 36,143 - 36,143
Multi-Sector and Other 1,157,476 137,872 1,295,348
Power, Energy, Water and Sanitation 720,924 49,802 770,726
Social Infrastructure and Services 1,258,302 45,955 1,304,257
Tourism 102,636 125 102,761
Transportation and Communication 1,325,586 273,002 1,598,588
Total 6,173,753 520,240 6,693,993
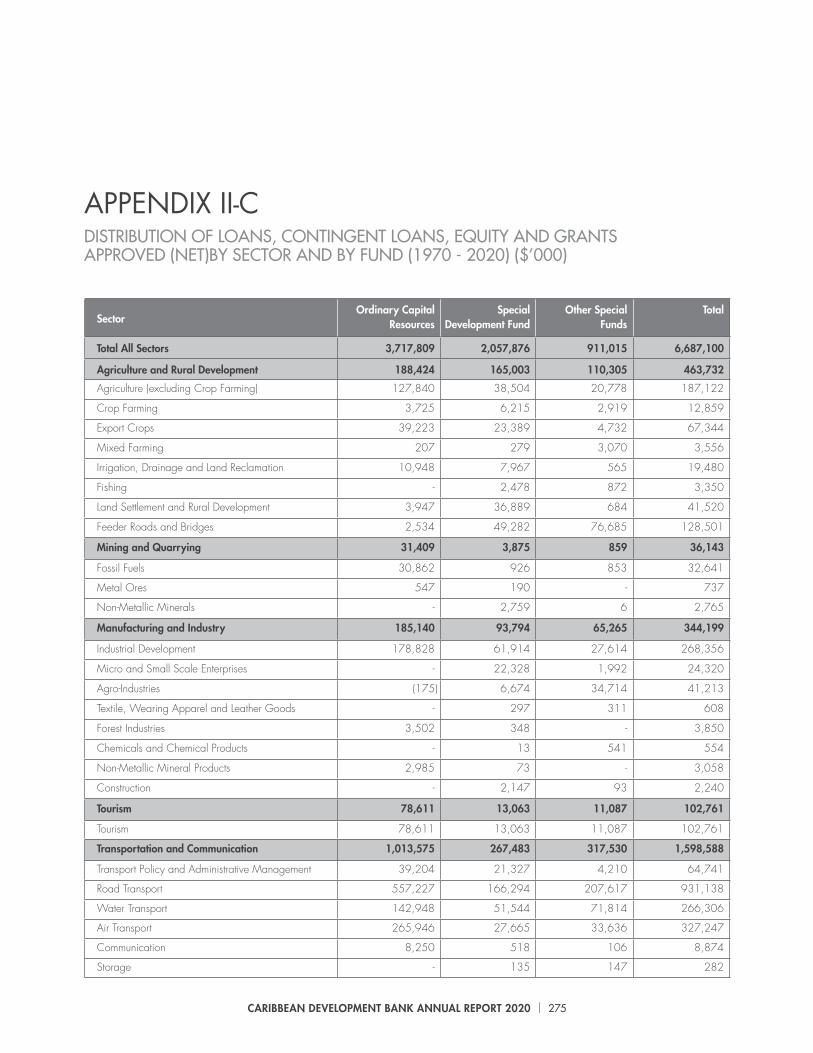
CARIBBEAN DEVELOPMENT BANK ANNUAL REPORT 2020 | 275
APPENDIX II-CDISTRIBUTION OF LOANS, CONTINGENT LOANS, EQUITY AND GRANTS APPROVED (NET)BY SECTOR AND BY FUND (1970 - 2020) ($’000)
SectorOrdinary Capital
ResourcesSpecial
Development FundOther Special
FundsTotal
Total All Sectors 3,717,809 2,057,876 911,015 6,687,100
Agriculture and Rural Development 188,424 165,003 110,305 463,732
Agriculture (excluding Crop Farming) 127,840 38,504 20,778 187,122
Crop Farming 3,725 6,215 2,919 12,859
Export Crops 39,223 23,389 4,732 67,344
Mixed Farming 207 279 3,070 3,556
Irrigation, Drainage and Land Reclamation 10,948 7,967 565 19,480
Fishing - 2,478 872 3,350
Land Settlement and Rural Development 3,947 36,889 684 41,520
Feeder Roads and Bridges 2,534 49,282 76,685 128,501
Mining and Quarrying 31,409 3,875 859 36,143
Fossil Fuels 30,862 926 853 32,641
Metal Ores 547 190 - 737
Non-Metallic Minerals - 2,759 6 2,765
Manufacturing and Industry 185,140 93,794 65,265 344,199
Industrial Development 178,828 61,914 27,614 268,356
Micro and Small Scale Enterprises - 22,328 1,992 24,320
Agro-Industries (175) 6,674 34,714 41,213
Textile, Wearing Apparel and Leather Goods - 297 311 608
Forest Industries 3,502 348 - 3,850
Chemicals and Chemical Products - 13 541 554
Non-Metallic Mineral Products 2,985 73 - 3,058
Construction - 2,147 93 2,240
Tourism 78,611 13,063 11,087 102,761
Tourism 78,611 13,063 11,087 102,761
Transportation and Communication 1,013,575 267,483 317,530 1,598,588
Transport Policy and Administrative Management 39,204 21,327 4,210 64,741
Road Transport 557,227 166,294 207,617 931,138
Water Transport 142,948 51,544 71,814 266,306
Air Transport 265,946 27,665 33,636 327,247
Communication 8,250 518 106 8,874
Storage - 135 147 282

CARIBBEAN DEVELOPMENT BANK ANNUAL REPORT 2020 | 276
APPENDIX II-C continuedDISTRIBUTION OF LOANS, CONTINGENT LOANS, EQUITY AND GRANTS APPROVED (NET)BY SECTOR AND BY FUND (1970 - 2020) ($’000)
SectorOrdinary Capital
ResourcesSpecial
Development FundOther Special
FundsTotal
Power, Energy, Water and Sanitation 515,383 177,476 77,867 770,726
Power and Energy 256,142 18,625 41,849 316,616
Electric Power 66,755 32,489 1,860 101,104
Alternative Energy 8,250 - 1,791 10,041
Water and Sanitation 184,236 126,362 32,367 342,965
Social Infrastructure and Services 467,888 657,567 178,802 1,304,257
Education - General 144,412 139,811 32,462 316,685
Education - Basic 8,253 60,690 13,173 82,116
Education - Secondary/Vocational 36,332 48,075 6,051 90,458
Education - Post Secondary 159,467 107,628 2,570 269,665
Health 4,091 2,467 2,151 8,709
Housing 74,658 36,959 23,049 134,666
Other Social Infrastructure and Services 40,675 261,937 99,346 401,958
Environmental Sustainability and Disaster Risk Reduction
254,822 316,654 33,482 605,358
Environmental Sustainability 441 5,420 1,186 7,047
Sea Defence/Flood Prevention/Control 15,249 5,026 801 21,076
Disaster Prevention and Preparedness 21,149 76,956 15,002 113,507
Reconstruction Relief and Rehabilitation 217,983 229,252 16,493 463,728
Financial, Business and Other Services 118,376 44,491 3,121 165,988
Financial Policy and Administrative Management 32,083 10,952 2,345 45,380
Financial Intermediaries 86,293 33,539 776 120,608
Multi-Sector and Other 864,181 318,470 112,697 1,295,348
Government and Civil Society 229,021 23,175 15,391 267,587
Urban Development 29,912 10,327 156 40,395
Policy-Based Loans/Structural Adjustment Programme 636,100 257,296 38,800 932,196
Regional/Multulateral Trade Agreements - 3,967 13,182 17,149
Other (30,852) 23,705 45,168 38,021

CARIBBEAN DEVELOPMENT BANK ANNUAL REPORT 2020 | 277
Coun
try
Agr
icul
ture
an
d Ru
ral
Dev
elop
men
t
Min
ing
and
Qua
rryi
ng
Man
ufac
turin
g an
d In
dust
ryTo
uris
mTr
ansp
orta
tion
and
Com
mun
icatio
n
Pow
er,
Ener
gy,
Wat
er a
nd
Sani
tatio
n
Soci
al
Infr
astr
uctu
re
and
Serv
ices
Envi
ronm
enta
l Su
stai
nabi
lity
and
Dis
aste
r Ri
sk R
educ
tion
Fina
ncia
l, Bu
sine
ss
and
Oth
er
Serv
ices
Mul
ti-Se
ctor
an
d O
ther
Tota
l
Ang
uilla
2,87
1-
6,57
81,
193
20,7
1214
,734
9,22
89,
425
22,4
0469
,906
157,
051
Ant
igua
and
Bar
buda
6,63
80
4,05
51,
922
115,
856
8,47
640
,829
48,1
14(6
15)
97,7
5232
3,02
7
Baha
mas
10,0
86-
11,4
682,
187
21,7
7858
,375
5,80
71,
378
274
91,0
5220
2,40
5
Barb
ados
18,8
6910
031
,863
40,0
6116
7,45
944
,666
110,
738
7,64
77,
593
194,
439
623,
435
Beliz
e30
,284
-15
,207
1,25
123
3,46
984
,219
147,
490
19,3
8138
,439
63,1
8163
2,92
1
Cay
man
Isla
nds
1,30
838
81,
671
6,42
923
,047
9,77
55,
551
-44
(13)
48,2
00
Dom
inic
a21
,952
-17
,876
7,50
636
,795
34,3
1867
,610
70,0
1112
,926
40,4
1330
9,40
7
Dom
inic
an R
epub
lic51
9-
--
--
17-
-25
979
5
Gre
nada
25,3
2745
119
,626
4,55
369
,871
20,9
5788
,088
44,1
8211
,034
57,2
1134
1,30
0
Guy
ana
64,1
50-
18,5
0612
828
4,23
813
,718
75,9
7225
,935
(2)
55,7
9453
8,43
9
Hai
ti25
,500
-90
9-
-95
987
,846
17,9
77-
19,0
8615
2,27
7
Jam
aica
146,
990
932
99,0
3015
,646
105,
466
72,7
3512
7,03
411
6,24
049
,825
171,
030
904,
928
Mon
tserra
t1,
408
871,
948
168
25,3
713,
174
10,8
33-
378
(12)
43,3
55
St. K
itts
and
Nev
is6,
164
123
10,8
541,
746
46,8
1730
,529
75,3
7413
,310
520
40,2
0122
5,63
8
St. L
ucia
22,7
2362
25,2
2614
,197
121,
524
79,1
3213
9,27
945
,372
5,62
595
,879
549,
019
Surin
ame
215
-25
--
160,
730
23,2
08-
-59
,298
243,
476
Trin
idad
and
Tob
ago
42,2
1430
,875
32,6
504
38,2
6243
,249
(16,
502)
204
10,0
0833
,685
214,
649
Turk
s an
d C
aico
s Isl
ands
1,51
018
1,01
51,
302
3,14
091
321
,806
1,09
6(2
07)
5,08
835
,681
St. V
ince
nt a
nd th
e G
rena
dine
s16
,899
2,93
913
,174
541
226,
848
74,7
1094
,048
75,5
765
77,5
0258
2,24
2
Virg
in Is
land
s3,
503
-5,
378
403
36,0
185,
062
11,6
7784
,663
150
,000
196,
705
Regi
onal
3,31
30
4,18
21,
430
2,99
58,
311
81,9
5222
,894
4,62
628
,295
157,
998
Regi
onal
: LD
C F
ocus
1,36
511
960
543
011
,059
1,09
112
,690
617
491
5,34
633
,813
Regi
onal
: MD
C F
ocus
25-
--
6,31
3-
9,60
2-
-3,
020
18,9
60
Regi
onal
: LD
C/
MD
C F
ocus
9,89
949
22,3
531,
664
1,55
089
374
,080
1,33
62,
619
36,9
3615
1,37
9
Tota
l46
3,73
236
,143
344,
199
102,
761
1,59
8,58
877
0,72
61,
304,
257
605,
358
172,
881
1,29
5,34
86,
687,
100
APP
END
IX II
-DD
ISTR
IBU
TIO
N O
F LO
AN
S, C
ON
TIN
GEN
T LO
AN
S, E
QU
ITY
AN
D G
RAN
TS A
PPRO
VED
(NET
)BY
CO
UN
TRY
AN
D B
Y SE
CTO
R (1
970
- 202
0) ($
’000
)

CARIBBEAN DEVELOPMENT BANK ANNUAL REPORT 2020 | 278
APPENDIX II-EAPPROVALS OF LOANS, CONTINGENT LOANS, EQUITY AND GRANTS (NET)BY COUNTRY AND BY YEAR (1970 - 2020) ($’000)
Country 1970 - 2014 2015 2016 2017 2018 2019 2020 Total
Anguilla 112,124 2,357 22,046 5,590 14,923 11 - 157,051
Antigua and Barbuda
136,507 50,610 24,853 90,881 2,705 3,855 13,616 323,027
Bahamas 86,329 28,951 (15,560) 281 11,441 50,213 40,750 202,405
Barbados 450,459 46,003 (1,460) (30,966) 115,746 74,971 (31,318) 623,435
Belize 398,365 36,759 35,628 6,052 82,897 8,259 64,961 632,921
Cayman Islands 48,247 - 12 (47) (12) - - 48,200
Dominica 238,224 3,685 3,479 14,343 23,364 1,934 24,378 309,407
Dominican Republic
527 234 17 - - 17 - 795
Grenada 257,990 35,979 12,835 10,390 21 40 24,045 341,300
Guyana 323,552 225 12,396 8,347 5,557 362 188,000 538,439
Haiti 82,186 15,303 12,424 24,575 2,961 3,017 11,811 152,277
Jamaica 783,600 (3,310) 1,015 79,440 21,592 (12,033) 34,624 904,928
St. Kitts and Nevis
209,997 8,407 6,271 1,048 150 - (235) 225,638
St. Lucia 409,224 14,284 44,509 5,013 (12,383) (6,230) 94,602 549,019
Montserrat 23,540 41 11 20,092 (8) - (321) 43,355
Suriname 21,981 592 180,808 31,539 310 46 8,200 243,476
Trinidad and Tobago
203,473 233 410 9 200 10,076 248 214,649
Turks and Caicos Islands
29,254 5,200 13 440 655 119 - 35,681
St. Vincent and the Grenadines
304,170 512 34,579 13,453 40,831 151,905 36,792 582,242
Virgin Islands 77,459 23 13 68,760 50,200 - 250 196,705
Regional 72,816 11,206 12,561 28,296 11,019 12,263 9,837 157,998
Regional: LDC Focus
33,813 - - - - - - 33,813
Regional: MDC Focus
18,960 - - - - - - 18,960
Regional: LDC/MDC Focus
151,379 - - - - - - 151,379
Total 4,474,176 257,294 386,860 377,536 372,169 298,825 520,240 6,687,100
LDCs 2,382,905 173,752 377,481 292,129 206,614 162,956 278,099 3,873,936
MDCs 1,866,549 72,102 (3,199) 57,111 154,536 123,589 232,304 2,502,992
Regional 224,722 11,440 12,578 28,296 11,019 12,280 9,837 310,172
Note: Cancellations prior to 2009 are deducted in the year in which approvals were made.

CARIBBEAN DEVELOPMENT BANK ANNUAL REPORT 2020 | 279
APPENDIX II-FDISTRIBUTION OF LOANS APPROVED (NET)BY COUNTRY AND BY FUND (1970 - 2020) ($’000)
CountryOrdinary Capital
ResourcesSpecial Development
Fund Other Special Funds Total Percentage of Total
Anguilla 142,156 11,599 500 154,255 2.8%
Antigua and Barbuda 233,480 45,174 9,346 288,000 5.2%
Bahamas 192,326 3,036 3,240 198,602 3.6%
Barbados 560,377 6,909 35,779 603,065 10.9%
Belize 340,177 182,137 11,265 533,579 9.6%
Cayman Islands 39,884 4,703 3,313 47,900 0.9%
Dominica 85,103 137,364 36,322 258,789 4.7%
Grenada 106,990 165,862 32,483 305,335 5.5%
Guyana 172,144 224,703 22,164 419,011 7.6%
Jamaica 505,111 217,478 74,831 797,420 14.4%
St. Kitts and Nevis 102,148 96,151 9,025 207,324 3.7%
St. Lucia 259,284 175,139 38,811 473,234 8.5%
Montserrat 485 10,857 1,372 12,714 0.2%
Suriname 214,702 25,755 - 240,457 4.3%
Trinidad and Tobago 203,808 5,018 2,566 211,392 3.8%
Turks and Caicos Islands
17,399 12,100 - 29,499 0.5%
St. Vincent and the Grenadines
304,757 152,375 23,522 480,654 8.7%
Virgin Islands 169,833 22,041 1,894 193,768 3.5%
Regional 10,467 5,175 - 15,642 0.3%
Regional: LDC Focus 10,000 5,232 2,626 17,858 0.3%
Regional: MDC Focus 7,266 5,544 2,174 14,984 0.3%
Regional: LDC/MDC Focus
39,912 742 - 40,654 0.7%
Total 3,717,809 1,515,094 311,233 5,544,136
Percentage of Total 67.1 27.3 5.6 100.0
LDCs 2,026,398 1,046,489 170,479 3,243,366 58.5%
MDCs 1,641,032 462,688 140,754 2,244,474 40.5%
Regional 50,379 5,917 0 56,296 1.0%

CARIBBEAN DEVELOPMENT BANK ANNUAL REPORT 2020 | 280
APPENDIX II-GDISTRIBUTION OF LOANS APPROVED (NET)BY SECTOR AND BY FUND (1970 - 2020) ($’000)
SectorOrdinary Capital
ResourcesSpecial Development
FundOther Special
Funds Total
Total All Sectors 3,717,809 1,515,094 311,233 5,544,136
Agriculture and Rural Development 188,424 129,805 36,835 355,064
Agriculture (excluding Crop Farming) 127,840 35,704 18,865 182,409
Crop Farming 3,725 5,895 2,780 12,400
Export Crops 39,223 23,314 4,674 67,211
Mixed Farming 207 100 1,421 1,728
Irrigation, Drainage and Land Reclamation 10,948 7,816 409 19,173
Fishing - 2,437 694 3,131
Land Settlement and Rural Development 3,947 25,567 312 29,826
Feeder Roads and Bridges 2,534 28,972 7,680 39,186
Mining and Quarrying 31,409 3,294 436 35,139
Fossil Fuels 30,862 535 430 31,827
Metal Ores 547 - - 547
Non-Metallic Minerals - 2,759 6 2,765
Manufacturing and Industry 185,140 73,426 47,544 306,110
Industrial Development 178,828 59,702 13,383 251,913
Micro and Small Scale Enterprises - 8,563 1,137 9,700
Agro-Industries (175) 5,086 32,318 37,229
Textile, Wearing Apparel and Leather Goods - 2 260 262
Forest Industries 3,502 - - 3,502
Chemicals and Chemical Products - - 446 446
Non-Metallic Mineral Products 2,985 73 - 3,058
Tourism 78,611 10,803 6,935 96,349
Tourism 78,611 10,803 6,935 96,349
Transportation and Communication 1,013,575 259,864 76,340 1,349,779
Transport Policy and Administrative Management 39,204 19,130 - 58,334
Road Transport 557,227 163,971 31,162 752,360
Water Transport 142,948 50,982 15,041 208,971
Air Transport 265,946 25,744 30,137 321,827
Communication 8,250 37 - 8,287
Power, Energy, Water and Sanitation 515,383 167,607 25,444 708,434
Power and Energy 256,142 15,206 - 271,348
Electric Power 66,755 32,304 1,577 100,636
Alternative Energy 8,250 - - 8,250
Water and Sanitation 184,236 120,097 23,867 328,200
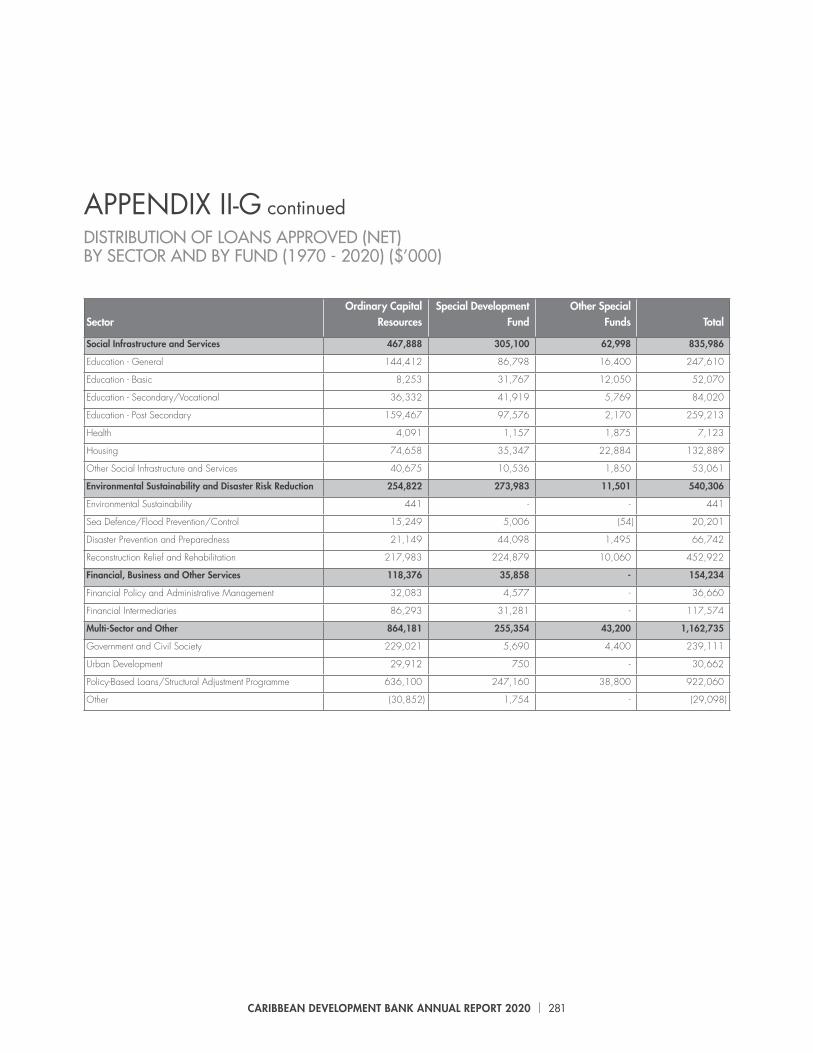
CARIBBEAN DEVELOPMENT BANK ANNUAL REPORT 2020 | 281
APPENDIX II-G continuedDISTRIBUTION OF LOANS APPROVED (NET)BY SECTOR AND BY FUND (1970 - 2020) ($’000)
SectorOrdinary Capital
ResourcesSpecial Development
FundOther Special
Funds Total
Social Infrastructure and Services 467,888 305,100 62,998 835,986
Education - General 144,412 86,798 16,400 247,610
Education - Basic 8,253 31,767 12,050 52,070
Education - Secondary/Vocational 36,332 41,919 5,769 84,020
Education - Post Secondary 159,467 97,576 2,170 259,213
Health 4,091 1,157 1,875 7,123
Housing 74,658 35,347 22,884 132,889
Other Social Infrastructure and Services 40,675 10,536 1,850 53,061
Environmental Sustainability and Disaster Risk Reduction 254,822 273,983 11,501 540,306
Environmental Sustainability 441 - - 441
Sea Defence/Flood Prevention/Control 15,249 5,006 (54) 20,201
Disaster Prevention and Preparedness 21,149 44,098 1,495 66,742
Reconstruction Relief and Rehabilitation 217,983 224,879 10,060 452,922
Financial, Business and Other Services 118,376 35,858 - 154,234
Financial Policy and Administrative Management 32,083 4,577 - 36,660
Financial Intermediaries 86,293 31,281 - 117,574
Multi-Sector and Other 864,181 255,354 43,200 1,162,735
Government and Civil Society 229,021 5,690 4,400 239,111
Urban Development 29,912 750 - 30,662
Policy-Based Loans/Structural Adjustment Programme 636,100 247,160 38,800 922,060
Other (30,852) 1,754 - (29,098)

CARIBBEAN DEVELOPMENT BANK ANNUAL REPORT 2020 | 282
APPENDIX II-HCONTINGENT LOANS APPROVED (NET)BY COUNTRY AND BY FUND (1970 - 2020) ($’000)
CountryOrdinary Capital
ResourcesSpecial Development
Fund Other Special Funds Total Percentage of Total
Anguilla - - 71 71 1.4%
Antigua and Barbuda - 4 - 4 0.1%
Barbados - 384 156 540 10.4%
Belize - 829 152 981 18.9%
Dominica - - 809 809 15.5%
Grenada - 241 - 241 4.6%
Jamaica - 286 - 286 5.5%
St. Kitts and Nevis - 178 56 234 4.5%
St. Lucia - 145 50 195 3.7%
Montserrat - 87 - 87 1.7%
Trinidad and Tobago - 200 - 200 3.8%
Turks and Caicos Islands - 1,054 - 1,054 20.3%
St. Vincent and the Grenadines
- 217 131 348 6.7%
Virgin Islands - 50 104 154 3.0%
Total - 3,675 1,529 5,204
Percentage of Total 0.0 70.6 29.4 100.0
LDCs 0 2,805 1,373 4,178 80.3%
MDCs 0 870 156 1,026 19.7%

CARIBBEAN DEVELOPMENT BANK ANNUAL REPORT 2020 | 283
APPENDIX II-ICONTINGENT LOANS APPROVED (NET)BY SECTOR AND BY FUND (1970 - 2020) ($’000)
SectorOrdinary Capital
ResourcesSpecial Development
Fund Other Special Funds Total
Total All Sectors - 3,675 1,529 5,204
Agriculture and Rural Development
- 460 147 607
Agriculture (excluding Crop Farming)
- 185 96 281
Crop Farming - - 51 51
Export Crops - 75 - 75
Land Settlement and Rural Development
- 200 - 200
Mining and Quarrying - 391 131 522
Fossil Fuels - 391 131 522
Manufacturing and Industry - 52 - 52
Industrial Development - 52 - 52
Tourism - 93 - 93
Tourism - 93 - 93
Transportation and Communication
- 2,096 243 2,339
Transport Policy and Administrative Management
- 1,267 104 1,371
Road Transport - 245 38 283
Air Transport - 584 101 685
Power, Energy, Water and Sanitation
- 583 852 1,435
Power and Energy - 222 824 1,046
Water and Sanitation - 361 28 389
Multi-Sector and Other - - 156 156
Urban Development - - 156 156
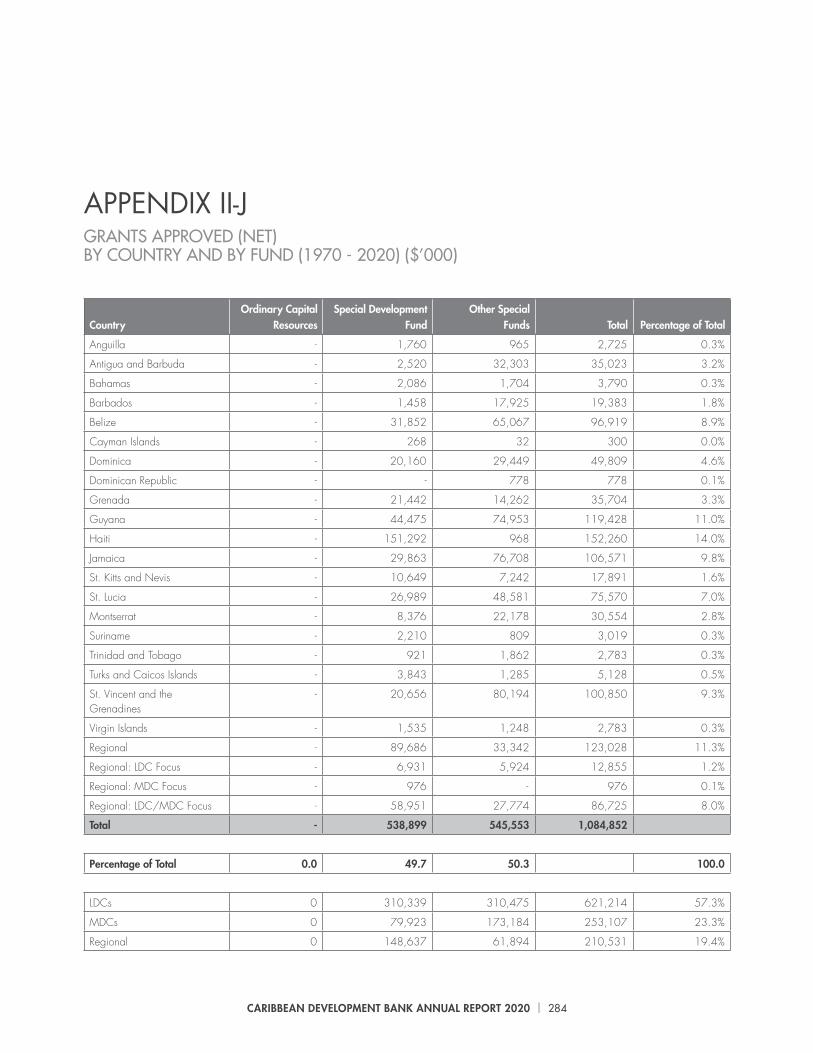
CARIBBEAN DEVELOPMENT BANK ANNUAL REPORT 2020 | 284
APPENDIX II-JGRANTS APPROVED (NET)BY COUNTRY AND BY FUND (1970 - 2020) ($’000)
CountryOrdinary Capital
ResourcesSpecial Development
FundOther Special
Funds Total Percentage of Total
Anguilla - 1,760 965 2,725 0.3%
Antigua and Barbuda - 2,520 32,303 35,023 3.2%
Bahamas - 2,086 1,704 3,790 0.3%
Barbados - 1,458 17,925 19,383 1.8%
Belize - 31,852 65,067 96,919 8.9%
Cayman Islands - 268 32 300 0.0%
Dominica - 20,160 29,449 49,809 4.6%
Dominican Republic - - 778 778 0.1%
Grenada - 21,442 14,262 35,704 3.3%
Guyana - 44,475 74,953 119,428 11.0%
Haiti - 151,292 968 152,260 14.0%
Jamaica - 29,863 76,708 106,571 9.8%
St. Kitts and Nevis - 10,649 7,242 17,891 1.6%
St. Lucia - 26,989 48,581 75,570 7.0%
Montserrat - 8,376 22,178 30,554 2.8%
Suriname - 2,210 809 3,019 0.3%
Trinidad and Tobago - 921 1,862 2,783 0.3%
Turks and Caicos Islands - 3,843 1,285 5,128 0.5%
St. Vincent and the Grenadines
- 20,656 80,194 100,850 9.3%
Virgin Islands - 1,535 1,248 2,783 0.3%
Regional - 89,686 33,342 123,028 11.3%
Regional: LDC Focus - 6,931 5,924 12,855 1.2%
Regional: MDC Focus - 976 - 976 0.1%
Regional: LDC/MDC Focus - 58,951 27,774 86,725 8.0%
Total - 538,899 545,553 1,084,852
Percentage of Total 0.0 49.7 50.3 100.0
LDCs 0 310,339 310,475 621,214 57.3%
MDCs 0 79,923 173,184 253,107 23.3%
Regional 0 148,637 61,894 210,531 19.4%

CARIBBEAN DEVELOPMENT BANK ANNUAL REPORT 2020 | 285
APPENDIX II-KGRANTS APPROVED (NET)BY SECTOR AND BY FUND (1970 - 2020) ($’000)
Sector Ordinary Capital Resources
Special Development Fund
Other Special Funds
Total
Total All Sectors - 538,899 545,553 1,084,852
Agriculture and Rural Development - 34,738 71,658 106,396
Agriculture (excluding Crop Farming) - 2,615 1,594 4,209
Crop Farming - 320 88 408
Export Crops - - 58 58
Mixed Farming - 179 207 386
Irrigation, Drainage and Land Reclamation - 151 156 307
Fishing - 41 178 219
Land Settlement and Rural Development - 11,122 372 11,494
Feeder Roads and Bridges - 20,310 69,005 89,315
Mining and Quarrying - 190 292 482
Fossil Fuels - - 292 292
Metal Ores - 190 - 190
Manufacturing and Industry - 20,127 6,983 27,110
Industrial Development - 2,160 4,007 6,167
Micro and Small Scale Enterprises - 13,765 712 14,477
Agro-Industries - 1,588 2,025 3,613
Textile, Wearing Apparel and Leather Goods - 106 51 157
Forest Industries - 348 - 348
Chemicals and Chemical Products - 13 95 108
Construction - 2,147 93 2,240
Tourism - 2,148 3,080 5,228
Tourism - 2,148 3,080 5,228
Transportation and Communication - 5,523 240,947 246,470
Transport Policy and Administrative Management - 930 4,106 5,036
Road Transport - 2,078 176,417 178,495
Water Transport - 562 56,773 57,335
Air Transport - 1,337 3,398 4,735
Communication - 481 106 587
Storage - 135 147 282
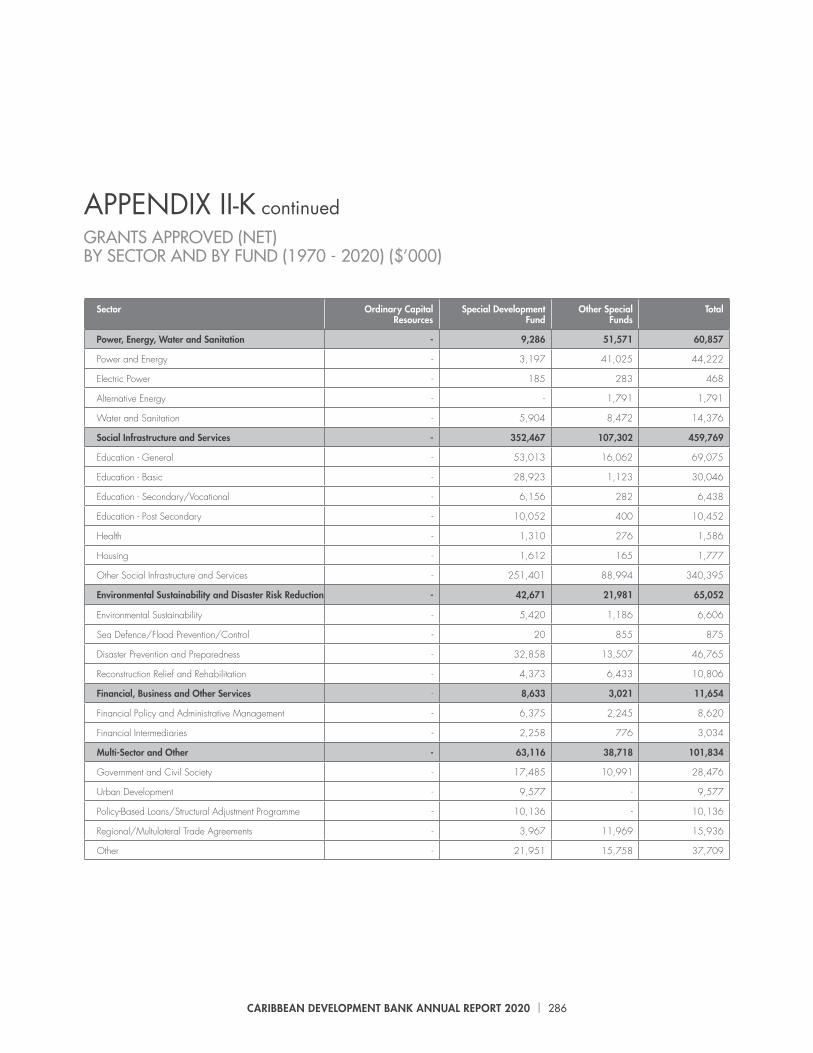
CARIBBEAN DEVELOPMENT BANK ANNUAL REPORT 2020 | 286
Sector Ordinary Capital Resources
Special Development Fund
Other Special Funds
Total
Power, Energy, Water and Sanitation - 9,286 51,571 60,857
Power and Energy - 3,197 41,025 44,222
Electric Power - 185 283 468
Alternative Energy - - 1,791 1,791
Water and Sanitation - 5,904 8,472 14,376
Social Infrastructure and Services - 352,467 107,302 459,769
Education - General - 53,013 16,062 69,075
Education - Basic - 28,923 1,123 30,046
Education - Secondary/Vocational - 6,156 282 6,438
Education - Post Secondary - 10,052 400 10,452
Health - 1,310 276 1,586
Housing - 1,612 165 1,777
Other Social Infrastructure and Services - 251,401 88,994 340,395
Environmental Sustainability and Disaster Risk Reduction - 42,671 21,981 65,052
Environmental Sustainability - 5,420 1,186 6,606
Sea Defence/Flood Prevention/Control - 20 855 875
Disaster Prevention and Preparedness - 32,858 13,507 46,765
Reconstruction Relief and Rehabilitation - 4,373 6,433 10,806
Financial, Business and Other Services - 8,633 3,021 11,654
Financial Policy and Administrative Management - 6,375 2,245 8,620
Financial Intermediaries - 2,258 776 3,034
Multi-Sector and Other - 63,116 38,718 101,834
Government and Civil Society - 17,485 10,991 28,476
Urban Development - 9,577 - 9,577
Policy-Based Loans/Structural Adjustment Programme - 10,136 - 10,136
Regional/Multulateral Trade Agreements - 3,967 11,969 15,936
Other - 21,951 15,758 37,709
APPENDIX II-K continuedGRANTS APPROVED (NET)BY SECTOR AND BY FUND (1970 - 2020) ($’000)

CARIBBEAN DEVELOPMENT BANK ANNUAL REPORT 2020 | 287
APPENDIX II-LGRANTS APPROVED (NET)BY COUNTRY AND BY YEAR (1970 - 2020) ($’000)
Country 1970 - 2014 2015 2016 2017 2018 2019 2020 Total
Anguilla 2,352 16 46 277 23 11 - 2,725
Antigua and Barbuda
6,873 610 18,872 1,271 2,926 3,855 616 35,023
Bahamas 1,414 712 436 281 (3) 200 750 3,790
Barbados 17,752 594 267 12 408 200 150 19,383
Belize 32,763 1,759 3,087 6,052 31,863 1,541 19,847 96,912
Cayman Islands 347 - 12 (47) (12) - - 300
Dominica 32,961 1,322 1,252 2,898 7,669 2,047 1,878 50,027
Dominican Republic
527 234 17 - - - - 778
Grenada 24,783 979 2,603 5,053 21 710 1,555 35,704
Guyana 42,741 637 857 9,081 (34) 2,049 65,825 121,156
Haiti 82,356 15,303 12,424 24,575 2,961 3,000 11,811 152,430
Jamaica 22,339 834 1,015 54,440 21,697 1,727 4,624 106,676
St. Kitts and Nevis
16,042 407 479 1,048 150 - (235) 17,891
St. Lucia 29,010 1,033 2,011 4,263 - 968 38,285 75,570
Montserrat 10,535 41 11 20,092 (8) - - 30,671
Suriname 41 592 309 1,721 310 46 - 3,019
Trinidad and Tobago
1,881 233 410 9 200 50 - 2,783
Turks and Caicos Islands
4,815 200 13 (1) (18) 119 - 5,128
St. Vincent and the Grenadines
25,047 748 16,062 8,418 5,657 40,001 4,917 100,850
Virgin Islands 1,078 23 13 1,219 200 - 250 2,783
Regional 44,018 11,467 12,561 28,296 11,019 3,794 9,542 120,697
Regional: LDC Focus
12,855 - - - - - - 12,855
Regional: MDC Focus
976 - - - - - - 976
Regional: LDC/MDC Focus
86,725 - - - - - - 86,725
Total 500,231 37,744 72,757 168,958 85,029 60,318 162,652 1,084,852
LDCs 281,682 23,033 57,194 76,839 51,742 52,298 78,924 621,712
MDCs 87,279 3,010 2,985 63,823 22,268 4,226 71,349 254,940
Regional 131,270 11,701 12,578 28,296 11,019 3,794 12,379 211,037
Note: Cancellations prior to 2009 are deducted in the year in which approvals were made.

CARIBBEAN DEVELOPMENT BANK ANNUAL REPORT 2020 | 288
BMC - Borrowing Member Country
BNTF - Basic Needs Trust Fund
CAPE - Caribbean Advanced Proficiency Examination
CARICOM - Caribbean Community
CCRIF - Caribbean Catastrophe Risk Insurance Facility
CDB - Caribbean Development Bank
CTCS - Caribbean Technological Consultancy Services
EDGE - Economic Dividends for Gender Equality
ERC - Enterprise Risk Committee
GCF - Green Climate Fund
GDP - Gross domestic product
IAD - Internal Audit Division
ICA - Office of Integrity, Compliance and Accountability
IDB - Inter-American Development Bank
IFRS - International Financial Reporting Standards
IMF - International Monetary Fund
km - kilometres
mn - million
MSME - micro, small and medium-sized enterprise
OAC - Oversight and Assurance Committee
OCR - Ordinary Capital Resources
OECS - Organisation of Eastern Caribbean States
OIE - Office of Independent Evaluation
ORM - Office of Risk Management
OSF - Other Special Funds
P&L - Profit and loss
PPAM - Public Policy Analysis and Management
$ refers to U.S. Dollars throughout unless otherwise stated
ABBREVIATIONS
AND ACRONYMS

CARIBBEAN DEVELOPMENT BANK ANNUAL REPORT 2020 | 289
PPE - Personal protective equipment
RMF - Results Management Framework
S&P - Standard and Poor’s
SDF - Special Development Fund
SFR - Special Funds Resources
SDGs - Sustainable Development Goals
SEF - Sustainable Energy Facility
TA - Technical Assistance
TVET - Technical and vocational education and training
UKCIF - United Kingdom Caribbean Infrastructure Fund
$ refers to U.S. Dollars throughout unless otherwise stated

CARIBBEAN DEVELOPMENT BANK ANNUAL REPORT 2020 | 290

CARIBBEAN DEVELOPMENT BANK ANNUAL REPORT 2020 | 291

CARIBBEAN DEVELOPMENT BANK ANNUAL REPORT 2020 | 292

CARIBBEAN DEVELOPMENT BANK ANNUAL REPORT 2020 | 293

CARIBBEAN DEVELOPMENT BANK ANNUAL REPORT 2020
294