carl : cyberoam aggregated reporting and logging :: user guide
TRANSCRIPT

CARL : Cyberoam Aggregated Reporting and Logging :: User Guide
1
Table Of Contents INTRODUCTION........................................................................................................ 4
About Cyberoam Aggregated Reporting and Logging......................................................... 5
INSTALLATION AND SETUP ................................................................................... 6
System Requirements ......................................................................................................... 6
Prerequisites........................................................................................................................ 8
Installing and Uninstalling .................................................................................................. 10
Starting and Shutting Down............................................................................................... 11
Accessing the Web Client.................................................................................................. 12
License Information ........................................................................................................... 13
GETTING STARTED ............................................................................................... 14
Using the Dashboard......................................................................................................... 15
Using the Sub Tab............................................................................................................. 19
Using The Left Navigation Pane ........................................................................................ 20
Dashboard View Customization......................................................................................... 22
FIREWALL REPORTS ............................................................................................ 24
Generating Reports ........................................................................................................... 24
Live Reports....................................................................................................................... 25
Traffic Reports ................................................................................................................... 26
Protocol Usage Reports..................................................................................................... 28
Web Usage Reports .......................................................................................................... 30
Mail Usage Reports ........................................................................................................... 32
FTP Usage Reports ........................................................................................................... 34
Telnet Usage Reports........................................................................................................ 36
Event Summary Reports.................................................................................................... 38
Firewall Rules Report ........................................................................................................ 39
Inbound Outbound Reports ............................................................................................... 40
Intranet Reports ................................................................................................................. 41
Internet Reports ................................................................................................................. 42
Streaming and Chat Sites Reports .................................................................................... 43

CARL : Cyberoam Aggregated Reporting and Logging :: User Guide
2
Security Reports ................................................................................................................ 44
Virus Reports ..................................................................................................................... 46
Attack Reports ................................................................................................................... 48
TREND REPORTS................................................................................................... 50
Protocol Trend Reports...................................................................................................... 51
Traffic Trend Reports......................................................................................................... 52
Event Trend Reports.......................................................................................................... 53
CUSTOM REPORTS ............................................................................................... 54
Creating Report Profiles .................................................................................................... 54
Setting Log Filters.............................................................................................................. 56
Creating Custom Criteria Reports...................................................................................... 57
NOTIFICATIONS ..................................................................................................... 60
Creating an Alert Profile..................................................................................................... 60
Viewing Alerts .................................................................................................................... 63
Alerts Administration.......................................................................................................... 64
SYSTEM SETTINGS................................................................................................ 66
Simulating Firewall Logs.................................................................................................... 67
Configuring Data Storage Duration.................................................................................... 68
Managing Syslog Servers.................................................................................................. 70
Managing Alert Profiles...................................................................................................... 71
Importing Log Files ............................................................................................................ 72
Archiving Log Files ............................................................................................................ 74
Viewing Device Details ...................................................................................................... 76
Scheduling Reports ........................................................................................................... 77
Working Hour Configuration .............................................................................................. 79
Report View Customization ............................................................................................... 80
Configuring DNS Resolution.............................................................................................. 81
Configuring to View Unused Firewall Rules....................................................................... 83

CARL : Cyberoam Aggregated Reporting and Logging :: User Guide
3
ADMIN SETTINGS................................................................................................... 84
Setting up the Mail Server ................................................................................................. 84
Managing Protocol Groups ................................................................................................ 85
Adding Different Users....................................................................................................... 87
Accessing the Database.................................................................................................... 90
Setting up Intranets............................................................................................................ 91
Viewing Server Diagnostics ............................................................................................... 92
Changing Account Settings ............................................................................................... 93
Configuring Firewall Availability Alerts............................................................................... 94
CONFIGURING CYBEROAM.................................................................................. 95
Configuring Cyberoam....................................................................................................... 96
TIPS AND TRICKS ................................................................................................ 100
Frequently Asked Questions............................................................................................ 100
Troubleshooting Tips ....................................................................................................... 104
USING ASK ME..................................................................................................... 107
CONTACTING TECHNICAL SUPPORT ............................................................... 108

CARL : Cyberoam Aggregated Reporting and Logging :: User Guide
4
Introduction
A Firewall is an important perimeter defense tool which protects your network from attacks. Security tools like Firewalls generate a huge quantity of traffic logs, which can be mined to generate a wealth of security information reports.
What is Cyberoam Aggregated Reporting and Logging?
Cyberoam Aggregated Reporting and Logging is a browser-based firewall server reporting solution that uses a built-in syslog server to store, analyze, and report on these logs. CARL provides daily, weekly, monthly, and yearly reports on firewall traffic, security breaches, and more. This helps network administrators to proactively secure networks before security threats arise, avoid network abuses, manage bandwidth requirements, monitor web site visits, and ensure appropriate usage of networks by employees. Cyberoam Aggregated Reporting and Logging (CARL) analyzes your firewall logs and answers questions like the following:
• Who are the top Web surfers in the company, and what web sites are they visiting?
• How many users inside the firewall are trying to access web sites with inappropriate content?
• How much network activity originates on each side of the firewall? • Are we experiencing hack attempts? Where are they originating? • Which servers receive the most hits?
This User Guide will help you install CARL on your machine, and get familiar with the CARL user interface. If you are unable to find the information you are looking for in this document, please let us know at [email protected]

CARL : Cyberoam Aggregated Reporting and Logging :: User Guide
5
About Cyberoam Aggregated Reporting and Logging
CARL automatically collects, correlates, and analyzes security device information from multiple Cyberoam appliances. The following are some of the key features of this release:
Feature Description Automated syslog collection and processing
Automatically collects and parses logs, and updates the database at user-defined intervals
Syslog archiving Allows for archiving of log files at user-defined intervals
Built-in database Stores and processes syslog data in the embedded MySQL database
Dashboard Provides a quick view of current activity across all devices from a single place
Automatic alerting
Automatically notifies and warns against specific events based on user-defined thresholds. Reports on network behavioral analysis can be obtained from Anomaly Alert Reports.
Pre-defined device reports
Includes traffic analysis reports across all devices or specific to firewalls
Historical trending Allows you to analyze trends in bandwidth usage, protocol usage, etc. over varying time periods
Customizable report profiles
Allows you to build reports to meet your specific needs
Report scheduling Automatically generates reports at specified time intervals and delivers them as PDF reports via email.
Multiple report formats
Generates and exports reports in HTML, PDF, and CSV formats.
Advanced user management
Allows you to create different users and set appropriate access privileges

CARL : Cyberoam Aggregated Reporting and Logging :: User Guide
6
Installation and Setup
System Requirements
This section lists the minimum system requirements for installing and working with CARL.
• Hardware Requirements • MySql Performance Improvement Parameters • Supported Operating Systems • Supported Web Browsers
Hardware Requirements
The minimum hardware requirements for CARL to start running are listed below. Processor: 1GHz Intel™ Pentium 4 or equivalent Memory*: 512MB of RAM Disk Space*: 1GB for the product. CARL is optimized for 1024x768 resolution and above. * The following table recommends the disk space and RAM size requirements of the system where CARL is installed. The disk space and RAM size requirements depends on the number of devices sending log information to CARL, the number of firewall log records received per second or the firewall log data received per day by CARL.
Log Records Rate or Volume
RAM Size Hard Disk Space Requirement
Per Month to Archive Logs 50/sec or 1.5 GB/day 512 MB 30 GB 100/sec or 3 GB/day 1 GB 90 GB 300/sec or 9 GB/day 2 GB 270 GB 500/sec or 15 GB/day 2 GB 450 GB 1000/sec or 30 GB/day 3 GB 900 GB 2000/sec or 60 GB/day 4 GB 1.8 TB
CPU Requirements
• Dedicated machine has to be allocated to process more than 200 logs per second. • Dual core processors are needed to process more than 500 logs per second. • Quadra core processors are needed to process more than 1000 logs second.
RAM Requirements
• Number of firewalls handled by the CARL will increase the requirement of the above RAM values. So it is better to have RAM value higher than the suggested value in case of having more than 5 firewalls.

CARL : Cyberoam Aggregated Reporting and Logging :: User Guide
7
Separate Installation
• CARL server and MySQL database can be installed in separate machines, in case of higher log rate with low-end CPU machines.
Hard Disk Requirements for more months
• The above Hard Disk space requirement projected is for one month. If you need to archive the logs for more number of months, multiply the above requirements with the number of months based on your requirement.
Note: The Log Records Per Second is the total log records received per second by CARL from all the configured devices. MySql Performance Improvement Parameters For better performance, we recommend replacing the existing MySQL parameters mentioned in startDB.bat/sh, available under <CARL Home>\bin directory, with the following MySQL parameters changes for the corresponding RAM Size.
RAM Size MySQL Parameters For Windows Installation 512 MB Default configuration as given in startDB.bat
1 GB --innodb_buffer_pool_size=400M
--key_buffer_size=250M --tmp_table_size=100M
2 GB --innodb_buffer_pool_size=900M
--key_buffer_size=600M --tmp_table_size=100M
3 GB --innodb_buffer_pool_size=900M
--key_buffer_size=600M --tmp_table_size=100M
4 GB --innodb_buffer_pool_size=900M
--key_buffer_size=600M --tmp_table_size=100M
Supported Operating Systems CARL has been tested to run on the following operating systems and versions:
• Windows™ NT/2000/2003/XP/Vista
Supported Web Browsers CARL has been tested to support the following browsers and versions:
• Internet Explorer 5.5 or later • Netscape 7.0 or later • Mozilla 1.5 or later • Firefox 1.0 or later

CARL : Cyberoam Aggregated Reporting and Logging :: User Guide
8
Prerequisites
This topic deals with the following pre-requisites for setting up CARL in your enterprise.
• Ports to be Freed • Recommended System Setup • Changing Default Ports
Ports to be Freed CARL requires the following ports to be free:
Port Number
Usage
8500 This is the default web server port. You will access the CARL server from a web browser using this port number. You may change this port during installation.
514, 1514
These are the default listener ports on which CARL listens for incoming logs exported from devices. You can add more ports on which CARL can listen for incoming logs.
33336 This is the port used to connect to the MySQL database in CARL
Look up Changing Default Ports for help on changing the default ports used by CARL
Recommended System Setup Apart from the System Requirements, the following setup would ensure optimal performance from CARL:
Run CARL on a separate, dedicated PC or server. The software is resource-intensive, and a busy processor may cause problems in collecting logs.
Use the MySQL bundled with CARL that runs on port 33336. You need not start another separate instance of MySQL.
Changing Default Ports
Changing the default MySQL port:
1. Edit the mysql-ds.xml file present in the <CARL Home>/server/default/deploy directory.
2. Change the port number in the following line to the desired port number: <connection-url>jdbc:mysql://localhost:33336/firewall</connection-url>
3. Save the file and restart the server.

CARL : Cyberoam Aggregated Reporting and Logging :: User Guide
9
Changing the default web server port:
1. Edit the sample-bindings.xml file present in the <CARL Home>/server/default/conf directory.
2. Change the port number in the following line to the desired port number: <binding port="8500"/>
3. Save the file and restart the server.

CARL : Cyberoam Aggregated Reporting and Logging :: User Guide
10
Installing and Uninstalling
CARL is available for Windows platform. For more information on supported versions and other specifications, look up System Requirements. This topic covers the following procedures:
• Installing CARL on Windows • Uninstalling from Windows
Installation This section explains the key steps for installing CARL. Refer the User Guide for detailed CARL installation information. Installing on Windows
1. Double-click the CARL.exe file to launch setup program 2. Follow the instructions as they appear on the screen. Once the installation is
complete you will notice a tray icon, which provides you with the following options.
Option Description CARL Server Status
This option provides you details like Server Name, Server IpAddress , Server Port, Server Status.
Start WebClient This option will open up your default browser and connect you to the web login UI of CARL Server, provided the server has already been started.
Shutdown Server
This option will shutdown the CARL Server.
Note: The tray icon option is only available for Windows ! Uninstalling from Windows
• Click on Start > Programs > CARL> Uninstall CARL to uninstall CARL from the machine.
CARL : Cyberoam Aggregated Reporting and Logging :: User Guide
11
Starting and Shutting Down
Once you have successfully installed CARL, start the CARL server by following the steps below. This topic covers the following procedures:
• Starting CARL in Windows • Shutting down from Windows
Starting CARL in Windows
1. Click on Start > Programs > CARL > CARL to start the server. Alternatively you can navigate to the <CARL Home>\bin folder, and invoke the run.bat file.
2. Once the server has successfully started, you can either use the Start WebClient tray-icon option or alternatively open a web browser and type the URL, http://<hostname>:8500 (replace <hostname> with the name of the machine on which CARL is installed, and 8500 with the web server port specified during installation).
Shutting Down from Windows
• Click on Start > Programs > CARL > Shutdown CARL to shut down the server. Alternatively you can navigate to the <CARL Home>\bin folder, and invoke the shutdown.bat file. As already mentioned, you can also make use of the tray-icon option Shutdown Server.
CARL : Cyberoam Aggregated Reporting and Logging :: User Guide
12
Accessing the Web Client
CARL is essentially a firewall log analysis tool that collects, stores, and reports on logs from distributed firewalls on the network. Once the server has successfully started, follow the steps below to access CARL.
1. Open a supported web browser window 2. Type the URL address as http://<hostname>:8500 (where <hostname> is the
name of the machine on which CARL is running, and 8500 is the default web server port)
3. Log in to CARL using the default username/password combination of admin/admin.
Once you log in, you can start collecting firewall logs, generate reports, and more.
If you want to access the web client from the same machine on which CARL is installed, execute the startClient.bat/.sh file from the <CARL Home>/bin directory.
• On a Windows machine, you can also access the web client from the Start menu by clicking on Start > Programs > CARL > CARL Web Client.
• On a Windows machine, you can also access the web client from the System Tray by right-clicking on CARL Tray Icon > Start Web Client.
CARL : Cyberoam Aggregated Reporting and Logging :: User Guide
13
License Information
After you log in to CARL, click the Upgrade License link present in the top-right corner of the screen. The License window that opens, shows you the license information for the current CARL installation. The License window displays the following information:
• Type of license applied - Trial or Registered (Professional, Premium) • Product version number • Number of days remaining for the license to expire • Maximum number of devices that you are allowed to manage
Upgrading your License
Before upgrading the current license, make sure you have the new license file from Cyberoam saved on that system.
1. Browse for the new license file, and select it. 2. Click Upgrade to apply the new license file.
The new license is applied with immediate effect. Contact [email protected] or [email protected] for any license-related queries.

CARL : Cyberoam Aggregated Reporting and Logging :: User Guide
14
Getting Started
Once CARL has been successfully set up and started in your network, the next thing you need to do is start sending logs to the CARL server. As soon as you log in, you will see the Dashboard. If no devices are sending logs to CARL, you will see a welcome screen, with options to help you get started. The options are:
• Configure Your Firewall • Add Syslog Server • Import Log File • Simulate
Each of those options is explained below: Configure Your Firewall If your firewall is capable of exporting logs to the displayed ports in CARL, then set the appropriate parameters in the firewall to do so. Click the How do I do this? link for specific instructions on setting up log exports on certain firewalls. Add Syslog Server If your firewall cannot export logs to the displayed ports in CARL, but can export logs to another port, click the Add Syslog Server link to add a virtual syslog server and start receiving exported logs on the newly configured port. Import Log File If your firewall cannot export logs, click the Import Log File link to import a log file from the local machine or a remote machine via FTP. Simulate If you do not want to receive log files from any device, but still generate reports, click the Simulate link to generate reports from sample firewall logs. You can later turn this off by clicking the Stop Simulate link from the Settings tab.

CARL : Cyberoam Aggregated Reporting and Logging :: User Guide
15
Using the Dashboard
The Dashboard is shown when the Home tab is clicked. It is the first page you see when you log in. You can also customize your Dashboard Views as per requirements.
Dashboard Views selection is available only in the Home tab.
Once the server has started receiving records, the Dashboard dynamically changes to display the current statistics for each device whose log files are analyzed. The CARL dashboard shows the:
• Traffic Overview Graphs • Security Overview Graphs • Traffic Statistics • Security Statistics • Basic Search • Advanced Search
The Traffic Overview graphs shows protocol-wise distribution of traffic across each device. At one glance, you can see the total traffic generated by each protocol group across each device. You can also drill down from the bars in the graph to see specific protocol usage in the Protocol Usage Report. The Security Overview graphs shows distribution of security events like attack, virus, port scans, etc.. generated across each device. Drill down from the bars in the graph to see the corresponding events generated. The Traffic Statistics table, shows the Traffic Overview graph's data in more detail, with specific percentage values of incoming and outgoing traffic per protocol group across each device. The Show bar lets you view the the top 5(default) / 10 / 15 or All protocol groups, captured in the logs across the configured devices. You can click on the Traffic IN, Traffic OUT, and Total Traffic for each protocol group of the configured device to obtain the drill-downs of the traffic. If the icon is displayed above the table, it indicates that intranet's have not been configured. You need to configure intranet's if you want to separate inbound and outbound firewall traffic. The traffic values in the table let you drill down to see traffic details for the corresponding protocol group in the Protocol Usage Report. The Quick Reports link provides you 'quick' access to the top level details of traffic like Top Hosts, Top Destinations, Top Conversations, Top Protocol Groups, Top Firewall Rules, and Top Attack Reports for the corresponding firewall. The icon next to the Unassigned protocol group indicates traffic details for protocols that have not been assigned to any protocol group. Click the icon, and under the View Identifiers tab, you can see the traffic details for each of these unassigned protocols. The Assign Group tab provides you with options to either associate these unknown protocols to the predefined Protocol Groups (and Protocols) or create a new Protocol Group (and Protocol). You can do this by selecting from the listed identifier and assigning
it to either the pre-defined Protocol Group (and Protocol) or create a new protocol group (and new Protocol).
CARL : Cyberoam Aggregated Reporting and Logging :: User Guide
16
Multiple Selection enables you to assign multiple identifiers to a particular protocol group (and protocol). Single selection enables you to assign each of the individual identifier to a particular protocol group (and protocol). The Security Statistics table, shows the Security Overview graph's data in more detail, along with the distribution of the Configured Alerts. The Configured Alerts are classified according to the priority as High, Medium, and Low. Clicking on the alert counts against High, Medium, Low, or All Alerts will list you complete details like Alert Profile name, the generated time, the device for which the alert was raised, the alert priority, and the status of the alert. The security statistics table provides you with the counts for attacks, virus, failed log ons, security events, and denied events. Attacks: CARL will recognize only those firewall log messages which contains the attribute denoting an attack. Virus: CARL will recognize only those firewall log messages which contains the attribute denoting a virus. Failed Log Ons: CARL will recognize only those firewall log messages, which contains the attribute denoting a failed log on. Denied Events: CARL will recognize only those firewall log messages, which contains the attribute denoting a denied request. Security Events: The Security Events in CARL are based on the severity attributes Emergency, Alert, Critical, and Error only.
Since Security Events are based on severity attributes, they may also include the other events like port scans, attacks, virus, failed log ons, security events, and denied events.
Clicking on the counts against each of the above events in the security statistics table will lead you to the corresponding the quick reports for those events.
Editing Device Details
Click the icon next to a device name to change the device's details. You can change the device's display name, up link speed and down link speed. The device name and the vendor type cannot be changed.
Up Link Speed and Down Link Speed determines the % IN Traffic and % OUT traffic.
Click the icon to delete the device from the database. You are asked to confirm your choice, after which the device is permanently deleted.
When a device is deleted, all existing data pertaining to that device is permanently deleted from the database. Later if logs are received from that device, the device is added as a new device, and reports are generated. To stop this from happening, you need to configure the device to stop sending logs to CARL.

CARL : Cyberoam Aggregated Reporting and Logging :: User Guide
17
Search
Doing a search in CARL UI is easy. CARL offers both a Basic Search and Advanced Search in all the pages of the product. The search results can be saved as report profiles and can also be scheduled to run the search and mail the report profile on an hourly, daily, weekly, monthly or once only basis. But the reports profiles created via search cannot be edited and will not contain graphical representation of data, and drill down facility.
Basic Search, enables you to search for the following :
Search for Description
Hosts Refers to the IP Address or DNS Names which were recorded in the firewall logs example: 192.168.0.1,web-server
Protocol Identifiers
Refers to the list of protocols and protocol identifiers that are available in the Protocol Groups page (Settings >> Protocol Groups) example: 6969/tcp, icmp, IPSec
User Names Refers to the authenticated user name required by some firewall's example: john, kate
Attack Refers to the attack name. examples: UDP Snort, Ip spoof
Virus Refers to the Virus name. examples: JS/Exception, W32/Mitglieder
Advanced Search, offers numerous options for making your searches more precise and getting more useful results Aggregated Logs Database. It allows you to search from the Raw Firewall Logs. In Advance Search, you can search the logs for the selected devices, from the aggregated logs database or raw firewall logs, and define matching criteria. Selected Devices In this section, you can choose the devices for which you want the logs to be searched. If no device is selected or you want to change the list of selected devices, select the devices.
1. Click Change Selection link. 2. Select Devices from the list window pops-up. In that window, All Devices with
selection check box and individual devices with selection check boxes options are available.
3. Select the devices by selecting the check boxes as per your requirement. Click OK to select the devices and close the window or click Cancel to cancel the opration and close the window.
The selected devices are displayed in this section. Search From In this section, you can select one from the two options:
1. Aggregated Logs Database 2. Raw Firewall Logs
CARL : Cyberoam Aggregated Reporting and Logging :: User Guide
18
1. Aggregated Logs Database
Select this option if you want to search from the aggregated logs database.
2. Raw Firewall Logs
Select this option if you want to search from the raw firewall logs. Selecting this option will enable the following options:
a. Raw Virus/Attack Logs b. Raw Device Management Logs c. Raw Denied Logs
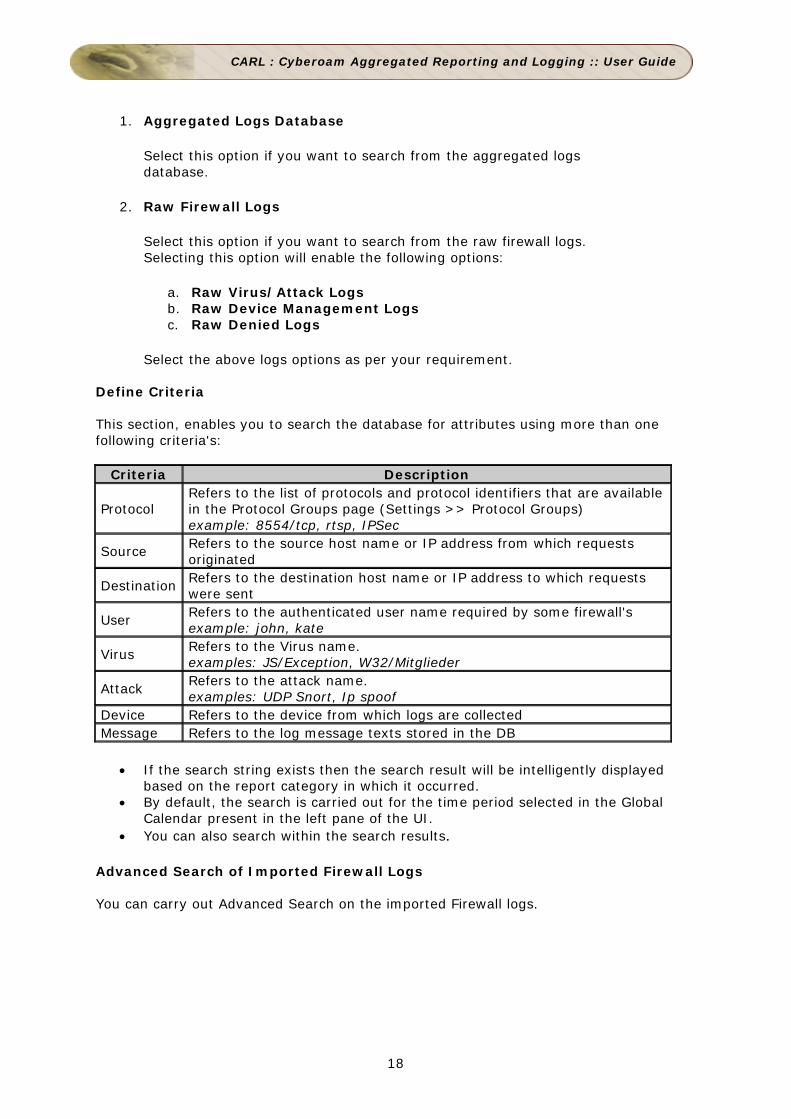
Select the above logs options as per your requirement. Define Criteria This section, enables you to search the database for attributes using more than one following criteria's:
Criteria Description
Protocol Refers to the list of protocols and protocol identifiers that are available in the Protocol Groups page (Settings >> Protocol Groups) example: 8554/tcp, rtsp, IPSec
Source Refers to the source host name or IP address from which requests originated
Destination Refers to the destination host name or IP address to which requests were sent
User Refers to the authenticated user name required by some firewall's example: john, kate
Virus Refers to the Virus name. examples: JS/Exception, W32/Mitglieder
Attack Refers to the attack name. examples: UDP Snort, Ip spoof
Device Refers to the device from which logs are collected Message Refers to the log message texts stored in the DB
• If the search string exists then the search result will be intelligently displayed based on the report category in which it occurred.
• By default, the search is carried out for the time period selected in the Global Calendar present in the left pane of the UI.
• You can also search within the search results.
Advanced Search of Imported Firewall Logs You can carry out Advanced Search on the imported Firewall logs.

CARL : Cyberoam Aggregated Reporting and Logging :: User Guide
19
Using the Sub Tab
The sub tab provides links to frequently accessed reports and tasks in CARL. It also shows the current server status using intuitive icons. The following reports can be generated by clicking the corresponding links in the sub tab:
Link Action
Live Reports View live traffic reports for the past one day for each firewall, on a 5-minute average
My Report Profiles View the list of custom report profiles created so far The following tasks can be done by clicking the corresponding links in the sub tab:
Link Action Add Report Profile Create a new custom report profile Add Syslog Server Add a virtual syslog server to receive logs from different ports
Add Alert Profile Create a new alert profile to trigger alerts and send notifications
Import Logs Import a log file from your local machine or through FTP
Search & Advanced Search
Offers numerous options for making your searches more precise and getting more useful results. Reports can be scheduled from the search results.
The purpose of each icon in the sub-tab is described below:
Icon Description
Packet Count - the number of packets received from each device sending log files to the server. For troubleshooting, admin users can view the cumulative flow rate of logs received by CARL at the syslog listening ports from all the configured firewalls.
or
Listening Ports - the list of ports at which the server is listening for logs and devices that are sending logs to the syslog server at the particular port. If any of the ports is down, then you would receive a message in web UI "Syslog listener port is down"
No Unknown Packets Received - no unknown packets or unsupported log formats have been received by the server
Unknown Packets Received - unknown packets have been sent to the server. Details such as, the source sending the records, receiving port, etc. are also displayed.

CARL : Cyberoam Aggregated Reporting and Logging :: User Guide
20
Using The Left Navigation Pane
The left navigation pane provides quick links to different tasks and reports in CARL. The components present in the left navigation pane depend on the tab that is currently selected. The following is a list of all components found in the left navigation pane: Component Description Dashboard Views
List all the custom dashboard views created by the user. 'All Devices' view is the default dashboard view.
Global Calendar
Allows you to select the time period for all reports from one place. By default, the current day's data from 00:00 Hrs to the current time is shown.
Firewalls
Includes links to generate reports for each firewall from which logs have been collected.
Click on the icon to customize the reports view for each of the listed firewall's Click on the icon against each firewall to generate reports for that firewall alone in a new window. Click on the icon against each firewall to obtain Quick Reports of the top level details of traffic like Top Hosts, Top Destinations, Top Conversations, etc for the corresponding firewall.
Reports Across Devices
Includes links to generate reports across all devices from which logs have been collected
My Report Profiles
Includes links to generate custom reports created using the Add Report Profile link.
All Alerts Includes links to view all the alert profiles created by the user, using the Add Alert Profile link.
My Alerts
Includes links to view all the alerts assigned to the operator user by admin or other operator user. Includes links to view all the alerts assigned to the admin user by himself or other operator user.
Bookmarks Allows you to set a bookmark for the current page, and manage existing bookmarks
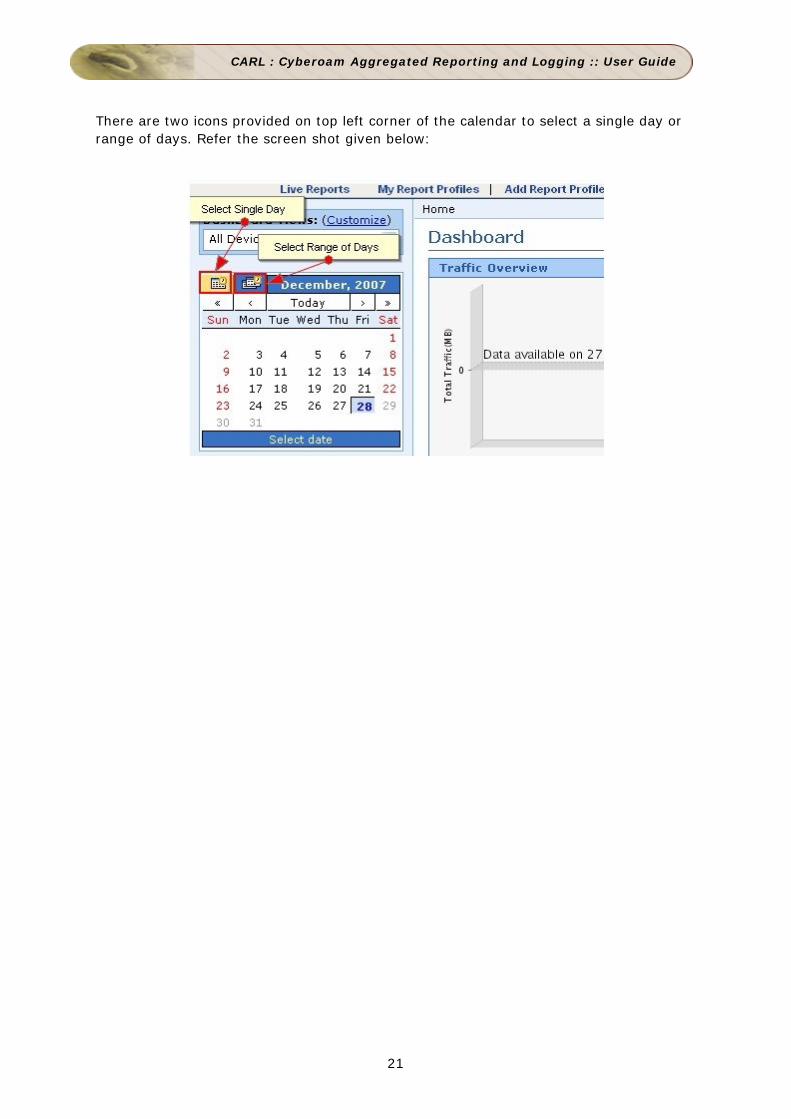
Most of the tasks in the left navigation pane can be done from the main tabs also, by clicking the corresponding links. The left navigation pane provides a quicker way to perform the same tasks. Using Calendar You can use the calendar to select a single date or range of days to view various details of the reports, alerts, and logs of the Firewalls.
CARL : Cyberoam Aggregated Reporting and Logging :: User Guide
21
There are two icons provided on top left corner of the calendar to select a single day or range of days. Refer the screen shot given below:
CARL : Cyberoam Aggregated Reporting and Logging :: User Guide
22
Dashboard View Customization
In the Dashboard Views section, you can see Customize link besides "Dashboard Views:" title to customize the dashboard view and a combo box listing all the available Dashboard Views with All Devices view on top. To customize the dashboard view, click Customize link. Dashboard View Customization page appears. It lists all the dashboard views available to the user including All Devices view on top. The dashboard view customization page lets users to:
• Create multiple dashboard views based on the devices assigned to the user. Each view can be configured to show a list of assigned devices. The created dashboard views are listed in the Dashboard Views combo box in the left hand side top of the Home tab.
• Edit any of the listed views, except the All Devices dashboard view. • Set any one of the views as default dashboard view. • Delete any of the listed views, except the All Devices view and the default
dashboard view, if any of the created dashboard view is set as a default dashboard view.
To create a new device view Click Create Device View link. The Create Device View screen pops-up. In that screen,
• Enter a name for the view in the View Name text box. • Select the devices from the Available Devices list, and move it to the
Dashboard View Devices list. • Select the Set this view as Default Home check box option to make this view
as the default dashboard view upon user login. • Click Update to create the device view and Close to close the screen.
Now you can see the new view created is listed in the Dashboard View Customization page. To edit a device view To edit a view, click the icon of the view to be edited. The Edit Device View screen pops-up. The procedure is same as that of create device view. To set a device view as default view Select any one of the listed views to be Set as default. The default dashboard view is
indicated by the icon and all other views by the icon.
Click the icon of the view, which you want to set as deafult view. Now the icon
changes to icon and in the previous default view, the icon changes to icon.

CARL : Cyberoam Aggregated Reporting and Logging :: User Guide
23
To delete a device view To delete a view, click the icon of the view to be deleted.
Default View: The default dashboard view is the one which appears in the Home tab, upon user login. By default All Devices view is set as default view. User can create and set any view as default view. Default view will appear automatically only when the user closes the client and re-logs in. User can view any of the listed dashboard views and traversing between the tabs will not change the view.

CARL : Cyberoam Aggregated Reporting and Logging :: User Guide
24
Firewall Reports
Generating Reports
CARL offers a rich set of pre-defined reports that help in analyzing bandwidth usage and understanding network behavior. On a broad level, reports in CARL are classified into the following types:
Report Description My Report Profiles
Create custom report profiles to report on specific parameters
Reports Across Devices
View bandwidth usage, protocol usage, etc. across all devices whose logs are analyzed
Firewall Reports
View traffic reports, protocol usage, event summary, etc. for each firewall
Trend Reports
View trends of bandwidth usage, protocol usage, and events generated
All the above reports can be accessed from the Reports tab. Except the Live Report, all other reports include links to several sections of the report which can be seen when the
icon, or the report bar itself is clicked. Click on each section to go to the corresponding section of the report directly, or click the View Report link to view the entire report with all the sections. DNS Resolution in Reports CARL provides an option to configure DNS resolution for all the reports. For more details refer Configuring DNS Resolution page under the System Settings section. In each of the individual reports a ResolveDNS link has been provided at the top. Clicking this link enables DNS Resolution for all the IP Addresses of the unresolved hosts present in the current report. The status of DNS Resolution depends on the default DNS lookup time, within which CARL will try to resolve the IP Address. If DNS Resolution is in progress for any other CARL user, then the subsequent user will see the message "Please wait, DNS Resolution in progress for another user" when clicking ResolveDNS link. Once the DNS Resolution is complete for the first user, then the DNS Resolution for the subsequent user begins automatically.

CARL : Cyberoam Aggregated Reporting and Logging :: User Guide
25
Live Reports
The Live Reports provide a live visual representation of the traffic load across network links. Graphs are similar to that of MRTG, with the aim of providing a simple way to see exactly how much inbound and outbound traffic was generated for each device. The graphs for each device shows the minimum, maximum, and average amount of incoming and outgoing traffic through that device, over several time periods. Traffic is broken down into the last day, last week, last month, and last year, with an average granularity of 5 minutes, 30 minutes, 2 hours, and 1 day respectively. Click the Live Reports link in the sub tab or in the Reports Across Devices box in the left navigation pane, to see the live reports for all devices, for the last one day, over a 5-minute average. Click the Live Reports link present inside the list of reports for a device, to see the live reports for that device alone, over all the time periods described above. Drill down from each of the graphs in the live report to see the following details:
Graph Description
Inbound/Outbound Traffic Conversations
The inbound/outbound conversations for all hosts across this firewall. This data is available only for the last day's traffic over a 5-minute average granularity.
Top Hosts
The top hosts contributing to inbound/outbound traffic across this firewall. Drill down from this graph to see the corresponding conversations for each host, during the selected time period.
Top Protocol Groups
The top protocol groups used in inbound/outbound traffic across this firewall. Drill down from this graph to see the corresponding conversations using each protocol group, during the selected time period.
Top Users
The top users contributing to inbound/outbound traffic across this firewall. Drill down from this graph to see the corresponding conversations for each user, during the selected time period.
CARL : Cyberoam Aggregated Reporting and Logging :: User Guide
26
Traffic Reports
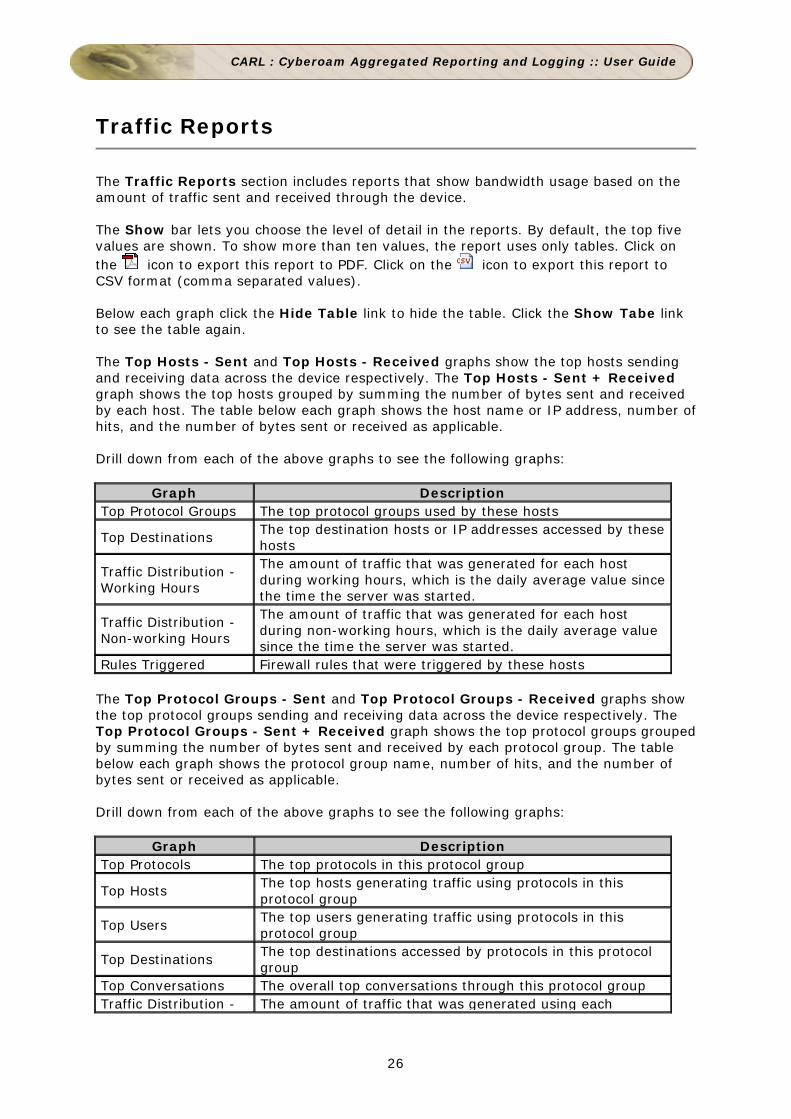
The Traffic Reports section includes reports that show bandwidth usage based on the amount of traffic sent and received through the device. The Show bar lets you choose the level of detail in the reports. By default, the top five values are shown. To show more than ten values, the report uses only tables. Click on the icon to export this report to PDF. Click on the icon to export this report to CSV format (comma separated values). Below each graph click the Hide Table link to hide the table. Click the Show Tabe link to see the table again. The Top Hosts - Sent and Top Hosts - Received graphs show the top hosts sending and receiving data across the device respectively. The Top Hosts - Sent + Received graph shows the top hosts grouped by summing the number of bytes sent and received by each host. The table below each graph shows the host name or IP address, number of hits, and the number of bytes sent or received as applicable. Drill down from each of the above graphs to see the following graphs:
Graph Description Top Protocol Groups The top protocol groups used by these hosts
Top Destinations The top destination hosts or IP addresses accessed by these hosts
Traffic Distribution - Working Hours
The amount of traffic that was generated for each host during working hours, which is the daily average value since the time the server was started.
Traffic Distribution - Non-working Hours
The amount of traffic that was generated for each host during non-working hours, which is the daily average value since the time the server was started.
Rules Triggered Firewall rules that were triggered by these hosts The Top Protocol Groups - Sent and Top Protocol Groups - Received graphs show the top protocol groups sending and receiving data across the device respectively. The Top Protocol Groups - Sent + Received graph shows the top protocol groups grouped by summing the number of bytes sent and received by each protocol group. The table below each graph shows the protocol group name, number of hits, and the number of bytes sent or received as applicable. Drill down from each of the above graphs to see the following graphs:
Graph Description Top Protocols The top protocols in this protocol group
Top Hosts The top hosts generating traffic using protocols in this protocol group
Top Users The top users generating traffic using protocols in this protocol group
Top Destinations The top destinations accessed by protocols in this protocol group
Top Conversations The overall top conversations through this protocol group Traffic Distribution - The amount of traffic that was generated using each
CARL : Cyberoam Aggregated Reporting and Logging :: User Guide
27
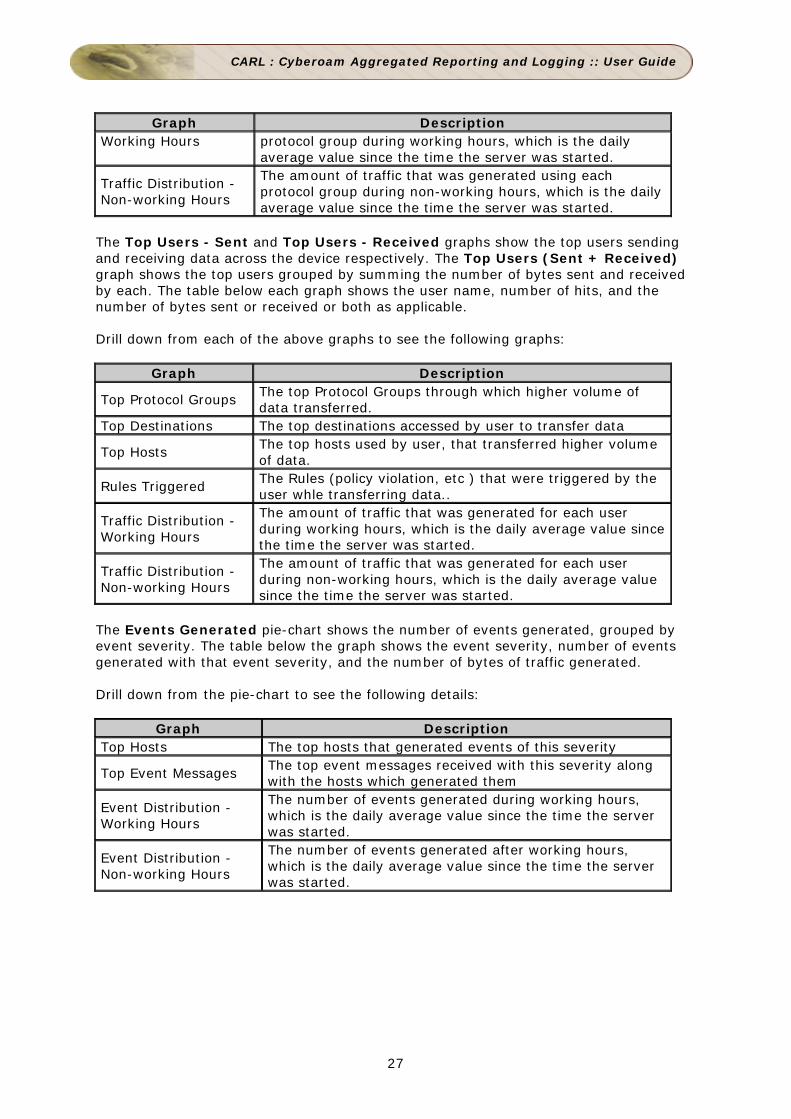
Graph Description Working Hours protocol group during working hours, which is the daily
average value since the time the server was started.
Traffic Distribution - Non-working Hours
The amount of traffic that was generated using each protocol group during non-working hours, which is the daily average value since the time the server was started.
The Top Users - Sent and Top Users - Received graphs show the top users sending and receiving data across the device respectively. The Top Users (Sent + Received) graph shows the top users grouped by summing the number of bytes sent and received by each. The table below each graph shows the user name, number of hits, and the number of bytes sent or received or both as applicable. Drill down from each of the above graphs to see the following graphs:
Graph Description
Top Protocol Groups The top Protocol Groups through which higher volume of data transferred.
Top Destinations The top destinations accessed by user to transfer data
Top Hosts The top hosts used by user, that transferred higher volume of data.
Rules Triggered The Rules (policy violation, etc ) that were triggered by the user whle transferring data..
Traffic Distribution - Working Hours
The amount of traffic that was generated for each user during working hours, which is the daily average value since the time the server was started.
Traffic Distribution - Non-working Hours
The amount of traffic that was generated for each user during non-working hours, which is the daily average value since the time the server was started.
The Events Generated pie-chart shows the number of events generated, grouped by event severity. The table below the graph shows the event severity, number of events generated with that event severity, and the number of bytes of traffic generated. Drill down from the pie-chart to see the following details:
Graph Description Top Hosts The top hosts that generated events of this severity
Top Event Messages The top event messages received with this severity along with the hosts which generated them
Event Distribution - Working Hours
The number of events generated during working hours, which is the daily average value since the time the server was started.
Event Distribution - Non-working Hours
The number of events generated after working hours, which is the daily average value since the time the server was started.

CARL : Cyberoam Aggregated Reporting and Logging :: User Guide
28
Protocol Usage Reports
The Protocol Usage Reports section includes reports that show bandwidth usage based on all the protocol groups generating traffic through the device.
Separate reports are available for Web, Mail, FTP, and Telnet protocol groups. Click on the respective reports to view bandwidth usage details.
The Show bar lets you choose the level of detail in the reports. By default, the top five values are shown. To show more than ten values, the report uses only tables. Click on the icon to export this report to PDF. Click on the icon to export this report to CSV format (comma separated values). Below each graph click the Hide Table link to hide the table. Click the Show Table link to see the table again.
Click on the Protocol Groups link under the Settings tab to see what protocols fall under each protocol group, and how to edit them.
The Top Protocol Groups - Sent and Top Protocol Groups - Received graphs show the top protocol groups sending and receiving data across the device respectively. The Top Protocol Groups - Sent + Received graph shows the top protocol groups grouped by summing the number of bytes sent and received by each protocol group. The table below each graph shows the protocol group name, number of hits, and the number of bytes sent or received as applicable. Drill down from each of the above graphs to see the following graphs:
Graph Description Top Protocols The top protocols in this protocol group
Top Hosts The top hosts generating traffic using protocols in this protocol group
Top Users The top users generating traffic using protocols in this protocol group
Top Destinations
The top destinations accessed by protocols in this protocol group
Top Conversations
The top conversations using protocols in this protocol group
Traffic Distribution - Working Hours
The amount of traffic that was generated by each protocol group during working hours, which is the daily average value since the time the server was started.
Traffic Distribution - Non-working Hours
The amount of traffic that was generated by each protocol group during non-working hours, which is the daily average value since the time the server was started.
The Top Hosts - Sent and Top Hosts - Received graphs show the top hosts sending and receiving data across the device respectively. The Top Hosts - Sent + Received graph shows the top hosts grouped by summing the number of bytes sent and received

CARL : Cyberoam Aggregated Reporting and Logging :: User Guide
29
by each host. The table below each graph shows the host name or IP address, the protocol used, number of hits, and the number of bytes sent or received as applicable. Drill down from each of the above graphs to see the following graphs:
Graph Description
Top Destinations The top destination hosts or IP addresses accessed by these hosts
Top Users The top users using this host in generating traffic
Traffic Distribution - Working Hours
The amount of traffic that was generated by the host during working hours, which is the daily average value since the time the server was started.
Traffic Distribution - Non-working Hours
The amount of traffic that was generated by the host after working hours, which is the daily average value since the time the server was started.
The Top Users - Sent and Top Users - Received graphs show the top users sending and receiving data across the device respectively. The Top Users - Sent + Received graph shows the top users grouped by summing the number of bytes sent and received by each protocol group. The table below each graph shows the user name, the protocol used, number of hits, and the number of bytes sent or received as applicable. Drill down from each of the above graphs to see the following graphs:
Graph Description Top Destinations
The top destinations accessed by the user
Top Hosts The top hosts used by user in generating traffic Traffic Distribution - Working Hours
The amount of traffic that was generated by the user during working hours, which is the daily average value since the time the server was started.
Traffic Distribution - Non-working Hours
The amount of traffic that was generated by the user after working hours, which is the daily average value since the time the server was started.
The Top Rules table shows the top protocol groups triggering firewall rules, the rules that were triggered, and the destination and the number of hits.

CARL : Cyberoam Aggregated Reporting and Logging :: User Guide
30
Web Usage Reports
The Web Usage Reports section includes reports on the top protocols under the Web protocol group, that have been used to generate traffic through that device. The Show bar lets you choose the level of detail in the reports. By default, the top five values are shown. To show more than ten values, the report uses only tables. Click on the icon to export this report to PDF. Click on the icon to export this report to CSV format (comma separated values). Below each graph click the Hide Table link to hide the table. Click the Show Table link to see the table again
Click on the Protocol Groups link under the Settings tab to see what protocols fall under each protocol group, and how to edit them.
The Top Protocols - Sent and Top Protocols - Received graphs show the top Web protocols sending and receiving data across the device respectively. The Top Protocols - Sent + Received graph shows the top protocols grouped by summing the number of bytes sent and received by each protocol. The table below each graph shows the protocol name, number of hits, and the number of bytes sent or received as applicable. Drill down from each of the above graphs to see the following graphs:
Graph Description Top Hosts The top hosts generating traffic using this protocol Top Destinations
The top destinations accessed by using this protocol
Top Conversations
The top conversations using protocols in this protocol group
Traffic Distribution - Working Hours
The amount of traffic that was generated by using this protocol during working hours, which is the daily average value since the time the server was started.
Traffic Distribution - Non-working Hours
The amount of traffic that was generated by using this protocol after working hours, which is the daily average value since the time the server was started.
The Top Users - Sent and Top Users - Received graphs show the top users sending and receiving data across the device respectively. The Top Users - Sent + Received graph shows the top users grouped by summing the number of bytes sent and received by each protocol group. The table below each graph shows the user name, the protocol used, number of hits, and the number of bytes sent or received as applicable. Drill down from each of the above graphs to see the following graphs:
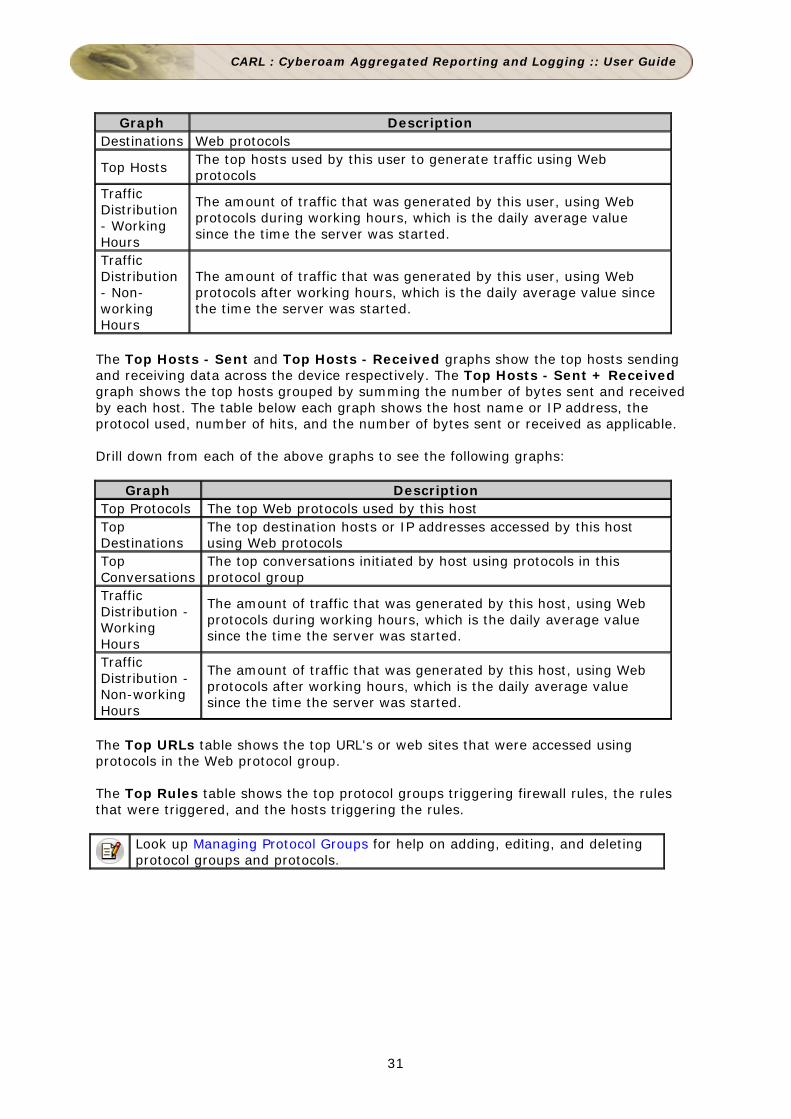
Graph Description Top Protocols
The top Web protocols used by this user
Top The top destination hosts or IP addresses accessed by this user using
CARL : Cyberoam Aggregated Reporting and Logging :: User Guide
31
Graph Description Destinations Web protocols
Top Hosts The top hosts used by this user to generate traffic using Web protocols
Traffic Distribution - Working Hours
The amount of traffic that was generated by this user, using Web protocols during working hours, which is the daily average value since the time the server was started.
Traffic Distribution - Non-working Hours
The amount of traffic that was generated by this user, using Web protocols after working hours, which is the daily average value since the time the server was started.
The Top Hosts - Sent and Top Hosts - Received graphs show the top hosts sending and receiving data across the device respectively. The Top Hosts - Sent + Received graph shows the top hosts grouped by summing the number of bytes sent and received by each host. The table below each graph shows the host name or IP address, the protocol used, number of hits, and the number of bytes sent or received as applicable. Drill down from each of the above graphs to see the following graphs:
Graph Description Top Protocols The top Web protocols used by this host Top Destinations
The top destination hosts or IP addresses accessed by this host using Web protocols
Top Conversations
The top conversations initiated by host using protocols in this protocol group
Traffic Distribution - Working Hours
The amount of traffic that was generated by this host, using Web protocols during working hours, which is the daily average value since the time the server was started.
Traffic Distribution - Non-working Hours
The amount of traffic that was generated by this host, using Web protocols after working hours, which is the daily average value since the time the server was started.
The Top URLs table shows the top URL's or web sites that were accessed using protocols in the Web protocol group. The Top Rules table shows the top protocol groups triggering firewall rules, the rules that were triggered, and the hosts triggering the rules.
Look up Managing Protocol Groups for help on adding, editing, and deleting protocol groups and protocols.
CARL : Cyberoam Aggregated Reporting and Logging :: User Guide
32
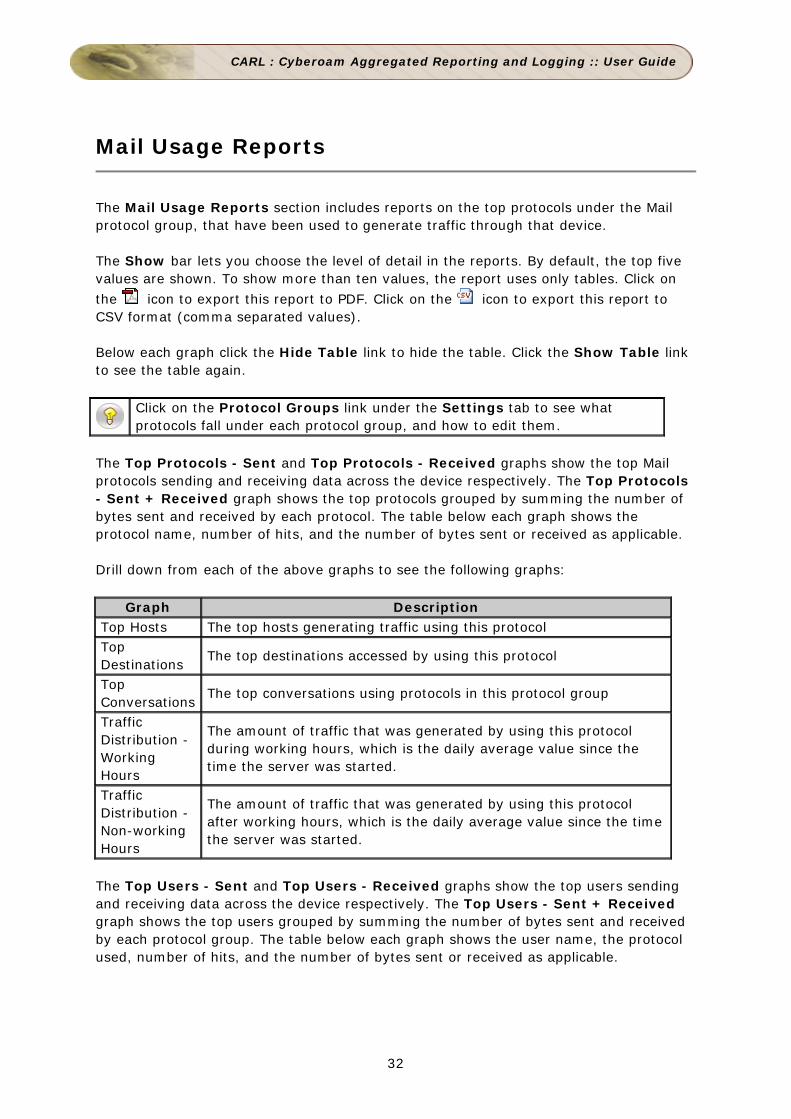
Mail Usage Reports
The Mail Usage Reports section includes reports on the top protocols under the Mail protocol group, that have been used to generate traffic through that device. The Show bar lets you choose the level of detail in the reports. By default, the top five values are shown. To show more than ten values, the report uses only tables. Click on
the icon to export this report to PDF. Click on the icon to export this report to CSV format (comma separated values). Below each graph click the Hide Table link to hide the table. Click the Show Table link to see the table again.
Click on the Protocol Groups link under the Settings tab to see what protocols fall under each protocol group, and how to edit them.
The Top Protocols - Sent and Top Protocols - Received graphs show the top Mail protocols sending and receiving data across the device respectively. The Top Protocols - Sent + Received graph shows the top protocols grouped by summing the number of bytes sent and received by each protocol. The table below each graph shows the protocol name, number of hits, and the number of bytes sent or received as applicable. Drill down from each of the above graphs to see the following graphs:
Graph Description Top Hosts The top hosts generating traffic using this protocol Top Destinations
The top destinations accessed by using this protocol
Top Conversations
The top conversations using protocols in this protocol group
Traffic Distribution - Working Hours
The amount of traffic that was generated by using this protocol during working hours, which is the daily average value since the time the server was started.
Traffic Distribution - Non-working Hours
The amount of traffic that was generated by using this protocol after working hours, which is the daily average value since the time the server was started.
The Top Users - Sent and Top Users - Received graphs show the top users sending and receiving data across the device respectively. The Top Users - Sent + Received graph shows the top users grouped by summing the number of bytes sent and received by each protocol group. The table below each graph shows the user name, the protocol used, number of hits, and the number of bytes sent or received as applicable.

CARL : Cyberoam Aggregated Reporting and Logging :: User Guide
33
Drill down from each of the above graphs to see the following graphs:
Graph Description Top Protocols
The top Mail protocols used by this user
Top Destinations
The top destination hosts or IP addresses accessed by this user using Mail protocols
Top Hosts The top hosts used by this user to generate traffic using Mail protocols
Traffic Distribution - Working Hours
The amount of traffic that was generated by this user, using Mail protocols during working hours, which is the daily average value since the time the server was started.
Traffic Distribution - Non-working Hours
The amount of traffic that was generated by this user, using Mail protocols after working hours, which is the daily average value since the time the server was started.
The Top Hosts - Sent and Top Hosts - Received graphs show the top hosts sending and receiving data across the device respectively. The Top Hosts - Sent + Received graph shows the top hosts grouped by summing the number of bytes sent and received by each host. The table below each graph shows the host name or IP address, the protocol used, number of hits, and the number of bytes sent or received as applicable. Drill down from each of the above graphs to see the following graphs:
Graph Description Top Protocols The top Mail protocols used by this host Top Destinations
The top destination hosts or IP addresses accessed by this host using Mail protocols
Top Conversations
The top conversations initiated by host using protocols in this protocol group
Traffic Distribution - Working Hours
The amount of traffic that was generated by this host, using Mail protocols during working hours, which is the daily average value since the time the server was started.
Traffic Distribution - Non-working Hours
The amount of traffic that was generated by this host, using Mail protocols after working hours, which is the daily average value since the time the server was started.
The Top Rules table shows the top protocol groups triggering firewall rules, the rules that were triggered, and the destination and the number of hits.
Look up Managing Protocol Groups for help on adding, editing, and deleting protocol groups and protocols.

CARL : Cyberoam Aggregated Reporting and Logging :: User Guide
34
FTP Usage Reports
The FTP Usage Reports section includes reports on the top protocols under the FTP protocol group, that have been used to generate traffic through that device. The Show bar lets you choose the level of detail in the reports. By default, the top five values are shown. To show more than ten values, the report uses only tables. Click on
the icon to export this report to PDF. Click on the icon to export this report to CSV format (comma separated values). Below each graph click the Hide Table link to hide the table. Click the Show Table link to see the table again
Click on the Protocol Groups link under the Settings tab to see what protocols fall under each protocol group, and how to edit them.
The Top Protocols - Sent and Top Protocols - Received graphs show the top FTP protocols sending and receiving data across the device respectively. The Top Protocols - Sent + Received graph shows the top protocols grouped by summing the number of bytes sent and received by each protocol. The table below each graph shows the protocol name, number of hits, and the number of bytes sent or received as applicable. Drill down from each of the above graphs to see the following graphs:
Graph Description Top Hosts The top hosts generating traffic using this protocol Top Destinations
The top destinations accessed by using this protocol
Top Conversations
The top conversations using protocols in this protocol group
Traffic Distribution - Working Hours
The amount of traffic that was generated by using this protocol during working hours, which is the daily average value since the time the server was started.
Traffic Distribution - Non-working Hours
The amount of traffic that was generated by using this protocol after working hours, which is the daily average value since the time the server was started.
The Top Users - Sent and Top Users - Received graphs show the top users sending and receiving data across the device respectively. The Top Users - Sent + Received graph shows the top users grouped by summing the number of bytes sent and received by each protocol group. The table below each graph shows the user name, the protocol used, number of hits, and the number of bytes sent or received as applicable.

CARL : Cyberoam Aggregated Reporting and Logging :: User Guide
35
Drill down from each of the above graphs to see the following graphs:
Graph Description
Top Protocols
The top FTP protocols used by this user
Top Destinations
The top destination hosts or IP addresses accessed by this user using FTP protocols
Top Hosts The top hosts used by this user to generate traffic using FTP protocols
Traffic Distribution - Working Hours
The amount of traffic that was generated by this user, using FTP protocols during working hours, which is the daily average value since the time the server was started.
Traffic Distribution - Non-working Hours
The amount of traffic that was generated by this user, using FTP protocols after working hours, which is the daily average value since the time the server was started.
The Top Hosts - Sent and Top Hosts - Received graphs show the top hosts sending and receiving data across the device respectively. The Top Hosts - Sent + Received graph shows the top hosts grouped by summing the number of bytes sent and received by each host. The table below each graph shows the host name or IP address, the protocol used, number of hits, and the number of bytes sent or received as applicable. Drill down from each of the above graphs to see the following graphs:
Graph Description
Top Protocols The top FTP protocols used by this host
Top Destinations
The top destination hosts or IP addresses accessed by this host using FTP protocols
Top Conversations
The top conversations initiated by host using protocols in this protocol group
Traffic Distribution - Working Hours
The amount of traffic that was generated by this host, using FTP protocols during working hours, which is the daily average value since the time the server was started.
Traffic Distribution - Non-working Hours
The amount of traffic that was generated by this host, using FTP protocols after working hours, which is the daily average value since the time the server was started.
The Top Rules table shows the top protocol groups triggering firewall rules, the rules that were triggered, and the destination and the number of hits. The Top URLs table shows the top URL's or web sites that were accessed using protocols in the FTP protocol group.
Look up Managing Protocol Groups for help on adding, editing, and deleting protocol groups and protocols.

CARL : Cyberoam Aggregated Reporting and Logging :: User Guide
36
Telnet Usage Reports
The Telnet Usage Reports section includes reports on the top protocols under the Telnet protocol group, that have been used to generate traffic through that device. The Show bar lets you choose the level of detail in the reports. By default, the top five values are shown. To show more than ten values, the report uses only tables. Click on
the icon to export this report to PDF. Click on the icon to export this report to CSV format (comma separated values). Below each graph click the Hide Table link to hide the table. Click the Show Table link to see the table again
Click on the Protocol Groups link under the Settings tab to see what protocols fall under each protocol group, and how to edit them.
The Top Protocols - Sent and Top Protocols - Received graphs show the top Telnet protocols sending and receiving data across the device respectively. The Top Protocols - Sent + Received graph shows the top protocols grouped by summing the number of bytes sent and received by each protocol. The table below each graph shows the protocol name, number of hits, and the number of bytes sent or received as applicable. Drill down from each of the above graphs to see the following graphs:
Graph Description Top Hosts The top hosts generating traffic using this protocol Top Destinations
The top destinations accessed by using this protocol
Top Conversations
The top conversations using protocols in this protocol group
Traffic Distribution - Working Hours
The amount of traffic that was generated by using this protocol during working hours, which is the daily average value since the time the server was started.
Traffic Distribution - Non-working Hours
The amount of traffic that was generated by using this protocol after working hours, which is the daily average value since the time the server was started.
The Top Users - Sent and Top Users - Received graphs show the top users sending and receiving data across the device respectively. The Top Users - Sent + Received graph shows the top users grouped by summing the number of bytes sent and received by each protocol group. The table below each graph shows the user name, the protocol used, number of hits, and the number of bytes sent or received as applicable.

CARL : Cyberoam Aggregated Reporting and Logging :: User Guide
37
Drill down from each of the above graphs to see the following graphs:
Graph Description Top Protocols
The top Telnet protocols used by this user
Top Destinations
The top destination hosts or IP addresses accessed by this user using Telnet protocols
Top Hosts The top hosts used by this user to generate traffic using Telnet protocols
Traffic Distribution - Working Hours
The amount of traffic that was generated by this user, using Telnet protocols during working hours, which is the daily average value since the time the server was started.
Traffic Distribution - Non-working Hours
The amount of traffic that was generated by this user, using Telnet protocols after working hours, which is the daily average value since the time the server was started.
The Top Hosts - Sent and Top Hosts - Received graphs show the top hosts sending and receiving data across the device respectively. The Top Hosts - Sent + Received graph shows the top hosts grouped by summing the number of bytes sent and received by each host. The table below each graph shows the host name or IP address, the protocol used, number of hits, and the number of bytes sent or received as applicable. Drill down from each of the above graphs to see the following graphs:
Graph Description Top Protocols The top Telnet protocols used by this host Top Destinations
The top destination hosts or IP addresses accessed by this host using Telnet protocols
Top Conversations
The top conversations initiated by hosts, using protocols in this protocol group
Traffic Distribution - Working Hours
The amount of traffic that was generated by this host, using Telnet protocols during working hours, which is the daily average value since the time the server was started.
Traffic Distribution - Non-working Hours
The amount of traffic that was generated by this host, using Telnet protocols after working hours, which is the daily average value since the time the server was started.
The Top Rules table shows the top protocol groups triggering firewall rules, the rules that were triggered, and the destination and the number of hits.
Look up Managing Protocol Groups for help on adding, editing, and deleting protocol groups and protocols.

CARL : Cyberoam Aggregated Reporting and Logging :: User Guide
38
Event Summary Reports
The Event Summary Reports section includes reports that show the summary of events generated by that device. The Show bar lets you choose the level of detail in the reports. By default, the top five values are shown. To show more than ten values, the report uses only tables. Click on the icon to export this report to PDF. Click on the icon to export this report to CSV format (comma separated values). Below each graph click the Hide Table link to hide the table. Click the Show Table link to see the table again. The Top Hosts graph shows the top hosts generating events along with the respective event severities. The table below the graph shows the host name or IP address, the event severity, the number of events, and the number of bytes of traffic generated. Drill down from this graph to see the following graphs:
Graph Description
Top Event Messages The top event messages generated and corresponding event ID
Event Distribution - Working Hours
The number of events generated during working hours, which is the daily average value since the time the server was started.
Event Distribution - Non-working Hours
The number of events generated after working hours, which is the daily average value since the time the server was started.
The Event Summary pie-chart shows the number of events generated, grouped by event severity. The table below the graph shows the event severity, number of events generated with that event severity, and the number of bytes of traffic generated. Drill down from the pie-chart to see the following details:
Graph Description Top Hosts The top hosts that generated events of this severity Top Event Messages
The top event messages received with this severity along with the hosts which generated them
Event Distribution - Working Hours
The number of events generated during working hours, which is the daily average value since the time the server was started.
Event Distribution - Non-working Hours
The number of events generated after working hours, which is the daily average value since the time the server was started.
Event Messages will list all the event messages in the descending order of number of events along with the severity.

CARL : Cyberoam Aggregated Reporting and Logging :: User Guide
39
Firewall Rules Report
The Firewall Rules Report shows the top firewall rules triggered on this firewall, grouped by different categories. The Show bar lets you choose the level of detail in the reports. By default, the top five values are shown. To show more than ten values, the report uses only tables. Click on the icon to export this report to PDF. Click on the icon to export this report to CSV format (comma separated values). Below each graph click the Hide Table link to hide the table. Click the Show Table link to see the table again. The Top Used Rules table shows the used Firewall rules and number of log counts that have triggered the firewall rules. The table shows the Rule Number or ID of the used rule, and the Count of log entries that have triggered the paritcular rule. Drill down from the rule to see the hosts, protocols, user, status, message, and count that triggered the firewall rule. The Top Unused Rules table shows the Firewall rules that have not triggered. The table shows the Rule Number or ID of the unused rule. Drill down from the rule to see the description of the unused rule. The Top Rules - Protocol Group Based graph shows the top protocol groups that have triggered firewall rules. The table below the graph shows the protocol group, the rule triggered, and the number of hits. Drill down from this graph to see the top hosts, the top protocols and the top conversations that triggered the firewall rule in that protocol group. The Top Rules - Host Based graph shows the top hosts that have triggered firewall rules. The table below the graph shows the host, the rule triggered, the number of hits. Drill down from this graph to see the top destinations accessed, the top protocols and the top conversations for each host that triggered the firewall rule. The Top Rules - Destination Based graph shows the top destinations for which firewall rules have been triggered. The table below the graph shows the destination host name or IP address, the rule triggered, and the number of hits. Drill down from this graph to see the top hosts, the top protocols and the top conversations that triggered the firewall rule. The Top Rules table shows the overall top firewall rules that have been triggered across this firewall. The table below the graph shows the rule triggered, and the number of hits. Drill down from this graph to see the top hosts, the top protocols and the top conversations that triggered the firewall rule.

CARL : Cyberoam Aggregated Reporting and Logging :: User Guide
40
Inbound Outbound Reports
The Inbound Outbound Traffic Reports section includes reports that show traffic details when inbound traffic (traffic coming into LAN) and outbound traffic (traffic going out of LAN) for the firewall, are separated. In order to separate inbound and outbound traffic, you need to first configure your intranets by clicking the Intranet Settings link from the Settings tab. When configured, the Inbound Outbound Traffic Reports shows you which hosts and what protocol groups have been contributing the most traffic on either side of the firewall. The Show bar lets you choose the level of detail in the reports. By default, the top five values are shown. To show more than ten values, the report uses only tables. Click on the icon to export this report to PDF. Click on the icon to export this report to CSV format (comma separated values). Below each graph click the Hide Table link to hide the table. Click the Show Table link to see the table again. The Top Hosts - Inbound Firewall Traffic graph shows the top hosts contributing to traffic inbound (traffic coming into LAN) to the firewall. The table below the graph shows the host name or IP address, along with the number of hits and the total bytes of traffic generated.
If the host (IP / DNS Name of the machine which initiated the conversation) is INSIDE the LAN (Internal Host), then their RECEIVED will be counted as inbound and If the host (IP / DNS Name of the machine which initiated the conversation) is OUTSIDE the LAN (External Host) then their SENT will be counted as inbound.
The Top Hosts - Outbound Firewall Traffic graph shows the top hosts contributing to traffic outbound (traffic going out of LAN) to the firewall. The table below the graph shows the host name or IP address, along with the number of hits and the total bytes of traffic generated.
If the host (IP / DNS Name of the machine which initiated the conversation) is INSIDE the LAN (Internal Host), then their SENT will be counted as outbound and If the host (IP / DNS Name of the machine which initiated the conversation) is OUTSIDE the LAN (External Host) then their RECEIVED will be counted as outbound.
The Top Protocol Groups - Inbound Firewall Traffic graph shows the top protocol groups contributing to traffic inbound to the firewall. The table below the graph shows the protocol group, along with the number of hits and the total bytes of traffic generated. The Top Protocol Groups - Outbound Firewall Traffic graph shows the top protocol groups contributing to traffic outbound to the firewall. The table below the graph shows the protocol group, along with the number of hits and the total bytes of traffic generated.

CARL : Cyberoam Aggregated Reporting and Logging :: User Guide
41
Intranet Reports
The Intranet Reports section includes reports that show details of traffic transferred through the firewall by the internal hosts (hosts inside your LAN). In order to identify your internal hosts, you need to first configure your intranets by clicking the Intranet Settings link from the Settings tab. The Show bar lets you choose the level of detail in the reports. By default, the top five values are shown. To show more than ten values, the report uses only tables. Click on the icon to export this report to PDF. Click on the icon to export this report to CSV format (comma separated values). Below each graph click the Hide Table link to hide the table. Click the Show Table link to see the table again. The Top Internal Hosts (Sent+Received) graph shows the top internal hosts that are sending and receiving traffic through the firewall. You can expect only IP's inside your LAN here. The table below the graph shows the IP address, along with the number of hits, bytes received, bytes sent, and the total bytes (sent + received) of traffic generated. The Top Internal Protocol Groups (Sent+Received) graph shows the top protocol groups used by internal host for sending and receiving traffic through the firewall. The table below the graph shows the protocol group, along with the number of hits, % hits, total bytes of traffic generated and what % of traffic each protocol group constitute to the total traffic. The Top Internal Servers graph shows the top internal servers that served traffic. This is destination based report which list the internal servers which served more for external hosts. Transaction is not started/initiated by the servers listed here. Here you can expect all your server IPs which are behind your firewall, i.e. inside your LAN. The table below the graph shows the IP address of the internal server, along with the number of hits, the total bytes of traffic, and % of total traffic to the particular internal server. The Top Conversations table lists details like host which initiated the conversation, its destination, the protocol used for the conversation along with the number of hits, the total bytes of traffic generated and % of total traffic for the particular conversation.
CARL : Cyberoam Aggregated Reporting and Logging :: User Guide
42
Internet Reports
The Internet Reports section includes reports that show details of traffic transferred through the firewall by the external hosts (hosts outside your LAN). In order to identify your external hosts, you need to first configure your intranets by clicking the Intranet Settings link from the Settings tab. When configured, all hosts outside your configured intranets will be considered as external hosts. The Show bar lets you choose the level of detail in the reports. By default, the top five values are shown. To show more than ten values, the report uses only tables. Click on the icon to export this report to PDF. Click on the icon to export this report to CSV format (comma separated values). Below each graph click the Hide Table link to hide the table. Click the Show Table link to see the table again. The Top External Hosts (Sent+Received) graph shows the top external hosts that are sending and receiving traffic through the firewall. Here you can expect only IP's outside your LAN. The table below the graph shows the IP address, along with the number of hits, bytes received, bytes sent, and the total bytes (sent + received) of traffic generated. The Top External Protocol Groups (Sent+Received) graph shows the top protocol groups used by external host for sending and receiving traffic through the firewall. The table below the graph shows the protocol group, along with the number of hits, % hits, total bytes of traffic generated and what % of traffic each protocol group constitute to the total traffic. The Top External Sites graph shows the top external sites that were visited. This is destination based report which list the external servers or sites which served more for the internal hosts. Transaction is not started/initiated by the servers listed here. You can expect all external sites which are browsed more by your internal hosts. The table below the graph shows the host name or IP address, along with the number of hits, the total bytes of traffic to the site, and % of total traffic to the particular external site. The Top Conversations table lists details like host which initiated the conversation, its destination, the protocol used for the conversation along with the number of hits, the total bytes of traffic generated and % of total traffic for the particular conversation.

CARL : Cyberoam Aggregated Reporting and Logging :: User Guide
43
Streaming and Chat Sites Reports
The Streaming and Chat Sites Reports section includes reports on streaming and chat sites visited. In order to identify your external hosts, you need to first configure your intranets by clicking the Intranet Settings link from the Settings tab. When configured, all hosts outside your configured intranets will be considered as external hosts. The Show bar lets you choose the level of detail in the reports. By default, the top five values are shown. To show more than ten values, the report uses only tables. Click on the icon to export this report to PDF. Click on the icon to export this report to CSV format (comma separated values). Below each graph click the Hide Table link to hide the table. Click the Show Table link to see the table again. The Top Streaming and Chat Sites graph shows the top streaming and chat sites that are sending and receiving traffic through the firewall. Here you can expect only IP's outside your LAN. The table below the graph shows the IP address, along with the number of hits, bytes received, bytes sent, and the total bytes (sent + received) of traffic generated. The Top Protocols graph shows the top protocols used for accessing the streaming and chat sites through the firewall. The table below the graph shows the protocol used by the internal host to access the streaming and chat site, along with the absolute number of hits, bytes received, bytes sent, and the total bytes (sent + received) of traffic generated. The Top Sources graph shows the top hosts that accessed the streaming and chat sites. The table below the graph shows the internal host accessing the streaming and chat site, along with the number of hits, bytes received, bytes sent, and the total bytes (sent + received) of traffic generated. The Top Attacks Using Streaming and Chat Protocols table lists details like host, its destination, the protocol used for the conversation, the name or id (as defined by the firewall) of the attack, the attack count, status of the attack, and the attack message generated by the firewall.

CARL : Cyberoam Aggregated Reporting and Logging :: User Guide
44
Security Reports
The Security Reports section includes reports that help in monitoring and analyzing the security and effectiveness of the firewall, and assist in identifying, tracking, and investigating potential security risks. The Show bar lets you choose the level of detail in the reports. By default, the top five values are shown. To show more than ten values, the report uses only tables. Click on
the icon to export this report to PDF. Click on the icon to export this report to CSV format (comma separated values). Below each graph click the Hide Table link to hide the table. Click the Show Table link to see the table again. The Top Denied Hosts report shows the top source IP addresses or host names that have been denied requests for the selected time period. The Top Denied Destinations report shows the top destination IP addresses or host names that have been denied responses for the selected time period. Drill down from these graphs to see the following details:
Field Description
Destination/ Host
The destination host name or IP address to which requests were denied/ The host name or IP address of the host whose requests were denied
Protocol The protocol used by the denied request Hits The number of times the request was generated Time The timestamp of the last time when the request was received Message The message generated when the request was denied
The Top Denied Protocols report shows the top protocols that have been denied requests for the selected time period. Drill down from this graph to see the following details:
Field Description
Host The host name or IP address of the host whose requests were denied
Destination The destination host name or IP address that denied the request Hits The number of times the request was generated Time The timestamp of the last time when the request was received Message The message generated when the request was denied
The Top Security Events pie-graph shows the top events generated with severity as Emergency, Critical, Alert, Error, or Warning.
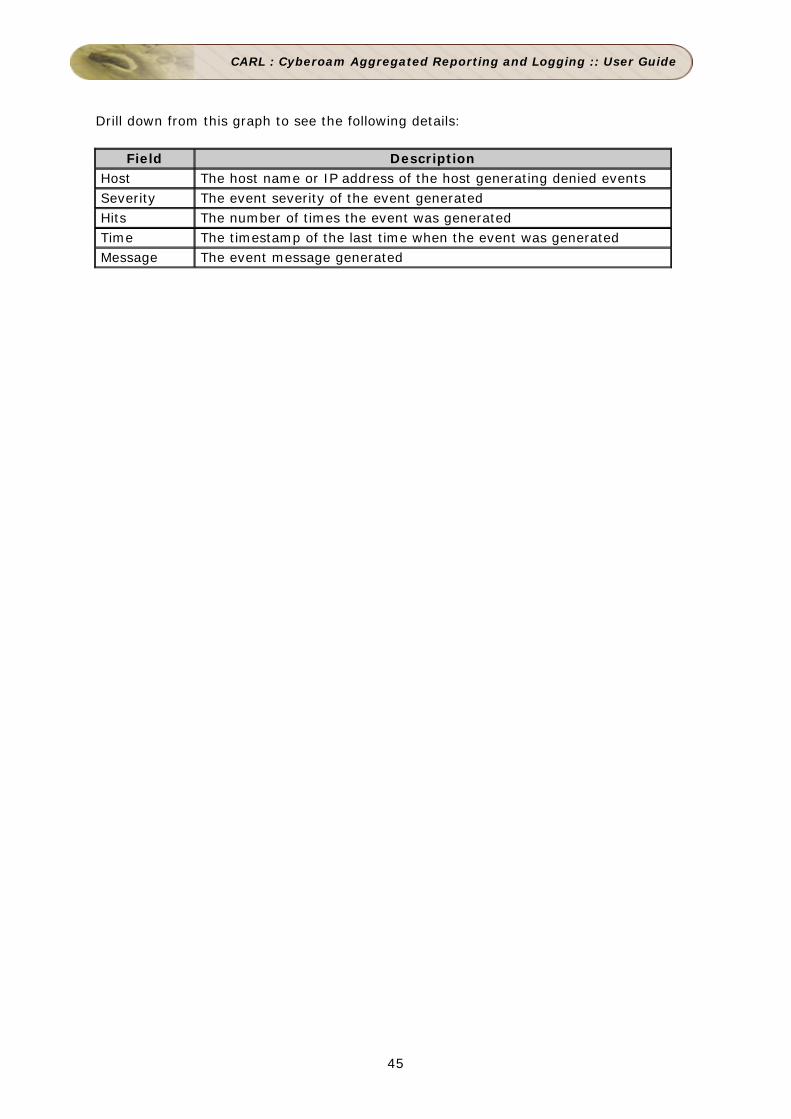
CARL : Cyberoam Aggregated Reporting and Logging :: User Guide
45
Drill down from this graph to see the following details:
Field Description Host The host name or IP address of the host generating denied events Severity The event severity of the event generated Hits The number of times the event was generated Time The timestamp of the last time when the event was generated Message The event message generated
CARL : Cyberoam Aggregated Reporting and Logging :: User Guide
46
Virus Reports
The Virus Reports section includes reports that show details on viruses that have been identified by the firewall. These reports help in identifying the top viruses and worms that have affected the network, analyze the extent of damage, and also track the source of the attack. The Show bar lets you choose the level of detail in the reports. By default, the top five values are shown. To show more than ten values, the report uses only tables. Click on the icon to export this report to PDF. Click on the icon to export this report to CSV format (comma separated values). Below each graph click the Hide Table link to hide the table. Click the Show Table link to see the table again The Top Virus Sending Hosts report shows the top source IP addresses or host names from which viruses have been sent, along with the protocol used to send the virus. The Top Virus Affected Hosts report shows the top destination IP addresses or host names that have been affected by viruses, along with the protocol that was used to receive the virus. Drill down from these graphs to see the following details:
Field Description Virus The name of the virus that was sent or received Destination/ Host
The destination host or IP address to which the virus was sent/ The host or IP address that sent the virus
Severity The severity level of the virus, as defined by the firewall File The name of the virus file that was sent or received
Hits The number of times the virus was sent to or received by the same host
Subtype The subtype of the virus, as defined by the firewall Time The timestamp when the virus was sent or received Message The virus message generated by the firewall
The Top Protocols Used By Viruses report shows the top protocols used by each virus. The Top Viruses By Priority report shows the top severities with which viruses have been sent. Drill down from these graphs to see the following details:
Field Description Host The host or IP address that sent the virus Destination The destination host or IP address to which the virus was sent Severity/ Protocol
The severity level of the virus, as defined by the firewall/ The protocol used to send the virus
File The name of the virus file that was sent or received
Hits The number of times the virus was sent to or received by the same host
Subtype The subtype of the virus, as defined by the firewall Time The timestamp when the virus was sent or received Message The virus message generated by the firewall

CARL : Cyberoam Aggregated Reporting and Logging :: User Guide
47
The Top Virus Files report shows the top virus files that have been sent. The Top Virus with Status report shows the status of the Top Virus. Drill down from these graphs to see the following details:
Field Description Virus The name of the virus that sent this file Host The host or IP address that sent the virus file Destination The destination host or IP address to which the virus file was sent Protocol The protocol used by the virus to send this virus file Severity The severity level of the virus, as defined by the firewall Hits The number of times the virus file was sent to the same host Subtype The subtype of the virus, as defined by the firewall Time The timestamp when the virus file was sent Message The virus message generated by the firewall

CARL : Cyberoam Aggregated Reporting and Logging :: User Guide
48
Attack Reports
The Attack Reports section includes reports that show details of attacks that have been identified by the firewall. These reports help in identifying the top attackers, the top targets for the attacks and other details like protocol used, the priority of the attack and the status of the attack. The Show bar lets you choose the level of detail in the reports. By default, the top five values are shown. To show more than ten values, the report uses only tables. Click on the icon to export this report to PDF. Click on the icon to export this report to CSV format (comma separated values). Below each graph click the Hide Table link to hide the table. Click the Show Table link to see the table again. The Top Attackers report shows the top source IP addresses or host names from which attacks are originating, along with the protocol used for the attack and the number of hits. The Top Targets report shows the top destination IP addresses or host names that have been attacked, along with the protocol used for the attack and the number of hits. Drill down from these graphs to see the following details:
Field Description
Attack The name or id (as defined by the firewall) of the attack that was sent or received
Destination/ Host
The destination host or IP address to which the attack was sent/ The host or IP address that sent the attack
Severity The severity level of the attack, as defined by the firewall
Hits The number of times the attack was sent to or received by the same host
Subtype The subtype of the attack, as defined by the firewall Time The time stamp when the attack was sent or received Status The status of the attack that was sent or received Message The attack message generated by the firewall
The Top Protocols Used By Attacks report shows the top protocols used by each attack. The Top Attacks By Priority report shows the top attacks classified based on priority like Alert, Emergency etc. Drill down from these graphs to see the following details:
Field Description Host The host or IP address that sent the attack Destination The destination host or IP address to which the attack was sent Severity/ Protocol
The severity level of the attack, as defined by the firewall/ The protocol used to send the attack
Hits The number of times the attack was sent to or received by the same host
Subtype The subtype of the attack, as defined by the firewall Time The time stamp when the attack was sent or received Status The status of the attack that was sent or received Message The attack message generated by the firewall
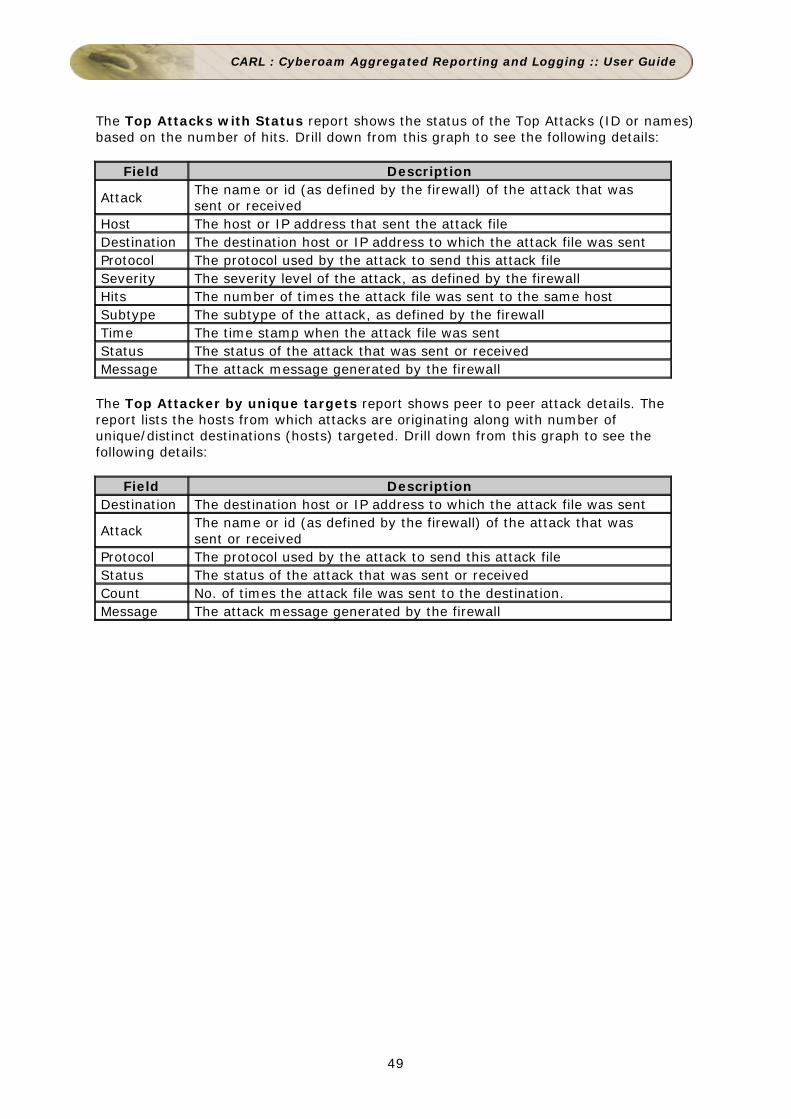
CARL : Cyberoam Aggregated Reporting and Logging :: User Guide
49
The Top Attacks with Status report shows the status of the Top Attacks (ID or names) based on the number of hits. Drill down from this graph to see the following details:
Field Description
Attack The name or id (as defined by the firewall) of the attack that was sent or received
Host The host or IP address that sent the attack file Destination The destination host or IP address to which the attack file was sent Protocol The protocol used by the attack to send this attack file Severity The severity level of the attack, as defined by the firewall Hits The number of times the attack file was sent to the same host Subtype The subtype of the attack, as defined by the firewall Time The time stamp when the attack file was sent Status The status of the attack that was sent or received Message The attack message generated by the firewall
The Top Attacker by unique targets report shows peer to peer attack details. The report lists the hosts from which attacks are originating along with number of unique/distinct destinations (hosts) targeted. Drill down from this graph to see the following details:
Field Description Destination The destination host or IP address to which the attack file was sent
Attack The name or id (as defined by the firewall) of the attack that was sent or received
Protocol The protocol used by the attack to send this attack file Status The status of the attack that was sent or received Count No. of times the attack file was sent to the destination. Message The attack message generated by the firewall

CARL : Cyberoam Aggregated Reporting and Logging :: User Guide
50
Trend Reports
Trend Reports analyze traffic over several time periods and present graphs that make analysis and forecasting a lot easier. CARL includes trend reports based on traffic generated, protocols used, and events triggered. Trend reports compare the current trend with the historical trend on an hourly, daily, and weekly basis. Historical trends show data from the time the server was started. CARL includes three types of trend reports that are described in the following sections:
• Protocol Trend Reports • Traffic Trend Reports • Event Trend Reports
CARL : Cyberoam Aggregated Reporting and Logging :: User Guide
51
Protocol Trend Reports
The Protocol Trend Reports section includes reports that show trends in the amount of traffic generated using different protocol groups. Protocol trends help in identifying peak usage times for each protocol group, understanding user trends, and enforcing better policies to allow traffic from each protocol group. Click on the icon to export this report to PDF. Click on the icon to export this report to CSV format (comma separated values). Below each graph click the Hide Details link to hide the table. Click the Show Details link to see the table again. The Hourly Trend Comparison reports for Web, Mail, FTP, and Telnet protocol groups compare the traffic generated using these protocol groups over the past day, with the traffic generated since the time the server was started. The Working Hour and Non-working Hour Traffic Trend reports show the amount of traffic generated using each protocol group during working and non-working hours respectively, since the time the server was started.

CARL : Cyberoam Aggregated Reporting and Logging :: User Guide
52
Traffic Trend Reports
The Traffic Trend Reports section includes reports that show trends in the amount of traffic generated across the firewall. Traffic trends help in understanding peak usage times, enforcing better security policies, and planning for effective bandwidth upgrades. In a large enterprise with several firewalls, traffic trends can also help the network administrator to distribute the traffic load between firewalls to reduce response times and thereby enable better quality of service. Click on the icon to export this report to PDF. Click on the icon to export this report to CSV format (comma separated values). Below each graph click the Hide Details link to hide the table. Click the Show Details link to see the table again. The Hourly Trend Comparison report compares the amount of traffic generated across this firewall over the past day, with the amount of traffic generated across this firewall since the time the server was started. The Weekly Trend Comparison report compares the amount of traffic generated across this firewall over the past week, with the amount of traffic generated across this firewall since the time the server was started. The Working Hour and Non-working Hour Traffic Trend reports show the amount of IN and OUT traffic generated across this firewall during working and non-working hours respectively, since the time the server was started.
CARL : Cyberoam Aggregated Reporting and Logging :: User Guide
53
Event Trend Reports
The Event Trend Reports section includes reports that show trends in the number of events generated across the firewall. Event trends help in identifying malfunctioning hosts and malevolent systems, that eventually lead to enforcing better security policies, and increasing network perimeter security. Click on the icon to export this report to PDF. Click on the icon to export this report to CSV format (comma separated values). Below each graph click the Hide Details link to hide the table. Click the Show Details link to see the table again. The Hourly Trend Comparison report compares the number of events generated across this firewall over the past day, with the number of events generated across this firewall since the time the server was started. The Weekly Trend Comparison report compares the number of events generated across this firewall over the past week, with the number of events generated across this firewall since the time the server was started. The Working Hour and Non-working Hour Event Trend reports show the number of events generated across this firewall during working and non-working hours respectively, since the time the server was started.

CARL : Cyberoam Aggregated Reporting and Logging :: User Guide
54
Custom Reports Creating Report Profiles
Custom reports in CARL are grouped into report profiles, and listed under the My Reports category. A report profile can contain a combination of pre-defined and custom reports. The My Reports section is present in the Reports tab and the left navigation pane. The process of creating a report profile includes several other tasks such as including and excluding log filters, and setting custom criteria for specific reports.
Creating a Report Profile
Click the Add Report Profile link to create a new report profile. You can click this link from the sub tab, the left navigation pane, or the My Reports section in the Reports tab. Step 1: Select Devices and Filters
1. For Report Profile Name, enter a unique name for the report profile. 2. Select the devices (firewalls) to report on. If you want to report on all the devices
sending logs to a specific syslog port, then select the Select All Devices check box.
3. You can specify the filters on log data, in the section Choose the Filters. Follow the instructions available for Setting Log Filters to know more about operations on Include and Exclude filters.
4. Click Next to continue to the next step of the wizard. Click Cancel to exit the wizard.
Step 2: Select Report Type and Schedule This step lets you specify which reports to include as part of this report profile, and set up schedules to generate this report profile automatically.
1. From the list of Available Reports, select the reports that you want to include in this report profile. All the pre-defined reports are listed, along with custom reports that you have previously set up. You can save the report in PDF and also can customize the PDF report by selecting the Customize images for PDF Reports , whereby you can provide your own Cover image (820 by 612 pixels) and Footer image (37 by 547 pixels).
Look up Creating Custom Criteria Reports to know more about adding a new report to this list
2. In the Schedule & Email Options section, choose a Schedule Type to schedule this report to be automatically generated at specific time intervals. Choose from hourly, daily, weekly, or monthly schedules, or choose to run this report only once. For Daily, and Only once schedules, you can set the TimeFilter for Custom Hours, Only Working Hours, or Only NonWorking Hours.

CARL : Cyberoam Aggregated Reporting and Logging :: User Guide
55
For the Daily schedules, if the option Run on Week Days is selected then the reports are run daily except on the weekends. For the Weekly or Monthly schedules, select the option Generate Report only for Week Days if you want to report on the events that occurred only on the week days and not report on events that occurred over the weekends. If the Email the Report option is checked, the scheduled report will be generated and emailed as PDF to the Mail Id that is provided. You can use comma "," separator for multiple mail ids.
You need to configure the mail server settings in CARL before setting up an email notification. You can do this from the Setup the Mail-Server Details link.
3. Click Preview to see how this report will look like, once it is set up. Click Save to save this report profile under the My Reports section. Click Cancel to exit the wizard.
CARL : Cyberoam Aggregated Reporting and Logging :: User Guide
56
Setting Log Filters
Include filters specify those criteria which the log data must meet in order to be included in the report. Exclude filters specify those criteria which the log data must meet in order to be excluded from the report. Apart from selecting specific filters to apply on a report, you can also add, select, edit, and delete filters in this step. Include and Exclude filters let you filter log data and show only specific details in the custom report. Once you have set filters, you can include or exclude them while creating custom reports. Adding a New Filter:
1. Click the Add icon to add a new filter 2. In the popup window that opens, enter a unique name for the filter 3. Select the type of filter you are creating, whether its a Include Filter or an
Exclude Filter. 4. In the Include the following Protocols drop-down, choose the protocols to be
filtered 5. In the Include the following IP/Hostname drop-down, specify the IP
addresses of the hosts (Single or IPRange or CIDR) to be filtered. 6. In the Include the following Destinations drop-down, specify the IP addresses
of destination address (Single or IPRange or CIDR) to be filtered 7. In the Include the following Events drop-down, choose the event priorities to
be filtered 8. In the Include the following Users drop-down, specify the users to be filtered 9. Click Finish to create the new filter. Click Cancel to exit the wizard without
saving the new filter.
Selecting a Filter:
1. Click the Select icon to select from the list of already created filters. 2. You can select a specific filter or All filters and then click the Select button. Click
Cancel to exit the wizard without selecting.
Editing a Filter:
1. Click the Edit icon to edit an existing filter 2. Editing a filter affects all existing report profiles to which this filter is applied. If
you still want to edit the filter, accept the warning message and proceed editing. 3. The wizard for editing the filter is similar to that for adding a new filter. Follow the
same steps and click Finish to save the edited filter. Click Cancel to exit the wizard without saving the edited filter.
Removing a Filter:
1. Click the Remove icon to remove or delete an existing filter 2. Choose whether you would like to Remove filter from the list or Remove it
completely 3. Remove filter from the list option will only remove the filter from this listing,
but would still be available for selection. Remove it completely option will remove this filter permanently and affects all existing report profiles to which this filter is applied. If you still want to remove this filter completely, accept the warning message. The filter is removed, and all report profiles to which this filter is applied, are permanently modified to reflect the changes.

CARL : Cyberoam Aggregated Reporting and Logging :: User Guide
57
Creating Custom Criteria Reports
CARL lets you define custom criteria and set up new reports. These reports are added to the Available Reports list, in Step 3 of the Add Report Profile wizard.
1. In Step 3 of the Add Report Profile wizard, click the icon to add a new report 2. In the popup window that opens, enter a unique name for the report 3. In the Report based on selection, choose Protocol, URL, or Event depending on
the report criteria you will specify. 4. In the Graph Settings tab, choose the following:
1. The type of graph to be displayed, in the Graph Types drop-down list 2. The attributes to be used for the X and Y axes of the graph, along with the
labels to be displayed 3. The attribute based on which all data will be grouped together, in the
Grouping Criteria option 4. The attribute based on which data will be sorted, in the Order By option
5. In the Table Settings tab, choose the values to be shown in the table of the report
Once you have selected all the required options, click Apply to include this new report in the Available Reports list. Select the checkbox next to this report to include it in a report profile. You can click the icon at any time to delete a custom report from the Available Reports list.Using Advanced Search
CARL provides advanced search feature. Advanced Search, offers numerous options for making your searches more precise and getting more useful results Aggregated Logs Database. It allows you to search from the Raw Firewall Logs. Using this feature, you will be able to save the search results as Report Profiles. This provides a simplified means to create very precise, selectively filtered and narrowed down Report Profiles.
• Advanced Search • Using Advanced Search to create Report Profiles
Advanced Search
In Advance Search, you can search the logs for the selected devices, from the aggregated logs database or raw firewall logs, and define matching criteria. Selected Devices In this section, you can choose the devices for which you want the logs to be searched. If no device is selected or you want to change the list of selected devices, select the devices.
1. Click Change Selection link. 2. Select Devices from the list window pops-up. In that window, All Devices with
selection check box and individual devices with selection check boxes options are available.
3. Select the devices by selecting the check boxes as per your requirement. Click OK to select the devices and close the window or click Cancel to cancel the opration and close the window.
The selected devices are displayed in this section.

CARL : Cyberoam Aggregated Reporting and Logging :: User Guide
58
Search From In this section, you can select one from the two options:
1. Aggregated Logs Database 2. Raw Firewall Logs
1. Aggregated Logs Database
Select this option if you want to search from the aggregated logs database.
2. Raw Firewall Logs
Select this option if you want to search from the raw firewall logs. Selecting this option will enable the following options:
a. Raw Virus/Attack Logs b. Raw Device Management Logs c. Raw Denied Logs
Select the above logs options as per your requirement. Define Criteria This section, enables you to search the database for attributes using more than one following criteria's:
Criteria Description
Protocol Refers to the list of protocols and protocol identifiers that are available in the Protocol Groups page (Settings >> Protocol Groups) example: 8554/tcp, rtsp, IPSec
Source Refers to the source host name or IP address from which requests originated
Destination Refers to the destination host name or IP address to which requests were sent
User Refers to the authenticated user name required by some firewall's example: john, kate
Virus Refers to the Virus name. examples: JS/Exception, W32/Mitglieder
Attack Refers to the attack name. examples: UDP Snort, Ip spoof
Device Refers to the device from which logs are collected Message Refers to the log message texts stored in the DB
• If the search string exists then the search result will be intelligently displayed based on the report category in which it occurred.
• By default, the search is carried out for the time period selected in the Global Calendar present in the left pane of the UI.
• You can also search within the search results.

CARL : Cyberoam Aggregated Reporting and Logging :: User Guide
59
Using Advanced Search to create Report Profile
To generate Virus/Attack reports:
• Click Advanced Search link in the Sub Tab. • Select appropriate Devices.
Raw Firewall Logs
o Select Raw Firewall Logs radio button. o Select Raw Virus/Attack Logs in the Raw Firewall Logs group. o In the Criteria section, enter Duration isn't '0'. o Click Search and click Configure Columns to change reports columns.
Aggregated Logs Database
o Select Aggregated Logs Database radio button. o In the Criteria section, select Match all of the following or Match any
of the following to match all the criteria set or any of the criteria set and add or remove additional criteria using Add Criteria and Remove Criteria links and select Protocol is 'HTTP'.
o Click Search. Search results provide the Reports related to your search <for time period from begining of the day to current time>.
o Select the required reports by selecting the individual reports or by selecting the Add Criteria to select all the reports. These will form the criteria for the Report Profile.
• To save the search result as report profile, click Save as Report Profile link. • Enter a Report Profile Name. • Schedule the report, if required by selecting Associate Schedule check box. • Click Save as Profile button. A new report profile is added.
In the Configure Columns pop-up screen you can select the required columns of the report. For example: User, StartTime, Time, and Duration. Here Time represents EndTime of the connection.

CARL : Cyberoam Aggregated Reporting and Logging :: User Guide
60
Notifications Creating an Alert Profile
An alert is triggered whenever an event matching a specific criteria is generated. An alert profile lets you define such specific criteria, and also notify you by email, when the corresponding alert is triggered.
• Creating New Alert Profile • Example Alert Profile
Creating a New Alert Profile
Click the Add Alert Profile link to create a new alert profile. You can find this link on the sub tab or in the Alerts box in the left navigation pane when the Alerts tab is selected.
1. Enter a unique name for the alert profile. 2. Select the devices for which the alert needs to be triggered by clicking the
Change Selection link and selecting the required devices. 3. Select either of the Alert Profile Type:
1. Normal Alert Profile 1. Filters:
Define Criteria for which the alert needs to be triggered. You can set criteria based on the Severity, Protocol, Date, Received (in Bytes), Sent (in Bytes), Source, Destination, URL, Status, File Name, Rule, Virus, Attack, Protocol Identifies, Message, Duration (in seconds), or Record Type. Use the Add Criteria and Remove Criteria to specify more or fewer criteria for the alert.
2. Threshold: The Priority of the alert can be High, Medium, or Low based on your requirement for notification.
3. Enter the threshold criteria for the alert to be triggered. For example: Trigger an Alert for every: 5 Events generated within 2 Minutes Here, Events refer to the criteria that has been defined above.
4. You can Apply Threshold to: Either, All Devices Selected, in which case the alert will be triggered when all the firewalls cumulatively crosses the threshold set in the threshold criteria above. Or, Each Device Selected, in which case the alert will be triggered when each firewall crosses the threshold set in the threshold criteria above.
2. Anomaly Alert Profile type, can be selected when you would like to be notified of any abnormal behaviors or traffic anomalies. Anomaly reports can be used for Network Behavioral Analysis (NBA).
1. Select the type of anomaly alert report you would like to receive. The report types could be Traffic Report, Attack Report, Virus Report, URL Report, Rule Report, or Event Report.
2. Filters: Each of the above report types provide a set of filters which can be configured as per the nature of the alert you would like to receive.
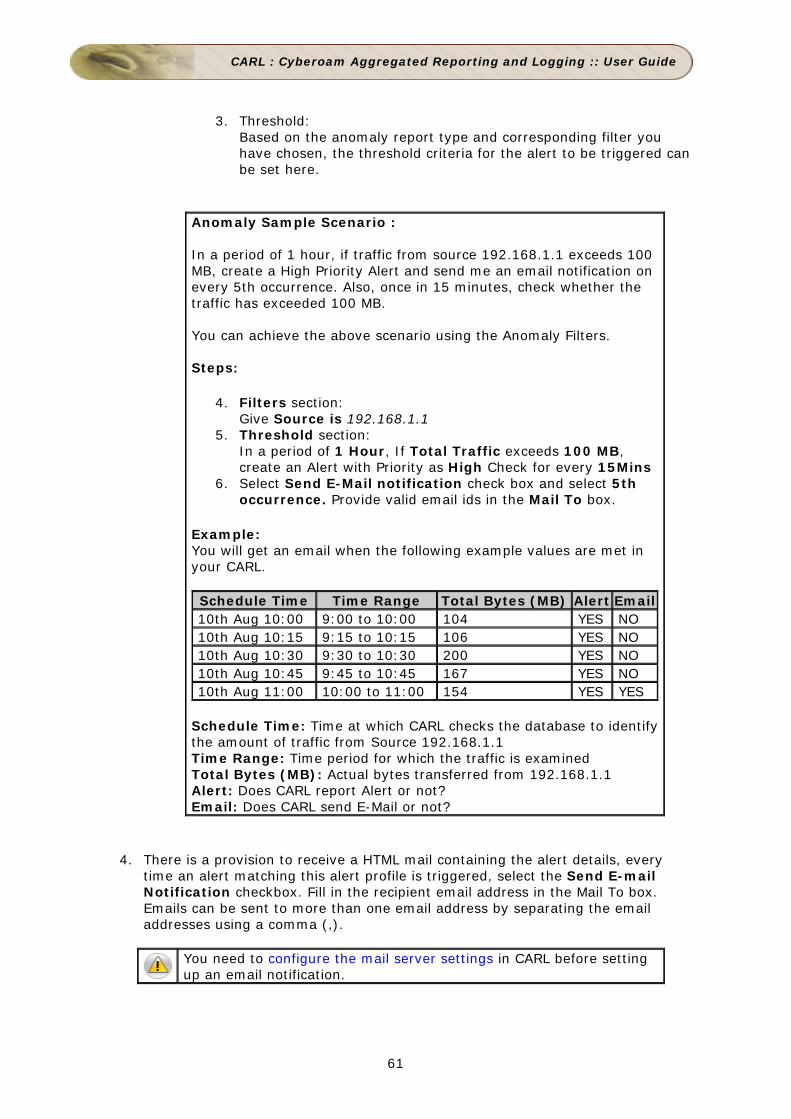
CARL : Cyberoam Aggregated Reporting and Logging :: User Guide
61
3. Threshold: Based on the anomaly report type and corresponding filter you have chosen, the threshold criteria for the alert to be triggered can be set here.
Anomaly Sample Scenario : In a period of 1 hour, if traffic from source 192.168.1.1 exceeds 100 MB, create a High Priority Alert and send me an email notification on every 5th occurrence. Also, once in 15 minutes, check whether the traffic has exceeded 100 MB. You can achieve the above scenario using the Anomaly Filters. Steps:
4. Filters section: Give Source is 192.168.1.1
5. Threshold section: In a period of 1 Hour, If Total Traffic exceeds 100 MB, create an Alert with Priority as High Check for every 15Mins
6. Select Send E-Mail notification check box and select 5th occurrence. Provide valid email ids in the Mail To box.
Example: You will get an email when the following example values are met in your CARL.
Schedule Time Time Range Total Bytes (MB) Alert Email 10th Aug 10:00 9:00 to 10:00 104 YES NO 10th Aug 10:15 9:15 to 10:15 106 YES NO 10th Aug 10:30 9:30 to 10:30 200 YES NO 10th Aug 10:45 9:45 to 10:45 167 YES NO 10th Aug 11:00 10:00 to 11:00 154 YES YES
Schedule Time: Time at which CARL checks the database to identify the amount of traffic from Source 192.168.1.1 Time Range: Time period for which the traffic is examined Total Bytes (MB): Actual bytes transferred from 192.168.1.1 Alert: Does CARL report Alert or not? Email: Does CARL send E-Mail or not?
4. There is a provision to receive a HTML mail containing the alert details, every time an alert matching this alert profile is triggered, select the Send E-mail Notification checkbox. Fill in the recipient email address in the Mail To box. Emails can be sent to more than one email address by separating the email addresses using a comma (,).
You need to configure the mail server settings in CARL before setting up an email notification.
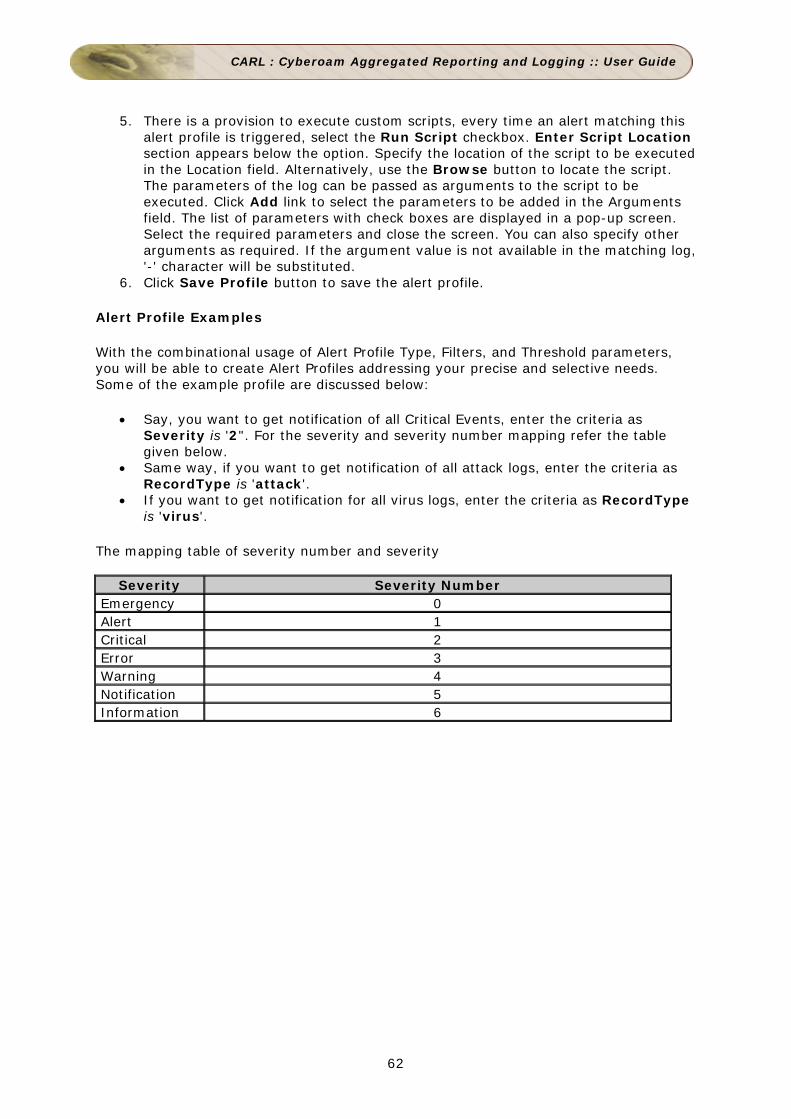
CARL : Cyberoam Aggregated Reporting and Logging :: User Guide
62
5. There is a provision to execute custom scripts, every time an alert matching this alert profile is triggered, select the Run Script checkbox. Enter Script Location section appears below the option. Specify the location of the script to be executed in the Location field. Alternatively, use the Browse button to locate the script. The parameters of the log can be passed as arguments to the script to be executed. Click Add link to select the parameters to be added in the Arguments field. The list of parameters with check boxes are displayed in a pop-up screen. Select the required parameters and close the screen. You can also specify other arguments as required. If the argument value is not available in the matching log, '-' character will be substituted.
6. Click Save Profile button to save the alert profile.
Alert Profile Examples
With the combinational usage of Alert Profile Type, Filters, and Threshold parameters, you will be able to create Alert Profiles addressing your precise and selective needs. Some of the example profile are discussed below:
• Say, you want to get notification of all Critical Events, enter the criteria as Severity is '2". For the severity and severity number mapping refer the table given below.
• Same way, if you want to get notification of all attack logs, enter the criteria as RecordType is 'attack'.
• If you want to get notification for all virus logs, enter the criteria as RecordType is 'virus'.
The mapping table of severity number and severity
Severity Severity Number Emergency 0 Alert 1 Critical 2 Error 3 Warning 4 Notification 5 Information 6
CARL : Cyberoam Aggregated Reporting and Logging :: User Guide
63
Viewing Alerts
After setting up an Alert Profile, select the Alerts tab to see the list of alerts triggered. By default, the Alerts tab lists all the alerts triggered so far. The list shows the timestamp of the alert, the host which triggered it, the alert priority, and the status of the alert. Clicking on each alert profile would provide the details of the alert like why, when, & for which device the alert was triggered.
Viewing Alerts for an Alert Profile
The Alerts box on the left navigation pane lists all the alert profiles created so far. Click on each alert profile to view the corresponding list of alerts triggered. The icon against an alert profile indicates that an email notification has been setup. The icon against an alert profile indicates that a Run Script action has been setup. The icon indicates that the alert profile is currently enabled and active. To disable the alert profile, click on this icon. The alert profile is now disabled, and the icon is shown. When an alert profile is disabled, alerts will not be triggered for that alert profile. To start triggering alerts again, click on the icon to enable the alert profile. To edit an alert profile click on icon. To delete an alert profile, click on the icon. The Alerts tab lets you view alerts for various alert profiles set up. To manage alert profiles, click the Alert Profiles link in the Settings tab.
CARL : Cyberoam Aggregated Reporting and Logging :: User Guide
64
Alerts Administration
Select the Alerts tab to see the list of alerts triggered. By default, the Alerts tab lists all the alerts triggered so far. The triggered alerts can be administered by the users of CARL application. This topic explains the following sub-topics of alert administration.
• All Alerts • Administering Alerts • Alert Actions • My Alerts
The administrator or operator can keep track of the actions taken on a particular alert. The actions are:
• The user can add a note or view the note(s) added by other users. • The users can view the complete history of actions and notes on the alert but will
not be able to modify the contents. • The administrator can assign an alert to operator user. • The operator can assign the alert to another operator user. • The assigned user can remediate the alert and add the notes. • The administrator only can delete the alerts which are not required any longer.
The All Alerts list shows the following: Alert Profile - the alert profile which triggered the alert.
Generated Time
- the time stamp of the alert.
Device - the host which triggered the alert.
Priority - the alert priority (high, medium, low) which was set as per requirement at the alert profile creation time.
Status - the status of the alert notification, if any notification is configured.
Alert Owner - the CARL application user assigned as owner to remediate the triggered alert
Action - the action by the user on the alert, to add or view notes on the alert and delete the alert.
Administering Alerts Clicking on each alert profile would display the details of the alert and the details of the alert profile which triggered the alert. The Alert Details are:
Criticality - the alert priority (high, medium, low) which was set as per requirement at the alert profile creation time the host which triggered the alert.
Last Event Message
- the last event (type) message, which triggered the alert notification.

CARL : Cyberoam Aggregated Reporting and Logging :: User Guide
65
Alert Profile Name
- the name of the alert profile which triggered this alert. Besides the name, there is a link named "View all the alerts generated by this profile". Clicking the link displays all the alerts generated by the profile.
Alert Notification Status
- the status of the alert notification, if any notification is configured.
Date & Time - the time stamp of the alert.
Alert Actions - the action by the user on the alert, to add or view notes on the alert, assign owner, view alert history, and delete the alert.
The Alert Profile Details are: Matching Conditions
- the matching condition(s) set in the alert profile to triggered an alert.
Latest Record - displays the record of the last event, which triggered the alert notification.
Alert Actions The actions which can be performed by the users are: Add/View Note
- the user can add a note or view the already existing note entries pertaining to this alert. Any user can add a note to the alert.
Assign Owner
- any user, higher in the hierarchy can assign an user, lower in the hierarchy, as owner to the alert to remediate. The hierarchy of users in the CARL application is: Admin > Operator > Guest. The lower hierarchy users can assign the alert to the user of same hierarchy, but cannot assign to the user in higher hierarchy.
Alert History
- all the actions like creation, assigning owner along with the notes, if any will be listed for the particular alert.
Delete Alert
- the administrator user can only delete the alert if it is not required any longer.
My Alerts My Alerts lists the alerts assigned to an operator user either by another operator user or admin user. Same way, it lists the alerts assigned to an admin user either by another admin user or himself. It is displayed below the All Alerts on the Left Navigation Pane, only if alerts were assigned to the logged-in user. The My Alerts list displays the alert details same as that of the All Alerts list.

CARL : Cyberoam Aggregated Reporting and Logging :: User Guide
66
System Settings Configuring System Settings
The Settings tab lets you configure several system settings for the server running CARL, as well as other settings. The Simulate option sends sample firewall logs to CARL so that you can view reports without having to send actual firewall logs. At any time, click the Stop Simulate link to stop sending sample data. The Data Storage Size section in the left navigation pane of Settings tab lets you to configure data storage duration settings for the database and archive of CARL The following is the the list of configuration options available under the System Settings section:
Setting Description
Syslog Server Settings Click this link to configure syslog servers to receive logs at different ports
Alert Profiles Click this link to view the alert profiles set up so far
Import Log Files Click this link to import log files from the local machine or by FTP
Device Details Click this link to view details of logs received from each device
Archived Files Click this link to configure archiving intervals, or load an archived file into the database
Schedule Listing Click this link to view the list of reports scheduled
Working Hour Click this link to configure Working and Non-Working hour firewall event log collection pattern of the organization.
Customize Report To customize the device specific reports to be shown in Device Tree and the Reports page.
Configure DNS To configure resolving of DNS reverse lookup, globally for all the reports.
Device Rule To configure viewing of Used and Unused rules of a Firewall device.
The following is the the list of configuration options available under the Administration Settings section:
Setting Description Protocol Groups Click this link to manage protocol groups
Intranet Settings Click this link to configure intranets to identify internal and external traffic
User Management Click this link to add, edit, or delete users in CARL Mail Server Settings
Click this link to configure the mail server
Database Console Click this link to access the database and execute queries Server Diagnostics Click this link to view system-related information for CARL Firewall Availability Alert
Click this link to configure to trigger alerts if there was no logs from Firewalls for a specifc period of time
CARL : Cyberoam Aggregated Reporting and Logging :: User Guide
67
Simulating Firewall Logs
The Simulate option lets you test CARL with sample data before setting it up on your network. The sample data is taken from the firewall_records.xml file present in the <CARL Home>/server/default/conf directory on the server. When you click the Simulate link from the welcome screen or the Settings tab, the syslog server in CARL starts receiving the sample data as logs. The server then analyzes this data and generates reports assuming this data to be actual firewall logs. As a result, you can view all the pre-defined firewall reports, create custom report profiles, and set up notifications just like you would when actual data is received. At any time, click the Stop Simulate link from the Settings tab to stop sending the sample data to the server. However, data already sent to the server will be present until the database is reinitialized.

CARL : Cyberoam Aggregated Reporting and Logging :: User Guide
68
Configuring Data Storage Duration
CARL retains the Firewall log data in the database as well as archives the logs received from each Firewall device, and zips them in regular intervals. The Archived Files page displays files that have been archived for each device. Perpetual retention of data in the database as well as archives use a lot disk space. If you are concerned about the disk space used by CARL, use these options as per your policies. To provide you more control, CARL gives you options to configure the data retention period for the database and archiving separately.
Configuring the Retention Time Period
Select the Settings tab in the Web Client. On the left side of the screen, you will see Data Storage Options section below the Settings section. In that section, there will be two configurations. One is Database and the other is Log Archive. Database In the Database, you can configure the time period to retain the Firewall log data in the database. The time period options are listed in the combo box. The options are:
• Forever • 1 Year • 6 Months • 3 Months • 1 Week
Select the time period as per your requirement. Log Archive In the Log Archive you can configure the time period to retain the archived Firewall log data. The time period options are listed in the combo box. The options are:
• Forever • 1 Year • 6 Months • 3 Months • 1 Month • 1 Week
Select the time period as per your requirement. Click the Update button to configure the data retention time periods.
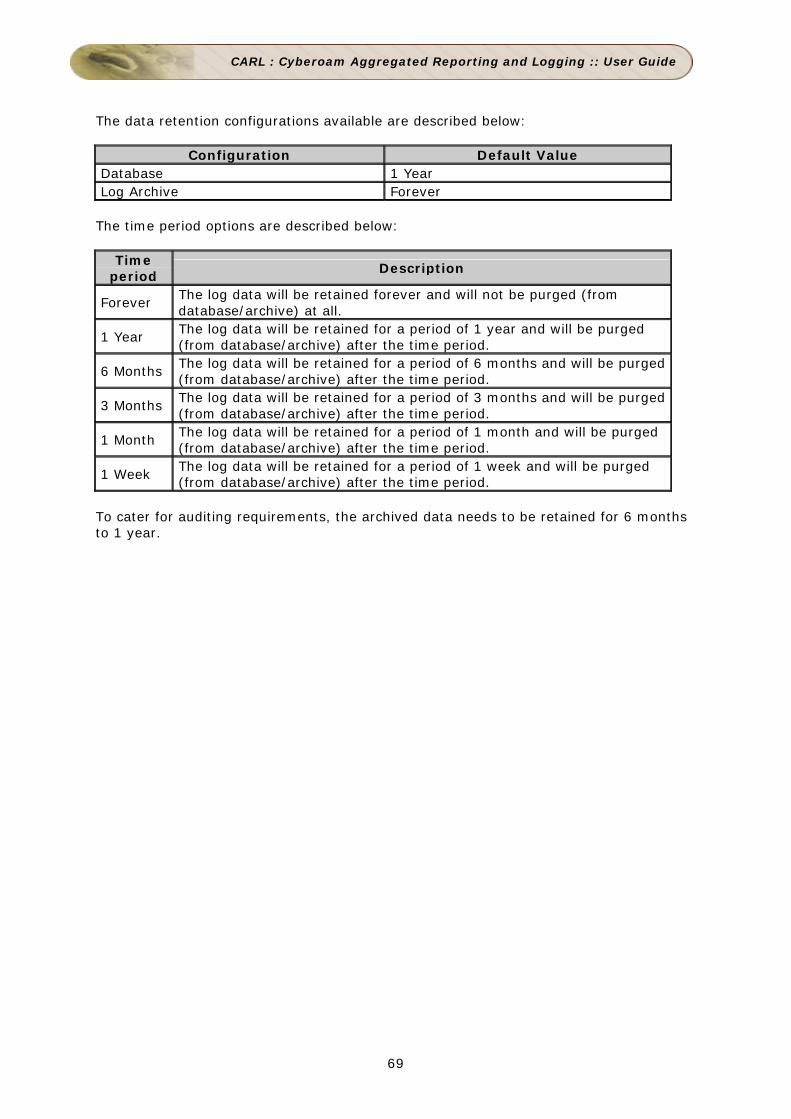
CARL : Cyberoam Aggregated Reporting and Logging :: User Guide
69
The data retention configurations available are described below:
Configuration Default Value Database 1 Year Log Archive Forever
The time period options are described below:
Time period
Description
Forever The log data will be retained forever and will not be purged (from database/archive) at all.
1 Year The log data will be retained for a period of 1 year and will be purged (from database/archive) after the time period.
6 Months The log data will be retained for a period of 6 months and will be purged (from database/archive) after the time period.
3 Months The log data will be retained for a period of 3 months and will be purged (from database/archive) after the time period.
1 Month The log data will be retained for a period of 1 month and will be purged (from database/archive) after the time period.
1 Week The log data will be retained for a period of 1 week and will be purged (from database/archive) after the time period.
To cater for auditing requirements, the archived data needs to be retained for 6 months to 1 year.
CARL : Cyberoam Aggregated Reporting and Logging :: User Guide
70
Managing Syslog Servers
The Syslog Server Settings page lets you manage the various virtual syslog servers set up to receive exported logs at different ports. The default listener ports for the syslog server in CARL are 514 and 1514. If your firewalls are exporting log files to either of these ports, you do not have to set up any virtual syslog servers. The Syslog Servers table shows the various virtual syslog servers set up so far, along with their IP address, listener port, and status. You can delete a virtual syslog server by clicking the icon. Once a virtual syslog server is deleted, the corresponding listener port is also freed. You can also stop the syslog collection by clicking the icon and restart the syslog collection by clicking on the icon.
Adding a New Syslog Server
The Add Syslog Server box lets you add a new virtual syslog server and begin listening on a new port for exported log files. Enter a unique SysLog Server Name for the new virtual syslog server, and the listener port. The Host Name/IP Address field is currently not editable, and takes the IP address of the machine on which the CARL server is running. Click Add Syslog Server to add this virtual syslog server, and begin listening for log files at the specified port.

CARL : Cyberoam Aggregated Reporting and Logging :: User Guide
71
Managing Alert Profiles
The Alert Profiles link lets you manage all the alert profiles set up so far. The Add New Alert Profile link lets you create a new alert profile. The Alert Profiles table lists all the alert profiles, along with the priority, and the number of times each alert has been triggered. Click an alert profile to see the corresponding list of alerts triggered. The toggle icon lets you enable or disable an alert profile and correspondingly start or stop triggering alerts for the same. The icon lets you edit an alert profile. The icon lets you delete an alert profile. Once deleted, the alerts associated with this profile are also deleted from the database. The icon indicates that an email notification has been set up for this alert profile. The corresponding email address is also displayed next to this icon.

CARL : Cyberoam Aggregated Reporting and Logging :: User Guide
72
Importing Log Files
The Import Log Files link lets you import a log file from the local machine or remotely, through FTP. The Imported Log Files page shows you the list of log files imported, along with details such as the host from which it was imported, and the status of the import. Importing of archived files (.gz format) created by CARL and zipped log files (.zip format) are also supported.
• Click the icon to delete an imported log file from the database.
Importing a Log File
1. Click the Import Log File link to import a new log file. 2. Choose Local Host if the log file is present in the local machine from which you
are accessing the CARL server. Click Browse to locate the log file. 3. The option Ignore UnParsed/Junk Record(s) enables the CARL to skip those
records in the imported log file, that are in unsupported format and continue with parsing the subsequent supported records in the file. If not selected, the CARL will not parse the entire log file even if one record contains unsupported log format. Then click Import to import the log file into the database.
4. Choose Remote Host if you need to import the particular log file or the entire directory containing the log files from a remote location on the network.
1. Enter the remote host's hostname or IP address, and the FTP user name and password.
2. Enter the time interval (in minutes) after which CARL should retrieve new log files.
3. Select the Ignore UnParsed/Junk Record(s) option as per requirement.
4. Enter the location on the remote machine where the log file or the entire directory containing the log files is present. You can click the List Remote Files/Directories link to locate the file on the remote computer.
5. Select the Change filename dynamically option, if you want to import the Micosoft ISA Proxy log files.
5. Finally click Import to import the log file into the database.
If you have selected the Ignore UnParsed/Junk Record(s) while importing the logs, the records will not be shown when the icon is clicked on the sub tab.
Micosoft ISA Proxy creates log file with new name (with time stamp appended) everyday. If the Micosoft ISA Proxy log files are to be imported, you do not have to change the filename daily, instead select the Change filename dynamically option while importing the logs. Selecting the option displays the the Filename pattern: text box to enter the time stamp pattern that the Proxy server appends when the Proxy server creates the log file daily. A help tip icon displays, (when you hover the mouse on the icon) the mapping of the Timestamp in Filename to the Pattern to be given. Enter the pattern as required.
The supported formats for imported log files is shown below the Location box. We also support importing of archived files (.gz format) created by our CARL. If you are importing an unsupported log file, a warning message is shown. You can still import the file, but records will show up when the icon is clicked on the sub tab.
CARL : Cyberoam Aggregated Reporting and Logging :: User Guide
73
The time taken to import a log file depends on its file size. Once the file has been imported successfully, the device from which it was imported is listed in the appropriate category, and the reports are generated automatically. The Imported Log Files table shows the list of all log files imported so far. In this list, the latest imported log file will appear on the top. The number of imported log files listed per page can be seleted (5, 10, 20. 50, 100). The icon is displayed if logs have been
imported from the local machine. The icon is displayed if logs have been imported from a remote machine. Click this icon to see the remote host details, and file details for the log file imported. Click the toggle icon to enable or disable collecting logs from this device after the specified time interval. Click the icon to delete all log files imported from this device.
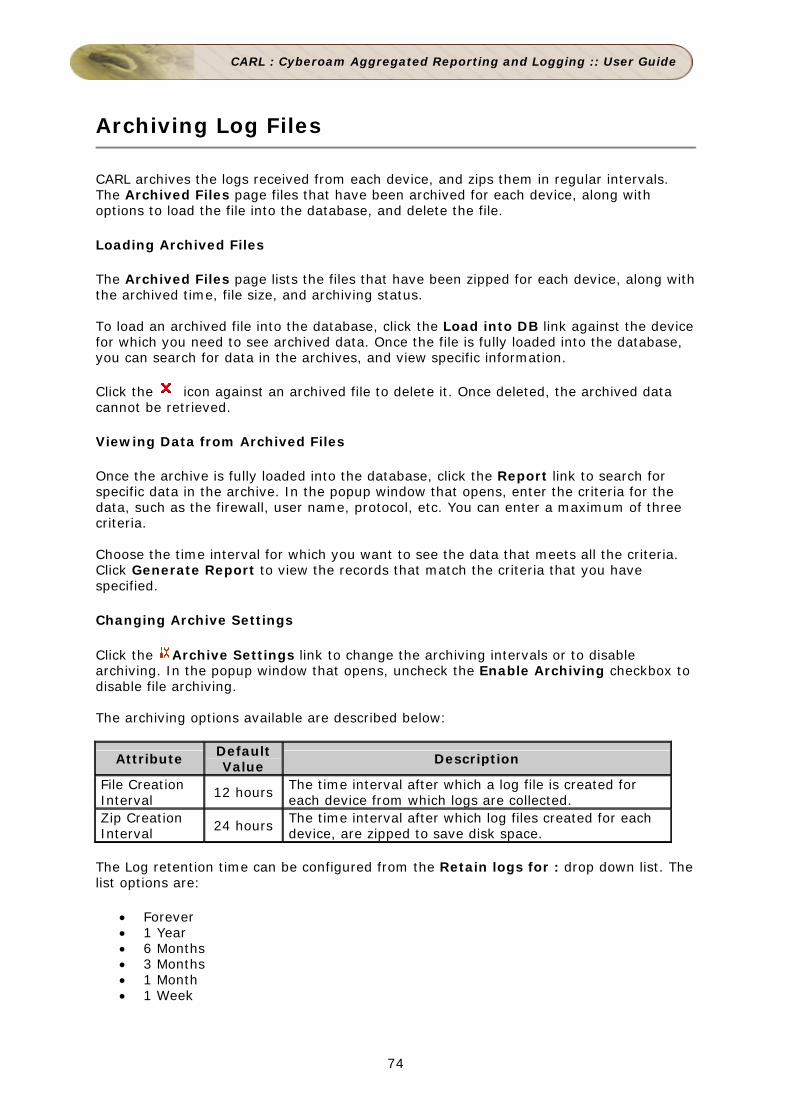
CARL : Cyberoam Aggregated Reporting and Logging :: User Guide
74
Archiving Log Files
CARL archives the logs received from each device, and zips them in regular intervals. The Archived Files page files that have been archived for each device, along with options to load the file into the database, and delete the file.
Loading Archived Files
The Archived Files page lists the files that have been zipped for each device, along with the archived time, file size, and archiving status. To load an archived file into the database, click the Load into DB link against the device for which you need to see archived data. Once the file is fully loaded into the database, you can search for data in the archives, and view specific information. Click the icon against an archived file to delete it. Once deleted, the archived data cannot be retrieved.
Viewing Data from Archived Files
Once the archive is fully loaded into the database, click the Report link to search for specific data in the archive. In the popup window that opens, enter the criteria for the data, such as the firewall, user name, protocol, etc. You can enter a maximum of three criteria. Choose the time interval for which you want to see the data that meets all the criteria. Click Generate Report to view the records that match the criteria that you have specified.
Changing Archive Settings
Click the Archive Settings link to change the archiving intervals or to disable archiving. In the popup window that opens, uncheck the Enable Archiving checkbox to disable file archiving. The archiving options available are described below:
Attribute Default Value Description
File Creation Interval 12 hours The time interval after which a log file is created for
each device from which logs are collected. Zip Creation Interval 24 hours The time interval after which log files created for each
device, are zipped to save disk space. The Log retention time can be configured from the Retain logs for : drop down list. The list options are:
• Forever • 1 Year • 6 Months • 3 Months • 1 Month • 1 Week

CARL : Cyberoam Aggregated Reporting and Logging :: User Guide
75
By default the Archive Location for the firewall logs in CARL is <CARL Home>\server\default\archive, you can change this location by enabling the Change Raw Logs Archive Location and providing the location of your choice. By default the Indexing Location for the firewall logs in CARL is <CARL Home>\server\default\indexes, you can change this location by enabling the Change Raw Logs Indexing Location and providing the location of your choice. Click Zip Now to create a zipped file with the currently available log files. Click Save to save the archiving options, if you have changed them. Click Close to close the Archive Settings box. Note: The currently active log files (i.e., logs not yet archived) will be stored in the <CARL Home>\server\default\archive\localhost\hot directory. The archived log files (i.e., logs archived as according to the arcive settings) will be stored in the <CARL Home>\server\default\archive\localhost\cold directory. The archived log files loaded into database for analysis will be stored in the Warm directory. The log files will be stored in the <CARL Home>\server\default\archive\localhost\warm directory for 1 day and after that the log files will be purged.
CARL : Cyberoam Aggregated Reporting and Logging :: User Guide
76
Viewing Device Details
The Device Details link shows you the various devices from which logs are collected in CARL. The Supported Logs Received table shows all the devices from which logs supported by CARL, are received, along with the timestamp of the last received log file, the syslog port, and the current status of log collection. The icon indicates that this firewall is exporting logs in the WELF format. Click on the icon next to a device to change the device name or the link speed values. Click the icon to delete the device from the database. All logs collected from that device will also be deleted. The Unsupported Log Record Details table shows all the devices from which logs that are not supported by CARL are received. Click the View Record link to view the first few lines from the unsupported log record. Click the Tell Us link to open a popup window, through which you can send a mail to the CARL Technical Support team telling us about the unsupported log format. Type the relevant details, and click Send Mail to send the message. The Technical Support team will get back to you with more details about the unsupported log format, and how we can help you. The Schedules Executed table shows the schedules that have run so far, along with the user that executed the schedule, the report profile the schedule was associated with, and the status of execution of the schedule.

CARL : Cyberoam Aggregated Reporting and Logging :: User Guide
77
Scheduling Reports
Once you have created a custom report profile, you can set up schedules to run the report automatically at specified time intervals. You can also configure CARL to automatically email the report once it runs.
Scheduled reports are generated and emailed only as PDF files. If you are viewing PDF reports on a Windows machine, make sure you have Adobe Acrobat Reader installed.
Click the Schedule Listing link under the Settings tab takes you the All Schedules page to view the list of reports that have been scheduled so far. The list shows all the schedules that have been set up so far, along with the report profile they are associated with, the type of schedule, and options to delete the schedule. Click the icon to delete a schedule. The report profile associated with this schedule will no longer be generated automatically at the specified time interval. The icon against a schedule is a toggle icon used to enable or disable a schedule. When the icon is displayed, the schedule is enabled, and reports will be generated automatically for that schedule. Click the icon to disable the schedule. The icon is displayed indicating that the schedule is currently disabled. Reports will not be generated automatically for this schedule. Creating a New Schedule Click the icon or the New Schedule link to add a new schedule. In the Add New Schedule page that comes up, enter the following details: Attribute Description Task Name
Enter a unique name to identify this schedule
Profile Name
Choose the report profile to which this schedule has to be applied. All the report profiles that have been created are listed.
Mail Id The first time a schedule is associated with a report profile, you need to enter the e-mail address to which the report has to be sent. Enter multiple e-mail addresses separated by a comma(,).
Hourly* If you want to schedule this report to run every hour, enter the date and time after which this report has to run every one hour
Daily* If you want to schedule this report to run every day, enter the date and time after which this report has to run every one day
Weekly* If you want to schedule this report to run every week, enter the date and time after which this report has to run every one week
Monthly* If you want to schedule this report to run every month, enter the date and time after which this report has to run every one month
Once only*
If you want to run this report only once, enter the date and time when the report has to be generated
*Choose from any one of these options

CARL : Cyberoam Aggregated Reporting and Logging :: User Guide
78
For Daily, and Only once schedules, you can set the TimeFilter for Custom Hours, Only Working Hours, or Only NonWorking Hours. For the Daily schedules, if the option Run on Week Days is selected then the reports are run daily except on the weekends. For the Weekly or Monthly schedules, select the option Generate Report only for Week Days if you want to report on the events that occurred only on the week days and not report on events that occurred over the weekends. Once you have chosen all the required values click Save Task to save and activate the new schedule. Click Cancel to return to the All Schedules page.

CARL : Cyberoam Aggregated Reporting and Logging :: User Guide
79
Working Hour Configuration
Here you can configure the Working and Non-Working hour patterns of your enterprise. This will help you to distinguish between the working and non-working hour firewall log trends. By default, 10 - 20 Hours are considered as Working Hours and the remaining hours are considered as Non working Hours. Two options are provided for configuring the working hour patterns.
• General
Here you can mention the Start Time and End Time for your official working hours, and all hours outside the given range is considered as non-working hours.
• Advanced
This option provides more customized working hours classification.For example, you may mention intermittent working hours like 8-12, 15-18, 19, 20, 21 Hours. Which means your non-working hour are 12-15 Hours and 21-8 Hours.
Working hour and Non-Working hour traffic details for external hosts (hosts outside the LAN) will not be available in the CARL reports.

CARL : Cyberoam Aggregated Reporting and Logging :: User Guide
80
Report View Customization
Here you can customize the device specific reports to be shown in Device Tree and the Reports page. For each of the selected device, you are provided with the option of selecting from the default Available Reports the most required list of reports and move it to the Selected Reports. And only these selected reports would be listed in the Device Tree and the Reports page for this device. The report view customization for the selected device can be applied on the selected device alone by clicking Apply for Selected Device. And, if you would like the report view customization for the selected device to applied for all other devices too then click Apply for All Device

CARL : Cyberoam Aggregated Reporting and Logging :: User Guide
81
Configuring DNS Resolution
CARL by deafult displays the IP addresses of the Source and Destination that participate in the conversation going through Firewall. It also has the option to resolve the IP addresses to DNS names (whichever could be resolved) in the individual reports. You can do it by clicking Resove DNS link that is provided in the report page. Moreover, CARL provides an option to configure DNS resolution for all the reports. DNS resolution can be configured by following the steps given below:
1. In the CARL web client, select the Settings tab. 2. In Settings screen, select the System Settings > Configure DNS link.
Resolve DNS Configuration page appears. 3. On the top, there are three options provided with radio buttons. Select an option
as per your requirement, by clicking the radio button. The options are:
• Do Reverse lookup automatically. I want to see DNS name everywhere instead of IPAddress.
• Don't do Reverse lookup automatically. Let me get an option to do that in my reports.
• No lookup at all. I want to see IPAddresses everywhere.
4. Select IPAddress and DNSName mapping in memory as per your requirement from the drop down list. The list options are 5000, 10000, and 20000. This denotes the number of IP address and DNS name mappings to cached in the memory of the machine. You can leave it undisturbed with the default value.
5. Click Update to effect the Resolve DNS Configuration. Click Cancel to cancel the configuration operation.
Description of the options
• Do Reverse lookup automatically. I want to see DNS name everywhere instead of IPAddress.
In this option, CARL will perform reverse NS lookup of all IP addresses automatically. This will be carried out for all the reports and the only DNS names (whichever could be resolved) will be displayed in the reports. Use this option, if you want to see only DNS names of the hosts in all your reports.
• Don't Reverse lookup automatically. Let me get an option to do that in my reports.
In this option, CARL will not perform reverse NS lookup of IP addresses automatically and will display the IP addresses of the Source and Destination that participate in the conversation going through Firewall and if you want DNS names to be displayed for the hosts for a particular report, you can use the ResolveDNS link in the report. In each of the individual reports a ResolveDNS link has been provided at the top. Clicking this link enables DNS Resolution for all the IP Addresses

CARL : Cyberoam Aggregated Reporting and Logging :: User Guide
82
of the unresolved hosts present in the current report. The status of DNS Resolution depends on the default DNS lookup time, within which CARL will try to resolve the IP Address. This is an existing option. Use this option, if you want to see DNS names of the hosts only in particular reports.
If DNS Resolution is in progress for any other CARL user, then the subsequent user will see the message "Please wait, DNS Resolution in progress for another user" when clicking ResolveDNS link. Once the DNS Resolution is complete for the first user, then the DNS Resolution for the subsequent user begins automatically.
• No lookup at all. I want to see IPAddresses everywhere.
In this option, CARL will display only the IP addresses of the Source and Destination that participate in the conversation going through Firewall. If you select this option, Resolve DNS option will not be available for any of the reports. Use this option, if you want to see only IP addresses of the hosts in all your reports.
CARL will resolve all the IP Addresses into DNS names which are resolved by the 'nslookup' command from the machine where the product is installed.

CARL : Cyberoam Aggregated Reporting and Logging :: User Guide
83
Configuring to View Unused Firewall Rules
In a Firewall device, there could be numerous rules/access-list defined to secure the network from external attacks. Out of the rules/access-list configured, there could be certain rules which would be most used and certain which are least used or never used. CARL captures the most used rules in the Top Used Rules as they would be available in the logs generated by Firewall. But, to get the Unused Rules, one needs to configure the CARL to fetch the complete rules from the device. Once, CARL fetches the complete rules configured in the Firewall, it can provide the Unused Rules view. To view Unused Firewall Rules, configure the CARL by following the steps given below:
1. In the CARL web client, select the Settings tab. 2. In Settings screen, select the System Settings > Device Rule link. Device
Rule Info page appears. 3. On the top, there are two links provided to add device info to fetch rules and to
delete the device info. The links are: a. Add Device Info b. Delete Device Info
Add Device Info
4. Click the Add Device Info link to add the device information to fetch the rules using Telnet or SSH. The Enter Device Details screen opens up.
5. In the Enter Device Details screen, select the Firewall device in the Select Device drop down list.
6. In the Fetch Rules section, there will be an option to fetch rules : • From File
Fetch Rules > From File
7. In the From File tab, enter the file name with absolute path of the file which contains the rules details of the Firewall device. Alternatively, click the Browse button to locate the file.
8. Click Import button to import the file. Click Cancel to cancel the rules details file importing operation.
• User should create a file containing rules details. • The file should contain rule name and description in comma separated
format. • Each rule should be in a new line.
Delete Device Info
• To delete the Device Info from the list of Device Details table, select the check boxes of the respective Device Info entries and click the Delete Device Info link.

CARL : Cyberoam Aggregated Reporting and Logging :: User Guide
84
Admin Settings Setting up the Mail Server
You need to configure the mail server on CARL in order to receive email alert notifications and scheduled reports. Click the Mail Server Settings link to edit the mail server settings. Enter the following details:
Field Description Outgoing Server Name
Enter the name of the SMTP server on your network which is used for outgoing emails.
Port Enter the port used by the SMTP server. Usually this is 25.
Authenticate for every Login
If your SMTP server requires you to authenticate yourself before sending an email, check this option. Otherwise leave it unchecked. * The below two fields are active only when this checkbox is checked.
User Name* Enter the user name used to authenticate email sending from this machine.
Password* Enter the corresponding password for the typed user name.
Sender MailId
Enter the Sender or From Address which needs to be mentioned in the outgoing emails.By default, [email protected] will be mentioned as the sender mailid. The Test Server button is for testing the mail server configurations. You can give your email-id in the "Enter Recipient Mail Id" field, which comes-up when you click Test Server. If the mail server configurations have been given correctly you will receive a Test Mail.
After all the details have been filled in, click Save Changes to save the mail server settings.
If the mail server is not configured, you will see an error message when you are setting up an email alert notification or scheduling a report to be emailed automatically. Click the Configure Mail Server now link inside the error message to configure the above settings from the opened popup window.

CARL : Cyberoam Aggregated Reporting and Logging :: User Guide
85
Managing Protocol Groups
A protocol group is a set of related protocols typically used for a common purpose. The Protocol Groups link lets you define protocols as well as protocol groups, so that you can identify traffic that is unique to your enterprise. Most of the common enterprise protocols are already included in CARL under appropriate groups. Some of the important protocol groups include the following:
Protocol Group
Protocols Included Description
Web HTTP, HTTPS,
Gopher Includes protocols used to access IP traffic (the Internet)
Mail POP, SMTP, IMAP Includes protocols used to send or receive e-mail traffic
FTP FTP, TFTP, FTPS Includes protocols used to transfer files through FTP
Telnet telnet Includes protocols used to access telnet services
Click the Protocol Groups link to view the list of protocol groups and the corresponding protocols. The View by Group box lets you view the list, one protocol group at a time. The Unassigned protocol group contains all the protocols that are not assigned to any group.
Some firewalls interpret protocols at Layer 4 (Application Layer), which means that a combination of port and protocol is identified as an application, and written into the log file. For example, tcp protocol on port 80 is identified as http traffic. Hence http is shown in the Protocols column. Other firewalls interpret protocols at Layer 3 only, which means only the port and protocol values are written into the log file. Hence, in the same example, tcp/80 is shown in the Protocols column.
Operations on Protocols
Click the icon next to a protocol to delete it from the protocol group. Once a protocol is deleted, all the database records related to that protocol will be deleted. Click the icon to move a protocol from the current protocol group to another. Click the Add Protocol link or the icon next to it to add a new protocol, and assign it to a protocol group. Remember to enter the protocol value exactly as it appears in the log file. If you want to add it to a new protocol group, click the icon next to the Protocol Group text box to add a New Protocol Group, and enter the name of the new protocol group and click Add. From the list of Available Protocol Identifiers, move the required protocols to the Selected Protocol Identifiers to be included in this protocol group. Please note that a protocol can belong to only one protocol group at a time. Click the Add Protocol Identifier link or the icon to add a new protocol identifier. And, to specify the range for the protocol identifier click the Add Protocol Identifier

CARL : Cyberoam Aggregated Reporting and Logging :: User Guide
86
Range link or the icon and specify the From Port & To Port of the protocol identifier, and select between tcp or udp for the Layer 3 Protocol.
When you see the icon next to the Unassigned protocol group on the Dashboard, you need to add the protocols and assign them to protocol groups in this way.
Operations on Protocol Groups
Click the Add Protocol Group link or icon next to it to add a new protocol group. In the popup window that opens, enter a unique group name, and a short description. From the list of protocols currently not assigned to any protocol group, choose the protocols to be included in this protocol group. Please note that a protocol can belong to only one protocol group at a time. Select the protocol group from the list and click the Edit Protocol Group or the icon to edit the properties of that protocol group. In the popup window that opens, you can edit the protocol group's description, add currently ungrouped protocols, or remove existing protocols from this protocol group. To delete a protocol group, select the protocol group from the list and click the Delete Protocol Group link or the icon next to it. The protocol group is deleted, and all associated protocols are put in the Others protocol group.
How to group the unassigned Protocols
Generally used protocols like Mail, Web, FTP, Telnet, etc., have been configured as Groups. However, the unknown protocols can be grouped as per your requirement.
1. Click on the 'Unassigned' in protocol group under Traffic Statistics, which shows all the unknown protocols.
2. Click on Assign and Select 'All' under Hits and select the 'Multiple Selection', which lists all the unassigned protocols.
3. Select the protocols and group it under protocol group and assign the appropriate protocol.
4. If you do not find a protocol group, click on the sign to add a new protocol group.
Once you configure the protocols to protocol groups, you will not receive any unassigned protocol after the time of assigning. Once you assign the protocols, the reports will show the assigned protocols only from the assigning time. Hence, in the reports generate earlier to the protocol assignment, you will see only the unassigned protocols and in the upcoming reports, you can find the newly assigned protocols under their appropriate protocol group. If you are not sure of the protocols, which needs to be assigned, kindly check the application that uses the port/protocol. You can also check the raw log in the <CARL Home>\server\default\archive\<firewall IP address> folder.

CARL : Cyberoam Aggregated Reporting and Logging :: User Guide
87
Adding Different Users
Click the User Management link to create and manage the different users who are allowed to access the CARL server. The different types of users and their respective privileges are described in the table below:
User Description
Administrator This user can do all operations including configuring syslog servers, setting up file archiving, adding additional users, and more
Operator This user can do all operations except configuring the Intranet settings, and user management
Guest This user can only generate reports, view device details, and basically has only read-only privileges. The Alerts, Ask Me & Support tabs are not available for guest users.
By default, an Administrator user with username as admin and password as admin, and a Guest user with username guest and password guest are already created. Adding a New User Click the Add New User link to add another user to access CARL. Enter the new user's username, password, access level, and default e-mail address. Assign Devices To View section allows the Administrator to assign devices to users with Guest or Operator privileges, and only the assigned devices can be viewed by the particular user when they login to CARL.
By default, users with "Administrator" privileges can view all the devices.
Click Add User to add this user to the list of users accessing CARL.
Editing User Details
If you have logged in as a user with administrative privileges, the User Management page lists all the users created so far. Click the user's username to view the respective user details. You can change the password, access level, the default e-mail address for this user and can also reassign the devices that can be viewed by the particular user. If you have logged in as an Operator or Guest user, click on the Account Settings link to change your password and default e-mail address. Once you are done, click Save User Details to save the new changes.
Viewing Login Details
If you have logged in as an Administrator user, click the View link against a user to view the corresponding login details. The Login Details page shows the remote host IP address from which the user logged on, the timestamp of the login, and the duration of the session.

CARL : Cyberoam Aggregated Reporting and Logging :: User Guide
88
CARL User Privileges
Types of User Privileges in CARL
• Administrator - Can perform Add/Edit/Delete operations of all product configurations and Firewalls.
• Operator - Can perform Add/Edit/Delete operations of the Firewalls assigned to him and product configurations except Intranet Settings and User Management.
• Guest - Has read-only privileges for the Firewalls assigned to him and cannot perform any product configuration.
Comparison of Feature Access to the Users
Sl No
Feature Name Administrator Operator Guest
1 User Management Create/Modify/Delete users
Yes No No
2 Predefined Reports and ReportProfiles
The user can view all predefined reports of all the firewalls. The user can perform Add/Edit/Delete operation of Report profiles created by all users.
The user can view all predefined reports of Firewalls assigned to him. The user can perform Add/Edit/Delete operation of Report profiles created by himself.
The user can view all predefined reports of Firewalls assigned to him.
3 Alert Profiles and Alert Administration
The user can perform Add/Edit/Delete operation of Alert profiles created by all users. Administration of Alerts created by All Alert Profiles
The user can perform Add/Edit/Delete operation of Alert profiles created by himself. Administration of Alerts created by his own Alert Profiles
No
4 Edit/Delete Device All Firewalls Only for Firewalls assigned to him.
No
5 Dashboard View Customization
For all Firewalls Only for Firewalls assigned to him.
Only for Firewalls assigned to him
6 Advanced Search Yes Yes
The user can perform advanced search except Save as Report Profile.

CARL : Cyberoam Aggregated Reporting and Logging :: User Guide
89
Sl No
Feature Name Administrator Operator Guest
7 Intranet Settings Configuring Firewall based LAN settings
Yes No No
8 Bookmark The user can view only his bookmarks.
The user can view only his bookmarks.
The user can view only his bookmarks.
9
Configuration Settings listed in the Settings tab.
• Adding Syslog Server
• Alert Porfiles view
• Import Log files view
• Schedule Listing page
• Working Hour configuration
• Customize Report Tree
• Mail Server Settings
• Database Console
Yes Yes No
10
Configuration views present in the Settings Tab.
• Device Details • Archived Files • Protocol Groups • Server
Diagnostics • Account
Settings
Yes Yes
The user can view all the Configuration settings except Archive Settings.
11
User Assistance
• Upgrade License • Help • About
Yes Yes No
CARL : Cyberoam Aggregated Reporting and Logging :: User Guide
90
Accessing the Database
CARL lets advanced users access the in-built database and run standard queries. Click the Database Console link to open the Database Console page. In the prompt window displayed, enter the query to be executed. Remember the following when executing a query:
• Table names and table columns are case-sensitive. • For SELECT queries, set the row limit between 1 and 500. Default row limit is 10.
Keep in mind that you are accessing the database directly at your own risk. Any update or delete operations will result in loss of data.
CARL : Cyberoam Aggregated Reporting and Logging :: User Guide
91
Setting up Intranets
CARL includes the option to specify networks, or a range of IP addresses to identify machines behind a firewall. This setup is identified as the Intranet. By adding the machines or IP addresses that are located within your network (LAN), you can identify and distinguish between traffic that is generated within your network, and traffic that is coming from, or destined outside your network. Click the Intranet Settings link to define intranets. The Intranet Settings page will list all the devices that have been configured to send their logs to CARL for analysis. The Change action, found against each listed firewall, would enabe you to configure the (intranet) private IP Network / IP Address / IP Range for each firewall. For instance, if your are a MSSP (Managed Security Service Provider) who is monitoring firewalls of different client networks at different locations and all your clients could possibly end up with the same (intranet) private IP Network / IP Address / IP Range, then Configure all devices would serve the purpose of applying the common configuration across All Devices.
• To designate an entire IP network as an Intranet, select IP Network from the list, and enter the network IP address and the corresponding Net Mask value.
• To include a single host in the Intranet, select IP Address from the list, and enter the IP address of the host.
• To designate a range of IP address as the Intranet, select IP Range from the list, and enter the starting IP address and the ending IP address.
For Example : If you have three private IP Network (say) 10.8.0.0, 10.9.0.0, and 10.10.0.0, each with Net Mask: 255.255.0.0, then instead of adding them separately, we would recommend you to give the entire private IP network : 10.0.0.0 with Net Mask 255.0.0.0, as this would improve the performance of CARL. The same is recommended for IP Range too, where you can mention Start IP: 10.0.0.0, End IP: 10.255.255.255 .And this is applicable to Class B & Class C networks too!
You can specify multiple intranets by clicking the Add button. Once you are done, click Save Settings to activate the new settings.

CARL : Cyberoam Aggregated Reporting and Logging :: User Guide
92
Viewing Server Diagnostics
Click the Server Diagnostics link to see server-specific device information. This information will be useful while troubleshooting the server or reporting a problem. The various information boxes on this page are described in the table below:
Box Description
License Information This box shows details about the license that is currently applied.
System Information This box shows device information for the CARL server
Installation Information This box shows details about the CARL installation on the server machine
JVM Memory Information
This box shows statistics on the amount of memory used by the JVM
CARL : Cyberoam Aggregated Reporting and Logging :: User Guide
93
Changing Account Settings
Click the Account Settings link under the Settings tab to change the default password and e-mail address set for this account. You cannot change the account's user name or access level. Once you have made the required changes, click Save User Details to save the changes. Click Cancel to return to the default Settings tab.
This option is visible only for users with Guest or Operator access level

CARL : Cyberoam Aggregated Reporting and Logging :: User Guide
94
Configuring Firewall Availability Alerts
In CARL, alert can be triggered, if the Firewall stopped sending the logs. The alert triggering is configurable. Firewall non-availability alert configuration notifies the user through e-mail, when the CARL is not receiving logs from firewall(s). Follow the procedure given below to configure the triggering of alert:
• Select the Settings tab in the Web Client. On the right side of the screen, you will see Admin Settings section below the System Settings section. In the Admin Settings section, there will be Firewall Availability Alert link.
• Click the Firewall Availability Alert link. The Firewall Availability Alert page opens. In the screen, there will be a link Add Alert on the left side top to add an alert. Below the link, the configured alerts are listed in a table. The details of the table columns are:
Columns Description
Device Names The device names of the firewalls, for which this alert will be triggered, if the firewalls fail to send logs.
Alert Mail Address
Failure of the above mentioned firewalls to send logs will trigger an alert to send e-mail to the configured users e-mail IDs.
Time Interval (minutes)
The time duration within which a log should be received by the CARL. Failure to receive a log within this time duration will trigger this alert.
Action This indicates whether the configured alert is enabled or disabled.
• To configure an alert, click the Add Alert link. The Create Availability Alert page opens.
o Select the firewall devices for which this alert needs to be triggered using the Change Selection link. A pop-up window Select Devices from the list opens to select the devices. In this the first option will be All Devices, and below the All Devices option the devices are listed. Select the All Devices option or devices as per requirement. The selected devices are displayed under the Selected Devices.
o In the "Send an alert mail to ______ if the logs are not received from the above selected firewall(s) for at least (15 minutes/30 minutes/60 minutes/2 hours/6 hours/12 hours/1 day)" part, configure the following:
Enter the e-mail address to which the alert has to be sent. Enter multiple e-mail addresses separated by a comma(,).
Select the time interval from the combo box. The time interval options available are: 15 minutes, 30 minutes, 60 minutes, 2 hours, 6 hours, 12 hours, and 1 day
o If the Mail Server is not configured the following note appears and there is a link provided to configure the Mail Server. Configure the Mail Server in order to get the mail alerts.
Note: Mail Server is not configured. Click here to configure the Mail Server.
• After choosing all the required values, click Add Alert to save and activate the new alert. Click Cancel to cancel the alert configuration.

CARL : Cyberoam Aggregated Reporting and Logging :: User Guide
95
Configuring Cyberoam
CARL listens at the default ports for exported log files. The following is a list of firewalls and versions for which configuration instructions are included. Click the firewall name to see the corresponding configuration instructions.
Firewall Name Version Numbers Cyberoam Cyberoam Version 9.5.4 Build 66 onwards
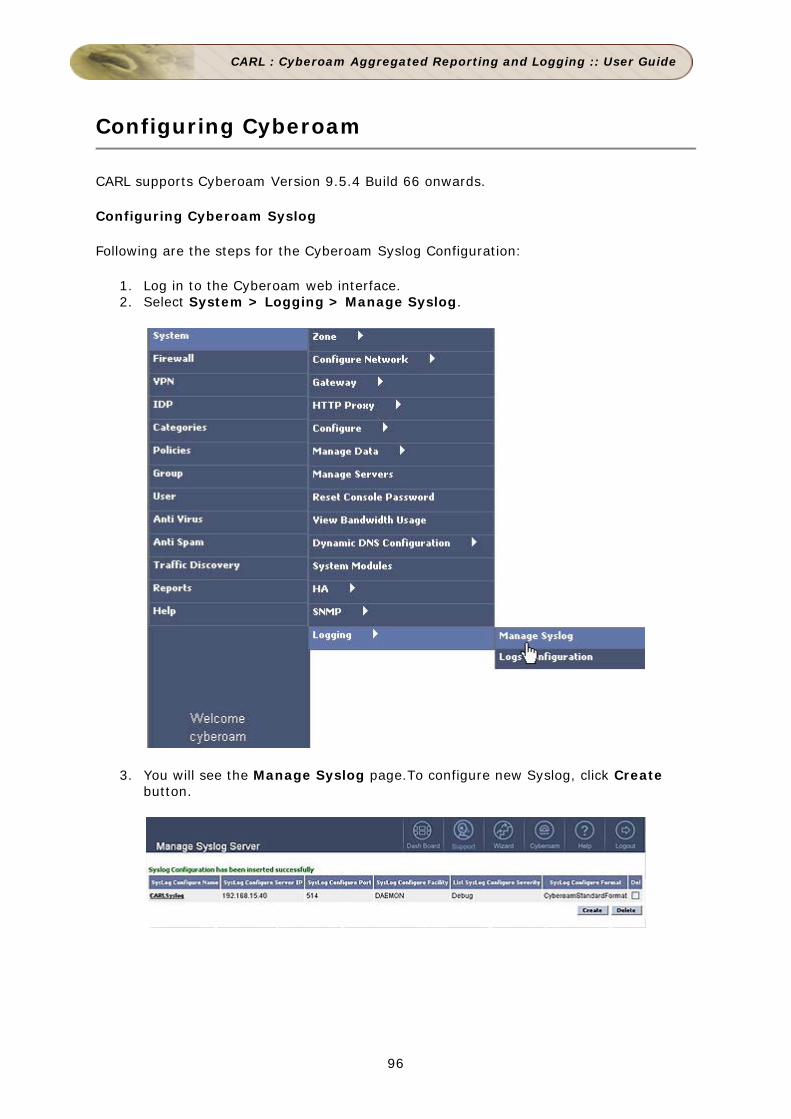
CARL : Cyberoam Aggregated Reporting and Logging :: User Guide
96
Configuring Cyberoam
CARL supports Cyberoam Version 9.5.4 Build 66 onwards.
Configuring Cyberoam Syslog
Following are the steps for the Cyberoam Syslog Configuration:
1. Log in to the Cyberoam web interface. 2. Select System > Logging > Manage Syslog.
3. You will see the Manage Syslog page.To configure new Syslog, click Create button.
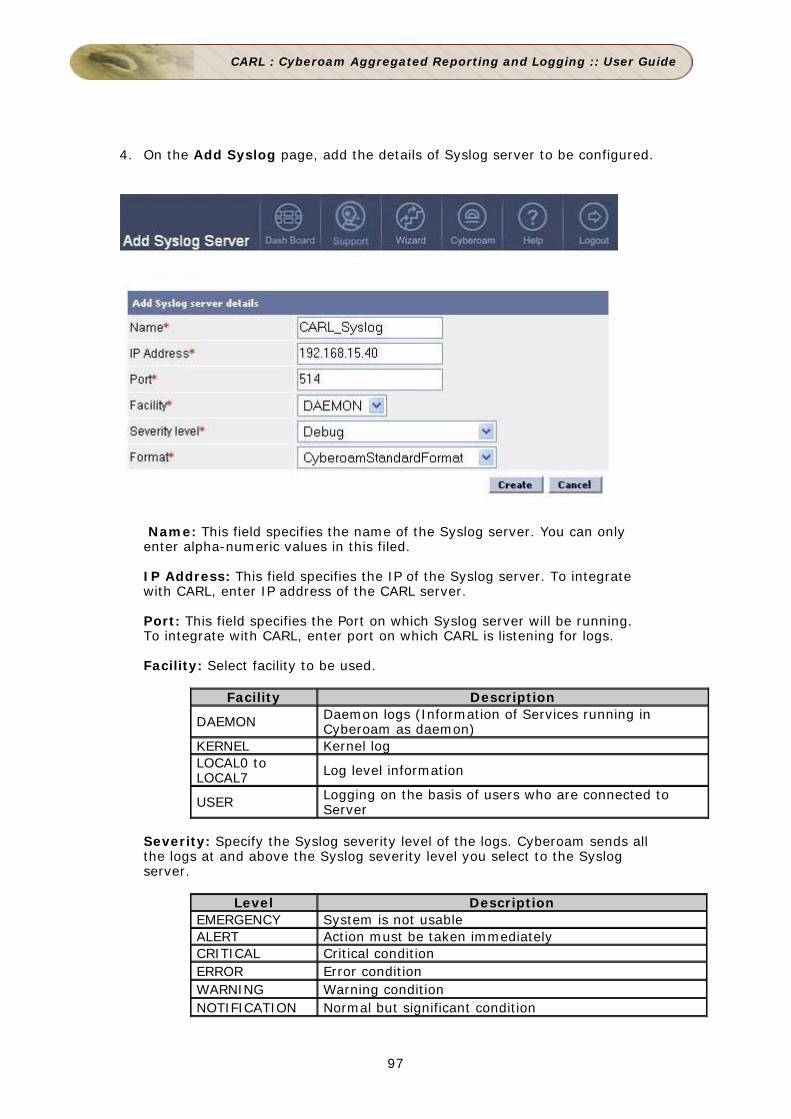
CARL : Cyberoam Aggregated Reporting and Logging :: User Guide
97
4. On the Add Syslog page, add the details of Syslog server to be configured.
Name: This field specifies the name of the Syslog server. You can only enter alpha-numeric values in this filed. IP Address: This field specifies the IP of the Syslog server. To integrate with CARL, enter IP address of the CARL server. Port: This field specifies the Port on which Syslog server will be running. To integrate with CARL, enter port on which CARL is listening for logs. Facility: Select facility to be used.
Facility Description
DAEMON Daemon logs (Information of Services running in Cyberoam as daemon)
KERNEL Kernel log LOCAL0 to LOCAL7 Log level information
USER Logging on the basis of users who are connected to Server
Severity: Specify the Syslog severity level of the logs. Cyberoam sends all the logs at and above the Syslog severity level you select to the Syslog server.
Level Description EMERGENCY System is not usable ALERT Action must be taken immediately CRITICAL Critical condition ERROR Error condition WARNING Warning condition NOTIFICATION Normal but significant condition
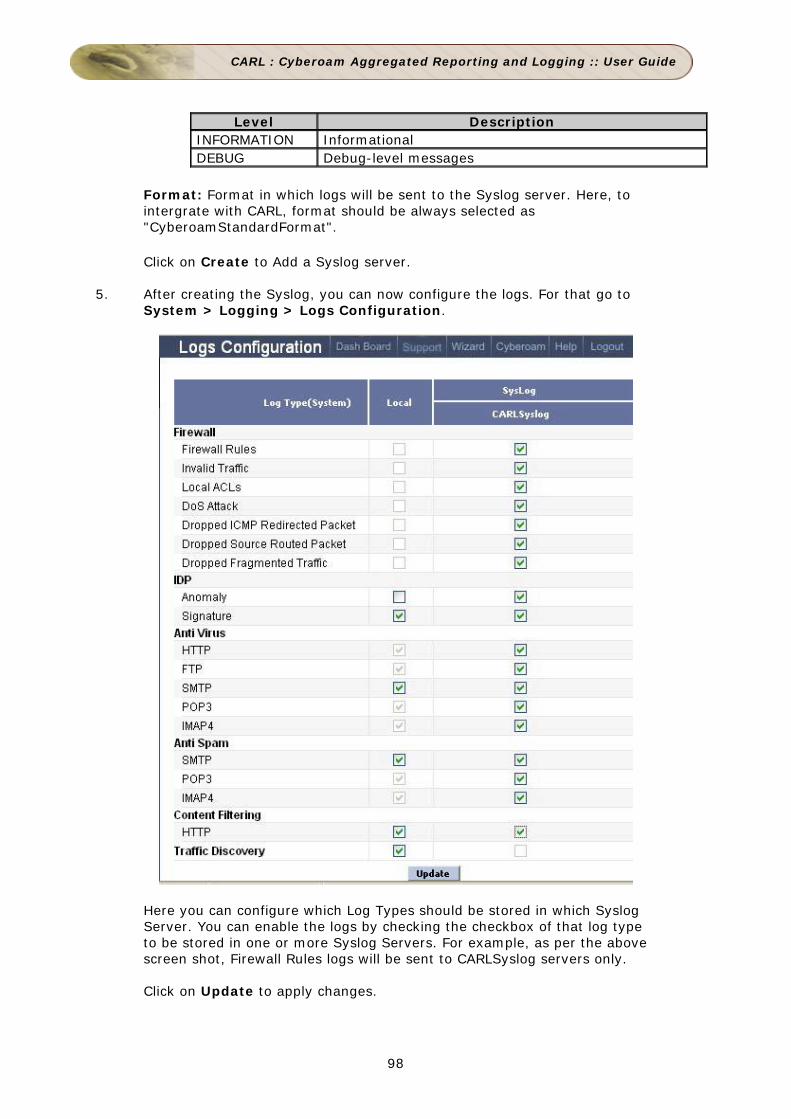
CARL : Cyberoam Aggregated Reporting and Logging :: User Guide
98
Level Description INFORMATION Informational DEBUG Debug-level messages
Format: Format in which logs will be sent to the Syslog server. Here, to intergrate with CARL, format should be always selected as "CyberoamStandardFormat".
Click on Create to Add a Syslog server.
5. After creating the Syslog, you can now configure the logs. For that go to System > Logging > Logs Configuration.
Here you can configure which Log Types should be stored in which Syslog Server. You can enable the logs by checking the checkbox of that log type to be stored in one or more Syslog Servers. For example, as per the above screen shot, Firewall Rules logs will be sent to CARLSyslog servers only. Click on Update to apply changes.
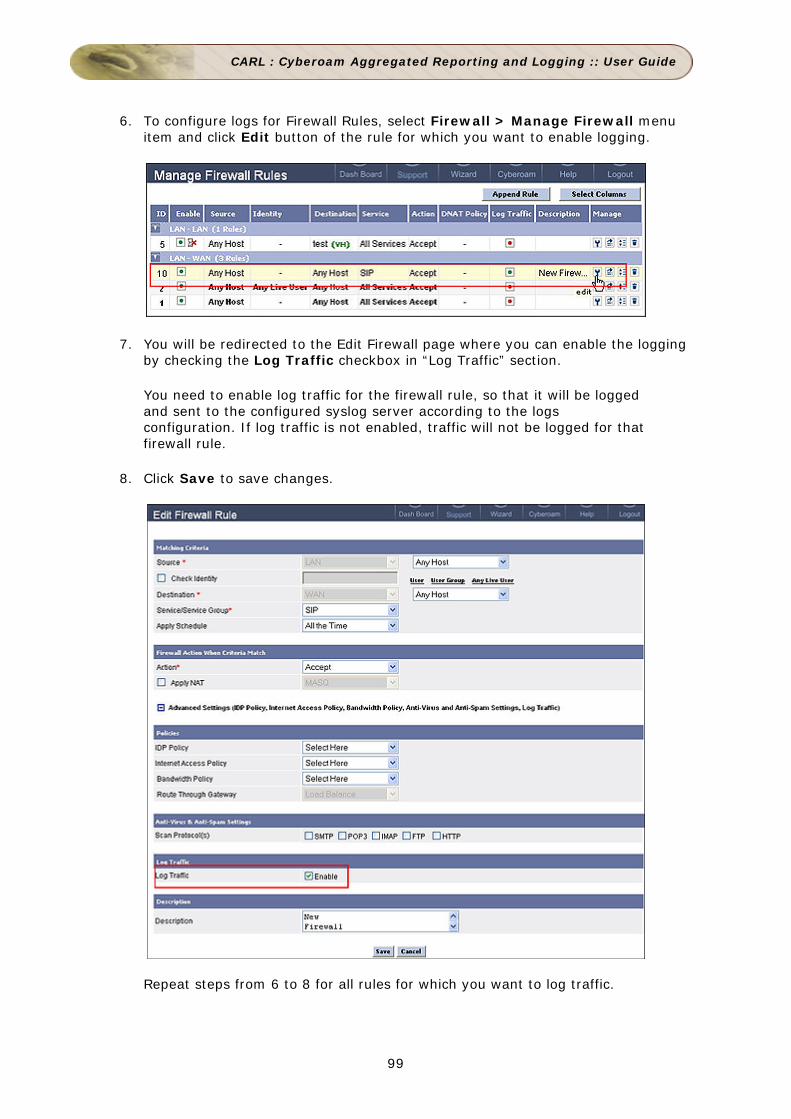
CARL : Cyberoam Aggregated Reporting and Logging :: User Guide
99
6. To configure logs for Firewall Rules, select Firewall > Manage Firewall menu item and click Edit button of the rule for which you want to enable logging.
7. You will be redirected to the Edit Firewall page where you can enable the logging by checking the Log Traffic checkbox in “Log Traffic” section.
You need to enable log traffic for the firewall rule, so that it will be logged and sent to the configured syslog server according to the logs configuration. If log traffic is not enabled, traffic will not be logged for that firewall rule.
8. Click Save to save changes.
Repeat steps from 6 to 8 for all rules for which you want to log traffic.

CARL : Cyberoam Aggregated Reporting and Logging :: User Guide
100
Tips and Tricks Frequently Asked Questions
General Product Information [ Show/Hide All ]
1. Is a trial version of CARL available for evaluation?
Yes, a 30-day free trial version can be downloaded from the website at http://www.cyberoam.com/logging-reporting.html
2. Does the trial version have any restrictions?
The trial version is a fully functional version of CARL. When the trial period expires, you cannot restart the server.
3. Do I have to reinstall CARL when moving to the fully paid version?
No, you do not have to reinstall or shut down the server. You just need to enter the new license file in the Upgrade License box. Please refer the page: Installation > Licensing Information.
4. I don't have a firewall. Can I still use this product?
You can still use CARL to simulate firewall logs and see how reports will look like when real-time data is used. Click the Simulate link in the Settings tab to begin sending sample log files to CARL.
5. How many users can access the application simultaneously?
This depends only on the capacity of the server on which CARL is installed. The CARL license does not limit the number of users accessing the application at any time.
6. CARL runs in a web browser. Does that mean I can access it from anywhere?
Yes. As long as the web browser can access the server on which CARL is running, you can work with CARL from any location.
7. How secure is the data that is sent to the web browser over the Internet?
Data sent from CARL is normally not encrypted and hence is readable if intercepted.
8. How do I buy CARL?
Please see the website at http://www.cyberoam.com/logging-reporting.html for information on purchasing options.

CARL : Cyberoam Aggregated Reporting and Logging :: User Guide
101
9. Is there a limit on the number of users or web sites that I can monitor?
There is no license restriction on the number of users or web sites that you can monitor. However, you may face performance issues when using lower end machines to run CARL.
Installation [ Show/Hide All ]
1. What are the recommended system requirements for CARL?
It is recommended that you install CARL on a machine with the following configuration: * Processor - Pentium 4 - 1.5GHz * Disk Space - 100MB * RAM - 512MB * Operating System - Windows 2000/XP * Web Browser - Internet Explorer 6.0, or Mozilla Firefox 1.0 Look up System Requirements to see the minimum configuration required to install and run CARL.
2. Does the installation of CARL make any changes to the firewall server configuration?
The installation of CARL does not make any changes to the firewall server configuration.
3. Can I install CARL as a root user?
CARL can be started as a root user, but all file permissions will be changed, and later you cannot start the server as another user.
4. When I try to access the web client, another web server comes up. How is this possible? The web server port you have selected during installation is possibly being used by another application. Configure that application to use another port, or change the CARL web server port.
5. Is a database backup necessary, or does CARL take care of this?
The archiving feature in CARL automatically stores all logs received in zipped flat files. You can configure archiving settings to suit the needs of your enterprise. Apart from that, if you need to backup the database, which contains processed data from firewall logs, you can run the database backup utility, BackupDB.bat/.sh present in the < CARL Home>/troubleshooting directory.

CARL : Cyberoam Aggregated Reporting and Logging :: User Guide
102
Configuration [ Show/Hide All ]
1. How do I see session information of all users registered to log in to CARL?
The session information for each user can be accessed from the User Management page. Click the View link under Login Details against each user to view the active session information and session history for that user. Look up User Management for more information on users in CARL.
2. My firewall cannot export logs. How do I configure CARL to report on my firewall?
You can set up CARL to import the logs from the firewall at periodic intervals.
3. Does CARL store raw logs?
Raw logs are archived periodically, and stored as zipped flat files. You can load these archived log files into CARL at any time and generate reports based on them.
Reporting
General
1. Why am I seeing empty graphs? Graphs are empty if no data is available. If you have started the server for the first time, wait for at least one minute for graphs to be populated.
2. What are the types of report formats that I can generate? Reports can be generated in HTML, CSV, and PDF formats. All reports are generally viewed as HTML in the web browser, and then exported to CSV or PDF format. However, reports that are scheduled to run automatically, or be emailed automatically, are generated only as PDF files.
3. Are IP addresses automatically resolved? IP addresses are automatically resolved by connecting to the network DNS server.
4. Why are some traffic values shown as 0.0MB or 0.00%? Since CARL processes log files as and when they are received, traffic values of 0.0MB or 0.0% may be displayed initially when the amount of traffic is less than 10KB. In such a case, wait until more data is received to populate the report tables.
5. What are the different formats in which reports can be exported? Reports can be exported as PDF or CSV files. However, reports are emailed only as PDF files.

CARL : Cyberoam Aggregated Reporting and Logging :: User Guide
103
6. Why do the intranet reports show zero results? Verify if intranet's have been configured correctly. If you have specified IP addresses that are not actually behind the firewall, you will get zero values in the reports.
7. Why don't trend reports take time values or top-n values into account? Trend reports show historical data for the corresponding traffic statistics shown in the report. Hence time changes from the Global Calendar, or top-n value changes from the Show bar on the report, do not affect these reports.
8. Why the Un-used Rules Report is empty? To view the "Un Used Rules Reports", you need to configure CARL to fetch rules from device via Telnet or SSH. After this configuration the reports will be available. However, this advanced feature is available only for Premium License Users of CARL.

CARL : Cyberoam Aggregated Reporting and Logging :: User Guide
104
Troubleshooting Tips
General [ Show/Hide All ]
1. Where do I find the log files to send to CARL Support? The log files are located in the <CARL Home>/server/default/log directory. Typically when you run into a problem, you will be asked to send the serverout.txt file from this directory to CARL Support.
2. Internet Explorer says "Error opening this document. File cannot be found" when I try to open an exported PDF report. Internet Explorer throws this error when you try to open an exported PDF report in the web browser itself. This is a known issue, and we are working on resolving it. For now, save the report to your local machine, and open it using the regular PDF software that you use (Adobe Acrobat Reader or xpdf)
3. I find that CARL keeps crashing or all of a sudden stops collecting logs. What could be the reason? The inbuilt MySQL database of CARL could get corrupted if other processes are accessing these directories. Kindly exclude the CARL installation directory 'Cyberoam' (it could be in C:\Cyberoam or D:\Cyberoam) from both the Backup process and Anti-Virus Scans.
4. How to increase the time limit of web client time out?
To increase the time limit of web client time out, follow the steps given below:
• Shutdown/stop the CARL application • Rename/remove the <CARL Home>\server\default\log directory
into log_old directory. • Change the "session-timeout" value (default value is 30 minutes)
as per your requirement (say 60 minutes), in the two files given below and save the files, <CARL Home>\server\default\conf\web.xml <CARL Home>\server\default\deploy\jbossweb-tomcat50.sar\conf\web.xml
• Restart the CARL Server.
The above changes will affect all the web clients connected to the FWA server. Alternatively, you can install the "Auto IE Refresher" in your machine for IE browser and monitor the pages from your machine. Reference pages: http://www.softpedia.com/get/Internet/Other-Internet-Related/Auto-IE-Refresher.shtml http://www.download.com/AutoRefresher-for-IE/3000-12512_4-10293579.html

CARL : Cyberoam Aggregated Reporting and Logging :: User Guide
105
Installation [ Show/Hide All ]
1. CARL displays "Enter a proper Cyberoam license file" during installation. This message could be shown in two cases: Case 1: Your system date is set to a future or past date. In this case, uninstall CARL, reset the system date to the current date and time, and re-install CARL. Case 2: You may have provided an incorrect or corrupted license file. Verify that you have applied the license file obtained from Cyberoam. If neither is the reason, or you are still getting this error, contact [email protected]
2. When I try to access the web client, another web server comes up. How is this possible? The web server port you have selected during installation is possibly being used by another application. Configure that application to use another port, or change the CARL web server port.
Startup and Shut Down [ Show/Hide All ]
1. MySQL-related errors on Windows machines. Probable cause: An instance of MySQL is already running on this machine
Solution: Shut down all instances of MySQL and then start the CARL server.
Probable cause: Port 33336 is not free
Solution: Kill the other application running on port 33336. If you cannot free this port, then change the MySQL port used in CARL
2. CARL displays "Port 8500 needed by CARL is being used by another application. Please free the port and restart CARL " when trying to start the server. Probable cause: The default web server port used by CARL is not free.
Solution: Kill the other application running on port 8500. If you cannot free this port, then change the web server port used in CARL.
Reporting [ Show/Hide All ]
1. Why am I seeing empty graphs?
Probable cause:Graphs are empty either because there is no traffic is passing through the firewall or if firewall traffic is not sufficient enough to populate the reports table of CARL. Solution: If you are starting CARL for the first time or if you are shutting down and restarting CARL, it will wait for the reports table to be populated with 5000

CARL : Cyberoam Aggregated Reporting and Logging :: User Guide
106
log records for the first time. From the next time onwards, CARL will populate reports table once in 7 minutes or once it receives the next 5000 records, whichever is earlier. You can check for the number of records received in " Packet Count " icon shown in top right corner in client UI. This will list out the details like the number of logs received and also the last received log time. It is better to run the server continuously and check whether 5000 records are collected. Do not stop and restart the server in-between!
Moreover, for viewing the already collected log records in the reports, kindly do the following:
1. Login into CARL client UI. You will be seeing the Dashboard page. 2. Replace the URL shown in your browser with the following URL.
http://localhost:8500/fw/genreport.do
3. Wait for sometime. Once the reports are generated an empty page will be shown.
4. Now remove genreport.do from the URL and just type http://localhost:8500/fw alone.
5. Now you will be able to see the report data.
2. Why are some traffic values shown as 0.0MB or 0.0%?
Since CARL processes log files as and when they are received, traffic values of 0.0MB or 0.0% may be displayed initially when the amount of traffic is less than 10KB. In such a case, wait until more data is received to populate the report tables.
3. Why do the Intranet Reports show zero results? Verify if intranets have been configured correctly. If you have specified IP addresses that are not actually behind the firewall, you will get zero values in the reports.
4. Why doesn't Trend Reports take time values or top-n values into account? Trend reports show historical data for the corresponding traffic statistics shown in the report. Hence time changes from the Global Calendar, or top-n value changes from the Show bar on the report, do not affect these reports.
CARL : Cyberoam Aggregated Reporting and Logging :: User Guide
107
Using Ask ME
The Ask ME tab offers a quick way to see just the reports that you need, without having to create a new report profile, or drilling down through the pre-defined reports. Ask ME enables managers and other non-technical staff to answer simple but critical questions about bandwidth usage and network security. The Ask ME tab shows a series of questions. In Step 1, select the area of interest - bandwidth usage, firewall rules, etc. If you are not sure, leave it to the default All Questions option. In Step 2, select the appropriate question for which you need an answer. Then click the Get the Answer button. The report corresponding to the question selected is now generated and displayed. If you want more questions to come up in the Ask ME tab, click the Tell us here link. In the popup window that opens, enter the question and describe it shortly. Once you are done, click Send. The CARL Technical Support team will analyze your question, and if found valid, will include it in upcoming releases of CARL.

CARL : Cyberoam Aggregated Reporting and Logging :: User Guide
108
Contacting Technical Support
The CARL Support tab gives you a wide range of options to contact the Technical Support team in case you run into any problems.
Link Description
Request Technical Support
Click this link to submit a form from the CARL web site, with a detailed description of the problem that you encountered
Troubleshooting Tips Click this link to see the common problems typically encountered by users, and ways to solve them
Toll-free Number Call the toll-free number +1-800-301-00013 to talk to the CARL Technical Support team directly
Create Support Information File [SIF]
Click this link to create a ZIP file containing all the server logs that the Technical Support team will need, to analyze your problem. You can then send this ZIP file to [email protected]