carnation creek and queen charlotte islands fish/forestry
TRANSCRIPT

Carnation Creek and Queen Charlotte Islands
Fish/Forestry Workshop: Applying 20 Years
of Coast Research to Management Solutions
Ministry of ForestsResearch Program
Dan L. Hogan, Peter J. Tschaplinski,
and Stephen Chatwin
(editors)

Canadian Cataloguing in Publication DataCarnation Creek and Queen Charlotte Island
Fish/Forestry Workshop (1994 : Queen CharlotteCity, B.C.)
Carnation Creek and Queen Charlotte IslandFish/Forestry Workshop : applying 20 years of coastresearch to management solutions
(Land management handbook ; 41)
ISBN 0-7726-3510-2
1. Fish habitat improvement – British Columbia –Carnation Creek Region – Congresses. 2. Habitat(Ecology) – British Columbia – Carnation CreekRegion – Management – Congresses. 3. Forestmanagement – Environmental aspects – BritishColumbia – Carnation Creek Region – Congresses.I. Hogan, Daniel Lewis, 1954– . II. Tschaplinski,Peter John, 1953– . III. Chatwin, Stephen C.IV. British Columbia. Ministry of Forests. ResearchBranch. V. Series.
SH173.C36 1998 639.9’77’097112 C98-960079-3
CitationHogan, D.L., P.J. Tschaplinski, and S. Chatwin (Editors). 1998. B.C. Min. For., Res. Br., Victoria, B.C.Land Manage. Handb. No. 41.
Prepared byD.L. Hogan,P.J. Tschaplinski andS. Chatwin (editors)forB.C. Ministry of ForestsResearch Branch31 Bastion SquareVictoria, BC
© 1998 Province of British Columbia
Copies of this and other Ministry of Foreststitles are available from:Crown Publications Inc.521 Fort StreetVictoria, BC
Ministry of ForestsPublication Internet Catalogue: www.for.gov.bc.ca/hfd

LIST OF CONTRIBUTORS
Name Address
J.M.E. Balke Lacon Road, Denman Island, BC
William J. Beese MacMillan Bloedel Limited, Front Street,Nanaimo, BC
Stephen A. Bird Pacific Watershed Research Association,– West th Avenue, Vancouver, BC
M.J. Bovis Department of Geography, University of BritishColumbia, Vancouver, BC
Tom G. Brown Department of Fisheries and Oceans, Pacific BiologicalStation, Nanaimo, BC
Michael Brownlee Integrated Resources Branch, B.C. Ministry of Forests,Victoria, BC
Anthony L. Cheong B.C. Ministry of Environment, Lands and Parks,Fisheries Branch, nd Floor, Blanshard Street,Victoria, BC
Michael Church Department of Geography, University of BritishColumbia, Vancouver, BC
S.J. Crockford Pacific Identifications, Nelthorpe Street,Victoria, BC
James E. Doyle Mt. Baker Snoqualmie N.F., U.S. Forest Service, th Avenue West, Mountlake Terrace, WA
R.J. Fannin University of British Columbia, Faculty of Forestry,Vancouver, BC
Darren Ham University of British Columbia, Vancouver, BC
Gordon F. Hartman Fisheries Research and Education Services, Rose Ann Drive, Nanaimo, BC
Judith K. Haschenburger Department of Geography, University of BritishColumbia, Vancouver, BC
Eugene D. Hetherington E.D. Hetherington and Associates Ltd., DunnettCrescent, Victoria, BC (formerly ResearchHydrologist with the Canadian Forest Service,Pacific Forestry Centre, Victoria, BC)
Dan Hogan B.C. Ministry of Forests, Research Branch, PO Box
Stn Prov Govt, Victoria, BC
L.B. Holtby Department of Fisheries and Oceans, Pacific BiologicalStation, Nanaimo, BC Canada
Josh Korman West th Avenue, Vancouver, BC
Ray Krag Group Supervisor, Harvest Engineering,Forest Engineering Research, Institute of Canada, East Mall, Vancouver, BC
iii

iv
Werner Kurz ESSA Technologies Ltd., ‒ West th Avenue,Vancouver, BC
C. Peter Lewis B.C. Ministry of Environment, Lands and Parks,Victoria, BC
J. Stevenson Macdonald Fisheries and Oceans Canada, Department ofResources and Environmental Sciences, Simon FraserUniversity, Burnaby, BC
D. Marmorek ESSA Technologies Ltd., ‒ West th Avenue,Vancouver, BC
T.H. Millard B.C. Ministry of Forests, Labieux Road,Nanaimo, BC
Greta Movassaghi Mt. Baker Snoqualmie N.F., U.S. Forest Service, th Avenue West, Mountlake Terrace, WA
Roger Nichols Mt. Baker Snoqualmie N.F., U.S. Forest Service, th Avenue West, Mountlake Terrace, WA
M.E. Oden Madrone Consultants Ltd., Herd Road, RR#,Duncan, BC
Ian Parnell ESSA Technologies Ltd., ‒ West th Avenue,Vancouver, BC
Stephen Rice University of British Columbia, Department ofGeography, Vancouver, BC
T.P. Rollerson B.C. Ministry of Forests, Labieux Road,Nanaimo, BC
Jim W. Schwab B.C. Forest Service, Forest Sciences Section,PO Box , Smithers, BC
J. Charles Scrivener Consultant Biologist, Rutherford Road,Nanaimo, BC
G. Suther Ecofocus Environmental Consultants, LaconRoad, Denman Island, BC
B. Thomson B.C. Ministry of Environment, Lands and Parks,–nd Street, Surrey, BC
Derek B. Tripp Tripp Biological Consultants Ltd., Extension Road,Nanaimo, BC
Peter J. Tschaplinski B.C. Ministry of Forests, Research Branch, PO Box
Stn Prov Govt, Victoria, BC
Tim Webb ESSA Technologies Ltd., ‒ West th Avenue,Vancouver, BC
David Wilford B.C. Ministry of Forests, Prince Rupert Forest Region,Forest Sciences Section, Bag ,Smithers, BC
Robert P. Willington Integrated Resource Analysis Section, TimberWestLimited, PO Box , Crofton, BC
M.P. Wise International Forest Products, Dunsmuir Street,Vancouver, BC
Michael Z’Graggen East th Avenue, Vancouver, BC

CONTENTS
List of Contributors ....................................................................................................................................................... iii
Introductory Comments for FFIP/Carnation Creek WorkshopDavid Wilford ............................................................................................................................................................... 1
Introduction to Day 1: Focus on ResearchMichael Brownlee ......................................................................................................................................................... 3
Introduction: Workshop Outline and Experimental DesignC. Peter Lewis ................................................................................................................................................................ 5
The Landscape of the Pacific NorthwestMichael Church ............................................................................................................................................................ 13
An Introduction to the Ecological Complexity of Salmonid Life History Strategies andof Forest Harvesting Impacts in Coastal British Columbia
J. Charles Scrivener, Peter J. Tschaplinski, and J. Stevenson Macdonald .............................................................. 23
Focus on Forestry-fisheries Problems: Lessons Learned from Reviewing Applicationsof the Coastal Fisheries-Forestry Guidelines
D. Tripp and D. Hogan ................................................................................................................................................ 29
Watershed HydrologyEugene D. Hetherington .............................................................................................................................................. 33
Landslides on the Queen Charlotte Islands: Processes, Rates, and Climatic EventsJim W. Schwab ............................................................................................................................................................... 41
Gully Processes in Coastal British Columbia: The Role of Woody DebrisM.J. Bovis, T.H. Millard, and M.E. Oden .................................................................................................................. 49
Stream Channel Morphology and Recovery ProcessesD. L. Hogan, S. A. Bird, and S. Rice ............................................................................................................................ 77
Evolution of Fish Habitat Structure and Diversity at Log Jamsin Logged and Unlogged Streams Subject to Mass Wasting
Derek Tripp ................................................................................................................................................................... 97
Channel Scour and Fill in Coastal StreamsJudith K. Haschenburger ............................................................................................................................................. 109
Fine Sediments in Small Streams in Coastal British Columbia: A Review of Research ProgressMichael Church ............................................................................................................................................................ 119
Changes of Spawning Gravel Characteristics after Forest Harvesting in Queen Charlotte Islands andCarnation Creek Watersheds and the Apparent Impacts on Incubating Salmonid Eggs
J. Charles Scrivener and Derek B. Tripp .................................................................................................................... 135
Overwintering Habitats and Survival of Juvenile Salmonids in Coastal Streams of British ColumbiaGordon F. Hartman, Derek B. Tripp, and Tom G. Brown ...................................................................................... 141
v

vi
Long-term Patterns in the Abundance of Carnation Creek Salmon, and the Effects of Logging,Climate Variation, and Fishing on Adult Returns
Peter J. Tschaplinski, J. Charles Scrivener, and L.B. Holtby .................................................................................... 155
Watershed Hydrology: Forest Management ImplicationsRobert P. Willington ..................................................................................................................................................... 181
Gully Assessment MethodsD.L. Hogan and T.H. Millard ...................................................................................................................................... 183
Classification and Assessment of Small Coastal Stream ChannelsD.L. Hogan and S.A. Bird ............................................................................................................................................ 189
Productivities, Costs, and Site and Stand Impacts of Helicopter-logging in Clearcuts, Patch Cuts,and Single-tree Selection Cuts: Rennell Sound Trials
Ray Krag ......................................................................................................................................................................... 201
Ten Years of Watershed Restoration in Deer Creek, Northwest Cascades of Washington StateJames E. Doyle, Greta Movassaghi, and Roger Nichols ........................................................................................... 215
The Fish/Forestry Interaction Program Simulation Model (FFIPS)D. Marmorek, Ian Parnell, Tim Webb, Michael Z’Graggen, Werner Kurz, and Josh Korman ........................... 231
Problems, Prescriptions, and Compliance with the Coastal Fisheries-Forestry Guidelinesin a Random Sample of Cutblocks in Coastal British Columbia
Derek Tripp ................................................................................................................................................................... 245
POSTERS
The Spatial Variation and Routine Sampling of Spawning Gravels in Small Coastal StreamsStephen Rice .................................................................................................................................................................. 257
Debris Avalanches-flows on British Columbia’s North CoastJim W. Schwab ............................................................................................................................................................... 259
Landslide Runout Behaviour in the Queen Charlotte IslandsR.J. Fannin, M.P. Wise, and T.P. Rollerson ................................................................................................................ 261
Landslide Reforestation and Erosion Control in the Queen Charlotte IslandsWilliam J. Beese ............................................................................................................................................................. 263
River Otter Predation on Juvenile Salmonids in Winter: Preliminary Report ofRiver Otter Scat Collection and Diet Analysis
J.M.E. Balke, P.J. Tschaplinski, S.J. Crockford, and G. Suther ................................................................................. 265
Applications of Photography in Geomorphology: Size Scales and Appropriate PlatformsDarren Ham and Dan Hogan .....................................................................................................................................267
Terrain Attribute Study: Slope Failure Frequencies Following Logging in Coastal British ColumbiaB. Thomson ................................................................................................................................................................... 271
Quantifying Basin Comparisons in the Queen Charlotte IslandsAnthony L. Cheong ...................................................................................................................................................... 273
Riparian Area Response to the Development of a Lateral Sediment WedgeStephen A. Bird ............................................................................................................................................................. 275

77
Coastal Fish/Forestry Interaction Programs
There is a direct link between stream channel mor-phology and in-stream fish habitats. Pacific salmon,trout and char (salmonids) use stream environmentsfor specific phases of their life cycle. Special condi-tions are needed for successful spawning, thedevelopment and hatching of eggs, and the growthand survival of young (Toews and Brownlee 1981).Salmonids spawn in riffles composed of clean, stablegravels with well-oxygenated streamflows. Certainspecies also require stable pools to rear in for periodsof time ranging from months to years (young fishuse pools to hide from predators, to feed in, and togrow in before migrating to the sea). Adult fishrequire an unobstructed migration path between theocean and the stream spawning grounds. Similarly,young salmonids (fry and juveniles) require accessalong the stream channel and into tributaries andside channels.
A central goal of forest and watershed manage-ment in British Columbia has been to minimizechanges in sediment and debris production and itsdelivery to streams, to avoid changes to runoffpatterns, and to eliminate direct disturbance ofchannel banks and beds. To accomplish this, harvest-ing plans are now designed to avoid landslide anderosion-prone terrain, limit harvest rates, ensurehigh standards of road building and maintenance,and prohibit tree falling and yarding adjacent tostreams (B.C. Ministry of Forests, Forest PracticesCode [draft] 1994). Past practices, however, were notas carefully applied and serious environmentalimpacts on stream channels and aquatic ecosystemshave been widespread (Tripp 1994).
Most previous studies of the response and reco-very of small streams to past forest management haveconcentrated on identifying specific channel impactsand their logging-related cause, and have generallyspeculated on the temporal duration of the impact.
Studies throughout the Pacific Northwest show thatin most cases the channel bed aggrades, bank stabilityis reduced as the channel widens, and pools areinfilled by sediment inputs from landslides (Sullivanet al. 1987). The time required for the channel torecover to pre-disturbance conditions varies from 5to over 60 years. The recovery time depends uponinput sediment characteristics (location along thestream system, amount, and particle size distribution)and the form and structure of the riparian area.
In addition to changing sedimentation and hydro-logical characteristics of a watershed, logging hasbeen shown to have a pronounced influence on theintroduction and storage of large woody debris (LWD)to streams. The influence of individual LWD pieceson channel morphology has been investigated formore than two decades (cf. Thomson 1991). Anintegral component of stream ecology (Hartmanand Scrivener 1990), LWD influences both physicaland biological characteristics of stream channels withbankfull widths less than or equal to the length ofin-stream LWD. In comparison, relatively littleresearch has been undertaken on the importance ofLWD accumulations (log jams) on channelmorphology.
In this paper we review research conducted insmall coastal streams on the Queen CharlotteIslands and Vancouver Island. Research on theQueen Charlotte Islands was designed specifically toidentify and describe the long-term response ofstream channels to increased sediment and debrisloadings resulting from both natural processes andforest management practices. The focus of thisresearch is on log-jam characteristics (e.g., origin,function, and longevity) because jams are the majorfactor controlling the long-term evolution of channelmorphology and fish habitats. The streams have arange of natural disturbance histories, with hillslopefailure events documented back to the 1820s andimpacts from logging that began 40 years ago.
Stream Channel Morphology and Recovery Processes
D. L. H, S. A. B S. R

78
Research undertaken by the Carnation CreekFish/Forestry Interactions Program was establishedto document annual changes in a series of studyareas all located within a single watershed. Thephysical setting of Carnation Creek on VancouverIsland is similar to that of watersheds investigatedon the Queen Charlotte Islands (Church, thisvolume) and enable much finer temporal resolutionof channel changes than does the research on theQueen Charlotte Islands. The results from CarnationCreek are used to illustrate a detailed, annualsequence of channel changes that support thelonger-term (decades-long) results from the QueenCharlotte Islands.
Environmental Setting
The Queen Charlotte Islands are located approxi-mately 80 km west of Prince Rupert in north coastalBritish Columbia (Fig. 1). The islands are character-ized by abundant salmon-producing streams(Northcote et. al. 1984), large areas of steep terrainunderlain by highly erodible bedrock (Alley andThomson 1978) and several soil types that are proneto mass movement (Wilford and Schwab 1982). The
incidence of slope failure is also high because theislands have a predominantly wet climate and theyexperience frequent seismic activity. The averageannual precipitation exceeds 3600 mm along thewest coast, but Williams (1968) estimates this mayreach 7000 mm on coastal mountain ranges. Theseismic activity is due to the location of the QueenCharlotte faultline separating the Juan de Fuca/Explorer and America plates (Sutherland Brown1968; Church, this volume). All of the study water-sheds are in the Coastal Western Hemlock (CWH)biogeoclimatic zone.
Carnation Creek (Fig. 1) drains into BarkleySound on the west side of Vancouver Island. Acomplete description of the Carnation Creek studyis included in Hartman and Scrivener (1990). TheCarnation Creek watershed is also in the CWHbiogeoclimatic zone, and is approximately 11 km2 indrainage basin area with no lakes in the watershed.The local climate is per-humid and 95% of theannual precipitation falls as rain. Monthly stream-flows are highly variable, ranging from 0.025 m3s-1
in summer to 33 m3s-1 during winter freshet. Peakflows up to 64 m3s-1 have been measured. The basinis characterized by irregular topography, with a widevalley flat downstream, confined channels in themid-valley, and steep valley walls with bluffs androck outcrops in headwater areas. The bedrock isprimarily volcanic with thin, coarse-textured soilsthat are well drained in most non-alluvial locations.Landslides are prevalent in the headwater andcanyon areas.
This paper reviews the results of researchcompleted on stream channels both in the QueenCharlotte Islands and Carnation Creek. Thechannels range in gradient from 0.003 to 0.08 and inwidth from 5 to 45 m. The drainage basin areasrange from 1 to 68 km2. Channel morphologies aretypified by a riffle-pool sequence, although cascade-pool and step-pool channels are identified in thesteeper reaches. Channel beds are composed ofgravels and cobbles, and LWD is abundant withvolumes as high as 0.24 m3/m2 in selected reaches.
The Morphology of Forested and Logged Stream Channels
Recent concerns regarding changes in channelmorphology on the Queen Charlotte Islands beganin 1978 after a series of intense storms caused
figure 1 Location map showing the Queen CharlotteIslands and Carnation Creek Fish/ForestryInteraction Program sites. Channel research onthe Queen Charlotte Islands reviewed in thispaper is indicated by location and by authors.
CarnationCreek
Vancouver
QueenCharlotteIslands

79
extensive landslide events on logged and forestedhillslopes (details of these landslide events are givenby Schwab, 1983). In response to these concerns,Hogan (1986) provides one of the first detaileddescriptions of channel morphology in forested andlogged watersheds on the Queen Charlotte Islands aspart of the Fish/Forestry Interaction Program. Themorphological characteristics of Government Creek(Fig. 2) are typical of many stream channels flowingthrough old-growth forest in the CWH biogeocli-matic zone. The channel is diverse, with complexlongitudinal and planimetric forms. The longitudinalprofile has distinct, well-defined pools and riffles(pools—primarily lateral scour pools—account foralmost 65% of the overall channel area). The width ofthe channel is variable, alternating between narrowsections with stable banks and wide sections wherethe channel becomes locally unstable. The channelbanks are commonly undercut while channel barsconsist of cobble, gravel, and sand-textured sediment.
By comparison, the morphological characteristicsof Mosquito Creek (Fig. 3) are relatively simple, withminimal variability in longitudinal, planemetric andsedimentologic characteristics. The channel is in alogged CWH watershed (57% logged during the1960s by high-lead methods without leave strips)and is similar in most morphometric attributes(e.g., drainage basin area and shape, drainagedensity, average channel and hillslope gradient, andgeology) to the Government Creek watershed. Thelongitudinal profile shows long pools with relativelyuniform depths. Although riffles and glides are moreprevalent in the logged stream (45% riffle and glidein Mosquito Creek compared to 35% GovernmentCreek), the shape of each morphological featurediffers from those in the forested stream. Forexample, both pools and riffles in Mosquito Creekare relatively long, narrow and shallow. Channelwidth is not only wider than expected for the drain-age size and hydrological nature, it is consistently
figure 2 Large woody debris, morphology and longitudinal profile of an old growth watershed stream (Government Creekreach B, after Hogan 1986).
top of bank
bottom of channel bank
backwaterstream
pool and riffle divisionsP R
undercut bank
deposition boundary
LWD
buried LWD
LWD cluster
9.0
11.0
10.0
12.0
20 40 60 80 100 120 140 160
Horizontal distance (m)
180 200 220 240 260Arb
itrar
y el
evat
ion
(m)
Reach profile
Large organic debris
metres0
5
10
20 50
30Morphology
N

80
wide with minimal variability. Channel banks arerarely undercut and most channel bars consist ofuniformly textured gravels.
The underlying difference between the morpho-logies of Government and Mosquito creeks isexplained by the LWD characteristics associated witheach channel (Hogan 1986, 1987). The mostimportant difference appears to be a shift in LWDorientation; there is significantly more LWDoriented parallel to the channel banks in MosquitoCreek compared to the predominantly diagonalarrangement in Government Creek. A similarpattern of LWD orientation was found betweenlogged and forested channels in South Bay DumpCreek and in two other reaches of Government andMosquito creeks. The shift in orientation reduces theinteraction among LWD, stream flow and sedimenttransport, so that the same amount of debris has lessinfluence on scouring and trapping of sediment inthe logged stream. Although there is almost twice asmuch sediment stored along the logged channel bed
in Mosquito Creek compared to Government Creek,this material is located in fewer than one-quarter asmany storage sites (Figs. 2 and 3).
In addition to changes in orientation, the totalvolume of LWD is reduced in logged channels, as isthe size distribution of individual LWD pieces(Hogan 1986, 1987). In Government Creek (Fig. 2),LWD is prevalent and frequently spans the channelfrom bank to bank. Most of the LWD has root wadsattached to the log trunk that acts as an anchorduring high flows. In Mosquito Creek (Fig. 3), onthe other hand, relatively small pieces of LWD floatdownstream and have accumulated in debris jams.As a consequence, the influence of individual LWDpieces on channel morphology between log jams isreduced while the size of individual log jams isincreased following logging.
The importance of LWD pieces on channelmorphology was established in the early years of theFish/Forestry Interaction Program on the QueenCharlotte Islands. However, the functional role of
figure 3 Large woody debris, morphology and longitudinal profile of a logged watershed stream (Mosquito Creek Main,after Hogan 1986).
top of bank
bottom of channel bank
backwaterstream
pool and riffle divisionsP R
undercut bank
deposition boundary
LWD
buried LWD
LWD cluster
metres
0 5 10 20 5030
N
Large organic debris
Morphology
12.0
11.0
10.09.0
20 40 60 80 100 120 140 160
Horizontal distance (m)
180 200 220 240 260 280 300
Arb
itrar
y el
evat
ion
(m)
Reach profile

81
figure 4 Examples of landslides and debris delivery to stream channels. a) Photograph of an old, revegetated landslidetrack on the Queen Charlotte Islands. b) Photograph of sediment and debris delivered directly into the stream(coupled hillslope and stream). LWD jam formed at the terminus of the debris flow.
LWD jams has not been considered systematically.The remainder of this paper deals with LWD jams,including their formation, function, and longevity.
The Formation and Influence of Log Jams
Log jams form in coastal streams by severalmechanisms. The most important factors are relatedto watershed attributes, particularly the linkagebetween hillslopes and stream channels. Church(1983) stratifies stream reaches on the QueenCharlotte Islands according to the relative couplingamong the hillslope, valley flat, and stream channel.Coupled reaches occur when coarse sediment(>2 mm) and LWD, mobilized on the hillslope bymass wasting, directly enters the stream channel.Decoupled reaches occur when the coarse sedimentand LWD are intercepted by the valley flat and donot directly enter the stream channel.
Channelized debris flows (or torrents) introducelarge amounts of sediment and debris to the channel(Fig. 4). In coupled reaches, log jams form initiallyat the terminus of debris flows that enter thechannel (Hogan and Bird, in prep.). Subsequentflows can reorganize this LWD and influence jamdevelopment in downstream reaches. In coupled
reaches, much of the volume of LWD in a jam isderived from upslope and upstream; relatively minoramounts are derived from the proximal riparianarea. In decoupled reaches, log jams originate fromfloated debris that becomes anchored at some pointalong the channel. Approximately equal amounts ofLWD in a jam are derived from upstream and theproximal riparian area. Riparian vegetation isintroduced into the channel as a result of bankerosion initiated by the formation of the jam. Oncethe jam forms, it has a tendency to grow by theaddition of wood from overbank areas.
The development of an individual log jam andthe short-term channel adjustments following debrisflows were documented through annual surveys ofCarnation Creek. A sequence of channel maps(Fig. 5) shows the same study area over a timeperiod of 1.5 decades (note that the survey lines arein the same spot in each map and can be used ascomparison references). In the early years(1972–1979), the channel was relatively narrow, withstable banks and a series of pools and riffles. Thejam, clearly evident in 1982, began to form in 1979as a result of the interlocking of two large logs andseveral small pieces of wood. The jam was enlargedsubstantially in 1984 as a result of a series of large
4a.4b.

82
figure 5 Example of log-jam formation in Carnation Creek (for a photograph, see Figure 10a).
1982
1985
1988
1972
1977
1979

83
figure 6 Change in the number of LWD pieces, LWDvolume, and channel width in Carnation Creekwith the development of a new log jam.
storms, and in particular an unusually large flood inJanuary 1984. The channel width upstream of thefully developed jam increased dramatically (Figs. 5and 6) and there was over 2 m of net aggradation(Fig. 7). As the jam grew in size and influence on the
channel, it began to move downstream (from thecentre of the 1982 map to the far left-hand side ofthe 1985 map, Fig. 5) as LWD in the jam wasreorganized by subsequent high flows. All previouslyexisting pools, riffles, and bars were completelydestroyed as the jam developed and migrateddownstream.
Log jams are an important influence on thelongitudinal profile of small coastal streams. Alongitudinal profile of Riley Creek surveyed byHogan (1989) shows extensive aggradation upstreamof several log jams (Fig. 8a). Individual log jams, ora series of closely spaced log jams, impede thedownstream transport of sediment and form anextensive sediment wedge upstream of the jam(s)(Fig. 8b). Between log jams, the channel has a typicalpool-riffle sequence (mean spacing distance of4.3 Wb), cobble-gravel textured bars, and individualLWD pieces. In relative terms, because log jamscontrol sediment transport and create extensiveupstream sedimentation and downstreamdegradation, they have the greatest influence onchannel morphology. Individual LWD pieces, andespecially log steps, are important to channelmorphology and fish habitat features at a smallerscale (e.g., a distance of several bankfull widths),primarily between log jams.
60
50
10
Number of LWD pieces per 30 m of channel
Year of channel survey
40
30
20
1970
1990
1985
1975
1980
35
30
10
LWD volume (m3 per 30 m of channel)
25
20
15
1970
1990
1985
1975
1980
16
14
6
Bankfull channel width (m)
12
10
8
1970
1990
1985
1975
1980
figure 7 Change in the net aggradation anddegradation in Carnation Creek with thedevelopment of a new log jam.
2.0
-1.0
Deviation from 1971–75 mean elevation (m)
Cross-section (number)
1.0
0.0
-2.0
Aggradation
Degradation
Upstream Downstream
2 4 6 8 10 12 14 16 18
1973 1977 19821979 1984 1986

figure 8 Longitudinal profile of Riley Creek (after Hogan1989). a) Entire longitudinal survey (zoneslying above the smooth line drawn through thedata points—the smooth line is a second-orderpolynomial placed simply to make visualinspection easier). b) Detailed profile ofselected section from A.
84
200
180
160
140
120
100
80
60
Elevation (m)
LWD jams
LWD jams
LWD jams
simulated trendline
Distance along thalweg (m)7000 8000 9000 10 000 11 000 12 000
135
Elevation (m)
130
125
120
115
110
105
1008300 8550 8800 9050 9300
Distance along thalweg (m)
J-24yrsJ-9yrs
J-15yrs
BedrockLS
LS
LS
LS
J-9yrsJ-24yrs
J-9yrs
J-24yrsJ-9yrs
LSLS
LS refers to LWD stepsJ = LWD jam of given age
Hogan (1986) documents the morphology of acobble-gravel bed channel in Hangover Creek, show-ing the two distinctly different sections upstreamand downstream of a relatively old log jam (Fig. 9).The LWD located in the middle of the channel is oftwo ages and origins. That on top of the debriscluster is a result of recent blowdown (logs mappedas above the channel bed and with attached rootwads located in the overbank zone). Because theselogs are above the bed, they have had relatively littleinfluence on bed and bank sediment scour ordeposition. However, upon close inspection ofFigure 9, one can identify an old log jam beneath theblowdown. Nurse trees growing on in-stream LWDhave ages ranging from 32 to 45 years, indicating
that the jam has been in place for several decades;the stable vegetated and undercut banks and islandsattest to these ages. Remnants of logs are alsoincorporated into the fluvial sediments making upthe channel banks.
The morphology of Hangover Creek, as influencedby relatively old log jams (at least 45 years old),contrasts with that of Carnation Creek shortly afterthe formation of the log jam shown in Figure 5. Thedownstream zone in Hangover Creek, extending from0 to 180 m in Figure 9, has a single channel withlong, well-defined pools and riffles, gravel-texturedside channel bars, and diagonally oriented LWDpieces that cause lateral and under-scour pools.Upstream of 180 m, the channel expands laterally,doubling in width, and has multiple channels withmid-channel bars and vegetated islands. Pool andriffle shapes are very different in the upstreamsection compared to the downstream section, withincreased lateral and vertical variability. The contrastin appearance between recent and old log jams(300+ years since jam formation) is shown inFigure 10.
Changes in channel morphology associated withLWD longevity in Riley Creek are shown in Figure 11(Hogan 1989). Log jam locations and ages areshown in the longitudinal profiles to enable compar-ison of specific features associated with the variousages. In all cases there is substantial channelaggradation upstream of the recently formed, younglog jams. For example, at the 3400 m distance(Fig. 11a), the bank top and bar top surface graphsmerge, indicating that the channel bed is at the sameelevation as the bank top; the channel has completelyfilled with sediment and the bar tops are elevated tothe height of the bank tops. Degradation of thechannel bed is also evident downstream of theyoung jams (3350–3400 m). As log jams age, moresediment is excavated, the bed upstream of the jamdowncuts, and eroded sediment is transferreddownstream. For example, there is relatively littleaggradation between 2800 and 3000 m and from3150 to 3350 m, although there are two large olderjams present in these zones.
The volume of LWD in a jam also decreases withtime (Fig. 11b) as individual pieces rot or are brokeninto smaller pieces and removed by higher flows. Asjams are reduced in size, the orientation of theremaining LWD shifts from perpendicular to parallel,relative to the streambank (Fig. 11c). As described
8a.
8b.

85
figure 10 Log jams of different ages. a) Recently formed jam in Carnation Creek with extensive sediment wedge upstreamof intact debris that effectively stops sediment transfer downstream. b) Moderately old jam (25 years sinceformation) showing evidence of downcutting of the sediment wedge as the jam deteriorates (no longer spansthe channel). c) Old jam (50 years since formation) that has minimal contemporary influence on sedimenttrapping and scouring. d) Very old jam (300+ years since formation) with complex channel conditions (deeppools, log steps, undercut banks, stable bars, and back channels, etc.).
figure 9 Large woody debris, morphology, and longitudinal profile of Hangover Creek (after Hogan 1986).
top of bank
bottom of channel bank
backwaterstream
pool and riffle divisionsP R
undercut bank
deposition boundary
LWD
buried LWD
LWD cluster
9.0
11.0
10.0
8.0
20 40 60 80 100 120 140 160
Horizontal distance (m)
180 200 220 240 260 280 300Arb
itrar
y el
evat
ion
(m)
Reach profile
320 340 360 380
metres0
5
10
20 50
30N
Large organic debris
Not
mapped
Morphology
Not
mapped
10a. 10b.
10c. 10d.

86
figure 11 Channel changes associated with LWD jamlongevity in Riley Creek (after Hogan 1989).
previously, this shift in orientation influences thesediment trapping ability of the debris, increasing theeffectiveness of bed and bank scour through time.
Changes in channel width and sediment textureare also related to the age of a log jam (Figs. 11dand e). In general, when the channel boundary isnot confined by bedrock, there is an increase inchannel width upstream of recently formed jams. Assediment transport is restricted by a jam, thechannel aggrades and becomes wider and finer-textured. Downstream, the channel can becomenarrow and coarse-textured as the sediment supplyis impeded. Rice (1990) characterizes the sedimentupstream and downstream of log jams with a rangeof ages in Riley Creek (Fig. 12). Jam U (less than5 years old) spans the entire channel and is highlyimpermeable to sediment. A sediment wedge,extending some 50 m, has been initiated upstream ofthe jam. In contrast, jam N (between 30 and 50 yearsold) spans three-quarters of the total bankfull widthand is undercut by three separate channels.However, remnants of a sediment wedge areapparent upstream of jam N. Most of the storedsediment has been re-mobilized and transporteddownstream. These differences in permeabilitybetween relatively old and young log jams arereflected in the texture of the bed, as the contrastbetween fine-textured sediments upstream andcoarse-textured sediments downstream decreaseswith time (Fig. 12).
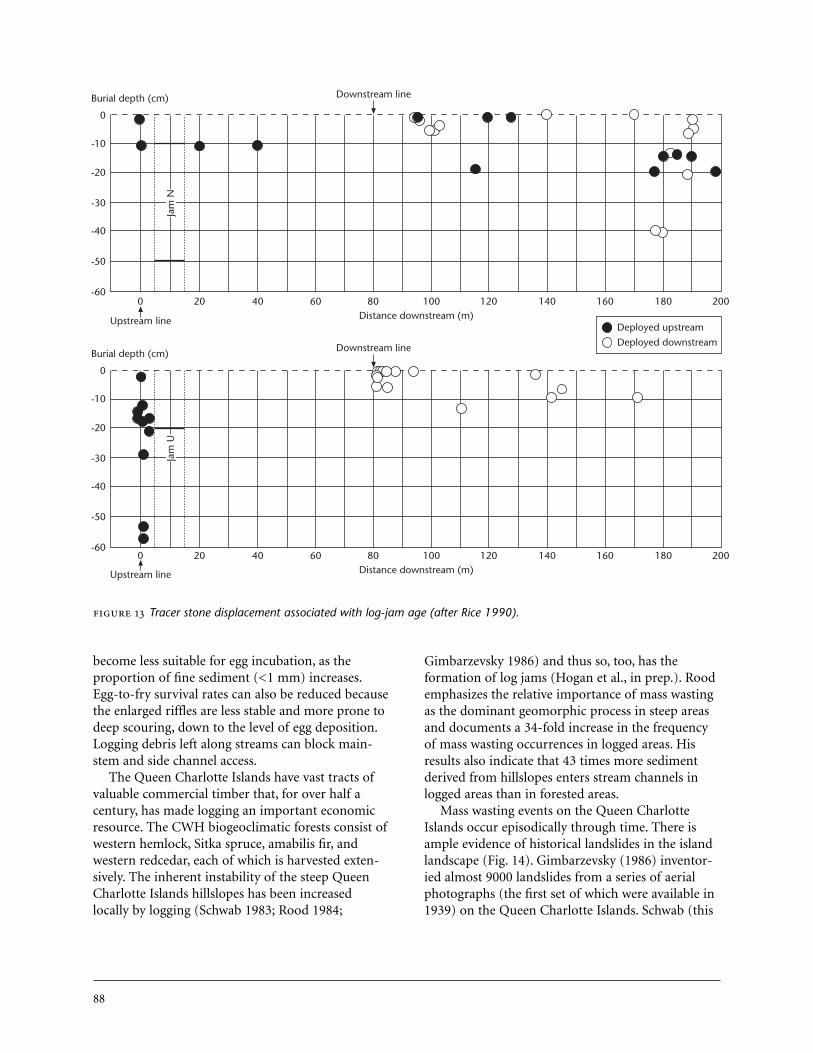
To better understand the sediment transportregime associated with log jams, Rice (1990) placedtracer particles upstream and downstream of jam Uand jam N (Fig. 13). A year after placement ofparticles upstream of the recently formed jam (jamU), all tracer particles recovered were found neartheir original position (≤1 bankfull widths) andburied by 2 and 60 cm of sand and gravel. Incontrast, of those tracer stones recovered upstreamof the relatively old jam (jam N), only two werefound near their original position. The remainderwere found as much as 7 bankfull widthsdownstream of the jam. Tracer particles placeddownstream of both jams U and N moved as muchas 6 and 4 bankfull widths downstream, respectively.However, a greater proportion of stones downstreamof jam U remained in their original position.Downstream of jam N, the channel bed experienceddeep scour (> 0.4 m) as tracer particles weretransported downstream.
Elevation (m)
105103101999795
93918987852700 2800 2900 3000 3100 3200 3300 3400 3500
LWD volumes (m3)
300
250
200
150
100
50
02700 2800 2900 3000 3100 3200 3300 3400 3500
LWD volume by orientation (m3)
300
200
100
0
1002700 2800 2900 3000 3100 3200 3300 3400 3500
Wb (m)
25
20
15
10
02700 2800 2900 3000 3100 3200 3300 3400 3500
Estimated D95 (mm)
400
300
200
100
02700 2800 2900 3000 3100 3200 3300 3400 3500
Distance along thalweg (m)
(e) Surface sediment size
(d) Channel width
(c) LWD orientation
Perpendicular and diagonal
Parallel orientation
(b) In-channel LWD volumes
(a) Thalweg, bar, and bank top position
J-15yrs
J-9yrsJ-24yrs
J-2yrs
J-2yrs
bank topbarthalweg
Average Wb

87
figure 12 Surface grain-size distributions associated with log-jam age (after Rice 1990).
The longitudinal profiles, detailed mapping,sediment sampling, and tracer particle studies showa consistent pattern of channel adjustments tolandslide events. Debris flows, often triggered byforest harvesting and related activities, can introducesediment and debris into stream channels, a processthat leads to the formation of log jams. Streamchannels respond to log jams by widening andaggrading as a sediment wedge develops on the longprofile. Through time, a log jam deteriorates and itsinfluence on sediment transport is reduced. Thetemporal and spatial distribution of debris flows andthe subsequent development of log jams together actas a primary control of channel morphology.
1.0
0.8
0.6
0.4
0.2
0.0
Prop
ortio
n fin
er
1.0
Proportion finer
0.8
0.6
0.4
0.2
0.0
3 4 5 6 7 8 9 10
3 4 5 6 7 8 9 10
1.0
0.8
0.6
0.4
0.2
0.0
Jam U(young, strong,impermeable)
Jam K
Jam N(old, weak,permeable)
Grain size (-Phi)
Grain size (-Phi)
Upstream
Downstream
3 4 5 6 7 8 9 10
Forest Harvesting and the Formation of Log Jams
Forestry activities can influence the amount, timingand nature of sediment and water moving through astream system. The impacts of forestry activities onchannel morphology and fish habitat have beenstudied intensively over the last several decades(e.g., Salo and Cundy 1987; Hartman and Scrivener1990). In general, logging and related activities haveled to increased levels of sediment entering streamchannels. Excess loads of coarse-textured materialstend to promote bed aggradation, in turn leading toexpanded bars and riffles, infilled pools, and bankerosion. The gravel composition of riffles can
88
figure 13 Tracer stone displacement associated with log-jam age (after Rice 1990).
Gimbarzevsky 1986) and thus so, too, has theformation of log jams (Hogan et al., in prep.). Roodemphasizes the relative importance of mass wastingas the dominant geomorphic process in steep areasand documents a 34-fold increase in the frequencyof mass wasting occurrences in logged areas. Hisresults also indicate that 43 times more sedimentderived from hillslopes enters stream channels inlogged areas than in forested areas.
Mass wasting events on the Queen CharlotteIslands occur episodically through time. There isample evidence of historical landslides in the islandlandscape (Fig. 14). Gimbarzevsky (1986) inventor-ied almost 9000 landslides from a series of aerialphotographs (the first set of which were available in1939) on the Queen Charlotte Islands. Schwab (this
become less suitable for egg incubation, as theproportion of fine sediment (<1 mm) increases.Egg-to-fry survival rates can also be reduced becausethe enlarged riffles are less stable and more prone todeep scouring, down to the level of egg deposition.Logging debris left along streams can block main-stem and side channel access.
The Queen Charlotte Islands have vast tracts ofvaluable commercial timber that, for over half acentury, has made logging an important economicresource. The CWH biogeoclimatic forests consist ofwestern hemlock, Sitka spruce, amabilis fir, andwestern redcedar, each of which is harvested exten-sively. The inherent instability of the steep QueenCharlotte Islands hillslopes has been increasedlocally by logging (Schwab 1983; Rood 1984;
-10
-20
-30
-40
-50
-60
Distance downstream (m)
0
Burial depth (cm)
0 20 40 60 80 100 120 140 160 180 200
-10
-20
-30
-40
-50
-60
0
Burial depth (cm)
Distance downstream (m)0 20 40 60 80 100 120 140 160 180 200
Downstream line
Upstream line
Downstream line
Upstream line
Deployed upstream
Deployed downstream
Jam
NJa
m U

89
figure 14 Historical landslide and precipitation records. A) Landslide events occurring in the Queen Charlotte Islands,1810–1991 (from Schwab, this volume). B) Annual maximum 24-hour precipitation records for selectedstations (aggregate record: Port Simpson, 1887–1909; Masset, 1910–1914; Queen Charlotte City,1915–1948; Sandspit, 1949–1962; Tasu, 1963–1972; Sewell Inlet, 1973–1989).
volume) sampled 970 of these landslides anddetermined their date of occurrence by dendrochro-nological field surveys. His results (Fig. 14a) showthat almost 85% of the total volume of sedimentand debris derived from the landslides and deliveredto stream channels was generated in seven largeevents occurring throughout the last two centuries(1810–1991). Of these, the largest events (indecreasing order of magnitude) occurred in 1917,1891, 1875, 1978, and 1935. Only the 1978 eventpost-dates the onset of local logging.
The landslides documented by Schwab (thisvolume) occurred during years that experiencedsevere rainstorms. The combined federal Atmos-pheric Environment Service records (Fig. 14b),beginning in 1887, show large storms in 1891, 1917,1935, 1952, and 1978. Septer and Schwab (1995)
100
8060
40
20
0
120
Total precipitation (annual estimate mm/24 hr relative to station record)
-20
-40-60
1989
1959
1962
1968
1971
1974
1977
1980
1983
1986
1965
1956
1953
1950
1947
1944
1941
1938
1935
1932
1929
1926
1923
1920
1917
1914
1911
1908
1905
1902
1899
1896
1893
1890
1887
b)
0.35
Percent volume
0.30
0.25
0.20
0.15
0.10
0.05
0
1800
1810
/183
018
5018
6518
7018
7518
8618
8718
9118
91/1
917
1905
1908
1917
1925
Unk
now
nRe
pea
t19
9119
9019
8919
88
1935
1940
1942
1945
1957
1961
1962
1964
1972
1974
1975
1976
1977
1978
1979
1980
1980
–85
1982
1983
1984
1985
1987
a)
n = 970 landslides
provide a complete history of each storm. The 1891storm lasted for 3 days. It delivered 305 mm ofrainfall in the first 24 hours and set off debris slidesthat killed 49 Native Indians on the mainland northcoast east of the Queen Charlotte Islands. Therewere five major multiple-day storms in 1935 and atleast three in 1917 along the north coast. TheOctober 29–November 1, 1978, storm caused anestimated 1000 landslides on the Queen CharlotteIslands alone (Schwab 1983), mainly as a result ofthe very short duration rainfalls (120 mm/12 hr) onsteep terrain where logging practices—particularlyroad building and harvesting—had occurred.
Hogan et al. (in prep.) analyzed channel surveysof 44 km of stream channel in 12 watersheds(including 1193 and 1547 channel widths in forestedand logged watersheds, respectively) and identified

90
watershed becomes smaller and steeper. In relativelylarge watersheds with predominantly decoupledstream channels, mass wasting events rarely impactthe channel. Consequently, relatively few new logjams are created during episodes of watersheddisturbance. As the connection between the hillslopeand the stream channel becomes stronger, masswasting events create log jams at an increasing rate,often destroying old log jams in the process. Aschannel gradient becomes increasingly steep, the rateof jam production with an increasing connection tothe hillslope appears to reach a critical point. Forexample, during a debris flow in a steep, coupledstream, an entire channel can be scoured by debrispassing completely through to the stream mouthfrom upslope source areas. Log jams that existbefore such an event can be completely destroyed.
The influence of land use on log-jam formation isshown clearly by the impact of the 1978 storm. Thelarge number of jams initiated in 1978 was due tothe accelerated rate of landslide occurrence in loggedwatersheds (Hogan et al., in prep.). The lack of oldjams (initiated in 1917) in logged watersheds islikely a result of their replacement by young jamsinitiated by the 1978 episode.
The Evolution of Channel Morphology
Hogan (1989) defines log jams as major accumu-lations of LWD, either currently or over the lastdecades (remnants of which are still evident) thatalters channel morphology and downstream sedi-ment transport. Log jams are different from otherin-channel blockages such as those caused by rockslides that create essentially permanent dams Logjams begin to break down over time. The debrispieces rot, are broken into smaller sizes, and aremoved by floods. The longevity of each jaminfluences its temporal role in controlling channelmorphology, as the interruption of sedimenttransport decreases through time.
Because LWD age and channel morphology areintricately linked, the shift in log-jam age distri-bution shown in Figure 15 corresponds with a shiftin expected channel morphology. Hogan (1989)proposes a model of temporal and spatial adjust-ments of channel morphology in response to thedevelopment of log jams (Fig. 16). Initially, beforethe formation of a log jam, a channel is morpho-logically complex, with many of the features shown
Both episodes of log-jam formation are evidentin all watersheds regardless of land use. However, thefrequency of log-jam formation through time isdependent on both watershed type (see Hogan et al.,in prep., for details) and land use. Generally, therelative frequency of young jams increases as a
620 log jams, including 238 and 382 log jams inforested and logged watersheds, respectively. Thefrequency of log jams through time (Fig. 15) indi-cates that the rate of log-jam creation has been epi-sodic over the past century. The distribution is bi-modal, with the first peak centred near the turn ofthe 20th century and the second in the 1970s. Incomparison with landslide histories provided bySchwab (this volume) and the correspondingmeteorological histories provided by Septer andSchwab (1995), episodes of jam initiationcorrespond to landslide events trigged by severerainstorms. The first peak on the histogramidentifies an episode of log-jam formation corres-ponding to storms that occurred in 1891 and 1917,while the second peak identifies another episode oflog-jam formation corresponding to storms thatoccurred in 1964, 1974, and 1978.
figure 15 LWD jam age distributions for forested andlogged watershed streams in the QueenCharlotte Islands (after Hogan et al., in prep.).
0.12
Log jams/Wb
0.10
0.08
0.06
0.04
0.02
0.00
1880
1890
1900
1910
1930
1940
1950
1960
1980
1990
1970
Log-jam year of formation
Total no. of jams: 620Length of survey:Forested 1193 WbLogged 1547 Wb
Total 2740 Wb
1920
Logged n = 382 jamsForested n = 238 jams
1891
19171964
1974
1978

91
figure 16 Adjustment of channel morphology in response to LWD jam formation and deterioration (after Hogan 1989).
Upstream and downstream of LWD jam
• complex, diverse morphology• high width, depth and sediment texture variability• pools more extensive than riffles• lateral scour pools and diagonal riffles• LWD diagonal to flows• abundant undercut banks• many small LWD steps
(b) Less than 10 years since LWD jam formation
(a) Never debris torrented
(d) 20–30 years since LWD jam
Upstream and downstream
• downcutting continues• stable diagonal riffles• pool and riffles extent approximately equal• diverse pool types• previously burned LWD exhumed and functioning
(traps and scours sediment)
(f) LWD jam formation longer than 50 years ago
Upstream
• braided channel• fine textured sediment• riffles and glides• few pools• LWD in jam• minimal undercut banks
(c) 10–20 years since LWD jam formation
(e) 30–50 years since LWD jam formation
Upstream and downstream of LWD jam
• side channels• complex morphology• similar to “never debris torrented”
Downstream
• single thread• coarse texture• riffles, few pools• LWD parallel to channel• mainly over-hang (not
undercut banks
Upstream
• 1 or 2 main channels• bed sediment coarser• pools more extensive• riffles less extensive• steeper channel
Downstream
• 1 or 2 main channels• bed sediment finer• pools more extensive• riffles less extensive
Upstream
• reduced number ofchannels
• increased sinuosity• fine sediment removal
bed coarse• pools associated with
LWD• steeper gradient
Downstream
• one main channel• bar development
(mid-channel)• finer bed texture• pools associated with
LWD

92
in Figure 16a. After the jam has been established, thechannel undergoes fundamental changes, the mostsevere occurring during the first decade (Fig. 16b).Recently formed jams are effective sediment trapsthat cause bank erosion and increased channelwidths, reduced gradients, and finer sediment tex-tures upstream of the jam. During the second andthird decades, the jam begins to deteriorate. As itbecomes a less effective sediment trap, the sedimentsupply to downstream zones increases. In turn, theupstream wedge is downcut, preferred channels areestablished, and riparian vegetation begins tocolonize the bar and bank surfaces (Fig. 16c and d).Typically, after approximately 30 years, the channelbegins to resemble pre-jam formation conditions(Fig. 16e and f). Although remnants remain alongthe channel margin and individual LWD piecesremain along the bed and function as indicated pre-viously, after 50 years there is very little evidence ofthe original jam (e.g., Hangover Creek shown inFigure 9). Many of the debris steps shown in Figure 8are actually the final remains of ancient jams.
The evolution of stream channels in the QueenCharlotte Islands is often linked to the evolution ofadjacent riparian areas (Bird 1993). In the lowerreaches of Gregory Creek, landslides on forestedterrain occurring in 1891, 1917, and 1978 produceddebris floods that forced the channel around logjams and into the riparian area (Fig. 17). Almost halfof the riparian area was activated by these threeevents, removing the riparian canopy and trans-ferring LWD from the riparian area to the streamchannel. Following the debris floods, riparianvegetation colonized several active sediment wedgesassociated with log jams, leaving at least two logjams abandoned in the present-day riparian area.The result of log jam adjustment and developmentin the riparian area of Gregory Creek is a diverseand complex successional pattern of riparian forestpatches, ranging in age from 12 to over 300 yearsold. Intensive logging upstream and within thesedepositional riparian areas can produce extensiveand active sediment wedges that coincide with thedevelopment of relatively young log jams. Robertsand Church (1986) identify these features in fourlogged watersheds (Mosquito Tributary, Armentieres,Mountain, and Lagins) where streambank retreatinto the riparian area was followed by excessivedeposition of sediment in the newly widened streamchannels. Recent observations of Mosquito Tributary
indicate a relatively uniform, even-aged ripariancanopy dominated by red alder established on theedges of a still-active sediment wedge.
Log jams are fundamental structural elements inthe small coastal streams investigated by the researchreviewed in this paper. Recently formed jams alterchannel morphology to the point that in-stream fishhabitats are essentially destroyed. Over the course of50 years the same log jam creates complex, diversemorphologies and riparian areas that are highlyproductive fish habitats. Thus, the shift from an evendistribution of young, moderate and old log jams toa distribution of predominantly young log jamsconstitutes a critical impact.
Hogan et al. (in prep.) identify two episodes oflog-jam formation in the Queen Charlotte Islands inthe last century (Fig. 15). The jam-forming magni-tude of Episode I (storms in 1891 and 1917) is fairlysimilar in both forested and logged watersheds (peakrate of log-jam formation is 0.0047 and 0.0026jams/Wb/yr in forested and logged watersheds,respectively) as the episode pre-dates logging(i.e., the “logged” watersheds were unlogged at thetime). However, the magnitude of Episode II (1964,1974, and 1978 storms) is substantially greater in thelogged watersheds, where the rate of log-jamformation increased by a factor of 3.8, than in theforested watersheds, where the rate decreased by 0.6(peak rate of log-jam formation is 0.0027 and0.0099 jams/Wb/yr in forested and logged water-sheds, respectively). Generally, both forested andlogged watersheds have similar distributions of oldjams, but logged watersheds have more new jams.Therefore, given the distribution of log-jam fre-quency through time (Fig. 15), we would expect in acontemporary inspection of a forested stream in theQueen Charlotte Islands to find young channel char-acteristics half as often as old channel characteristicsthrough space (Fig. 16a and b). In logged watersheds,we would expect to find young channel character-istics nearly 4 times as often as the old morphologies.
Management Implications
Much of the channel and riparian diversity thatcharacterizes coastal streams is a result of log-jamformation and longevity. Over the long term (on theorder of half a century), the complex channels andriparian areas that develop as a log jam deterioratesare highly productive fish habitats. However, the

93
figure 17 Pathways of fluvial disturbance in the riparian area (after Bird 1993). The arrows identify two events occurring in1891 and 1917, indicated by Spruce–Alder and the Alder–Spruce patches, respectively, when the channel wasforced into the riparian area. Log jams C and K formed during these events and are now abandoned by thechannel. A third event in 1978, indicated by Alder patches, was responsible for the creation of several islands.The riparian area occupied by Spruce–Hemlock patches has been undisturbed for at least three centuries.
94
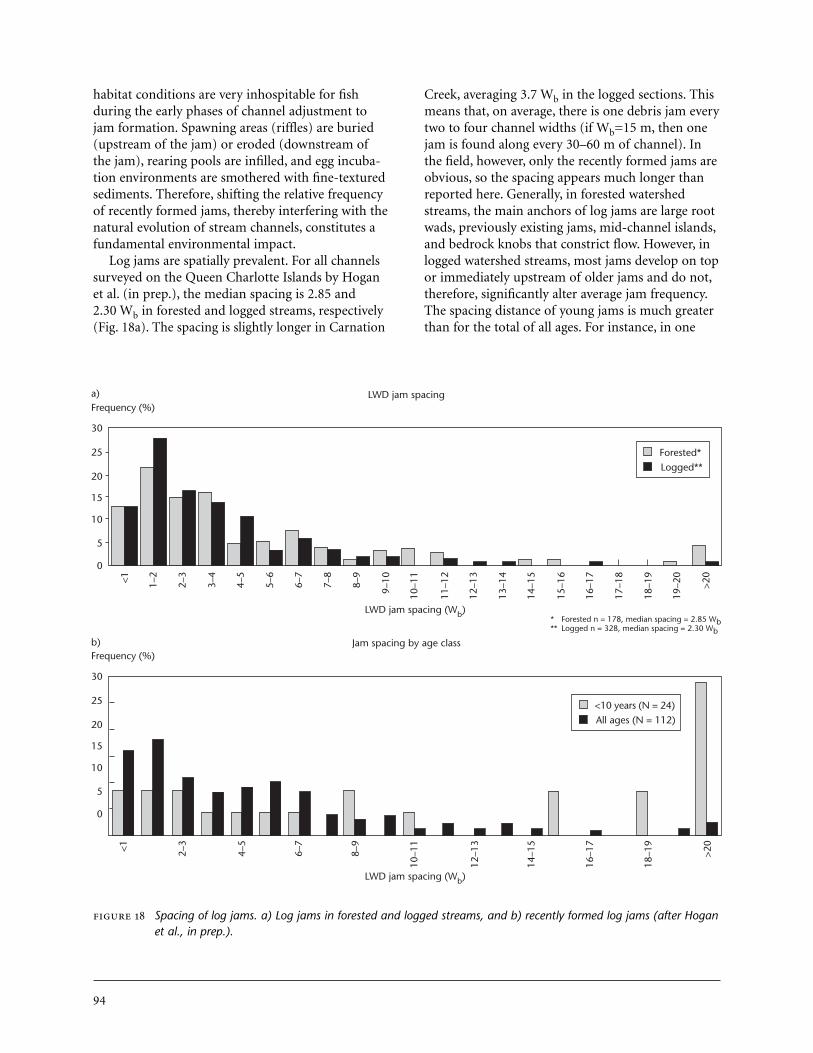
figure 18 Spacing of log jams. a) Log jams in forested and logged streams, and b) recently formed log jams (after Hoganet al., in prep.).
habitat conditions are very inhospitable for fishduring the early phases of channel adjustment tojam formation. Spawning areas (riffles) are buried(upstream of the jam) or eroded (downstream ofthe jam), rearing pools are infilled, and egg incuba-tion environments are smothered with fine-texturedsediments. Therefore, shifting the relative frequencyof recently formed jams, thereby interfering with thenatural evolution of stream channels, constitutes afundamental environmental impact.
Log jams are spatially prevalent. For all channelssurveyed on the Queen Charlotte Islands by Hoganet al. (in prep.), the median spacing is 2.85 and2.30 Wb in forested and logged streams, respectively(Fig. 18a). The spacing is slightly longer in Carnation
Creek, averaging 3.7 Wb in the logged sections. Thismeans that, on average, there is one debris jam everytwo to four channel widths (if Wb=15 m, then onejam is found along every 30–60 m of channel). Inthe field, however, only the recently formed jams areobvious, so the spacing appears much longer thanreported here. Generally, in forested watershedstreams, the main anchors of log jams are large rootwads, previously existing jams, mid-channel islands,and bedrock knobs that constrict flow. However, inlogged watershed streams, most jams develop on topor immediately upstream of older jams and do not,therefore, significantly alter average jam frequency.The spacing distance of young jams is much greaterthan for the total of all ages. For instance, in one
30
Frequency (%)
<1 1–2
2–3
3–4
5–6
6–7
7–8
8–9
10–1
1
12–1
3
9–10
LWD jam spacing (Wb)
4–5
LWD jam spacing
Logged**Forested*25
20
15
10
5
0
11–1
2
13–1
4
14–1
5
15–1
6
16–1
7
17–1
8
18–1
9
19–2
0
>20
* Forested n = 178, median spacing = 2.85 Wb** Logged n = 328, median spacing = 2.30 Wb
30
Frequency (%)Jam spacing by age class
25
20
15
10
5
0
All ages (N = 112)<10 years (N = 24)
<1 2–3
6–7
8–9
10–1
1
12–1
3
4–5
14–1
5
16–1
7
18–1
9
>20
LWD jam spacing (Wb)
b)
a)

95
Queen Charlotte Islands stream, approximately 50%of the young jams are spaced farther than 14 Wb
apart (Fig. 18b).In an old-growth forest watershed, the natural
rate of log-jam formation is relatively low, resultingin a wide range of jam ages so that individual ageclasses do not affect the morphology. Although someage classes will be more prevalent because of theepisodic nature of landslides, the range of agesproduces a diverse mosaic of channel and riparianpatterns that have rich habitat attributes. In a loggedwatershed, the rate of log-jam formation is acceler-ated. The nature of entire channel systems can bealtered because the steep headwater streams receiveproportionally more jam-forming events but theinfluence of these are transferred downstream intolarger, lower gradient streams.
A troublesome legacy of past forest managementpractices in steep terrain is the severity of theenvironmental damage produced by relatively lowmagnitude-high frequency storm events. The 1978storm on the Queen Charlotte Islands was not asintense as events occurring earlier in the century.Nevertheless, far more landslides occurred during1978 than in earlier storms of the same or greatermagnitude. Previous studies have confirmed thatlogging on unstable slopes accelerates the alreadyhigh rate of landslide activity along much of coastalBritish Columbia. This leads to a correspondingincrease in recently formed log jams, with all of theassociated channel morphology and fish habitatchanges. New management initiatives, particularlythe British Columbia Forest Practices Code, willattempt to minimize future environmental impactsin streams. However, the current recovery of streamchannels to their pre-logging conditions is depen-dent on the time required—approximately 50 years—for a diverse array of log-jam ages to establish.
References
Alley, N. F. and B. Thomson. 1978. Aspects ofenvironmental geology, parts of GrahamIsland, Queen Charlotte Islands. B.C. Min.Environ., Lands and Parks, Victoria, B.C.Resource Anal. Br. Bull. No. 2, 65 p.
Bird, S.A. 1993. Stream channel and riparian zoneresponse to the development of a lateralsediment wedge in the Queen Charlotte
Islands, B.C. MSc thesis, Univ. Western Ont.,London, Ont. 154 p.
Church, M. 1983. Concepts of sediment transfer andtransport on the Queen Charlotte Islands.Fish/Forestry Interaction Program, WorkingPaper 2/83. B.C. Min. For. and B.C. Min.Environ., Lands and Parks, Victoria, B.C.
Gimbarzevsky, P. 1986. Regional inventory of masswasting on the Queen Charlotte Islands. B.C.Min. For., Victoria, B.C. Land Manage. Rep.No. 29. 96 p.
Hartman, G.F., and J.C. Scrivener. 1990. Impacts offorestry practices on a coastal streamecosystem, Carnation Creek, British Columbia.Dep. Fisheries and Oceans, Ottawa, Ont. Can.Bull. Fish. Aquatic Sci. 223. 148 p.
Hogan, D.L. 1986. Channel morphology ofunlogged, logged and debris torrented streamsin the Queen Charlotte Islands. B.C. Min. For.,Victoria, B.C. Land Manage. Rep. No. 49. 94 p.
_____. 1987. The influence of large organic debrison channel recovery in the Queen CharlotteIslands, British Columbia, Canada. In Erosionand sedimentation in the Pacific Rim. R.L.Beschta, T. Blinn, G.E. Grant, G.G. Ice and F.J.Swanson (editors). Inter. Assoc. Hydrolog. Sci.,IAHS Publ. No. 165, pp. 343–354.
_____. 1989. Channel response to mass wasting inthe Queen Charlotte Islands, British Columbia:Temporal and spatial changes in streammorphology. In Proc. Watersheds ’89: Conf. onthe Stewardship of Soil, Air and WaterResources, Juneau, Alaska, March 21–23, 1989.USDA For. Serv., Alaska Region, R10-MB-77,pp. 125–144.
Northcote, T.G., A.E. Peden, and T.E. Reichen. 1984.Fishes of the coastal marine, riverine andlacustrine waters of the Queen CharlotteIslands. In Proc. 1984 Symp. on the QueenCharlotte Islands. G.G.E. Scudder. and N.Gessler (editors). Univ. B.C., Vancouver, B.C.73 p.

96
Sutherland Brown, A. 1968. Geology of the QueenCharlotte Islands, British Columbia. B.C. Dep.Mines, Victoria, B.C. Petroleum ResourcesBull. No. 54. 226 p.
Thomson, B. 1991. Annotated bibliography of largeorganic debris (LOD) with regards to streamchannels and fish habitats. B.C. Min. Environ.,Lands and Parks, Victoria, B.C. Tech. Rep. 32.93 p.
Toews, D.A.A. and M.J. Brownlee. 1981. A handbookfor fish habitat protection on forest lands inBritish Columbia. Dep. Fish. Oceans,Vancouver, B.C. Special Publ. 173 p.
Tripp, D. 1994. The use and effectiveness of theCoastal Fisheries-Forestry Guidelines inselected Forest Districts of coastal BritishColumbia. B.C. Min. For., Victoria, B.C. 86 p.
Wilford, D.J. and J.W. Schwab. 1982. Soil massmovements in the Rennell Sound area, QueenCharlotte Islands, British Columbia. InHydrological processes of forested areas. Proc.Can. Hydrolog. Symp., Fredericton, N.B.,June 14–15, National Research Council,pp. 521–541.
Williams, G.D.V. 1968. Climate of the QueenCharlotte Islands. In Flora of the QueenCharlotte Islands. J.A. Calder and R.L. Taylor(editors). Can. Dep. Agric., Plant ResearchInst., Ottawa, Ont., pp. 16–49.
Rice, S.P. 1990. The spatial variation of bed materialtexture in coupled basins on the QueenCharlotte Islands. MSc thesis. Univ. B.C.,Vancouver, B.C. 127 p.
Roberts, R.G. and M. Church. 1986. The sedimentbudget in severely disturbed watersheds,Queen Charlotte Ranges, British Columbia.Can. J. For. Res. 16:1092–1106.
Rood, K.M. 1984. An aerial photograph inventory ofthe frequency and yield of mass wasting on theQueen Charlotte Islands, British Columbia.B.C. Min. For., Victoria, B.C. Land Manage.Rep. No. 34. 55 p.
Salo, E.O. and T.W. Cundy (editors). 1987.Streamside management: forestry and fisheriesinteractions. Coll. For. Resources, Univ. Wash.,Seattle, Wash., Inst. For. Resources Contrib.No. 57. 467 p.
Schwab, J.W. 1983. Mass wasting: October–November storm, Rennell Sound, QueenCharlottes Islands, British Columbia. B.C. Min.For., Victoria, B.C. Res. Note No. 91. 23 p.
Septer, D. and J.W. Schwab. 1995. Rainstorms andflood damage: Northwest British Columbia,1891–1991. B.C. Min. For., Victoria B.C. LandManage. Rep. 31.
Sullivan, K., T.E. Lisle, C.A. Dolloff, G.E. Grant, andL. Reid. 1987. Stream channels: the linkbetween forests and fishes. In Streamsidemanagement: forestry and fisheriesinteractions. E.O. Salo and T.W. Cundy(editors). Coll. For. Resources, Univ. Wash.,Seattle, Wash., Inst. For. Resources Contrib.No. 57, pp. 39–97.

97
Introduction
Large woody or organic debris is an essential com-ponent of most streams on the Queen CharlotteIslands (Hogan 1986; Tripp and Poulin 1986). It isfrequently also closely linked with upslope processes,inasmuch as debris torrents and other mass wastingevents appear to be a significant source of debris forstreams on the Queen Charlotte Islands (Schwab,this volume). Where the gradient is steep enough,slides or torrents may be carried down in smallstreams for a considerable distance before halting ina lower gradient reach. When the floodplain isconfined between steep hillsides, debris torrents alsoenter the low gradient sections of larger streamsdirectly from gully failures alongside the stream.
Most of the large organic debris in medium-sizestreams (15–25 m wide ) on the Queen CharlotteIslands is organized into log jams (Hogan 1989).These log jams physically occupy a significant por-tion of the total stream length available to fish.Because log jams also control many of the habitatcharacteristics upstream of a jam as well as below ajam, understanding how the fish habitat at log jamsdevelops or evolves in many streams can requirestudy of most of the fish habitat present.
Logging to the stream edge changes the type andrate of debris entering a stream. In steep land areason the Queen Charlotte Islands, logging in upslopeareas also accelerates the amount of sediment anddebris introduced into streams (Rood 1984). Bothfactors should affect the structure of the log jams,but to what degree or how quickly is unknown. Thepresent study attempts to determine how log jamsand the fish habitat associated with them evolve overtime. It also attempts to determine if log jams inlogged streams show the same patterns and rates ofchange as log jams in unlogged streams.
Methods
Site Selection and Aging In this study, a log jam isdefined as any deadlocked jumble of large woody ororganic debris (LOD) large enough to completelyspan a stream and obstruct the movements of graveland debris downstream. A log jam did not actuallystill have to be present, as long as there was clearevidence that such a jam once existed. A combi-nation of large debris piles on one or both sides ofthe channel, large alluvial flats or terraces repre-senting major sediment deposits, and relic channelswere all considered to be strong evidence of a majorlog jam at one time.
Log jams were selected to provide a range of ageson both logged and unlogged streams. During theinitial selection process, the age of each log jamencountered during reconnaissance surveys oflogged and unlogged streams was roughly estimatedas young (0–30 years), mature (30–60 years), or old(greater than 60 years). Age was initially based onthe following visual characteristics: the amount ofmoss present on the debris, the integrity of the jamand thus the amount of gravel backed up in front ofthe jam face, and the number and size of treesgrowing on the debris or alluvial terraces thatmarked the initial depth of the sediments piled upby the log jam.
Log jams with bare, moss-free logs, large accumu-lations of gravel above the jam compared todownstream, and a thick growth of small-stemmedalders were considered to be young. Log jams with aheavy cover of moss or trees growing on the logs,even or randomly distributed gravel deposits, andopen groves of large alders were considered to be old.For the log jams selected for further study, final agewas based on tree cores. The latter were taken with anincrement borer from a range of what appeared to be
Evolution of Fish Habitat Structure and Diversity at Log Jamsin Logged and Unlogged Streams Subject to Mass Wasting
D T

98
the oldest trees above and below the face of the jam.Trees that were growing on logs in the log jam werepreferred because they provided a minimum jam agethat was less equivocal than other trees.
Habitat Measurements Each log jam site encom-passed a length of channel equal to five bankfullwidths above and below the face of the log jam.Bankfull width was average width from rooted edgeto rooted edge in the main channel between logjams. The centre of each log jam site was consideredto be the upstream face of the jam, which was easilyand consistently located. The upper log jam sectionreferred to the stream area above the face of the jam;the lower jam section referred to the stream areabelow the face of the jam.
A sketch map was drawn of each site to determinewhere the main debris accumulations were located,where the main channels and side channels werelocated, and where each pool and riffle was located.All mapping was at a stable, low flow period wheneach pool and riffle present was readily identifiable.
Each pool at each log jam site was numbered anddescribed as either a lateral scour pool, backwaterpool, dammed pool, trench pool, underscour pool,or plunge pool according to Bisson et al. (1982),while riffles were distinguished as either riffles, runs,or cascades. Other pool types identified includedunderscour pools, drawdown (i.e., isolated) pools,and glide pools. All features were recorded as main-stem or side channel habitats and, in the case of sidechannels, as temporary or permanent depending onwhether the intervening ground was vegetated ornot. Each channel was also recorded as “capped” or“uncapped” depending on whether or not flows inthe channel originated from seepage water at thebase of a log jam. The position of each habitat unitrelative to the “face” of the main log jam in the reachwas recorded as being upstream or downstream.
The structure or material most responsible forthe formation of each habitat unit (e.g., tree roots,LOD, boulder, cobble or gravel deposits, streambanks) was recorded to determine the principalhydraulic controls present above and below debrisjams in each reach. Maximum depth was recorded toestimate maximum pool depth at zero discharge,and therefore the extent of the deep water cover ineach pool. Other variables measured in each habitatunit included length and width to determine theamount of each habitat type present, substrate
composition (visual estimates of % fines, gravel,larges, and bedrock), and substrate size (D90).
Fish Cover Measurements The amount of fish coverpresent in the form of LOD, deep water, boulders,and stable rooted undercut banks in or beside eachhabitat unit was measured in plan view to thenearest 0.1 m2. Stream cover was measured sepa-rately from channel cover. The former included onlythe cover (LOD, rocks, deep water, and undercutbanks) that was actually in water and influencing thedistribution and abundance of fish at the time of thesurvey. Where portions of the cover were partly inand partly out of the water, only the portion in waterwas counted as stream cover. Channel cover (LOD,undercut banks, and rocks) was all the cover in thechannel up to the top of the banks, both in and outof the water. Pieces of LOD that overlapped morethan one habitat unit along the length of the channelwere assigned to the habitat unit that the piece wasconsidered to have the greatest effect on. Where morethan one habitat unit was present across the channel,the LOD was assigned to the feature least likely to bedrowned out at higher flows.
Length and width of individual LOD pieces, deepwater areas, and undercut banks were measureddirectly with metre sticks and metre tapes. Coverrocks were counted along a 1-m wide strip acrossthe middle of the habitat unit, from water’s edge towater’s edge in the case of stream cover, and frombank to bank in the case of channel cover. Totalamount of rock cover was then calculated as theproduct of the number of large, stable rocks on thetransect, times the length of the habitat unit.Unusually large rocks or bedrock outcrops thatcould provide cover from high flows were measuredseparately and added to the transect estimates.
The number of pieces of LOD present in eachfeature, and the average length, diameter, orientation(parallel, diagonal, perpendicular), and position(under, over, alongside) of the LOD relative tostream flows was recorded. In large debris piles,where the precise number of LOD pieces presentcould not determined, the total number present wasestimated by comparing the number of piecespresent in the area or volume of the visible logspresent to the total area or volume of the debrispresent. Total length and diameter at mid-length wasmeasured to the nearest 0.1 m on a maximum ofthree pieces of LOD in each habitat unit. Where

99
more than three pieces of LOD were present, thelargest and smallest pieces were measured, alongwith a third piece judged to be representative of allthe debris by each pool or riffle.
Data Analysis Habitat characteristics such as age,number of channels, sinuosity, and percent pool orriffle area that were independent of stream size werecompared directly between reaches. To remove thescale effects caused by differences in stream size, allother depth, area, or volume measurements wereexpressed as per unit of channel area or unit ofchannel length. A unit of channel length was equi-valent to average bankfull width as defined above.
A habitat diversity index H' was calculated tointegrate various measures of channel complexitysuch as the different types of channels present, thedifferent types of pools and riffles present, and thedifferent hydraulic controls responsible for eachpool or riffle. The index is similar to the commonShannon-Weaver diversity index often calculated forsamples of benthic invertebrates, except the differenthabitat types here are compared by area rather thanby number. Each pool and riffle was classified as totype (e.g., lateral, plunge, glide), hydraulic control(e.g., LOD, bedrock), and channel type (capped oruncapped, permanent or temporary). Habitatdiversity H' was then calculated separately for eachupper and lower jam section as follows (from Lloydet al. 1968):
H' = C/A × ((A log A) - sum (ai log ai))where C = 3.32193;
A = total wetted area of each jamsection;
ai = wetted area of the ith habitat typewith the same hydraulic controland channel type.
Differences between jam sections were tested withpaired t-tests, while differences between logged andunlogged streams were tested with independentt-tests. Relationships among the various habitatparameters were explored with a Pearson correlationmatrix, using Bonferroni-adjusted probabilities toreduce the likelihood of spurious correlations.
Results
A total of 32 sites were investigated (Fig. 1), 26 ofwhich had obvious log jams that were still affectingstreamflow patterns. Six sites were debris torrent
Location of study streams on the QueenCharlotte Islands. Numbers in brackets are thenumber of log jam study sites on each stream.
20 200 40 60 80 100Kilometres
Gregory (6)
Riley (4)
Government (4)
Bonanza (2)
Shelley (2)
Tarundl (2)
Southbay (1)
Fukukawa (2)
Mosquito (2)
Schomar (2)
Cohoe (1)
Peel (3)
Sachs (1)
GrahamIsland
MoresbyIsland
BritishColumbia
N

tracks that had largely obliterated any evidence of alog jam in the stream, other than some remnants stillembedded in the banks or lying on the floodplain.
Of the 26 intact log jams formed by mass wastingor large fluvial events, 13 were formed in unloggedstream reaches and 13 were formed in logged streamreaches. All of the unlogged sites were located on thewest coast of the Queen Charlotte Islands. Of the 13logged sites, eight were on the east coast and fivewere on the west coast. Of the six torrented sites,two were unlogged sites on the west coast, and fourwere logged sites, three on the east coast and one onthe west coast. One debris torrent site (SouthbayDump Creek) had six to eight pieces of LOD addedto it 8 years previously in a study on the use of LODto restore stream habitats.
Stream Size and Log Jam Age Log jam sites were alllocated on medium-size streams 15–24 m wide,while the sites where torrents had passed by were allin smaller streams 8–11 m wide (Table 1). The esti-mated age of the log jams in logged streams rangedfrom 8 to 42 years, while log jams in unloggedstreams varied from 11 to 110 years. All loggedtorrent sites were 11 years old; unlogged sites werean estimated to be between 69 and 75 years old.
Log jams in logged streams were the same ageabove and below the face of the jams. The log jamsin unlogged streams, however—particularly theolder jams—tended to have more recent debrisdeposits on top of the original debris. The uppersections of each log jam site were therefore 18 yearsyounger, on average, than the sections below the faceof the jam.
Habitat Differences Above and Below Log JamsDifferences between the fish habitat above and belowthe face of a log jam were much greater than thedifferences between log jams in logged and unloggedstreams. Of the 25 channel, substrate, LOD, and fishcover characteristics recorded for upper and lower logjam sections, 15 differed significantly from eachother (P<0.05), in most cases by a large margin(Table 2). By comparison, only 8 of 27 parametersmeasured on logged and unlogged streams differedsignificantly (Table 3).
Most of the differences in habitat above andbelow the face of log jams were related to the extraside channels present below the face of the jam.Because of the extra side channels and the habitatreplication they represent, the number of pools andriffles per unit of channel length was also signifi-cantly higher downstream, as was wetted length andoverall habitat diversity. The amount of LODpresent in any given watercourse was not appreci-ably higher below the face of the jam compared toupstream. However, because of the greater numberof parallel watercourses below the jam, the totalamount of LOD below the jam face was substantiallyhigher than above the jam.
Percent of wetted area that was pool area did notdiffer significantly above and below log jams. Whilepools in the single channel above a log jam tendedto be half again larger than pools below a jam, therewas a greater number of pools in the main channeland side channels below the jam. The net result wasactually a significantly greater wetted area and asignificantly greater volume of water below the faceof the jam compared to upstream. Similarly, while
100
table 1 Average channel width and age of the study sites
Average age (years, range)
Logged condition N Average bankfull width (m, range) Above jam Below jam
Log jam sitesLogged 13 14.2 (8–23.5) 26.8 (8–42) 26.8 (8–42)Unlogged 13 19.5 (8–24) 54.2 (12–105) 72.2 (33–110)
Torrent path sitesLogged 4 10.0 (8–11) 11.0 (11–11) 11 (11–11)Unlogged 2 8.5 (8–9) 72.0 (69–75) 72.0 (69–75)

101
Differences between the main fish habitat characteristics of the upstream and downstream sections of log jams inlogged and unlogged streams. P values are probabilities of no significant differences between upper and lowerjam sections, using a paired t-test to test for differences. Bold faced P values are values < 0.05.
Log-jam section
Habitat variable Upper Lower P
No. reaches 26 26
Age (years) 40.5±26.6 49.5±28.9 0.0571
Stream characteristics
No. stream channels 1.31±0.62 < 2.85±1.69 <0.0001
No. habitat units/channel width 2.15±1.12 < 4.78±3.40 <0.0001
Habitat diversity (H') 2.12±0.54 < 2.82±0.81 0.0012
Wetted length/channel length 1.38±0.37 < 2.29±1.03 0.0001
Wetted area (m2/m2 of channel) 0.45±0.09 < 0.65±0.25 0.0001
Wetted volume (m2/m2 of channel) 0.23±0.12 < 0.30±0.15 0.0246
Proportion of wetted area pool 0.58±0.22 0.63±0.21 0.2951
No. pools/channel width 1.34±0.94 < 3.12±2.27 <0.0001
Mean pool area (m2) 78.4±68.2 > 52.1±58.2 0.0302
Mean net pool depth (m) 0.59±0.32 0.57±0.27 0.7747
Substrate
Fines (m2/m2 of channel) 0.08±0.07 0.11±0.07 0.0699
Gravel (m2/m2 of channel) 0.18±0.10 < 0.28±0.14 0.0016
Larges (m2/m2 of channel) 0.17±0.11 < 0.24±0.14 0.0050
Bedrock (m2/m2 of channel) 0.02±0.03 0.02±0.03 0.9357
D90 (m) 0.22±0.16 0.20±0.15 0.6350
LOD
No. pieces/m2 of channel 0.04±0.02 < 0.10±0.05 <0.0001
Piece volume (m3) 2.86±2.43 3.18±2.32 0.5991
Stream volume (m3/m2 of channel) 0.02±0.02 < 0.07±0.07 0.0033
Channel volume (m3/m2 of channel) 0.08±0.05 < 0.33±0.35 <0.0001
Other cover
Stream undercut (m2/m2 of channel) 0.01±0.01 < 0.02±0.03 0.0045
Total undercut (m2/m2 of channel) 0.02±0.01 < 0.05±0.06 0.0018
Stream boulders (m2/m2 of channel) 0.07±0.13 0.10±0.13 0.2335
Total boulders (m2/m2 of channel) 0.12±0.17 0.17±0.21 0.2966
Deep water (m2/m2 of channel) 0.09±0.07 0.11±0.08 0.1541
the amount of gravel present in terms of volumemay be greatest above the jam face, gravel area—andthus the amount of spawning habitat available tofish—was greatest below the jam face.
Parameters that did not differ above and belowthe face of a log jam suggest that it is primarily bed-load that is affected by the log jam, and that bedloadmovements may be responsible for many of the
habitat differences observed. The amount of fines,for example, that would be transported mainly assuspended materials and thus be less affected by alog jam, was the same above and below the face ofthe jam. Bedrock, which is a permanent fixtureunaffected by stream flows, also had the samesurface area above and below the jam face.

102
Differences Between Logged and Unlogged StreamsIn logged/unlogged stream comparisons, habitatdifferences related almost exclusively to the greaternumber of channels present below the face of thelog jam in unlogged streams. More side channels inturn meant a greater total wetted length relative to
overall channel length, a greater number of poolsand riffles, and a higher diversity (H').
A greater number of side channels below the faceof a jam in unlogged streams is probably related tothe significantly greater age of the unlogged streamlog jams, inasmuch as unlogged stream log jams had
Differences between the main fish habitat characteristics of log jams in logged and unlogged streams. P valuesare probabilities of no significant differences between log jam characteristics in logged and unlogged streams,using a t-test to test for differences. Bold faced P values are values < 0.05.
Log-jam section
Habitat variable Upper Lower P
No. reaches 26 26
Age (years) 26.8±10.6 < 63.2±28.0 <0.0001
Channel width (m) 14.2±3.5 < 19.5±4.2 <0.0001
Stream characteristics
No. stream channels 1.62±0.75 < 2.54±1.86 0.0230
No. habitat units/channel width 2.50±1.14 < 4.43±3.63 0.0123
Habitat diversity (H') 2.23±0.63 < 2.71±0.82 0.0228
Wetted length/channel length 1.58±0.49 < 2.10±1.12 0.0337
Wetted area (m2/m2 of channel) 0.56±0.20 0.53±0.19 0.5611
Wetted volume (m3/m2 of channel) 0.26±0.16 0.27±0.11 0.7400
Proportion of wetted area pool 52.8±22.8 < 68.1±18.0 0.0097
No. pools/channel width 1.56±0.83 < 2.90±2.46 0.0117
Mean pool area/channel width 2.93±1.51 4.19±3.48 0.0960
Mean net pool depth (m) 52.1±28.5 63.1±29.0 0.1717
Mean net pool depth/channel width 3.74±2.01 3.19±1.20 0.2334
Substrate
Fines (m2/m2 of channel) 0.08±0.08 0.10±0.07 0.2309
Gravel (m2/m2 of channel) 0.25±0.14 0.21±0.11 0.1793
Larges (m2/m2 of channel) 0.22±0.14 0.19±0.11 0.4268
Bedrock (m2/m2 of channel) 0.01±0.03 0.02±0.03 0.7547
D90 (m) 23.7±18.3 18.5±12.7 0.2381
LOD
No. pieces/m2 of channel 0.08±0.05 0.06±0.04 0.0823
Piece volume (m3) 2.63±2.28 3.38±2.42 0.2572
Stream volume (m3/m2 of channel) 0.05±0.06 0.05±0.06 0.8334
Channel volume (m3/m2 of channel) 0.25±0.37 0.17±0.14 0.3091
Other cover
Stream undercut (m2/m2 of channel) 0.01±0.01 0.02±0.03 0.3310
Total undercut (m2/m2 of channel) 0.03±0.03 0.04±0.06 0.6710
Stream boulders (m2/m2 of channel) 0.10±0.17 0.07±0.08 0.4824
Total boulders (m2/m2 of channel) 0.14±0.22 0.14±0.16 0.9290
Deep water (m2/m2 of channel) 0.10±0.10 0.10±0.05 0.8136

103
Habitat parameters that showed significant,positive correlations with each other at logjams in logged and unlogged streams on theQueen Charlotte Islands.
more time to develop side channels. Unlogged sitesalso had significantly wider channels than theunlogged sites, but it is not known how importantchannel width is in determining the number of sidechannels, or what the potential complexity of a logjam can be.
For other habitat characteristics, only percentpool area was greater at log jams in unloggedstreams, a difference that may be more attributableto differences in bedload than to age. There were noother differences between logged and unloggedstreams with regard to substrate characteristics, orother fish cover characteristics measured (e.g., under-cut bank area, deep water area, boulders). When onlythe upper sections of log jams were compared,logged streams had significantly smaller debrispieces than unlogged streams, but they also hadsignificantly more pieces. The net result was thesame LOD volumes. For the lower log jam sectionsor both the upper and lower sections combined,there were no significant differences in the numberof LOD pieces, piece volume, or total volume.
Habitat Relationships For stream habitats above theface of the log jam, pool area showed a significantnegative correlation with cobble and boulder area(P< 0.05). When there was little pool area, there wasa large riffle area, which is also where most of theboulders and cobbles are located. Fines showed theopposite pattern, a significant positive correlationwith pool area, water volume, and deep water cover.This pattern may be related to the fact that verylarge pools tended to form upstream of log jams.Because of the slow flows in these pools at moststage heights, these pools would be the sites wherefine size particles would most likely accumulate, orat least be most visible. Gravel area, undercut bankarea, and deep water area were also positivelycorrelated with LOD abundance (either stream LODarea or the number of channel LOD pieces).
Significant (P< 0.05) correlations among habitatparameters differed slightly below the face of the logjams. Ignoring obviously related parameters(e.g., LOD area and LOD volume), the number ofLOD pieces in the water was strongly negativelycorrelated with D90, but positively correlated withdeep water area and gravel area. Deep water area was
in turn positively correlated with gravel area andfine area, while percent pool area was negativelycorrelated with boulder area.
Combining the data for upper and lower jamsections increased the sample size and the signifi-cance of the relationships among the various habitatcharacteristics, but the relationships remainedotherwise similar. As expected, closely relatedcharacteristics remained highly correlated. Forexample, D90, stream boulder cover, and totalsubstrate coverage by cobbles and boulders were allstrongly correlated with each other. Similarly, habitatdiversity, the number of channels, wetted length overchannel length, and the number of pools and rifflesper unit of channel length were also closely cor-related, as were the number of LOD pieces, LODareas, and LOD volumes.
There were also five parameters not obviouslyrelated to each other that showed significantcorrelations. These were total gravel area, total finesarea, deep water area or total water volume, habitatdiversity (H', number of streams, or number ofpools and riffles), and LOD abundance (number ofpieces, area, or volume). As indicated in Figure 2,LOD abundance was significantly correlated withthe four other parameters. Total water volume wassignificantly correlated with fine area, while gravelarea was correlated with habitat diversity. Gravelarea and deep water cover were also correlated.
Gravel area
Fines area Habitat diversity
Deep water area(or total water volume)
LOD
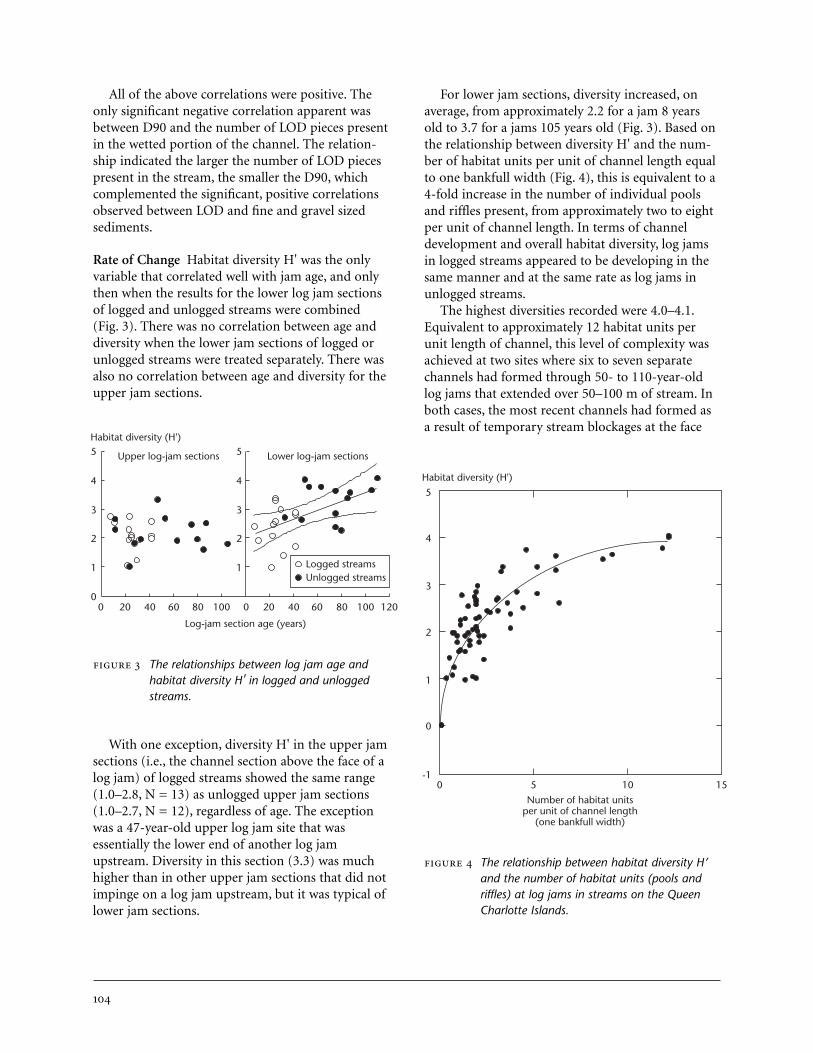
The relationship between habitat diversity H’and the number of habitat units (pools andriffles) at log jams in streams on the QueenCharlotte Islands.
104
The relationships between log jam age andhabitat diversity H' in logged and unloggedstreams.
For lower jam sections, diversity increased, onaverage, from approximately 2.2 for a jam 8 yearsold to 3.7 for a jams 105 years old (Fig. 3). Based onthe relationship between diversity H' and the num-ber of habitat units per unit of channel length equalto one bankfull width (Fig. 4), this is equivalent to a4-fold increase in the number of individual poolsand riffles present, from approximately two to eightper unit of channel length. In terms of channeldevelopment and overall habitat diversity, log jamsin logged streams appeared to be developing in thesame manner and at the same rate as log jams inunlogged streams.
The highest diversities recorded were 4.0–4.1.Equivalent to approximately 12 habitat units perunit length of channel, this level of complexity wasachieved at two sites where six to seven separatechannels had formed through 50- to 110-year-oldlog jams that extended over 50–100 m of stream. Inboth cases, the most recent channels had formed asa result of temporary stream blockages at the face
All of the above correlations were positive. Theonly significant negative correlation apparent wasbetween D90 and the number of LOD pieces presentin the wetted portion of the channel. The relation-ship indicated the larger the number of LOD piecespresent in the stream, the smaller the D90, whichcomplemented the significant, positive correlationsobserved between LOD and fine and gravel sizedsediments.
Rate of Change Habitat diversity H' was the onlyvariable that correlated well with jam age, and onlythen when the results for the lower log jam sectionsof logged and unlogged streams were combined(Fig. 3). There was no correlation between age anddiversity when the lower jam sections of logged orunlogged streams were treated separately. There wasalso no correlation between age and diversity for theupper jam sections.
With one exception, diversity H' in the upper jamsections (i.e., the channel section above the face of alog jam) of logged streams showed the same range(1.0–2.8, N = 13) as unlogged upper jam sections(1.0–2.7, N = 12), regardless of age. The exceptionwas a 47-year-old upper log jam site that wasessentially the lower end of another log jamupstream. Diversity in this section (3.3) was muchhigher than in other upper jam sections that did notimpinge on a log jam upstream, but it was typical oflower jam sections.
0
1
2
3
4
5
Log-jam section age (years)
Upper log-jam sections Lower log-jam sections
1
2
3
4
5
0 20 40 60 80 100 0 20 40 60 80 100 120
Logged streamsUnlogged streams
Habitat diversity (H')
0 5 10 15-1
0
1
2
3
4
5
Number of habitat unitsper unit of channel length
(one bankfull width)
Habitat diversity (H')

105
Habitat diversity H’ in torrented logged andunlogged streams.
of the jam. The blockages occurred when gulliesupstream of the jams torrented and deposited a newlayer of debris on the face of the jams. Estimated ageof the torrents based on the age of the aldersgrowing above the jams was 24–28 years.
Most of the jams inspected with their large com-plex of side channels were clearly permanent orpersistent features, with ongoing side channel devel-opment as a result of periodic debris and sedimentblockages or breaches on a relatively wide section ofthe floodplain. As new channels were formed, accu-mulations of old debris from even older log jamswere occasionally exhumed out of the floodplain.
Three jams were simpler, more temporarylooking structures with possibly only one relic sidechannel. The log jams were concentrated over ashort section of the channel, with little or no LODevident other than what was originally deposited atthe site, plus some windthrown trees. The latter mayhave formed the original obstruction, or were addedlater when the log jam formed and increased localbank erosion. In all three cases, the stream wasconfined to a narrow channel with little or nofloodplain. With little opportunity to flow aroundthe jam, the stream had little recourse but to flowover the jam, eventually breaching it. With nosubsequent debris deposits to block the channelagain, there was never a reason for the stream toseek a new course.
Torrented Streams Diversity H' in small torrentedstreams was highest (2.3–2.8) in a stream that hadLOD added to the channel 8 years previously(Fig. 5). Elsewhere, diversity was 0.0–2.0 in recentlytorrented logged streams, and 1.0–2.1 in oldtorrented, unlogged streams.
The habitat in small, torrented streams withoutlog jams was much more uniform than in streamswith log jams. There was also little indication thatthe complexity of these channels changes very muchover time. The main habitat characteristics ofrecently torrented, logged stream reaches (smallpools and long riffles, little LOD, a streambedarmoured with boulders) were still very evident inold (69–75 years) unlogged torrented streams.
0 20 40 60 80 100 1200
1
2
3
4
5
Debris torrent age (years)
Habitat diversity (H')
Logged streams
Unlogged streams
Logged streams,LWD added 8 yearspreviously
Discussion
Logged versus Unlogged Log Jams There were nodifferences between the habitat at log jams in loggedand unlogged streams that could not be attributedto differences in stream size or log jam age. In parti-cular, the habitat upstream of the face of the log jamswas very similar in logged and unlogged streams. Oneof the few measurable differences was a decrease inthe average size of the LOD pieces present. This wascompensated for by an increase in the number ofLOD pieces. As a result, total LOD volumesremained similar, as did other key habitat character-istics such as wetted area, pool depth, substratecomposition, bank cover, and deep water cover.Percent pool area was greater above log jams inunlogged streams than in logged streams, but thismay be attributable to the fact that unlogged streamjams had twice the time (27 vs. 54 years) to scourout the gravel accumulated in front of the log jam.

106
Most log jams are a combination of debris fromthe riparian zone and the hillslopes. Log jamstherefore represent points where the stream, riparianzone, and hillslopes are linked together. In thissurvey, large trees from the riparian zone werefrequently observed at the core of a log jam, andwere probably partly responsible for halting thedebris flows from the adjacent hillside or gully oncethe debris flow entered the stream. If the streamchannel is more or less completely blocked off bythe original log jam, or by later debris deposits fromsubsequent gully failures, more trees will inevitablybe recruited from the riparian zone as the streamseeks a new course through or around the jam.
Jam Morphology An old log jam in an unconfined,unlogged stream typically has one channel upstreamof the face of the jam and several channelsdownstream. Above the jam, the habitat is oftendominated by one or two pool/riffles sequences overa distance equivalent to five channel widths. Eachpool and riffle combination therefore tends to belarge in terms of surface area covered. The pools,which often have a sharp drop out at the head of thepool but a long, shallow tail, are also often thedeepest pools associated with the jam. Partly this isbecause the build-up of gravel in front of the logjam allows for a greater depth of scouring thanwould be the case if the substrate were composed ofmore resistant materials (i.e., boulders); and partly itis because the stream’s energy is still concentrated inone channel.
Deep water and low, rooted undercut banksconstitute most of the cover upstream of the logjam. If it is present, LOD tends to be composed ofrelatively few, but very large, pieces in the mainpools above the jam, with smaller pieces confined tothe margins of the pools. A large, smooth gravel baris frequently present between these pools and theface of the jam. The face of the main jam itself fre-quently has a line of bare, recently deposited woodydebris plastered up against the main members of thejam. The face of the jam is otherwise obscured by aheavy growth of alders. The stream channel istypically deflected to one side.
Below the face of the jam, the habitat can be amaze of logs and channels, separated by islands ofdebris or flat alluvial deposits, all overgrown with acomplex assortment of mosses, grass, shrubs, variousage alders, and young conifers. In this study, the
Downstream, below the face of the log jams,unlogged stream log jams had more habitat thanlogged stream log jams because they also had agreater number of side channels and thus morewetted area and more pools. The greater number ofside channels is attributable to the greater age of thejams, which allowed time for more slope failures,debris torrents, and major floods to apply anotherlayer of debris to the jam and force the stream toseek new channels or reactivate old channels.
The absence of any major differences in habitatnot attributable to age differences at log jams inlogged and unlogged streams agrees with earlierfindings on the habitat characteristics of logged andunlogged streams on the Queen Charlotte Islands. Ina synoptic survey of 33 logged, unlogged, anddebris-torrented (logged) stream reaches (Tripp andPoulin 1992), debris-torrented streams stood out instark contrast to non-torrented stream reaches(logged or unlogged). By comparison, logged andunlogged streams differed only in the amount ofundercut bank cover present (logged streams hadless). Logged stream reaches had less LOD, but notsignificantly so.
Log Jam Formation Debris for log jams in streamscan come from the riparian zone as windfalls orundercut trees, or from the adjacent slopes as debristorrents or slides. Field observations suggest that logjams derived exclusively from debris in the riparianzone tended to be dominated by large intact treeswith the root wads still attached. With relativelyfewer small pieces of debris, the jams were moreopen and therefore relatively permeable to water andbedload movements downstream. They alsoextended over relatively short lengths of stream.
Log jams that were the result of a slide or debristorrent into the stream were mainly made up ofbroken or shattered stems and branches that knittedtogether more readily than large intact trees during aflood event. Log jams made of debris from torrentsor slides, in combination with a large volume of newsediments, were therefore more likely to form animpenetrable mass that would block stream flowsand deflect them elsewhere to form another channel.Subsequent additions of debris and sediment to theface of the jam have resulted in the formation ofadditional channels, or greater flows in some of theolder channels, none of which are likely to disappearas long as the log jam is present.

107
length of channel occupied by the jam often extendedto five channel widths downstream, at which pointthe side channels in the jam had usually coalesced toform a single channel again. Sometimes the distancebetween jams was less than five channel widths.
Log Jam Function The results of this study showthat wetted area and wetted volume were signifi-cantly greater downstream below the face of a jam,logged or unlogged. Since a difference in watervolume implies a greater transit time, log jamsdissipate the kinetic energy of streams and slow themovement of water and bedload materialsdownstream. This supports similar findings byothers on the role of LOD in a stream (e.g., Keller etal. 1981; Swanson and Lienkaemper 1978), but on alarger scale.
In streams like Carnation Creek on VancouverIsland, the off-channel habitats and tributary streamsthat are often located on wide, low-gradient flood-plains are an important refuge for fish, away fromother fish and floods in the mainstem (Bustard andNarver 1975; Hartman and Brown 1987). Manystreams, however, do not have floodplains of anysignificance, and thus much less off-channel habitatfor fish. In streams confined between steep hillsides,the log jams that are created as a result of repeateddebris torrents or slides into the mainstem stream maymore than offset the shortage of off-channel habitats.
By dividing up stream flows into several channels,log jams increase the gravel area covered by water.The amount of spawning habitat available to fish istherefore increased, even though the total volume ofgravel present may be greater above log jams.Divided stream flows also increase total wetted areaand thus the area for rearing fish. Numbers of fishper unit wetted area may remain the same (Hartmanet al., this volume), but numbers of fish per unit ofchannel length can be greatly increased. Finally,dividing up the stream into several channels —somewith a cap of LOD at the face of the jam and othersfree-flowing—should also reduce overall egg orjuvenile losses resulting from excessive gravel scouror flooding, because flows in some channels areprobably less severe than in others.
Management Implications If a log jam in a fish-bearing stream is dependent on gully failures besidethe stream for creating, maintaining, or enhancingthe complexity of the jam, then timber management
practices need to reflect this fact. They also need torecognize that periodic gully failures are normal, andpossibly a critical means of maintaining or increas-ing the number of side channels in many log jams.In turn, more side channels at log jam sites translateinto a greater ability to buffer gravel and water move-ments downstream, more spawning habitat, morerearing habitat, and ultimately greater productivity.
Current logging practices recognize the impor-tance of careful logging around gullies so that therate of gully failures in a watershed is not accelerated.Gullies were frequently logged in the past withoutregard to their role in watershed sediment budgets. Asa result, many failed, greatly increasing the amount ofsediment and debris in streams (Rood 1984).
Present-day prescriptions for logging aroundgullies usually require that timber be felled andyarded away from the gully, and that any debrisintroduced be removed concurrent with logging(Tripp 1995). This may reduce the frequency of gullyfailures, though if debris clean-up is too zealous,sediment movements downstream may still be accel-erated, but without a debris component. Harvestingthe timber in gullies should reduce the rate at whichgullies are recharged with debris. However, byeliminating an important source of debris to thestream, it should also alter how log jams evolve tobecome more complex and productive.
Torrented Streams The habitat of small streamsdirectly affected by the passage of a debris torrent isless dynamic than the habitat of large streamsaffected by a debris torrent deposit. Presumably thedifference is attributable to differences in streamenergy and thus the stream’s ability to move debrisand bedload. Recovery as a result may be very slowin directly affected reaches of small streams. Thoughthe sample size for unlogged streams in this studywas very small (two streams), the habitat conditionspresent in small, unlogged stream reaches affectedby debris torrents 69–75 year ago suggest that therewill be little further change in the habitat of small,logged streams affected 11 years ago.
Summary
The principal objectives of this research were todetermine the fish habitat characteristics of log jamsformed by mass wasting in unlogged streams, howthese characteristics changed over time, and if log

108
jams in logged streams show similar types and ratesof change. Debris transport zones in fish-bearingstreams were also examined, though few such sitesin unlogged streams were located.
At log jam sites, fish habitat varied more aboveand below the jams than between jams in loggedand unlogged reaches. Rates and patterns of changealso appeared to be similar between logged andunlogged streams, though no sites with loggingolder than 42 years were sampled. Longer termchanges in habitat structure of log jams in loggedstreams could therefore not be assessed. Increases inlog jam complexity appear to be dependent onperiodic additions of new debris, which may or maynot be as available in logged streams as it is inunlogged streams. In debris torrent transport zoneslacking log jams, the habitat at all sites was muchmore uniform. There was also little differencebetween logged sites 11 years old and unlogged sties69–75 years old.
References
Bisson, P.A., J.L. Nielsen, R.A. Palmason, and L.E.Grove. 1982. Stream habitat definition 1.Summer low flow habitats and their utilizationby salmonid fishes. In Proc. Symp. onAcquisition and Utilization of Aquatic HabitatInventory Information. West. Div. Am. Fish.Soc., Portland, Oreg.
Bustard, D.R. and D.W. Narver. 1975. Aspects of thewinter ecology of juvenile coho salmon(Oncorhynchus kisutch) and steelhead trout(Salmo gairdneri). J. Fish. Res. Board Can.32(5):667–680.
Hartman, G.F. and T.G. Brown. 1987. Use of small,temporary, flood plain tributaries by juvenilesalmonids in a west coast rain-forest drainagebasin, Carnation Creek, British Columbia.Can. J. Fish. Aquat. Sci. 44:262–270.
Hogan, D.L. 1986. Channel morphology ofunlogged, logged, and debris torrented streamsin the Queen Charlotte Islands. B.C. Min. For.Lands, Victoria, B. C. Land Manage. Rep. 49.
_____. 1989. Channel response to mass wasting inthe Queen Charlotte Islands, British Columbia:temporal and spatial changes in streammorphology. In Proc. Conf. on Watersheds ’89:Stewardship of Soil, Air and Water Resources,Juneau, Alaska, March 21–23, 1989. U.S. Dep.Agric. For. Serv., Alaska Region, R10-MB-77,pp. 125–144.
Keller, E.A., A. MacDonald, and T. Tally. 1981.Streams in the coastal redwood environment:the role of large organic debris. In Proc. Symp.on Watershed Rehabilitation in RedwoodNational park and Other Coastal Areas,Binghampton, N.Y., Sept. 21–22, 1979. R.N.Coates (editor). Kendall/Hunt Publishing Co.,pp. 161–176.
Lloyd, M., J.H. Zar, and J.R. Karr. 1968. On thecalculation of information-theoreticalmeasures of diversity. Am. Midland Natur.79:257–272.
Rood, K.M. 1984. An aerial photography inventoryof the frequency and yield of mass wasting onthe Queen Charlotte Islands, B.C. B.C. Min.For., Victoria, B.C. Land Manage. Rep. No. 34.
Swanson, F.J. and G.W. Lienkaemper. 1978. Physicalconsequences of large organic debris in PacificNorthwest streams. U.S. Dep. Agric. For. Serv.,Gen. Tech. Rep. PNW-56.
Tripp, D.B. 1995. The use and effectiveness of theCoastal Fisheries-Forestry Guidelines in theChilliwack and Mid-Coast Forest Districts ofcoastal British Columbia. Tripp BiologicalConsultants Ltd. report to B.C. Min. For.,Integr. Resources Br., Victoria, B.C.
Tripp, D.B. and V.A. Poulin. 1986. The effects ofmass wasting on juvenile fish habitats instreams on the Queen Charlotte Islands. B.C.Min. For. Lands, Victoria, B.C. Land Manage.Rep. No. 45.
_____. 1992. The effects of logging and masswasting on juvenile salmonid populations instreams on the Queen Charlotte Islands. B.C.Min. For. Lands, Victoria, B.C. Land Manage.Rep. No. 80.

109
Introduction
The process of scour and fill in rivers is the key linkbetween sediment transport and net morphologicalchange in channels. Scour and fill are the results ofsediment transport events, where the level of stream-flow controls the magnitude of transport. In specificlocations in a channel, differences in the amount ofscour and fill over time lead to net change inchannel morphology.
Effective management of fishery resources withinrivers requires an understanding of the relationbetween stream discharge and scour and fill. Thedirect link that exists between magnitude of scourdepth and the loss of anadromous fish eggs under-scores the need to understand and predict scourdepths. The degree of impact is determined by acombination of the vertical distribution of fish eggs,which varies by species, and the depth of scour,which may be achieved by a single large-magnitudeflood event or by the cumulative effect of numerousevents over an entire flood season.
The purpose of this paper is to examine depths ofscour and fill in coastal streams. The specific aimsare: 1) to evaluate whether scour and fill depths canbe modelled by a specific mathematical function;2) to establish relations of stream discharge todepths of scour and fill; and 3) to examine relationsof scour depths on a regional basis. Establishment ofthese relations could aid in decision-making relatedto fishery and forestry resources, by providing ameans to predict depths of scour and fill in specificstreams or within defined regions.
Study Areas
Twelve gravel-bed streams (Table 1) were selectedfor investigation of scour depths from the detailedphase of the Fish/Forestry Interaction Programcompleted in the Queen Charlotte Islands (Tripp
and Poulin 1986). Six of the streams are located onthe west and southwest coasts of Graham Island; theremaining six are found on the northeast coast ofMoresby Island (see Figure 1 in Tripp and Poulin[1986] for location map). The physical character-istics of the streams on the Queen Charlotte Islandsspan a range of basin areas, study reach gradients,and surficial sediment sizes (Table 1). CarnationCreek, on the west coast of Vancouver island, drainsa relatively small basin over a relatively gentlegradient (Table 1). The most detailed studies ofscour and fill were conducted in this stream. Surfacesediments in the channel exhibit a median particlesize of 47 mm, which is in the lower range ofsediment sizes of the streams studied (Table 1).
Study reaches selected within each basin typicallybegin at the mouth and extend upstream for dis-tances up to 900 m (Table 1). In Carnation, Tarundl,Bonanza, and Riley creeks, the downstream boun-dary is displaced upstream from the basin mouth,but these distances do not exceed 6 km. These lowersegments of coastal river basins are typically used byanadromous fish for spawning and rearing habitat.The study reach in Carnation Creek encompassesstudy areas 6, 7, and 8 established for the CarnationCreek experimental program (see Figure 1 inScrivener [1987] for study area locations).
Methods
Scour monitors and chains were used to measurescour and fill depths. Scour monitors are construc-ted from 100 kg test fishing line strung with 4 cmdiameter perforated plastic balls tied off by aweighted base at one end and a plastic disk at theother. Metal chains with 4 cm long links, weighted atthe one end, compose the scour chains. Themonitors and chains are collectively referred to asscour indicators because comparable data are
Channel Scour and Fill in Coastal Streams
J K. H

110
derived from both types. The scour depth measuredby an indicator is a maximum depth at the locationof the indicator. The fill measured is a net depthbecause sediment deposition in the channel could betransient over the extent of a flood event.
Indicator length and the depth of a vertical inser-tion into the channel bed determine the maximumdepth of scour that can be measured by an indicator.In Carnation Creek, the leading edge of theindicators reached a depth of 1 m in most cases, butin the streams of the Queen Charlotte Islands amaximum of 38 cm was achieved, in part due to thedifficulty of driving indicators into the coarsesediment. The 38 cm upper limit of measurementwas reached, and most likely exceeded, at 121 of theindicators by the end of the study period. Therefore,calculated mean scour depths are underestimates forsome of the streams.
In both studies, scour indicators were positionedalong channel cross-sections. In the streams on theQueen Charlotte Islands, three scour indicators werepositioned in the low-flow channel of transects that
crossed the transition from pool to riffle in thechannel bed morphology. Individual streams wereinstrumented with 18–30 indicators (Table 1).Collectively, the streams on the Queen CharlotteIslands contain 288 indicators. Scour monitors andchains the Carnation Creek were spaced alongchannel cross-sections at a 2-m interval across thefull bank-to-bank width, and the cross-sections werepositioned in pool and riffle areas. Over 100indicators were installed in the study reach ofCarnation Creek.
In Carnation Creek, scour indicators wererecovered 15 times during the winter flood seasonsof 1991–92 and 1992–93. These data characterizedepths of scour and fill associated with individualflooding periods, and have peak magnitudes rangingfrom 4 to 49 m3s -1. The maximum flood peak isused as an index when more than one flood eventoccurred during a flooding period. Recovery ofscour indicators in the 12 streams of the QueenCharlotte Islands occurred twice, so scour depthscharacterize the maximum depths achieved over two
Characteristics of study streams
SedimentBasin Reach Reach median Numberarea % length gradient diameter of scour
Stream (km2) loggeda (m) (%) (mm) indicators
Carnation Creek 11 61 900 0.9 47 108
Queen Charlotte Islands 288
Bonanza Creek 47 13 311 0.9 50 18
Haans Creek 29 43 312 1.0 48 18
Hangover Creek 21 – 400 0.7 71 18
Macmillan Creek 6 77 680 3.1 68 30
Miller Creek 22 3 660 3.1 67 18
Piper Creek 4 10 806 2.2 55 30
Riley Creek 29 12 247 1.5 72 18
Sachs Creek 18 62 500 0.8 46 18
Saltspring Creek 6 13 292 3.5 72 30
Schomar Creek 7 36 507 2.1 47 30
Southbay Dump Creek 4 82 260 3.7 60 30
Tarundl Creek 11 37 473 4.0 43 30
Data for streams on the Queen Charlotte Islands extracted from Table 2 in Tripp and Poulin (1986).a Percent at time of study.

111
time periods: late October to early December 1983and late October to late February 1984. Scour depthsfor the December to February period were derivedby subtracting the depths observed during the firstrecovery from those observed over the completestudy period. The absence of detailed hydrologicalrecords for the study streams prevents a direct assess-ment of scour depths as they relate to magnitude offlood events. The stream gauging station on nearbyPremier Creek, however, indicates that several floodsoccurred within each measurement period.
Evaluation of scour and fill involved constructingfrequency distributions of scour and fill depths andthen fitting negative exponential functions to theseempirical distributions. Model parameters werederived using a Newton-Raphson iterative proce-dure, with data grouped by a 4-cm interval. Theexponential model was selected for use because it issuccessful in describing empirical observations formanother technique used to estimate scour and filldepths: magnetically tagged stones (Hassan andChurch 1994). The Cramér-von Mises goodness-of-fit statistic, specifically adapted for an exponentialfunction when parameter estimation derives fromempirical grouped data (J. Spinelli, pers. comm.,1994), was used to assess how well exponentialmodels depict the empirical frequency distributions.This statistic compares theoretical cumulativefrequency distributions for the models to observed
cumulative frequency distributions. The relations ofmean depths of scour and fill to flood peak dis-charge were established using functional analysisrather than regression analysis (Mark and Church1977), because the assumption of an error-freeindependent variable cannot be supported (Neteret al. 1982).
Results
Exponential Models of Scour and Fill DepthsFrequency distributions of scour and fill depths forfive representative flooding periods that occurredduring the field seasons in Carnation Creek aredescribed in general by exponential functions(Table 2). Statistical results indicate that only the filldistributions for the 12.7 and 21.8 m3s-1 events aredifferent at the 0.05 significance level. For each floodpeak magnitude, model parameters for scour and filldepths are comparable, with the largest difference of0.09 obtained in the 21.8 m3s-1 flood event (Fig. 1).As flood peak discharge increases over the range ofdischarge magnitudes, the slope of the relationsdecreases (Table 2). Thus, the range of depths notedincreased, as illustrated by the maximum depth ofscour and fill measured for these representativeflood events (Table 2). This is true for both scourand fill relations.
Exponential models for scour and fill depths for representative flood events in Carnation Creek
Flood peakmagnitude Number of Maximum Model W2
(m3s-1) Relation indicators depth (cm)a parameter probabilityb
5.7 Scour 108 10 0.62 0.66Fill 108 10 0.70 0.98
12.7 Scour 105 10 0.54 0.89Fill 105 14 0.46 0.01c
21.8 Scour 108 18 0.28 0.75Fill 108 22 0.19 0.02c
33.9 Sour 108 38 0.16 0.27Fill 107 50 0.11 0.68
48.8 Sour 108 98 0.064 0.17Fill 107 62 0.067 0.66
a Mid-point value of the largest category of depths where an observation was recorded.b The Cramér-von Mises (W2) statistic was used to evaluate differences between observed and theoretical distributions.c Statistically different at the 0.05 significance level.
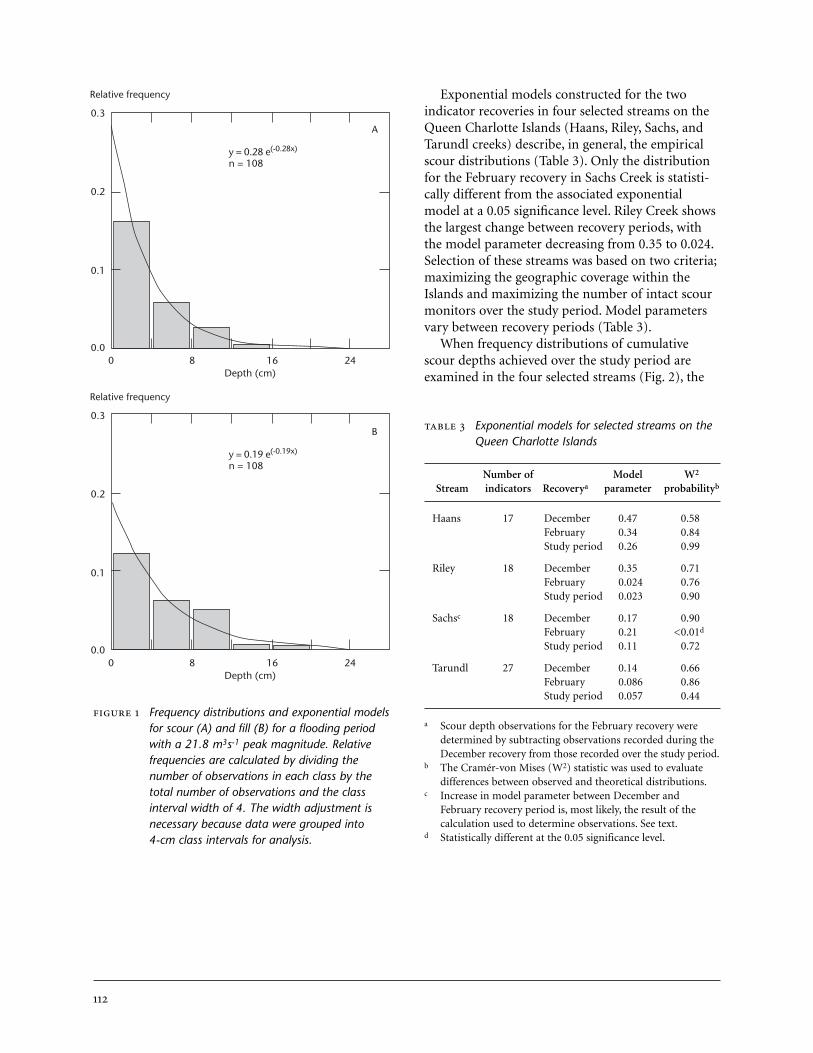
112
Frequency distributions and exponential modelsfor scour (A) and fill (B) for a flooding periodwith a 21.8 m3s-1 peak magnitude. Relativefrequencies are calculated by dividing thenumber of observations in each class by thetotal number of observations and the classinterval width of 4. The width adjustment isnecessary because data were grouped into4-cm class intervals for analysis.
Exponential models constructed for the twoindicator recoveries in four selected streams on theQueen Charlotte Islands (Haans, Riley, Sachs, andTarundl creeks) describe, in general, the empiricalscour distributions (Table 3). Only the distributionfor the February recovery in Sachs Creek is statisti-cally different from the associated exponentialmodel at a 0.05 significance level. Riley Creek showsthe largest change between recovery periods, withthe model parameter decreasing from 0.35 to 0.024.Selection of these streams was based on two criteria;maximizing the geographic coverage within theIslands and maximizing the number of intact scourmonitors over the study period. Model parametersvary between recovery periods (Table 3).
When frequency distributions of cumulativescour depths achieved over the study period areexamined in the four selected streams (Fig. 2), the
Exponential models for selected streams on theQueen Charlotte Islands
Number of Model W2
Stream indicators Recoverya parameter probabilityb
Haans 17 December 0.47 0.58February 0.34 0.84Study period 0.26 0.99
Riley 18 December 0.35 0.71February 0.024 0.76Study period 0.023 0.90
Sachsc 18 December 0.17 0.90February 0.21 <0.01d
Study period 0.11 0.72
Tarundl 27 December 0.14 0.66February 0.086 0.86Study period 0.057 0.44
a Scour depth observations for the February recovery weredetermined by subtracting observations recorded during theDecember recovery from those recorded over the study period.
b The Cramér-von Mises (W2) statistic was used to evaluatedifferences between observed and theoretical distributions.
c Increase in model parameter between December andFebruary recovery period is, most likely, the result of thecalculation used to determine observations. See text.
d Statistically different at the 0.05 significance level.
0.3
Relative frequency
Depth (cm)0 8 16 24
0.2
0.1
0.0
A
y = 0.28 e(-0.28x)
n = 108
0.3
Relative frequency
Depth (cm)0 8 16 24
0.2
0.1
0.0
B
y = 0.19 e(-0.19x)
n = 108

113
Frequency distributions and exponential models for four selected study streams in the Queen Charlotte Islands.Scour depths are cumulative depths for the complete study period (about 4 months). Relative frequencies arecalculated by dividing the number of observations in each class by the total number of observations and theclass interval width of 4. The width adjustment is necessary because data were grouped into 4-cm class intervalsfor analysis. Data derived from scour monitors that were eroded from the streambed during the study period areindicated by the greater-than-and-equal-to symbol.
exponential model adequately fits these distributionsat the 0.05 significance level (Table 3). The range inmodel parameters is illustrated by comparing RileyCreek, with a parameter of 0.023, to Haans Creek,with a parameter of 0.26. Thus, these four creeksscoured to different degrees within each recoveryperiod and over the seasonal study period.
Stream Discharge and Depths of Scour and FillPower functions relating mean scour and fill depthto flood peak magnitude were established, based onall available indicator recoveries in Carnation Creek(Fig. 3). Both mean scour and mean fill increasewith flood magnitude as expected. Coefficients ofdetermination for the linearized relations are 0.86
0.3
Relative frequency
Depth (cm)0 8 16 24 32 40
0.2
0.1
0.0
y = 0.26 e(-0.26x)
n = 17
Haans Creek
0.3
Relative frequency
Depth (cm)0 8 16 24 32 40
0.2
0.1
0.0
y = 0.11 e(-0.11x)
n = 18
Sachs Creek
0.3
Relative frequency
Depth (cm)0 8 16 24 32 40
0.2
0.1
0.0
y = 0.023 e(-0.023x)
n = 18
Riley Creek
0.3
Relative frequency
Depth (cm)0 8 16 24 32 40
0.2
0.1
0.0
y = 0.057 e(-0.057x)
n = 27
Tarundl Creek
≥

114
area—evaluated in an attempt to establish predictiveregional relations.
In the relation between seasonal scour depth andstudy reach gradient (Fig. 4a), mean depths rangefrom 0.7 to 34 cm in an unsystematic manner withgradient. The mass wasting classification for streams,based on proximity and degree of mass wasting tothe study reach within basins (Tripp and Poulin1986), fails to resolve the scatter in the relation, inpart because of the small sample size for eachcategory. A stream with little or no mass wastingevidence may have relatively large mean scour, evenin a moderate gradient reach. Furthermore, a streamclassified into the second category of mass wastingwith similar reach gradient may experience a meanscour depth of about 7 cm or sometimes nearly30 cm (Fig. 4a).
and 0.96 for scour and fill, respectively. Confidencelimits constructed for the slopes of the two relationsindicate that they are not statistically different at the0.05 significance level. Hence, the relations of meanscour depth to flood peak magnitude and mean filldepth to flood peak magnitude are similar.
Regional Relations
Mean Scour Depths Regional relations require iden-tification of river basin and channel characteristicsthat control scour depth in channels. Tripp andPoulin (1986) reported both mass wasting historyand study reach gradient as being factors thatexplain larger values of scour depths in the streamson the Queen Charlotte Islands. These data arebeing further examined and another factor—basin
Power function relations of mean scour (A) and mean fill (B) to flood peak magnitude in Carnation Creek. Dataanalysis included scour indicator recoveries completed over two winter flood seasons.
100
Mean depth (cm)
Flood peak discharge (m3s-1)1 10 100
10
1
0.1
100
Mean depth (cm)
Flood peak discharge (m3s-1)1 10 100
10
1
0.1
A B
y = 0.012 x1.8y = 0.026 x1.6

115
Most streams align within the lower left corner ofthe relation between seasonal mean scour depth andbasin area (Fig. 4b). Three of the four streams withmass wasting evidence in the study reach have smallbasin areas and relatively large mean scour depths.The three points that deviate substantially from thistrend represent the streams located in RennellSound, where relatively large mean scour depths inthe channels are produced in relatively large basins.
Regional Frequency Distribution A regionalfrequency distribution of seasonal scour depths wasconstructed by combining results from the 12 studystreams on the Queen Charlotte Islands. The streamswere made comparable by using the mediandiameter of the channel surface sediment of eachstream as a scaling factor for scour depth observa-tions (Fig. 5). This distribution of seasonal scourappears exponential in form. The right portion ofthe distribution beginning at a ratio of 5 reflects themaximum depth of 38 cm that could be recorded bysome of the scour indicators. The goodness-of-fitstatistic, which incorporates this largest depth classas the right tail of the distribution, indicates that theexponential model adequately fits the empiricaldistribution at a significance level of 0.01.
Discussion
Frequency distributions of scour and fill depths forCarnation Creek and streams on the QueenCharlotte Islands illustrate that, for a particularflooding period or over a flood season, the channelis scoured and filled over a range of magnitudes.These frequency distributions can be modelled bynegative exponential functions. Scour and fillmodels for a particular flood exhibit similar modelparameters, which indicate that a balance existsbetween the amount of sediment scoured and filledover the study reach. The systematic inverse relationbetween model parameters and discharge levelshows that the channel is scoured and filled moredeeply with increasing flow levels, as expected.Empirical observations confirm that the maximumdepth measured, and thus the absolute range ofdepths, increases as discharge level increases. Thus,greater amounts of mobilized sediment occur withlarger flow levels, which results in the increasedlikelihood for changes in channel morphology andassociated sediment size distributions in river chan-nels. Difference in parameters of the exponential
Relations of seasonal mean scour depth tostudy reach gradient (A) and basin area (B).Streams are classified by consideration of theproximity and degree of mass wasting to thestudy reach. Mass wasting category symbolsare: ■ little or no mass wasting evidence in thestream; ● mass wasting evidence upstream ofthe study area; and ▲ mass wasting evidencewithin the study reach.
40
(a) Mean scour depth (cm)
Reach gradient (%)0 1 2 3 4 5
30
0
A
20
10
40
(b) Mean scour depth (cm)
Basin area (km2)0 1 2 3 4 5
30
0
20
10
B

116
models portray the varied behaviour of streams onthe Queen Charlotte Islands, a relatively smallgeographic area. In these exponential models thedifferences reflect, in part, the sharp precipitationgradient that exists in the Queen Charlotte Islandsdue to topographic influences.
Mean depth versus flood peak magnituderelations indicate that predictive relations for scourand fill based on streamflow are possible. InCarnation Creek, the functional form of theserelations is a power function, which gives rise to anincrease in mean depth of approximately 2 times,with a unit increase in flood peak discharge.Furthermore, the similarity in the exponents of therelations suggests that the channel within the studyreach of Carnation Creek is scouring and filling atthe same magnitude, and hence no systematicaggradation or degradation occurred over the studyperiod. Development of explicit relations betweenmean depth and flood peak magnitude in otherstreams requires empirical observations.
The relation between mean scour and reachgradient is not yet firmly established, given thescatter exhibited in these limited data. The relationbetween mean scour depth and basin area suggeststhat the size of river basin may index the potentialfor large magnitudes of scour when mass wasting isactive because small basins are most directlyinfluenced by mass wasting processes. Moreover,large basins can experience large mean values ofsour, given a relatively large input of precipitation asa result of geographic location, as evidenced by thethree study streams located in Rennell Sound. Asimilar adjustment would be expected in other areaswith definable precipitation subregions.
The collapse of frequency distributions of scourdepth from individual streams into a regionalfrequency distribution demonstrates that channelsediment size and the structural tightness of surfaceparticles play an important role in controlling scourdepth. Given an adequate collection of rivers in aregion and a statistically sound sample of scourindicators, a regional distribution of scour depthswould most likely be exponential in form, asindicated by the analysis of scour that occurred thatoccurred in Queen Charlotte Islands streams. Thebimodal nature of the observed distribution resultsfrom the measurement limitation of scour indicatorsused in the streams on the Charlottes.
Application to Management For the effectivemanagement of fishery and forestry resources, it isencouraging for prediction purposes that frequencydistributions of scour and fill depths can bedescribed by a single mathematical function. Ifmean scour or fill depths are known or can beestimated (for example, from discharge estimates),an exponential function depicting the frequencydistribution could be generated to determine theproportion of a channel scouring to a definedthreshold depth where critical loss of anadromousfish eggs would occur. Furthermore, prediction ofcumulative scour depth for a flood season composedof a particular sequence and magnitude of floodevents could be achieved by deriving exponentialmodel parameters for specific flood peaks from arelation between mean scour and flood peakmagnitude. These mean values serve as parametersin exponential models for predicting scour and filldepths associated with individual flood events.Determining the seasonal effect could be achieved
Regional frequency distribution and associatedexponential model of seasonal scour depthsthat occurred over the study period. Mediandiameter characterizes channel surface sedi-ment. Ratio values beginning at 5 are affectedby the limitation of scour indicator length.
0.7
Relative frequency
Scour depth/median diameter0 1 2 3 4 5 6
0.5
0.3
0.1
y = 0.16 e(-0.16x)
n = 279
0.0
0.2
0.4
0.6
≥

117
by summing individual exponential distributions.Thus, various flood season scenarios could begenerated for planning purposes.
It would also be useful for management if predi-ctions of scour and fill could be made on a regionalbasis. Overall, the attempts at regional relationsemphasize that such relations depend on thedefinition of precipitation subregions (and thushydrology) and of the physical parameters of riverbasins, such as basin area, channel gradient,sediment character, and historical evidence of masswasting. These parameters are, in general, obtainablefrom maps, aerial photographs, and reconnaissancefield work. If an integrated regional predictiverelation could be established, streams could beevaluated from this relation based on individualcharacteristics and preliminary assessments—allwith relatively minimal effort and expense. Themajor limitation of this work for management is theneed for empirical observations with which todevelop the relations.
Summary
Distributions of scour and fill depths can be describ-ed by negative exponential functions in CarnationCreek and the streams on the Queen CharlotteIslands. Thus, the exponential model appears to begenerally applicable for coastal streams, whetherscour results from single or numerous flood events.The models behave in a predictable manner based onflood peak magnitude, which suggests they may beintegrated into management decision-makingprocedures. The observed differences in scour in theQueen Charlotte Islands streams indicate that bothregional hydrology and state of the channel bedaffect scour depth, and that further study is requiredbefore a general predictive scour model can bedescribed. In the meantime, scour and fill modelscan be elaborated for particular streams based onobservations in the streams. Applied on a seasonalbasis, this has the potential to aid enhancementefforts in coastal streams that serve as anadromousfish habitat.
Acknowledgements
Data from the Queen Charlotte Islands weresupplied by D. Tripp. Field work was conducted byB. Eccles and C. Rally. The research in CarnationCreek is funded by a National Science andEngineering Research Council of Canada grantawarded to M. Church. The B.C. Ministry of Forestsprovides logistical support by operating theCarnation Creek field station. A. Collett, B. Eaton,K. Trainor, M. Oden, and S. Tsang assisted with fieldwork at Carnation Creek.
References
Hassan, M.A. and M. Church. 1994. Vertical mixingof coarse particles in gravel bed rivers: akinematic model. Water Resources Res.30:1173–1185.
Mark, D.M. and M. Church. 1977. On the misuse ofregression in earth science. Math. Geol.9:63–75.
Neter, J., W. Wassermann, and G.A. Whitmore. 1982.Applied statistics. Allyn and Bacon, Inc.,Boston, Mass.
Scrivener, J.C. 1987. The Carnation Creekexperimental watershed project. A descriptionand history from 1970 to 1986: applying 15years of Carnation Creek results, CarnationCreek Steering Committee, Pac. Biolog. Stat.,p. 1–10.
Tripp, D.B. and V.A. Poulin. 1986. The effects oflogging and mass wasting on salmonidspawning habitat in streams on the QueenCharlotte Islands. B.C. Min. For., Victoria, B.C.Land Manage. Rep. 50.


119
Introduction
“Fine sediment” is conventionally considered to bematerial of sand size and finer—material that isfrequently and easily moved in streams, usually insuspension. Such material can pose serious problemsin the gravel-bed streams of the Pacific Northwestbecause, in sufficient concentration, it may interferewith the behaviour of fish and other aquatic organ-isms adapted to the environment of these streams,and even threaten their survival. When it settles ontothe bed, it threatens benthic organisms and fishspawning success. More generally, fine sedimentreduces water quality and, in community watersupplies, poses problems for water delivery works.
The Carnation Creek experimental study and theFish/Forestry Interaction Program (FFIP) were bothinitiated in substantial measure to understand theeffects of logging on the aquatic environment, andparticularly on the environment and life cycle ofPacific salmon, through the processes of sedimenta-tion and associated stream channel changes. Thepurpose of this paper is to give a critical discussionof progress in these two programs toward furtheringour understanding of the occurrence of fine sedi-ments in small, salmon-supporting streams in coastalBritish Columbia, both natural and disturbed.
Characterization of Fine Sediments
It is first necessary to acknowledge that “fine sedi-ment” has different operational definitions withindifferent scientific disciplines, and even in differentanalyses within one discipline. Some commonunderstanding about the meaning of the term wouldsubstantially aid study.
Sedimentologically, fine sediment is understoodto consist of sand and finer material. However, thereis no universal standard for the definition of sizelimits for various classes of material. In stream andaquatic studies in British Columbia, two standards
are common. Most scientific work is based on theWentworth classification of clastic materials(Wentworth 1922). However, much engineeringwork uses a classification traceable to Britishstandards. Table 1 compares the two scales. Differ-ences between them are small but could significantlyinfluence the characterization of sediments in somecases, since large amounts of material may occupy anarrow range of grain size.
Sediment texture scales
Class limits (mm)
Texture description Wentworth British
Medium and coarse gravel 64.0
Fine gravel 8.0 9.55
Granules (“pea gravel”) 4.0
Very coarse sand 2.0 2.38
Coarse sand 1.0 coarse sand
Medium sand 0.5 1.19
Fine sand 0.25 0.30
Silt 0.064 0.074
Clay 0.004
The Wentworth system is based on divisions in successive powers of2 (e.g., the lower limit of gravel is 23 = 8.0 mm; the lower limit ofmedium sand is 2-2 = 0.25 mm). The British units follow a similarsequence, but the powers are displaced by 0.25 unit; for example,the lower limit of gravel is 23.25 = 9.51 mm. The minor discrepancyin the second decimal affects some of the division points.
Fisheries scientists interested in describingstreambed sediments have selected a number of size-related measures to be indices of sediment quality inrelation to fish behaviour. Fine sediment in the bedreduces spawning success, so the proportion of bedsediment finer than some selected size has oftenbeen used as such an index. In a review, Chapman
Fine Sediments in Small Streams in Coastal British Columbia: A Review of Research Progress
M C

120
Grain size distribution from a gravel-bedstream, showing bimodal distribution of thesubsurface material. The fine mode is missingfrom the surface material (Mamquam River,near Squamish, B.C.).
Another relevant classification of hydraulicbehaviour of stream sediment is the divisionbetween bed material and wash material. The formeris material normally found in the bed and lowerbanks of the channel, which forms the channelboundary. It must be able to withstand ambientfluid stresses most of the time. The latter is materialwhich, once entrained, normally travels a long way,
(1988) identified 9.5 mm, 3.3 mm, 0.85 mm, and0.105 mm as sizes that have been selected, the latterbeing proposed as the “upper limit of silt.” (Incomparison with standard texture breaks [Table 1],3.3 mm = 21.75 is within the granule range;0.85 mm = 2-0.25 is within coarse sands; and0.105 mm = 2-3.25 is within fine sands.) The twosmallest sizes appear to have become prominentreference sizes as the result of field work by McNeiland Ahnell (1964) on the ability of pink salmon(Oncorhynchus gorbuscha) to remove material finerthan these sizes from redd diggings. Subsequently,0.85 mm appears to have become the most widelyuseful single reference size (see discussion inChapman 1988). A 3.3-mm criterion emerged as auseful correlate from field studies by Koski (1966)on emergence of coho (O. kisutch) fry, while 9.5 mmwas introduced as one index of gravel size distri-bution in laboratory studies by Tappel and Bjornn(1983). Chapman emphasizes that none of theseindex sizes represents a sufficient or physicallysatisfactory explanation of spawning success. Thevariable nature of streambed sediment size distri-butions, and the fact that it is intragravel pore spacesthat actually facilitate the biological processes, areboth reasons for that conclusion. It is interesting,nonetheless, to note that characteristic size distri-butions of good quality spawning gravel for severalOncorhynchus species have very little material finerthan 0.85 mm (typically less than 3%).
Another way to characterize fine sediment instreams is to define it as material that commonlymoves in suspension. In the most powerful currentsthis might include small granules, but in almost anysmall stream on the British Columbia coast it wouldbe unusual for mineral material coarser than about1 mm to be moved in suspension in normal waterfloods. Most of the time, nearly all of the suspendedmineral material would be finer than 0.25 mm. Forthe purpose of appraising the normal streamenvironment, the value of 0.85 mm found useful infishery studies could be taken as a practical upperlimit for suspended mineral matter. (The writer isaware of only one size distribution measurement ofsuspended mineral material in a small coastalstream, taken at Carnation Creek. All of the materialwas fine sand or finer. Samples taken to determinetotal concentration are usually far too small topermit size analysis.) This may be no coincidence:the ability of fish to clean material from gravels
depends on the propensity of the material to remainsuspended, once disturbed, for at least a shortdistance in water velocities commonly encounterednear the streambed.
The size distribution of streambed gravels is oftenbimodal (Fig. 1). In clean gravels, the finer mode isvery subordinate. The gap between the two modescommonly falls in the range 1–4 mm and is centrednear 2 mm; in powerful rivers it may fall a bithigher. The reason for the bimodal distribution isnot completely understood (see Wolcott 1988) but,in general, is considered to be related to relativehydraulic mobility of coarse versus fine material,coupled with the ability (or inability) of finer materialto “hide” by penetrating the interstices of the coarsermaterial. This division lends some rational supportto the proposal for using 0.85–1.0 mm as a criterionfor the limit of “fine material” in streams.
Particle size (mm)
2564 32 16 8 4 2 1.0 0.5 0.25 0.125 0.063
Perc
ent
∅ Particle size-6 -5 -4 -3 -2 -1 0 1 2 3 4
20
15
10
5
0
Surface layerMedian size: 21.1 mmGeometric mean size: 16.0 mm
Subsurface bulkMedian size: 7.73 mm
Geometric mean size: 4.82 mm

121
so that it is not present in significant quantities inthe bed and lower banks. Bed material may move insuspension or in traction (over the bed), but washmaterial always moves in suspension. In many rivers,the upper limit of wash material falls in the range0.125–0.250 mm. In steep, gravel-bed channels, thedivision may be somewhat higher. There is a goodhydraulic reason for the division: finer material ismaintained in suspension at velocities lower than itsentrainment velocity, so it always moves in suspen-sion and can easily move a long way.
Wash material (in effect, fine sand and finer)normally contributes a few percent of the streambedcomposition. This material is trapped by the filteringaction of larger material as water circulates throughthe streambed. If large volumes of such material areintroduced into the stream, however, it is capable ofpenetrating deeply into formerly clean gravels andclogging them completely (Beschta and Jackson1979). In comparison, substantial volumes of largersands may seal the surface, but normally do notpenetrate deeply.
To summarize, then, it may be useful to define“fine mineral material” in stream systems as particlesfiner than 1.0 mm (choice of the round number isdeliberate), and to note that two distinct sub-popu-lations divided at about 0.2 mm (0.18 mm = 2-2.5 isthe nearest usual Wentworth break) exhibit signifi-cantly different behaviour. Stream power may playsome role in the exact definition of these boundaries;in many streams, both boundaries appear to fallslightly below the proposed values.
None of the foregoing discussion considers fineorganic material. That is because there have notbeen systematic measurements of fine organicmaterial in many streams. Most such measurementshave been research measurements in studies ofcarbon flux. In water quality studies, total suspendedsolids are commonly reported (as “non-filterableresidue”), and this includes organics. However, thesamples usually are dip samples which do not cap-ture particles that are stratified in the water column.While one may assert from casual, but widespread,observations that fine organic matter commonly is aminor constituent of gravel deposits in coastalstreams, there is in fact very little systematic know-ledge about it.
Carnation Creek provides a single datum. In1974–75, 32.5 tonnes of detritus entered the creek(Neaves 1978, in Hartman and Scrivener 1990);
suspended sediment transport was 146 tonnes. Mostof the detritus was leaf litter which, at least initially,would have been large bits.
Carnation Creek Suspended Sediment Studies
At Carnation Creek, 43% of the 10.1 km2 above themain Water Survey of Canada gauge (B-weir) waslogged in a 5-year period between 1976 and 1981.Road construction began in 1975 after a 4-yearperiod to determine pre-harvest conditions. Withrespect to fine sediment, the problem was to attemptto detect the effect of the logging activity on theregime of fine sediment transport in the stream.
In Carnation Creek, as in most steep coastalstreams, it is reasonable to suppose that fine sedimentis sediment transported in suspension. This coinci-dence makes it possible to establish straightforwardprocedures for sampling. At B-weir, near the mouthof the basin, an automatic pump sampler was used toobtain frequent samples. The observing program wasundertaken by the Water Survey of Canada between1973 and 1986, and the data have been reported byTassone (1988) and Hartman and Scrivener (1990).The problem defined above was addressed by abefore-and-after logging comparison of the sus-pended sediment transport regime at this one site. Inthis paper, the results are critically examined, with aview to drawing some lessons from the work.
All annual data presented here are for the “wateryear,” extending from 1 October until 30 Septemberfollowing. This treats each winter high flow seasonwithin a single annual time unit.
Figure 2 displays a summary of the annual loadof Carnation Creek. There is no apparent evidencein these results for a land disturbance effect. Thefigure also shows mean annual suspended sedimentconcentration, the long-term discharge-weightedmean being 8 mg l-1. In general, mean concentrationfollows the load pattern except in 1978–80, when itappears that concentrations were anomalously high.The numbers in the figure—the maximum dailysuspended sediment concentration observed in eachyear—again show no trend. These sorts of resultshave been used to suggest that the effect of loggingon the fine sediment regime of the creek wasnegligible or slight.
A direct plot of annual sediment load againstannual flow volume (Fig. 3) confirms the anomalouscharacter of the 1978–80 period. During this period,

122
Annual suspended sediment yield fromCarnation Creek (bars) and mean annualconcentration of suspended sediment (line).The numbers beside each mean annual pointrepresent the maximum suspended sedimentconcentration measured in that year (mg L-1).Shading of the bars indicates years before,during, and after logging. (Display based onFig. 47 of Hartman and Scrivener 1990.)
Annual suspended sediment load versus annualflow volume. The solid line indicates theregression relation. The dashed line was drawnby eye and is interpreted to represent thenormal load-volume relation on the stream.Points coded as bars of Fig. 2.
creekside logging occurred with relatively carefultreatment or with leave strips, but many creeksidealders were blown down during a storm. Intensivecreekside treatment had previously occurred on ablock cut in 1976–77, with no obvious immediateeffect on mean or total suspended sediment. Thatyear experienced no significant high flow (instan-taneous peak flow was 16.0 m3s-1. It is not known,and would be difficult to determine now, whetherthe apparently high incidence of suspendedsediment in 1978–80 was the direct consequence oflogging in those years, or represented a delayedeffect of the earlier intensive treatment, or was dueto some other cause altogether.
In the winter of 1978–79, a peak flow of 43.9 m3s-1
occurred, the largest observed up to that time in thestudy. The storm occurred on 7 November, 1978,when 58 mm of rain fell, following 41.7 mm duringthe previous day. Neither total is exceptional, andthe 2-day event was much smaller than the 2-year48-hour storm. There was also no snow on theground. Nonetheless, this storm produced a dailymean suspended sediment concentration of 99 mg l-1
(the largest on record) and a daily load of 97.5 tonnes.These observations focus attention on individualstorm events.
Runoff events that transport a significant amountof fine sediment are ones in which relatively highflows are sustained for a considerable length of time.A search was made of the records to identify days onwhich daily mean flow exceeded 10 m3s-1 (Table 2).(Many events fall just below that threshold andappear not to transport large amounts of sediment.)Maximum instantaneous flows are available forsome events, and show that there is no obviouscorrelation between the instantaneous peak flow andthe daily mean. Since both size and duration of flowinfluence total sediment transport, it is apparentthat no simple correlation between flow and sedi-ment transport is available. There have been 20events in all (to the end of the 1986 water year), witha slightly greater rate of events in the pre-loggingperiod. The biggest events, however, occurred from1980 on.
There is a rough relation between storm meanflow (which is, in information terms, the same asrunoff volume) and total fine sediment load (Fig. 4).(The floods of 7 November 1978 and 4 January 1984stand out as notable exceptions.) Almost all of thehighest sediment-yielding floods also had notably
Water year
600
1973–74 1976–77 1979–80 1982–83 1985–86
500
400
300
200
100
Susp
ende
d se
dim
ent
(ton
nes)
Mea
n su
spen
ded
sedi
men
t co
ncen
trat
ion
(mg
L-1)12
10
8
6
4
2
00
Roadbuilding
commences
Loggingcompleted
86
26
27
27 54
99
41
24
44
49
88
73
44
5 × 10²
Sediment load (tonnes)
102
Flow volume (103m3)10 50
1978–79
1979–80
1985–86

123
Major sediment transporting events at Carnation Creek, 1973–1986
<Q> Qp <C> L L/Lann
Date m3s-1 m3s-1 mg l-1 tonnes %
Pre-logging
30 Feb. 74 12.4 20 23.6 5.81
24 Nov. 74 13.4 26 33.2 22.7
3 Nov. 75 13.9 27 35.7 11.6
13 Nov. 75 11.6 26 28.9 9.35
2 Dec. 75 13.8 26 32.9 10.6
During logging
12 Feb. 77 13.1 34.8 27 33.7 26.5
7 Nov. 78 11.4 43.9 99 97.5 54.1
17 Dec. 79 13.5 23.4 41 47.8 20.5
1 Nov. 80 11.2 15 14.5 5.94
10 Dec. 80 14.0 24 29.0 11.9
26 Dec. 80 21.6 43.1 38E 78.9 29.1
Post-logging
31 Oct. 81 11.0 15 14.3 7.52
23 Jan. 82 13.7 50.0 44 52.1 27.4
22 Oct. 82 10.3 45 40.0 12.4
11 Feb. 83 20.0 36.2 49 84.7 26.2
15 Nov. 83 13.7 11 13.0 4.79
4 Jan. 84 20.0 65.1 88 152.0 56.1
7 Oct. 84 13.2 14 16.0 5.71
9 Oct. 84a 10.0 10 8.64 3.09
24 Feb. 86 23.2 49.3 44 88.0 31.4
a This event probably is not independent of the preceding one.Data are extracted from Water Survey of Canada records. <Q> is mean daily flow and Qp is instantaneous maximum flow for the day;instantaneous maximum flow is shown only when the event yielded the highest instantaneous flow of the year. <C> is meansuspended sediment concentration for the day. L is daily load and Lann is total annual load. E indicates an estimated quantity.Most suspended sediment samples at Carnation Creek were obtained by an automatic sampler with a fixed intake. Distance of theintake from the streambed varied according to the history of scour and fill of bed sediment near the intake. Hence, quoted sampleconcentrations are not closely comparable amongst all events. This circumstance introduces an unknown measure of error into thecumulated load estimates as well.
high peak flows. A peak flow threshold of 40 m3s-1 isidentified in Figure 4, and the single, apparently dis-parate, event registered a peak flow of 36.2 m3s-1.Another evident feature of the plot is that thepost-logging events show greater scatter thanpreceding ones.
In considering both the data of Table 2 and thepattern revealed in Figure 4, it should be noted thatthe data are based on calendar days (because that isthe way the published records report them), so thatthey probably do not reflect complete flood events.This circumstance may contribute significant non-systematic variability to the displayed results.
Some details are known about the largest event,which occurred on 4 January 1984. The 190 mm ofrain exceeded the 25-year 24-hour expected total.Although there was no snow on the ground, the pre-ceding period had been wet, with 72 mm on January 1.Precipitation on the 3 days surrounding this dayconstituted a 15-year event. During this majorstorm, there were numerous landslides in the upperpart of the drainage basin and a debris flow throughthe canyon in the middle reach of Carnation Creek.The debris debouched into the lower course and thedownstream flood caused extensive reorganizationof log jams and major movement of sediment stored

124
Daily suspended sediment load versus dailymean flow for days with greater than 10 m3s-1
mean flow. The indicated relation was drawnby eye.
Flood hydrographs for some individual storms inCarnation Creek (from Tassone 1988: Fig. 8).
in gravel wedges associated with the jams. Consider-ing the debris flow on the main channel and thedownstream disturbance, it is not surprising that thehighest sediment concentrations (peak recorded,842 mg l-1) and load were observed in this event.This history, in turn, focuses attention on the actualsources of sediment associated with each flood andwith within-storm details of sediment movement.
Details of individual floods have not been studied.Figure 5 illustrates the flow and sediment concen-tration in three storms. The first (12 February 1977)reveals a fairly direct sediment response to flows, butwith concentration slightly leading the flow peak,and with an anomalously large response to the latesecondary peak. Sediment concentration custom-arily “leads” flow when fine sediment is mobilizedfrom the channel bed or banks on rising stage andthen is exhausted before the peak flows are reached.The prominent late peak in sediment concentrationprobably is related to the release of a discrete storeof sediment by the late flow rise. Such a sediment
source could be a bank collapse or a significantchange in a log jam. The peak was detected by asingle sediment sample, so a small, transient eventvery close to the automatic sampler intake cannot beruled out.
The 15 November 1983 event is remarkable forthe lack of sedimentary response to a substantialflow. Evidently no major changes occurred along thechannel during this event. In comparison, the4 January 1984 event reveals a more sensitive butstill initially moderate response. A major spike ofsediment-charged water follows, with the secondaryflow peak. This is the signature at B-weir of theupstream debris flow and log-jam-breaking event.Subsequent variability in suspended sedimentconcentration was caused by continuing changesalong the channel in response to that primary event.
Fine sediment is mobilized in small drainagebasins from a number of sources:1. from the bed and lower banks, as bed material is
entrained with rising flows. In Carnation Creek,
160
Load (tonnes/day)
140
120
100
80
60
40
20
0
pre-loggingduring loggingpost-loggingpeak flow >40 m3s-1
10 12 14 16 18 20 22 24
Daily mean flow (m3s-1)
7/11/78
4/1/84
1977 1983Feb. 11 Feb. 12 Nov. 14 Nov. 15
400
300
200
100
Susp
ende
d se
dim
ent
(mg
L-1)
Dis
char
ge (
m3
s-1)30
00
1984
600
500
400
300
200
100Susp
ende
d se
dim
ent
(mg
L-1)
Dis
char
ge (
m3
s-1)
60
50
40
30
20
10
00
20
10
Jan. 1 Jan. 2 Jan. 3 Jan 4.
a) b)
c)hydrographsuspended sedimentconcentration, withpumped samples

125
this source is very modest, as there is only a fewpercent of fine sand and silt in the bed (Hartmanand Scrivener 1990). Sediment concentrationscommonly are in phase with, or slightly leadthe flow.
2. from streamside, where fine material falls into thecreek during low flows as the result of wetting/drying or freeze/thaw erosion of the banks, or asthe result of tree-throw. This source is probablyalso modest in Carnation Creek. Marinesediments exposed in the banks of the lowercourse constitute a potentially major source offine material, but they are highly compact anderode only very slowly. Sediment concentrationleads flow, since loosened material is mobilizedon rising stage and soon exhausted.
3. directly from the land surface accompanyingoverland flow. This source is minor in mostforested drainage basins. A significant source isdirect drainage from roads, but this appears tohave been a minor factor in Carnation Creek.Sediment concentration often lags behind flowbecause of travel-time from the terrestrial sources.
4. from episodic release of fine sediment associatedwith sediment mass movements into the channel.In Carnation Creek, this source includes majorbank collapse and debris flows from gullies flow-ing into the canyon reach. Occurrence is random.
5. from episodic release of substantial volumes offine sediment in the channel when a log jam fails.
The last two sources probably are the cause ofmajor spikes of fine sediment in Carnation Creek,with (4) being by far the most efficient deliverymechanism for fine sediment. Individual events mayor may not be related to forest management activities.To prove such effects, analysis must be conducted ona storm-by-storm basis, and there must be knowledgeof events in the landscape that can be connectedwith the gauge records. Discrete sediment deliveryevents represent the major source of fine sedimentin most small, forested streams in coastal BritishColumbia. Gauging records are not sufficient toexplain the pattern of sediment mobilization, andtime-aggregated analyses actually obscure the causesof sediment incidence. To properly examine thequestion whether logging activity influenced theoccurrence of fine sediment in Carnation Creek, itwill be necessary to explain within-storm sedimenttransport by knowledge of the causes of sediment
mobilization in the landscape. Such analyses havenot, so far, been conducted.
FFIP Fine Sediment Studies In FFIP, two questionsabout fine sediment in stream channels wereaddressed:1. Can land use effects be detected in fine sediment
yield to streams?2. If so, where does the fine sediment go?
The second question was prompted by theobservation that spawning gravels in QueenCharlotte streams have low fine sediment contentdespite a high rate of land surface disturbance.
Land Use Effects The approach to answer the firstquestion was to conduct a synoptic survey ofsediment concentration in a substantial number ofstreams selected to cover a range of land surfaceconditions. Figure 6 locates the sampled streams andTable 3 gives some data of their drainage basins,along with a brief description of the classificationsystem by which the results are organized. Sampleswere opportunistically taken between August 1983and March 1984 to determine the fine sedimentconcentration in the water column.
Figure 7 displays the distribution of suspendedsediment concentrations found in the survey. Therewere 249 samples in total, or an average of 12samples per stream. It is not known how well thedata truly reflect the regime of the streams: oppor-tunistic sampling of a highly episodic phenomenonis very difficult. But, insofar as the streams weresampled as a group, the data do form an internallycomparable set. It is first clear that suspendedsediment concentration is a highly skewed variate.Approximately two-thirds of all samples returnedresults of <25 mg l-1 suspended sediment concen-tration—that is, little or no suspended sedimentwithin the resolution of the measurements. About20% of the samples exceeded 100 mg l-1, with a fewindividual samples exceeding 1000 mg l-1. The highestvalue observed was 4400 mg l-1.
A slight preponderance of the higher suspendedsediment concentrations are contributed by “oldlogged, mass wasted” basins. In comparison, “newlogged, mass wasted” basins do not exhibit elevatedsediment concentrations (in comparison with allnot-mass-wasted classes). A reason for this may bethe reduced degree of streambank damage associated

Location of streams sampled in the FFIPsynoptic suspended sediment samplingprogram, and of streams (named in bold type)studied for environments of fine deposits.
Distribution of observations of significantsuspended sediment concentration in a synopticsurvey of streams in the Queen CharlotteIslands (frequency distribution of allobservations, not classified). A “significantconcentration” is defined as being > 25 mg L-1.Streams are classified by land use history (seeTable 3 for definitions). Note that theconcentration classes are not uniform; nindicates the number of streams in each group(analysis by D. Hogan).
126
with “new logged” methods. However, there are atleast three possible confounding factors. Streamstage is well known to influence suspended sedimentconcentration. In this program, this factor was notcontrolled. However, the result is sustained whencomparisons are constrained to samples taken onthe same day (with, presumably, comparable runoffconditions from basin to basin). Another significantuncontrolled effect is drainage basin size. The oldlogged, mass wasted group includes the smallest
drainage basins in the study, and thus the ones inwhich measurements were generally taken closest toupstream sources of fine sediment. Finally, geologyis confounded in the results: the old logged, masswasted group of basins is situated entirely on theHonna and Haida formations, clastic sedimentaryrocks known to be erodible. Most of the other basinsare situated mainly on volcanic rocks (some of whichare also considered to be susceptible to erosion).
PiperTarundl
Miller
Haans
Ski JumpSachs
AllifordMacmillan
South Bay DumpSchomar
HangoverBonanzaGregory
RileyPhantom
ShelleyMountain
HonnaGovernment
Deena
Graham
Island
Moresby
Island
Queen
CharlotteRanges
133°W
54°N
Skidegate Plateau
Queen Charlotte Lowlands
131°W
52°N
Kilometres0 50
Frequency observed (%)
70
25–50 51–100 101–200 201–500 501–1000 >1000
60
50
40
30
20
10
0
Suspended sediment concentration (mg L-1)
70
60
50
40
30
20
10
0
All data
>100
050
1+20
1+10
1+51+
25+
<25
not logged, not masswasted; n=4old logged, not masswasted; n=7recently logged, notmass wasted; n=3old logged, masswasted; n=4recently logged, masswasted; n=2

127
Data of FFIP study streamsa
Drainage area Logging history Mass wastingb
Steep land Age Occurrence Yield to streamsName Total (km2) % cleared (yr) no. km-2yr-1 m3km-2yr-1
Not logged, not mass wastedc
Government 16.1 7.7 0 – 0.12 0.50
Gregory 36.7 14.8 0.8 4.4 0.30 1.2
Hangover 21.2 11.6 0 – 0.15 0.60
Phantom 18.6 3.2
Old logged, not mass wasted
Piper 4.2 ? 9.5 0 0
Schomar 6.6 25.0 6.4 15
Miller 22.4 13.4
Mountain 12.8 10.2 9.4 17 0.13 0.20
Tarundl 11.3 3.2 35.4 8.6 ? 0.34
Haans 34.8
New logged, not mass wasted
Deena 63.0
Honna
Bonanza 47.4 22.9 12.9 6.6 0.67 5.1
Old logged, mass wasted
Sachs 17.8 6.8 64.7 9.5 1.7 9.8
So Bay Dump 4.0 2.0 80.0 7.6 2.6 25
Ski Jump
Macmillan 6.2 3.1 64.5 5.5 2.6 24
Alliford
New logged, mass wasted
Riley 28.7 12.0 12.2 6.6 1.2 5.7
Shelley 5.2 2.9 17 13
a Names in bold indicate streams studied for downstream occurrence of fine sediments in sediment deposits.b Data from Rood (1984). Calculations are based on the steepland area in each basin.c Basin is considered “not logged” if only a small proportion of the total area is cleared. Logging style refers to methods rather than to
age; “old logging” includes cat and skidder hauling, clearing to streambank and, possibly, hauling through the stream channel; “newlogging” does not include these practices and is restricted mainly to high lead. “Old logging” mainly occurred or began before 1966.The area is considered to be “not mass wasted” if the sediment yield to streams is less than 1 m3km-2yr-1.
Figure 8 provides a summary comparison of theresults by stream class. Mean sediment concentrationin the old logged, mass wasted group is considerablyhigher than in any other group. However, the hugevariability of the results precludes the assertion thatthe difference is generically significant.
The investigation demonstrates the episodicoccurrence of elevated concentrations of suspendedsediment in Queen Charlotte streams and associates
them dominantly (but not exclusively) with basinson certain rock formations logged by obsoletemethods. The results are consistent with knowledgethat the incidence of elevated concentrations isepisodic and relatively infrequent, yet very high(>1000 mg l-1) concentrations can occur occasion-ally. However, the experimental design and the sizeof the program both preclude the extraction of morerefined conclusions. Because of the episodic nature

128
Mean of significant sediment concentrationsobserved in sampled streams, classified by landuse history. Graph shows the mean ± 2 stan-dard errors. The open circles indicate meanconcentration when the < 25 mg L-1 observa-tions are included (see Fig. 7 inset forfrequency); n indicates the number of observa-tions in each group (analysis by D. Hogan).
At present, a good deal more is known, in general,about the temporal pattern of suspended sedimenttransport than is known about spatial variability.Very little is firmly known about the relative impor-tance of the specific, spatially variable factors listedabove in controlling the regime of fine sedimentincidence in the long run. To overcome some ofthese lacunae, it appears well worthwhile to persistwith studies of the type attempted in FFIP. The FFIPstudy clearly indicates the magnitude of the task andprovides some clear lessons for study design.
Where Does the Fine Sediment Go? This questionwas studied by dividing the stream channel into anumber of characteristic depositional environmentsacross the channel and along the course of thestream (Fig. 9). These were systematically searchedin a subsample of the synoptic study streams (iden-tified by bold print in Figure 6 and Table 3) for thepresence of fine sediment. It is important to notethat the study design specifically targeted certainenvironments to search for the presence of fines(i.e., sub 1 mm material). In-channel depositionalenvironments included medial bar tops and pocketdeposits in the lee of major obstructions such asboulders or LOD pieces. Channel-side depositsincluded lateral bar tops and shadow deposits in thelee of bank projections and LOD. The overbankzone was taken to be any site adjacent to the channelwhere perennial terrestrial vegetation was growing.In overbank sites, recent flood deposits (rather thanorganic soil) were sampled. The results do not repre-sent a characterization of the overall sedimentologyof the study streams. However, the internal compar-isons do indicate where the fine sediment occurs,and frequency gradients of fine material generallyindicate the locus of travel of fine material. Toemphasize the relative occurrence of fine materialsin the selected environments, the results have beenuniformly truncated at the upper end of the distri-bution at 8.0 mm. The truncation was not severe.
Figure 10 illustrates the overall, grouped results(based on proportional size distributions) for thestudy streams in a pattern that parallels the studydesign. Individual streams replicate the overallresults. Fines were found in all the environmentsstudied and sands dominate in all cases. Graveldeclines abruptly from “in-channel” depositionalenvironments to the others, while the incidence ofvery fine material (silts and clays) increases steadily
of the phenomenon, temporal variability is large, sothat an intensive sampling program or continuousmonitoring devices would be required to obtaingood discrimination between sites. In addition, thelarge variability of land surface condition and theneed to account for geology, topography, exposure,and land use history all dictate that a very largesample of basins be included in post-treatmentspatial comparisons. The requirements for a sensi-tive analysis are formidable.
Observed sediment concentration (mg L-1)
550
n= 24 103 7 64 13Setting
500
450
400
350
300
250
200
150
100
50
0
unlo
gged
; not
mas
s w
aste
d
old
logg
ed; n
ot m
ass
was
ted
rece
ntly
logg
ed; n
ot m
ass
was
ted old
logg
ed; m
ass
was
ted
rece
ntly
logg
ed; m
ass
was
ted

129
Sampling design for the detection of fine sediment in stream deposits, Queen Charlotte Islands streams (seeTable 3 for streams studied).
Proportional distribution of sizes finer than8 mm in specified sedimentary environmentsalong stream channels in the Queen CharlotteIslands classified by gradient (comparesampling design in Fig. 9); IC = in-channel;CS = channel-side; OB = overbank (analysisby D. Hogan).
from in-channel, to channel-side, to overbank, asshould be expected.
Progressively downstream, there is a systematictrend toward reduced gravel and increased sand pro-portions in the in-channel and channel-side deposi-tional environments, but this is not sustainedoverbank. Very fine materials exhibit no systematicdownstream trend in any environment. This reflectsentrainment controls on the incidence of the properbed material of the channel, controls that do notinfluence the occurrence of very fine material. Veryfine material is caught by being trapped in the inter-stices of coarser material in the channel, or by advect-ing into still water overbank. These processes appearto be equally effective everywhere along the channel.
In comparison with all these sites, spawningriffles are vigorously washed and frequently scoured,which removes the fines that accumulate thereduring periods of moderate flow. The steep gradi-ents and frequent freshets in Queen Charlottestreams emphasize this cleaning effect. The netresult (Fig. 11) is that the “open channel,” cobble-gravel bottom of the pool-riffle sequence exhibits
IC CS OB IC CSOB IC CSOB IC CSOB estuary100
Com
pos
ition
(%
fine
r)
Stream gradient≥7% 4–6.9% 2–3.9% ≤1.9%
80
60
40
20
0
90
70
50
30
10
granules
sand
silt
upstream downstream

130
Comparison of the texture of fine sediment deposits in Queen Charlotte streams with that of spawning gravelsfrom the same channels.
channel system. Very fine material remains trulywash material right through the channel system.
The gradients that occur in the sands and finegravels in the depositional environments are not, ingeneral, replicated in the sedimentology of the openchannel deposits. In the steep, small drainage basinscharacteristic of the Queen Charlotte Islands,channels are coupled to overbank sources of sedi-ment along nearly their entire course, so the overall
strongly coarse-skewed sediments, even within thetruncated -8.0 mm range, whereas the protected,depositional environments exhibit normal or fine-skewed sediments.
In the delta/estuary reach of the study channels,the incidence of very fine material approaches 25%.More of it undoubtedly moves into deep water off-shore. It appears, then, that much of the materialmoves relatively quickly right to the end of the
Sediment size (mm)
100
80
60
40
20
Percentage finer (%)
0
Government Creeknot logged,not mass wasted
.01 0.1 1.0 10
100
80
60
40
20
Percentage finer (%)
0
Deena Creeknew logged,not mass wasted
Sediment size (mm).01 0.1 1.0 10
Sediment size (mm)
100
80
60
40
20
Percentage finer (%)
0
Tarundl Creekold logged,not mass wasted
.01 0.1 1.0 10
100
80
60
40
20
Percentage finer (%)
0
South Bay Dump Creekold logged,mass wasted
Sediment size (mm).01 0.1 1.0 10
in-channel fines
spawning gravels

131
sedimentology of the channel is dominated by thetexture of source sediments. No systematic down-stream gradients of sediment texture occur in suchreaches (Rice and Church 1996).
The summary lessons from this study are that veryfine sediments are indeed found in transit throughthe stream system, but they are segregated intospecific depositional environments along the channel.Apart from some trapping in interstices, these do notinclude the open channel environment of spawninggravels. The segregation of sediments into differentlocal environments as the result of hydraulic action isevident along the channel by visual inspection. Thathighly mobile, fine sediments are relatively efficientlysegregated should not be surprising.
Nonetheless, when very large inputs of finesediments are experienced (e.g., in the reachimmediately downstream from a debris flow lobe),the total volume of fines may be sufficient toproduce significant transient deposition everywherein the channel. Figure 12 shows the effect of a debristorrent entering a stream channel and the initialrecovery of gravel quality within the winter season.It appears to require two or three seasons tocompletely clean the open-channel gravels. Evenwithout large influxes of fine material, there are alsominor variations in very fine sediment content ofopen-channel gravels between summer and winter,since low flows in summer will permit somedeposition of fines in the gravels.
Conclusions
The studies of suspended sediment incidence inCarnation Creek and FFIP streams have contributedsome useful results to knowledge of the regime offine sediment transfers in forested and logged coastalstreams. Probably more important, however, is whatthey have taught about the requirements for thoroughcharacterization of the regime, and for definitiveassessment of land use effects on fine sedimentmobility. These lessons are summarized here.
In both Carnation Creek and the FFIP survey, itis apparent that the incidence of elevated suspendedsediment concentrations is highly episodic. Finematerial is prepared for fluvial transport either byfreeze/thaw or wetting/drying along streambanks oris delivered by minor ravelling and bank collapse. Itis mobilized in the next freshet and the availablestock may quickly be exhausted. But major bankcollapse, or earthflow or debris flow impact on thechannel, may episodically introduce substantialvolumes of fine sediment. Such events occurnaturally as well as in consequence of land use.Sometimes, the impacting event occurs long afterthe initial land surface disturbance began thepreparation of material for eventual mobilization. Incontrast to the foregoing mechanisms, drainage offactive, unpaved roads, may provide a relativelypersistent source of fine sediment, but even thissource is active only during wet periods.
Given the circumstances described above, twoimportant conditions must be met before finesediment regime and sources can be properlycharacterized:1. Temporal records must be continuous, or must at
least incorporate frequent, systematic sampling sothat the true magnitude and duration of fine sedi-ment incidence in the stream can be characterized;
2. To connect the incidence of fine sedimentunequivocally with sources, analyses must beconducted on an event-by-event basis, andinformation must be available about eventsreleasing sediment into the stream, as well asabout downstream concentrations.
These requirements have not been realized in anystudy in British Columbia to date, and in few studieselsewhere. Some events at Carnation Creek can bebroadly analyzed if a good deal of inference isaccepted (which is not unusual in studies of this
Percent finer than 3.36 mm in bed materialsamples recovered from riffles in BonanzaCreek at two dates following entry of a debristorrent into the channel on 14 January 1982(data collected by E. Harding, B. Eccles, andM. Morris).
% finer than 3.36 mm
Distance from point of entry of debris flow (m)
30
-200 -100 0 100 200 300 400 500 600 700 800 900 1000
January 28, 1982
April, 1982
downstreamupstream poin
t of
ent
ry
20
10
0

132
sort). Recent developments in water columnmonitoring promise to make the provision ofcontinuous records of sediment concentration agood deal more convenient in the near future, butthere remain serious problems in obtainingadequately detailed surveillance of land surfaceconditions, and in making the connection betweensediment sources and downstream effects.
A third important condition is indicated by theFFIP synoptic survey. Variations in land surface condi-tion (encompassing geology, topography, exposure,geomorphological and land use histories) and veg-etation condition all create significant variability inthe conditions for fine sediment mobilization. Thisappears to make the requirements for adequateregional knowledge very onerous indeed. An addi-tional lesson that emerges from experience to date isthat, in natural landscapes (including ones underforestry management, but explicitly excluding agri-cultural and urban landscapes) most of the finesediment is derived from a very small portion of theland surface. In general, these places are mass failureson hillslopes, roadways, and stream channel banks.They characteristically comprise, in total, only about1% of the landscape. It may be a good deal moreefficient to concentrate on learning more about theoccurrence of these source sites and the processes onthem in various geological/topographic situations,than to attempt extensive regional monitoring. Atthe least, source studies should be incorporated intohierarchically arranged studies of suspended sedi-ment movement in the landscape (e.g., Nistor 1996).But the ultimate implications of this strategy, like somany aspects of this topic, remain not at all clear.
Acknowledgements
Data of suspended sediment transport in CarnationCreek were collected by the Water Survey of Canadaunder the direction of Mr. Bruno Tassone, thenRegional Sediment Engineer, Pacific and YukonRegion, Inland Waters Directorate, who also under-took the primary analysis. Queen Charlotte Islandsdata were collected by Dr. Lee Beaven, of theFish/Forestry Interaction Program. Primary analysiswas undertaken by Mr. Dan Hogan, B.C. Ministry ofForests, who undertook additional analyses for thispaper. The writer thanks each of these individualsvery much for allowing him to dissect their hard-won results.
References
Beschta, R.L. and W.L. Jackson. 1979. The intrusionof fine sediments into a stable gravel bed.J. Fish. Res. Board Can. 36:204–210.
Chapman, D.W. 1988. Critical review of variablesused to define effects of fines in redds of largesalmonids. Amer. Fish. Soc. Trans. 117:1–21.
Hartman, G.F. and J.C. Scrivener. 1990. Impacts offorest practices on a coastal stream ecosystem,Carnation Creek, British Columbia. Can. Bull.Fish. and Aquat. Sci. 223.
Koski, K.V. 1966. The survival of coho salmon(Oncorhynchus kisutch) from egg deposition toemergence in three Oregon streams. MScthesis. Oreg. State Univ., Corvallis, Oreg.(Quoted in Chapman 1988).
McNeil, W.J. and W.H. Ahnell. 1964. Success of pinksalmon spawning relative to size of spawningbed materials. US Dep. Int., Fish. Wildl. Serv.,Special Scientific Rep. – Fisheries 469.
Nistor, C. 1996. Temporal patterns in the normalregime fine sediment cascade in Russell CreekBasin, Vancouver Island. MSc thesis. Univ.B.C., Vancouver, B.C.
Rice, S.P. and M. Church. 1996. The variation ofsediment texture in headward, gravel-bedchannels. Earth Surface Processes andLandforms 21:1–18.
Rood, K.M. 1984. An aerial photograph inventory ofthe frequency and yield of mass wasting on theQueen Charlotte Islands, British Columbia.B.C. Min. For., Victoria, B.C. Land Manage.Rep. 34.
Tappel, P.D. and T.C. Bjornn. 1983. A new method ofrelating size of spawning gravel to salmonidembryo survival. N. Amer. J. Fish. Manage.3:123–135.

133
Tassone, B.L. 1988. Sediment loads from 1973 to1984: 08HB048 Carnation Creek at the mouth,British Columbia. In Applying 15 Years ofCarnation Creek Results: Proc. Workshop. T.W.Chamberlin (editor). Pac. Biolog. Sta.,Nanaimo, B.C., pp. 46–58.
Wentworth, C.K. 1922. A scale of grade and classterms for clastic sediments. J. Geology30:377–392.
Wolcott, J.F. 1988. Slope process control of bimodalgrain size distributions in riverbed gravels.J. Sedimentary Petrology 58:979–984.
