carnegie institution for science...property and equipment, net (notes 4 and 5) 132,309 133,422 long...
TRANSCRIPT

CARNEGIE INSTITUTION FOR SCIENCE
Financial Statements and Schedule
June 30, 2018 and 2017
(With Independent Auditors’ Report Thereon)

KPMG LLP is a Delaware limited liability partnership and the U.S. member firm of the KPMG network of independent member firms affiliated with KPMG International Cooperative (“KPMG International”), a Swiss entity.
KPMG LLPSuite 120001801 K Street, NWWashington, DC 20006
Independent Auditors’ Report
The Audit Committee
Carnegie Institution of Washington:
We have audited the accompanying financial statements of the Carnegie Institution of Washington (d/b/a
Carnegie Institution for Science), which comprise the statements of financial position as of June 30, 2018 and
2017, and the related statements of activities and cash flows for the years then ended, and the related notes to
the financial statements.
Management’s Responsibility for the Financial Statements
Management is responsible for the preparation and fair presentation of these financial statements in
accordance with U.S. generally accepted accounting principles; this includes the design, implementation, and
maintenance of internal control relevant to the preparation and fair presentation of financial statements that are
free from material misstatement, whether due to fraud or error.
Auditors’ Responsibility
Our responsibility is to express an opinion on these financial statements based on our audits. We conducted
our audits in accordance with auditing standards generally accepted in the United States of America. Those
standards require that we plan and perform the audit to obtain reasonable assurance about whether the
financial statements are free of material misstatement.
An audit involves performing procedures to obtain audit evidence about the amounts and disclosures in the
financial statements. The procedures selected depend on the auditors’ judgment, including the assessment of
the risks of material misstatement of the financial statements, whether due to fraud or error. In making those
risk assessments, the auditor considers internal control relevant to the entity’s preparation and fair presentation
of the financial statements in order to design audit procedures that are appropriate in the circumstances, but
not for the purpose of expressing an opinion on the effectiveness of the entity’s internal control. Accordingly, we
express no such opinion. An audit also includes evaluating the appropriateness of accounting policies used and
the reasonableness of significant accounting estimates made by management, as well as evaluating the overall
presentation of the financial statements.
We believe that the audit evidence we obtained is sufficient and appropriate to provide a basis for our audit
opinion.
Opinion
In our opinion, the financial statements referred to above present fairly, in all material respects, the financial
position of Carnegie Institution of Washington as of June 30, 2018 and 2017, and the changes in its net assets
and cash flows for the years then ended, in accordance with U.S. generally accepted accounting principles.
2
Other Matters
Our audit was conducted for the purpose of forming an opinion on the financial statements as a whole. The
supplementary information included in the accompanying schedules of expenses is presented for purposes of
additional analysis and is not a required part of the financial statements. Such information is the responsibility
of management and was derived from and relates directly to the underlying accounting and other records used
to prepare the financial statements. The information has been subjected to the auditing procedures applied in
the audit of the financial statements and certain additional procedures, including comparing and reconciling
such information directly to the underlying accounting and other records used to prepare the financial
statements or to the financial statements themselves, and other additional procedures in accordance with
auditing standards generally accepted in the United States of America. In our opinion, the information is fairly
stated in all material respects in relation to the basic financial statements as a whole.
Washington, District of Columbia
November 12, 2018

3
CARNEGIE INSTITUTION FOR SCIENCE
Statements of Financial Position
June 30, 2018 and 2017
(Dollars in 000’s)
Assets 2018 2017
Cash and cash equivalents $ 18,761 34,465
Contributions receivable, net (note 2) 3,848 5,040
Accounts receivable and other assets, net 7,307 6,308
Bond proceeds (note 7) 21,306 20,319
Investments (notes 3 and 14) 996,497 947,231
Property and equipment, net (notes 4 and 5) 132,309 133,422
Long term deferred asset (note 6) 59,324 58,188
Total assets $ 1,239,352 1,204,973
Liabilities and Net Assets
Liabilities:
Accounts payable and accrued expenses (notes 7 and 8) $ 13,706 17,671
Deferred revenue (note 5) 27,504 27,685
Bonds payable (note 7) 115,038 115,045
Accrued postretirement benefits (note 9) 24,281 25,375
Total liabilities 180,529 185,776
Net assets (notes 10 and 11):
Unrestricted 322,559 308,316
Temporarily restricted 680,887 655,711
Permanently restricted 55,377 55,170
Total net assets 1,058,823 1,019,197
Commitments and contingencies (notes 3, 7, 9, 12, and 13)
Total liabilities and net assets $ 1,239,352 1,204,973
See accompanying notes to financial statements.

4
CARNEGIE INSTITUTION FOR SCIENCE
Statements of Activities
Years ended June 30, 2018 and 2017
(Dollars in 000’s)
2018 2017
Temporarily Permanently Temporarily Permanently
Unrestricted restricted restricted Total Unrestricted restricted restricted Total
Revenue and support:
External revenue:
Grants and contracts $ 26,907 — — 26,907 30,378 — — 30,378
Contributions and gifts (note 14) 1,640 5,834 207 7,681 1,273 7,560 14 8,847
Other income (note 8) 4,222 10 — 4,232 1,700 — — 1,700
External revenue 32,769 5,844 207 38,820 33,351 7,560 14 40,925
Investment income, net (note 3) 26,285 69,380 95,665 33,834 86,638 — 120,472
Net assets released from restrictions (note 10) 50,048 (50,048) — 50,591 (50,591) — —
Total revenue and support 109,102 25,176 207 134,485 117,776 43,607 14 161,397
Expenses:
Program expenses:
Terrestrial magnetism 9,882 — — 9,882 9,723 — — 9,723
Observatories 22,886 — — 22,886 20,183 — — 20,183
Geophysical laboratory 19,711 — — 19,711 20,587 — — 20,587
Embryology 12,764 — — 12,764 10,912 — — 10,912
Plant biology 10,118 — — 10,118 11,330 — — 11,330
Global ecology 6,944 — — 6,944 7,279 — — 7,279
Other programs 849 — — 849 648 — — 648
Total program expenses 83,154 — — 83,154 80,662 — — 80,662
Administrative and general expenses 13,478 — — 13,478 21,069 — — 21,069
Total expenses 96,632 — — 96,632 101,731 — — 101,731
Change in net assets before
pension-related changes other than net
periodic postretirement benefit cost 12,470 25,176 207 37,853 16,045 43,607 14 59,666
Pension-related changes other than net periodic
postretirement benefit cost (note 9) 1,773 — — 1,773 3,345 — — 3,345
Change in net assets 14,243 25,176 207 39,626 19,390 43,607 14 63,011
Net assets at beginning of year 308,316 655,711 55,170 1,019,197 288,926 612,104 55,156 956,186
Net assets at end of year $ 322,559 680,887 55,377 1,058,823 308,316 655,711 55,170 1,019,197
See accompanying notes to financial statements.

5
CARNEGIE INSTITUTION FOR SCIENCE
Statements of Cash Flows
Years ended June 30, 2018 and 2017
(Dollars in 000’s)
2018 2017
Cash flows from operating activities:
Change in net assets $ 39,626 63,011
Adjustments to reconcile change in net assets to net cash used in
operating activities:
Depreciation 9,908 10,174
Provision for allowance for uncollectible accounts 73 (420)
Net (gains) losses on investments and bond proceeds (89,311) (93,746)
Net losses (gains) on interest rate and commodity swaps (120) 932
Net loss on disposal of property 97 1,577
Contributions of stock (148) (24)
Amortization of bond issuance costs, premium, and discount (7) (7)
Contributions and investment income restricted for long-term
investment in endowment (207) (14)
Pension change other than net periodic benefit cost 1,773 3,345
(Increase) decrease in assets:
Contributions and accounts receivable 132 1,324
Accrued investment income (14) (3)
Long-term deferred asset (1,136) (1,511)
Increase (decrease) in liabilities:
Accounts payable and accrued expenses (3,844) 8,534
Deferred revenue (181) (1,244)
Accrued postretirement benefits (2,867) (5,644)
Net cash used in operating activities (46,226) (13,716)
Cash flows from investing activities:
Acquisition of property and equipment (1,907) (3,669)
Construction of facilities and equipment (6,986) (7,682)
Investments purchased (403,835) (621,137)
Proceeds from investments sold or matured 443,043 651,130
Net cash provided by investing activities 30,315 18,642
Cash flows from financing activity:
Proceeds from contributions and investment income restricted for:
Investment in endowment 207 14
Net increase in cash and cash equivalents (15,704) 4,940
Cash and cash equivalents at beginning of year 34,465 29,525
Cash and cash equivalents at end of year $ 18,761 34,465
Supplementary cash flow information:
Cash paid for interest $ 5,336 5,197
See accompanying notes to financial statements.
CARNEGIE INSTITUTION FOR SCIENCE
Notes to Financial Statements
June 30, 2018 and 2017
6 (Continued)
(1) Organization and Summary of Significant Accounting Policies
(a) Organization
The Carnegie Institution of Washington, doing business as Carnegie Institution for Science, (Carnegie)
conducts advanced research and training in the sciences. Carnegie carries out its scientific work in six
research centers located throughout the United States and at an observatory in Chile. The centers are
the Departments of Embryology, Plant Biology, Global Ecology, Terrestrial Magnetism, the Geophysical
Laboratory, and the Observatories.
For the years ended June 30, 2018 and 2017, Carnegie had investment income, including net
unrealized and realized gains of $95.7 million and $120.5 million, respectively. Carnegie’s other
sources of income are primarily from gifts and federal grants and contracts.
(b) Basis of Accounting and Presentation
The financial statements are prepared on the accrual basis of accounting in accordance with
U.S. general accepted accounting principles.
(c) Investments and Cash Equivalents
Carnegie’s common stock and equity investments are reported at fair value based on quoted market
prices, or with respect to commingled funds, real estate funds, certain natural resources funds,
absolute return funds, and private equity funds, at estimated net asset values (NAV), as a practical
expedient for fair value, provided by the general partners of limited partnerships or other external
investment managers. These estimated values are reviewed and evaluated by Carnegie. Due to the
inherent uncertainties of these estimates, these values may differ from the values that would have been
reported had a ready market for such investments existed.
All investments are exposed to various risks, such as interest rate, market, and credit risks. Due to the
level of risk associated with certain investment securities, it is at least reasonably possible that changes
in the values of investment securities will occur in the near term and that such changes could materially
affect the amounts reported in the financial statements. All changes in fair value are recognized in the
statements of activities.
Carnegie considers all highly liquid debt instruments purchased with original maturities of 90 days or
less to be cash equivalents. Money market and other highly liquid instruments held by investment
managers are reported as investments and bond proceeds.
(d) Income Taxes
Carnegie has been recognized by the Internal Revenue Service as exempt from federal income tax
under Section 501(c)(3) of the Internal Revenue Code (the Code) except for amounts from unrelated
business income. Carnegie is also an educational institution within the meaning of
Section 170(b)(1)(A)(ii) of the Code. The Internal Revenue Service has classified Carnegie as other
than a private foundation, as defined in Section 509(a) of the Code.
Carnegie has analyzed the tax positions taken and has concluded that as of June 30, 2018 and 2017,
there are no uncertain tax positions taken or expected to be taken that would require recognition or
disclosure in the financial statements.

CARNEGIE INSTITUTION FOR SCIENCE
Notes to Financial Statements
June 30, 2018 and 2017
7 (Continued)
(e) Fair Value of Financial Instruments
The fair value of investments in common stock and equity securities is based on quoted market prices.
The fair value of investments in bond funds, commingled funds, real estate, natural resources, absolute
return funds, and private equity is estimated using net asset value or its equivalent, as discussed in
note 1(c).
Carnegie uses interest rate and commodity swap agreements to mitigate the risk of changes in interest
rates associated with fixed interest rate indebtedness and changes in the market. Carnegie recognizes
derivative financial instruments at fair value.
Financial Accounting Standards Board (FASB) Accounting Standards Codification Topic 820, Fair
Value Measurement, establishes, among other things, a hierarchical disclosure framework, which
prioritizes and ranks the level of market price observability used in measuring financial instruments at
fair value. The hierarchy gives the highest priority to unadjusted quoted market prices in active markets
for identical assets or liabilities (Level 1) and the lowest priority to unobservable inputs (Level 3
measurements).
Fair value measurements are categorized in one of the following three categories:
Level 1 – Pricing inputs are unadjusted quoted prices available in active markets for identical assets or
liabilities.
Level 2 – Pricing inputs are quoted prices for identical assets or liabilities in markets that are not active,
or inputs that are observable either directly or indirectly, for substantially the full term of the asset or
liability through corroboration with observable market data.
Level 3 – Pricing inputs are unobservable for the investment and include situations where there is little,
if any, market activity for the investment. The inputs into the determination of fair value require
significant management judgment or estimation.
The level of a value determined for a financial instrument within the fair value hierarchy is based on the
lowest level of any input that is significant to the fair value measurement in its entirety. Determination of
what constitutes “observable” input requires judgment by Carnegie. In general, Carnegie considers
observable inputs to be market data that are readily available, regularly distributed or updated, reliable
and verifiable, and provided by independent sources that are actively involved in the relevant market.
(f) Use of Estimates
The preparation of financial statements in conformity with U.S. generally accepted accounting
principles requires management to make estimates and assumptions that affect the reported amounts
of assets and liabilities and disclosure of contingent assets and liabilities at the date of the financial
statements. Actual results could differ from those estimates. Carnegie makes significant estimates in
measurement and reporting including fair value of investments, useful lives of property and equipment,
allowances for doubtful pledges, income tax uncertainties, and other contingencies.

CARNEGIE INSTITUTION FOR SCIENCE
Notes to Financial Statements
June 30, 2018 and 2017
8 (Continued)
(g) Property and Equipment
Carnegie capitalizes expenditures for land, buildings and leasehold improvements, telescopes,
scientific and administrative equipment, and projects in progress. Routine replacement, maintenance,
and repairs are charged to expense.
Depreciation is computed on a straight-line basis, generally over the following estimated useful lives:
Buildings and telescopes 50 Years
Scientific and administrative equipment 2–10 Years,
based on
scientific life
of equipment
Long-lived assets, such as property and equipment, are reviewed for impairment whenever events or
changes in circumstances indicate that the carrying value amount of an asset may not be recoverable.
No impairments were recognized in 2018 or 2017.
(h) Contributions and Net Assets
Contributions are classified based on the existence or absence of donor-imposed restrictions.
Contributions are classified in categories of net assets as follows:
Unrestricted – Includes all contributions received without donor-imposed restrictions on use or time
Temporarily restricted – Includes contributions with donor-imposed restrictions as to purpose of gift
and/or time period expended
Permanently restricted – Generally includes endowment gifts in which donors stipulated that the
corpus be invested in perpetuity. Only the investment income generated from endowments may be
spent. Certain endowments require that a portion of the investment income be reinvested in
perpetuity.
Contributions include unconditional promises to give. In instances where such promises are to be
received after one year or more from the date of the gift, they are recorded at a discounted amount at
an appropriate risk-adjusted rate commensurate with the expected collection period. Amortization of
the discount is recorded as additional contribution revenue.
Expirations of temporary restrictions on net assets (i.e., the donor stipulated purpose has been fulfilled
or the stipulated time period has elapsed) are reported as releases of restrictions in the statements of
activities.
Gifts of long-lived assets, such as buildings or equipment, are considered unrestricted when placed in
service unless restricted by the donor. Cash gifts restricted for investment in long-lived assets are
released from restriction when the asset is acquired or as costs are incurred for asset construction.

CARNEGIE INSTITUTION FOR SCIENCE
Notes to Financial Statements
June 30, 2018 and 2017
9 (Continued)
(i) Grants
Carnegie records revenue on grants from federal agencies only to the extent that reimbursable
expenses are incurred. This revenue is treated as receivables until the cash drawdown is completed at
the end of each month. Funds received in excess of reimbursable expenses are recorded as deferred
revenue, and expenses in excess of funds received are recorded as accounts receivable.
Reimbursement of indirect costs may be based on provisional rates if final rates are not received.
These provisional rates are subject to subsequent audit by Carnegie’s federal cognizant agency, the
Department of Energy.
(j) Retirement Benefits
Carnegie has a noncontributory, defined contribution, money-purchase retirement plan in which all
U.S. personnel are eligible to participate. After one year of participation, an individual’s benefits are
fully vested. The plan has been funded through individually owned annuities issued by Teachers’
Insurance and Annuity Association and College Retirement Equities Fund.
Carnegie also provides postretirement medical benefits to all eligible employees (retirees as of that
date were grandfathered) who were age 50 or older and employed as of July 1, 2016, retire after
age 55 and have at least 10 years of service. Employees under age 40 on July 1, 2016 and who meet
the Rule of 75 (age plus years of service equal to at least 75) on or after age 55 may qualify for retiree
health. Employees hired on or after July 1, 2016, must meet the Rule of 75 on or after age 60.
(k) Allocation of Costs
The costs of providing programs and supporting services have been summarized in the statements of
activities. Most expenses are directly charged to the respective program or supporting activity. Certain
costs have been allocated among the programs based upon management’s estimate of each
program’s share of the allocated costs. Fundraising expenses of $2.7 million and $1.8 million for the
years ended June 30, 2018 and 2017, respectively, have been included in administrative and general
expenses in the accompanying statements of activities.
(l) New Accounting Standards
In May 2014, FASB issued ASU 2014-09, Revenue from Contracts with Customers (Topic 606) which
requires an entity to recognize revenue when the entity transfers promised goods and services to the
customer in an amount that reflects the consideration an entity expect to receive in exchange for the
goods and services. The guidance will be effective for Carnegie in the year ending June 30, 2019.
In February 2016, FASB issued ASU 2016-02, Leases, which will impact recognition of leased assets
and leased liabilities. The guidance will be effective for Carnegie in the year ending June 30, 2020.
In August 2016, FASB issued ASU 2016-14, Presentation of Financial Statement of Not-for-Profit
Entities, which will impact presentation of the net asset classes on the statement of the financial
position and the statement of activities and require enhanced disclosures related to the net assets and
liquidity. The guidance will be effective for Carnegie in the year ending June 30, 2019.
CARNEGIE INSTITUTION FOR SCIENCE
Notes to Financial Statements
June 30, 2018 and 2017
10 (Continued)
In June 2018, FASB issued ASU 2018-08: Clarifying the Scope and the Accounting Guidance for
Contributions Received and Contributions Made, which refined existing guidance to clarify the scope of
contribution accounting. The guidance will be effective for Carnegie in the year ending June 30, 2019.
Carnegie is currently in the process of evaluating the impact of adoption of these recently issued
accounting standards on its financial statements.
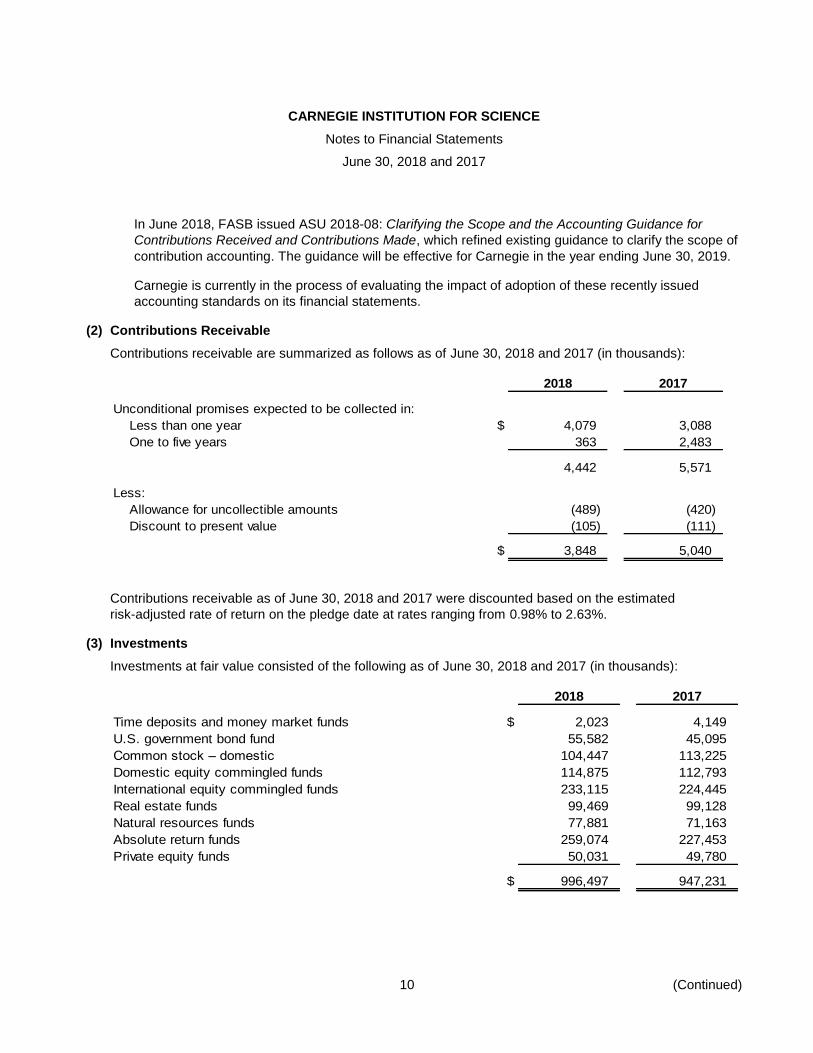
(2) Contributions Receivable
Contributions receivable are summarized as follows as of June 30, 2018 and 2017 (in thousands):
2018 2017
Unconditional promises expected to be collected in:
Less than one year $ 4,079 3,088
One to five years 363 2,483
4,442 5,571
Less:
Allowance for uncollectible amounts (489) (420)
Discount to present value (105) (111)
$ 3,848 5,040
Contributions receivable as of June 30, 2018 and 2017 were discounted based on the estimated
risk-adjusted rate of return on the pledge date at rates ranging from 0.98% to 2.63%.
(3) Investments
Investments at fair value consisted of the following as of June 30, 2018 and 2017 (in thousands):
2018 2017
Time deposits and money market funds $ 2,023 4,149
U.S. government bond fund 55,582 45,095
Common stock – domestic 104,447 113,225
Domestic equity commingled funds 114,875 112,793
International equity commingled funds 233,115 224,445
Real estate funds 99,469 99,128
Natural resources funds 77,881 71,163
Absolute return funds 259,074 227,453
Private equity funds 50,031 49,780
$ 996,497 947,231

CARNEGIE INSTITUTION FOR SCIENCE
Notes to Financial Statements
June 30, 2018 and 2017
11 (Continued)
Investment income, net consisted of the following for the years ended June 30, 2018 and 2017 (in
thousands):
2018 2017
Interest and dividends $ 10,299 12,198
Net realized gains 42,568 95,642
Net unrealized gains 46,932 15,414
Investment management expenses (4,134) (2,782)
$ 95,665 120,472
The following table represents investments that are measured at fair value on a recurring basis as of
June 30, 2018 (in thousands):
June 30
2018 Level 1 Level 2 Level 3 NAV (1)
Time deposits and money marketfunds $ 2,023 2,023 — — —
U.S. government bond funds 55,582 5,752 49,830 — — Common stock – domestic 104,447 104,033 — 414 — Domestic equity commingled funds 114,875 43,765 — — 71,110 International equity commingled
funds 233,115 — — — 233,115 Real estate funds 99,469 — — 2,045 97,424 Natural resources funds 77,881 — — 50,320 27,561 Absolute return funds 259,074 — — — 259,074 Private equity funds 50,031 — — — 50,031
$ 996,497 155,573 49,830 52,779 738,315
The following table represents investments that are measured at fair value on a recurring basis as of
June 30, 2017 (in thousands):
June 30
2017 Level 1 Level 2 Level 3 NAV (1)
Time deposits and money marketfunds $ 4,149 4,149 — — —
U.S. government bond funds 45,095 4,893 40,202 — — Common stock – domestic 113,225 112,811 — 414 — Domestic equity commingled funds 112,793 48,975 — — 63,818 International equity commingled
funds 224,445 30,460 — — 193,985 Real estate funds 99,128 — — 7,756 91,372 Natural resources funds 71,163 — — 49,238 21,925 Absolute return funds 227,453 — — — 227,453 Private equity funds 49,780 — — — 49,780
$ 947,231 201,288 40,202 57,408 648,333

CARNEGIE INSTITUTION FOR SCIENCE
Notes to Financial Statements
June 30, 2018 and 2017
12 (Continued)
(1) Certain investments are measured at fair value using NAV as a practical expedient for fair value and
have not been classified in the fair value hierarchy. The NAV amounts have been presented to permit
reconciliation of the fair value hierarchy to the amounts presented in the statements of financial
position.
The following table summarizes the nature and risk of Carnegie’s investments in funds, which are valued
based on NAV as a practical expedient for fair value as of June 30, 2018 and 2017 (in thousands):
2018
Fair value Unfunded Redemption
2018 2017 commitments frequency
Domestic equity commingled
fund (a) $ 71,110 63,818 15,027 Biennial
International equity
commingled funds (b) 233,115 193,985 — Monthly
Real estate funds (c) 97,424 91,372 44,136 Illiquid
Natural resources funds (d) 27,561 21,925 7,605 Illiquid
Quarterly,
Absolute return funds (e) 259,074 227,453 12,750 annual, biennial
Private equity funds (f) 50,031 49,780 25,560 Illiquid
$ 738,315 648,333 105,078
(a) This class comprises a single fund that invests in common stocks of biotechnology companies. This
fund seeks to produce returns that mirror or exceed various benchmarks established for comparable
portfolios. The notice period is 90 days and redemptions can me made once every two years at the end
of the calendar year.
(b) This class comprises five international partnerships that invest in public equity markets internationally
and one institutional mutual fund that mirrors an emerging markets index. These funds seek to produce
returns that mirror or exceed various benchmarks established for comparable portfolios. The majority of
Carnegie’s capital in this category can be redeemed on a monthly basis or more frequently. The notice
period is 30 days or less.
(c) This class includes several real estate funds that invest primarily in U.S. commercial real estate. One
fund targets commercial, residential, and industrial real estate in Europe. Investments under this
category cannot be redeemed. Instead, distributions are made from operating proceeds on a periodic
basis, typically monthly or quarterly. Proceeds from assets sold are generally distributed immediately. It
is estimated that the underlying assets of these funds will be liquidated over the next one to ten years.
(d) This class includes funds that invest primarily in timber and oil and gas assets. The investment strategy
is to acquire, operate, develop, and improve oil and gas and timber producing assets. Investments
under this category cannot be redeemed. Instead, distributions are made from operating proceeds on a
periodic basis, typically quarterly. Proceeds from assets sold may be distributed immediately. It is
CARNEGIE INSTITUTION FOR SCIENCE
Notes to Financial Statements
June 30, 2018 and 2017
13 (Continued)
estimated that the underlying assets of these funds will be liquidated over the next two to
fourteen years.
(e) This class comprises several separate funds, and include partnerships that invest in publicly traded
equities, fixed income securities; distressed fixed income securities; value investments, credit
investments, event-driven situations, real estate, and distressed credit investments; and distressed
credit securities and event-driven situations. In general, these funds seek to produce positive absolute
returns that do not necessarily correlate with the public markets. The majority of Carnegie’s capital in
this category can be redeemed on an annual basis; in some cases, redemptions can occur within a
year, with a minimum of typically 90 days’ notice. Less than one percent is invested in a partnership
where, under the current terms, funds are in liquidation and cannot be withdrawn. The underlying
assets are expected to be distributed over the next couple of years.
(f) This class comprises five separate managers and ten separate private equity funds that invest primarily
in leveraged buyouts, venture capital, emerging growth companies, corporate finance, and various
niche strategies. Private equity investment transactions may involve acquisitions, leveraged buyouts,
reorganizations, privatizations, restructurings, and spin-offs. Investments under this category cannot be
redeemed. Such distributions are made on a periodic basis, typically quarterly. It is estimated that the
underlying assets of these various funds will be liquidated over the next one to twelve years.
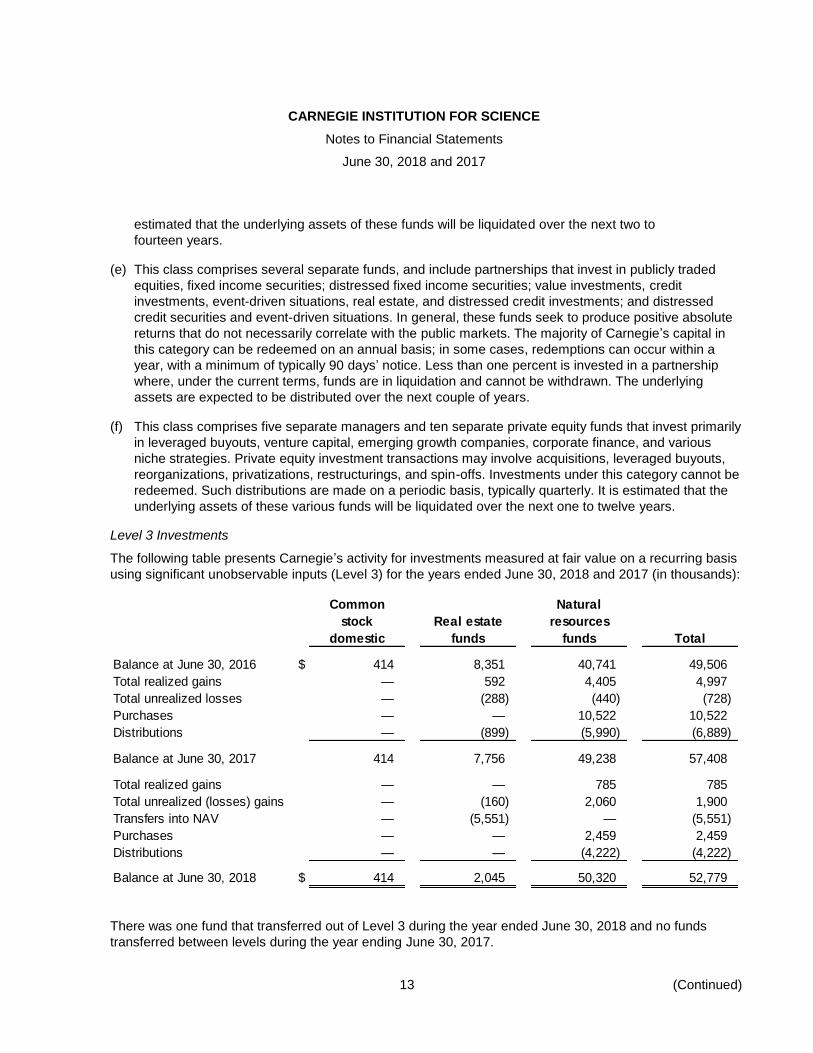
Level 3 Investments
The following table presents Carnegie’s activity for investments measured at fair value on a recurring basis
using significant unobservable inputs (Level 3) for the years ended June 30, 2018 and 2017 (in thousands):
Common Natural
stock Real estate resources
domestic funds funds Total
Balance at June 30, 2016 $ 414 8,351 40,741 49,506
Total realized gains — 592 4,405 4,997
Total unrealized losses — (288) (440) (728)
Purchases — — 10,522 10,522
Distributions — (899) (5,990) (6,889)
Balance at June 30, 2017 414 7,756 49,238 57,408
Total realized gains — — 785 785
Total unrealized (losses) gains — (160) 2,060 1,900
Transfers into NAV — (5,551) — (5,551)
Purchases — — 2,459 2,459
Distributions — — (4,222) (4,222)
Balance at June 30, 2018 $ 414 2,045 50,320 52,779
There was one fund that transferred out of Level 3 during the year ended June 30, 2018 and no funds
transferred between levels during the year ending June 30, 2017.
CARNEGIE INSTITUTION FOR SCIENCE
Notes to Financial Statements
June 30, 2018 and 2017
14 (Continued)
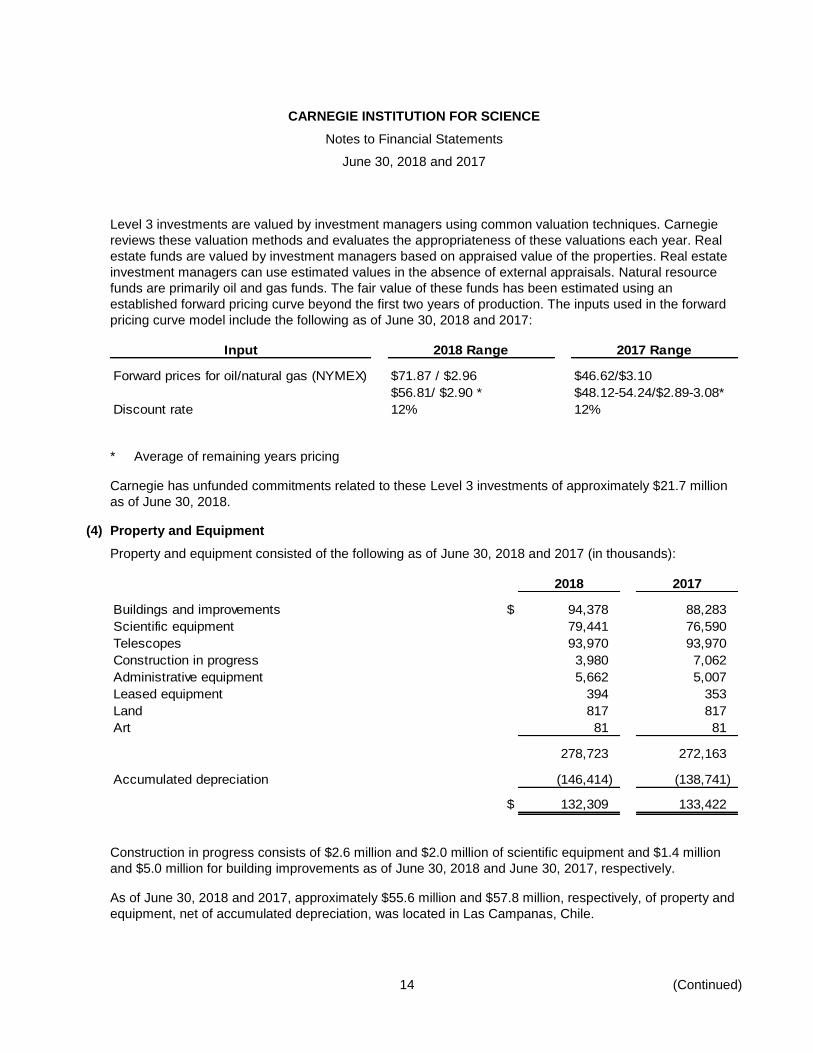
Level 3 investments are valued by investment managers using common valuation techniques. Carnegie
reviews these valuation methods and evaluates the appropriateness of these valuations each year. Real
estate funds are valued by investment managers based on appraised value of the properties. Real estate
investment managers can use estimated values in the absence of external appraisals. Natural resource
funds are primarily oil and gas funds. The fair value of these funds has been estimated using an
established forward pricing curve beyond the first two years of production. The inputs used in the forward
pricing curve model include the following as of June 30, 2018 and 2017:
Input 2018 Range 2017 Range
Forward prices for oil/natural gas (NYMEX) $71.87 / $2.96 $46.62/$3.10
$56.81/ $2.90 * $48.12-54.24/$2.89-3.08*
Discount rate 12% 12%
* Average of remaining years pricing
Carnegie has unfunded commitments related to these Level 3 investments of approximately $21.7 million
as of June 30, 2018.
(4) Property and Equipment
Property and equipment consisted of the following as of June 30, 2018 and 2017 (in thousands):
2018 2017
Buildings and improvements $ 94,378 88,283
Scientific equipment 79,441 76,590
Telescopes 93,970 93,970
Construction in progress 3,980 7,062
Administrative equipment 5,662 5,007
Leased equipment 394 353
Land 817 817
Art 81 81
278,723 272,163
Accumulated depreciation (146,414) (138,741)
$ 132,309 133,422
Construction in progress consists of $2.6 million and $2.0 million of scientific equipment and $1.4 million
and $5.0 million for building improvements as of June 30, 2018 and June 30, 2017, respectively.
As of June 30, 2018 and 2017, approximately $55.6 million and $57.8 million, respectively, of property and
equipment, net of accumulated depreciation, was located in Las Campanas, Chile.

CARNEGIE INSTITUTION FOR SCIENCE
Notes to Financial Statements
June 30, 2018 and 2017
15 (Continued)
(5) Magellan Consortium
During the year ended June 30, 1998, Carnegie entered into an agreement (Magellan Agreement) with four
universities establishing a consortium to build and operate the Magellan telescopes. The two Magellan
telescopes are located on Manqui Peak, Las Campanas in Chile. The first telescope, with a cost of
approximately $41.7 million, was placed in service during 2001. The other, with a cost of approximately
$30.1 million, was placed in service in 2003.
The university members of the consortium, by contribution to the construction and operating costs of
Magellan, acquire rights of access and oversight as described in the Magellan Agreement. Total
contributions by the university members for construction, which amounted to $36.0 million, covered
approximately 50% of the total construction costs. These monies were used by Carnegie to finance part of
the Magellan Telescopes’ construction costs. The contributions were recorded as deferred revenue and are
being recognized ratably as income over the remaining estimated useful lives of the telescopes. As of
June 30, 2018 and 2017, the deferred revenue for the consortium totaled $22.7 million and $23.4 million,
respectively.
(6) Long term deferred asset
Carnegie is a founder and initial contributor to the Giant Magellan Telescope (GMT) project, which is
managed by the Giant Magellan Telescope Organization Corporation (GMTO) that includes institutions
from the United States, Australia, and Korea. The GMTO is a nonprofit organization incorporated in 2007
for the purpose of developing and building a state-of-the-art, next-generation, extremely large telescope.
Contributors to the GMT project acquire rights of access to the telescope upon completion, as described in
the Founders’ Agreement dated March 20, 2009. Beginning in fiscal year 2010, Carnegie began to
capitalize cash contributions to the GMTO, primarily received through fundraising efforts, as a deferred long
term asset. The asset will be amortized over the expected 50 year life of the telescope beginning at the
time it is placed into service. Carnegie’s cash contributions to GMTO in fiscal years 2018 and 2017 were
$1.1 million and $1.5 million, respectively. The deferred long term asset value was $59.3 million and
$58.1 million at June 30, 2018 and 2017, respectively.
(7) Debt
(a) Bonds Payable
Bonds payable consisted of the following as of June 30, 2018 and 2017 (in thousands):
June 30,
2018 2017
Maryland Health and Higher Education Facilities Authority
(MHHEFA) 2010 Revenue Bonds $ 30,600 30,600
California Educational Facilities Authority (CEFA) 2010
Revenue Bonds 34,500 34,500
2014 Taxable bonds 50,000 50,000
Bond issue cost (62) (55)
$ 115,038 115,045

CARNEGIE INSTITUTION FOR SCIENCE
Notes to Financial Statements
June 30, 2018 and 2017
16 (Continued)
On February 4, 2010, MHHEFA issued unsecured $30.6 million of fixed rate, tax-exempt revenue
bonds on behalf of Carnegie. The structure of the bonds is two term bonds, maturing in 2037 and 2040.
The bond due July 1, 2037 bears interest at a fixed rate of 4.25% with sinking fund redemptions of
$6,120,000 on July 1, 2036 and $6,115,000 on July 1, 2037. The bond due July 1, 2040 bears interest
at a fixed rate of 4.50% with sinking fund redemptions of $6,115,000 on each of July 1, 2038, 2039,
and 2040. The bonds are subject to redemption and purchase prior to maturity, beginning on July 1,
2020, at the option of MHHEFA upon the direction of Carnegie. There are no financial covenants or
stand-by credit facilities associated with the bonds.
On March 24, 2010, CEFA issued unsecured fixed-rate, tax-exempt revenue bonds with a par value of
$34.5 million on behalf of Carnegie. The structure of the 2010 CEFA bond is a single, fixed-rate bond,
maturing in 2040, with a par value of $34.5 million. The bond bears interest at a fixed rate of 5.00%
with sinking fund redemptions of $6,905,000 on each July 1, 2036 through 2040. The 2010 California
bonds are subject to redemption and purchase prior to maturity, beginning on July 1, 2020, at the
option of CEFA upon the direction of Carnegie. There are no financial covenants or stand-by credit
facilities associated with the bonds.
On May 15, 2014, Carnegie issued unsecured 2014 Series fixed rate taxable bond with a par value of
$50 million, maturing 2054. Proceeds were used to finance a portion of the GMT project (note 6), and
other capital projects and operations in support of Carnegie’s scientific mission. The bond bears
interest at a fixed rate of 4.241% with sinking fund redemptions of $10,000,000 on each July 1, 2050
through 2054. The Series 2014 bonds are subject to redemption prior to maturity in whole or in part, on
any date, at the option of the issuer. There are no financial covenants or stand-by credit facilities
associated with the bonds.
The interest expense aggregated $5.2 million for the years ended June 30, 2018 and 2017.
(b) Line of Credit
In fiscal year 2017, Carnegie entered into an unsecured revolving credit facility with a maximum
principal amount of $12 million from a commercial bank. The line expires on May 31, 2019 and is
subject to covenants including a provision to reduce outstanding principal to zero for 30 consecutive
days. Borrowings under the facility bear interest at a floating London Interbank Offered Rate (LIBOR)
plus a credit spread of 0.59%. There were no amounts outstanding under the line of credit as of
June 30, 2018 and $6 million was outstanding as of June 30, 2017.
(c) Note Payable
Carnegie entered into a secured, 3 year term loan for $4.0 million in February 2018 from a commercial
bank. The interest rate on the loan is 3.42% and Carnegie pays monthly installments of $117,077. The
remaining liability of the loan is $3.57 million as of June 30, 2018, which is included in accounts
payable and accrued expenses.

CARNEGIE INSTITUTION FOR SCIENCE
Notes to Financial Statements
June 30, 2018 and 2017
17 (Continued)
(8) Interest Rate and Commodity Swap Agreements
The fair value of derivative instruments held as of June 30, 2018 and 2017 and the change in the fair value
for 2018 and 2017 is summarized as follows (in thousands):
June 30, Gain (loss) in fair value
2018 2017 2018 2017
MHHEFA 2010 – interest rate
swaps – liabilities $ 674 738 64 (428)
CEFA 2010 – interest rate
swaps – liabilities 619 674 56 (504)
$ 1,293 1,412 120 (932)
Swap liabilites are included in accounts payable and accrued expenses. Gain (loss) in fair value is included
in other income.
On February 11, 2010, Carnegie entered into a basis swap with Barclays Capital. Under this agreement,
Barclays Capital pays Carnegie 68.08% of three-month LIBOR and Carnegie pays Barclays Capital the
Securities Industry and Financial Markets Association Benchmark (SIFMA) minus 0.08% on a notional
amount of $22.9 million, which matches the amortization structure of the 2010 MHHEFA bonds (note 7(a)).
Carnegie may terminate and cash settle this transaction upon meeting a three business day notice
requirement, with both parties obligated to pay any amounts owed on the termination date.
In addition to this basis swap, on February 26, 2010, Carnegie entered into a fixed to floating interest rate
swap where Carnegie receives 3.69% and pays SIFMA on a notional amount of $7.6 million. Notional
matches the amortization structure of the 2010 bonds (note 7(a)). Carnegie may terminate and cash settle
the transaction upon meeting a three business day notice requirement and Barclays Capital owns the right
to cancel the swap with Carnegie after ten years and upon meeting a 30-calendar day notice requirement.
On March 17, 2010, Carnegie entered into a basis swap with Barclays Capital. Under this agreement,
Barclays Capital pays Carnegie 68.00% of three-month LIBOR and Carnegie pays Barclays Capital SIFMA
minus 0.11% on a notional amount of $25.9 million, which matches the amortization structure of the 2010
bonds (note 7(b)). Carnegie may terminate and cash settle this transaction upon meeting a three business
day notice requirement, with both parties obligated to pay any amounts owed on the termination date.
In addition to this basis swap, on March 17, 2010, Carnegie entered into a fixed to floating interest rate
swap where Carnegie receives 3.74% and pays SIFMA on a notional amount of $8.6 million. This
transaction matches the amortization structure of the 2010 bonds (note 7(b)). Carnegie may terminate and
cash settle the transaction upon meeting a three business day notice requirement and Barclays Capital
owns the right to cancel the swap with Carnegie after ten years and upon meeting a 30-calendar day notice
requirement.
(9) Employee Benefit Plans
(a) Retirement Plan
Contributions made by Carnegie, described in note 1(j), totaled approximately $5.1 million for the years
ended June 30, 2018 and 2017, respectively.
CARNEGIE INSTITUTION FOR SCIENCE
Notes to Financial Statements
June 30, 2018 and 2017
18 (Continued)
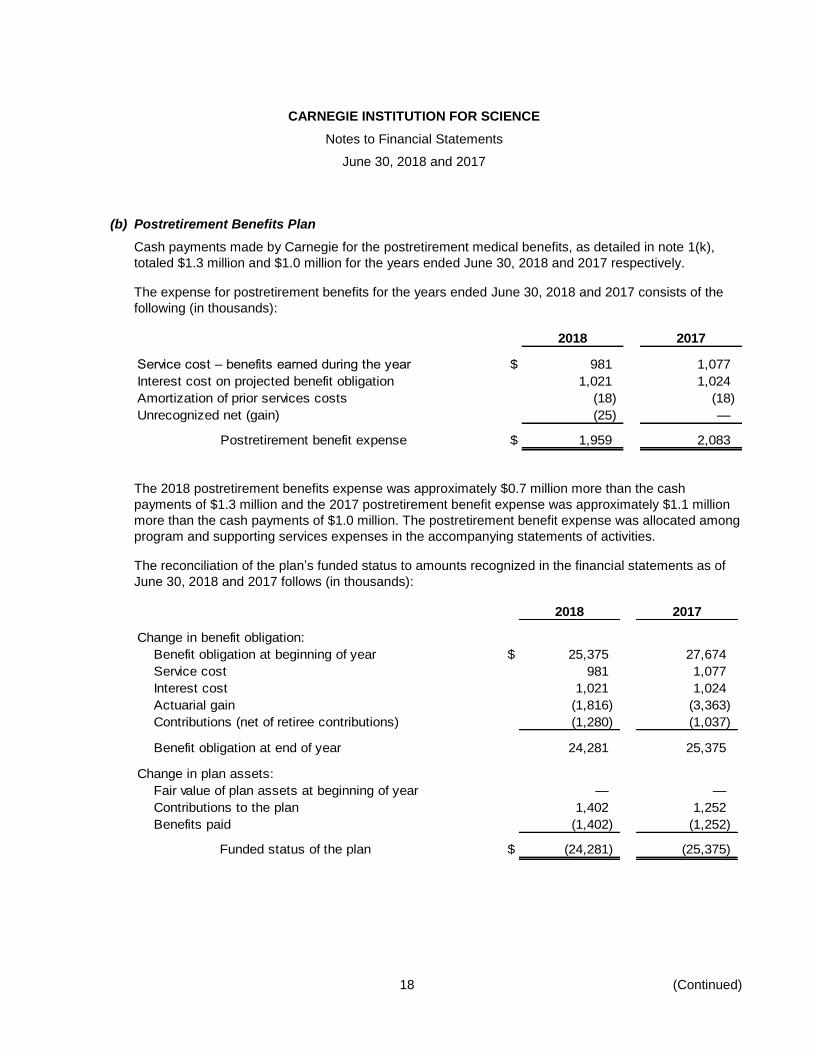
(b) Postretirement Benefits Plan
Cash payments made by Carnegie for the postretirement medical benefits, as detailed in note 1(k),
totaled $1.3 million and $1.0 million for the years ended June 30, 2018 and 2017 respectively.
The expense for postretirement benefits for the years ended June 30, 2018 and 2017 consists of the
following (in thousands):
2018 2017
Service cost – benefits earned during the year $ 981 1,077
Interest cost on projected benefit obligation 1,021 1,024
Amortization of prior services costs (18) (18)
Unrecognized net (gain) (25) —
Postretirement benefit expense $ 1,959 2,083
The 2018 postretirement benefits expense was approximately $0.7 million more than the cash
payments of $1.3 million and the 2017 postretirement benefit expense was approximately $1.1 million
more than the cash payments of $1.0 million. The postretirement benefit expense was allocated among
program and supporting services expenses in the accompanying statements of activities.
The reconciliation of the plan’s funded status to amounts recognized in the financial statements as of
June 30, 2018 and 2017 follows (in thousands):
2018 2017
Change in benefit obligation:
Benefit obligation at beginning of year $ 25,375 27,674
Service cost 981 1,077
Interest cost 1,021 1,024
Actuarial gain (1,816) (3,363)
Contributions (net of retiree contributions) (1,280) (1,037)
Benefit obligation at end of year 24,281 25,375
Change in plan assets:
Fair value of plan assets at beginning of year — —
Contributions to the plan 1,402 1,252
Benefits paid (1,402) (1,252)
Funded status of the plan $ (24,281) (25,375)

CARNEGIE INSTITUTION FOR SCIENCE
Notes to Financial Statements
June 30, 2018 and 2017
19 (Continued)
Pension related changes other than net periodic postretirement benefit cost consisted of the following
as of June 30, 2018 and 2017 (in thousands):
2018 2017
Unrecognized net actuarial gain $ 1,816 3,363
Unrecognized prior service costs (18) (18)
Amortization of net (gain) (25) —
$ 1,773 3,345
The unrecognized net loss and prior service costs that have not been recognized as a component of
net periodic postretirement benefit cost as of June 30, 2018 and 2017 are as follows (in thousands):
2018 2017
Unrecognized net actuarial (loss) $ (4,675) (2,884)
Unrecognized prior service costs (77) (95)
$ (4,752) (2,979)
The present value of the benefit obligation as of June 30, 2018 and 2017 was determined using an
assumed discount rate of 4.45% and 4.09%, respectively. The present value of the net periodic
postretirement benefit cost for the years ended June 30, 2018 and 2017 was determined using an
assumed discount rate of 4.09% and 3.75%, respectively. Carnegie’s policy is to fund postretirement
benefits as claims and administrative fees are paid.
For measurement purposes, a 7%, annual rate of increase in medical claims was assumed for 2018;
the rate of increase was assumed to decrease at 0.34% per year, eventually reaching 5% in 2024. The
healthcare cost trend rate assumption has a significant effect on the amounts reported. A
one-percentage point change in assumed annual healthcare cost trend rate would have the following
effects (in thousands):
One-percentage One-percentage
point increase point decrease
Effect on total of service and interest cost components $ 497 (371)
Effect on postretirement benefit obligation 4,285 (3,379)
The measurement date used to determine postretirement benefit obligations is June 30.
Carnegie expects to contribute approximately $0.8 million to its postretirement benefit plan during the
year ending June 30, 2019.
CARNEGIE INSTITUTION FOR SCIENCE
Notes to Financial Statements
June 30, 2018 and 2017
20 (Continued)
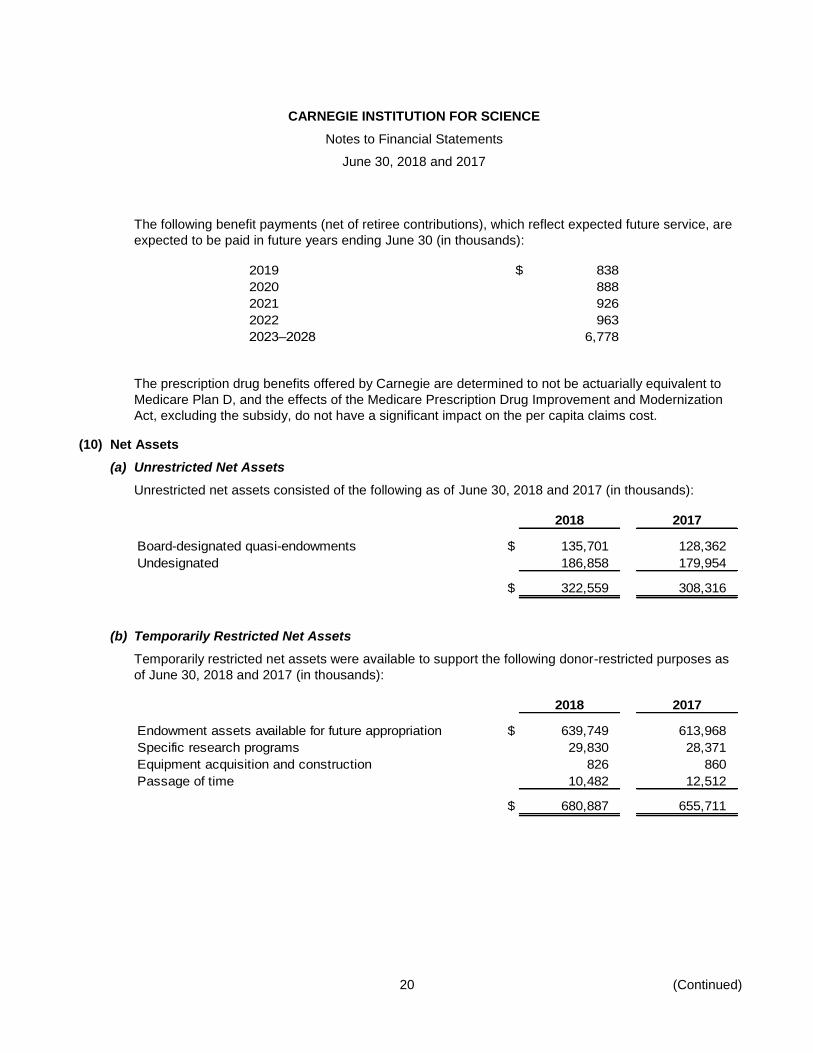
The following benefit payments (net of retiree contributions), which reflect expected future service, are
expected to be paid in future years ending June 30 (in thousands):
2019 $ 838
2020 888
2021 926
2022 963
2023–2028 6,778
The prescription drug benefits offered by Carnegie are determined to not be actuarially equivalent to
Medicare Plan D, and the effects of the Medicare Prescription Drug Improvement and Modernization
Act, excluding the subsidy, do not have a significant impact on the per capita claims cost.
(10) Net Assets
(a) Unrestricted Net Assets
Unrestricted net assets consisted of the following as of June 30, 2018 and 2017 (in thousands):
2018 2017
Board-designated quasi-endowments $ 135,701 128,362
Undesignated 186,858 179,954
$ 322,559 308,316
(b) Temporarily Restricted Net Assets
Temporarily restricted net assets were available to support the following donor-restricted purposes as
of June 30, 2018 and 2017 (in thousands):
2018 2017
Endowment assets available for future appropriation $ 639,749 613,968
Specific research programs 29,830 28,371
Equipment acquisition and construction 826 860
Passage of time 10,482 12,512
$ 680,887 655,711

CARNEGIE INSTITUTION FOR SCIENCE
Notes to Financial Statements
June 30, 2018 and 2017
21 (Continued)
(c) Permanently Restricted Net Assets
Permanently restricted net assets consisted of endowed gifts, the income from which is available to
support the following donor-restricted purposes as of June 30, 2018 and 2017 are as follows (in
thousands):
2018 2017
Specific research programs $ 15,496 15,289
Operation of Maxine Singer building 15,000 15,000
Equipment acquisition and construction 2,765 2,765
General support (Carnegie endowment) 22,116 22,116
$ 55,377 55,170
(d) Net Assets Released from Restrictions
During 2018 and 2017, Carnegie met donor-imposed requirements on certain gifts and, therefore,
released temporarily restricted net assets as follows (in thousands):
2018 2017
Appropriation of endowment assets $ 43,573 43,066
Specific research programs 6,441 7,510
Equipment acquisition and construction 34 15
$ 50,048 50,591
(11) Endowment
Carnegie’s endowment consists of a number of individual funds established for a variety of purposes. Its
endowment includes both donor-restricted endowment funds and funds designated by the Board of
Trustees to function as endowments to support the purposes of Carnegie. Net assets associated with
endowment funds are classified and reported based on the existence or absences of donor-imposed
restrictions.
(a) Interpretation of Relevant Law
Effective January 23, 2008, the District of Columbia enacted the Uniform Management of Institutional
Funds Act (UPMIFA), the provisions of which apply to endowment funds existing on or established after
that date. Based on its interpretation of the provisions of UPMIFA, Carnegie is required to act prudently
when making decisions to spend or accumulate donor-restricted endowment funds. As a result of this
interpretation, Carnegie classifies as permanently restricted net assets the original value of gifts
donated to the permanent endowment and subsequent gifts to the endowment. The remaining portion
of the endowment fund that is not classified in permanently restricted net assets is classified as
temporarily restricted net assets until those amounts are appropriated for expenditure by Carnegie in a
manner consistent with the standard of prudence prescribed by UPMIFA.

CARNEGIE INSTITUTION FOR SCIENCE
Notes to Financial Statements
June 30, 2018 and 2017
22 (Continued)
In accordance with UPMIFA, Carnegie considers the following factors in making a determination to
appropriate or accumulate donor-restricted endowment fund: the duration, preservation, and purposes
of the fund; general economic conditions, including inflation; expected total return from investments;
other resources; and investment and spending policies.
(b) Return Objectives and Risk Parameters
Carnegie’s Board of Trustees has adopted an investment policy, including return objectives, for its
endowment. This policy has identified an appropriate risk posture, stated expectations and objectives,
asset allocation guidelines, and criteria to monitor and evaluate the performance results of the
endowment fund’s managers. Carnegie expects the endowment fund to provide a real rate of return of
approximately 5% annually, while recognizing that performance in any given year may vary from this
goal.
(c) Strategies Employed for Achieving Objectives
To satisfy its long-term rate of return objectives, Carnegie relies on a total return strategy in which
investment returns are achieved through both capital appreciation (realized and unrealized) and current
yield (interest and dividends). Carnegie employs a diversified asset allocation strategy that allocates
investments among four broad asset classes: common stock, alternative assets, fixed income, and
cash. Common stock is subdivided into domestic and international categories. Alternative assets are
subdivided into absolute return partnerships, natural resources, real estate, and private equity funds.
(d) Spending Policy and How the Investment Objectives Relate to Spending Policy
The current Board-approved spending rule requires that the amounts appropriated for spending from
the endowment comprises a) 70% of the previous year’s budget, adjusted for inflation and b) 30% of
the most recent year-end endowment value, adjusted for debt, and then multiplied by the determined
spending rate, currently 5%, and adjusted for inflation. The rule functions to smooth annual
contributions from the endowment in support of the operating budget. In establishing this policy,
Carnegie considered the long-term expected return on its funds. Carnegie expects the current
spending and investment policies to grow its endowment to keep pace with inflation annually.
(e) Appropriation of Endowment Assets for Next Fiscal Year
For fiscal year 2019, Carnegie has appropriated $47.5 million of its endowment funds assets to be
distributed for spending. In accordance with the endowment spending policy described above, this
amount is calculated based upon an endowment spending rate of five percent (5%). Additional
amounts required to fulfill debt obligations of Carnegie are also authorized for expenditure.
(f) Funds with Deficiencies
From time to time, the fair value of assets associated with individual donor-restricted endowment funds
may fall below the level that the donor or UPMIFA requires Carnegie to retain as a fund of perpetual
duration. No such deficiencies existed as of June 30, 2018 or June 30, 2017.

CARNEGIE INSTITUTION FOR SCIENCE
Notes to Financial Statements
June 30, 2018 and 2017
23 (Continued)
(g) Endowment Net Asset Classification
Net asset classification by type of endowment as of June 30, 2018 and 2017 is as follows (in
thousands):
Temporarily Permanently
Unrestricted restricted restricted Total
June 30, 2018:
Donor-restricted endowment funds $ — 639,749 55,377 695,126
Board-designated endowment funds 135,701 — — 135,701
$ 135,701 639,749 55,377 830,827
June 30, 2017:
Donor-restricted endowment funds $ — 613,968 55,170 669,138
Board-designated endowment funds 128,362 — — 128,362
$ 128,362 613,968 55,170 797,500
Changes in endowment net assets for the years ended June 30, 2018 and 2017 were as follows (in
thousands):
Temporarily Permanently
Unrestricted restricted restricted Total
Endowment net assets, June 30, 2016 $ 118,593 570,405 55,156 744,154
Investment return:
Investment income 1,293 6,813 — 8,106
Net gains 15,145 79,816 — 94,961
Total investment return 16,438 86,629 — 103,067
Contributions 2 14 16
Appropriation of assets for expenditures (6,671) (43,066) — (49,737)
Endowment net assets, June 30, 2017 128,362 613,968 55,170 797,500
Investment return:
Investment income 833 4,340 — 5,173
Net gains 12,463 65,008 — 77,471
Total investment return 13,296 69,348 — 82,644
Contributions 5 207 212
Appropriation of assets for expenditures (5,962) (43,567) (49,529)
Endowment net assets, June 30, 2018 $ 135,701 639,749 55,377 830,827

CARNEGIE INSTITUTION FOR SCIENCE
Notes to Financial Statements
June 30, 2018 and 2017
24
(12) Lease Arrangements
Carnegie leases a portion of the land it owns in Las Campanas, Chile to other organizations. These
organizations have built and operate telescopes on the land. Most of the lease arrangements are not
specific and some are at no cost to the other organizations. The value of the no-cost leases could not be
determined and is not considered significant, and accordingly, contributions have not been recorded in the
financial statements.
Carnegie also leases a portion of one of its laboratories to another organization for an indefinite term.
Rents to be received under the agreement are approximately $200,000 annually, adjusted for inflationary
increases.
Carnegie leases land and buildings for various research departments. The monetary terms of the leases
are considerably below fair value; however, these terms were developed considering other nonmonetary
transactions between Carnegie and the related party lessors. Management believes the overall value of
such agreements is immaterial.
(13) Contingencies
Costs charged to the federal government under cost-reimbursement grants and contracts are subject to
government audit. Therefore, all such costs are subject to adjustment. Management believes that
adjustments, if any, would not have a significant effect on the financial statements.
(14) Related Party Transactions
A trustee of Carnegie is also the chairman of an investment entity with which Carnegie has invested
$45.7 million and $42.0 million in eight of its investment funds, as of June 30, 2018 and 2017, respectively.
Carnegie paid approximately $1.1 million and $0.7 million in management and incentive fees and interest to
these funds for the years ended June 30, 2018 and 2017, respectively.
(15) Subsequent Events
Carnegie has evaluated subsequent events through the date the financial statements were issued,
November 12, 2018 and determined no adjustments or disclosures were required.

25
Schedule
CARNEGIE INSTITUTION FOR SCIENCE
Schedules of Expenses
Years ended June 30, 2018 and 2017
(Dollars in 000’s)
2018 2017
Carnegie Federal and Total Carnegie Federal and Total
funds private grants expenses funds private grants expenses
Personnel costs:
Salaries $ 28,598 10,211 38,809 26,307 11,203 37,510
Fringe benefits and payroll taxes 10,447 2,553 13,000 10,427 3,327 13,754
Total personnel costs 39,045 12,764 51,809 36,734 14,530 51,264
Fellowship grants and awards 2,292 1,925 4,217 3,168 2,158 5,326
Depreciation 9,908 — 9,908 10,174 — 10,174
General expenses:
Educational and research supplies 2,861 1,508 4,369 2,266 1,632 3,898
Building maintenance and operation 3,479 723 4,202 4,016 1,746 5,762
Travel and meetings 1,784 1,364 3,148 1,763 1,550 3,313
Professional and contract services 3,127 1,464 4,591 2,665 1,346 4,011
Communications 477 61 538 387 69 456
Administrative and general 1,854 420 2,274 3,330 337 3,667
Interest 4,205 — 4,205 4,599 — 4,599
Subcontracts — 3,548 3,548 — 5,303 5,303
Equipment 6,345 3,712 10,057 5,715 7,510 13,225
Fund-raising expense 2,632 26 2,658 1,728 41 1,769
Total general expenses 26,764 12,826 39,590 26,469 19,534 46,003
Total direct costs 78,009 27,515 105,524 76,545 36,222 112,767
Indirect costs:
Grants and contracts (9,201) 9,201 — (10,048) 10,048 —
Total costs 68,808 36,716 105,524 66,497 46,270 112,767
Capitalized scientific equipment and facilities (8,892) — (8,892) (11,036) — (11,036)
Total expenses $ 59,916 36,716 96,632 55,461 46,270 101,731
See accompanying independent auditors’ report.