carrying capacities and site selection within the ... · carrying capacities and site selection...
TRANSCRIPT

19
Carrying capacities and site selection within the ecosystem approach to aquaculture
Ross, L.G., Telfer, T.C., Falconer, L., Soto, D., Aguilar-Manjarrez, J., Asmah, R., Bermúdez, J., Beveridge, M.C.M., Byron, C. J., Clément, A., Corner, R., Costa-Pierce, B.A., Cross, S., De Wit, M., Dong, S., Ferreira, J.G., Kapetsky, J.M., Karakassis, I., Leschen, W., Little, D., Lundebye, A.-K., Murray, F.J., Phillips, M., Ramos, L., Sadek, S., Scott, P.C., Valle-levinson, A., Waley, D., White, P.G. & Zhu, C. 2013. Carrying capacities and site selection within the ecosystem approach to aquaculture. In L.G. Ross, T.C. Telfer, L. Falconer, D. Soto & J. Aguilar-Manjarrez, eds. Site selection and carrying capacities for inland and coastal aquaculture, pp. 19–46. FAO/Institute of Aquaculture, University of Stirling, Expert Workshop, 6–8 December 2010. Stirling, the United Kingdom of Great Britain and Northern Ireland. FAO Fisheries and Aquaculture Proceedings No. 21. Rome, FAO. 282 pp.
AbstractThe growth in world aquaculture required to meet the demands of society will result in ever-increasing pressure upon aquatic and terrestrial resources. There are also potential consequences on the environment and on biodiversity, as well as inevitable societal impacts. There is growing adoption of aspects of the ecosystem approach to aquaculture (EAA), which takes a holistic view of the developments in the sector in an attempt to enable sustainable growth while avoiding negative effects. Carrying capacity is a major component of EAA, but defining what is meant by carrying capacity, how to evaluate it and how to implement standards is not a straightforward matter. This global review summarizes present views on this topic, and considers definitions of the different carrying capacities and methods and models for their evaluation. It also identifies some outstanding questions and bottlenecks. Proposals are made for a way forward that may result in flexible guidelines for implementing well-planned site selection and carrying capacity estimations within the EAA.
IntroductionWorldwide, aquaculture will need to increase production significantly during the next few decades to ensure sufficient animal protein supply to the increasing human population (Duarte et al., 2009). Though the majority of aquaculture throughout the world is undertaken in freshwater systems, use of coastal and shelf ecosystems for aquaculture will increase substantially, putting even greater environmental pressures on their ecosystem goods and services.
The location of aquaculture activities has historically been based on a combination of local demand and agro-ecology, with global demand and deteriorating capture fishery stocks having an increasing influence (Little et al., 2012). External interventions aimed at stimulating aquaculture growth have often been driven by short-term objectives and geo-political boundaries without paying enough attention to other key criteria for successful aquaculture, often resulting in limited development and sustainability. Established and developing aquaculture sectors have sometimes “clustered” around
20 Site selection and carrying capacities for inland and coastal aquaculture
important resources or services, to greater effect, taking into account a wide range of factors including the environment, proximity to markets and transportation links. These drivers have been most relevant in aquaculture development, especially in Asia-Pacific where the sector originated and the region with the largest production. However, continuous expansion is not always possible, and in many places the siting of farms is considered suboptimal, limiting production.
Any growth in aquaculture production will involve an expansion of cultivated areas, a higher density of aquaculture installations and the increased use of feeds, fertilizer and chemical inputs, as well as increased land and water use. Because aquaculture is a resource-based activity, which competes for economic, social, physical and ecological resources with other industries, its development could have negative impacts on industries such as fisheries, agriculture and tourism. In addition, use of environmental goods and services leads to impacts that can have both social and economic implications (FAO, 2008). As a result, it is vital that the carrying capacity of these systems is considered integral to the development and site selection process for aquaculture activities, and is inherent in adoption of good practices and sound environmental regulation to ensure the sustainability of aquaculture-based food production.
Other frameworks and institutions such as the European Union Water Framework Directive, the Marine Strategy Framework Directive, Canada’s Oceans Act, and the United States of America National Policy for the Stewardship of the Ocean, Coasts and Great Lakes all call for spatial planning for human activities, such as aquaculture, to be carried out in a more sustainable fashion, including the essential components of: (i) knowledge-based approaches for decision-making; and (ii) ecosystem-based approaches for integrated management.
The objective of this paper is to review critically the concepts of carrying capacity and aquaculture spatial location within the framework of EAA development and to suggest a strategy for their implementation to ensure greater sustainability for future inland and coastal aquaculture developments throughout the world.
Concepts of carrying capacityCarrying capacity is an important concept for ecosystem-based management, which helps set the upper limits of aquaculture production given the environmental limits and social acceptability of aquaculture, thus avoiding “unacceptable change” to both the natural ecosystem and the social functions and structures. In general terms, carrying capacity for any sector can be defined as the level of resource use both by humans or animals that can be sustained over the long term by the natural regenerative power of the environment. This is complementary to assimilative capacity, which is defined as “the ability of an area to maintain a healthy environment and accommodate wastes” (Fernandes et al., 2001), and to environmental capacity, which is defined as “the ability of the environment to accommodate a particular activity or rate of activity without unacceptable impact” (GESAMP, 1986). In addition to the above, Davies and McLeod (2003) defined carrying capacity as “the potential maximum production a species or population can maintain in relation to available food resources”. Assessment of carrying capacity is one of the most important tools for technical assessment of not only the environmental sustainability of aquaculture as it is not limited to farm or population sizes issues, but it can also be applied at ecosystem, watershed and global scales. Although these general views of carrying capacity for aquaculture are based solely on production, they have been developed further into a more comprehensive four-category approach based on physical, production, ecological and social carrying capacity (Inglis, Hayden and Ross, 2000; McKindsey et al., 2006). Although these accepted definitions were originally described specifically for bivalve aquaculture, they have also been applied to finfish cage culture (Gaĉek and Legović, 2010).
21
•Physical carrying capacity is based on the suitability for development of a given activity, taking into account the physical factors of the environment and the farming system. In its simplest form, it determines development potential in any location, but is not normally designed to evaluate that against regulations or limitations of any kind. In this context, this can also be considered as identification of sites or potential aquaculture zones from which a subsequent more specific site selection can be made for actual development.
•Thiscapacityconsiderstheentirewaterbody,orwaterbodies,andidentifiesthetotalarea suitable for aquaculture. Inglis, Hayden and Ross (2000) and McKindsey et al. (2006) note that physical carrying capacity does not indicate at what density cultured organisms are stocked or their production biomass. Physical carrying capacity is useful to quantify potential adequate and available areas for aquaculture in the ecosystem, but it offers little information on aquaculture’s limits at the waterbody or watershed level within the EAA. In terrestrial aquaculture, it can define the capacity of the area for the construction of ponds or the availability of water supply.
•Production carrying capacity estimates the maximum aquaculture production and is typically considered at the farm scale. For the culture of bivalves, this is the stocking density at which harvests are maximized. However, production biomass calculated at production carrying capacity could be restricted to smaller areas within a water basin so that the total production biomass of the water basin does not exceed that of the ecological carrying capacity, for example, fish cage culture in a lake.
•Estimatesofthiscapacityaredependentuponthetechnology,productionsystemand the investment required, with investment being defined by Gibbs (2009) as an “economic” capacity, being the biomass at a particular location for which investment can be secured.
•Ecological carrying capacity is defined as the magnitude of aquaculture production that can be supported without leading to significant changes to ecological processes, services, species, populations or communities in the environment.
•Gibbs (2007) discussed a number of issues pertaining to the definition andcalculation of ecological carrying capacity, and highlighted the fact that bivalve aquaculture can have an impact on the system because bivalves are both consumers (of phytoplankton) and producers (by recycling nutrients and detritus) with the concomitant ecosystem impacts of both. In determining ecological carrying capacity, he has urged caution when attributing cause of change (and partitioning impacts) between bivalve culture and other activities in the ecosystem. On the other hand, fish cage culture, for example, uses ecosystem services for the degradation of organic matter and nutrients and provision of oxygen, but a certain level of fish biomass may exceed the system capacity to process nutrients and provide oxygen, thus generating eutrophication.
•Social carrying capacity has been defined as the amount of aquaculture that can be developed without adverse social impacts.
Byron et al. (2011) have stated that the ultimate goal of determinations of social carrying capacity is to quantify the value of the involvement of stakeholders in a science-based effort to determine the proper limits to aquaculture in their local waters. Ecological degradation or adverse changes to ecosystems attributed to aquaculture may inhibit social uses. According to Byron et al. (2011), the point at which alternative social uses become prohibitive due to the level, density or placement of aquaculture farms is the social carrying capacity of aquaculture. Angel and Freeman (2009) refer to social carrying capacity as the concept reflecting the trade-offs among all stakeholders using common property resources and as the most difficult to quantify, but as the most critical from the management perspective. For example, if there is widespread opposition to aquaculture in a particular place, the prospects for its expansion will be limited.
Carrying capacities and site selection within the ecosystem approach to aquaculture
22 Site selection and carrying capacities for inland and coastal aquaculture
According to Little et al. (2012), aquaculture has the potential to exert significant social and economic impacts through upstream and downstream links around the use of water, seed, feed, chemicals, wastes expelled, etc. This incorporates a broad section of people as stakeholders. Similarly, employment along the value chains, both upstream and downstream, brings benefits to many people not directly involved in farming. Such implications can make the setting of boundaries for the estimation of social carrying capacity very challenging.
The ecosystem approach to aquaculture as a framework for carrying capacityIn 2006, the FAO Fisheries and Aquaculture Department recognized the need to develop an ecosystem-based management approach to aquaculture to strengthen the implementation of the FAO Code of Conduct for Responsible Fisheries (FAO, 1995). FAO proposed an ecosystem approach to aquaculture (EAA), defined as a strategy for the integration of aquaculture within the wider ecosystem such that it promotes sustainable development, equity, and resilience of interlinked social-ecological systems (Soto, Aguilar-Manjarrez and Hishamunda, 2008; FAO, 2010). The strategy is guided by three key principles, namely:
•Principle1:Aquaculturedevelopmentandmanagementshouldtakeaccountofthe full range of ecosystem functions and services, and should not threaten the sustained delivery of these to society.
•Principle 2:Aquaculture should improve humanwell-being and equity for allrelevant stakeholders.
•Principle 3: Aquaculture should be developed in the context of other sectors,policies and goals.
It is recognized that defining, developing and adapting existing methods to estimate resilience capacity, or the limits to “acceptable environmental change”, are essential tasks to moving forward with an EAA. Changes in the regulatory framework have recently led to a more stringent approach to licensing in many countries, e.g. in the European Union, Canada, the Republic of Chile and the United States of America. Nevertheless, only in a few countries (e.g. Ferreira et al., 2008a) has there been a concern with the assessment of carrying capacity at the system scale, i.e. to define and quantify potential aquaculture zones as an initial step prior to local-scale licensing of aquaculture operations.
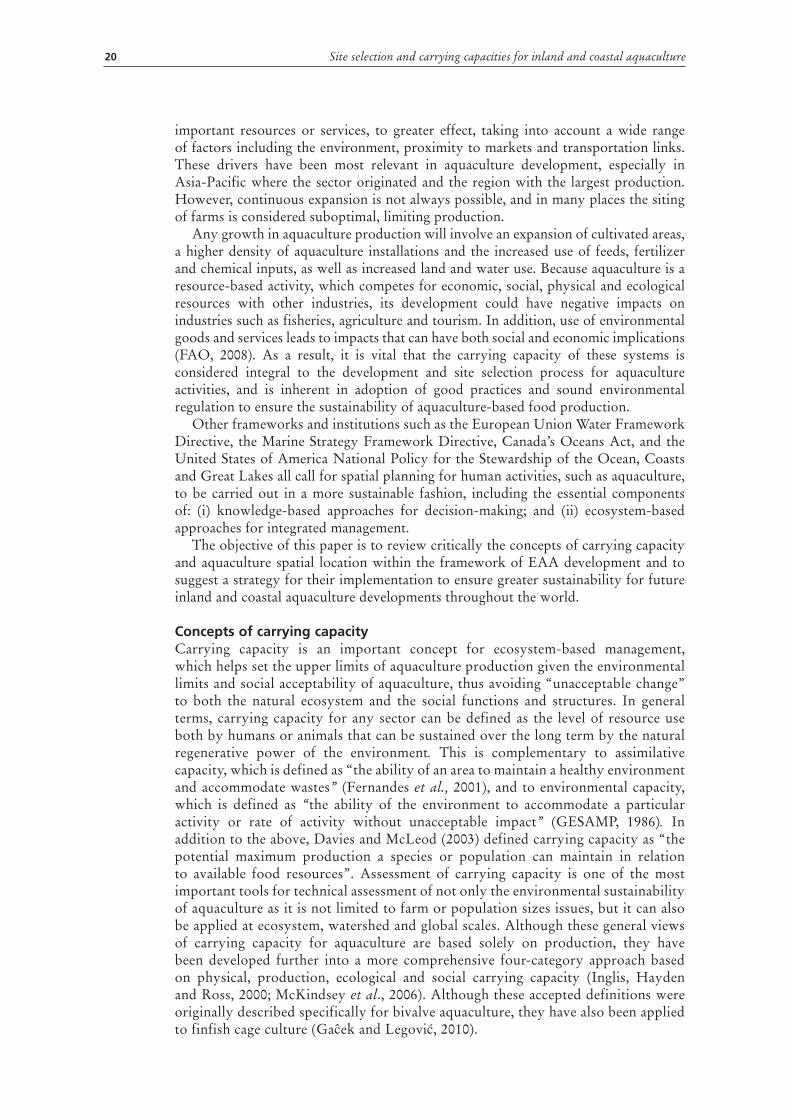
The application of the EAA at different geographical scales requires the harmonization of three objectives that comply with the EAA principles: (i) environmental; (ii) socio-economic; and (iii) governance, including multisectoral planning (FAO, 2010). These three objectives and their relative weights can differ among countries and across world regions, making it challenging to define a single standard for uniform compliance with respect to limits and thresholds.

23
The four carrying capacity categories as defined by McKindsey et al. (2006) can be weighted according to region and aquaculture system. Thus, the three core objectives of EAA can be mapped onto the four categories of carrying capacity, and illustrated as the overlap of these (Figure 1). The social category covers the socio-economic and governance objectives of the EAA as indicated above. The importance (size) of each circle represented will vary regionally or with culture system and will develop through time based on the feedback society provides. However, the need for harmonization of the three EAA objectives for the long-term sustainability of aquaculture must be kept in mind.
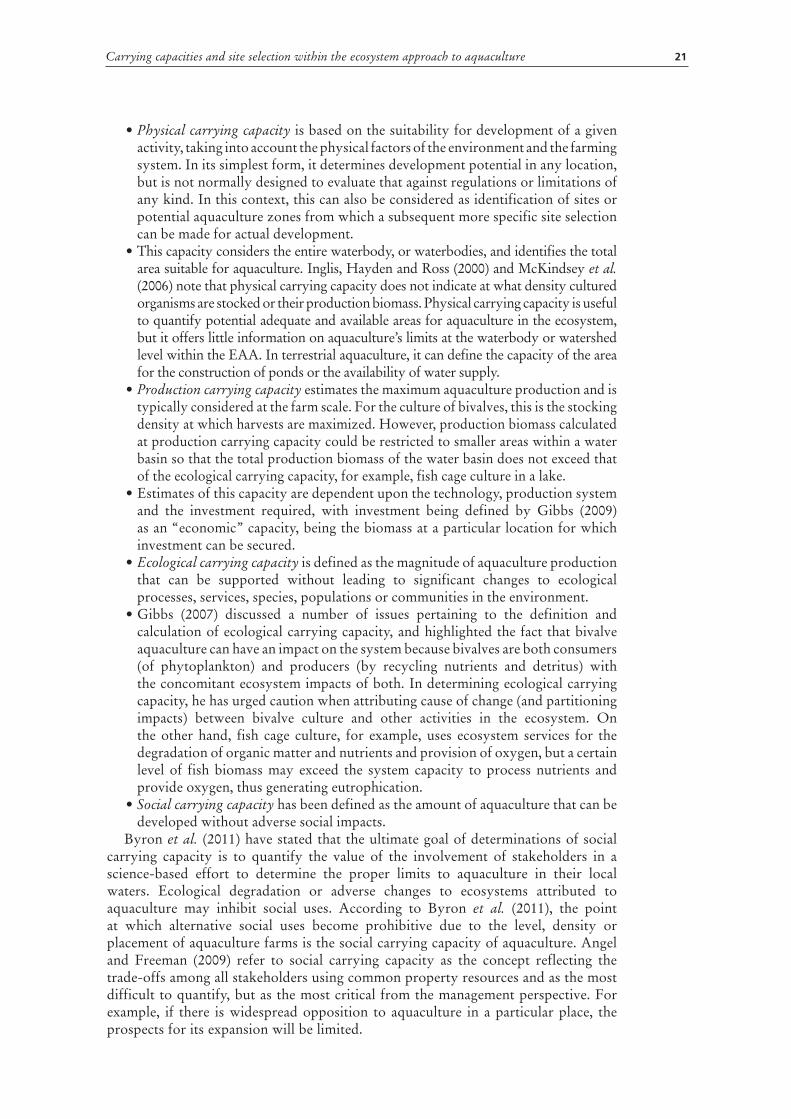
McKindsey et al. (2006) proposed a hierarchical structure to determine the carrying capacity of a given area, where the first stage would involve determining the physical carrying capacity or suitability of a site based on the natural conditions and needs of the species and culture system, followed by the calculation of the production carrying capacity of the available area using models (Figure 2). Models would also be used in the next stage to estimate the ecological carrying capacity and evaluating the range of potential outcomes for production ranging from no production to maximum production level, as determined in the previous step. The final stage would be to assess the different scenarios based on the outcomes from each of the previous steps and then make a decision on the level of acceptable productivity; this would introduce the social carrying capacity. The first two steps of the process (physical and production carrying capacities) do not depend on social values, whereas both ecological and social carrying capacities do. This requires environmental variables of interest to be defined by society before determining the ecological carrying capacity.
Salient characteristics of aquaculture potential, zoning, siting and carrying capacity, including purpose, scope, scales, executing entity, data needs, required resolution and results obtained, are proposed in Table 1 in order to show how these activities relate to one another. This approach is most appropriate when new developments are being considered or when there is little or no prior aquaculture activity in the area. Potential, siting and zoning for aquaculture are all development activities that may
Carrying capacities and site selection within the ecosystem approach to aquaculture
FIGURE 2Hierarchical structure to determine carrying capacity of a given area.
Social carrying capacity feeds back directly to ecological carrying capacityto provide guidance to choose pertinent response variables to measure
Source: modified from McKindsey et al. (2006).
24 Site selection and carrying capacities for inland and coastal aquaculture
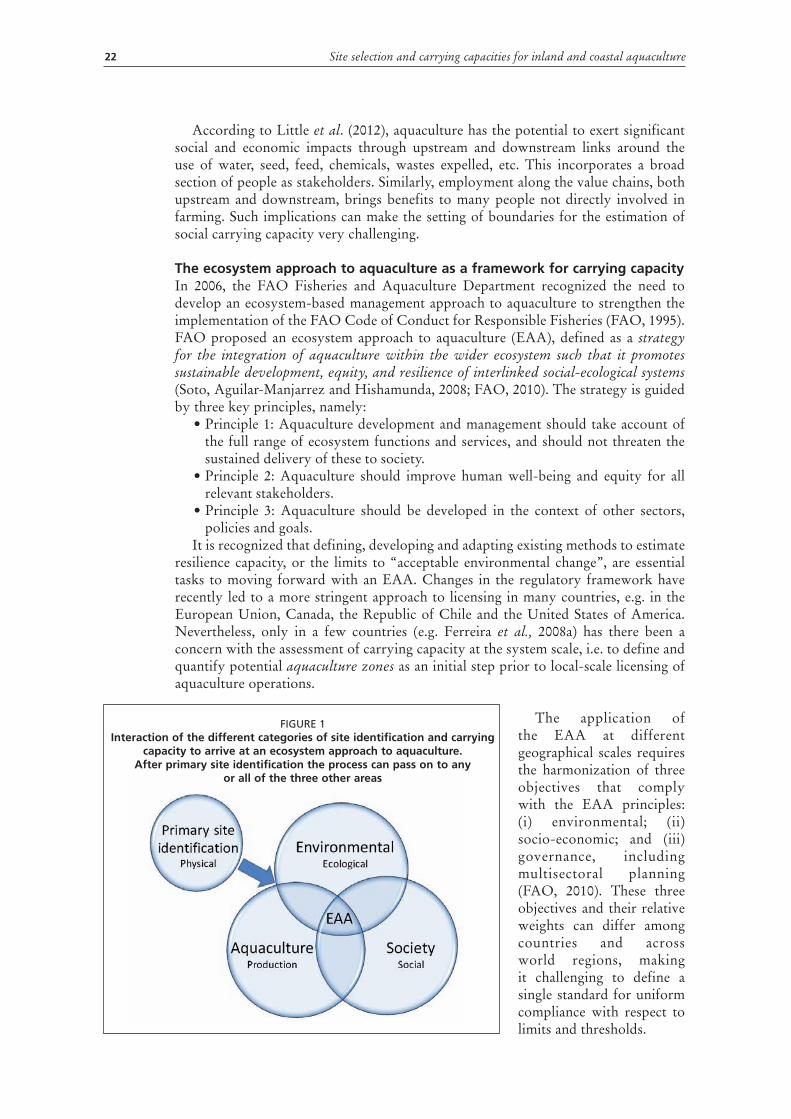
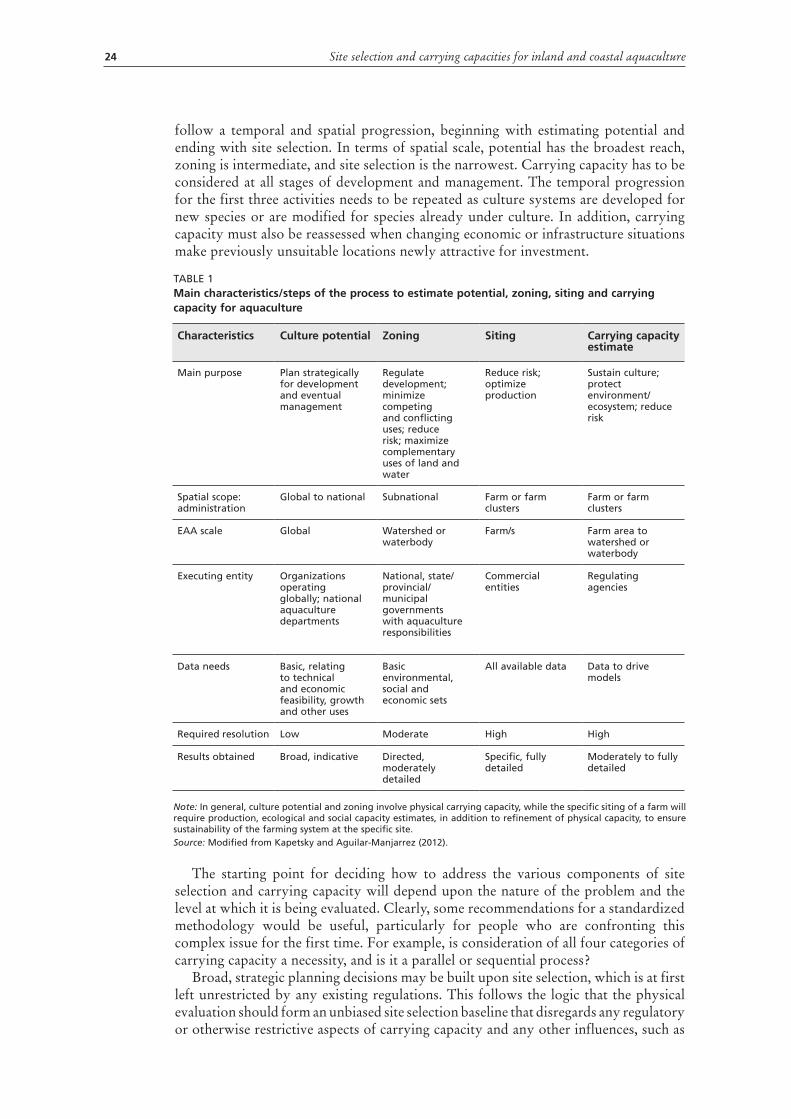
follow a temporal and spatial progression, beginning with estimating potential and ending with site selection. In terms of spatial scale, potential has the broadest reach, zoning is intermediate, and site selection is the narrowest. Carrying capacity has to be considered at all stages of development and management. The temporal progression for the first three activities needs to be repeated as culture systems are developed for new species or are modified for species already under culture. In addition, carrying capacity must also be reassessed when changing economic or infrastructure situations make previously unsuitable locations newly attractive for investment.
The starting point for deciding how to address the various components of site selection and carrying capacity will depend upon the nature of the problem and the level at which it is being evaluated. Clearly, some recommendations for a standardized methodology would be useful, particularly for people who are confronting this complex issue for the first time. For example, is consideration of all four categories of carrying capacity a necessity, and is it a parallel or sequential process?
Broad, strategic planning decisions may be built upon site selection, which is at first left unrestricted by any existing regulations. This follows the logic that the physical evaluation should form an unbiased site selection baseline that disregards any regulatory or otherwise restrictive aspects of carrying capacity and any other influences, such as
TABLE 1Main characteristics/steps of the process to estimate potential, zoning, siting and carrying capacity for aquaculture
Characteristics Culture potential Zoning Siting Carrying capacity estimate
Main purpose Plan strategically for development and eventual management
Regulate development; minimize competing and conflicting uses; reduce risk; maximize complementary uses of land and water
Reduce risk; optimize production
Sustain culture; protect environment/ ecosystem; reduce risk
Spatial scope: administration
Global to national Subnational Farm or farm clusters
Farm or farm clusters
EAA scale Global Watershed or waterbody
Farm/s Farm area to watershed or waterbody
Executing entity Organizations operating globally; national aquaculture departments
National, state/provincial/municipal governments with aquaculture responsibilities
Commercial entities
Regulating agencies
Data needs Basic, relating to technical and economic feasibility, growth and other uses
Basic environmental, social and economic sets
All available data Data to drive models
Required resolution Low Moderate High High
Results obtained Broad, indicative Directed, moderately detailed
Specific, fully detailed
Moderately to fully detailed
Note: In general, culture potential and zoning involve physical carrying capacity, while the specific siting of a farm will require production, ecological and social capacity estimates, in addition to refinement of physical capacity, to ensure sustainability of the farming system at the specific site.Source: Modified from Kapetsky and Aguilar-Manjarrez (2012).
25
competing land uses. This sequence was also advocated by McKindsey et al. (2006). Further site-related considerations at a national or regional level may be the strategic development of sites clustered or agglomerated into aquaculture zones, or aqua parks, as has occurred in many locations worldwide.
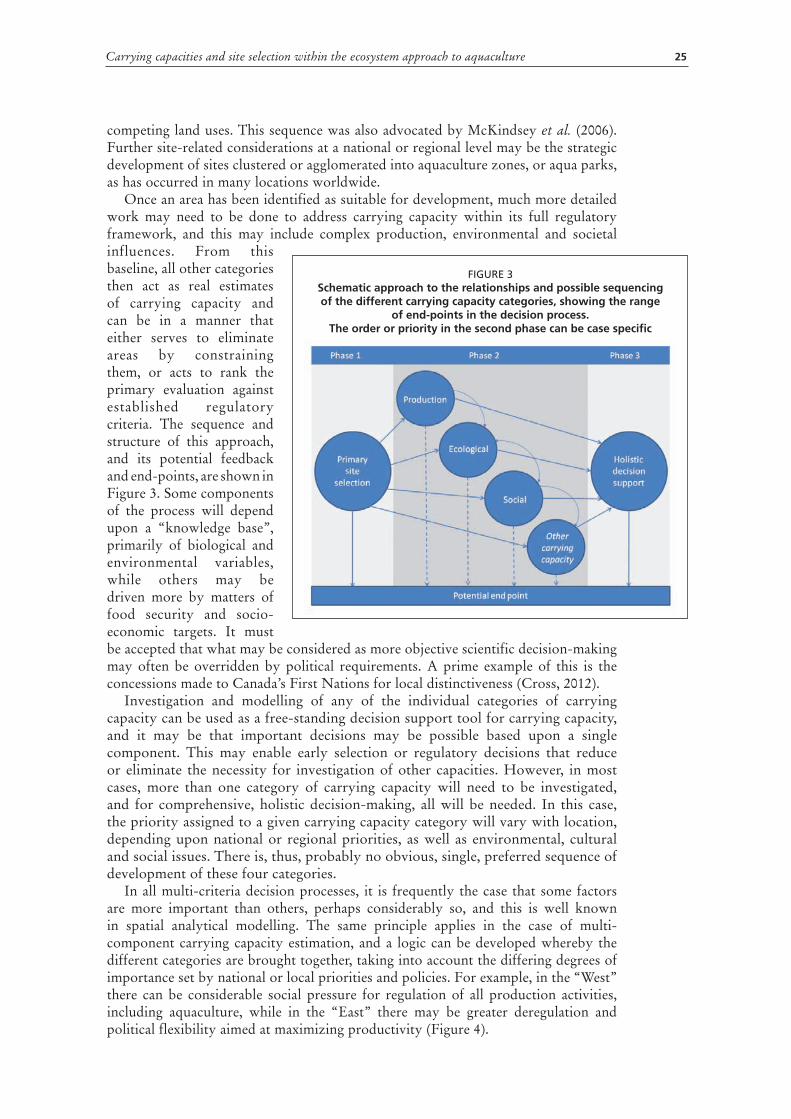
Once an area has been identified as suitable for development, much more detailed work may need to be done to address carrying capacity within its full regulatory framework, and this may include complex production, environmental and societal influences. From this baseline, all other categories then act as real estimates of carrying capacity and can be in a manner that either serves to eliminate areas by constraining them, or acts to rank the primary evaluation against established regulatory criteria. The sequence and structure of this approach, and its potential feedback and end-points, are shown in Figure 3. Some components of the process will depend upon a “knowledge base”, primarily of biological and environmental variables, while others may be driven more by matters of food security and socio-economic targets. It must be accepted that what may be considered as more objective scientific decision-making may often be overridden by political requirements. A prime example of this is the concessions made to Canada’s First Nations for local distinctiveness (Cross, 2012).
Investigation and modelling of any of the individual categories of carrying capacity can be used as a free-standing decision support tool for carrying capacity, and it may be that important decisions may be possible based upon a single component. This may enable early selection or regulatory decisions that reduce or eliminate the necessity for investigation of other capacities. However, in most cases, more than one category of carrying capacity will need to be investigated, and for comprehensive, holistic decision-making, all will be needed. In this case, the priority assigned to a given carrying capacity category will vary with location, depending upon national or regional priorities, as well as environmental, cultural and social issues. There is, thus, probably no obvious, single, preferred sequence of development of these four categories.
In all multi-criteria decision processes, it is frequently the case that some factors are more important than others, perhaps considerably so, and this is well known in spatial analytical modelling. The same principle applies in the case of multi-component carrying capacity estimation, and a logic can be developed whereby the different categories are brought together, taking into account the differing degrees of importance set by national or local priorities and policies. For example, in the “West” there can be considerable social pressure for regulation of all production activities, including aquaculture, while in the “East” there may be greater deregulation and political flexibility aimed at maximizing productivity (Figure 4).
Carrying capacities and site selection within the ecosystem approach to aquaculture

26 Site selection and carrying capacities for inland and coastal aquaculture
Aquaculture systems and species cultured vary considerably across the world, and can be either feed based or organically extractive in nature. Both of these culture types can occur in open coast marine systems or inland freshwater systems. Site selection is highly dependent on the type of aquaculture system, the location and interactions between the systems, and the surrounding environment (Table 2).
Feed-based aquaculture in cages (open water environments) or ponds (inland or fringing environments) is mainly constrained by physical capacity and wastewater reduction criteria. In Southeast Asia and the People’s Republic of China, there is greater preoccupation with production and physical capacities, whereas in the European Union and the United States of America legislation ensures greater emphasis on negative externalities.
Extractive aquaculture, because of the nature of its food intake, normally occupies relatively large areas, often including large shorefront leases. The issues that have emerged with respect to carrying capacity have been largely (i) production related, such as the reduced growth and harvest size of the Pacific oyster (Crassostrea gigas) in the Marennes-Oléron area of the French Republic in the mid-1990s, which was mainly attributed to overstocking (Raillard and Ménesguen, 1994); or (ii) social concerns in developed nations on the use of waterfront areas (e.g. the geoduck industry in Puget Sound, Cheney et al., 2010), landscape values, etc. The physical carrying capacity for extractive species may be already limited in some parts of Asia because of increasing human pressure on coastal marine environments also accompanied by water pollution.
Type Present Future
Feed-based aquaculture (e.g. cages, ponds)
Site selection based on maximizing production, waste dispersion (cages), wastewater minimization (ponds)
Integrated model systems, risks, welfare, disease Holistic indicatorsLife-cycle analysis: inefficiencies and ecolabellingMechanistic and statistical modelsData assimilation modelsMaximizing production
Shellfish farming Large areas Harmful algal bloomsFocus on production and social carrying capacity
Economic sustainability, ecology and economics Coupled GIS expert systems including xenobiotics harmful algal blooms, etc.Model uncertainties in yield Early warning
Integrated multitrophic aquaculture
Optimize productionReduce negative externalities
Combination with integrated coastal zone managementSimulation of species combinationsFull economic assessment.Combine GIS, remote sensing and modelling
TABLE 2Examples of the main issues currently considered in site selection, together with what may constitute future components for assessment.
Source: Modified from Ferreira, Ramos and Costa-Pierce (2012).
27
Appropriately dimensioned shellfish culture has been shown to have little effect on the benthos (Fabi, Manoukian and Spagnolo, 2009), even when large areas are cultivated (Zhang et al., 2009). Bioextraction for top-down control of eutrophication symptoms has been documented in many parts of the world (e.g. Xiao et al., 2007), and it is clear that the presence of significant levels of shellfish aquaculture (e.g. in the People’s Republic of China) has been instrumental in controlling coastal eutrophication, probably on a national scale (Sorgeloos, 2010). In addition, integrated multitrophic aquaculture (IMTA) has long been practised in Asia, and is an important farming system in the People’s Republic of China. Currently, the interest in co-cultivation across trophic levels, as represented by IMTA systems, is growing in the European Union and North America. The focus, once again, is more on optimal production in developing countries, whereas in developed countries the emphasis is on reduction of emissions. There is a clear link between the two because, for instance, hypoxic pond water is not only an external environmental liability but also an internal factor of increased mortality.
The issue of site selection and carrying capacity can be complicated further as natural resources overlap political boundaries, for example, aquaculture within the Mediterranean. The Mediterranean Sea is shared by 21 countries with different cultural traditions, economic structures, societal profiles and legislative frameworks; therefore, a strategy aiming at multinational cooperation, exchange of information and harmonization of regulations that becomes successful here is likely to be a model for other regions of the world. Consequently, both FAO and the General Fisheries Commission for the Mediterranean have promoted initiatives to assist cooperation for the development of aquaculture and to enhance the dialogue among Mediterranean States and stakeholders regarding main issues, including site selection and carrying capacity (FAO, 2011).
Because there is little or no consensus among stakeholders – and often between countries – to set acceptable ecological aquaculture impacts, it is important to ensure harmonization of aquaculture regulation. There are different mechanisms. One of them is to define acceptable impacts by establishing criteria and variables to be used for estimating carrying capacity (IUCN, 2009). Another tool is the use of variables related to environmental quality or standards, for instance, primary production and sediment oxygen levels. In any case, the application of soft law instruments must be considered as an important element of environmental standards harmonization. Finally, it is important to overcome the site-by-site regulation process. Decisions on site selection are made on an individual basis in response to applications for tenure (McDaniels, Dowlatabadi and Stevens, 2005). This mechanism ignores the fact that many of the major concerns involve regional or subregional cumulative impacts beyond political boundaries. The question about size and distribution of aquaculture activity can be neither answered by considering local, site-by-site criteria nor by a process that is reactive rather than proactive. The problem of siting criteria has to be dealt within region-wide planning through appropriate regulations aimed to address cumulative impacts related to production, environment and social aspects.
Further region-wide planning should be implemented to assess cumulative impacts. Region-wide analysis of carrying capacities and impacts at a large scale can be expensive; however, the use of predictive models and modelling is most often needed in order to assist with decision-making. Models have the capability to be used at local, regional and international level, and are extremely valuable tools for aquaculture development and management.
Estimating aquaculture potential (i.e. physical carrying capacity) is a first step towards planning for aquaculture development. Continental studies of potential for inland fish pond farming were carried out for Latin America (Kapetsky and Nath, 1997) and Africa (Aguilar-Manjarrez and Nath, 1998). A regional study for the Caribbean using the same approach was carried out by Kapetsky and Chakalall (1998).
Carrying capacities and site selection within the ecosystem approach to aquaculture
28 Site selection and carrying capacities for inland and coastal aquaculture
Data requirementsThe information needed for site selection and estimates of carrying capacity is varied and will usually consist of data describing the physical, biological, economic, social and infrastructural aspects. These data can come from a variety of sources, ranging from primary data from the field or satellite imagery to all forms of secondary data, including paper maps, photographs and textual databases. Sources such as satellite imagery are already in digital form, although other sources may require some work to prepare them for use, for example, when they are to be used in a spatial database.
Clearly, data requirements and the mix of relevant variables will differ with location, species, farming system and social and cultural issues. With the exception of archived digital data and satellite imagery, it can be extremely costly and time consuming to collect field data first-hand, and, for this reason, it is often useful to locate the required data from existing secondary sources, either in paper or digital form. A primary consideration is to identify what data are really needed specifically to model the activity in question, as distinct from the plethora of data that may be available. This is followed by attempts to source the data and considerations regarding age, scale, quality and relative cost.
It can often be the case that estimating one variable from another can create new data that are more useful than the original data. Such data are referred to as “proxy” data, and established relationships may exist for deriving useable output from these data. Examples of aquaculture site selection proxies are: calculation of probable water temperatures from air temperatures, extraction of semi-quantitative soil texture from FAO soil association distribution maps, calculation of maximum dissolved oxygen levels from digital elevation models, and temperature data or calculation of maximum wave heights from wind direction, velocity and fetch (Aguilar-Manjarrez and Nath, 1998; Scott, 2003).
Establishing social and economic data requirements can be challenging, especially considering the less clear boundaries for the relevant stakeholders and the diverse nature of socio-economic issues related to the siting and farming activity. Information, such as available workforce, land ownership, access, water use, local infrastructure, local income, availability of housing and schools if the farming zone is far from urban areas, can be needed (also see EAA guidelines, FAO, 2010).
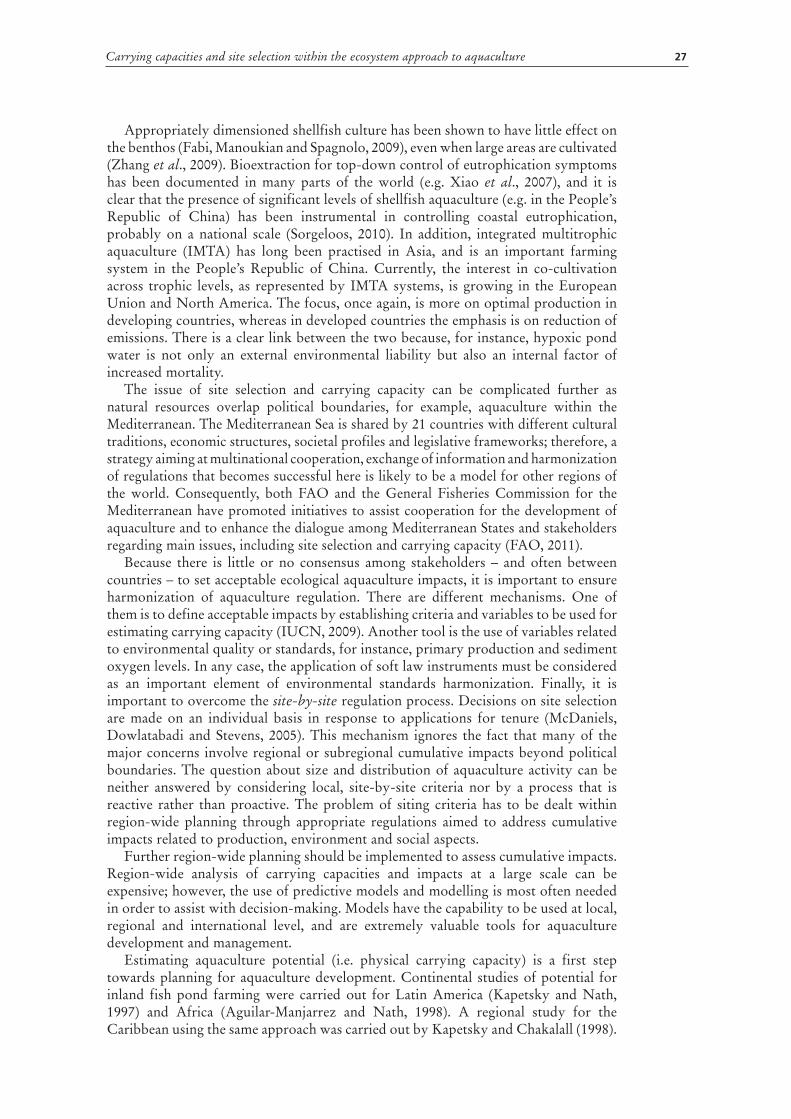
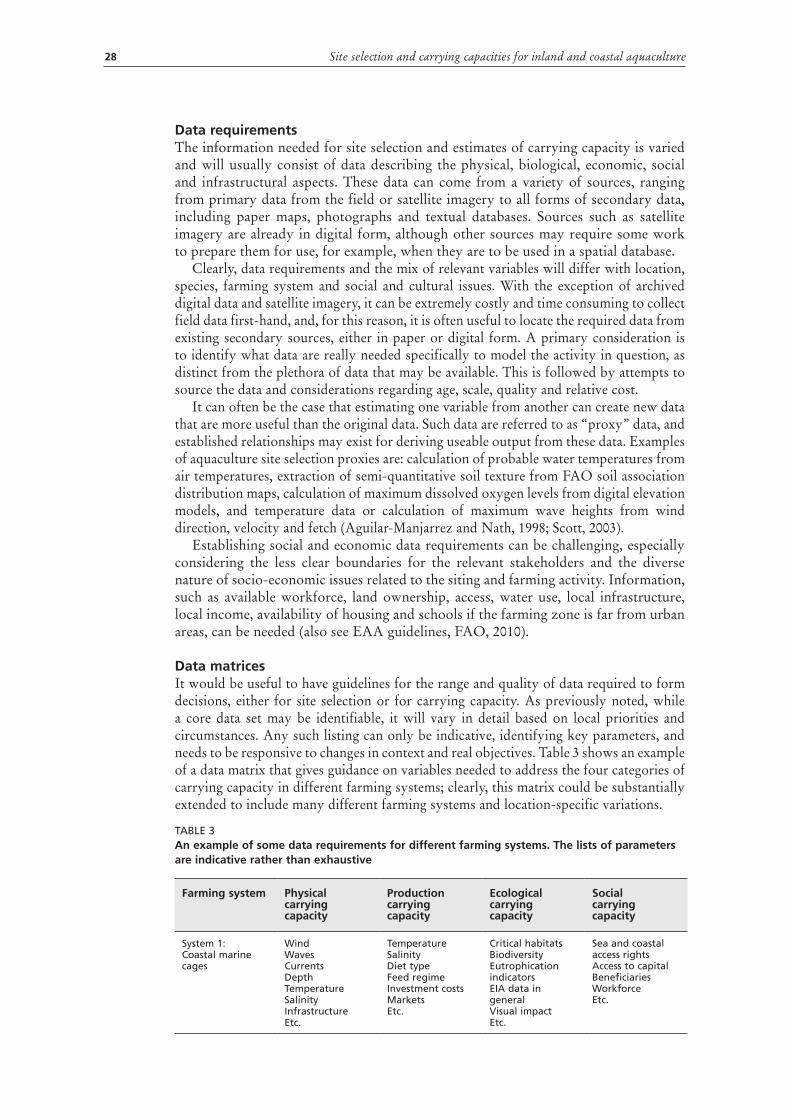
Data matricesIt would be useful to have guidelines for the range and quality of data required to form decisions, either for site selection or for carrying capacity. As previously noted, while a core data set may be identifiable, it will vary in detail based on local priorities and circumstances. Any such listing can only be indicative, identifying key parameters, and needs to be responsive to changes in context and real objectives. Table 3 shows an example of a data matrix that gives guidance on variables needed to address the four categories of carrying capacity in different farming systems; clearly, this matrix could be substantially extended to include many different farming systems and location-specific variations.
Farming system Physicalcarrying capacity
Productioncarrying capacity
Ecologicalcarrying capacity
Socialcarrying capacity
System 1: Coastal marine cages
Wind WavesCurrentsDepthTemperatureSalinityInfrastructureEtc.
TemperatureSalinityDiet typeFeed regimeInvestment costsMarketsEtc.
Critical habitats BiodiversityEutrophication indicators EIA data in general Visual impactEtc.
Sea and coastal access rightsAccess to capital BeneficiariesWorkforceEtc.
TABLE 3An example of some data requirements for different farming systems. The lists of parameters are indicative rather than exhaustive
29
The priority assigned to a given carrying capacity category will probably vary with location, depending upon national or regional priorities as well as environmental, cultural and social issues. There is, thus, probably no obvious, single, preferred sequence of development of these four categories. In fact, each category can be used as a free-standing decision- support tool for carrying capacity, and important decisions may be possible based upon a single component. Whatever the chosen sequence, it may be that decisions that can be extracted from the locally highest-priority category will determine the necessity, or otherwise, for other work to follow.
Decision-making and modelling tools Assessment of carrying capacity for aquaculture can be challenging because of the number and nature of interactions, processes and scenarios involved. McKindsey et al. (2006) noted the potential complexity of the decision framework and surmised that many kinds of expertise may be needed to evaluate carrying capacity. They proposed that expert systems are the most practical and cost-effective way to manage the decision support process.
Decision support for expansion and optimization of aquaculture operations can make use of a wide range of models, drawing from a considerable volume of work (see, for example, www.ecasatoolbox.org.uk). Virtual tools, including mathematical models,
Carrying capacities and site selection within the ecosystem approach to aquaculture
Farming system Physicalcarrying capacity
Productioncarrying capacity
Ecologicalcarrying capacity
Socialcarrying capacity
System 2:Ponds (inland/ coastal)
Water quantityWater quality SlopeSoilsRainfallEvaporationInfrastructureEtc.
TemperatureDiet typeFeed regimeInfrastructureInvestment, costsMarketsEtc.
Critical habitats BiodiversityEutrophication indicators Visual impactEIA data in general Etc.
Land ownership, Water and riparian rightsAccess to capital WorkforceBeneficiariesEtc.
System 3:Freshwater cages
Wind WavesCurrentsDepthTemperatureSalinityInfrastructureEtc.
TemperatureInfrastructureInvestment, costsMarketsEtc.
Critical habitats BiodiversityEutrophication indicators Visual impactEIA data in general Etc.
Land ownershipWater and riparian rightsAccess to capital BeneficiariesEtc.
System 4:Hatcheries
Water quantityWater qualityInfrastructureEtc.
TemperatureDietsInfrastructureInvestment, costsMarketsEtc.
Critical habitats BiodiversityEutrophication indicators Visual impactEIA data in general Etc.
Local needsLand ownershipWater rightsWorkforceSkills availabilityVisual impactEtc.
System 5:Bivalve culture
Wind WavesCurrentsChorophyll and productivityDepthTemperatureSalinityEtc.
TemperatureSalinityChlorophyll and productivityInvestment, costsMarketsEtc.
Critical habitats BiodiversityBottom anoxia indicators Visual impactEIA data in general Etc.
Sea rightsAccess to capital WorkforceBeneficiariesEtc.
System 6:Seaweed culture
Wind WavesCurrentsNutrient contentDepthTemperatureSalinityEtc.
TemperatureSalinityNutrients availabilityInvestment, costsMarketsEtc.
Critical habitats BiodiversityVisual impactEIA data in general Etc.
Sea rightsAccess to capital WorkforceBeneficiariesEtc.

30 Site selection and carrying capacities for inland and coastal aquaculture
are becoming more effective in analysing the various components of carrying capacity and, therefore, in assisting sound decision-making on sustainable development of aquaculture without the costs of social experimentation. Ferreira et al. (2012) defined virtual technology in this context as “any artificial representation of ecosystems that support aquaculture, whether directly or indirectly”. Such representations are designed to help measure, understand, and predict the underlying variables and processes, and they help to inform an ecosystem approach to aquaculture.
Virtual technology and models are an important part of decision support as they can be used to simplify or replicate existing processes easily and efficiently. These models can then be used to predict the potential consequences of different scenarios that could be expensive, challenging or dangerous to simulate in the real world, such as for example the release of a toxic chemical into the environment. Furthermore, modelling tools, such as “fuzzy” expert systems, can enable modelling where there may be inadequate data sets or uncertainty about boundaries. Fuzzy analytical techniques are available in GIS as parts of decision support systems (e.g. IDRISI by Clark University and ManifoldTM by CDA International Ltd), but they require expert knowledge in order to take informed decisions about uncertainties. Self-learning systems have been used to combine 3D hydrodynamic and fuzzy decision models, presented in a GIS framework, to produce a validated classification of coastal environments that are particularly vulnerable to aquaculture development in terms of nutrient waste (Moreno Navas, Telfer and Ross, 2011).
Although site selection and carrying capacity assessment are complex issues, decision support tools can be used to represent all of the key components. The planning process should flow from a broad assessment of carrying capacity to detailed site selection, focused on a narrower spatial scale and supporting specific licensing procedures. A general approach for shellfish culture, from Silva et al. (2011), is presented in Figure 5. At all stages of the process, virtual technologies are valuable for decision support, providing a means to evaluate trade-offs among social, environmental and economic components of sustainability.
It is clear that virtual technologies, whether they are GIS, satellite remote sensing, dynamic models or others, can play an important role in addressing the physical, production and environmental components of site selection and carrying capacity. However, models need to be more production and management oriented, and need to adapt to local realities and conditions. This requires a more effective linkage between industry and research to create objective-led demand for virtual technology-driven research and technology development and a clear view of the business models that might support it.
Attention is drawn to virtual applications that include carrying capacity as one of their functions, or that have carrying capacity estimates as an objective. Some of these incorporate multiple models, multiple species, and the possibility that they could be adapted to contribute to broad-scale applications such as the global study of mariculture potential (Kapetsky and Aguilar-Manjarrez, 2012), or when applied at the national level as part of a broad process of estimating aquaculture potential. Several such applications, including, for example, blue mussel ecological carrying capacity (Filgueira and Grant, 2009), farm-level shellfish models for decision support to industry (Dallaghan, 2009), and using the FARM siting and decision model in data-poor situations (Ferreira, Hawkins and Bricker, 2007) have already been recognized as important examples and case studies of virtual technology by Ferreira, Ramos and Costa-Pierce (2012).
Environmental modelsEnvironmental models are essentially tools, based on mathematical algorithms, that enable predictions of environmental changes and their consequences (Ford, 1999) using

31
baseline and subsequent monitoring data. Such models are also used in aquaculture for farm management to simulate the quality of the water within the farming system to help minimize fish (or other farmed organism) deaths and to predict profitability (Beveridge, 2004). Models can range from simple mathematical calculations to the more complex integrated processes that require specialized software.
One of the earliest and simplest applications of modelling to aquaculture was Dillon and Rigler’s modification of Vollenweider’s original model, which used phosphorus (P) levels to estimate the ecological carrying capacity of freshwater lakes, assuming that P limits phytoplankton growth and therefore eutrophication (Beveridge, 1984). Thus, there would be a maximum P intake a lake could receive before the eutrophication process is triggered. This model has been used widely to estimate carrying capacity of lakes to support fish farming, for example, in the Republic of Chile. Further modifications of this model have also been used assuming nitrogen as the limiting element (Soto, Salazar and Alfaro, 2007).
A common method used for basic modelling is the mass balance equation, which can be used for many different parameters but is most widely used in a water quality context to model nitrogen and phosphorus concentrations in and from aquaculture systems. When using such models there has been an all-encompassing approach to their implementation through application of general guidelines. However, it is now clear that these general guidelines are not relevant for every system (Panchang, Cheng
Carrying capacities and site selection within the ecosystem approach to aquaculture
FIGURE 5General top down approach for carrying capacity assessment combining GIS
and dynamic modelling
Source: Silva et al. (2011).

32 Site selection and carrying capacities for inland and coastal aquaculture
and Newell, 1997); for example, site suitability for net pen culture should be modelled and considered on a site-by-site basis because environmental variability can make a general approach invalid (Dudley, Panchang and Newell, 2000). Consequently, it is important that the available data are representative of the system selected to prevent any restrictions on the model’s usefulness (Cromey, Nickell and Black, 2002; Cromey et al., 2002).
In the 1990s, determinations of carrying capacity for cage aquaculture were made using statistical models based upon empirical data (Beveridge, 1996). The driver for determinations of carrying capacity was an increased concern about the environmental effects of cage aquaculture in smaller, enclosed, poorly flushed waterbodies. This was due to impacts of nutrients and waste feeds not only on pelagic and benthic ecosystems, but also due to increased user and other social conflicts. Such increase in environmental-social concerns over the sometimes poorly planned and weakly regulated expansion of cage culture occurred in response to events, such as the “boom and bust” cycles of cage aquaculture in the Republic of the Philippines (Laguna de Bay and the seven lakes of San Pablo; Beveridge, 1996), in Indonesian reservoirs (Costa-Pierce, 1998), and in trash-fish-fed cage culture in many Asian countries (Pullin, Rosenthal and Maclean, 1993).
Over the past decade, numerous simulation models have been developed to predict environmental changes with different nutrient loadings from dissolved and particulate inputs from fish cage aquaculture (Byron and Costa-Pierce, 2012). Models such as DEPOMOD (Cromey, Nickell and Black, 2002; Cromey et al., 2002) and others (for example, Corner et al., 2006; FAO, 2009) can be used in local-scale assessment of the effects of fish cages on the environment. These models use information on depth, current velocity, current direction, feed input and farm management practices to predict the deposition of wastes from the cages. In Scotland, DEPOMOD is also used by the regulator to assess the environmental impact of new lease applications for salmon farms, supporting site selection at a local scale.
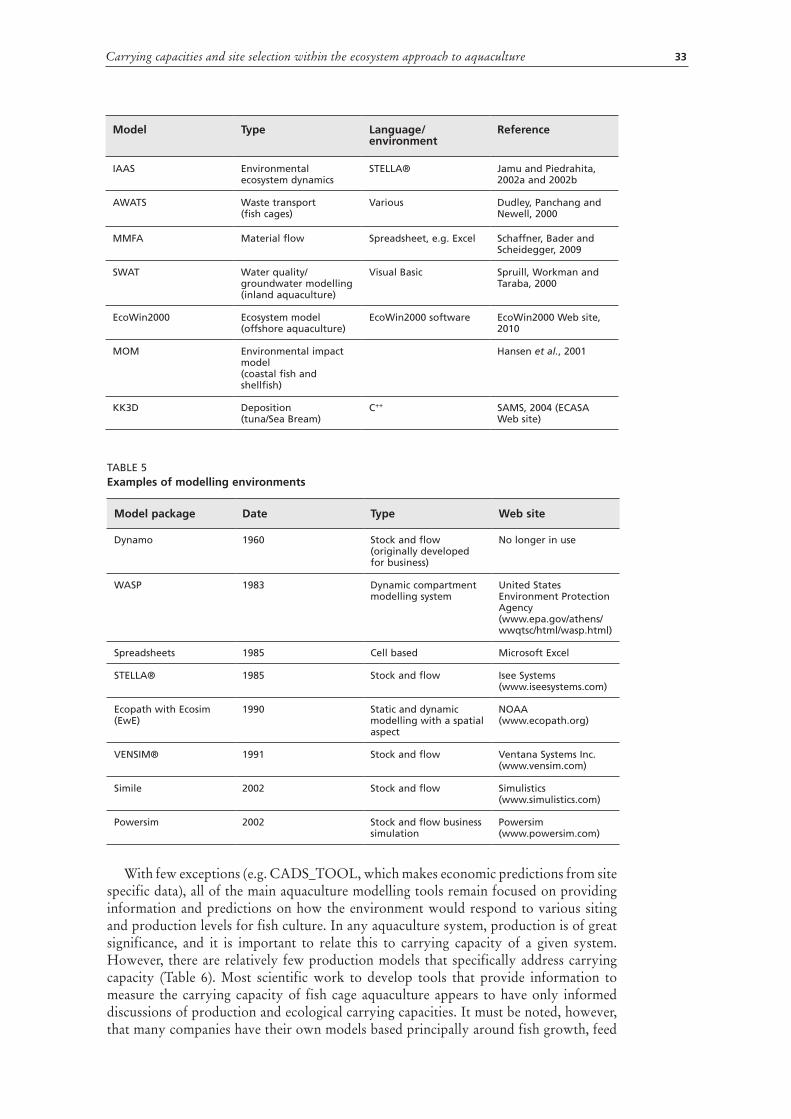
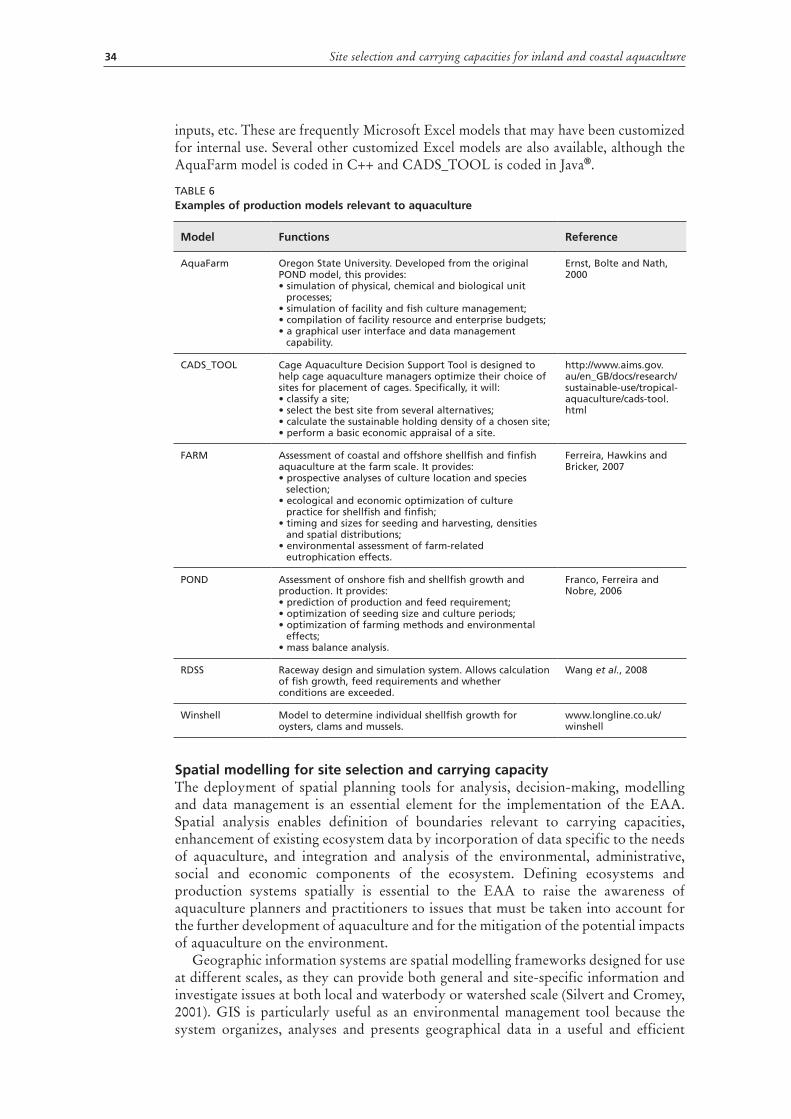
Mathematical models can be further developed into dynamic models that show change over time at a particular location, and are either coded directly to form a free-standing, single objective, often a commercial software product (Table 4), or may be developed within modelling environments, such as STELLA® or VENSIM® (Table 5). The latter offers a flexible and consistent approach to modelling, giving the opportunity to develop a range of models that can be easily disseminated and used while allowing further model development and adaptation by other users.
Model Type Language/environment
Reference
Simple mathematical models
Simple mass balance for nutrients and water exchange
Excel, etc. Beveridge and Phillips, 1993
DEPOMOD Waste dispersion(salmon cages)
Visual Basic Cromey, Nickell and Black, 2002; Cromey et al., 2002
COD-MOD Waste dispersion(cod cages)
Visual Basic Cromey, Nickell and Black, 2002; Cromey et al., 2002
MERAMOD Waste dispersion(Mediterranean cages)
Borland Delphi 7 SAMS, 2004
FARM Resource management for shellfish
STELLA® Ferreira, Hawkins and Bricker, 2007
APEM Environmental ecosystem dynamics
STELLA® Culberson and Piedrahita, 1996
TABLE 4Summary of environmental models and model systems relevant to aquaculture
33
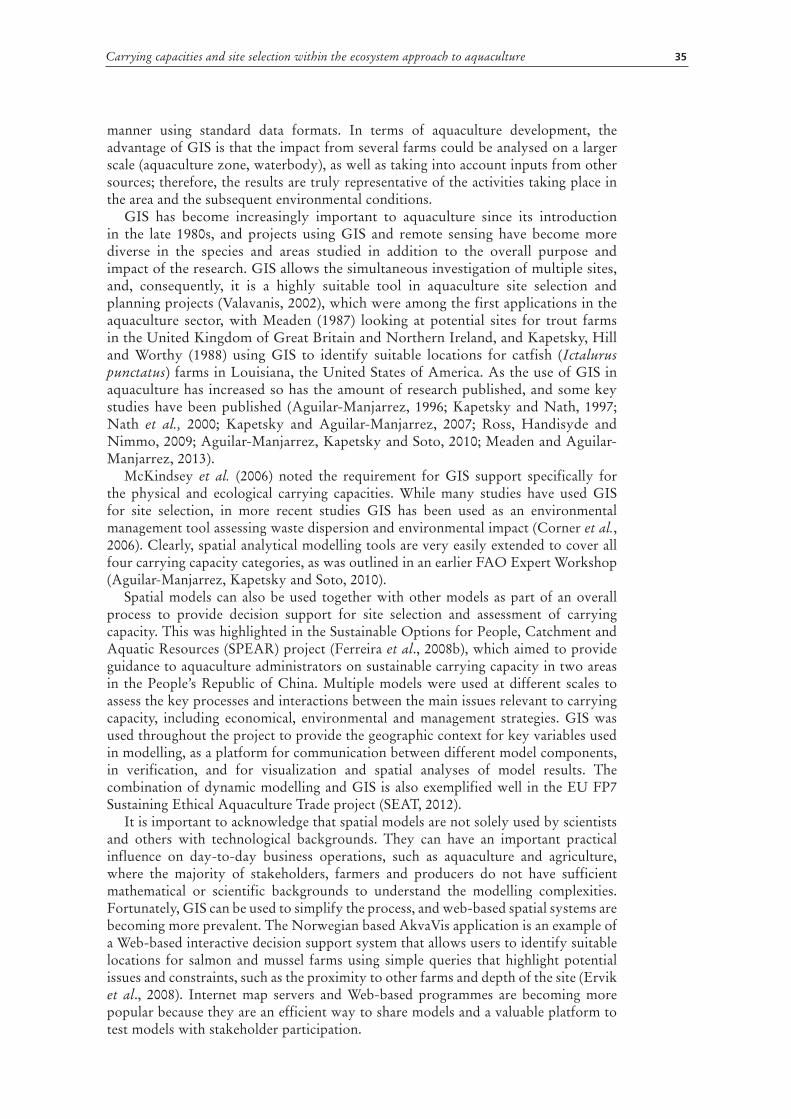
With few exceptions (e.g. CADS_TOOL, which makes economic predictions from site specific data), all of the main aquaculture modelling tools remain focused on providing information and predictions on how the environment would respond to various siting and production levels for fish culture. In any aquaculture system, production is of great significance, and it is important to relate this to carrying capacity of a given system. However, there are relatively few production models that specifically address carrying capacity (Table 6). Most scientific work to develop tools that provide information to measure the carrying capacity of fish cage aquaculture appears to have only informed discussions of production and ecological carrying capacities. It must be noted, however, that many companies have their own models based principally around fish growth, feed
Carrying capacities and site selection within the ecosystem approach to aquaculture
Model Type Language/environment
Reference
IAAS Environmental ecosystem dynamics
STELLA® Jamu and Piedrahita, 2002a and 2002b
AWATS Waste transport(fish cages)
Various Dudley, Panchang and Newell, 2000
MMFA Material flow Spreadsheet, e.g. Excel Schaffner, Bader and Scheidegger, 2009
SWAT Water quality/ groundwater modelling(inland aquaculture)
Visual Basic Spruill, Workman and Taraba, 2000
EcoWin2000 Ecosystem model(offshore aquaculture)
EcoWin2000 software EcoWin2000 Web site, 2010
MOM Environmental impact model(coastal fish and shellfish)
Hansen et al., 2001
KK3D Deposition(tuna/Sea Bream)
C++ SAMS, 2004 (ECASA Web site)
TABLE 5Examples of modelling environments
Model package Date Type Web site
Dynamo 1960 Stock and flow (originally developed for business)
No longer in use
WASP 1983 Dynamic compartment modelling system
United States Environment Protection Agency (www.epa.gov/athens/wwqtsc/html/wasp.html)
Spreadsheets 1985 Cell based Microsoft Excel
STELLA® 1985 Stock and flow Isee Systems(www.iseesystems.com)
Ecopath with Ecosim (EwE)
1990 Static and dynamic modelling with a spatial aspect
NOAA(www.ecopath.org)
VENSIM® 1991 Stock and flow Ventana Systems Inc.(www.vensim.com)
Simile 2002 Stock and flow Simulistics(www.simulistics.com)
Powersim 2002 Stock and flow business simulation
Powersim(www.powersim.com)
34 Site selection and carrying capacities for inland and coastal aquaculture
inputs, etc. These are frequently Microsoft Excel models that may have been customized for internal use. Several other customized Excel models are also available, although the AquaFarm model is coded in C++ and CADS_TOOL is coded in Java®.
Spatial modelling for site selection and carrying capacity The deployment of spatial planning tools for analysis, decision-making, modelling and data management is an essential element for the implementation of the EAA. Spatial analysis enables definition of boundaries relevant to carrying capacities, enhancement of existing ecosystem data by incorporation of data specific to the needs of aquaculture, and integration and analysis of the environmental, administrative, social and economic components of the ecosystem. Defining ecosystems and production systems spatially is essential to the EAA to raise the awareness of aquaculture planners and practitioners to issues that must be taken into account for the further development of aquaculture and for the mitigation of the potential impacts of aquaculture on the environment.
Geographic information systems are spatial modelling frameworks designed for use at different scales, as they can provide both general and site-specific information and investigate issues at both local and waterbody or watershed scale (Silvert and Cromey, 2001). GIS is particularly useful as an environmental management tool because the system organizes, analyses and presents geographical data in a useful and efficient
TABLE 6Examples of production models relevant to aquaculture
Model Functions Reference
AquaFarm Oregon State University. Developed from the original POND model, this provides:• simulation of physical, chemical and biological unit
processes;• simulation of facility and fish culture management;• compilation of facility resource and enterprise budgets;• a graphical user interface and data management
capability.
Ernst, Bolte and Nath, 2000
CADS_TOOL Cage Aquaculture Decision Support Tool is designed to help cage aquaculture managers optimize their choice of sites for placement of cages. Specifically, it will:• classify a site;• select the best site from several alternatives;• calculate the sustainable holding density of a chosen site;• perform a basic economic appraisal of a site.
http://www.aims.gov.au/en_GB/docs/research/sustainable-use/tropical-aquaculture/cads-tool.html
FARM Assessment of coastal and offshore shellfish and finfish aquaculture at the farm scale. It provides:• prospective analyses of culture location and species
selection;• ecological and economic optimization of culture
practice for shellfish and finfish;• timing and sizes for seeding and harvesting, densities
and spatial distributions;• environmental assessment of farm-related
eutrophication effects.
Ferreira, Hawkins and Bricker, 2007
POND Assessment of onshore fish and shellfish growth and production. It provides:• prediction of production and feed requirement;• optimization of seeding size and culture periods;• optimization of farming methods and environmental
effects;• mass balance analysis.
Franco, Ferreira and Nobre, 2006
RDSS Raceway design and simulation system. Allows calculation of fish growth, feed requirements and whether conditions are exceeded.
Wang et al., 2008
Winshell Model to determine individual shellfish growth for oysters, clams and mussels.
www.longline.co.uk/winshell
35
manner using standard data formats. In terms of aquaculture development, the advantage of GIS is that the impact from several farms could be analysed on a larger scale (aquaculture zone, waterbody), as well as taking into account inputs from other sources; therefore, the results are truly representative of the activities taking place in the area and the subsequent environmental conditions.
GIS has become increasingly important to aquaculture since its introduction in the late 1980s, and projects using GIS and remote sensing have become more diverse in the species and areas studied in addition to the overall purpose and impact of the research. GIS allows the simultaneous investigation of multiple sites, and, consequently, it is a highly suitable tool in aquaculture site selection and planning projects (Valavanis, 2002), which were among the first applications in the aquaculture sector, with Meaden (1987) looking at potential sites for trout farms in the United Kingdom of Great Britain and Northern Ireland, and Kapetsky, Hill and Worthy (1988) using GIS to identify suitable locations for catfish (Ictalurus punctatus) farms in Louisiana, the United States of America. As the use of GIS in aquaculture has increased so has the amount of research published, and some key studies have been published (Aguilar-Manjarrez, 1996; Kapetsky and Nath, 1997; Nath et al., 2000; Kapetsky and Aguilar-Manjarrez, 2007; Ross, Handisyde and Nimmo, 2009; Aguilar-Manjarrez, Kapetsky and Soto, 2010; Meaden and Aguilar-Manjarrez, 2013).
McKindsey et al. (2006) noted the requirement for GIS support specifically for the physical and ecological carrying capacities. While many studies have used GIS for site selection, in more recent studies GIS has been used as an environmental management tool assessing waste dispersion and environmental impact (Corner et al., 2006). Clearly, spatial analytical modelling tools are very easily extended to cover all four carrying capacity categories, as was outlined in an earlier FAO Expert Workshop (Aguilar-Manjarrez, Kapetsky and Soto, 2010).
Spatial models can also be used together with other models as part of an overall process to provide decision support for site selection and assessment of carrying capacity. This was highlighted in the Sustainable Options for People, Catchment and Aquatic Resources (SPEAR) project (Ferreira et al., 2008b), which aimed to provide guidance to aquaculture administrators on sustainable carrying capacity in two areas in the People’s Republic of China. Multiple models were used at different scales to assess the key processes and interactions between the main issues relevant to carrying capacity, including economical, environmental and management strategies. GIS was used throughout the project to provide the geographic context for key variables used in modelling, as a platform for communication between different model components, in verification, and for visualization and spatial analyses of model results. The combination of dynamic modelling and GIS is also exemplified well in the EU FP7 Sustaining Ethical Aquaculture Trade project (SEAT, 2012).
It is important to acknowledge that spatial models are not solely used by scientists and others with technological backgrounds. They can have an important practical influence on day-to-day business operations, such as aquaculture and agriculture, where the majority of stakeholders, farmers and producers do not have sufficient mathematical or scientific backgrounds to understand the modelling complexities. Fortunately, GIS can be used to simplify the process, and web-based spatial systems are becoming more prevalent. The Norwegian based AkvaVis application is an example of a Web-based interactive decision support system that allows users to identify suitable locations for salmon and mussel farms using simple queries that highlight potential issues and constraints, such as the proximity to other farms and depth of the site (Ervik et al., 2008). Internet map servers and Web-based programmes are becoming more popular because they are an efficient way to share models and a valuable platform to test models with stakeholder participation.
Carrying capacities and site selection within the ecosystem approach to aquaculture
36 Site selection and carrying capacities for inland and coastal aquaculture
Modelling socio-economic driversModelling is primarily predictive and often used as a precursor to, and informant for, implementation of environmental management. There are also other methods used within the management framework that are not based on modelling and that are implemented during the production and post-production process, though these methods are necessarily informed by the ecological and production models and decision support systems presented earlier.
A key example of implementation of non-modelling and modelling approaches is when incorporating stakeholder input (Byron et al., 2011). This has the premise that science is much more likely to be accepted if there are agreed upon, cooperative, aquaculture research frameworks that combine efforts of scientists and farmers and that are integrated into outreach and extension services. Here, the ecological carrying capacity results are adopted into management, and stakeholders have had direct input into and obtain an intimate knowledge of the science (Costa-Pierce, 2002). In this regard, efforts to improve methodologies for the determination of the social carrying capacity may be well served to consider approaches that integrate rigorous science into participatory extension processes that include and measure the quality of participation and stakeholder inputs (Dalton, 2005; 2006). Estimation of this will establish a more quantitative basis for discussion, integration of ecological, production and social implications and final decision-making, enabling a better understanding of the trade-offs of aquaculture production for a particular locality or set of conditions.
Little et al. (2012) not only noted the growing use of participatory approaches in EAA, but also noted that careful consideration must be given to who is encouraged and supported to participate, in what ways and for what specific purpose. Because participation has become an accepted orthodoxy in development circles and has attracted both mainstream and inevitable criticism (Henkel and Stirrat, 2001), greater reflection is required. Increasingly so-called participation is part of a box-ticking exercise within more blueprint approaches to standard approaches to development that have been done in the past. Community stakeholder engagement is frequently cursory, unrepresentative of marginal voices, and more consultative than collegiate. Often, expectations within “projects” are too narrowly sectoral and involve a tiny proportion of potential stakeholders in any active way. Community stakeholder engagement needs to be strengthened, with more rigorous application of cost–benefit analysis. Alongside immediate economic concerns, a broad understanding of the social and ecosystem services that are part of aquaculture and associated value chains must be considered. Identification and use of appropriate indicators can be a robust approach to assessing social impacts, and must pay equal attention to local conditions and opinion if they are to be accurate and relevant in their application. Project scope and identification of stakeholders have rightly been identified as key steps. The boundaries around EAA are typically set too narrowly and the resources applied too limited and/or conservatively for what are complex human systems. This often brings these non-modelling approaches into conflict with modelling tools, as by necessity the latter simplifies the system into sectors for which numerical estimations can be made to produce generic models.
Field verification Field verification as part of modelling work is absolutely essential, both for quality control of certain data sources and for testing the outcomes of models. While an environment and an activity can be modelled in total isolation as an academic exercise, it is only through careful verification that the general applicability of results can be ensured. Consequently, decisions on site selection and carrying capacity achieved through modelling require field verification, which should include participative input from stakeholders. This not only refines the data inputs and the model outcomes,
37
but also provides feedback into the modelling process itself by allowing better understanding of the assumptions used. It is important to recall that models generated with participative input also have high acceptability to the full community.
Implementation of carrying capacity concepts McKindsey et al. (2006) and the International Council for the Exploration of the Sea (ICES, 2008) identified gaps in knowledge that need to be addressed in order to advance progress in the scientific basis of carrying capacity for aquaculture, including:
•Development of specific guidance to better define “unacceptable” ecologicalimpacts that include stakeholder identification of important ecological attributes and ecosystem components.
•Identificationofcriticallimits(i.e.performancestandardsorthresholds)atwhichthe levels of aquaculture developments disrupt an ecosystem, thus requiring management actions.
These indicators, often known as environmental quality standards (EQSs), are used by regulators and decision-makers and employ best available science and often adopt a “precautionary approach” in their implementation. The existence and use of standards as part of the environmental management of aquaculture, to inform regulation, for enforcement, environmental impact assessments (EIAs) and other procedures is highly variable. In many countries, water quality standards are well developed, and a considerable amount is known with regard to the local ecosystem and aquaculture production. In Europe, they are now being applied in relation to particular waterbodies, while in some developing countries water quality standards have sometimes been copied from developed countries and may not reflect local conditions or needs. The Association of Southeast Asian Nations has also initiated the process of standardizing water quality standards within the Southeast Asian region. Implementation of such standards also depends upon effective governance and control mechanisms for implementation within aquaculture and environmental management (Telfer and Beveridge, 2001). Different countries, regions and even localities may use location and system-specific indicators of change, which are implemented as part of the initial regulation of the development or for continued monitoring of environmental and production “health”. Use of such indicators for monitoring and governance of aquaculture have been critically reviewed (FAO, 2009).
In many countries, an EIA is required as part of the licensing process for farms over a threshold size or if an existing site expands beyond its approved licence size. The EIA may be defined as “The process of identifying, predicting, evaluating and mitigating the biophysical, social, and other relevant effects of development proposals prior to major decisions being taken and commitments made” (FAO, 2009). The EIA most often provides the framework for the implementation of environmental carrying capacity criteria, although it can also include social and economic impacts. However, the practical implementation of these may be weak, as there are not yet enough sector studies and fully agreed indicators (FAO, 2009).
An EIA for single aquaculture farms may or may not use direct evaluations of carrying capacities or good acceptable proxies (e.g. models). Conversely, when dealing with many small farms that often do not formally require an individual EIA, there is a need for a strategic environmental assessment (SEIA) to ensure that the sum of the small farms will not exceed the ecological carrying capacity; however, this is as yet rarely done. This can also be the case even for large farms sharing a common waterbody, for example, for shrimp farming in coastal zones. Although in most countries each farm requires an EIA, the combined effects of farms on the receiving waterbody (e.g. a mangrove estuary) is normally not assessed or monitored, meaning that joint farm nutrient loads can exceed the ecological (and sometimes social) carrying capacity. This may also be true for cage farming, for example, in the Republic of Chile (Soto and Norambuena, 2004).
Carrying capacities and site selection within the ecosystem approach to aquaculture
38 Site selection and carrying capacities for inland and coastal aquaculture
Indicators for carrying capacity are less easy to implement in areas with variable or little governance. In such areas indicators require particular adoption by local aquaculturists, and therefore should be of particular relevance to their own particular system.
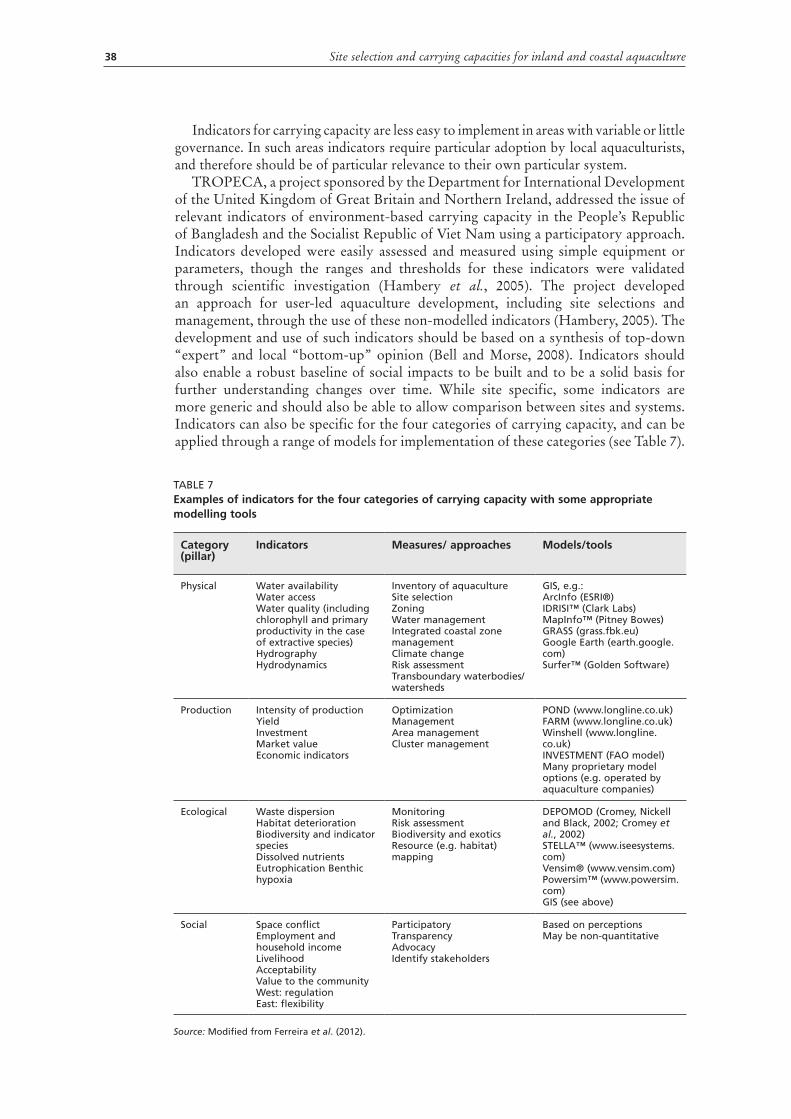
TROPECA, a project sponsored by the Department for International Development of the United Kingdom of Great Britain and Northern Ireland, addressed the issue of relevant indicators of environment-based carrying capacity in the People’s Republic of Bangladesh and the Socialist Republic of Viet Nam using a participatory approach. Indicators developed were easily assessed and measured using simple equipment or parameters, though the ranges and thresholds for these indicators were validated through scientific investigation (Hambery et al., 2005). The project developed an approach for user-led aquaculture development, including site selections and management, through the use of these non-modelled indicators (Hambery, 2005). The development and use of such indicators should be based on a synthesis of top-down “expert” and local “bottom-up” opinion (Bell and Morse, 2008). Indicators should also enable a robust baseline of social impacts to be built and to be a solid basis for further understanding changes over time. While site specific, some indicators are more generic and should also be able to allow comparison between sites and systems. Indicators can also be specific for the four categories of carrying capacity, and can be applied through a range of models for implementation of these categories (see Table 7).
TABLE 7Examples of indicators for the four categories of carrying capacity with some appropriate modelling tools
Category (pillar)
Indicators Measures/ approaches Models/tools
Physical Water availabilityWater access Water quality (including chlorophyll and primary productivity in the case of extractive species)Hydrography Hydrodynamics
Inventory of aquaculture Site selection Zoning Water management Integrated coastal zone management Climate change Risk assessmentTransboundary waterbodies/watersheds
GIS, e.g.:ArcInfo (ESRI®) IDRISI™ (Clark Labs) MapInfo™ (Pitney Bowes) GRASS (grass.fbk.eu)Google Earth (earth.google.com)Surfer™ (Golden Software)
Production Intensity of productionYield InvestmentMarket valueEconomic indicators
OptimizationManagementArea managementCluster management
POND (www.longline.co.uk)FARM (www.longline.co.uk)Winshell (www.longline.co.uk)INVESTMENT (FAO model)Many proprietary model options (e.g. operated by aquaculture companies)
Ecological Waste dispersionHabitat deteriorationBiodiversity and indicator species Dissolved nutrientsEutrophication Benthic hypoxia
MonitoringRisk assessmentBiodiversity and exoticsResource (e.g. habitat) mapping
DEPOMOD (Cromey, Nickell and Black, 2002; Cromey et al., 2002)STELLA™ (www.iseesystems.com)Vensim® (www.vensim.com)Powersim™ (www.powersim.com)GIS (see above)
Social Space conflictEmployment and household incomeLivelihood Acceptability Value to the community West: regulation East: flexibility
Participatory Transparency Advocacy Identify stakeholders
Based on perceptionsMay be non-quantitative
Source: Modified from Ferreira et al. (2012).
39
Groffman et al. (2006) have identified ecological threshold as the point at which there is an abrupt change in an ecosystem quality, property or phenomenon, or where small changes in an environmental driver produce large responses in the ecosystem. On the other hand, thresholds may also be defined in a legal framework as the point beyond which pollution load becomes unacceptable. This threshold defines the legal boundary between acceptable contamination and unacceptable pollution (Hassan, 2006). In this context, EQSs and environmental thresholds become the major prerequisite for estimating the carrying capacity of a fish farm in a given site and also necessary for a meaningful EIA and environmental monitoring.
EQSs set concentrations in the environment for certain compounds below which unacceptable effects are expected not to occur (IUCN, 2009, FAO, 2009). One problem of setting standards is that not all of them are legally enforceable, and many are fixed in guidelines that usually embody political commitments rather than legally binding obligations. Moreover, as the establishment of these standards implies that something is defined by policy-makers rather than by scientists, it is important to ensure harmonization and reduce the arbitrariness of the authority. Clearly, compromise among the different interests and stakeholders is required, as development within carrying capacity requires not only environmental and scientific requirements but also social and political acceptance. In this context, soft law instruments must be considered as an important element of harmonization of legally enforceable standards.
The definition of social carrying capacity indicators is much more challenging. They can involve indicators of local conflicts, employment, alcoholism, women, child labour, etc., and may vary from locality to locality. While the definition of critical limits for ecological carrying capacity has been explored to some extent (e.g. level of phosphorus that will trigger eutrophication), the definition of critical limits for social change and indicators have not been fully defined in the context of aquaculture. According to Little et al. (2012), critical limits and indicators should be produced within the broader producer community and should be ideally monitored over time and/or matched with otherwise similar communities where aquaculture is not established as a major activity. This approach would allow identification of the depth and spread of impacts within communities in which aquaculture is established, either through direct participation as producers or indirectly through employment or linkages within the economy. Beyond the immediate net benefits, they should also indicate whether aquaculture, once established, supports or detracts from equity within the community. These indicators should include: (i) proportion of households within the community that gain some benefit(s) from aquaculture; (ii) evidence for complementarity within the livelihood portfolio; (iii) trend of increasing median incomes of all households in the community where aquaculture is practised; (iv) low standard error of the mean for monthly household incomes in aquaculture communities; and (v) increasing trend in day labour rate (both in aquaculture and non-aquaculture related activities (Faruque, 2007).
National regulators worldwide should implement aquaculture carrying capacity regulation with full consideration of more than just emission standards or EQSs. This would allow establishment of different categories of sites and identification of areas that are likely to be acceptable for aquaculture development. Because there is no consensus among stakeholders and countries to set acceptable ecological aquaculture impacts, it is important to ensure consistent regulation. It is also important to avoid regulation on a site-by-site basis where decisions on site selection are made on an individual basis in response to applications for tenure (McDaniels, Dowlatabadi and Stevens, 2005). This mechanism ignores the fact that many of the major concerns involve cumulative impacts at the waterbody scale. Questions about size and distribution of aquaculture activities can neither be answered by considering local, site-by-site criteria nor by a process that is reactive rather than proactive. Instead, siting criteria are better if managed through region-wide planning and based upon regulations appropriately aimed to address cumulative impacts.
Carrying capacities and site selection within the ecosystem approach to aquaculture

40 Site selection and carrying capacities for inland and coastal aquaculture
ConclusionsThe use and implementation of the carrying capacity concept within the EAA can be highly complex, and a number of considerations must be taken into account. One of the most difficult problems to overcome is the difference in nature of what carrying capacity actually means in the context of aquaculture and its development. The classification of the types or categories of carrying capacities described by McKindsey et al. (2006) for shellfish culture is a useful interpretation of carrying capacity, but their implementation in general aquaculture practice and development must also be able to allow for systems where species are simple consumers (e.g. molluscan shellfish, seaweed), those which are fed from external sources but are net contributors into the environment (e.g. carnivorous fish, shrimp), or mixtures of both systems. Equally, the four categories of carrying capacity will be implemented differently depending on local conditions and requirements for these species and issues of local regulation and governance. This leads to the necessity of implementing these categories of carrying capacities differentially according to weightings relevant to the species, systems and locality.
The implementation of the EAA based upon application of carrying capacities will therefore require a defined system of weighting factors, leading to a series of questions:
1. What are the relative weightings for the different combinations of species, farming systems and localities?
2. Can rules be developed to decide these relative weightings of the four categories under a range of circumstances?
3. Can these rules be defined generically in a single system, which forms the basis for implementation of the four categories throughout the world?
4. Can these weightings be incorporated into the existing regulation and governance of aquaculture in the different localities, or should they inform these for the future?
Implementation and measurement of the effectiveness of the four categories, in answering the questions above, will be dependent on specific indicators for collection of baseline or subsequent monitoring data. As with the capacity categories, these indicators may vary depending on the system, location and governance. These too will need careful consideration as to their implementation and relevance to a particular aquaculture system and locality.
There are a number of methods and/or generalizations that can be used to weigh both the carrying capacity categories and their indicators. One such example is that suggested by Gibbs (2009) for marine mollusc culture in New Zealand. Here, the approach did not include the physical carrying capacity as a particular category, but begins the development process with an initial site selection using the measures and models implicit in the physical carrying capacity category. Then, once the potential for aquaculture is established, the other categories can be differentially applied depending on the weightings discussed above. An example of this weighting is given in Ferreira, Ramos and Costa-Pierce (2012). In addition to the remaining categories of carrying capacity, Gibbs (2009) introduced “economic capacity” as the biomass at a particular location for which investment can be secured. This brings in an additional element probably considered under the initial four categories within the production capacity category.
Some form of EIA is required as part of the aquaculture licensing process in many countries, and the future implementation of carrying capacity criteria could be built within these EIA systems. In addition, to ensure a more effective ecosystem perspective, it is often necessary to go to a higher level strategic planning and management framework, including SEIA, and in many cases connecting the estimation of carrying capacity to risk assessment.
These issues, and the need to weigh carrying capacity categories relative to each other, will be further developed and refined as part of the FAO Guidelines for implementation of the EAA using a carrying capacity approach.
41
ReferencesAguilar-Manjarrez, J. 1996. Development and evaluation of GIS-based models for
planning and management of coastal aquaculture: a case study in Sinaloa, Mexico. Institute of Aquaculture, University of Stirling, Scotland, UK. (Ph.D. dissertation)
Aguilar-Manjarrez, J. & Nath, S.S. 1998. A strategic reassessment of fish farming potential in Africa. CIFA Technical Paper No. 32. Rome, FAO. 170 pp. (available at www.fao.org/docrep/W8522E/W8522E00.htm).
Aguilar-Manjarrez, J., Kapetsky, J.M. & Soto, D. 2010. The potential of spatial planning tools to support the ecosystem approach to aquaculture. FAO Expert Workshop, 19–21 November 2009, Rome. Fisheries and Aquaculture Proceedings No. 17. Rome, FAO. 176 pp. (also available at www.fao.org/docrep/012/i1359e/i1359e00.htm).
Angel, D. & Freeman, S. 2009. Integrated aquaculture (INTAQ) as a tool for an ecosystem approach to the marine farming sector in the Mediterranean Sea. In D. Soto, ed. Integrated mariculture: a global review, pp. 133–183. FAO Fisheries and Aquaculture Technical Paper No. 529. Rome, FAO. 183 pp. (also available at www.fao.org/docrep/012/i1092e/i1092e00.htm).
Bell, S. & Morse, S. 2008. Sustainability indicators: measuring the immeasurable. London, Earthscan. 240 pp.
Beveridge, M.C.M. 1984. Cage and pen fish farming: carrying capacity models and environmental impact. FAO Fisheries and Aquaculture Technical Paper No. 255. Rome, FAO. 131 pp. (also available at www.fao.org/DOCREP/005/AD021E/AD021E00.HTM).
Beveridge, M.C.M. 1996. Cage aquaculture. Second edition. Oxford, UK, Wiley-Blackwell. 352 pp.
Beveridge, M.C.M. 2004. Cage Aquaculture. Third edition. Oxford. UK. Wiley-Blackwell. pp 368.
Beveridge, M.C.M. & Phillips, M. 1993. Environmental impact of tropical inland aquaculture. In R.S.V. Pullin, H. Rosenthal & J.L. Maclean, eds. Environment and aquaculture in developing countries, pp. 213–236. ICLARM Conference Proceedings 31. Manila, ICLARM.
Byron, C.J., Bengtson, D., Costa-Pierce, B. & Calanni, J. 2011. Integrating science into management: ecological carrying capacity of bivalve shellfish aquaculture. Marine Policy, 35: 363–370.
Byron, C.J. & Costa-Pierce, B. 2013. Carrying capacity tools for use in the implementation of an ecosystems approach to aquaculture. In L.G. Ross, T.C. Telfer, L. Falconer, D. Soto. & J. Aguilar-Manjarrez, eds. Site selection and carrying capacity for inland and coastal aquaculture, pp. 87–101. FAO/Institute of Aquaculture, University of Stirling, Expert Workshop, 6–8 December 2010. Stirling, the United Kingdom of Great Britain and Northern Ireland. FAO Fisheries and Aquaculture Proceedings No. 21. Rome, FAO. 282 pp.
Cheney, D., Langan, R., Heasman, K., Friedman, B. & Davis, J. 2010. Shellfish culture in the open ocean: lessons learned for offshore expansion. Marine Technology Society Journal, 44 (3): 55–67.
Corner, R.A., Brooker, A.J., Telfer, T.C. & Ross, L.G. 2006. A fully integrated GIS-based model of particulate waste distribution from marine fish-cage sites. Aquaculture, 258: 299–311.
Costa-Pierce, B.A. 1998. Constraints to the sustainability of cage aquaculture for resettlement from hydropower dams in Asia: an Indonesian case study. Journal of Environment and Development, 7(4): 333–363.
Costa-Pierce, B.A. 2002. Farming systems research and extension methods for the development of sustainable aquaculture ecosystems. In B.A. Costa-Pierce, ed. Ecological aquaculture: the evolution of the blue revolution, pp. 103–124. Oxford, UK, Blackwell Science. 320 pp.
Carrying capacities and site selection within the ecosystem approach to aquaculture

42 Site selection and carrying capacities for inland and coastal aquaculture
Cromey, C.J., Nickell, T.D. & Black, K.D. 2002. DEPOMOD – modelling the deposition and biological effects of waste solids from marine cage farms. Aquaculture, 214: 211–239.
Cromey, C.J., Nickell, T.D., Black, K.D., Provost, P.G. & Griffiths, C.R. 2002. Validation of a fish farm waste resuspension model by use of a particulate tracer discharged from a point source in a coastal environment. Estuaries, 25: 916–929.
Cross, S. 2013. Carrying capacity and site selection tools for use in the implementation of an ecosystem-based approach to aquaculture in Canada: a case study. In L.G. Ross, T.C. Telfer, L. Falconer, D. Soto. & J. Aguilar-Manjarrez, eds. Site selection and carrying capacity for inland and coastal aquaculture, pp. 253–262. FAO/Institute of Aquaculture, University of Stirling, Expert Workshop, 6–8 December 2010. Stirling, the United Kingdom of Great Britain and Northern Ireland. FAO Fisheries and Aquaculture Proceedings No. 21. Rome, FAO. 282 pp.
Culberson, S.D. & Piedrahita, R.H. 1996. Aquaculture pond ecosystem model: temperature and dissolved oxygen prediction – mechanism and application. Ecological Modelling, 89 (1–3): 231–258.
Dallaghan, B. 2009. UISCE project – virtual aquaculture. Aquaculture Ireland, 128: 6–7.Dalton, T. 2005. Beyond biogeography: a framework for involving the public in
planning of U.S. marine protected areas. Conservation Biology, 1392–1401.Dalton, T. 2006. Exploring participants’ views of participatory coastal and marine
resource management processes. Coastal Management, 34: 351–367.Davies, I.M & McLeod, D. 2003. Scoping study for research into the aquaculture
(shellfish) carrying capacity of GB coastal waters. London, The Crown Estate. Final report. 76 pp. (also available at http://77.68.38.63/aqua_capacity_gb_waters.pdf).
Duarte, C.M., Holmer, M., Olsen, Y., Soto, D., Marbà, N., Guiu, J., Black K. & Karakassis, I. 2009. Will the oceans help feed humanity? Bioscience, 59: 967–976.
Dudley, R.W., Panchang, V.G., Newell, C.R. 1998. AWATS: A Net-Pen Aquaculture Waste Transport Simulator for Management Purposes. Proc. 26th US-Japan Aquaculture Symposium, Durham, New Hampshire, Nov. 1997. US-Japan Cooperative Program in Natural Resources (UJNR) Technical Report No. 26, Ed. W. H. Howell et al. pp 215–228.
EcoWin2000. 2010. EcoWin2000 screening model: aquaculture carrying capacity. [online] United Kingdom. [Cited 25 October 2012]. www.ecowin2000.com.
Ernst, D.H., Bolte, J.P. & Nath, S.S. 2000. AquaFarm: simulation and decision support for aquaculture facility design and management planning. Aquacultural Engineering, 23 (1–3): 121–179.
Ervik, A., Agnalt, A.-L., Asplin, L., Aure, J., Bekkvik, T.C., Døskeland, I., Hageberg, A.A., Hansen, T., Karlsen, Ø., Oppedal, F. & Strand, Ø. 2008. AkvaVis – dynamisk GIS-verktøyfor lokalisering av oppdrettsanlegg for nye oppdrettsarter – Miljøkrav for nye oppdrettsarter og laks. Fisken og Havet, nr 10/2008. 90 pp.
Fabi, G., Manoukian, S. & Spagnolo, A. 2009. Impact of an open-sea suspended mussel culture on macrobenthic community (Western Adriatic Sea). Aquaculture, 289: 54–63.
FAO. 1995. Code of Conduct for Responsible Fisheries. Rome. 41 pp. (available at www.fao.org/docrep/005/v9878e/v9878e00.htm).
FAO. 2008. Report of the Expert Consultations on the Assessment of Socio-economic Impacts of Aquaculture. Ankara, Turkey, 4–8 February 2008.
FAO. 2009. Environmental impact assessment and monitoring in aquaculture. FAO Fisheries and Aquaculture Technical Paper No. 527. Rome. 57 pp. Includes a CD-ROM containing the full document (648 pp.) (also available at www.fao.org/docrep/012/i0970e/i0970e00.htm).
FAO. 2010. Aquaculture development. 4. Ecosystem approach to aquaculture. FAO Technical Guidelines for Responsible Fisheries No. 5, Suppl. 4. Rome. 53 pp. (also available at www.fao.org/docrep/013/i1750e/i1750e00.htm).
43
FAO. 2011. Report of the WGSC – SHoCMed Workshop on the definition and environmental monitoring within Allowable Zone of Effect (AZE) of aquaculture activities within the Mediterranean countries. Malaga, Spain, 16–18 November 2011 (available at http://www.faosipam.org/GfcmWebSite/CAQ/WGSC/2011/SHoCMed_AZE/GFCM-CAQ-WGSC-2011-SHoCMed_AZE-Report.pdf).
Faruque, G. 2007. An exploration of impacts of aquaculture production and marketing on rural livelihoods in three regions in Bangladesh. University of Stirling, UK. (Ph.D. dissertation)
Fernandes, T. F., Eleftheriou, A., Ackefors, H., Eleftheriou, M., Ervik, A., Sanchez-Mata, A., Scanlon, T., White, P., Cochrane, S., Pearson, T. H. & Read, P.A. 2001. The scientific principles underlying the monitoring of the environmental impacts of aquaculture. Journal of Applied Ichthyology, 17: 181–193.
Ferreira, J. G., Hawkins, A.J.S. & Bricker, S.B. 2007. Management of productivity, environmental effects and profitability of shellfish aquaculture – the Farm Aquaculture Resource Management (FARM) model. Aquaculture, 264: 160–174.
Ferreira, J.G., Hawkins, A.J.S., Monteiro, P., Moore, H., Service, M., Pascoe, P.L., Ramos, L. & Sequeira, A. 2008a. Integrated assessment of ecosystem-scale carrying capacity in shellfish growing areas. Aquaculture, 275: 138–151.
Ferreira, J.G., Andersson, H.C., Corner, R.A., Desmit, X., Fang, Q., de Goede, E.D., Groom, S.B., Gu, H., Gustafsson, B.G., Hawkins, A.J.S., Hutson, R., Jiao, H., Lan, D., Lencart-Silva, J., Li, R., Liu, X., Luo, Q., Musango, J.K., Nobre, A.M., Nunes, J.P., Pascoe, P.L., Smits, J.G.C., Stigebrandt, A., Telfer, T.C., de Wit, M.P., Yan, X., Zhang, X.L., Zhang, Z., Zhu, M.Y., Zhu, C.B., Bricker, S.B., Xiao, Y., Xu, S., Nauen, C.E. & Scalet, M. 2008b. Sustainable options for people, catchment and aquatic resources. The SPEAR project, an international collaboration on integrated coastal zone management. Institute of Marine Research/European Commission. 180 pp. (also available at www.biaoqiang.org/documents/SPEAR book.pdf).
Ferreira, J.G., Aguilar-Manjarrez, J., Bacher, C., Black, K., Dong, S.L., Grant, J., Hofmann, E., Kapetsky, J., Leung, P.S., Pastres, R., Strand, Ø. & Zhu, C.B. 2012. Progressing aquaculture through virtual technology and decision-support tools for novel management. In R.P. Subasinghe, J.R. Arthur, D.M. Bartley, S.S. De Silva, M. Halwart, N. Hishamunda, C.V. Mohan & P. Sorgeloos, eds. Farming the waters for people and food, pp. 643–704. Proceedings of the Global Conference on Aquaculture 2010, Phuket, Thailand, 22–25 September 2010. FAO, Rome, and NACA, Bangkok. (also available at www.fao.org/docrep/015/i2734e/i2734e00.htm).
Ferreira, J., Ramos, L. & Costa-Pierce, B.A. 2013. Key drivers and issues surrounding carrying capacity and site selection, with emphasis on environmental components. In L.G. Ross, T.C. Telfer, L. Falconer, D. Soto. & J. Aguilar-Manjarrez, eds. Site selection and carrying capacities for inland and coastal aquaculture, pp. 47–86. FAO/Institute of Aquaculture, University of Stirling, Expert Workshop, 6–8 December 2010. Stirling, the United Kingdom of Great Britain and Northern Ireland. FAO Fisheries and Aquaculture Proceedings No. 21. Rome, FAO. 282 pp.
Filgueira, R. & Grant, J. 2009. A box model for ecosystem-level management of mussel culture carrying capacity in a coastal bay. Ecosystems, 12: 1222–1233.
Ford, A. 1999. Modelling the environment. Washington DC, Island Press. 415 pp.Franco, A.R., Ferreira, J.G. & Nobre, A.M. 2006. Development of a growth model
for penaeid shrimp. Aquaculture, 259 (1–4): 268–277.Gaĉek, S. & Legović, T. 2010. Towards carrying capacity assessment for aquaculture
in the Bolinao Bay, Philippines: a numerical study of tidal circulation. Ecological Modelling, 221: 1394–1412.
Carrying capacities and site selection within the ecosystem approach to aquaculture

44 Site selection and carrying capacities for inland and coastal aquaculture
GESAMP. 1986. Environmental Capacity, An Approach to Marine Pollution Prevention. GESAMP Reports and Studies No. 30. 62 pp. (available at www.gesamp.org/data/gesamp/files/media/Publications/Reports_and_studies_30/gallery_1263/object_1271_large.pdf).
Gibbs, M.T. 2007. Sustainability performance indicators for suspended bivalve aquaculture activities. Ecological Indicators, 7: 94–107.
Gibbs, M.T. 2009. Implementation barriers to establishing a sustainable coastal aquaculture sector. Marine Policy, 33: 83–89.
Groffman, P., Baron, J., Blett, T., Gold, A., Goodman, I., Gunderson, L., Levinson, B., Palmer, M., Paerl, H., Peterson, G., LeRoy Poff, N., Rejeski, D., Reynolds, J., Turner, M., Weathers, K. & Wiens, J. 2006. Ecological thresholds: the key to successful environmental management or an important concept with no practical application? Ecosystems, 9: 1–13.
Hambery, J. 2005. Aquaculture development within the capacity of the environment: a short guide for developing user led environmental management systems. Report to DFID Aquaculture and Fish Genetics Research Programme. Hambery Consulting. 38 pp.
Hambery, J., Le Anh, T., Rouf, M.A., Dung, V., van Tu, N., Naser, N. & Telfer, T. 2005. Practical guidance and allocation of environmental capacity for aquaculture in tropical developing countries (TROPECA). Report to DFID Aquaculture and Fish Genetics Research Programme. Hambery Consulting. 9 pp.
Hansen, P.K., Ervik, A., Schaanning, M., Johannessen, P., Aure, J., Jahnsen, T. & Stigebrandt, A. 2001. Regulating the local environmental impact of intensive, marine fish farming: II. The monitoring programme of the MOM system (Modelling–Ongrowing fish farms–Monitoring). Aquaculture, 194: 75–92.
Hassan, D. 2006. Protecting the marine environment from land-based sources of pollution: towards effective international cooperation. Hampshire, UK, Ashgate. 233 pp.
Henkel, H. & Stirrat, R. 2001. Participation as spiritual duty; empowerment as secular subjection. In B. Cooke & U. Kothari, eds. Participation: the new tyranny? London, Zed Books. 224 pp.
Inglis, G.J., Hayden, B.J. & Ross, A.H. 2000. An overview of factors affecting the carrying capacity of coastal embayments for mussel culture. NIWA Client Report; CHC00/69 Project No. MFE00505. Christchurch, New Zealand, National Institute of Water and Atmospheric Research, Ltd. 31 pp.
International Council for the Exploration of the Sea (ICES). 2008. Theme session H: Ecological carrying capacity in shellfish culture. Conveners: F. O’Beirn, & P.J. Cranford. Halifax, Nova Scotia, 2008.
International Union for Conservation of Nature (IUCN). 2009. Aquaculture site selection and site management. Spain, IUCN. 313 pp.
Jamu, D.M. & Piedrahita, R.H. 2002a. Ten-year simulations of organic matter concentrations in tropical aquaculture ponds using the multiple pool modelling approach. Aquacultural Engineering, 25(3): 187–201.
Jamu, D.M. & Piedrahita, R.H. 2002b. An organic matter and nitrogen dynamics model for the ecological analysis of integrated aquaculture/agriculture systems: I. Model development and calibration. Environmental Modelling & Software with Environment Data News, 17(6): 571–582.
Kapetsky, J.M. & Aguilar-Manjarrez, J. 2007. Geographic information systems, remote sensing and mapping for the development and management of marine aquaculture. FAO Fisheries Technical Paper No. 458. Rome, FAO. 125 pp. (also available at http://www.fao.org/docrep/009/a0906e/a0906e00.htm).

45
Kapetsky, J.M. & Aguilar-Manjarrez, J. 2013. From estimating global potential for aquaculture to selecting farm sites: perspectives on spatial approaches and trends. In L.G. Ross, T.C. Telfer, L. Falconer, D. Soto. & J. Aguilar-Manjarrez, eds. Site selection and carrying capacities for inland and coastal aquaculture, pp. 129–146. FAO/Institute of Aquaculture, University of Stirling, Expert Workshop, 6–8 December 2010. Stirling, the United Kingdom of Great Britain and Northern Ireland. FAO Fisheries and Aquaculture Proceedings No. 21. Rome, FAO. 282 pp.
Kapetsky, J.M. & Chakalall, B. 1998. A strategic assessment of the potential for freshwater fish farming in the Caribbean Island States. Una evaluación estratégica de la potencialidad para la piscicultura dulceacuícola en los Estados Insulares del Caribe. COPESCAL Technical Paper/Documento Técnico de la COPESCAL No. 10, Suppl./Supl. Rome/Roma, FAO. 41 pp. (available at www.fao.org/docrep/005/X0332B/X0332B00.htm).
Kapetsky, J.M. & Nath, S.S. 1997. A strategic assessment of the potential for freshwater fish farming in Latin America. COPESCAL Technical Paper No. 10. Rome, FAO. 128 pp. (available at www.fao.org/docrep/005/w5268e/W5268E00.htm).
Kapetsky, J.M., Hill, J.M. & Worthy, L.D. 1988. A geographical information system for catfish farming development. Aquaculture, 68: 311–320.
Little, D.C., Murray, F.J., Leschen, W. & Waley, D. 2013. Socio-economic factors affecting aquaculture site selection and carrying capacity. In L.G. Ross, T.C. Telfer, L. Falconer, D. Soto. & J. Aguilar-Manjarrez, eds. Site selection and carrying capacities for inland and coastal aquaculture, pp. 103–115. FAO/Institute of Aquaculture, University of Stirling, Expert Workshop, 6–8 December 2010. Stirling, the United Kingdom of Great Britain and Northern Ireland. FAO Fisheries and Aquaculture Proceedings No. 21. Rome, FAO. 282 pp.
McDaniels, T., Dowlatabadi, H. & Stevens, S. 2005. Multiple scales and regulatory gaps in environmental change: the case of salmon aquaculture. Global Environmental Change, 15(1): 9–21.
McKindsey, C.W., Thetmeyer, H., Landry, T. & Silvert, W. 2006. Review of recent carrying capacity models for bivalve culture and recommendations for research and management. Aquaculture, 261(2): 451–462.
Meaden, G.J. 1987. Where Should Trout Farms be in Britain? Fish Farmer, 10(2): 33–35.Meaden, G.J. & Aguilar-Manjarrez, J., eds. 2013. Advances in geographic information
systems and remote sensing for fisheries and aquaculture. CD-ROM version. FAO Fisheries and Aquaculture Technical Paper No. 552. Rome, FAO. 425 pp.
Moreno Navas, J., Telfer, T.C. & Ross, L.G. 2011. Spatial modelling of environmental vulnerability of marine finfish aquaculture using GIS-based neuro fuzzy techniques. Marine Pollution Bulletin, 62(8): 1786–1799.
Nath, S.S., Bolte, J.P., Ross, L.G. & Aguilar-Manjarrez, J. 2000. Applications of geographical information systems (GIS) for spatial decision support in aquaculture. Aquacultural Engineering, 23: 233–278.
Panchang, V., Cheng, G. & Newell, C. 1997. Modelling hydrodynamics and aquaculture waste transport in coastal Maine. Estuaries, 20(1):14–41.
Pullin, R., Rosenthal, H. & Maclean, J. 1993. Environment and aquaculture in developing countries. ICLARM Conference Proceedings No. 31. 359 pp.
Raillard, O. & Ménesguen, A. 1994. An ecosystem box model for estimating the carrying capacity of a macrotidal shellfish system. Mar. Ecol. Prog. Ser., 115: 117–130.
Ross, L.G., Handisyde, N. & Nimmo, D.C. 2009. Spatial decision support in aquaculture: the role of geographical information systems and remote sensing. In G. Burnell, ed. New technologies in aquaculture: improving production efficiency, quality and environmental management. Cambridge, UK, Woodhead Publishing Limited.
Carrying capacities and site selection within the ecosystem approach to aquaculture

46 Site selection and carrying capacities for inland and coastal aquaculture
Schaffner, M., Bader, H.P. & Scheidegger, R. 2009. Modelling the contribution of point sources and non-point sources to Thachin River water pollution. Science of the Total Environment, 407 (17): 4902–4915.
Scott, P.C. 2003. GIS and remote sensing-based models for development of aquaculture and fisheries in the coastal zone: a case study in Baía de Sepetiba, Brazil. University of Stirling, Scotland, UK. 308 pp. (Ph.D. dissertation)
Scottish Association for Marine Science (SAMS). 2004. Ecosystem approach for sustainable aquaculture. In The ECASA Toolbox [online]. United Kingdom. [Cited 25 October 2012]. www.ecasa.org.uk.
Sustaining Ethical Aquaculture Trade project (SEAT). 2012. Dynamic modelling and GIS. In SEAT [online]. United Kingdom. [Cited 25 October 2012]. http://seatglobal.eu/work-packages/wp4-environmental-models
Silva, C., Ferreira, J.G., Bricker, S.B., DelValls, T.A., Martín-Díaz, M.L. & Yañez, E. 2011. Site selection for shellfish aquaculture by means of GIS and farm-scale models, with an emphasis on data-poor environments. Aquaculture, 318: 444–457.
Silvert, W. & Cromey, C.J. 2001. Modelling impacts. In K.D. Black, ed. Environmental Impacts of Aquaculture. Sheffield, UK, Sheffield Academic Press. 214 pp.
Sorgeloos, P. 2010. Resources, technologies and services for future aquaculture: a needs assessment for sustainable development. Book of Abstracts, Global Conference on Aquaculture 2010, 22–25 September 2010. pp. 29–31. FAO/NACA/Thailand Department of Fisheries, Bangkok, Thailand.
Soto, D. & Norambuena F. 2004. Evaluating salmon farming nutrient input effects in Southern Chile inland seas: a large-scale mensurative experiment. Journal of Applied Ichthyology, 20: 1–9.
Soto, D., Aguilar-Manjarrez, J. & Hishamunda, N., eds. 2008. Building an ecosystem approach to aquaculture. FAO/Universitat de les Illes Balears Expert Workshop, 7–11 May 2007, Palma de Mallorca, Spain. FAO Fisheries and Aquaculture Proceedings No. 14. Rome, FAO. 221 pp. (also available at www.fao.org/docrep/011/i0339e/i0339e00.htm).
Soto, D., Salazar, F.J. & Alfaro, M.A. 2007. Considerations for comparative evaluation of environmental costs of livestock and salmon farming in southern Chile. In D.M. Bartley, C. Brugère, D. Soto, P. Gerber & B. Harvey, eds. Comparative assessment of the environmental costs of aquaculture and other food production sectors: methods for meaningful comparisons, pp. 121–136. FAO/WFT Expert Workshop, 24–28 April 2006, Vancouver, Canada. FAO Fisheries Proceedings No. 10. Rome, FAO. 241 pp. (also available at www.fao.org/docrep/010/a1445e/a1445e00.htm).
Spruill, C.A., Workman, S.R. & Taraba, J.L. 2000. Simulation of daily and monthly stream discharge from small watersheds using the SWAT model. Transactions of the ASAE, 43(6): 1431–1439.
Telfer, T.C. & Beveridge M.C.M. 2001. Monitoring environmental effects of marine fish aquaculture. Cahiers Options Mediterranennes, 55: 75–84.
Valavanis, V.D. 2002. Geographic information systems in oceanography and fisheries. London, Taylor & Francis. 209 pp.
Wang, Y.-H., Turton, R., Semmes, K. & Borisova, T. 2008. Raceway design and simulation system (RDSS): an event-based program to simulate the day-to-day operations of multiple-tank raceways. Aquacultural Engineering, 39: (2–3), 59–71.
Xiao, Y., Ferreira, J.G., Bricker, S.B., Nunes, J.P., Zhu, M. & Zhang, X. 2007. Trophic assessment in chinese coastal systems – review of methodologies and application to the Changjiang (Yangtze) Estuary and Jiaozhou Bay. Estuaries and Coasts, 30(6): 1–18.
Zhang, J., Hansen, P.K., Fang, J., Wang, W. & Jiang, Z. 2009. Assessment of the local environmental impact of intensive marine shellfish and seaweed farming. Application of the MOM system in the Sungo Bay, China. Aquaculture, 287: 304–310.