carsales quarterly insights reportshareholder.carsales.com.au/formbuilder/_resource/...carsales...
TRANSCRIPT
carsales Quarterly Insights Report - October 2015 1
carsales Quarterly Insights ReportOctober 2015
2 carsales Quarterly Insights Report - October 2015
The carsales Quarterly Insights Report - October 2015
The report gives access to data previously only available
to Australia’s manufacturers and distributors and sheds light
on the cars we look for, the cars we lust after and the cars
we buy, while investigating how the market differs from
state to state.
Each quarter, the carsales Quarterly Insight Report will
feature an in-depth review of one specific vehicle in the
market. Over the coming years, this will create an extensive
profile of the Australian car buying public. The first vehicle in
the headlights of the report is the Volkswagen Golf - a car
which was chosen for profiling before consumer sentiment
towards their emissions scandal could be evaluated.
Hundreds of thousands of prospective car buyers use
carsales.com.au each month to contact car dealers or
private sellers. The vehicle information associated with
these transactions is collected and analysed daily by
carsales to track the ‘user-chooser’ private car marketplace
and provide a holistic insight to both new and used car
purchasing. This data stands in contrast to existing new-car
buying surveys or new-car-registrations that are largely
composed of business, fleet or government orders and
often distorted by short-term dealer incentives.
The Australian love affair with the car has been well documented
over the years and is arguably part of our cultural identity; but how
much do we really know about the cars we buy, why we buy them
and what they mean to us? The carsales Quarterly Insights Report
aims to shed light on our love affair, each quarter investigating the
market and digging into the data that drives the new and used car
market in Australia.
carsales Quarterly Insights Report - October 2015 3
Contents
Vehicle in the headlights - Volkswagen Golf 5
Search behaviour 12
Top 10 cars across Australia 17
What cars do people buy for others? 29
When colour does matter! 30
Driving away at the right price? 36
carsales Quarterly Insights Report parting thoughts... 44
Contact details 45
4 carsales Quarterly Insights Report - October 2015
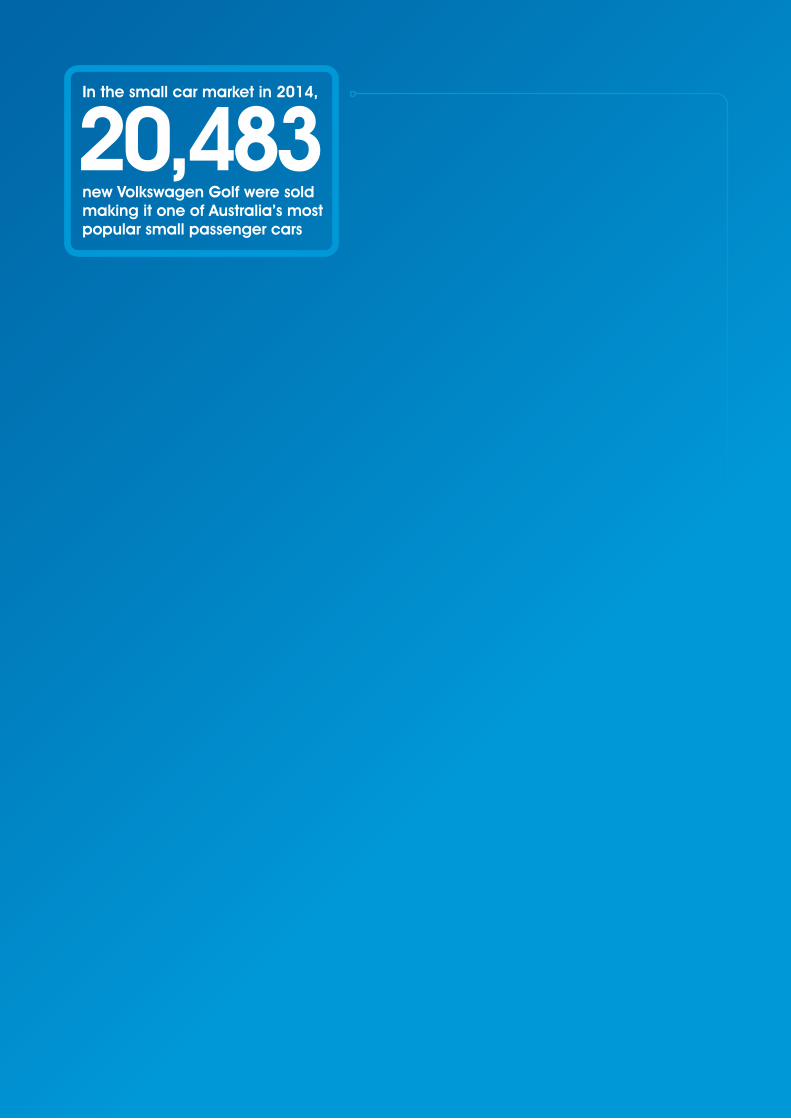
In the small car market in 2014,
20,483new Volkswagen Golf were sold making it one of Australia’s most popular small passenger cars

carsales Quarterly Insights Report - October 2015 5
Vehicle in the headlights - Volkswagen GolfThe Volkswagen Golf is popular with Australians. According to data
from the Federal Chamber of Automotive Industries in the financial
year to 30 June 2015, 20,483 new Golf were registered Down Under.
This places the Golf fourth in the small car market, behind the Toyota
Corolla (43,319), Mazda 3 (41,216) and Hyundai i30 (31,614). The
Holden Cruze came in fifth with 17,121 registrations.
The VW Golf is also the 10th highest selling car of any type in
Australia, according to data from VFACTS.
Considering carsales’ data for the first half of 2015,
Australia-wide Golf shoppers tend to stick to traditional
colours with 27.2% of all enquiries for white. That said,
Northern Territory bucked the colour trend, opting for silver
as their most popular colour for a whopping 59.3% in the
Top End. Much has been written about black cars heating
up quicker than white cars - Mythbusters undertook an
experiment which saw the black car 5°C warmer than
the white car (52.2°C to 57.2°C) after a stint in the sun.
This could be one reason why Northern Territorians and
Queenslanders shun a black Golf with just 3.7% and 11.9%
of enquiries respectively in black, compared to a whopping
59.3% in silver for NT, and 33.96% in white in Queensland.
The cooler southern states may also care less about heating
caused by darker coloured cars.
Consumers tend to stick to traditional colours when
considering a Golf with 27.22% of all enquiries in white,
24.85% in silver and 17.54% in black - making up 69.6% of
all Golf enquiries in the year to July 2015.
Colours such as blue and red have been received with
a lukewarm reception nationally and, despite all states
showing a market for VW Golf in these colours, both blue
and red enthusiasts average less than 9% nationally.
6 carsales Quarterly Insights Report - October 2015
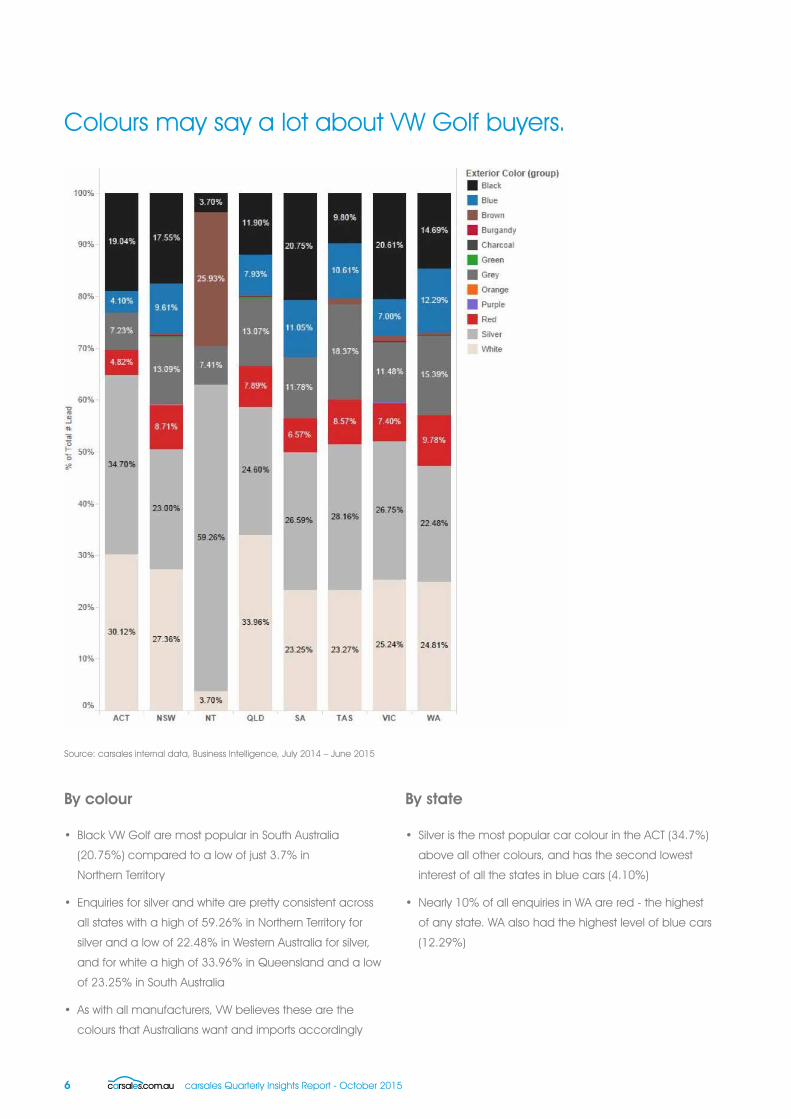
Source: carsales internal data, Business Intelligence, July 2014 – June 2015
Colours may say a lot about VW Golf buyers.
By colour
• Black VW Golf are most popular in South Australia
(20.75%) compared to a low of just 3.7% in
Northern Territory
• Enquiries for silver and white are pretty consistent across
all states with a high of 59.26% in Northern Territory for
silver and a low of 22.48% in Western Australia for silver,
and for white a high of 33.96% in Queensland and a low
of 23.25% in South Australia
• As with all manufacturers, VW believes these are the
colours that Australians want and imports accordingly
By state
• Silver is the most popular car colour in the ACT (34.7%)
above all other colours, and has the second lowest
interest of all the states in blue cars (4.10%)
• Nearly 10% of all enquiries in WA are red - the highest
of any state. WA also had the highest level of blue cars
(12.29%)
carsales Quarterly Insights Report - October 2015 7
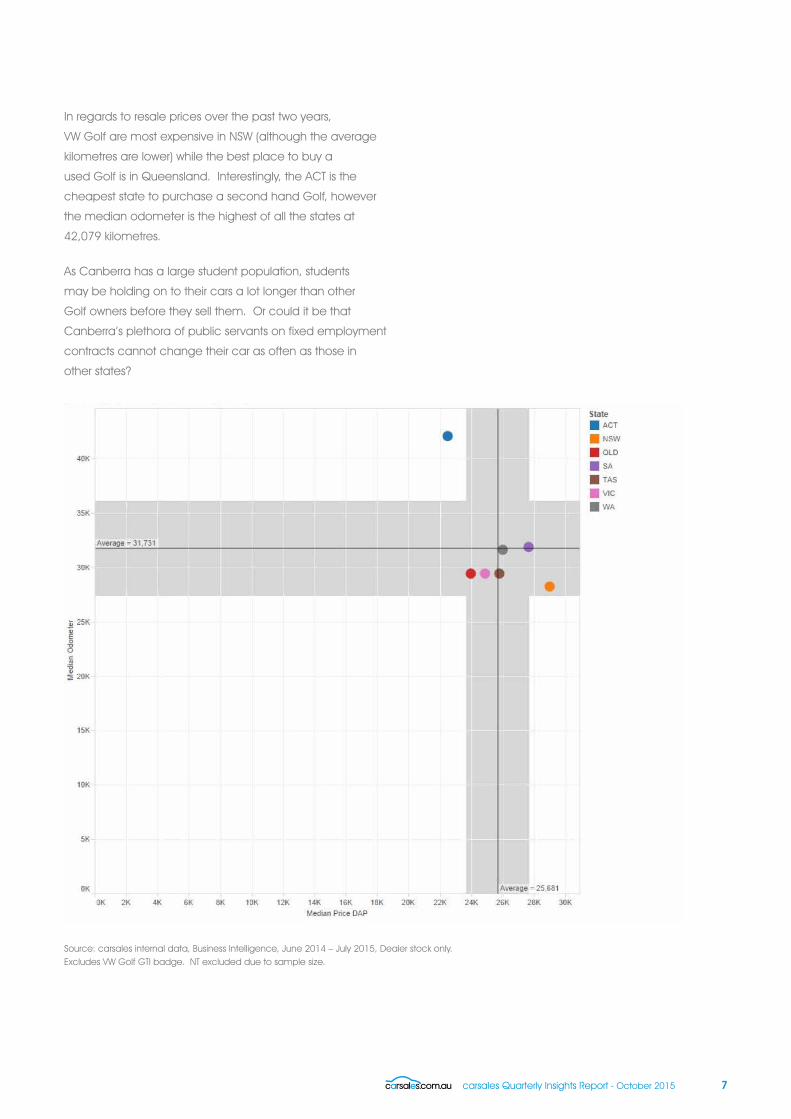
In regards to resale prices over the past two years,
VW Golf are most expensive in NSW (although the average
kilometres are lower) while the best place to buy a
used Golf is in Queensland. Interestingly, the ACT is the
cheapest state to purchase a second hand Golf, however
the median odometer is the highest of all the states at
42,079 kilometres.
As Canberra has a large student population, students
may be holding on to their cars a lot longer than other
Golf owners before they sell them. Or could it be that
Canberra’s plethora of public servants on fixed employment
contracts cannot change their car as often as those in
other states?
Source: carsales internal data, Business Intelligence, June 2014 – July 2015, Dealer stock only. Excludes VW Golf GTI badge. NT excluded due to sample size.
8 carsales Quarterly Insights Report - October 2015
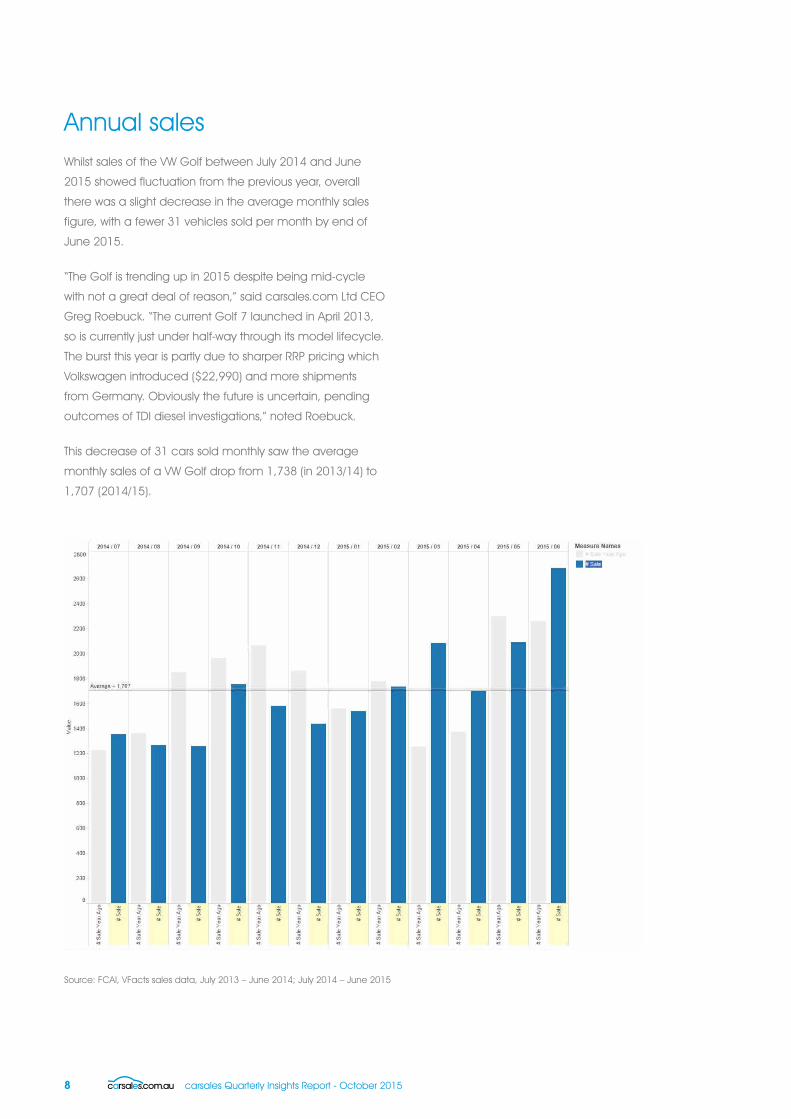
Annual salesWhilst sales of the VW Golf between July 2014 and June
2015 showed fluctuation from the previous year, overall
there was a slight decrease in the average monthly sales
figure, with a fewer 31 vehicles sold per month by end of
June 2015.
“The Golf is trending up in 2015 despite being mid-cycle
with not a great deal of reason,” said carsales.com Ltd CEO
Greg Roebuck. “The current Golf 7 launched in April 2013,
so is currently just under half-way through its model lifecycle.
The burst this year is partly due to sharper RRP pricing which
Volkswagen introduced ($22,990) and more shipments
from Germany. Obviously the future is uncertain, pending
outcomes of TDI diesel investigations,” noted Roebuck.
This decrease of 31 cars sold monthly saw the average
monthly sales of a VW Golf drop from 1,738 (in 2013/14) to
1,707 (2014/15).
Source: FCAI, VFacts sales data, July 2013 – June 2014; July 2014 – June 2015

carsales Quarterly Insights Report - October 2015 9
Small passenger car competitor analysisWith the Toyota Corolla and Mazda 3 consistent front-
runners in the small passenger car vehicle (sub $40,000),
the VW Golf is showing steady growth - much more so than
the Australian built Holden Cruze.
In the first five months of 2015, the Golf showed consistent
growth from December to April, thereafter dropping
approximately 3% in May along with the Toyota Corolla and
Mazda 3, meanwhile the Hyundai i30 experienced a very
large peak at the end of June.
carsales CEO Greg Roebuck says, “while at face value the
data suggests a spike in sales share, given our knowledge
of activity by dealers at this time of year, it might be more
accurate to say that dealers are trying to get rid of old stock
by redistributing it to family and friends.”
Source: FCAI, VFacts sales data, July 2014 – June 2015
10 carsales Quarterly Insights Report - October 2015
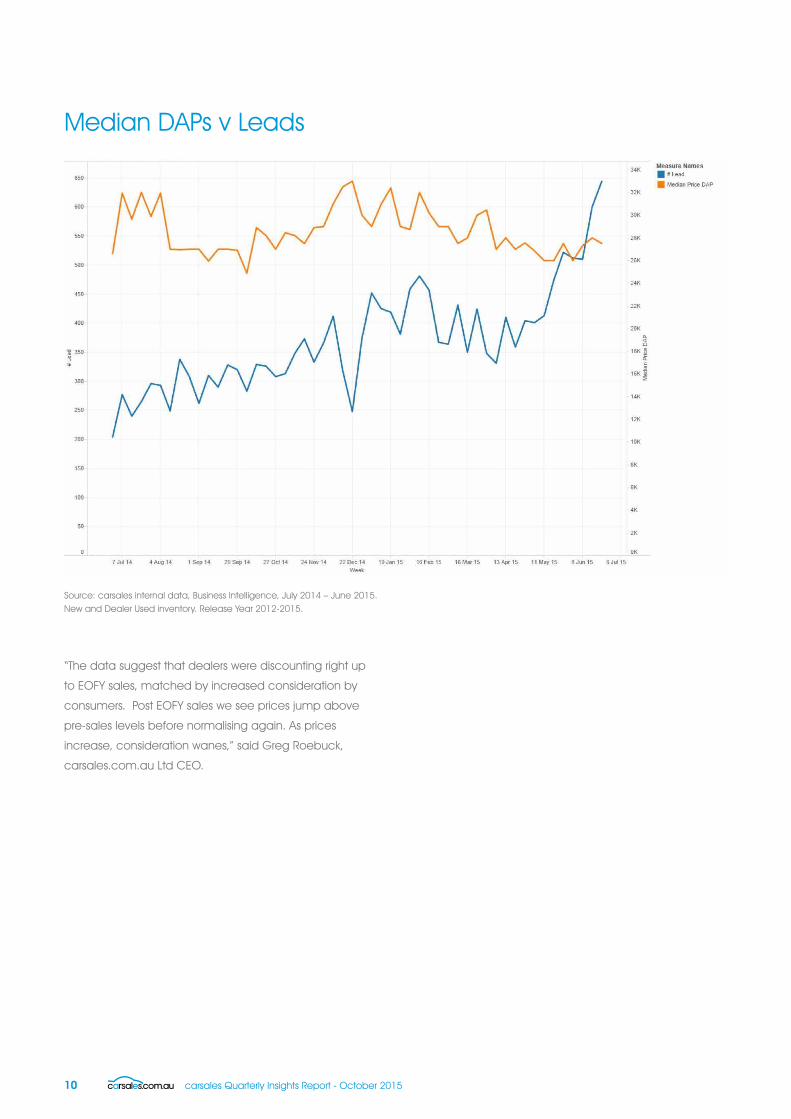
Median DAPs v Leads
“The data suggest that dealers were discounting right up
to EOFY sales, matched by increased consideration by
consumers. Post EOFY sales we see prices jump above
pre-sales levels before normalising again. As prices
increase, consideration wanes,” said Greg Roebuck,
carsales.com.au Ltd CEO.
Source: carsales internal data, Business Intelligence, July 2014 – June 2015. New and Dealer Used inventory. Release Year 2012-2015.
carsales Quarterly Insights Report - October 2015 11
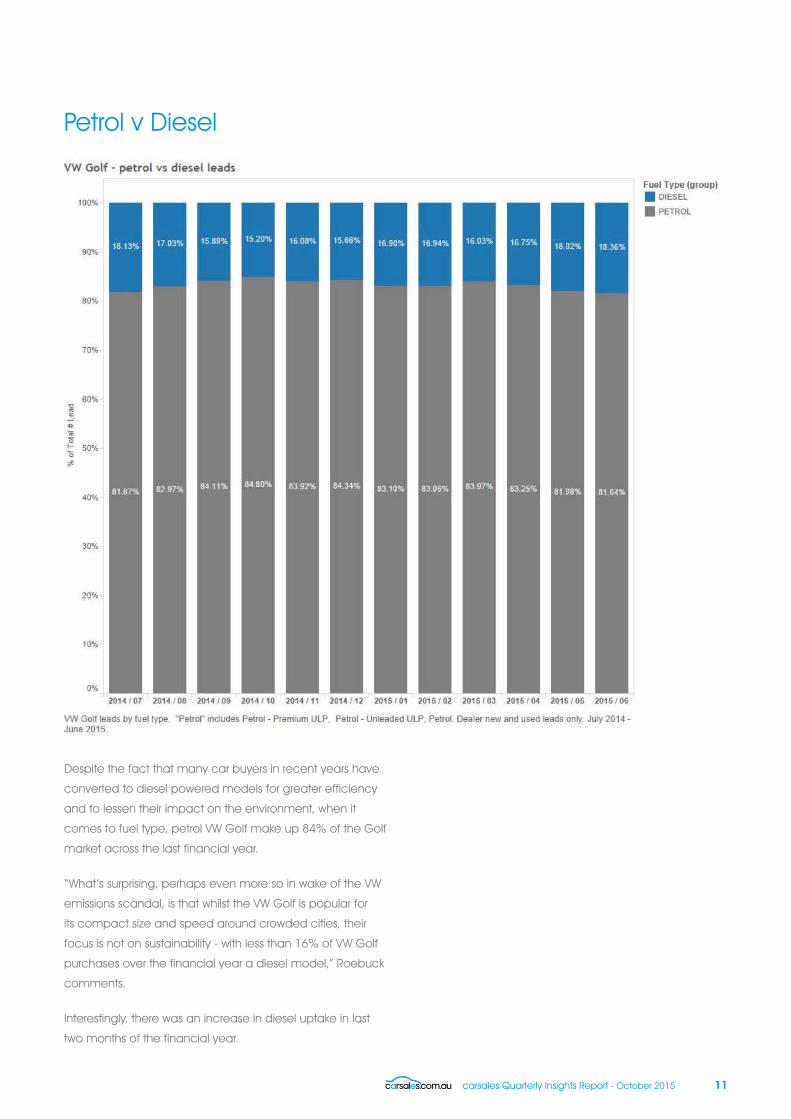
Petrol v Diesel
Despite the fact that many car buyers in recent years have
converted to diesel powered models for greater efficiency
and to lessen their impact on the environment, when it
comes to fuel type, petrol VW Golf make up 84% of the Golf
market across the last financial year.
“What’s surprising, perhaps even more so in wake of the VW
emissions scandal, is that whilst the VW Golf is popular for
its compact size and speed around crowded cities, their
focus is not on sustainability - with less than 16% of VW Golf
purchases over the financial year a diesel model,” Roebuck
comments.
Interestingly, there was an increase in diesel uptake in last
two months of the financial year.
12 carsales Quarterly Insights Report - October 2015
Search behaviour
As an online business, it’s therefore little wonder that this
behaviour of multi-screening is prevalent in the way people
use carsales as a search platform - and when they do it.
It is no secret that we live in a world of multi-screening - where we
consume information at the click of a button or the swipe of a
screen, wherever, whenever we want. According to a Roy Morgan
Single Source report in October 2014, multi-screening has increased
in popularity by 36% from three years earlier, for 18 to 49-year-olds.1
Various reports have identified two main types of screening -
sequential screening: where we move between devices, and
simultaneous screening, where we use multiple devices at once.
1 Roy Morgan Single Source, July 2010–June 2011 http://www.roymorgan.com/findings/ 5857-multi-screening-internet-with-television-on-the-rise-june-2014-201410072255
DID YOU
KNOW?DESKTOP COMPUTERS EXPERIENCE A SPIKE IN SEARCHES DURING THE WORKING DAY (9AM-4PM)

carsales Quarterly Insights Report - October 2015 13
Multi-screening is the new black - with usage across multiple mobile devices simultaneously a popular pastime for the average Australian household between
8-9pm nightly
14 carsales Quarterly Insights Report - October 2015
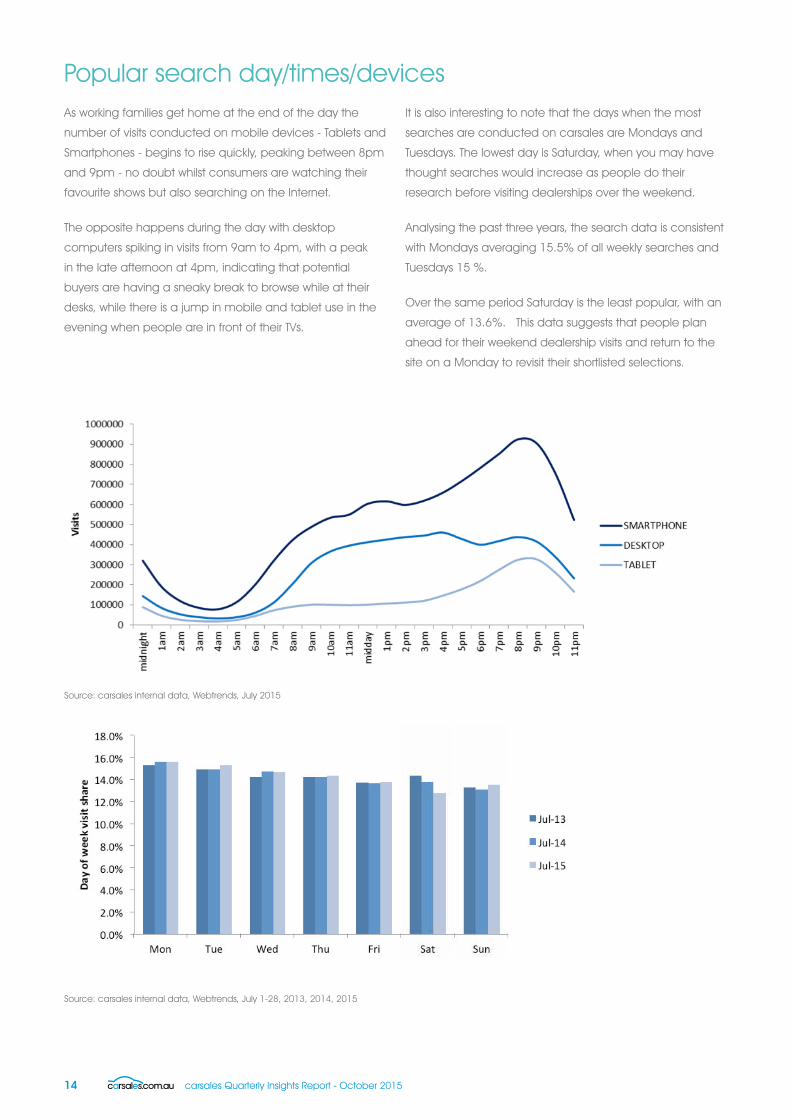
Popular search day/times/devicesAs working families get home at the end of the day the
number of visits conducted on mobile devices - Tablets and
Smartphones - begins to rise quickly, peaking between 8pm
and 9pm - no doubt whilst consumers are watching their
favourite shows but also searching on the Internet.
The opposite happens during the day with desktop
computers spiking in visits from 9am to 4pm, with a peak
in the late afternoon at 4pm, indicating that potential
buyers are having a sneaky break to browse while at their
desks, while there is a jump in mobile and tablet use in the
evening when people are in front of their TVs.
It is also interesting to note that the days when the most
searches are conducted on carsales are Mondays and
Tuesdays. The lowest day is Saturday, when you may have
thought searches would increase as people do their
research before visiting dealerships over the weekend.
Analysing the past three years, the search data is consistent
with Mondays averaging 15.5% of all weekly searches and
Tuesdays 15 %.
Over the same period Saturday is the least popular, with an
average of 13.6%. This data suggests that people plan
ahead for their weekend dealership visits and return to the
site on a Monday to revisit their shortlisted selections.
Source: carsales internal data, Webtrends, July 2015
Source: carsales internal data, Webtrends, July 1-28, 2013, 2014, 2015
carsales Quarterly Insights Report - October 2015 15
Shopping around: Territorians willing to travel the most for the cars they loveThere is no doubt that the Internet and the plethora of
personal electronic devices on the market have changed
purchasing behaviours. And whilst we may have thought
buying a car would not transcend state borders, carsales’
data show something a little different.
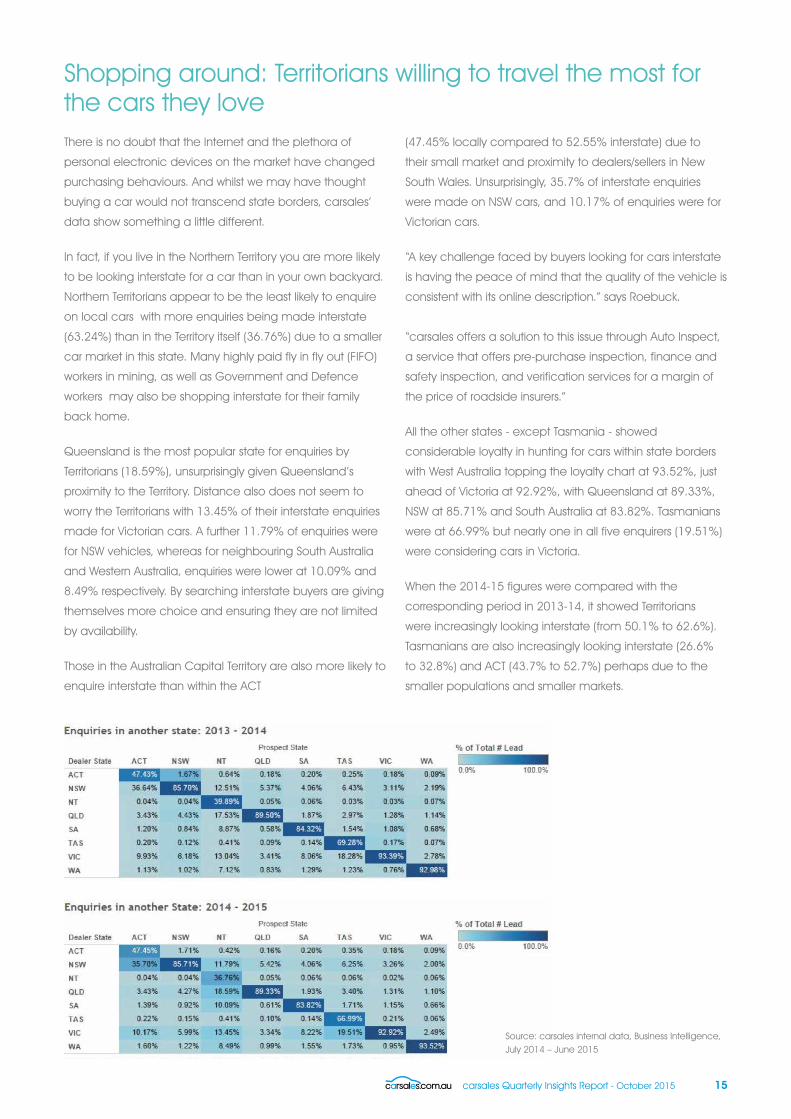
In fact, if you live in the Northern Territory you are more likely
to be looking interstate for a car than in your own backyard.
Northern Territorians appear to be the least likely to enquire
on local cars with more enquiries being made interstate
(63.24%) than in the Territory itself (36.76%) due to a smaller
car market in this state. Many highly paid fly in fly out (FIFO)
workers in mining, as well as Government and Defence
workers may also be shopping interstate for their family
back home.
Queensland is the most popular state for enquiries by
Territorians (18.59%), unsurprisingly given Queensland’s
proximity to the Territory. Distance also does not seem to
worry the Territorians with 13.45% of their interstate enquiries
made for Victorian cars. A further 11.79% of enquiries were
for NSW vehicles, whereas for neighbouring South Australia
and Western Australia, enquiries were lower at 10.09% and
8.49% respectively. By searching interstate buyers are giving
themselves more choice and ensuring they are not limited
by availability.
Those in the Australian Capital Territory are also more likely to
enquire interstate than within the ACT
(47.45% locally compared to 52.55% interstate) due to
their small market and proximity to dealers/sellers in New
South Wales. Unsurprisingly, 35.7% of interstate enquiries
were made on NSW cars, and 10.17% of enquiries were for
Victorian cars.
“A key challenge faced by buyers looking for cars interstate
is having the peace of mind that the quality of the vehicle is
consistent with its online description.” says Roebuck.
“carsales offers a solution to this issue through Auto Inspect,
a service that offers pre-purchase inspection, finance and
safety inspection, and verification services for a margin of
the price of roadside insurers.”
All the other states - except Tasmania - showed
considerable loyalty in hunting for cars within state borders
with West Australia topping the loyalty chart at 93.52%, just
ahead of Victoria at 92.92%, with Queensland at 89.33%,
NSW at 85.71% and South Australia at 83.82%. Tasmanians
were at 66.99% but nearly one in all five enquirers (19.51%)
were considering cars in Victoria.
When the 2014-15 figures were compared with the
corresponding period in 2013-14, it showed Territorians
were increasingly looking interstate (from 50.1% to 62.6%).
Tasmanians are also increasingly looking interstate (26.6%
to 32.8%) and ACT (43.7% to 52.7%) perhaps due to the
smaller populations and smaller markets.
Source: carsales internal data, Business Intelligence, July 2014 – June 2015

16 carsales Quarterly Insights Report - October 2015
carsales Quarterly Insights Report - October 2015 17
Top 10 cars across Australia(top 10 wealthiest/poorest suburbs national and at a state level)What cars are at the top of the list for Australia’s wealthiest and poorest
suburbs? Based on data from the Australian Taxation Office’s annual
Taxation Statistics report for 2012-131, we have analysed enquiries
in Australia’s top 10 wealthiest and bottom 10 poorest postcodes2
nationally, as well as by state, and this is what we found.
1 https://data.gov.au/dataset/taxation-statistics-2012-13/resource/146e28ca-8532-4ccd-b194-1b04a72c33da
2 ATO research
National statistics:Move over sports cars - amongst Australia’s top 10
wealthiest suburbs (by income), the VW Golf is the most
sought-after car with seven out of 10 top postcodes making
the most enquiries on this car. As the only small car to make
the list, Australians living in the top 10 wealthiest suburbs
then opt for a selection of European 4WDs - including the
Mercedes ML350, BMW X5, and Range Rover Sport.
Given the choice of car in these suburbs is either something
small and speedy, could it be that the proliferation of
vertical living in these wealthier, more centralised suburbs is
driving demand for smaller, zippier and in many respects,
cheaper cars in which to get around?
Interestingly, Dover Heights and Mosman are the sporty Golf
capitals of Australia, with enquiries on the turbocharged
GTI, GTI-Performance and R models leading the way in
these suburbs. Thirty-five per cent of VW Golf enquiries in
Dover Heights were for the GTI model, while the GTI made
up 22.5% of Golf enquiries in Mosman, and the R made up
13% of enquiries.
18 carsales Quarterly Insights Report - October 2015
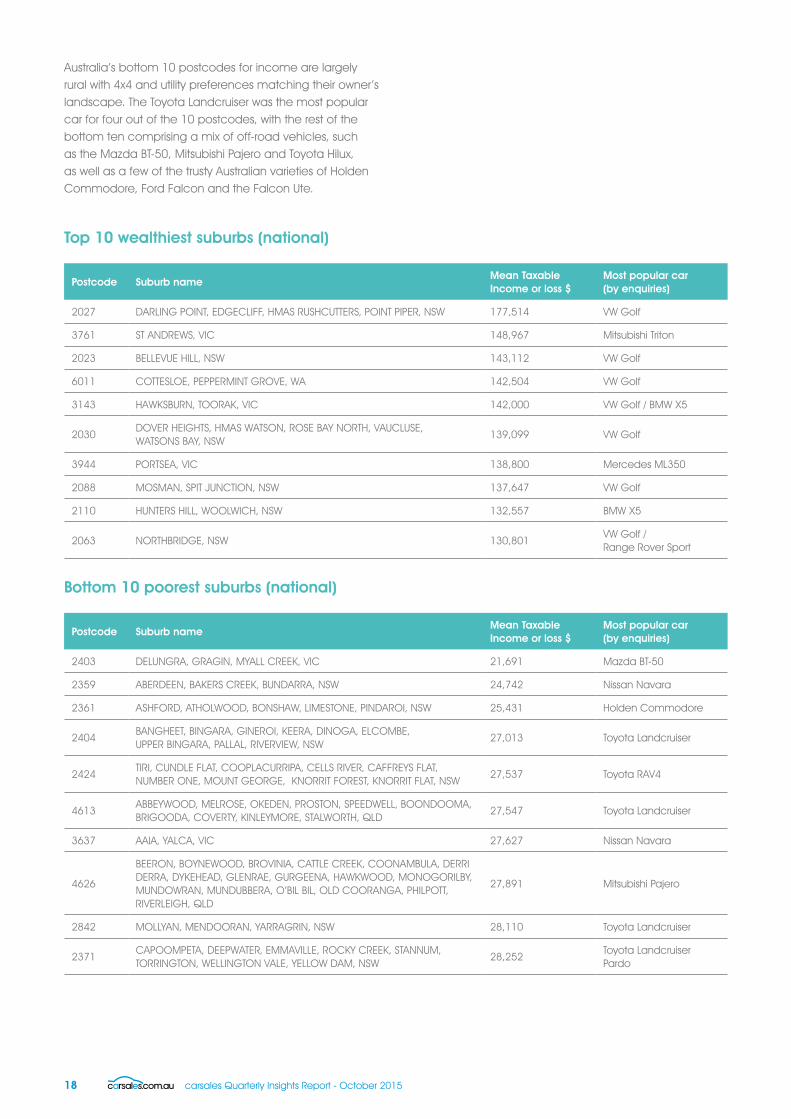
Australia’s bottom 10 postcodes for income are largely rural with 4x4 and utility preferences matching their owner’s landscape. The Toyota Landcruiser was the most popular car for four out of the 10 postcodes, with the rest of the bottom ten comprising a mix of off-road vehicles, such as the Mazda BT-50, Mitsubishi Pajero and Toyota Hilux, as well as a few of the trusty Australian varieties of Holden Commodore, Ford Falcon and the Falcon Ute.
Top 10 wealthiest suburbs (national)
Postcode Suburb nameMean Taxable Income or loss $
Most popular car (by enquiries)
2027 DARLING POINT, EDGECLIFF, HMAS RUSHCUTTERS, POINT PIPER, NSW 177,514 VW Golf
3761 ST ANDREWS, VIC 148,967 Mitsubishi Triton
2023 BELLEVUE HILL, NSW 143,112 VW Golf
6011 COTTESLOE, PEPPERMINT GROVE, WA 142,504 VW Golf
3143 HAWKSBURN, TOORAK, VIC 142,000 VW Golf / BMW X5
2030DOVER HEIGHTS, HMAS WATSON, ROSE BAY NORTH, VAUCLUSE, WATSONS BAY, NSW
139,099 VW Golf
3944 PORTSEA, VIC 138,800 Mercedes ML350
2088 MOSMAN, SPIT JUNCTION, NSW 137,647 VW Golf
2110 HUNTERS HILL, WOOLWICH, NSW 132,557 BMW X5
2063 NORTHBRIDGE, NSW 130,801VW Golf / Range Rover Sport
Bottom 10 poorest suburbs (national)
Postcode Suburb nameMean Taxable Income or loss $
Most popular car (by enquiries)
2403 DELUNGRA, GRAGIN, MYALL CREEK, VIC 21,691 Mazda BT-50
2359 ABERDEEN, BAKERS CREEK, BUNDARRA, NSW 24,742 Nissan Navara
2361 ASHFORD, ATHOLWOOD, BONSHAW, LIMESTONE, PINDAROI, NSW 25,431 Holden Commodore
2404BANGHEET, BINGARA, GINEROI, KEERA, DINOGA, ELCOMBE, UPPER BINGARA, PALLAL, RIVERVIEW, NSW
27,013 Toyota Landcruiser
2424TIRI, CUNDLE FLAT, COOPLACURRIPA, CELLS RIVER, CAFFREYS FLAT, NUMBER ONE, MOUNT GEORGE, KNORRIT FOREST, KNORRIT FLAT, NSW
27,537 Toyota RAV4
4613ABBEYWOOD, MELROSE, OKEDEN, PROSTON, SPEEDWELL, BOONDOOMA, BRIGOODA, COVERTY, KINLEYMORE, STALWORTH, QLD
27,547 Toyota Landcruiser
3637 AAIA, YALCA, VIC 27,627 Nissan Navara
4626
BEERON, BOYNEWOOD, BROVINIA, CATTLE CREEK, COONAMBULA, DERRI DERRA, DYKEHEAD, GLENRAE, GURGEENA, HAWKWOOD, MONOGORILBY, MUNDOWRAN, MUNDUBBERA, O’BIL BIL, OLD COORANGA, PHILPOTT, RIVERLEIGH, QLD
27,891 Mitsubishi Pajero
2842 MOLLYAN, MENDOORAN, YARRAGRIN, NSW 28,110 Toyota Landcruiser
2371CAPOOMPETA, DEEPWATER, EMMAVILLE, ROCKY CREEK, STANNUM, TORRINGTON, WELLINGTON VALE, YELLOW DAM, NSW
28,252Toyota Landcruiser Pardo
carsales Quarterly Insights Report - October 2015 19
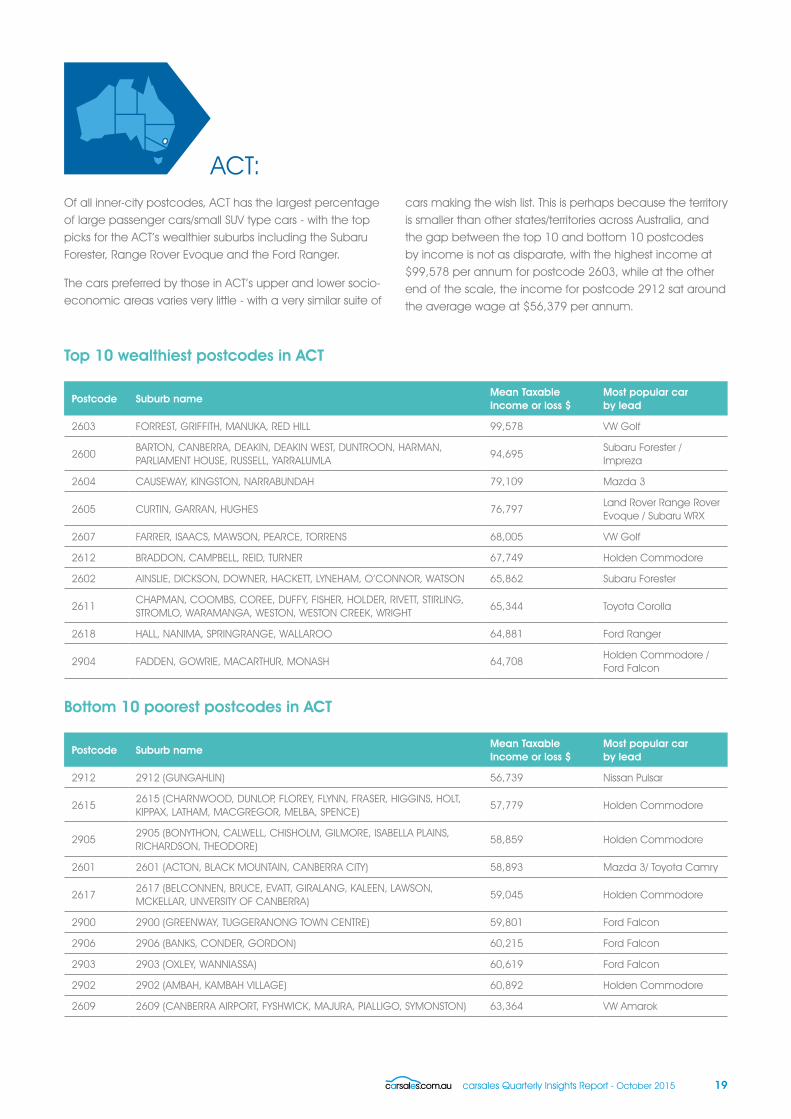
ACT:Of all inner-city postcodes, ACT has the largest percentage of large passenger cars/small SUV type cars - with the top picks for the ACT’s wealthier suburbs including the Subaru Forester, Range Rover Evoque and the Ford Ranger.
The cars preferred by those in ACT’s upper and lower socio-economic areas varies very little - with a very similar suite of
cars making the wish list. This is perhaps because the territory is smaller than other states/territories across Australia, and the gap between the top 10 and bottom 10 postcodes by income is not as disparate, with the highest income at $99,578 per annum for postcode 2603, while at the other end of the scale, the income for postcode 2912 sat around the average wage at $56,379 per annum.
Top 10 wealthiest postcodes in ACT
Postcode Suburb nameMean Taxable Income or loss $
Most popular car by lead
2603 FORREST, GRIFFITH, MANUKA, RED HILL 99,578 VW Golf
2600BARTON, CANBERRA, DEAKIN, DEAKIN WEST, DUNTROON, HARMAN, PARLIAMENT HOUSE, RUSSELL, YARRALUMLA
94,695Subaru Forester / Impreza
2604 CAUSEWAY, KINGSTON, NARRABUNDAH 79,109 Mazda 3
2605 CURTIN, GARRAN, HUGHES 76,797Land Rover Range Rover Evoque / Subaru WRX
2607 FARRER, ISAACS, MAWSON, PEARCE, TORRENS 68,005 VW Golf
2612 BRADDON, CAMPBELL, REID, TURNER 67,749 Holden Commodore
2602 AINSLIE, DICKSON, DOWNER, HACKETT, LYNEHAM, O’CONNOR, WATSON 65,862 Subaru Forester
2611CHAPMAN, COOMBS, COREE, DUFFY, FISHER, HOLDER, RIVETT, STIRLING, STROMLO, WARAMANGA, WESTON, WESTON CREEK, WRIGHT
65,344 Toyota Corolla
2618 HALL, NANIMA, SPRINGRANGE, WALLAROO 64,881 Ford Ranger
2904 FADDEN, GOWRIE, MACARTHUR, MONASH 64,708Holden Commodore / Ford Falcon
Bottom 10 poorest postcodes in ACT
Postcode Suburb nameMean Taxable Income or loss $
Most popular car by lead
2912 2912 (GUNGAHLIN) 56,739 Nissan Pulsar
26152615 (CHARNWOOD, DUNLOP, FLOREY, FLYNN, FRASER, HIGGINS, HOLT, KIPPAX, LATHAM, MACGREGOR, MELBA, SPENCE)
57,779 Holden Commodore
2905 2905 (BONYTHON, CALWELL, CHISHOLM, GILMORE, ISABELLA PLAINS, RICHARDSON, THEODORE)
58,859 Holden Commodore
2601 2601 (ACTON, BLACK MOUNTAIN, CANBERRA CITY) 58,893 Mazda 3/ Toyota Camry
2617 2617 (BELCONNEN, BRUCE, EVATT, GIRALANG, KALEEN, LAWSON, MCKELLAR, UNVERSITY OF CANBERRA)
59,045 Holden Commodore
2900 2900 (GREENWAY, TUGGERANONG TOWN CENTRE) 59,801 Ford Falcon
2906 2906 (BANKS, CONDER, GORDON) 60,215 Ford Falcon
2903 2903 (OXLEY, WANNIASSA) 60,619 Ford Falcon
2902 2902 (AMBAH, KAMBAH VILLAGE) 60,892 Holden Commodore
2609 2609 (CANBERRA AIRPORT, FYSHWICK, MAJURA, PIALLIGO, SYMONSTON) 63,364 VW Amarok

20 carsales Quarterly Insights Report - October 2015
NSW:The figures don’t lie - Sydney’s most popular car is the VW Golf, with eight out of 10 of the city’s wealthiest suburbs choosing VW Golf over any other passenger car. The runner up (BMW X5) was a distant second, favoured by two suburbs (one who also favoured the VW Golf) with the only other car to make the mix being the Range Rover Sport. Given the second most popular cars by a long way are luxury European SUVs, could this be an indication that mummy and daddy are more interested in purchasing small, safe
and reliable city cars for their children...or just that the status quo in Sydney’s inner suburbs is a smaller, zippier car to get people from A to B?
Ironically, whilst Sydney’s top 10 suburbs are all uniform with the cars they like - VW Golf - the bottom 10 suburbs have varied preferences but with a common thread of being working class/tradie cars, such as the Mazda BT-50, Toyota Landcruiser, Holden Commodore, and the Toyota RAV4.
Top 10 wealthiest postcodes NSW
Postcode Suburb nameMean Taxable Income or loss $
Most popular car by lead
2027 DARLING POINT, EDGECLIFF, HMAS RUSHCUTTERS, POINT PIPER 177,514 VW Golf
2023 BELLEVUE HILL 143,112 VW Golf
2030 DOVER HEIGHTS, HMAS WATSON, ROSE BAY NORTH, VAUCLUSE, WATSONS BAY
139,099 VW Golf
2088 MOSMAN, SPIT JUNCTION 137,647 VW Golf
2110 HUNTERS HILL, WOOLWICH 132,557 BMW X5
2063 NORTHBRIDGE 130,801 VW Golf / RR Sport
2025 WOOLLAHRA 126,411 VW Golf
2028 DOUBLE BAY 112,953 BMW X5
2061 MILSONS POINT, KIRRIBILLI 109,304 VW Golf
2041 BALMAIN, BIRCHGROVE, BALMAIN EAST 109,101 VW Golf
Bottom 10 poorest postcodes NSW
Postcode Suburb nameMean Taxable Income or loss $
Most popular car by lead
2403 DELUNGRA, GRAGIN, MYALL CREEK 21,691 Mazda BT-50
2359 ABERDEEN, BAKERS CREEK, BUNDARRA 24,742 Nissan Navara
2361 ASHFORD, ATHOLWOOD, BONSHAW, LIMESTONE, PINDAROI 25,431 Holden Commodore
2404 BANGHEET, BINGARA, GINEROI, KEERA, DINOGA, ELCOMBE, UPPER BINGARA, PALLAL, RIVERVIEW
27,013 Toyota Landcruiser
2424 TIRI, CUNDLE FLAT, COOPLACURRIPA, CELLS RIVER, CAFFREYS FLAT, NUMBER ONE, MOUNT GEORGE, KNORRIT FOREST, KNORRIT FLAT
27,537 Toyota RAV4
2842 MOLLYAN, MENDOORAN, YARRAGRIN 28,110 Toyota Landcruiser
2371 CAPOOMPETA, DEEPWATER, EMMAVILLE, ROCKY CREEK, STANNUM, TORRINGTON, WELLINGTON VALE, YELLOW DAM
28,252Toyota RAV4 / Toyota Landcruiser Prado
2347 OODSREEF, UPPER HORTON, THIRLDENE, RED HILL, MAYVALE, LONGARM, LINDESAY, IRONBARK, GUNDAMULDA, GULF CREEK, COBBADAH, BARRABA, BANOON
29,825 Isuzu D-Max
2876 GUNNINGBLAND, BOGAN GATE, NELUNGALOO 30,117 Kia Sorrento
2453
DUNDURRABIN, DORRIGO MOUNTAIN, FERNBROOK, EBOR, CLOUDS CREEK, CASCADE, DORRIGO, DEER VALE, BIELSDOWN HILLS, BOSTOBRICK, BILLYS CREEK, WILD CATTLE CREEK, NEVER NEVER, NORTH DORRIGO, TALLOWWOOD RIDGE, TYRINGHAM, HERNANI, MARENGO, MEGAN, MOONPAR
30,244Toyota Hilux / Toyota Landcruiser

carsales Quarterly Insights Report - October 2015 21
NT:Territorians love a Toyota - with eight out of 10 of the wealthiest suburbs up north opting for a mix of Landcruisers, Hilux, Corolla or Yaris’ - with the only other cars making the list being the Mazda BT-50 and Isuzu D-Max..
Again in NT’s less wealthy suburbs, Toyotas (particularly Landcruisers and Hilux) are favoured - with the Holden Commodore playing second fiddle in only two of the 10 locations.
Top 10 wealthiest postcodes NT
Postcode Suburb nameMean Taxable Income or loss $
Most popular car by enquiries
828 BERRIMAH, KNUCKEY LAGOON 121,138 Mazda BT-50
885 ALYANGULA 81,517 Toyota Landcruiser
820 BAGOT, BAYVIEW, COONAWARRA, EAST POINT, EATON, FANNIE BAY, LARRAKEYAH, LUDMILLA, PARAP, STUART PARK, THE GARDENS, THE NARROWS, WINNELLIE, WOOLNER
76,348 Toyota Hilux
880 GAPUWIYAK, GOVE, GUNYANGARA, NHULUNBUY, YIRRKALA 72,444 Toyota Landcruiser
804 PARAP 71,061 Toyota Corolla
811 CASUARINA 69,091 Toyota Yaris
821 WINNELLIE 68,814 Toyota Hiace
835 COOLALINGA, HOWARD SPRINGS, VIRGINIA 66,881 Toyota Landcruiser
801 DARWIN 66,771 Toyota Hilux
814 NIGHTCLIFF 64,960 Isuzu D-Max
Bottom 10 poorest postcodes NT
Postcode Suburb nameMean Taxable Income or loss $
Most popular car by enquiries
852
ARNOLD, BAINES, BARUNGA, BESWICK, BESWICK CREEK, BINJARI, BIRDUM, BRADSHAW, BUCHANAN, BULMAN WEEMOL, CRESWELL, DAGURAGU, DALY WATERS, DELAMERE, DUNMARRA, EDITH, ELSEY, ELSEY STATION, FLORINA, FLYING FOX, GREGORY, GULUNG , ARDRULK, GURINDJI, JILKMINGGAN, K
32,825 Toyota Landcruiser
872 ALI CURUNG, ALICE SPRINGS, AREYONGA, BARROW CREEK, ERNABELLA, FINKE, FREGON, HAASTS BLUFF, HERMANNSBURG, KALTUKATJARA, KINTORE, NYIRRIPI, PAPUNYA, SANTA TERESA, TI TREE, YUENDUMU, YULARA
37,617 Toyota Landcruiser
862
AVON DOWNS, CALVERT, CRESSWELL DOWNS, ELLIOTT, HELEN , PRINGS, MUCKATY STATION, NEWCASTLE WATERS, NICHOLSON, PAMAYU, PHILLIP CREEK STATION, RENNER SPRINGS, TABLELANDS, TENNANT CREEK, THREE WAYS, WARREGO, WOLLOGORANG STATION, WYCLIFFE WELL
39,310 Toyota Landcruiser
822
ANGURUGU, ACACIA HILLS, BEES CREEK, BATHURST ISLAND, ANNIE RIVER, ANINDILYAKWA, BURRUNDIE, BLACKMORE, BLACK JUNGLE, BELYUEN, CHANNEL ISLAND, CAMP CREEK, BYNOE HARBOUR, BYNOE, COLLETT CREEK, COOMALIE CREEK, COX PENINSULA, DALY, CHARLES DARWIN, CHARLOTTE
42,202 Toyota Hilux
861 TENNANT CREEK 45,338Toyota Landcruiser Prado
845 BATCHELOR 45,988 Toyota Landcruiser
854 BORROLOOLA 47,397 Holden Commodore
860 TENNANT CREEK 54,311 Holden Commodore
850 LANSDOWNE, KATHERINE SOUTH, EMUNGALAN, COSSACK, KATHERINE EAST, KATHERINE
54,373Toyota Landcruiser Prado
851 KATHERINE 54,598 Toyota Landcruiser
22 carsales Quarterly Insights Report - October 2015
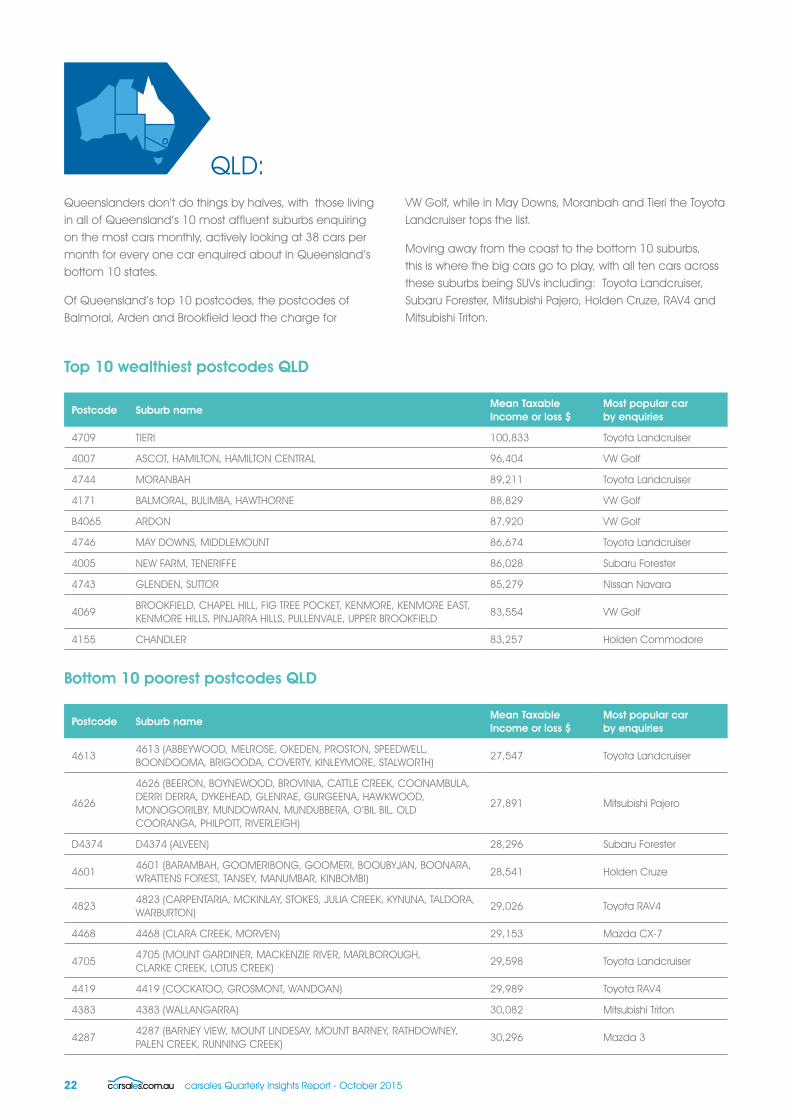
QLD:Queenslanders don’t do things by halves, with those living in all of Queensland’s 10 most affluent suburbs enquiring on the most cars monthly, actively looking at 38 cars per month for every one car enquired about in Queensland’s bottom 10 states.
Of Queensland’s top 10 postcodes, the postcodes of Balmoral, Arden and Brookfield lead the charge for
VW Golf, while in May Downs, Moranbah and Tieri the Toyota Landcruiser tops the list.
Moving away from the coast to the bottom 10 suburbs, this is where the big cars go to play, with all ten cars across these suburbs being SUVs including: Toyota Landcruiser, Subaru Forester, Mitsubishi Pajero, Holden Cruze, RAV4 and Mitsubishi Triton.
Top 10 wealthiest postcodes QLD
Postcode Suburb nameMean Taxable Income or loss $
Most popular car by enquiries
4709 TIERI 100,833 Toyota Landcruiser
4007 ASCOT, HAMILTON, HAMILTON CENTRAL 96,404 VW Golf
4744 MORANBAH 89,211 Toyota Landcruiser
4171 BALMORAL, BULIMBA, HAWTHORNE 88,829 VW Golf
B4065 ARDON 87,920 VW Golf
4746 MAY DOWNS, MIDDLEMOUNT 86,674 Toyota Landcruiser
4005 NEW FARM, TENERIFFE 86,028 Subaru Forester
4743 GLENDEN, SUTTOR 85,279 Nissan Navara
4069 BROOKFIELD, CHAPEL HILL, FIG TREE POCKET, KENMORE, KENMORE EAST, KENMORE HILLS, PINJARRA HILLS, PULLENVALE, UPPER BROOKFIELD
83,554 VW Golf
4155 CHANDLER 83,257 Holden Commodore
Bottom 10 poorest postcodes QLD
Postcode Suburb nameMean Taxable Income or loss $
Most popular car by enquiries
46134613 (ABBEYWOOD, MELROSE, OKEDEN, PROSTON, SPEEDWELL, BOONDOOMA, BRIGOODA, COVERTY, KINLEYMORE, STALWORTH)
27,547 Toyota Landcruiser
4626
4626 (BEERON, BOYNEWOOD, BROVINIA, CATTLE CREEK, COONAMBULA, DERRI DERRA, DYKEHEAD, GLENRAE, GURGEENA, HAWKWOOD, MONOGORILBY, MUNDOWRAN, MUNDUBBERA, O’BIL BIL, OLD COORANGA, PHILPOTT, RIVERLEIGH)
27,891 Mitsubishi Pajero
D4374 D4374 (ALVEEN) 28,296 Subaru Forester
4601 4601 (BARAMBAH, GOOMERIBONG, GOOMERI, BOOUBYJAN, BOONARA, WRATTENS FOREST, TANSEY, MANUMBAR, KINBOMBI)
28,541 Holden Cruze
4823 4823 (CARPENTARIA, MCKINLAY, STOKES, JULIA CREEK, KYNUNA, TALDORA, WARBURTON)
29,026 Toyota RAV4
4468 4468 (CLARA CREEK, MORVEN) 29,153 Mazda CX-7
4705 4705 (MOUNT GARDINER, MACKENZIE RIVER, MARLBOROUGH, CLARKE CREEK, LOTUS CREEK)
29,598 Toyota Landcruiser
4419 4419 (COCKATOO, GROSMONT, WANDOAN) 29,989 Toyota RAV4
4383 4383 (WALLANGARRA) 30,082 Mitsubishi Triton
4287 4287 (BARNEY VIEW, MOUNT LINDESAY, MOUNT BARNEY, RATHDOWNEY, PALEN CREEK, RUNNING CREEK)
30,296 Mazda 3
carsales Quarterly Insights Report - October 2015 23
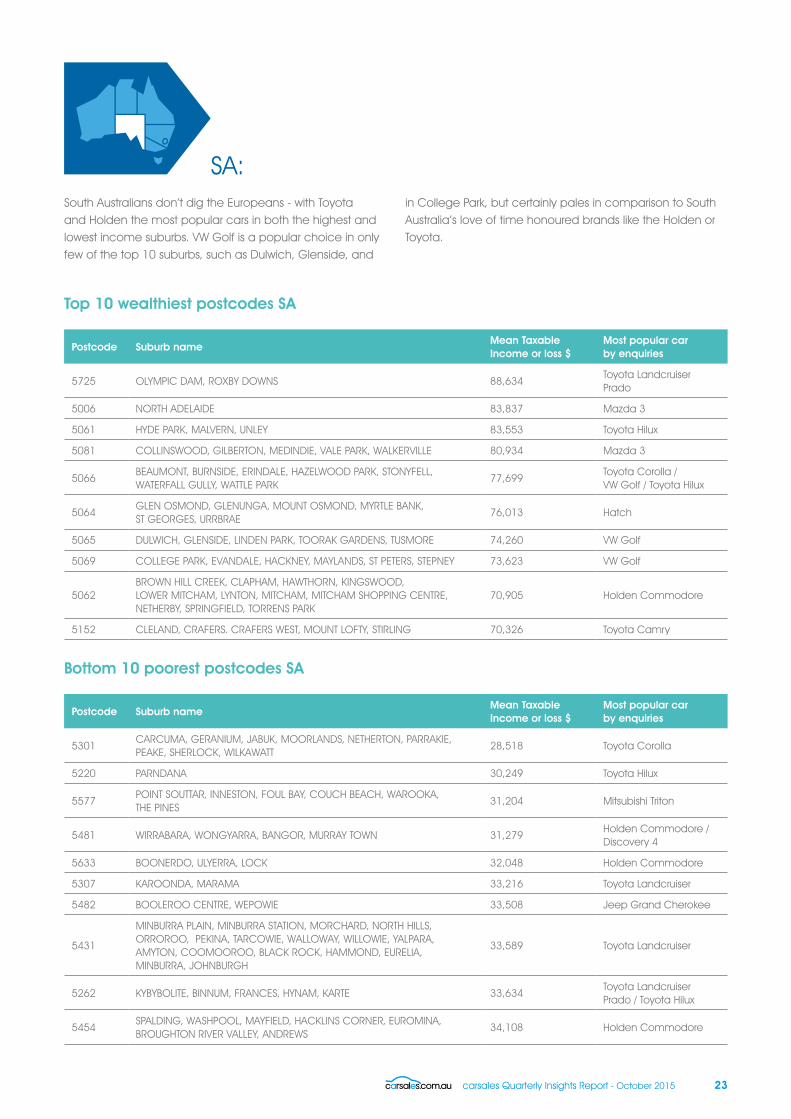
SA:South Australians don’t dig the Europeans - with Toyota and Holden the most popular cars in both the highest and lowest income suburbs. VW Golf is a popular choice in only few of the top 10 suburbs, such as Dulwich, Glenside, and
in College Park, but certainly pales in comparison to South Australia’s love of time honoured brands like the Holden or Toyota.
Top 10 wealthiest postcodes SA
Postcode Suburb nameMean Taxable Income or loss $
Most popular car by enquiries
5725 OLYMPIC DAM, ROXBY DOWNS 88,634Toyota Landcruiser Prado
5006 NORTH ADELAIDE 83,837 Mazda 3
5061 HYDE PARK, MALVERN, UNLEY 83,553 Toyota Hilux
5081 COLLINSWOOD, GILBERTON, MEDINDIE, VALE PARK, WALKERVILLE 80,934 Mazda 3
5066 BEAUMONT, BURNSIDE, ERINDALE, HAZELWOOD PARK, STONYFELL, WATERFALL GULLY, WATTLE PARK
77,699Toyota Corolla / VW Golf / Toyota Hilux
5064 GLEN OSMOND, GLENUNGA, MOUNT OSMOND, MYRTLE BANK, ST GEORGES, URRBRAE
76,013 Hatch
5065 DULWICH, GLENSIDE, LINDEN PARK, TOORAK GARDENS, TUSMORE 74,260 VW Golf
5069 COLLEGE PARK, EVANDALE, HACKNEY, MAYLANDS, ST PETERS, STEPNEY 73,623 VW Golf
5062 BROWN HILL CREEK, CLAPHAM, HAWTHORN, KINGSWOOD, LOWER MITCHAM, LYNTON, MITCHAM, MITCHAM SHOPPING CENTRE, NETHERBY, SPRINGFIELD, TORRENS PARK
70,905 Holden Commodore
5152 CLELAND, CRAFERS. CRAFERS WEST, MOUNT LOFTY, STIRLING 70,326 Toyota Camry
Bottom 10 poorest postcodes SA
Postcode Suburb nameMean Taxable Income or loss $
Most popular car by enquiries
5301 CARCUMA, GERANIUM, JABUK, MOORLANDS, NETHERTON, PARRAKIE, PEAKE, SHERLOCK, WILKAWATT
28,518 Toyota Corolla
5220 PARNDANA 30,249 Toyota Hilux
5577 POINT SOUTTAR, INNESTON, FOUL BAY, COUCH BEACH, WAROOKA, THE PINES
31,204 Mitsubishi Triton
5481 WIRRABARA, WONGYARRA, BANGOR, MURRAY TOWN 31,279Holden Commodore / Discovery 4
5633 BOONERDO, ULYERRA, LOCK 32,048 Holden Commodore
5307 KAROONDA, MARAMA 33,216 Toyota Landcruiser
5482 BOOLEROO CENTRE, WEPOWIE 33,508 Jeep Grand Cherokee
5431
MINBURRA PLAIN, MINBURRA STATION, MORCHARD, NORTH HILLS, ORROROO, PEKINA, TARCOWIE, WALLOWAY, WILLOWIE, YALPARA, AMYTON, COOMOOROO, BLACK ROCK, HAMMOND, EURELIA, MINBURRA, JOHNBURGH
33,589 Toyota Landcruiser
5262 KYBYBOLITE, BINNUM, FRANCES, HYNAM, KARTE 33,634Toyota Landcruiser Prado / Toyota Hilux
5454 SPALDING, WASHPOOL, MAYFIELD, HACKLINS CORNER, EUROMINA, BROUGHTON RIVER VALLEY, ANDREWS
34,108 Holden Commodore
24 carsales Quarterly Insights Report - October 2015
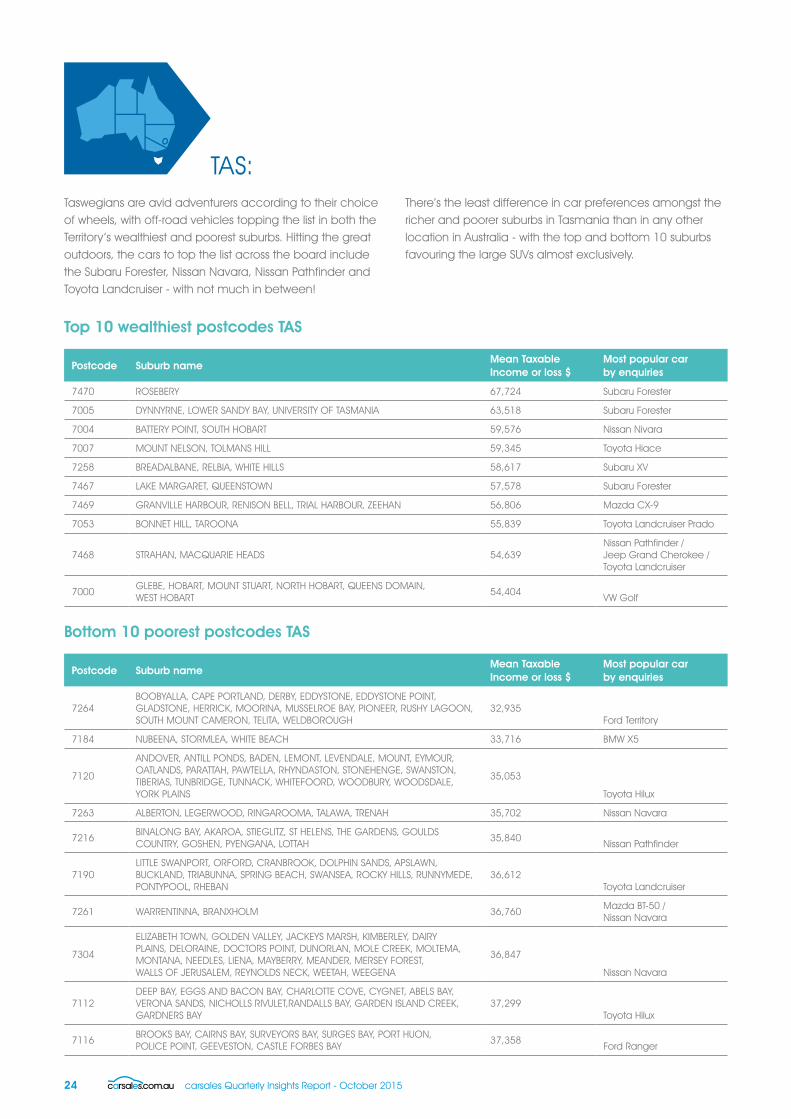
TAS:Taswegians are avid adventurers according to their choice of wheels, with off-road vehicles topping the list in both the Territory’s wealthiest and poorest suburbs. Hitting the great outdoors, the cars to top the list across the board include the Subaru Forester, Nissan Navara, Nissan Pathfinder and Toyota Landcruiser - with not much in between!
There’s the least difference in car preferences amongst the richer and poorer suburbs in Tasmania than in any other location in Australia - with the top and bottom 10 suburbs favouring the large SUVs almost exclusively.
Top 10 wealthiest postcodes TAS
Postcode Suburb nameMean Taxable Income or loss $
Most popular car by enquiries
7470 ROSEBERY 67,724 Subaru Forester
7005 DYNNYRNE, LOWER SANDY BAY, UNIVERSITY OF TASMANIA 63,518 Subaru Forester
7004 BATTERY POINT, SOUTH HOBART 59,576 Nissan Nivara
7007 MOUNT NELSON, TOLMANS HILL 59,345 Toyota Hiace
7258 BREADALBANE, RELBIA, WHITE HILLS 58,617 Subaru XV
7467 LAKE MARGARET, QUEENSTOWN 57,578 Subaru Forester
7469 GRANVILLE HARBOUR, RENISON BELL, TRIAL HARBOUR, ZEEHAN 56,806 Mazda CX-9
7053 BONNET HILL, TAROONA 55,839 Toyota Landcruiser Prado
7468 STRAHAN, MACQUARIE HEADS 54,639Nissan Pathfinder / Jeep Grand Cherokee / Toyota Landcruiser
7000GLEBE, HOBART, MOUNT STUART, NORTH HOBART, QUEENS DOMAIN, WEST HOBART
54,404VW Golf
Bottom 10 poorest postcodes TAS
Postcode Suburb nameMean Taxable Income or loss $
Most popular car by enquiries
7264BOOBYALLA, CAPE PORTLAND, DERBY, EDDYSTONE, EDDYSTONE POINT, GLADSTONE, HERRICK, MOORINA, MUSSELROE BAY, PIONEER, RUSHY LAGOON, SOUTH MOUNT CAMERON, TELITA, WELDBOROUGH
32,935Ford Territory
7184 NUBEENA, STORMLEA, WHITE BEACH 33,716 BMW X5
7120
ANDOVER, ANTILL PONDS, BADEN, LEMONT, LEVENDALE, MOUNT, EYMOUR, OATLANDS, PARATTAH, PAWTELLA, RHYNDASTON, STONEHENGE, SWANSTON, TIBERIAS, TUNBRIDGE, TUNNACK, WHITEFOORD, WOODBURY, WOODSDALE, YORK PLAINS
35,053
Toyota Hilux
7263 ALBERTON, LEGERWOOD, RINGAROOMA, TALAWA, TRENAH 35,702 Nissan Navara
7216BINALONG BAY, AKAROA, STIEGLITZ, ST HELENS, THE GARDENS, GOULDS COUNTRY, GOSHEN, PYENGANA, LOTTAH
35,840Nissan Pathfinder
7190LITTLE SWANPORT, ORFORD, CRANBROOK, DOLPHIN SANDS, APSLAWN, BUCKLAND, TRIABUNNA, SPRING BEACH, SWANSEA, ROCKY HILLS, RUNNYMEDE, PONTYPOOL, RHEBAN
36,612Toyota Landcruiser
7261 WARRENTINNA, BRANXHOLM 36,760Mazda BT-50 / Nissan Navara
7304
ELIZABETH TOWN, GOLDEN VALLEY, JACKEYS MARSH, KIMBERLEY, DAIRY PLAINS, DELORAINE, DOCTORS POINT, DUNORLAN, MOLE CREEK, MOLTEMA, MONTANA, NEEDLES, LIENA, MAYBERRY, MEANDER, MERSEY FOREST, WALLS OF JERUSALEM, REYNOLDS NECK, WEETAH, WEEGENA
36,847
Nissan Navara
7112DEEP BAY, EGGS AND BACON BAY, CHARLOTTE COVE, CYGNET, ABELS BAY, VERONA SANDS, NICHOLLS RIVULET,RANDALLS BAY, GARDEN ISLAND CREEK, GARDNERS BAY
37,299Toyota Hilux
7116BROOKS BAY, CAIRNS BAY, SURVEYORS BAY, SURGES BAY, PORT HUON, POLICE POINT, GEEVESTON, CASTLE FORBES BAY
37,358Ford Ranger
carsales Quarterly Insights Report - October 2015 25
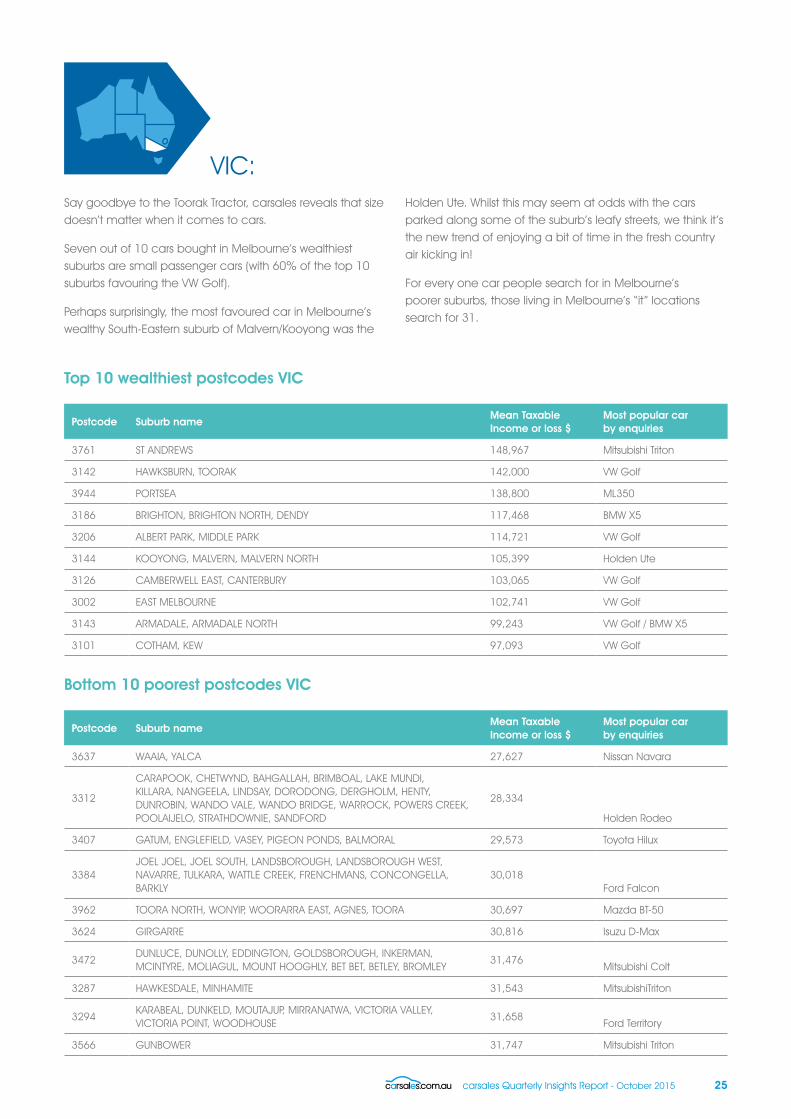
VIC:Say goodbye to the Toorak Tractor, carsales reveals that size doesn’t matter when it comes to cars.
Seven out of 10 cars bought in Melbourne’s wealthiest suburbs are small passenger cars (with 60% of the top 10 suburbs favouring the VW Golf).
Perhaps surprisingly, the most favoured car in Melbourne’s wealthy South-Eastern suburb of Malvern/Kooyong was the
Holden Ute. Whilst this may seem at odds with the cars parked along some of the suburb’s leafy streets, we think it’s the new trend of enjoying a bit of time in the fresh country air kicking in!
For every one car people search for in Melbourne’s poorer suburbs, those living in Melbourne’s “it” locations search for 31.
Top 10 wealthiest postcodes VIC
Postcode Suburb nameMean Taxable Income or loss $
Most popular car by enquiries
3761 ST ANDREWS 148,967 Mitsubishi Triton
3142 HAWKSBURN, TOORAK 142,000 VW Golf
3944 PORTSEA 138,800 ML350
3186 BRIGHTON, BRIGHTON NORTH, DENDY 117,468 BMW X5
3206 ALBERT PARK, MIDDLE PARK 114,721 VW Golf
3144 KOOYONG, MALVERN, MALVERN NORTH 105,399 Holden Ute
3126 CAMBERWELL EAST, CANTERBURY 103,065 VW Golf
3002 EAST MELBOURNE 102,741 VW Golf
3143 ARMADALE, ARMADALE NORTH 99,243 VW Golf / BMW X5
3101 COTHAM, KEW 97,093 VW Golf
Bottom 10 poorest postcodes VIC
Postcode Suburb nameMean Taxable Income or loss $
Most popular car by enquiries
3637 WAAIA, YALCA 27,627 Nissan Navara
3312
CARAPOOK, CHETWYND, BAHGALLAH, BRIMBOAL, LAKE MUNDI, KILLARA, NANGEELA, LINDSAY, DORODONG, DERGHOLM, HENTY, DUNROBIN, WANDO VALE, WANDO BRIDGE, WARROCK, POWERS CREEK, POOLAIJELO, STRATHDOWNIE, SANDFORD
28,334
Holden Rodeo
3407 GATUM, ENGLEFIELD, VASEY, PIGEON PONDS, BALMORAL 29,573 Toyota Hilux
3384JOEL JOEL, JOEL SOUTH, LANDSBOROUGH, LANDSBOROUGH WEST, NAVARRE, TULKARA, WATTLE CREEK, FRENCHMANS, CONCONGELLA, BARKLY
30,018Ford Falcon
3962 TOORA NORTH, WONYIP, WOORARRA EAST, AGNES, TOORA 30,697 Mazda BT-50
3624 GIRGARRE 30,816 Isuzu D-Max
3472DUNLUCE, DUNOLLY, EDDINGTON, GOLDSBOROUGH, INKERMAN, MCINTYRE, MOLIAGUL, MOUNT HOOGHLY, BET BET, BETLEY, BROMLEY
31,476Mitsubishi Colt
3287 HAWKESDALE, MINHAMITE 31,543 MitsubishiTriton
3294KARABEAL, DUNKELD, MOUTAJUP, MIRRANATWA, VICTORIA VALLEY, VICTORIA POINT, WOODHOUSE
31,658Ford Territory
3566 GUNBOWER 31,747 Mitsubishi Triton
26 carsales Quarterly Insights Report - October 2015
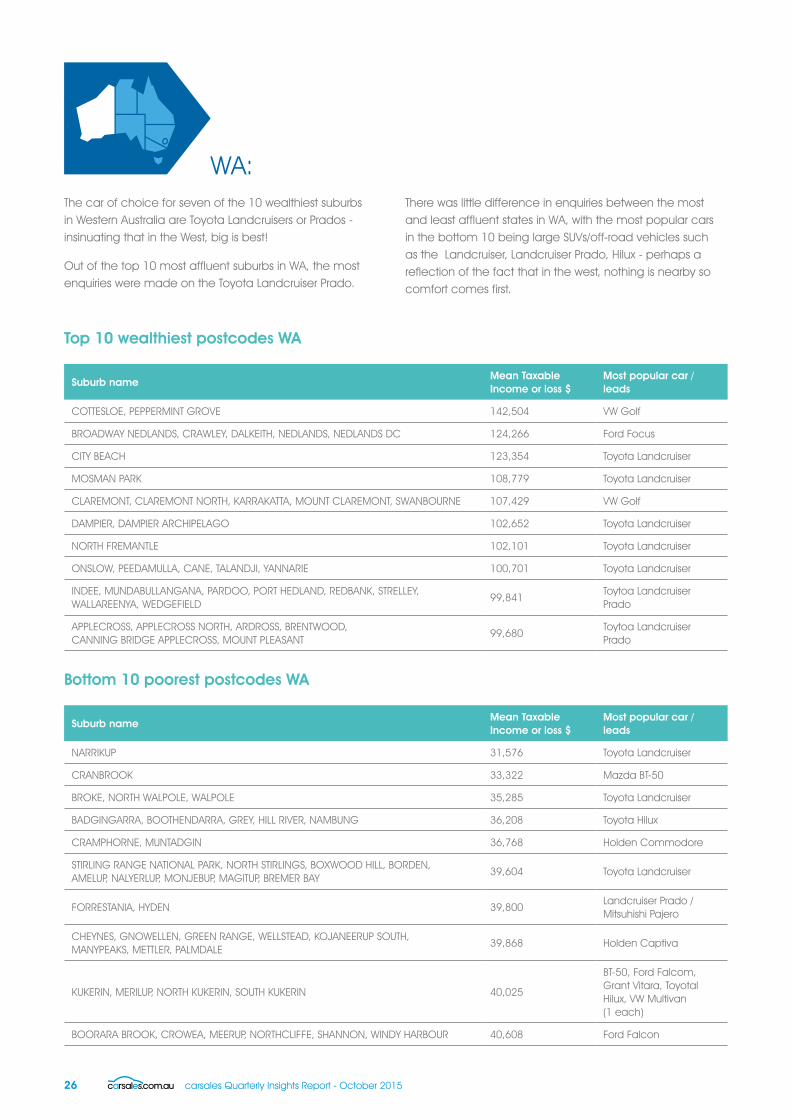
WA:The car of choice for seven of the 10 wealthiest suburbs in Western Australia are Toyota Landcruisers or Prados - insinuating that in the West, big is best!
Out of the top 10 most affluent suburbs in WA, the most enquiries were made on the Toyota Landcruiser Prado.
There was little difference in enquiries between the most and least affluent states in WA, with the most popular cars in the bottom 10 being large SUVs/off-road vehicles such as the Landcruiser, Landcruiser Prado, Hilux - perhaps a reflection of the fact that in the west, nothing is nearby so comfort comes first.
Top 10 wealthiest postcodes WA
Suburb nameMean Taxable Income or loss $
Most popular car / leads
COTTESLOE, PEPPERMINT GROVE 142,504 VW Golf
BROADWAY NEDLANDS, CRAWLEY, DALKEITH, NEDLANDS, NEDLANDS DC 124,266 Ford Focus
CITY BEACH 123,354 Toyota Landcruiser
MOSMAN PARK 108,779 Toyota Landcruiser
CLAREMONT, CLAREMONT NORTH, KARRAKATTA, MOUNT CLAREMONT, SWANBOURNE 107,429 VW Golf
DAMPIER, DAMPIER ARCHIPELAGO 102,652 Toyota Landcruiser
NORTH FREMANTLE 102,101 Toyota Landcruiser
ONSLOW, PEEDAMULLA, CANE, TALANDJI, YANNARIE 100,701 Toyota Landcruiser
INDEE, MUNDABULLANGANA, PARDOO, PORT HEDLAND, REDBANK, STRELLEY, WALLAREENYA, WEDGEFIELD
99,841Toytoa Landcruiser Prado
APPLECROSS, APPLECROSS NORTH, ARDROSS, BRENTWOOD, CANNING BRIDGE APPLECROSS, MOUNT PLEASANT
99,680Toytoa Landcruiser Prado
Bottom 10 poorest postcodes WA
Suburb nameMean Taxable Income or loss $
Most popular car / leads
NARRIKUP 31,576 Toyota Landcruiser
CRANBROOK 33,322 Mazda BT-50
BROKE, NORTH WALPOLE, WALPOLE 35,285 Toyota Landcruiser
BADGINGARRA, BOOTHENDARRA, GREY, HILL RIVER, NAMBUNG 36,208 Toyota Hilux
CRAMPHORNE, MUNTADGIN 36,768 Holden Commodore
STIRLING RANGE NATIONAL PARK, NORTH STIRLINGS, BOXWOOD HILL, BORDEN, AMELUP, NALYERLUP, MONJEBUP, MAGITUP, BREMER BAY
39,604 Toyota Landcruiser
FORRESTANIA, HYDEN 39,800Landcruiser Prado / Mitsuhishi Pajero
CHEYNES, GNOWELLEN, GREEN RANGE, WELLSTEAD, KOJANEERUP SOUTH, MANYPEAKS, METTLER, PALMDALE
39,868 Holden Captiva
KUKERIN, MERILUP, NORTH KUKERIN, SOUTH KUKERIN 40,025
BT-50, Ford Falcom, Grant Vitara, Toyotal Hilux, VW Multivan (1 each)
BOORARA BROOK, CROWEA, MEERUP, NORTHCLIFFE, SHANNON, WINDY HARBOUR 40,608 Ford Falcon

carsales Quarterly Insights Report - October 2015 27

28 carsales Quarterly Insights Report - October 2015
carsales Quarterly Insights Report - October 2015 29
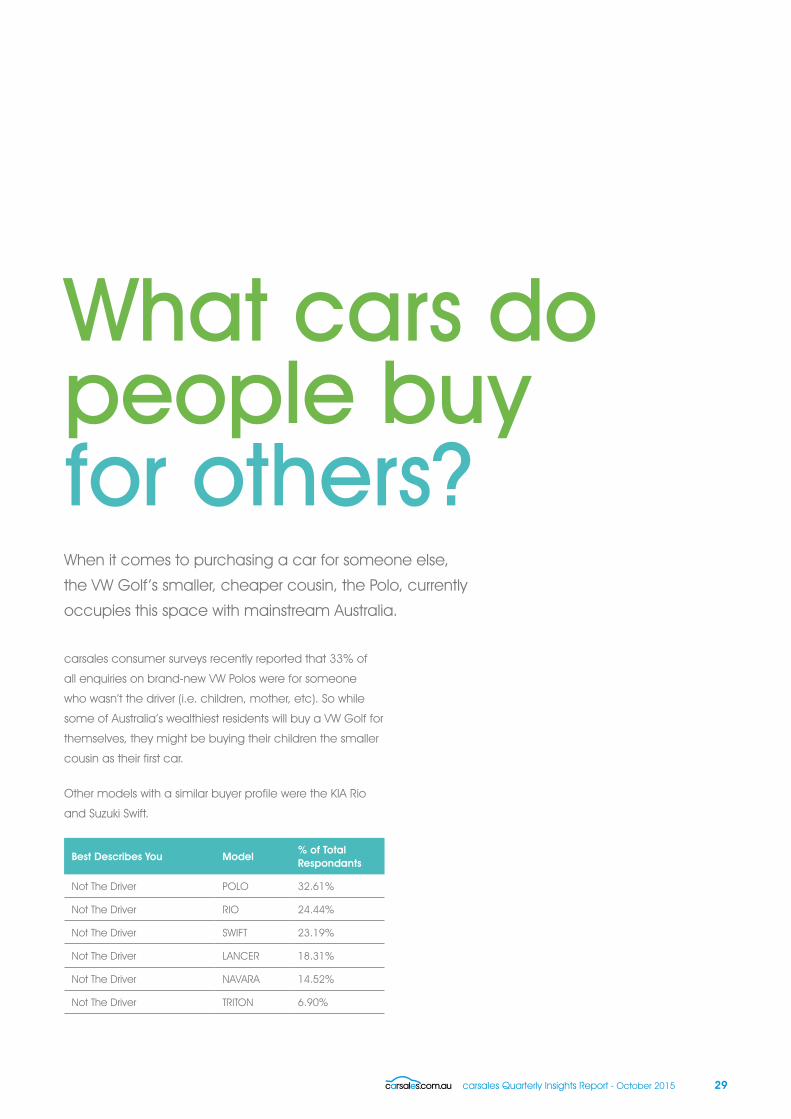
What cars do people buy for others? When it comes to purchasing a car for someone else,
the VW Golf’s smaller, cheaper cousin, the Polo, currently
occupies this space with mainstream Australia.
carsales consumer surveys recently reported that 33% of
all enquiries on brand-new VW Polos were for someone
who wasn’t the driver (i.e. children, mother, etc). So while
some of Australia’s wealthiest residents will buy a VW Golf for
themselves, they might be buying their children the smaller
cousin as their first car.
Other models with a similar buyer profile were the KIA Rio
and Suzuki Swift.
Best Describes You Model% of Total Respondants
Not The Driver POLO 32.61%
Not The Driver RIO 24.44%
Not The Driver SWIFT 23.19%
Not The Driver LANCER 18.31%
Not The Driver NAVARA 14.52%
Not The Driver TRITON 6.90%
30 carsales Quarterly Insights Report - October 2015
The two colours may not be everyone’s cup of tea but
considering the average time to sell a car is 35 days, it may
be worth taking these colours into account when buying
a car.
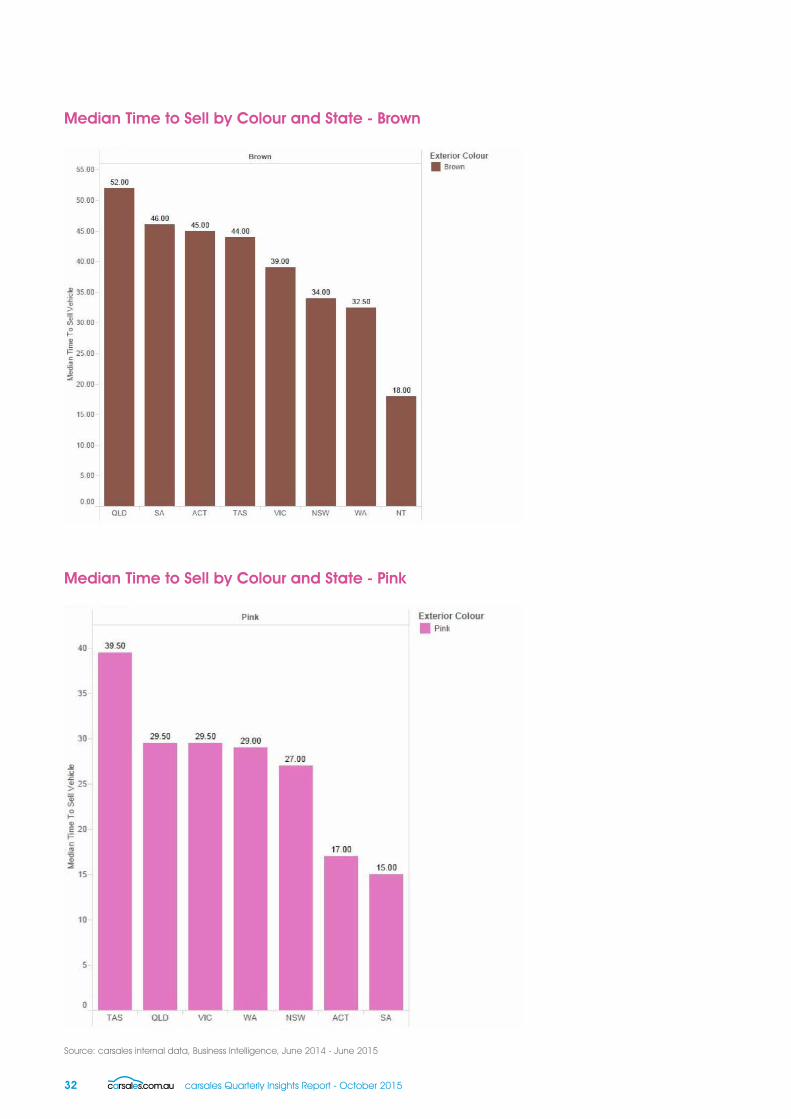
Brown coloured cars perform well across all states. As
mentioned, brown cars take just 18 days to sell via carsales
in the NT against an average of 38.81 days to sell a car,
32.5 days in the ACT and in SA they will take an average
27 days compared to the state average of 45 days.
Of course, you could also go for pink which sells quicker
across the country than virtually any other colour. In
flamboyant NSW it takes just 27 days to sell, 29 days in WA
and 29.5 days in both Queensland and Victoria.
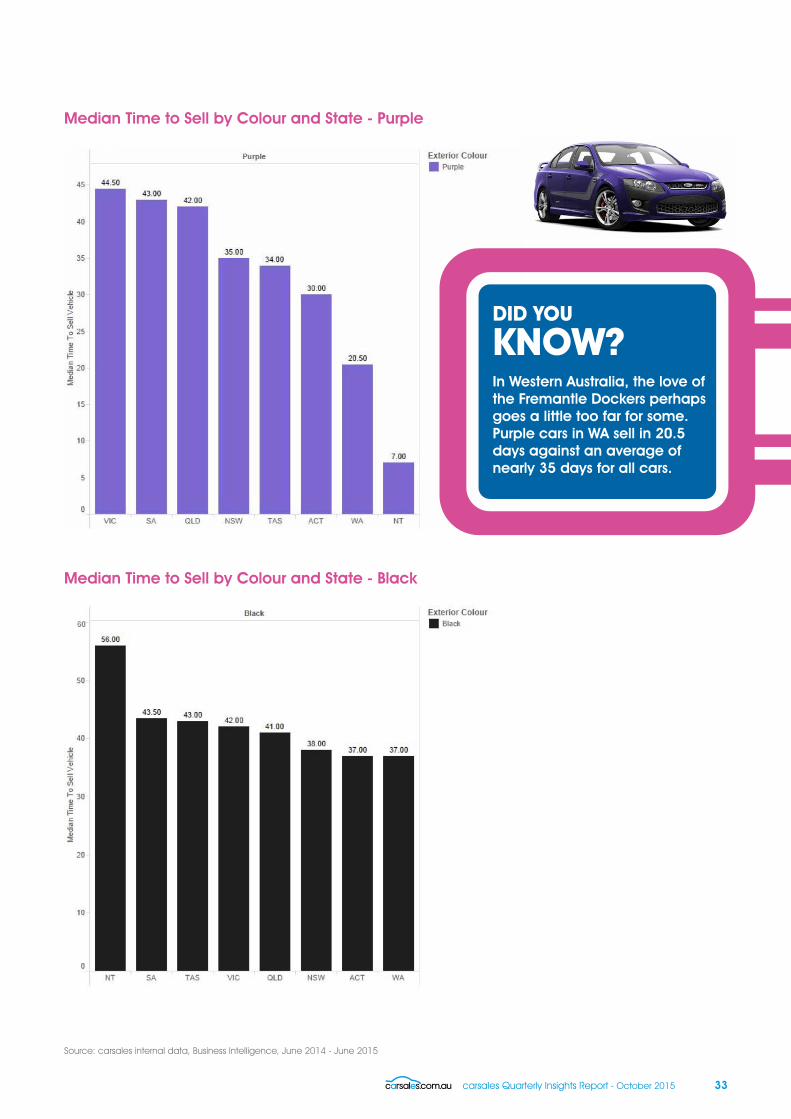
In Western Australia, the love of the Fremantle Dockers
perhaps goes a little too far for some. Purple cars in WA
sell in 20.5 days against an average of nearly 32days for
all cars.
In Victoria we know they love black (when it comes to
fashion anyway) but when it comes to black cars, they
take 42 days to sell in Victoria which only pips the national
average at the post by half a day - with black running off
the shelves at 42.19 days on average across the country.
An explanation could be that whilst black is a very popular
colour for Melbourne fashionistas, when it comes to cars
there are enough on the market for everyone, so getting in
first is not a concern.
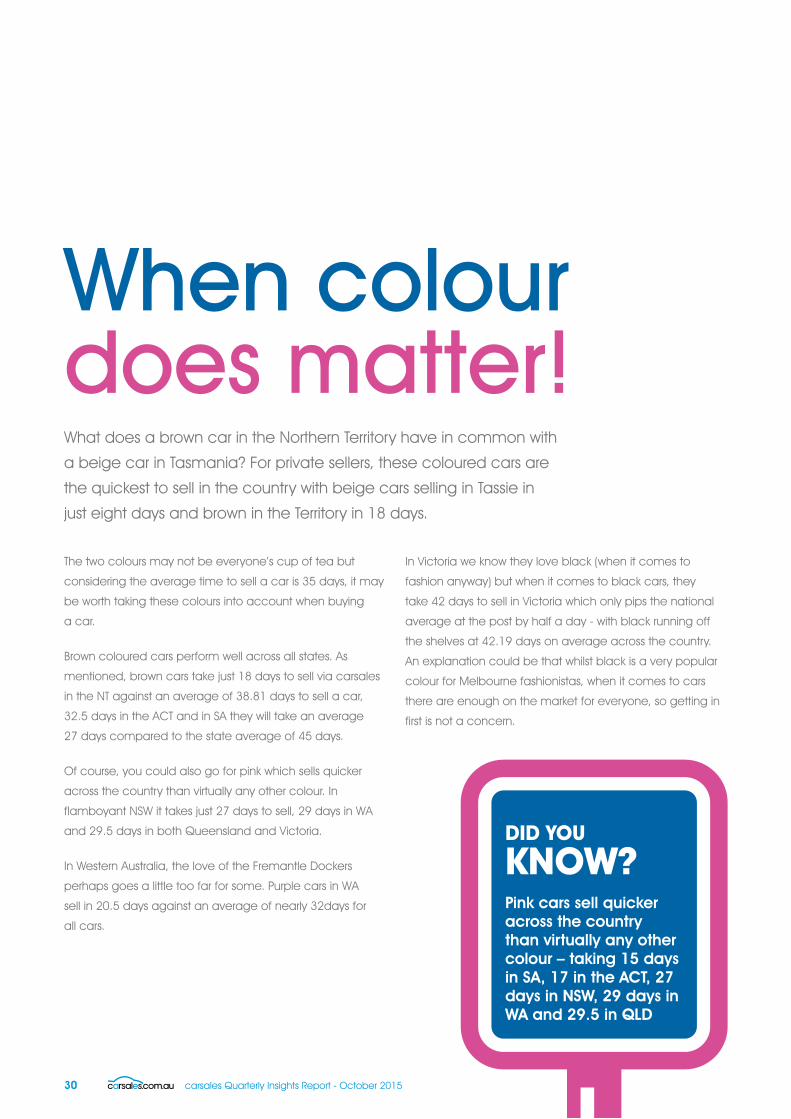
When colour does matter!What does a brown car in the Northern Territory have in common with
a beige car in Tasmania? For private sellers, these coloured cars are
the quickest to sell in the country with beige cars selling in Tassie in
just eight days and brown in the Territory in 18 days.
DID YOU
KNOW?Pink cars sell quicker across the country than virtually any other colour – taking 15 days in SA, 17 in the ACT, 27 days in NSW, 29 days in WA and 29.5 in QLD

carsales Quarterly Insights Report - October 2015 31
32 carsales Quarterly Insights Report - October 2015
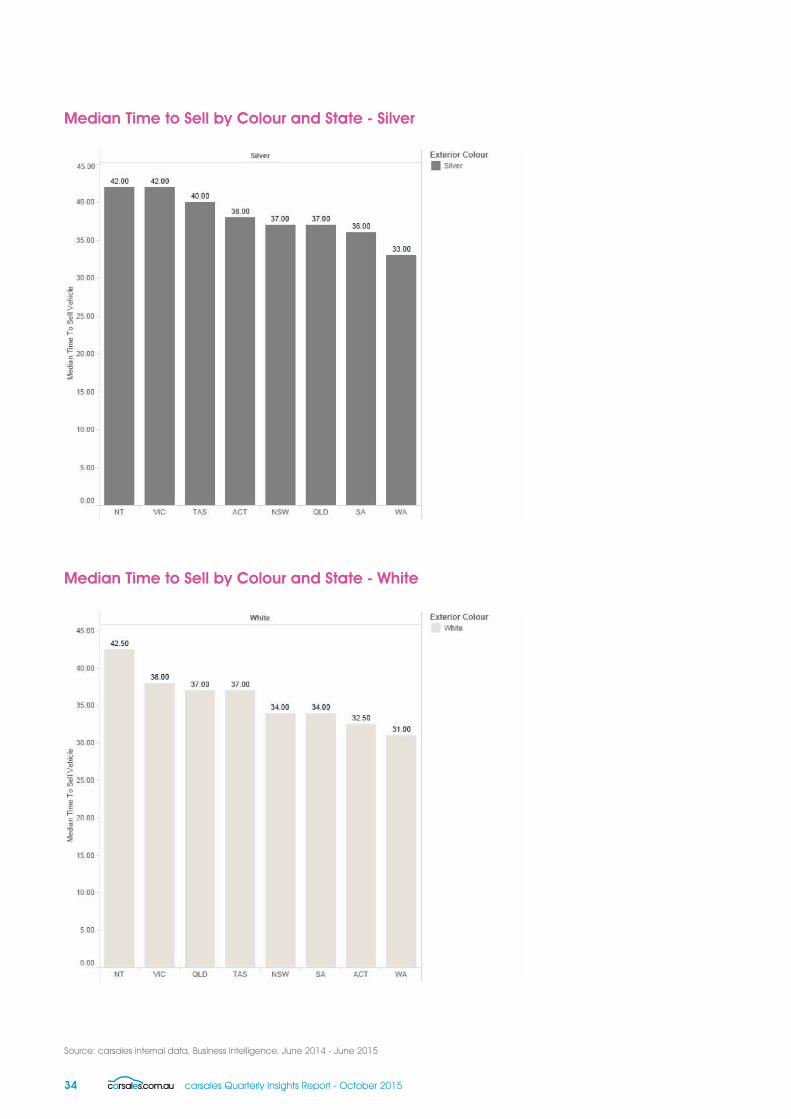
Source: carsales internal data, Business Intelligence, June 2014 - June 2015
Median Time to Sell by Colour and State - Brown
Median Time to Sell by Colour and State - Pink
carsales Quarterly Insights Report - October 2015 33
In Western Australia, the love of the Fremantle Dockers perhaps goes a little too far for some. Purple cars in WA sell in 20.5 days against an average of nearly 35 days for all cars.
DID YOU
KNOW?
Source: carsales internal data, Business Intelligence, June 2014 - June 2015
Median Time to Sell by Colour and State - Purple
Median Time to Sell by Colour and State - Black
34 carsales Quarterly Insights Report - October 2015
Source: carsales internal data, Business Intelligence, June 2014 - June 2015
Median Time to Sell by Colour and State - Silver
Median Time to Sell by Colour and State - White
carsales Quarterly Insights Report - October 2015 35
DID YOU
KNOW?Not so boring beige? It sells the quickest of all cars nationally - moving off the floor in just 8 days.
36 carsales Quarterly Insights Report - October 2015
Victorians spend the most on their new cars, with a median
drive away price of $30,015. However, Victorians are much
better off when buying a second hand car, with the median
drive away price fourth lowest at $26,398.
Interestingly, whilst Western Australians come in a modest
third for the median drive away price on new vehicles
($36,562), the average price Western Australians are paying
for a used vehicle is the second highest in the country at
$29,740. Could it be that the slowing down of the mining
boom means there’s an oversupply of second-hand,
premium condition cars on the market?
New South Welshmen also get the raw end of the deal
when purchasing cars, with both new and used cars the
country’s highest. New South Welshmen in the market for
a car have to swallow the fact that their used cars are only
about $2,000 less than a new car in four out of the other
7 states/territories. However this reflects the higher levels of
ownership of luxury cars across the state.
For those living in the ACT, not only are their new and
used cars the cheapest on the market across the country
($35,490 and $20,567 respectively), but the difference
between a new and used car is of the greatest value
amongst the states ($14,923). Northern Territory is not much
different with the average price of a new car is also at
the country’s lowest, at $35,490 and their used cars only
marginally higher than in ACT, at $21,625 (a difference
between new and used of 13,865).
Drive away prices across the statesWe all like to think we have it best where we live, but when in the market for a new car,
what state takes the cake?
Driving away at the right price?
carsales Quarterly Insights Report - October 2015 37
Victorians spend the most on
new cars, with a median drive
away price of $30,015

38 carsales Quarterly Insights Report - October 2015
Source: carsales internal data, Business Intelligence, July 2014 – June 2015. “New” includes BNCA, BNCIS Generic New and Demo, “Used” includes Dealer Used only. Null values and vehicles under $1000 excluded.
Median DAP New vs Used by State
But what can a dealer offer to help close the deal? What
special offers help get customers to sign on the dotted line?
Our analysis showed that in the last six weeks of FY2015,
Drive Away Price offers increase in conversion rate the most
in the final weeks of the financial year. While the take up of
special offers throughout the year varies considerably, when
the financial year draws to a close, manufacturers and
dealers rely on guaranteed price deals rather than generic
offer such as cash-backs, gift cards, extended warranty or
free-servicing.
carsales Quarterly Insights Report - October 2015 39
Upper Large Passenger category
If you’re based in the Northern Territory and looking to buy
a new car in the upper large category, you may want to
consider buying interstate. Buyers in NT are paying a median
price of $69,990 for a new car, while at the cheaper end of
the scale, South Australian’s are paying $46,990.
The best deals potentially to be had are in Tasmania
for both new and used cars ($53,439 and $36,067
respectively), and QLD ($51,400 and $36,789) who have
some of the lowest new and used cars on the market.
While the data shows that the Northern Territory pays the
most for new cars in this category at $69,990, we cannot
make conclusions about these results as there were limited
enquiries on new upper large SUV’s in this state.
UPPER LARGE < $100K NEW DEALER USED
NT 69,990 29,990
TAS 53,439 36,067
WA 52,746 40,493
QLD 51,400 36,789
NSW 49,859 42,184
VIC 47,490 38,500
SA 46,990 36,325
ACT 42,990 37,883
*During this period there were limited enquiries on dealer new upper large SUV in NT
Large passenger category
Spending on large new passenger cars varies greatly
between the states - with Tasmanians shelling out the most
at $76,931. They would be much better off looking to their
neighbour across Bass Strait for a better deal, as Victorians
pay over $32,000 less for new cars, with a median price
of $44,900.
However, it’s a very different story for Taswegians if buying
a used car, with the price of a new car 273% more than
a used car, with people being able to take their pick of a
used car in Tasmania for as little as $20,617. This makes
the used car market in Tasmania only $17 more than the
country’s cheapest market for used vehicles - Northern
Territory, and shows that Tasmanians like to hold onto their
cars for a lot longer than the average person, or they drive
them seriously hard that they depreciate so significantly!
LARGE < $70K NEW DEALER USED
TAS 76,931 20,617
NSW 53,730 25,779
NT 51,890 20,600
WA 51,554 26,689
SA 49,660 23,846
QLD 46,928 24,670
ACT 45,990 21,491
VIC 44,900 23,970
40 carsales Quarterly Insights Report - October 2015
Medium Passenger category
The states seem to be almost on par in the new medium
cars category, with top spending New South Welshmen
splashing out only $1,900 more than the lowest spenders in
Tasmania. Across both new and used categories, NSW, VIC
and SA spend the most, while ACT and QLD spend the least.
MEDIUM < $60K NEW DEALER USED
NSW 36,915 29,877
VIC 36,450 26,000
SA 36,248 28,035
WA 36,185 25,689
NT 35,740 22,655
QLD 35,409 24,044
TAS 35,000 24,737
ACT 34,990 24,534
Small Passenger category
Whilst New South Welshmen and Victorians are spending on
average the most on new small cars ($26,000 and $25,979
respectively), it’s the NSW residents who should be looking
interstate for a used car, being able to pick up a better deal
just down the road in the ACT to the tune of about $3,500.
What’s apparent in the small car industry, particularly in
comparison to some of the larger SUV and upper large car
markets, is that the variation in price between new and used
small cars in all states and territories is fairy minimal - with
about a 35% difference between the categories across the
board.
SMALL < $40K NEW DEALER USED
NSW 26,000 20,999
VIC 25,979 18,581
TAS 24,990 19,587
QLD 24,967 18,554
SA 24,922 20,752
ACT 24,689 17,492
WA 24,489 18,890
NT 22,360 18,535
DID YOU
KNOW?The medium new car market is much more competitive than the large vehicle market, with prices varying only $3,000 between the most and least expensive states, whereas for large cars, Tasmanians pay over $20,000 more for a new car than Victorians.
carsales Quarterly Insights Report - October 2015 41
SUVs
While ACT spend the most on upper large SUVs across the
country ($88,888) - almost 1/3 more than those paying
the least in Tasmania ($58,990). When it comes to buying
second hand ACT pay the least of all the states behind the
Northern Territory, paying $50,500 and $42,225 in order.
Could it be that those living in the ACT aren’t originally
from there, and they’re using people movers to take their
family to visit relatives scattered around the country? In turn,
wearing out their cars (and their value) rapidly?
Irrespective of what state you live in, depreciation of a new
car is not significantly different in the large SUV category,
with the difference between a new and used car sitting
around $12-14,000. This being said, a new large SUV is
cheapest in Northern Territory ($45,538) and has the least
deprecciation, with a used version less than $10,000
cheaper at $36,055.
For medium SUVs, Australia’s aren’t getting a much better or
worse deal - even if they do shop around, with the country’s
most expensive location to buy one new (NSW) will cost
someone $36,915 - which is only $2,000 cheaper than the
cheapest location (ACT) at $34,990.
In addition, this pattern is true for used mediaum SUVs, with
NSW the most expensive state at $29,887 - but setting a
trend for a variation of around $7,000-9,000 between new
and used across the country.
The best and worst place to buy a small SUV is in the
Northern Territory - the most expensive location at $31,323
possibly because of the distance stock has to go to get
to that far north, or becuase the demand is low, and the
best place to buy a used car ($21,635) - perhaps because
after a few dustry roads and harsh summers, they loose
their value.
All other states and territories offer a fairly comparitive price
for new and used small SUVs, giving people the opportunity
to enter into the larger car/SUV market for around
$28,500 new.
SMALL SUV < $40K NEW DEALER USED
NT 31,323 21,635
SA 29,988 23,990
ACT 29,988 23,990
WA 29,631 24,525
NSW 29,500 26,604
VIC 29,422 23,897
QLD 28,781 23,100
TAS 27,909 24,737
MEDIUM SUV < $60K NEW DEALER USED
NSW 36,915 29,887
VIC 36,450 26,000
SA 36,248 28,035
WA 36,185 25,689
NT 35,740 22,655
QLD 35,409 24,044
TAS 35,000 24,737
ACT 34,990 24,634
LARGE SUV < $70K NEW DEALER USED
WA 51,985 39,777
NSW 51,888 39,480
QLD 49,859 34,988
SA 48,444 38,326
VIC 47,890 34,780
ACT 47,807 32,536
TAS 47,495 33,999
NT 45,538 36,055
UPPER LARGE SUV <100K NEW DEALER USED
ACT 88,888 50,500
WA 82,274 59,095
QLD 80,675 51,980
SA 78,990 54,041
VIC 75,646 61,880
NT 69,990 42,225
NSW 69,939 58,970
TAS 58,990 55,990
42 carsales Quarterly Insights Report - October 2015
Utes/Cab Chassis
Northern Territorians have a legitimate reason for spending
more on a new, rather than used, 4x2 pick up truck, with the
difference between the two proving very little. Whilst the
cheapest location in Australia to buy a new ute/cab chassis
($25,765), the price of a used vehicle in this territory is only
$10 less ($25,755) - and the most expensive of the used
vehicle range in the country.
Interestingly, despite thinking that in the NT cars would be
driven harder due to the longer distances travelled and the
harsher weather conditions, could it be that it’s inner city
driving that does the most damage to our vehicles - with
Victoria, New South Wales and South Australia showing the
biggest price differentaition between new and used.
If you’re looking at buying a new ute/cab chassis and
trading in your old one, the best places to do this are in
West Australia and Tasmania, both of which sit in the middle
of the rankings for new (about $30,000) and are only about
$6,000 more expensive than a used car.
PU/CC 4X2 NEW DEALER USED
NSW 33,790 23,997
VIC 33,269 21,595
SA 32,811 22,825
WA 31,748 25,601
TAS 29,990 23,349
QLD 28,489 21,295
ACT 27,990 20,122
NT 25,765 25,755
Across the country, it appears that for an extra two wheels
of torque, you’re looking at paying over $10,000 for new
or used PU/CC 4x4 vehicles. Northern Territory is the most
expensive place to purchase a 4x4 vehicle new ($46,990)
or used ($35,003), whereas in Victoria, despite being middle
of the road with a new price of $43,690, purchasing a used
vehicle can save you over $12,000 at a drive away price of
$31,193 - Australia’s second lowest locations by only $500
(ACT being the cheapest at $29,838).
PU/CC 4X4 NEW DEALER USED
NT 46,990 35,003
SA 43,990 33,118
VIC 43,690 31,193
TAS 42,990 32,872
WA 42,510 35,284
QLD 42,000 31,990
NSW 41,000 35,950
ACT 35,862 29,838

carsales Quarterly Insights Report - October 2015 43
44 carsales Quarterly Insights Report - October 2015
Looking into car buying and selling behaviours of people across all
Australian states and territories, the country’s wealthiest and poorest
suburbs, and by colour preference, we see that there is not one car
that fits all - nor is any car enthusiast the same.
carsales Quarterly Insights Reportparting thoughts...
With the Volkswagon Golf touted as one of the most popular
small cars nationwide, as well as in Australia’s wealthiest
suburbs, it will be intresting to see how this vehicle and
brand fare the current media furore around the company’s
emissions misdemeanours. Will we see a shift in the cars
people buy - moving away from paying big bucks for a
badge, and sticking closer to home with the veicles they
choose such as the now limited edition Holden range?
carsales Quarterly Insights Report - October 2015 45
Releasing the insights report every quarter, caraslaes want to hear
from you and understand what you’re interested in knowing?
For further information on the carsales Quarterly Insights
Report, to propose topics for inclusion in future editions or
to set up an interview, please contact:
carsales Communications and PR Manager:
Will Clarke
p. 03 9093 4505 / 0468 971 536
Media advisors:
Felicity Robertson and Mia Cochrane
p. 03 9670 8350

48 carsales Quarterly Insights Report - October 2015