carton closing staples from china-publication. international trade commission publication 4694 may...
TRANSCRIPT

U.S. International Trade CommissionPublication 4694 May 2017
Washington, DC 20436
Carton Closing Staples from China
Investigation No. 731-TA-1359 (Preliminary)

U.S. International Trade Commission
COMMISSIONERS
Rhonda K. Schmidtlein, Chairman David S. Johanson, Vice Chairman
Irving A. Williamson Meredith M. Broadbent
F. Scott Kieff
Catherine DeFilippo
Staff assigned
Address all communications to Secretary to the Commission
United States International Trade Commission Washington, DC 20436
Director of Operations
Lawrence Jones, Investigator Mark Brininstool, Industry Analyst
Cindy Cohen, Economist Janet Freas, Accountant
Lita David-Harris, Statistician Darlene Smith, Statistical Assistant
Benjamin Allen, Attorney Douglas Corkran, Supervisory Investigator

U.S. International Trade CommissionWashington, DC 20436
www.usitc.gov
Publication 4694 May 2017
Carton Closing Staples from China
Investigation No. 731-TA-1359 (Preliminary)


CONTENTS Page
i
Determination ................................................................................................................................. 1
Views of the Commission ................................................................................................................ 3
Part I: Introduction ................................................................................................................ I‐1
Background ................................................................................................................................ I‐1
Statutory criteria and organization of the report ..................................................................... I‐1
Statutory criteria ................................................................................................................... I‐1
Organization of report ........................................................................................................... I‐3
Market summary ....................................................................................................................... I‐3
Summary data and data sources ............................................................................................... I‐3
Previous and related investigations .......................................................................................... I‐4
Nature and extent of sales at LTFV ........................................................................................... I‐5
The subject merchandise .......................................................................................................... I‐5
Commerce’s scope ................................................................................................................ I‐5
Tariff treatment ..................................................................................................................... I‐6
The product ............................................................................................................................... I‐6
Description and applications ................................................................................................. I‐6
Manufacturing processes ...................................................................................................... I‐8
Domestic like product issues ..................................................................................................... I‐9
Part II: Conditions of competition in the U.S. market ............................................................ II‐1
U.S. market characteristics ....................................................................................................... II‐1
Channels of distribution ........................................................................................................... II‐1
Geographic distribution ........................................................................................................... II‐2
Supply and demand considerations ……………………………………………………………………………………II‐3
U.S. supply ............................................................................................................................ II‐3
U.S. demand ......................................................................................................................... II‐5
Substitutability issues ............................................................................................................... II‐7
Lead times ............................................................................................................................ II‐7

CONTENTS Page
ii
Part II: Conditions of competition in the U.S. market‐‐Continued ......................................... II‐1
Comparison of U.S.‐produced and imported carton closing staples ................................... II‐8
Part III: U.S. producers’ production, shipments, and employment ....................................... III‐1
U.S. producers ......................................................................................................................... III‐1
Changes in operations ......................................................................................................... III‐2
U.S. production, capacity, and capacity utilization ................................................................. III‐2
Alternative products ............................................................................................................ III‐3
U.S. producers' U.S. shipments and exports ........................................................................... III‐4
U.S. producers’ inventories ..................................................................................................... III‐6
U.S. producers’ imports ........................................................................................................... III‐6
U.S. employment, wages, and productivity ............................................................................ III‐6
Part IV: U.S. imports, apparent U.S. consumption, and market shares ................................ IV‐1
U.S. importers.......................................................................................................................... IV‐1
U.S. imports ............................................................................................................................. IV‐2
U.S. importers' shipments of imports by type ................................................................... IV‐4
Negligibility .............................................................................................................................. IV‐5
Apparent U.S. consumption and U.S. market shares .............................................................. IV‐5
Part V: Pricing data ............................................................................................................... V‐1
Factors affecting prices ............................................................................................................ V‐1
Raw material costs ............................................................................................................... V‐1
U.S. inland transportation costs ........................................................................................... V‐1
Pricing practices ....................................................................................................................... V‐2
Pricing methods .................................................................................................................... V‐2
Sales terms and discounts .................................................................................................... V‐3
Price data .................................................................................................................................. V‐3
Price trends ........................................................................................................................... V‐6
Price comparisons ................................................................................................................ V‐6

CONTENTS Page
iii
Part V: Pricing data‐‐Continued ............................................................................................ V‐1
Lost sales and lost revenue ...................................................................................................... V‐8
Part VI: Financial experience of U.S. producers .................................................................... VI‐1
Background .............................................................................................................................. VI‐1
Operations on carton closing staples ...................................................................................... VI‐1
Net sales .............................................................................................................................. VI‐1
Cost of goods sold and gross profit or (loss) ....................................................................... VI‐2
Profitability .......................................................................................................................... VI‐2
Variance analysis ................................................................................................................. VI‐2
Capital expenditures and research and development (R&D) expenses ................................. VI‐2
Assets and return on investment ............................................................................................ VI‐3
Capital and investment ........................................................................................................... VI‐3
Part VII: Threat considerations and information on nonsubject countries .......................... VII‐1
The industry in China ............................................................................................................... VII‐2
Changes in operations ........................................................................................................ VII‐3
Operations on carton closing staples ................................................................................. VII‐3
Alternative products ........................................................................................................... VII‐4
Exports ..................................................................................................................................... VII‐4
U.S. inventories of imported merchandise ............................................................................. VII‐6
U.S. importers' outstanding orders ......................................................................................... VII‐7
Antidumping or countervailing duty orders in third country markets ................................... VII‐7
Information on nonsubject countries ..................................................................................... VII‐7
The industry in Taiwan ....................................................................................................... VII‐8
The industry in Sweden .................................................................................................... VII‐10
Global export market ....................................................................................................... VII‐11

CONTENTS Page
iv
Appendixes
A. Federal Register notices ................................................................................................. A‐1
B. Conference witnesses ..................................................................................................... B‐1
C. Summary data ................................................................................................................ C‐1
Note.— Information that would reveal confidential operations of individual concerns may not
be published and therefore has been deleted from this report. Such deletions are indicated by
asterisks. ***

1
UNITED STATES INTERNATIONAL TRADE COMMISSION
Investigation No. 731‐TA‐1359 (Preliminary)
Carton Closing Staples from China
DETERMINATION
On the basis of the record1 developed in the subject investigation, the United States International Trade Commission (“Commission”) determines, pursuant to the Tariff Act of 1930 (“the Act”), that there is a reasonable indication that an industry in the United States is materially injured by reason of imports of carton closing staples from China, provided for in subheadings 8305.20 and 7317.00 of the Harmonized Tariff Schedule of the United States, that are alleged to be sold in the United States at less than fair value (“LTFV”). COMMENCEMENT OF FINAL PHASE INVESTIGATION
Pursuant to section 207.18 of the Commission’s rules, the Commission also gives notice of the commencement of the final phase of its investigation. The Commission will issue a final phase notice of scheduling, which will be published in the Federal Register as provided in section 207.21 of the Commission’s rules, upon notice from the Department of Commerce (“Commerce”) of an affirmative preliminary determination in the investigation under section 733(b) of the Act, or, if the preliminary determination is negative, upon notice of an affirmative final determination in that investigation under section 735(a) of the Act. Parties that filed entries of appearance in the preliminary phase of the investigation need not enter a separate appearance for the final phase of the investigation. Industrial users, and, if the merchandise under investigation is sold at the retail level, representative consumer organizations have the right to appear as parties in Commission antidumping and countervailing duty investigations. The Secretary will prepare a public service list containing the names and addresses of all persons, or their representatives, who are parties to the investigation.
1 The record is defined in sec. 207.2(f) of the Commission’s Rules of Practice and Procedure
(19 CFR 207.2(f)).

2
BACKGROUND
On March 31, 2017, North American Steel & Wire/ISM Enterprises (“ISM”), Butler, Pennsylvania filed petitions with the Commission and Commerce, alleging that an industry in the United States is materially injured by reason of LTFV imports of carton closing staples from China. Accordingly, effective March 31, 2017, the Commission, pursuant to section 733(a) of the Act (19 U.S.C. 1673b(a)), instituted antidumping duty investigation No. 731‐TA‐1359 (Preliminary).
Notice of the institution of the Commission’s investigation and of a public conference to be held in connection therewith was given by posting copies of the notice in the Office of the Secretary, U.S. International Trade Commission, Washington, DC, and by publishing the notice in the Federal Register of April 7, 2017 ( 82 FR 17036). The conference was held in Washington, DC, on April 20, 2017, and all persons who requested the opportunity were permitted to appear in person or by counsel.

3
Views of the Commission
Based on the record in the preliminary phase of this investigation, we determine that there is a reasonable indication that an industry in the United States is materially injured by reason of imports of carton closing staples from China that are allegedly sold in the United States at less than fair value.
I. The Legal Standard for Preliminary Determinations
The legal standard for preliminary antidumping and countervailing duty determinations requires the Commission to determine, based upon the information available at the time of the preliminary determinations, whether there is a reasonable indication that a domestic industry is materially injured or threatened with material injury, or that the establishment of an industry is materially retarded, by reason of the allegedly unfairly traded imports.1 In applying this standard, the Commission weighs the evidence before it and determines whether “(1) the record as a whole contains clear and convincing evidence that there is no material injury or threat of such injury; and (2) no likelihood exists that contrary evidence will arise in a final investigation.”2
II. Background
North American Steel & Wire, Inc./ISM Enterprises (“petitioner” or “ISM”), a domestic producer of carton closing staples, filed the petition in this investigation on March 31, 2017. ISM appeared at the staff conference and submitted a postconference brief. No respondent entity appeared at the staff conference.3
ISM and Stanley Black and Decker (“SBD”), which accounted for 100 percent of U.S. production of carton closing staples since 2014, responded to the Commission’s U.S. producer questionnaire. U.S. import data are based on questionnaire responses from 13 U.S. importers, accounting for at least two‐thirds of U.S. imports of carton closing staples. The Commission received responses to its questionnaires from four foreign producers of subject merchandise in China; these firms accounted for less than half of all production of subject merchandise in China.4
1 19 U.S.C. §§ 1671b(a), 1673b(a) (2000); see also American Lamb Co. v. United States, 785 F.2d
994, 1001‐04 (Fed. Cir. 1986); Aristech Chem. Corp. v. United States, 20 CIT 353, 354‐55 (1996). No party argues that the establishment of an industry in the United States is materially retarded by the allegedly unfairly traded imports.
2 American Lamb Co., 785 F.2d at 1001; see also Texas Crushed Stone Co. v. United States, 35 F.3d 1535, 1543 (Fed. Cir. 1994).
3 Axxis, LLC (“Axxis”), *** importer of subject merchandise, submitted a statement in opposition to the petition. Statement from President Carl Schneider, EDIS Doc. 609825 (Apr. 26, 2017).
4 Confidential Report, INV‐PP‐060 (May 8, 2017), as revised by INV‐PP‐062 (May 10, 2017) (“CR”) at I‐5, IV‐1, Public Report, Carton Closing Staples from China, Inv. No. 731‐TA‐1359 (Preliminary), USITC Pub. 4694 (May 2017) (“PR”) at I‐4, IV‐1.

4
III. Domestic Like Product
In determining whether there is a reasonable indication that an industry in the United States is materially injured or threatened with material injury by reason of imports of the subject merchandise, the Commission first defines the “domestic like product” and the “industry.”5 Section 771(4)(A) of the Tariff Act of 1930, as amended (“the Tariff Act”), defines the relevant domestic industry as the “producers as a whole of a domestic like product, or those producers whose collective output of a domestic like product constitutes a major proportion of the total domestic production of the product.”6 In turn, the Tariff Act defines “domestic like product” as “a product which is like, or in the absence of like, most similar in characteristics and uses with, the article subject to an investigation.”7
The decision regarding the appropriate domestic like product(s) in an investigation is a factual determination, and the Commission has applied the statutory standard of “like” or “most similar in characteristics and uses” on a case‐by‐case basis.8 No single factor is dispositive, and the Commission may consider other factors it deems relevant based on the facts of a particular investigation.9 The Commission looks for clear dividing lines among possible like products and disregards minor variations.10 Although the Commission must accept Commerce’s determination as to the scope of the imported merchandise that is subsidized and/or sold at less than fair value,11 the Commission determines what domestic product is like
5 19 U.S.C. § 1677(4)(A). 6 19 U.S.C. § 1677(4)(A). 7 19 U.S.C. § 1677(10). 8 See, e.g., Cleo Inc. v. United States, 501 F.3d 1291, 1299 (Fed. Cir. 2007); NEC Corp. v.
Department of Commerce, 36 F. Supp. 2d 380, 383 (Ct. Int’l Trade 1998); Nippon Steel Corp. v. United States, 19 CIT 450, 455 (1995); Torrington Co. v. United States, 747 F. Supp. 744, 749 n.3 (Ct. Int’l Trade 1990), aff’d, 938 F.2d 1278 (Fed. Cir. 1991) (“every like product determination ‘must be made on the particular record at issue’ and the ‘unique facts of each case’”). The Commission generally considers a number of factors including the following: (1) physical characteristics and uses; (2) interchangeability; (3) channels of distribution; (4) customer and producer perceptions of the products; (5) common manufacturing facilities, production processes, and production employees; and, where appropriate, (6) price. See Nippon, 19 CIT at 455 n.4; Timken Co. v. United States, 913 F. Supp. 580, 584 (Ct. Int’l Trade 1996).
9 See, e.g., S. Rep. No. 96‐249 at 90‐91 (1979). 10 See, e.g., Nippon, 19 CIT at 455; Torrington, 747 F. Supp. at 748‐49; see also S. Rep. No. 96‐249
at 90‐91 (Congress has indicated that the like product standard should not be interpreted in “such a narrow fashion as to permit minor differences in physical characteristics or uses to lead to the conclusion that the product and article are not ‘like’ each other, nor should the definition of ‘like product’ be interpreted in such a fashion as to prevent consideration of an industry adversely affected by the imports under consideration.”).
11 See, e.g., USEC, Inc. v. United States, 34 Fed. App’x 725, 730 (Fed. Cir. 2002) (“The ITC may not modify the class or kind of imported merchandise examined by Commerce.”); Algoma Steel Corp. v. United States, 688 F. Supp. 639, 644 (Ct. Int’l Trade 1988), aff’d, 865 F.3d 240 (Fed. Cir.), cert. denied, 492 U.S. 919 (1989).

5
the imported articles Commerce has identified.12 The Commission may, where appropriate, include domestic articles in the domestic like product in addition to those described in the scope.13
A. Scope Definition
In its notice of initiation, Commerce defined the imported merchandise within the scope
of this investigation as follows:
Carton‐closing staples. Carton‐closing staples may be manufactured from carbon, alloy, or stainless steel wire, and are included in the scope of the investigation regardless of whether they are uncoated or coated, regardless of the type of coating.
Carton‐closing staples are generally made to American Society for Testing and Materials (ASTM) specification ASTM 01974/01974M ‐ 16, but can also be made to other specifications. Regardless of specification, however, all carton‐closing staples meeting the scope description are included in the scope. Carton‐closing staples include stick staple products, often referred to as staple strips, and roll staple products, often referred to as coils. Stick staples are lightly cemented or lacquered together to facilitate handling and loading into stapling machines. Roll staples are taped together along their crowns. Carton‐closing staples are covered regardless of whether they are imported in stick form or roll form.
Carton‐closing staples vary by the size of the wire, the width of the crown, and the length of the leg. The nominal leg length ranges from 0.4095 inch to 1.375 inches and the nominal crown width ranges from 1.125 inches to 1.375 inches. The size of the wire used in the production of carton‐closing staples varies from 0.029 to 0.064 inch (nominal thickness) by 0.064 to 0.100 inch (nominal width).
12 Hosiden Corp. v. Advanced Display Mfrs., 85 F.3d 1561, 1568 (Fed. Cir. 1996) (the Commission
may find a single like product corresponding to several different classes or kinds defined by Commerce); Cleo, 501 F.3d at 1298 n.1 (“Commerce’s {scope} finding does not control the Commission’s {like product} determination.”); Torrington, 747 F. Supp. at 748‐52 (affirming the Commission’s determination defining six like products in investigations where Commerce found five classes or kinds).
13 See, e.g., Pure Magnesium from China and Israel, Inv. Nos. 701‐TA‐403 and 731‐TA‐895‐96 (Final), USITC Pub. 3467 at 8 n.34 (Nov. 2001); Torrington, 747 F. Supp. at 748‐49 (holding that the Commission is not legally required to limit the domestic like product to the product advocated by the petitioner, co‐extensive with the scope).

6
Carton‐closing staples subject to this investigation are currently classifiable under subheadings 8305.20.00.00 and 7317.00.65.60 of the Harmonized Tariff Schedule of the United States (“HTSUS”).14
Carton closing staples are fastening devices used to secure or close the flaps of corrugated and solid paperboard cartons and boxes. They are manufactured from flat steel wire that is cut and shaped into a staple consisting of two legs connected by a crown and commonly coated with copper or zinc (galvanized).15 They are produced to standard sizes and specifications and vary by the size of the wire, the length of the legs, and the width of the crown.16
Carton closing staples are sold as either sticks or rolls. Stick and roll products are interchangeable in terms of their final use. The only difference in the use of the two products is the stapling tool in which they are used, but once fastened to the box or carton they are indistinguishable.17
B. Arguments of the Parties
ISM proposes a single domestic like product that is coextensive with Commerce’s scope.18 It argues that carton closing staples, regardless of form (i.e., stick or roll), are part of the same domestic like product.19 With regard to other types of staples, ISM argues that carton closing staples and other staples are distinct and are not part of the same domestic like product.20
C. Analysis
Based on the record in the preliminary phase of this investigation, we define a single
domestic like product, consisting of carton closing staples corresponding to the scope of the investigation.21
14 Carton Closing Staples from the People’s Republic of China: Initiation of Less‐Than‐Fair‐Value
Investigation, 82 Fed. Reg. 19351, 19356 (Apr. 27, 2017). 15 CR at I‐8, PR at I‐6. Carton closing staples are made from flat wire (as opposed to round wire)
so that the staple will remain flush with the packaging material in order to avoid catching or snagging on materials that may come into contact with the staple during storage and shipment. CR at I‐9, PR at I‐7.
16 CR at I‐9‐10, II‐1, PR at I‐6‐7, II‐1. The ASTM standard that applies to carton closing staples, ASTM D1974/D1974M—16 Standard, is measured in inches with a crown width of 1.125 inches, a leg width of 0.072 inches, and a leg thickness of 0.033 inches. CR at I‐9‐10, PR at I‐7.
17 CR at I‐8‐9, PR at I‐7. 18 Petitioner’s Postconference Br. at 5, 13. 19 Petitioner’s Postconference Br. at 5‐13. 20 Petitioner’s Postconference Br. at 5‐13. 21 We do not include other staples in the domestic like product with carton closing staples. The
available information on the record, which is largely limited to information submitted by petitioner, indicates that carton closing staples meet different ASTM standards than other staples, and these (Continued…)

7
Physical Characteristics and Uses. All carton closing staples consist of flat steel wire that is cut and shaped into a staple consisting of two legs connected by a crown.22 They are sold as either stick or roll products.23 Most carton closing staples are produced to standard sizes and specifications.24 Staples of the same dimensions are available in either stick or roll form.25 Notwithstanding differences in form, stick and roll products are used to secure or close the flaps of corrugated and solid paperboard cartons and boxes.26
Manufacturing Facilities, Production Processes, and Employees. During the POI, U.S. firms manufactured both stick and roll products at the same manufacturing facilities using overlapping employees.27 Production of all carton closing staples consists of drawing, annealing, pickling, plating, and forming steel wire rod.28 In forming the final product, separate machines are used to produce stick and roll products.29
Channels of Distribution. Staples in both roll and stick form are sold in the same channels of distribution, with the majority of staples sold to distributors.30
(…Continued) differences in physical characteristics are due to differences in their end uses. Carton closing staples are used to close and reinforce paperboard cartons and boxes whereas other staples serve fastening and less demanding office end uses. There is no overlap in the manufacturing facilities, processes, and employees, and the two products are not interchangeable. The record contains very limited information about channels of distribution and producer and customer perceptions, with petitioner reporting some overlap in distributors which sell other staples and carton closing staples but likely differences in customer and producer perceptions between carton closing staples and other staples. Petitioner also indicates that carton closing staples and other kinds of staples are all likely to be offered in a range of prices. Petitioner’s Postconference Br. at 5‐13.
We observe that other staples are not included in Commerce’s scope and that no party advocated defining the domestic like product to include them. Therefore, in light of the foregoing, we determine not to include other staples in the definition of the domestic like product.
22 CR at I‐8‐9, PR at I‐6‐7. 23 CR at I‐8, PR at I‐6. 24 CR at II‐1, PR at II‐1. 25 Conference Tr. at 23, 25 (Drake). 26 CR at I‐8, PR at I‐6. 27 Conference Tr. at 24 (Drake). 28 CR at I‐10, PR at I‐8. 29 CR at I‐11‐12, PR at I‐8. For the formation of stick products, 50 wires are fed together into a
machine where glue is applied to adhere the wires to one another. The wires are fed through an oven to cure the glue and then fed into a press, where the wires are cut and punched into the final product, a stick containing 50 staples. The sticks of staples are then given a visual quality control check and are manually packaged into cartons.
For roll products, two wires are fed into a machine which cuts and flattens the wires into their final form. The formed staples are then adhered to one another with melted tape to form a roll of 1,000 staples. After the roll is formed, tape is manually applied to the outside of the roll to keep it secure and then the rolls are manually packaged into cartons. Id.
30 CR at II‐1‐2, PR at II‐1, CR/PR at Table II‐1; Conference Tr. at 24 (Drake).

8
Interchangeability. Interchangeability between staples in stick and roll form is limited by a given staple tool, which is designed to take either sticks or rolls.31 However, carton closing staples are used interchangeably to fasten staples of the same size to the same type of boxes and cartons and to close those boxes or cartons.32
Producer and Customer Perceptions. ISM argued that stick and roll staples are part of the same product, and no other market participant argued otherwise, as indicated above. Staples in both stick and roll form are available from the same distributors and the same retailers.33 Roll and stick staples may be used by the same end users for the same basic use on the same box.34
Price. The pricing data the Commission collected indicate that there is an overlap of prices between stick and roll staples. Although roll staples are generally priced higher than stick staples, prices vary more widely by staple size than staple form.35
Based on the foregoing information, and in the absence of any contrary argument, we define a single domestic like product consisting of carton closing staples corresponding to the scope of the investigation.
IV. Domestic Industry
The domestic industry is defined as the domestic “producers as a whole of a domestic like product, or those producers whose collective output of a domestic like product constitutes a major proportion of the total domestic production of the product.”36 In defining the domestic industry, the Commission’s general practice has been to include in the industry producers of all domestic production of the like product, whether toll‐produced, captively consumed, or sold in the domestic merchant market.
We must determine whether any producer of the domestic like product should be excluded from the domestic industry pursuant to Section 771(4)(B) of the Tariff Act. This provision allows the Commission, if appropriate circumstances exist, to exclude from the domestic industry producers that are related to an exporter or importer of subject merchandise or which are themselves importers.37 Exclusion of such a producer is within the Commission’s discretion based upon the facts presented in each investigation.38
31 See Conference Tr. at 23 (Drake). 32 Conference Tr. at 24 (Drake). 33 Conference Tr. at 24 (Drake). 34 Conference Tr. at 17 (Tyndall). 35 See CR/PR at Tables V‐3‐6. 36 19 U.S.C. § 1677(4)(A). 37 See Torrington Co. v. United States, 790 F. Supp. 1161, 1168 (Ct. Int’l Trade 1992), aff’d
without opinion, 991 F.2d 809 (Fed. Cir. 1993); Sandvik AB v. United States, 721 F. Supp. 1322, 1331‐32 (Ct. Int’l Trade 1989), aff’d mem., 904 F.2d 46 (Fed. Cir. 1990); Empire Plow Co. v. United States, 675 F. Supp. 1348, 1352 (Ct. Int’l Trade 1987).
38 The primary factors the Commission has examined in deciding whether appropriate circumstances exist to exclude a related party include the following:
(1) the percentage of domestic production attributable to the importing producer; (Continued…)

9
***, which produced carton closing staples in the United States, imported subject merchandise during the period of investigation.39 Consequently, as an importer of subject merchandise during the period of investigation, *** is a related party. During 2014, *** was the *** domestic producer, and in 2015 it accounted for *** percent of domestic production.40 In ***.41 *** accounted for *** percent of domestic production of carton closing staples in 2016.42 Its imports of carton closing staples from China were *** staples in 2014, *** staples in 2015, and *** staples in 2016.43 The ratio of its subject imports to domestic production was *** percent in 2014 and *** percent in 2015, while in 2016 *** had no domestic production.44 Its operating income margin was *** percent in 2014 and *** percent in 2015, and in both years its operating performance ***.45
In view of the fact that *** imports of subject merchandise were substantial compared to its domestic production and that it ceased its domestic production of carton closing staples during the period of investigation in favor of importing the product from China, we find that appropriate circumstances exist to exclude *** from the domestic industry as a related party. Consequently, we define the domestic industry as all domestic producers of carton closing staples except for ***.
V. Negligible Imports
Pursuant to Section 771(24) of the Tariff Act, imports from a subject country of merchandise corresponding to a domestic like product that account for less than 3 percent of all such merchandise imported into the United States during the most recent 12 months for which data are available preceding the filing of the petition shall be deemed negligible.46
(…Continued)
(2) the reason the U.S. producer has decided to import the product subject to investigation (whether the firm benefits from the LTFV sales or subsidies or whether the firm must import in order to enable it to continue production and compete in the U.S. market);
(3) whether inclusion or exclusion of the related party will skew the data for the rest of the industry;
(4) the ratio of import shipments to U.S. production for the imported product; and (5) whether the primary interest of the importing producer lies in domestic production or
importation. Changzhou Trina Solar Energy Co. v. USITC, 100 F. Supp.3d 1314, 1326‐31 (Ct. Int’l. Trade 2015); see also Torrington, 790 F. Supp. at 1168.
39 CR at I‐4 n.6, III‐2, PR at I‐3 n.6, III‐1. *** is also the sole owner of ***, a foreign producer of carton closing staples. CR at III‐2, PR at III‐2, CR/PR at Table III‐2.
40 CR/PR at Table III‐4. 41 CR at III‐1 n.1, III‐2 n.3, PR at III‐1 nn.1 & 3, CR/PR at Table III‐3. 42 CR at III‐2, PR at III‐1, CR/PR at Tables III‐1, III‐3. 43 CR/PR at Table III‐9. 44 CR/PR at Table III‐9. 45 CR/PR at Table VI‐2. 46 19 U.S.C. §§ 1671b(a), 1673b(a), 1677(24)(A)(i), 1677(24)(B); see also 15 C.F.R. § 2013.1
(developing countries for purposes of 19 U.S.C. § 1677(36)).

10
Negligibility is not an issue in this investigation. U.S. imports from China, as measured by questionnaire responses, accounted for 93.2 percent of total imports of carton closing staples by quantity from March 2016 to February 2017, the twelve months preceding the March 31, 2017 filing of the petition.47
VI. Reasonable Indication of Material Injury by Reason of Subject Imports
A. Legal Standard
In the preliminary phase of an antidumping duty investigation, the Commission determines whether there is a reasonable indication that an industry in the United States is materially injured or threatened with material injury by reason of the imports under investigation.48 In making this determination, the Commission must consider the volume of subject imports, their effect on prices for the domestic like product, and their impact on domestic producers of the domestic like product, but only in the context of U.S. production operations.49 The statute defines “material injury” as “harm which is not inconsequential, immaterial, or unimportant.”50 In assessing whether there is a reasonable indication that the domestic industry is materially injured by reason of subject imports, we consider all relevant economic factors that bear on the state of the industry in the United States.51 No single factor is dispositive, and all relevant factors are considered “within the context of the business cycle and conditions of competition that are distinctive to the affected industry.”52
Although the statute requires the Commission to determine whether there is a reasonable indication that the domestic industry is “materially injured by reason of” unfairly traded imports,53 it does not define the phrase “by reason of,” indicating that this aspect of the injury analysis is left to the Commission’s reasonable exercise of its discretion.54 In identifying a causal link, if any, between subject imports and material injury to the domestic industry, the Commission examines the facts of record that relate to the significance of the volume and price effects of the subject imports and any impact of those imports on the condition of the domestic
47 CR/PR at Table IV‐4. 48 19 U.S.C. §§ 1671b(a), 1673b(a). The Trade Preferences Extension Act of 2015, Pub. L. 114‐27,
amended the provisions of the Tariff Act pertaining to Commission determinations of reasonable indication of material injury and threat of material injury by reason of subject imports in certain respects. We have applied these amendments here.
49 19 U.S.C. § 1677(7)(B). The Commission “may consider such other economic factors as are relevant to the determination” but shall “identify each {such} factor ... {a}nd explain in full its relevance to the determination.” 19 U.S.C. § 1677(7)(B).
50 19 U.S.C. § 1677(7)(A). 51 19 U.S.C. § 1677(7)(C)(iii). 52 19 U.S.C. § 1677(7)(C)(iii). 53 19 U.S.C. §§ 1671b(a), 1673b(a). 54 Angus Chemical Co. v. United States, 140 F.3d 1478, 1484‐85 (Fed. Cir. 1998) (“{T}he statute
does not ‘compel the commissioners’ to employ {a particular methodology}.”), aff’g 944 F. Supp. 943, 951 (Ct. Int’l Trade 1996).

11
industry. This evaluation under the “by reason of” standard must ensure that subject imports are more than a minimal or tangential cause of injury and that there is a sufficient causal, not merely a temporal, nexus between subject imports and material injury.55
In many investigations, there are other economic factors at work, some or all of which may also be having adverse effects on the domestic industry. Such economic factors might include nonsubject imports; changes in technology, demand, or consumer tastes; competition among domestic producers; or management decisions by domestic producers. The legislative history explains that the Commission must examine factors other than subject imports to ensure that it is not attributing injury from other factors to the subject imports, thereby inflating an otherwise tangential cause of injury into one that satisfies the statutory material injury threshold.56 In performing its examination, however, the Commission need not isolate the injury caused by other factors from injury caused by unfairly traded imports.57 Nor does the
55 The Federal Circuit, in addressing the causation standard of the statute, has observed that
“{a}s long as its effects are not merely incidental, tangential, or trivial, the foreign product sold at less than fair value meets the causation requirement.” Nippon Steel Corp. v. USITC, 345 F.3d 1379, 1384 (Fed. Cir. 2003). This was re‐affirmed in Mittal Steel Point Lisas Ltd. v. United States, 542 F.3d 867, 873 (Fed. Cir. 2008), in which the Federal Circuit, quoting Gerald Metals, Inc. v. United States, 132 F.3d 716, 722 (Fed. Cir. 1997), stated that “this court requires evidence in the record ‘to show that the harm occurred “by reason of” the LTFV imports, not by reason of a minimal or tangential contribution to material harm caused by LTFV goods.’” See also Nippon Steel Corp. v. United States, 458 F.3d 1345, 1357 (Fed. Cir. 2006); Taiwan Semiconductor Industry Ass’n v. USITC, 266 F.3d 1339, 1345 (Fed. Cir. 2001).
56 Uruguay Round Agreements Act Statement of Administrative Action (SAA), H.R. Rep. 103‐316, Vol. I at 851‐52 (1994) (“{T}he Commission must examine other factors to ensure that it is not attributing injury from other sources to the subject imports.”); S. Rep. 96‐249 at 75 (1979) (the Commission “will consider information which indicates that harm is caused by factors other than less‐than‐fair‐value imports.”); H.R. Rep. 96‐317 at 47 (1979) (“in examining the overall injury being experienced by a domestic industry, the ITC will take into account evidence presented to it which demonstrates that the harm attributed by the petitioner to the subsidized or dumped imports is attributable to such other factors;” those factors include “the volume and prices of nonsubsidized imports or imports sold at fair value, contraction in demand or changes in patterns of consumption, trade restrictive practices of and competition between the foreign and domestic producers, developments in technology and the export performance and productivity of the domestic industry”); accord Mittal Steel, 542 F.3d at 877.
57 SAA at 851‐52 (“{T}he Commission need not isolate the injury caused by other factors from injury caused by unfair imports.”); Taiwan Semiconductor Industry Ass’n , 266 F.3d at 1345. (“{T}he Commission need not isolate the injury caused by other factors from injury caused by unfair imports ... . Rather, the Commission must examine other factors to ensure that it is not attributing injury from other sources to the subject imports.” (emphasis in original)); Asociacion de Productores de Salmon y Trucha de Chile AG v. United States, 180 F. Supp. 2d 1360, 1375 (Ct. Int’l Trade 2002) (“{t}he Commission is not required to isolate the effects of subject imports from other factors contributing to injury” or make “bright‐line distinctions” between the effects of subject imports and other causes.); see also Softwood Lumber from Canada, Inv. Nos. 701‐TA‐414 and 731‐TA‐928 (Remand), USITC Pub. 3658 at 100‐01 (Dec. 2003) (Commission recognized that “{i}f an alleged other factor is found not to have or threaten to have injurious effects to the domestic industry, i.e., it is not an ‘other causal factor,’ then there is nothing to (Continued…)

12
“by reason of” standard require that unfairly traded imports be the “principal” cause of injury or contemplate that injury from unfairly traded imports be weighed against other factors, such as nonsubject imports, which may be contributing to overall injury to an industry.58 It is clear that the existence of injury caused by other factors does not compel a negative determination.59
Assessment of whether material injury to the domestic industry is “by reason of” subject imports “does not require the Commission to address the causation issue in any particular way” as long as “the injury to the domestic industry can reasonably be attributed to the subject imports” and the Commission “ensure{s} that it is not attributing injury from other sources to the subject imports.”60 61 Indeed, the Federal Circuit has examined and affirmed various Commission methodologies and has disavowed “rigid adherence to a specific formula.”62
(…Continued) further examine regarding attribution to injury”), citing Gerald Metals, 132 F.3d at 722 (the statute “does not suggest that an importer of LTFV goods can escape countervailing duties by finding some tangential or minor cause unrelated to the LTFV goods that contributed to the harmful effects on domestic market prices.”).
58 S. Rep. 96‐249 at 74‐75; H.R. Rep. 96‐317 at 47. 59 See Nippon, 345 F.3d at 1381 (“an affirmative material‐injury determination under the statute
requires no more than a substantial‐factor showing. That is, the ‘dumping’ need not be the sole or principal cause of injury.”).
60 Mittal Steel, 542 F.3d at 877‐78; see also id. at 873 (“While the Commission may not enter an affirmative determination unless it finds that a domestic industry is materially injured ‘by reason of’ subject imports, the Commission is not required to follow a single methodology for making that determination ... {and has} broad discretion with respect to its choice of methodology.”) citing United States Steel Group v. United States, 96 F.3d 1352, 1362 (Fed. Cir. 1996) and S. Rep. 96‐249 at 75. In its decision in Swiff‐Train v. United States, 793 F.3d 1355 (Fed. Cir. 2015), the Federal Circuit affirmed the Commission’s causation analysis as comporting with the Court’s guidance in Mittal.
61 Commissioner Kieff does not join this paragraph or the following three paragraphs. He points out that the Federal Circuit, in Bratsk, 444 F.3d 1369, and Mittal Steel, held that the Commission is required, in certain circumstances when analyzing present material injury, to consider a particular issue with respect to the role of nonsubject imports, without reliance upon presumptions or rigid formulas. The Court has not prescribed a specific method of exposition for this consideration. Mittal Steel explains as follows:
What Bratsk held is that “where commodity products are at issue and fairly traded, price competitive, non‐subject imports are in the market,” the Commission would not fulfill its obligation to consider an important aspect of the problem if it failed to consider whether non‐subject or non‐LTFV imports would have replaced LTFV subject imports during the period of investigation without a continuing benefit to the domestic industry. 444 F.3d at 1369. Under those circumstances, Bratsk requires the Commission to consider whether replacement of the LTFV subject imports might have occurred during the period of investigation, and it requires the Commission to provide an explanation of its conclusion with respect to that factor.
542 F.3d at 878.

13
The Federal Circuit’s decisions in Gerald Metals, Bratsk, and Mittal Steel all involved cases in which the relevant “other factor” was the presence in the market of significant volumes of price‐competitive nonsubject imports. The Commission interpreted the Federal Circuit’s guidance in Bratsk as requiring it to apply a particular additional methodology following its finding of material injury in cases involving commodity products and a significant market presence of price‐competitive nonsubject imports.66 The additional “replacement/benefit” test looked at whether nonsubject imports might have replaced subject imports without any benefit to the U.S. industry. The Commission applied that specific additional test in subsequent cases, including the Carbon and Certain Alloy Steel Wire Rod from Trinidad and Tobago determination that underlies the Mittal Steel litigation.
Mittal Steel clarifies that the Commission’s interpretation of Bratsk was too rigid and makes clear that the Federal Circuit does not require the Commission to apply an additional test nor any one specific methodology; instead, the court requires the Commission to have “evidence in the record ‘to show that the harm occurred ‘by reason of’ the LTFV imports,’” and requires that the Commission not attribute injury from nonsubject imports or other factors to subject imports.67 Accordingly, we do not consider ourselves required to apply the replacement/benefit test that was included in Commission opinions subsequent to Bratsk.
The progression of Gerald Metals, Bratsk, and Mittal Steel clarifies that, in cases involving commodity products where price‐competitive nonsubject imports are a significant factor in the U.S. market, the Court will require the Commission to give full consideration, with adequate explanation, to non‐attribution issues when it performs its causation analysis.68
The question of whether the material injury threshold for subject imports is satisfied notwithstanding any injury from other factors is factual, subject to review under the substantial
(…Continued)
62 Nucor Corp. v. United States, 414 F.3d 1331, 1336, 1341 (Fed. Cir. 2005); see also Mittal Steel, 542 F.3d at 879 (“Bratsk did not read into the antidumping statute a Procrustean formula for determining whether a domestic injury was ‘by reason’ of subject imports.”).
66 Mittal Steel, 542 F.3d at 875‐79. 67 Mittal Steel, 542 F.3d at 873 (quoting from Gerald Metals, 132 F.3d at 722), 875‐79 & n.2
(recognizing the Commission’s alternative interpretation of Bratsk as a reminder to conduct a non‐attribution analysis).
68 To that end, after the Federal Circuit issued its decision in Bratsk, the Commission began to present published information or send out information requests in the final phase of investigations to producers in nonsubject countries that accounted for substantial shares of U.S. imports of subject merchandise (if, in fact, there were large nonsubject import suppliers). In order to provide a more complete record for the Commission’s causation analysis, these requests typically seek information on capacity, production, and shipments of the product under investigation in the major source countries that export to the United States. The Commission plans to continue utilizing published or requested information in the final phase of investigations in which there are substantial levels of nonsubject imports.

14
evidence standard.69 Congress has delegated this factual finding to the Commission because of the agency’s institutional expertise in resolving injury issues.70
B. Conditions of Competition and the Business Cycle
The following conditions of competition inform our analysis of whether there is a reasonable indication of material injury by reason of subject imports.
1. Demand Conditions
U.S. demand for carton closing staples depends on the demand for carton and box packaging.71 Most questionnaire respondents indicated that the market was not subject to business cycles or other distinctive conditions of competition.72 Most U.S. producers and importers reported no change or a decrease in U.S. demand for carton closing staples since 2014.73 Importers, however, reported a decrease in demand attributable to a shift to alternative fasteners such as glue and tape.74
Apparent U.S. consumption remained at approximately *** staples from 2014 to 2016, increasing slightly by *** percent from 2014 to 2016.75
2. Supply Conditions
Domestic shipments, subject imports, and imports from nonsubject sources all supplied the U.S. market over the period of investigation.
Carton closing staples manufactured in the United States by *** and ISM were the second largest source of supply during the period of investigation. As observed above, ***.76 ISM ***.77 ISM’s market share decreased from *** percent in 2014 to *** percent in 2015 and *** percent in 2016.78
69 We provide in our discussion below a full analysis of other factors alleged to have caused any
material injury experienced by the domestic industry. 70 Mittal Steel, 542 F.3d at 873; Nippon, 458 F.3d at 1350, citing U.S. Steel Group, 96 F.3d at
1357; S. Rep. 96‐249 at 75 (“The determination of the ITC with respect to causation is ... complex and difficult, and is a matter for the judgment of the ITC.”).
71 CR at II‐8, PR at II‐5. 72 CR at II‐8, PR at II‐6. *** and 11 of 13 importers indicated that the market was not subject to
business cycles or distinct conditions of competition. Id. 73 CR at II‐8, PR at II‐6, CR/PR at Table II‐3. 74 CR at II‐8, PR at II‐6. 75 CR/PR at Table IV‐5. Apparent U.S. consumption was *** staples in 2014, *** staples in 2015,
and *** staples in 2016. Id. 76 CR at I‐4 n.6, PR at I‐3 n.6, CR/PR at Table III‐3. ***. CR/PR at Table III‐3. ***. ***. CR at III‐2
n.3, PR at III‐2 n.3. As observed above, SBD’s imports of carton closing staples ***. CR/PR at Table III‐9. 77 CR/PR at Table III‐4. 78 CR/PR at Table C‐2.

15
ISM’s capacity remained stable at *** staples from 2014 to 2016.79 This was smaller than apparent U.S. consumption over the same period. 80 Although ISM acknowledged that it had never been at a production level approaching its theoretical capacity, it testified that it could increase its production efficiency and capacity through longer production runs and by hiring additional staff, should it receive a greater quantity of orders for carton closing staples.81
Subject imports from China were the largest source of supply over the period of investigation. Subject imports’ market share increased from *** percent in 2014 to *** percent in 2015 and *** percent in 2016.82 Export shipments to the United States accounted for between *** and *** percent of total shipments of carton closing staples by the industry in China between 2014 and 2016, while home market shipments accounted for between *** and *** percent of the industry’s total shipments of carton closing staples during this period.83
Nonsubject imports were the smallest source of supply over the period of investigation. Their market share decreased from *** percent in 2014 to *** percent in 2015 and increased to *** percent in 2016.84 Sweden was the largest individual nonsubject source of supply to the U.S. market.85
3. Substitutability and Other Conditions
We find based on the record in the preliminary phase of this investigation that subject
imports and the domestic like product have a high degree of substitutability. The majority of U.S. importers responding to the Commission’s questionnaire reported that subject imports from China are always or frequently interchangeable with carton closing staples manufactured in the United States.86 Both responding U.S. producers indicated that subject imports and the domestic like product are always interchangeable.87 As observed above, carton closing staples are produced to standard sizes and specifications.88 The record indicates that stapling tools will work with staples from different manufacturers.89
79 CR/PR at Table III‐4. ISM testified at the staff conference that it had never operated its
existing equipment at full capacity nor had it been able to staff its facility to operate at such a level. Conference Tr. at 73 (Tyndall); CR at III‐3‐4 nn.5‐6, PR at III‐2 nn.5‐6. Commission staff adjusted ISM’s reported capacity to reflect the staffing levels and hours of operation ISM reported at the staff conference. CR at III‐4 n.8, PR at III‐3 n.8.
80 See CR/PR at Tables III‐4, IV‐5. 81 Conference Tr. at 72‐76 (Farah). ISM’s capacity utilization was *** percent in 2014, ***
percent in 2015, and *** percent in 2016. CR/PR at Table III‐4. 82 CR/PR at Table IV‐5. 83 CR/PR at Table VII‐3. 84 CR/PR at Table IV‐5. 85 CR at II‐6, PR at II‐5. 86 CR at II‐11, PR at II‐8, CR/PR at Table II‐4. 87 CR at II‐11, PR at II‐8, CR/PR at Table II‐4. 88 CR at I‐10, PR at I‐8. While there is evidence that some brands of stapling tools require staples
with brand‐specific sizing, the record indicates that various producers are able to manufacture staples (Continued…)

16
The record indicates that regardless of source the vast majority of carton closing staples are sold to distributors and staples from different manufacturers compete side‐by‐side.90 While there is some evidence that price appears to be an important factor in purchasing decisions, non‐price factors may also be important. Market participants expressed mixed views about the role of price in purchasing decisions. The *** U.S. producers reported that differences other than price were never significant in purchasing decisions. By contrast, half of U.S. importers reported differences other than price are always or frequently a significant factor in purchasing decisions, while the other half reported that differences other than price were sometimes or never a factor in purchasing decisions.91 We will closely examine the importance of non‐price factors in any final phase of this investigation.
Low‐carbon steel wire rod is the main raw material used to produce carton closing staples.92 Prices for steel wire rod decreased overall over the period of investigation.93 Market participants’ responses were mixed about raw material cost trends; however, a majority reported that raw material costs either fluctuated or decreased since 2014.94
Carton closing staples are sold primarily on the spot market.95 The record indicates that *** percent of ISM’s sales are on the spot market, while importers reported that *** percent of their sales were spot sales and *** percent of their sales were through long‐term contracts.96 However, one importer reported that these contracts are ***.97
C. Volume of Subject Imports
Section 771(7)(C)(i) of the Tariff Act provides that the “Commission shall consider
whether the volume of imports of the merchandise, or any increase in that volume, either in absolute terms or relative to production or consumption in the United States, is significant.”98
The volume of subject imports increased over the period of investigation from 2.4 billion staples in 2014 to 2.6 billion staples in 2015 and 3.1 billion staples in 2016.99 As observed
(…Continued) that meet those specifications and that producers advertise their staples as suitable for use in their competitors’ stapling tools. Conference Tr. at 27‐28, 47‐48 (Drake).
89 Conference Tr. at 7, 27‐28 (Drake), 17‐18 (Tyndall), 78 (Farah). 90 CR at II‐2, PR at II‐1, CR/PR at Table II‐1. While there is evidence that Bostitch may limit the
number of distributors it uses in a given region, these distributors also typically sell staples produced by other manufacturers. Id.
91 CR/PR at Table II‐5. 92 CR at I‐10, V‐1, PR at I‐8, V‐1. 93 CR at V‐1, PR at V‐1, CR/PR at Figure V‐1. 94 CR at V‐1, PR at V‐1. *** reported that raw material prices decreased since 2014, while ***
reported an increase. Importers were nearly evenly divided, with five reporting an increase, four reporting a decrease, and four reporting that raw material costs fluctuated since 2014. Id.
95 CR/PR at Table V‐2. 96 CR at V‐3‐4, PR at V‐2, CR/PR at Table V‐2. 97 CR at V‐4, PR at V‐2. 98 19 U.S.C. § 1677(7)(C)(i).

17
above, subject imports’ market share increased from *** percent in 2014 to *** percent in 2015 and *** percent in 2016.100
The subject imports’ increased market share came at the expense of the domestic industry and the excluded domestic producer. Subject imports’ market share increased by *** percentage points from 2014 to 2016, while the domestic industry’s market share declined by *** percentage points.101 Nonsubject imports’ market share was relatively stable, increasing by only *** percentage point from 2014 to 2016.102 We observe that a large portion of subject imports’ increased share of the U.S. market is attributable to *** move its production of carton closing staples from the United States to ***.103 The ratio of subject imports to U.S. production increased from *** percent in 2014 to *** percent in 2015, and *** percent in 2016.104
In light of the foregoing, we find that the volume of subject imports from China and the increase in that volume are significant in both absolute terms and relative to production and consumption.
D. Price Effects of the Subject Imports
Section 771(7)(C)(ii) of the Tariff Act provides that, in evaluating the price effects of subject imports, the Commission shall consider whether –
(I) there has been significant price underselling by the imported merchandise as compared with the price of domestic like products of the United States, and
(II) the effect of imports of such merchandise otherwise depresses prices to a significant degree or prevents price increases, which otherwise would have occurred, to a significant degree.105
As observed above, the record indicates that there is a high degree of substitutability between subject imports and the domestic like product.
The Commission collected quarterly pricing data on four pricing products.106 Two U.S. producers and ten importers provided usable pricing data for sales of the requested products,
(…Continued)
99 CR/PR at Table IV‐5. 100 CR/PR at Table IV‐5. 101 CR/PR at Table C‐2. ISM’s individual share of apparent U.S. consumption decreased from ***
percent in 2014 to *** percent in 2015, and then to *** percent in 2016. Id. Excluded producer *** market share declined from *** percent in 2014 to *** percent in 2016. Compare CR/PR, Tables C‐1 and C‐2.
102 CR/PR at Table IV‐5. 103 CR at IV‐2 n.3, PR at IV‐2 n.3. *** imports from China accounted for *** percent of the
increase in U.S. imports from China from 2015 to 2016. Id. 104 CR/PR at Table IV‐2. 105 19 U.S.C. § 1677(7)(C)(ii). 106 CR at V‐5, PR at V‐3. The four pricing products are as follows:
(Continued…)

18
although not all firms reported pricing for all products for all quarters.107 Pricing data reported by these firms accounted for approximately 54.4 percent of U.S. producers’ U.S. commercial shipments of carton closing staples and 43.7 percent of reported U.S. commercial shipments of subject imports from China in 2016.108
The pricing data show that subject imports from China undersold the domestic like product (i.e., sales of ***) in 39 of 48 quarterly price comparisons.109 The margins of underselling ranged from 2.0 percent to 16.0 percent, with an average margin of underselling of 9.5 percent.110 There were 3.3 billion subject carton closing staples involved in the underselling comparisons and 393 million subject carton closing staples involved in the overselling comparisons.111 112
Given the high degree of substitutability between the subject imports and the domestic like product, we find this pervasive underselling to be significant for the purposes of this preliminary determination.
We do not find that subject imports depressed prices of the domestic like product to a significant degree. The pricing data indicate that from 2014 to 2016 prices for domestically produced products increased for two pricing products and decreased for the other two pricing products.113 Moreover, ISM stated that it could not lower prices to meet those for subject imports and that it instead focused on maintaining prices, cutting costs, and increasing sales volume.114
We also do not find that subject imports prevented increases in prices of the domestic like product that otherwise would have occurred to a significant degree. ISM’s ratio of the cost of goods sold (“COGS”) to net sales was high but improved over the period of investigation,
(…Continued)
Product 1.—Stick staple, size A 7/8” or equivalent. Product 2.—Stick staple, size C 5/8’ or equivalent. Product 3.—Roll staple, size GR1 5/8” or equivalent. Product 4.—Roll staple, size RR1 5/8’ or equivalent.
107 CR at V‐5, PR at V‐3. 108 CR at V‐5, PR at V‐3. 109 Derived from CR/PR at Table V‐8. 110 Derived from CR/PR at Table V‐8. 111 Derived from CR/PR at Table V‐8. 112 Purchaser responses to the Commission’s lost sales and lost revenue survey were mixed. Of
the nine responding purchasers, seven reported that they have purchased subject imports instead of domestically produced product since 2014. However, only two of these purchasers reported that subject import prices were lower than those for the domestically produced product and one of these purchasers reported that price was a primary reason for its decision to shift its purchases from the domestic like product to subject imports. No responding purchaser reported that U.S. producers had reduced prices in order to compete with subject imports. CR at V‐18, PR at V‐9, CR/PR at Table V‐10.
113 CR at V‐14, PR at V‐7, CR/PR at Table V‐7. *** for products 1 and 3 increased from 2014 to 2016. *** prices for products 2 and 4 decreased *** percent and *** percent, respectively, suggesting some price depression for those products. Id.
114 Conference Tr. at 8 (Drake), 12 (Farah).

19
likely as a result of cost‐cutting measures by ISM.115 Moreover, the fact that raw material costs appear to have fluctuated or declined over the period of investigation may have made it less likely that ISM would have been able to raise prices.116
On the basis of the record in the preliminary phase of this investigation, we find that there was significant underselling of the domestic like product by subject imports. As a result of this underselling, subject imports gained market share at the expense of the domestic industry.
E. Impact of the Subject Imports117
Section 771(7)(C)(iii) of the Tariff Act provides that the Commission, in examining the impact of the subject imports on the domestic industry, “shall evaluate all relevant economic factors which have a bearing on the state of the industry.” These factors include output, sales, inventories, capacity utilization, market share, employment, wages, productivity, gross profits, net profits, operating profits, cash flow, return on investment, return on capital, ability to raise capital, ability to service debt, research and development, and factors affecting domestic prices. No single factor is dispositive and all relevant factors are considered “within the context of the business cycle and conditions of competition that are distinctive to the affected industry.”118
The production of ISM, the sole producer in the domestic industry, fluctuated over the period of investigation, decreasing from *** staples in 2014 to *** staples in 2015, and increasing to *** staples in 2016.119 Its capacity remained stable during this period at *** staples.120 Its capacity utilization decreased from *** percent in 2014 to *** percent in 2015, and increased to *** percent in 2016.121 Its U.S. shipments declined from *** staples in 2014 to *** staples in 2015 and *** staples in 2016.122 As observed above, ISM’s market share declined from *** percent in 2014 to *** percent in 2015 and *** percent in 2016.123 Its end‐
115 CR/PR at Table C‐2. ISM’s ratio of COGS to net sales improved from *** percent in 2014 to
*** percent in 2015, and then to *** percent in 2016. Id. ISM’s cost‐cutting measures included reducing the size of its workforce, foregoing capital expenditures, and delaying research and development efforts. Petitioner’s Postconference Br. at 27‐28.
116 CR at V‐1, PR at V‐1; CR/PR at Figure V‐1. 117 In its notice initiating the antidumping duty investigation on carton closing staples from
China, Commerce reported estimated dumping margins ranging from 13.76 to 263.43 percent. Initiation of Less‐Than‐Fair‐Value Investigation, 82 Fed. Reg. at 19351, 19355.
118 19 U.S.C. § 1677(7)(C)(iii). This provision was amended by the Trade Preferences Extension Act of 2015, Pub. L. 114‐27.
119 CR/PR at Table III‐4. 120 CR/PR at Table III‐4. 121 CR/PR at Table III‐4. According to ISM, it began exporting to Mexico in 2013 in an effort to
generate additional sales volume. However, according to ISM, despite an increase in exports to Mexico in 2016 it was not able to reach a sustainable capacity utilization level. CR at III‐8, PR at III‐4. We observe that ***. CR/PR at Table C‐2.
122 CR/PR at Table C‐2. 123 CR/PR at Table C‐2.

20
of‐period inventories fluctuated but increased overall, declining from *** staples in 2014 to *** staples in 2015, and increasing to *** staples in 2016.124
ISM’s employment‐related data showed mainly declines. The number of production and related workers (“PRWs”), hours worked, wages paid, and unit labor costs all declined from 2014 to 2016.125 By contrast, hourly wages and productivity both increased over the same period.126
Many of ISM’s financial indicia improved over the period of investigation, but its performance was poor overall. ISM’s net sales values were relatively stable at $*** in 2014 and 2015 and $*** in 2016.127 As observed above, its ratio of COGS to net sales decreased from *** percent in 2014 to *** percent in 2015 and *** percent in 2016.128 Its gross profit improved from *** in 2014 to *** in 2015 and *** in 2016.129 Its operating income also improved from *** in 2014 to *** in 2015, and to *** in 2016, as did its operating income margin, which increased from *** percent in 2014 to *** percent in 2015, and then to *** percent in 2016.130
For the purpose of this preliminary determination, we find that subject imports from China had a significant impact on the domestic industry. The significant and increased volumes of subject imports that undersold the domestic like product took market share directly from ISM during the period of investigation. Due to its loss of market share, ISM’s output and revenues were worse than they would have been in the absence of subject imports, particularly as ISM had ample unused capacity with which to supply the U.S. market. Although ISM’s financial indicators showed some improvement over the period of investigation, this improvement is likely related to cost‐cutting measures that the firm undertook during this period.131
We also have examined the role of nonsubject imports. We observe that nonsubject imports’ market share was stable and relatively small over the period of investigation during a period of largely steady apparent U.S. consumption.132 Consequently, the observed declines in
124 CR/PR at Table C‐2. 125 CR/PR at Table C‐2. 126 CR/PR at Table C‐2. 127 CR/PR at Table C‐2. ISM *** capital expenditures or research and development expenses
during the period of investigation. CR at VI‐10, PR at VI‐2. 128 CR/PR at Table C‐2. 129 CR/PR at Table C‐2. 130 CR/PR at Table C‐2. 131 As observed earlier, ISM’s cost‐cutting measures include reducing the size of its workforce,
foregoing capital expenditures, and delaying research and development efforts. Petitioner’s Postconference Br. at 27‐28. These measures are reflected in decreases in ISM’s selling, general, and administrative (“SG&A") expenses, unit SG&A expenses, and unit labor costs. See CR/PR at Table C‐2. SG&A expenses decreased from $*** in 2014 to $*** in 2015 and $*** in 2016, while unit SG&A expenses declined from $*** in 2014 and 2015 to $*** in 2016. CR/PR at Table C‐2. Unit labor costs declined from $*** in 2014 to $*** in 2015 and $*** in 2016. CR/PR at Table C‐2.
132 Nonsubject imports’ market share was *** percent in 2014, *** percent in 2015, and *** percent in 2016. CR/PR at Table C‐2.

21
ISM’s market share and its levels of output and revenues cannot be explained by nonsubject imports.
VII. Conclusion
For the reasons stated above, we determine that there is a reasonable indication that an industry in the United States is materially injured by reason of subject imports of carton closing staples from China that are allegedly sold in the United States at less than fair value.


I‐1
PART I: INTRODUCTION
BACKGROUND
This investigation results from petitions filed with the U.S. Department of Commerce (“Commerce”) and the U.S. International Trade Commission (“USITC” or “Commission”) by North American Steel & Wire, Inc./ISM Enterprises (“ISM”), Butler, Pennsylvania, on March 31, 2017, alleging that an industry in the United States is materially injured and threatened with material injury by reason of less‐than‐fair‐value (“LTFV”) imports of carton closing staples (“staples”) 1 from China. The following tabulation provides information relating to the background of this investigation.2 3
Effective date Action March 31, 2017 Petitions filed with Commerce and the Commission;
institution of Commission investigation (82 FR 17036, April 7, 2017)
April 20, 2017 Commission’s staff conference April 20, 2017 Commerce’s notice of initiation (82 FR 19351, April 27,
2017) May 12, 2017 Commission’s vote May 15, 2017 Commission’s determination May 22, 2017 Commission’s views
STATUTORY CRITERIA AND ORGANIZATION OF THE REPORT
Statutory criteria
Section 771(7)(B) of the Tariff Act of 1930 (the “Act”) (19 U.S.C. § 1677(7)(B)) provides
that in making its determinations of injury to an industry in the United States, the Commission‐‐
shall consider (I) the volume of imports of the subject merchandise, (II) the effect of imports of that merchandise on prices in the United States for domestic like products, and (III) the impact of imports of such merchandise on domestic producers of domestic like products, but only in
1 See the section entitled “The Subject Merchandise” in Part I of this report for a complete description of the merchandise subject in this proceeding.
2 Pertinent Federal Register notices are referenced in appendix A, and may be found at the Commission’s website (www.usitc.gov).
3 A list of witnesses appearing at the conference is presented in appendix B of this report.
I‐2
the context of production operations within the United States; and. . . may consider such other economic factors as are relevant to the determination regarding whether there is material injury by reason of imports.
Section 771(7)(C) of the Act (19 U.S.C. § 1677(7)(C)) further provides that‐‐4
In evaluating the volume of imports of merchandise, the Commission shall consider whether the volume of imports of the merchandise, or any increase in that volume, either in absolute terms or relative to production or consumption in the United States is significant.. . .In evaluating the effect of imports of such merchandise on prices, the Commission shall consider whether. . .(I) there has been significant price underselling by the imported merchandise as compared with the price of domestic like products of the United States, and (II) the effect of imports of such merchandise otherwise depresses prices to a significant degree or prevents price increases, which otherwise would have occurred, to a significant degree.. . . In examining the impact required to be considered under subparagraph (B)(i)(III), the Commission shall evaluate (within the context of the business cycle and conditions of competition that are distinctive to the affected industry) all relevant economic factors which have a bearing on the state of the industry in the United States, including, but not limited to. . . (I) actual and potential decline in output, sales, market share, gross profits, operating profits, net profits, ability to service debt, productivity, return on investments, return on assets, and utilization of capacity, (II) factors affecting domestic prices, (III) actual and potential negative effects on cash flow, inventories, employment, wages, growth, ability to raise capital, and investment, (IV) actual and potential negative effects on the existing development and production efforts of the domestic industry, including efforts to develop a derivative or more advanced version of the domestic like product, and (V) in {an antidumping investigation}, the magnitude of the margin of dumping.
In addition, Section 771(7)(J) of the Act (19 U.S.C. § 1677(7)(J)) provides that—5 (J) EFFECT OF PROFITABILITY.—The Commission may not determine that there is no material injury or threat of material injury to an industry in the United States merely because that industry is profitable or because the performance of that industry has recently improved.
4 Amended by PL 114‐27 (as signed, June 29, 2015), Trade Preferences Extension Act of 2015. 5 Amended by PL 114‐27 (as signed, June 29, 2015), Trade Preferences Extension Act of 2015.
I‐3
Organization of report
Part I of this report presents information on the subject merchandise, alleged dumping margins, and domestic like product. Part II of this report presents information on conditions of competition and other relevant economic factors. Part III presents information on the condition of the U.S. industry, including data on capacity, production, shipments, inventories, and employment. Parts IV and V present the volume of subject imports and pricing of domestic and imported products, respectively. Part VI presents information on the financial experience of U.S. producers. Part VII presents the statutory requirements and information obtained for use in the Commission’s consideration of the question of threat of material injury as well as information regarding nonsubject countries.
MARKET SUMMARY
Carton closing staples generally are used in fastening devices used to secure or close the flaps of corrugated and solid paperboard cartons and boxes. The leading U.S. producer of carton closing staples is ISM,6 while the known leading producers of carton closing staples outside the United States include Tianjin Jinxinshenglong Metal Produce Co., Lt. (“Tianjin”) and Zhejiang Best Nail Industrial Co., Ltd. (“Zhejiang”) of China and Josef Kihlberg of Sweden. The leading U.S. importers of carton closing staples from China are ***. Leading importers of carton closing staples from nonsubject countries (primarily Sweden, Austria, and Korea) include ***. The leading purchasers of carton closing staples include ***, all of whom are distributors.
Apparent U.S. consumption of carton closing staples totaled approximately *** and *** in 2016. Currently, one firm is known to produce carton closing staples in the United States. U.S. producers’ U.S. shipments of carton closing staples totaled approximately *** staples or *** in 2016, and accounted for *** percent of apparent U.S. consumption by quantity and *** percent by value. U.S. imports from China totaled approximately *** staples and *** in 2016 and accounted for *** percent of apparent U.S. consumption by quantity and *** percent by value. U.S. imports from nonsubject sources totaled approximately *** and *** in 2016 and accounted for *** percent of apparent U.S. consumption by quantity and *** percent by value.
SUMMARY DATA AND DATA SOURCES
A summary of data collected in this investigation is presented in appendix C, table C‐1.
Except as noted, U.S. industry data are based on questionnaire responses of ISM and SBD, the two firms that accounted for all confirmed U.S. production of carton closing staples since 2014. U.S. imports are based on the questionnaire responses of 13 firms that accounted for at least
6 ***. *** producer questionnaire, question II‐2.

I‐4
two‐thirds of the U.S. imports of carton closing staples.7 Four foreign producers submitted questionnaire responses that accounted for less than one half of production in China.8 9
PREVIOUS AND RELATED INVESTIGATIONS
Carton closing staples has been the subject of one prior antidumping duty investigation in the United States. ISM filed a petition in December 1982 alleging that an industry in the United States was materially injured and threatened with material injury by reason of LTFV imports of carton closing staples and nonautomatic carton closing staple machines from Sweden.10 In this previous investigation, staples in roll form were not included in the scope, and petitioners did not advocate for them to be included in the domestic like product.11 Following notification of its final affirmative determination by Commerce that imports of carton closing staples and nonautomatic carton closing staple machines from Sweden were being sold at LTFV, the Commission determined on November 8, 1983 that an industry in the United States was materially injured by reason of imports from Sweden of carton closing staples, which are being, or are likely to be, sold in the United States at LTFV.12 On June 7, 1994, Commerce published a
7 The Commission issued questionnaires to 66 firms identified in the petition, along with firms that, based on a review of data provided by *** included an additional *** potential U.S. importers. Due to the variety of products imported under HTSUS subheading 8305.20, many of the responding firms did not import carton closing staples during 2014‐16, but instead imported nails. Based on ***, *** firms imported more than *** under HTSUS statistical reporting numbers 8305.20.0000 and 7317.00.6560 between 2014 and 2016. Of the *** firms identified, staff received responses from *** firms, indicating whether they imported carton closing staples during 2014‐16. The *** firms identified account for approximately *** percent of all imports under the previously mentioned HTSUS statistical reporting numbers, while staff received useable questionnaire responses from *** of the top *** firms that imported more than *** short tons, during 2014‐16, while the other *** firms provided staff with “NO” responses.
8 Based on the combined estimates from foreign producers *** Foreign producer questionnaire response, section II‐6.
9 *** submitted a foreign producer questionnaire, but the data submitted largely replicated *** foreign producer questionnaire. ***. The data used was based on *** questionnaire response. *** foreign producer questionnaire responses.
10 Carton‐Closing Staples and Nonautomatic Carton‐Closing Staple Machines from Sweden, Inv. Nos. 731‐TA‐116 and 117 (Preliminary), USITC Publication 1342, January 1983.
11 Carton‐Closing Staples and Nonautomatic Carton‐Closing Staple Machines from Sweden, Inv. Nos. 731‐TA‐116 and 117 (Final), USITC Publication 1454, December 1983.
12 In addition to its determination on carton closing staples, the Commission also determined that an industry “in the United States was materially injured by reason of imports from Sweden of nonautomatic carton‐closing staple machines.” Carton‐Closing Staples and Nonautomatic Carton‐Closing Staple Machines from Sweden, Inv. Nos. 731‐TA‐116 and 117 (Final), USITC Publication 1454, December 1983, p.7.

I‐5
notice of the revocation of the antidumping duty order on carton closing staples and nonautomatic carton closing staple machines from Sweden.13
NATURE AND EXTENT OF ALLEGED SALES AT LTFV
Alleged sales at LTFV
On April 27, 2017, Commerce published a notice in the Federal Register of the initiation of its antidumping duty investigation on carton closing staples from China.14 Commerce has initiated an antidumping duty investigation based on the estimated dumping margins of 13.76 percent to 263.43 percent for carton closing staples from China.
THE SUBJECT MERCHANDISE
Commerce’s scope
Commerce has defined the scope of this investigation as follows:
Carton‐closing staples may be manufactured from carbon, alloy, or stainless steel wire, and are included in the scope of the investigation regardless of whether they are uncoated or coated, regardless of the type of coating. Carton‐closing staples are generally made to American Society for Testing and Materials (ASTM) specification ASTM D1974/D1974M‐16, but can also be made to other specifications. Regardless of specification, however, all carton‐closing staples meeting the scope description are included in the scope. Carton‐closing staples include stick staple products, often referred to as staple strips, and roll staple products, often referred to as coils. Stick staples are lightly cemented or lacquered together to facilitate handling and loading into stapling machines. Roll staples are taped together along their crowns. Carton‐closing staples are covered regardless of whether they are imported in stick form or roll form. Carton‐closing staples vary by the size of the wire, the width of the crown, and the length of the leg. The nominal leg length ranges from 0.4095 inch to 1.375 inches and the nominal crown width ranges from 1.125 inches to 1.375 inches. The size of the wire used in the production of carton‐closing staples varies from 0.029 to 0.064 inch (nominal thickness) by 0.064 to 0.100 inch (nominal width).Carton‐closing staples subject to this
13 Carton‐Closing Staples and Nonautomatic Carton‐Closing Staple Machines from Sweden, Revocation of Antidumping Duty Orders, 59 FR 29416, June 7, 1994.
14 Carton closing staples from China (Preliminary) Initiation of Less‐Than‐Fair‐Value Investigation, 82 FR 19351, April 27, 2017.

I‐6
investigation are currently classifiable under subheadings 8305.20.00.00 and 7317.00.65.60 of the Harmonized Tariff Schedule of the United States (“HTSUS”). While the HTSUS subheadings and ASTM specification are provided for convenience and for customs purposes, the written description of the subject merchandise is dispositive.15
Tariff treatment
Based upon the scope set forth by the Department of Commerce, information available to the Commission indicates that the merchandise subject to this investigation is imported under the following provisions of the 2017 HTS: 8305.20.00 (statistical reporting number 8305.20.0000) for staples in strips and 7317.00.65 (statistical reporting number 7317.00.6560) for staples other than those included in HTS heading 8305. Imports classifiable in HTS 8305.20.00 and 7317.00.65 are free of duty when they are the product of normal trade relations countries, including China.16
THE PRODUCT
Description and applications
Carton closing staples are fastening devices used to secure or close the flaps of corrugated and solid paperboard cartons and boxes.17 Carton closing staples are manufactured from steel wire which is cut and shaped into a staple consisting of two legs connected by a crown. Carton closing staples commonly have a copper or a zinc (galvanized) coating.18 Carton closing staples are sold as stick staple products, often referred to as staple strips, and roll staple products, often referred to as coils. The petitioner’s products contain 50 staples per stick and 1,000 staples per roll19 but the numbers of staples in sticks and rolls could vary. Stick staples are lightly cemented or lacquered together to facilitate handling and loading into staple machines. Roll staples are taped together along their crowns.20 Stick and roll products are interchangeable in terms of their final use. Once the staples are fastened to the box or carton they are indistinguishable.21 See figure I‐1 for images of the subject carton closing staple products.
15 Carton closing staples from China (Preliminary) Initiation of Less‐Than‐Fair‐Value Investigation, 82 FR 19351, April 27, 2017.
16 Decisions on the tariff classification and treatment of imported goods are within the authority of the U.S. Customs and Border Protection.
17 Petition, p. I‐8. 18 Petition, p. I‐8. 19 Conference transcript, p. 44 and 59 (Tyndall). 20 Petition, p. I‐8. 21 Conference transcript, pp. 16‐17 (Tyndall).
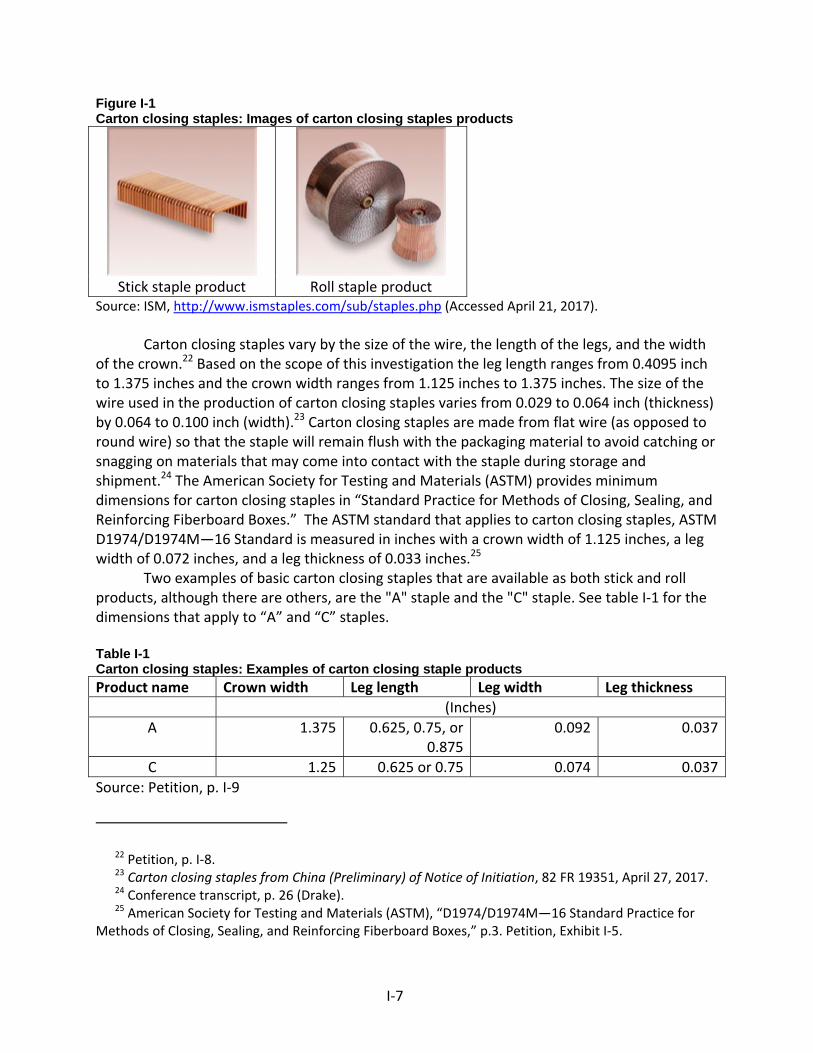
I‐7
Figure I-1 Carton closing staples: Images of carton closing staples products
Stick staple product Roll staple product
Source: ISM, http://www.ismstaples.com/sub/staples.php (Accessed April 21, 2017).
Carton closing staples vary by the size of the wire, the length of the legs, and the width of the crown.22 Based on the scope of this investigation the leg length ranges from 0.4095 inch to 1.375 inches and the crown width ranges from 1.125 inches to 1.375 inches. The size of the wire used in the production of carton closing staples varies from 0.029 to 0.064 inch (thickness) by 0.064 to 0.100 inch (width).23 Carton closing staples are made from flat wire (as opposed to round wire) so that the staple will remain flush with the packaging material to avoid catching or snagging on materials that may come into contact with the staple during storage and shipment.24 The American Society for Testing and Materials (ASTM) provides minimum dimensions for carton closing staples in “Standard Practice for Methods of Closing, Sealing, and Reinforcing Fiberboard Boxes.” The ASTM standard that applies to carton closing staples, ASTM D1974/D1974M—16 Standard is measured in inches with a crown width of 1.125 inches, a leg width of 0.072 inches, and a leg thickness of 0.033 inches.25
Two examples of basic carton closing staples that are available as both stick and roll products, although there are others, are the "A" staple and the "C" staple. See table I‐1 for the dimensions that apply to “A” and “C” staples.
Table I-1 Carton closing staples: Examples of carton closing staple products Product name Crown width Leg length Leg width Leg thickness
(Inches)
A 1.375 0.625, 0.75, or 0.875
0.092 0.037
C 1.25 0.625 or 0.75 0.074 0.037
Source: Petition, p. I‐9
22 Petition, p. I‐8. 23 Carton closing staples from China (Preliminary) of Notice of Initiation, 82 FR 19351, April 27, 2017. 24 Conference transcript, p. 26 (Drake). 25 American Society for Testing and Materials (ASTM), “D1974/D1974M—16 Standard Practice for
Methods of Closing, Sealing, and Reinforcing Fiberboard Boxes,” p.3. Petition, Exhibit I‐5.

I‐8
Manufacturing processes26
During the manufacturing process for carton closing staples, steel wire rod 27 is formed into staples using five main steps: drawing, annealing, pickling, plating, and forming. During the drawing stage, steel wire rod is drawn28 to the desired diameter of wire29 and then wound onto spools. The wire is then run through an annealing furnace that is heated to 1,100 degrees Celsius. The annealing process heats the wire to soften it before it is drawn to its final size. After annealing, the wire is treated with acid, water, heat, and electrical current during the pickling process to clean any impurities from the surface of the wire. Any impurities on the wire would cause the copper or zinc coating that is applied later in the process to flake off. After pickling, the wire is coated with copper or zinc through an electroplating process. During electroplating, copper or zinc bars are dissolved into a chemical solution. The wire is then passed through the solution while an electric current is applied to the solution which causes the copper or zinc to plate onto the surface of the wire. After the plating process, the wire is drawn again, this time to the width and thickness specifications of the desired staple product. After the wire is wound onto spools it is ready to be fed into the machines that will shape the wire into the final product, carton closing staples. Following plating, the wire is formed into staples. For the formation of stick products, 50 wires are fed together into a machine where glue is applied to adhere the wires to one another. The wires are fed through an oven to cure the glue and then fed into a press, where the wires are cut and punched into the final product, a stick containing 50 staples. The sticks of staples are then given a visual quality control check and are manually packaged into cartons. For roll products, two wires are fed into a machine which cuts and flattens the wires into their final form. The formed staples are then adhered to one another with melted tape to form a roll of 1,000 staples. After the roll is formed, tape is manually applied to the outside of the roll to keep it secure and then the rolls are manually packaged into cartons.
26 Unless otherwise noted, the following discussion is from the conference transcript, pp. 57‐60 (Tyndall).
27 Petitioner reported purchasing 1006 carbon wire rod with a diameter of {7/32nds} of an inch. The petitioner buys steel wire rod directly from mills and from distributors (both domestic and foreign, with price driving the decision), although purchasing directly from the mill can be less desirable because the mills seek guaranteed commitments that certain volumes will be purchased, while distributors are more willing to sell smaller amounts on a spot basis. Conference transcript, p. 69 (Tyndall).
28 Drawing is the process of pulling a wire through a die or a series of dies to reduce its cross section. Source: Will Kastner in Manufacturing Business Technology, “Application overview: Wire drawing,” https://www.mbtmag.com/article/2013/03/application‐overview‐wire‐drawing, (Accessed April 25, 2017).
29 Petitioner reported drawing steel wire rod down to an initial diameter of 0.085 inch in this stage of the manufacturing process. Conference transcript, p. 57 (Tyndall).

I‐9
DOMESTIC LIKE PRODUCT ISSUES
No issues with respect to domestic like product have been raised in this investigation. The petitioner proposes a single domestic like product that is co‐extensive with the product that is the subject of this investigation: carton closing staples.30 The petitioner contends that the domestic like product should not be expanded beyond the scope to include other types of staples.31
30 See 19 U.S.C. § 1677(10). 31 Petitioner’s postconference brief, pp. 12‐13.


II‐1
PART II: CONDITIONS OF COMPETITION IN THE U.S. MARKET
U.S. MARKET CHARACTERISTICS
Carton closing staples are used for closing and reinforcing paperboard boxes. Most carton closing staples are produced to standard sizes and specifications, and producers manufacture and advertise staples that fit other producers’ staple tools.1 Staple tools offered by manufacturers may have slightly different specifications for the staples that fit their tools; however, U.S. and foreign manufacturers produce staples that meet these specifications.2
Staples are sold in sticks and rolls, depending on the type of stapling tool. Rolls are typically used in higher volume applications than stick staples since they are sold in 1,000 to 5,000 staples per roll and thus, require fewer changeovers.3
Apparent U.S. consumption of carton closing staples increased slightly during 2014‐16. Overall, apparent U.S. consumption in 2016 was *** percent higher than in 2014.
CHANNELS OF DISTRIBUTION
Carton closing staples typically are sold through distributors, which sell both domestic
and imported products.4 ISM stated that the majority of its sales are to distributors, and that more than 90 percent of these distributors also purchase carton closing staples from China.5 ISM also stated that Bostitch has its own distribution network that is more tightly controlled than other distribution, and that its prices may therefore be sometimes higher.6 However, ISM further explained that although Bostitch may limit the number of distributors it uses in a given region, these distributors also typically sell staples produced by other manufacturers.7 One national distributor of fasteners advertises seven different brands of carton closing staples on its website, including Axxis, BeA, Bostitch, Interchange, ISM, Josef Kihlberg, and PSI.8
Both U.S. producers and importers sold mainly to distributors, as shown in table II‐1.
1 Conference transcript, p. 7 (Drake), p. 18 (Tyndall). Petitioner’s postconference brief, p. 15. 2 Conference transcript, p. 48 (Drake). 3 Conference transcript, p. 17 (Tyndall). 4 Conference transcript, p. 7 (Drake). 5 Conference transcript, p. 18 (Tyndall). 6 Conference transcript, p. 47 (Farah). 7 Petitioner’s postconference brief, Answers to Staff Questions 3. 8 Southern Carlson website, www.southerncarlson.com, retrieved May 2, 2017. Petitioner cites
examples of distributors ASC and Salco selling multiple brands of carton closing staples. Petitioner’s postconference brief, Answers to Staff Questions 3.

II‐2
Table II-1 Carton closing staples: U.S. producers’ and importers’ U.S. commercial shipments, by sources and channels of distribution, 2014-16
Item
Calendar year 2014 2015 2016
Share of commercial U.S. shipments (percent) U.S. producers: Distributors *** *** ***
End users *** *** ***U.S. importers: China: Distributors 86.8 86.2 82.3
End users 13.2 13.8 17.7U.S. importers: All other sources: Distributors 73.1 71.9 67.1
End users 26.9 28.1 32.9 Source: Compiled from data submitted in response to Commission questionnaires.
GEOGRAPHIC DISTRIBUTION
U.S. producers and importers reported selling carton closing staples to all regions in the United States (table II‐2). For U.S. producer ISM, *** percent of sales were within 100 miles of its production facility, *** percent were between 101 and 1,000 miles, and *** percent were over 1,000 miles. Importers sold 25 percent within 100 miles of their U.S. point of shipment, 58 percent between 101 and 1,000 miles, and 17 percent over 1,000 miles.
Table II-2 Carton closing staples: Geographic market areas in the United States served by U.S. producers and importers
Region U.S. producers Subject U.S. importers Northeast 2 6Midwest 2 9Southeast 2 8Central Southwest 2 8Mountains 2 8Pacific Coast 2 10Other1 2 2All regions (except Other) 2 5Reporting firms 2 12
1 All other U.S. markets, including AK, HI, PR, and VI. Source: Compiled from data submitted in response to Commission questionnaires.

II‐3
SUPPLY AND DEMAND CONSIDERATIONS
U.S. supply
Domestic production9
Based on available information, ISM has the ability to respond to changes in demand with large changes in the quantity of shipments of U.S.‐produced carton closing staples to the U.S. market. The main contributing factors to this degree of responsiveness of supply are the availability of unused capacity or inventories and ability to shift shipments from alternate markets. A factor mitigating responsiveness of supply is a limited ability to shift production to or from alternate products.
Industry capacity10
ISM’s capacity utilization was very low during 2014‐16, and increased irregularly from *** percent in 2014 to *** percent in 2016. ISM’s capacity *** and its production ***. This low level of capacity utilization suggests that ISM may have a substantial ability to increase production of carton closing staples in response to an increase in prices.
Alternative markets
ISM’s exports, as a percentage of total shipments, increased from *** percent to *** percent, as a result of increased export shipments and decreased U.S. shipments. This level of exports indicates that ISM may have the ability to shift shipments between the U.S. market and other markets in response to price changes. ISM exports carton closing staples to Mexico, with most of these exports going to one customer.11
Inventory levels
ISM’s inventories relative to total shipments increased irregularly from *** percent in 2014 to *** percent in 2016. These inventory levels suggest that ISM may have some ability to respond to changes in demand with changes in the quantity shipped from inventories.
9 ISM is currently the only U.S. producer of carton closing staples. ***. 10 Additional information concerning ISM’s capacity is presented in part III. 11 Conference transcript, pp. 40‐42 (Farah).
II‐4
Production alternatives
ISM stated that it could not switch production from carton closing staples to other products. ISM does not produce other products besides carton closing staples in its manufacturing plant.12
Subject imports from China13
Based on available information, responding Chinese producers of carton closing staples have the ability to respond to changes in demand with moderate changes in the quantity of shipments of carton closing staples to the U.S. market. The main contributing factors to this degree of responsiveness of supply are some availability of unused capacity and some ability to shift shipments from alternate markets. Factors mitigating responsiveness of supply include limited availability of inventories and a limited ability to shift production to or from alternate products.
Industry capacity
The capacity utilization of responding Chinese producers increased irregularly from *** percent 2014 to *** percent in 2016. Chinese capacity and production both increased from 2014 to 2016. This level of capacity utilization suggests that China producers may have some ability to increase production of carton closing staples in response to an increase in prices.
Alternative markets
China shipments to markets other than the United States, as a share of total shipments, decreased irregularly from 2014 to 2016. Shipments to the Chinese home market and shipments to other export markets were both lower in 2016 than in 2014, on an absolute basis and as a share of total shipments. In 2016, about *** of Chinese producers’ shipments were to the U.S. market, *** percent were to the Chinese home market, and *** percent were to third‐country export markets. This information indicates that Chinese producers may have some ability to shift shipments between domestic or other markets and the U.S. market in response to price changes.
Inventory levels
Responding Chinese producers’ inventories were equivalent to less than *** percent of their total shipments in 2014‐16. These inventory levels suggest that responding Chinese
12 Conference transcript, p. 36 (Farah). 13 For data on the number of responding foreign firms and their share of U.S. imports from China,
please refer to Part I, “Summary Data and Data Sources.”

II‐5
producers may have a limited ability to respond to changes in demand with changes in the quantity shipped from inventories.
Production alternatives
Three of the four responding foreign producers stated that they could not switch production from carton closing staples to other products. One responding Chinese producer, ***, which accounted for *** percent of total reported Chinese production, reported that it produces other staples and nails on the same machinery used to produce carton closing staples.
Nonsubject imports
Nonsubject imports accounted for 7.0 percent of total U.S. imports in 2016. Sweden was the largest nonsubject source of imports of carton closing staples during 2014‐16. Other reported sources of nonsubject imports were Austria and Korea. ***.
Supply constraints
ISM stated that it is unable to meet orders for certain low volume carton closing staples for which t it does not hold inventory.14 It reported that ***.
No importer reported constraints in its ability to supply carton closing staples. However, importer *** reported supply issues with ISM, ***, and ISM was unable to provide a delivery date. *** stated that “lead times and reliability are crucial in this industry.” ***.
U.S. demand
Based on available information, the overall demand for carton closing staples is likely to experience small‐to‐moderate changes in response to changes in price. The main contributing factors are the availability of substitute products but the small cost share of carton closing staples in end‐use products.
End uses and cost share
U.S. demand for carton closing staples depends on the demand for U.S.‐produced carton packaging. Carton closing staples account for a very small share of the cost of the end‐use products in which they are used. *** reported that carton closing staples account for less than 1 percent of the cost of a carton.
14 Petitioner’s postconference brief, p. 14. ISM shipped *** percent of its product from inventory in 2016.

II‐6
Business cycles
Most firms (*** and 11 of 13 importers) indicated that the market was not subject to business cycles or distinct conditions of competition. A few firms noted business cycles or other conditions of competition. *** stated that holidays, vegetable growing seasons, and tax seasons affected demand. *** stated that market demand is driven by a large number of markets and products which use cardboard box packaging fastened with carton closing staples. *** noted a customer preference to remove metal fasteners in cardboard boxes as a distinctive condition of competition.
Demand trends
Most firms reported no change or a decrease in U.S. demand for carton closing staples since January 1, 2014 (table II‐3). Petitioner characterized U.S. demand for carton closing staples as fairly stable.15 The four importers that indicated that demand had decreased attributed the decline to a shift to alternative fasteners such as glue and tape.
Table II-3 Carton closing staples: Firms’ responses regarding U.S. demand and demand outside the United States
Item Number of firms reporting
Increase No change Decrease Fluctuate Demand inside the United States: U.S. producers 0 2 0 0
Importers 1 5 4 2 Demand outside the United States: U.S. producers 0 2 0 0
Importers 0 3 1 1 Source: Compiled from data submitted in response to Commission questionnaires. Substitute products
Substitutes for carton closing staples include tape, glue, and plastic strapping. *** U.S. producers and 9 of 13 importers identified substitutes. Four importers indicated that changes in tape prices had affected staple prices, and three indicated that changes in glue prices had affected staple prices. *** stated that tape and glue are inexpensive and easily automated, and have created pricing pressure on staples that did not exist 15 years ago. *** stated that tape is inexpensive and does not require equipment. *** noted a decline in the market share for carton staples because of a preference for glue and tape.
15 Conference transcript, p. 43 (Farah).

II‐7
ISM stated that glue and tape have not significantly impacted demand for carton closing staples in recent years.16 It further stated that although the packaging market has grown with companies like Amazon, market‐growth areas often uses tape rather than staples.17
SUBSTITUTABILITY ISSUES
The degree of substitution between domestic and imported carton closing staples depends upon such factors as relative prices, quality (e.g., reliability of supply, defect rates, etc.), and conditions of sale (e.g., price discounts/rebates, lead times between order and delivery dates, payment terms, product services, etc.). Based on available data, staff believes that there is a high degree of substitutability between domestically produced carton closing staples and carton closing staples imported from China.
Lead times
Carton closing staples are primarily sold from inventory. ISM reported that *** percent of its 2016 U.S. commercial shipments were from inventory and *** percent were produced‐to‐order. It reported lead times of *** days from inventory and *** days for produced‐to‐order. ***.
Importers of Chinese product reported that about 79 percent of U.S. commercial shipments were from U.S. inventories, 19 percent were produced‐to‐order, and 2 percent were from foreign inventories. Most importers reported lead times from U.S. inventories of 1 to 5 days, with one importer reporting 14 days. One importer reported shipping times from foreign inventories of 60 days. Lead times reported by importers for produced‐to‐order product were generally 90 days.
Factors affecting purchasing decisions
Purchasers responding to lost sales lost revenue allegations18 were asked to identify the main purchasing factors their firm considered in their purchasing decisions for carton closing staples. The major purchasing factors identified by firms include availability, lead time, price, quality, service, and supplier reliability. Purchaser *** also cited suppliers’ ability and willingness to package staples in its brand cartons. Six of the nine responding purchasers listed price as among their top three purchasing factors, six listed quality, and five listed availability.
16 Conference transcript, pp. 44‐45 (Farah). 17 Conference transcript, p. 45 (Farah). 18 This information is compiled from responses by purchasers identified by Petitioners to the lost
sales lost revenue allegations. See Part V for additional information.

II‐8
Comparison of U.S.‐produced and imported carton closing staples
In order to determine whether U.S.‐produced carton closing staples can generally be used in the same applications as imports from China, U.S. producers and importers were asked whether the products can always, frequently, sometimes, or never be used interchangeably. As shown in table II‐4, both responding producers reported that carton closing staples from the United States and from China can *** be used interchangeably, and the 13 responding importers reported that they always or frequently can be used interchangeably. Importer *** stated that except for custom tools and custom carton closing staples, products are generally interchangeable as long as there is no production defect. Importer *** stated that interchangeability depends on the manufacturer's ability to produce to certain standards.
Table II-4 Carton closing staples: Interchangeability between carton closing staples produced in the United States and in other countries, by country pairs
Country pair U.S. producers U.S. importers
A F S N A F S N United States vs. China *** *** *** *** 9 4 0 0 United States vs. Taiwan *** *** *** *** 5 1 0 0 United States vs. Other *** *** *** *** 5 2 1 0 China vs. Taiwan *** *** *** *** 5 0 0 0 China vs. Other *** *** *** *** 5 1 0 0 Taiwan vs. Other *** *** *** *** 4 1 0 0
Note.—A=Always, F=Frequently, S=Sometimes, N=Never. Source: Compiled from data submitted in response to Commission questionnaires.
As seen in table II‐5, both U.S. producers reported that differences other than price between carton closing staples from the United States, China, and nonsubject countries were *** a significant factor in their sales of carton closing staples. Importers reported more mixed answers with six importers reporting that such differences between domestic and Chinese staples were always or frequently significant, and six reporting that they were sometimes or never significant.
Table II-5 Carton closing staples: Significance of differences other than price between carton closing staples produced in the United States and in other countries, by country pairs
Country pair U.S. producers U.S. importers
A F S N A F S N United States vs. China *** *** *** *** 4 2 4 2 United States vs. Taiwan *** *** *** *** 2 1 1 2 United States vs. Other *** *** *** *** 3 2 1 2 China vs. Taiwan *** *** *** *** 2 1 1 2 China vs. Other *** *** *** *** 2 1 2 1 Taiwan vs. Other *** *** *** *** 2 1 2 1
Note.--A = Always, F = Frequently, S = Sometimes, N = Never. Source: Compiled from data submitted in response to Commission questionnaires.
II‐9
Four importers explained their answers, noting that quality, lead times, and availability were important non‐price factors. *** stated that price “is crucial” but not the only factor, and that a supplier’s ability to supply a full package of fasteners and tools, and technical expertise are the most important factors. It also considers local stock capabilities, delivery times, tool support, and brand image. *** indicated that quality, reliability, and lead times were more significant factors than price. *** reported that it has not had contact with domestic manufacturers in more than nine years, and that it has concerns about U.S. manufacturers’ ability to consistently fill orders in a timely manner. *** stated that product quality and availability are important in supplying its end‐use customers, and it also noted a quality issue with ISM product ***.19
19 It stated, ***.

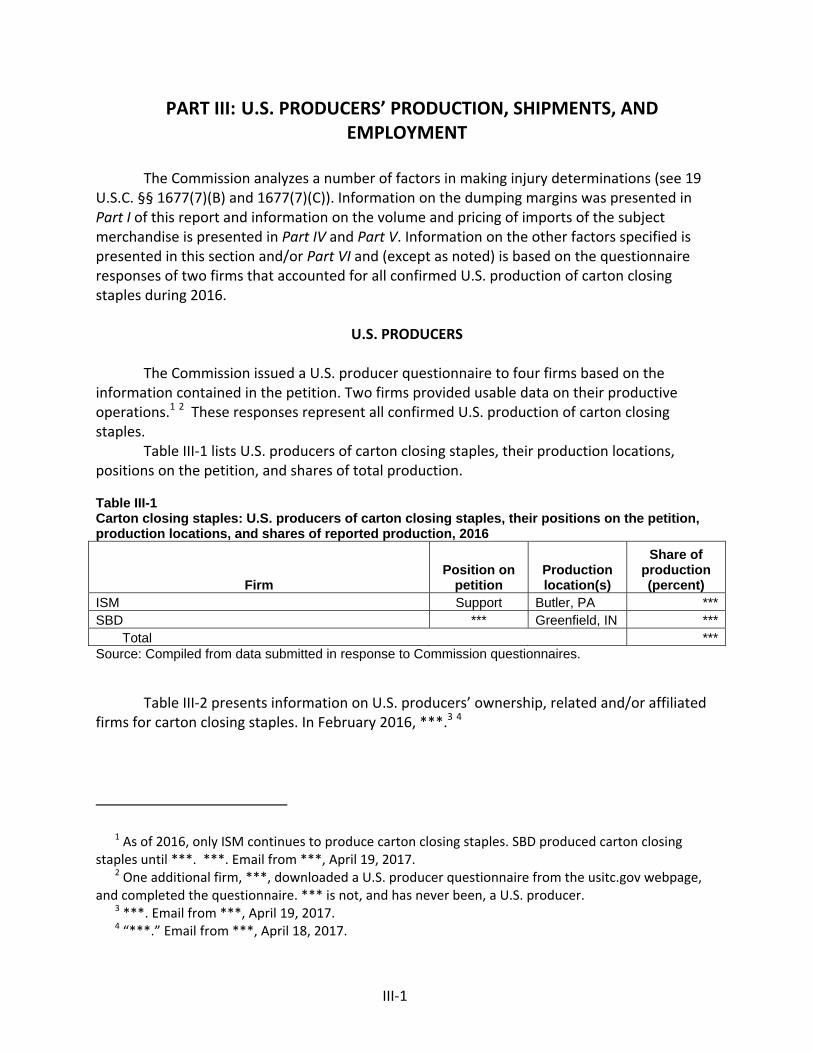
III‐1
PART III: U.S. PRODUCERS’ PRODUCTION, SHIPMENTS, AND EMPLOYMENT
The Commission analyzes a number of factors in making injury determinations (see 19 U.S.C. §§ 1677(7)(B) and 1677(7)(C)). Information on the dumping margins was presented in Part I of this report and information on the volume and pricing of imports of the subject merchandise is presented in Part IV and Part V. Information on the other factors specified is presented in this section and/or Part VI and (except as noted) is based on the questionnaire responses of two firms that accounted for all confirmed U.S. production of carton closing staples during 2016.
U.S. PRODUCERS
The Commission issued a U.S. producer questionnaire to four firms based on the information contained in the petition. Two firms provided usable data on their productive operations.1 2 These responses represent all confirmed U.S. production of carton closing staples.
Table III‐1 lists U.S. producers of carton closing staples, their production locations, positions on the petition, and shares of total production. Table III-1 Carton closing staples: U.S. producers of carton closing staples, their positions on the petition, production locations, and shares of reported production, 2016
Firm Position on
petition Production location(s)
Share of production (percent)
ISM Support Butler, PA ***SBD *** Greenfield, IN ***
Total ***Source: Compiled from data submitted in response to Commission questionnaires.
Table III‐2 presents information on U.S. producers’ ownership, related and/or affiliated firms for carton closing staples. In February 2016, ***.3 4
1 As of 2016, only ISM continues to produce carton closing staples. SBD produced carton closing staples until ***. ***. Email from ***, April 19, 2017.
2 One additional firm, ***, downloaded a U.S. producer questionnaire from the usitc.gov webpage, and completed the questionnaire. *** is not, and has never been, a U.S. producer.
3 ***. Email from ***, April 19, 2017. 4 “***.” Email from ***, April 18, 2017.
III‐2
Table III-2 Carton closing staples: U.S. producers’ ownership, related and/or affiliated firms
* * * * * * *
As indicated in table III‐2, U.S. producer *** is related to a foreign producer *** of carton closing staples, and *** is also a U.S. importer of the subject merchandise.
Table III‐3 presents U.S. producers’ reported changes in operations since January 1, 2014.
Table III-3 Carton closing staples: U.S. producers’ reported changes in operations, since January 1, 2014
* * * * * * *
U.S. PRODUCTION, CAPACITY, AND CAPACITY UTILIZATION
Table III‐4 and figure III‐1 present U.S. producers’ production, capacity, and capacity utilization (in millions of staples). From 2014 to 2016, U.S. producers’ (ISM and SBD) overall production of carton closing staples decreased by *** percent, while overall capacity decreased by *** percent.5 In 2014 and 2015, ISM and SBD produced ***, as ***. *** from 2014 to 2016, while ***. *** production increased from 2014 to 2016 by *** percent, and its capacity utilization rate increased by *** percentage points.
Table III-4 Carton closing staples: U.S. producers’ production, capacity, and capacity utilization, 2014-16
* * * * * * * Figure III-1 Carton closing staples: U.S. producers’ production, capacity, and capacity utilization, 2014-16
* * * * * * *
Between 2014 and 2016, for both U.S. producers, the average capacity utilization rate decreased by *** percentage points.6 ISM and SBD differed in each firm’s capacity utilization
5 In response to staff’s question about reaching production capacity, “we have not been at a production level to be at capacity. We have not been there yet.” Conference transcript, p.73 (Tyndall).
6 In response to staff’s question about capacity utilization and the intermittent use of the production equipment for annealing operations, ISM indicated that the equipment was being utilized at approximately one sixth or 18 percent of its hours available. During a forty hour period, ISM is running on half capacity, and they have not been at a production level to be at capacity. Conference transcript, pp. 71‐73 (Tyndall).

III‐3
during 2014‐15. From 2014 to 2016, *** produced at a *** percent overall capacity utilization rate, while *** had a *** percent overall capacity utilization rate during 2014‐15. Despite its current low capacity utilization rate, during the staff conference, ISM indicated it would like to add other machines, produce other products, and eventually fill out the capacity that it currently has available.7 The decreases in total capacity, total production, and overall capacity utilization can be mostly attributed to *** discontinuation of its U.S. production of carton closing staples.8
Alternative products
Table III‐5 presents U.S. producers’ overall capacity and production on the same equipment as carton closing staples production during 2014‐16. This table measures quantity in thousands of pounds.9 Production of carton closing staples decreased by *** percent from 2014 to 2016, while total production on the same machinery decreased by *** percent, during the same period. The overall capacity for U.S. producers decreased by *** percent, while the overall capacity utilization rate decreased by *** percentage points during 2014‐16.10 The share of production of carton closing staples increased by *** percentage points from 2014 to 2016, while the share of out‐of‐scope production decreased by ***. Table III-5 Carton closing staples: U.S. producers’ overall plant capacity and production on the same equipment as subject production, 2014-16
* * * * * * *
7 Conference transcript, p. 87 (Farah). 8 Based on the information provided to staff at the conference by company witnesses and ***
questionnaire, staff has adjusted the original nameplate or theoretical capacity numbers to reflect an “average production capacity” number as follows: ***. Additionally, the petitioner’s original capacity numbers were reported based on operating *** hours per week; however at the staff conference, the petitioner indicated that the forming machines were typically run only four ten hour shifts per week, or 40 hours per week. *** U.S. producer questionnaire response, section II‐7. Conference transcript, p. 72 (Tyndall).
9 *** calculated the production data for each year based on actual data in its records. The data for capacity were estimated by multiplying the average weight per 1,000 staples during those years (approximately *** lbs/1,000 staples), with the originally reported capacity in thousands of staples. Email from ***, May 1, 2017.
10 In response to staff’s question regarding capacity utilization, “It’s decreased significantly. So from when we started, we put all the machines back into operation. We moved them back into our building. It's just been a steady trend going down. We have huge capacity available now.” Conference transcript, p. 37 (Farah).

III‐4
U.S. PRODUCERS’ U.S. SHIPMENTS AND EXPORTS
Table III‐6 presents U.S. producers’ U.S. shipments, export shipments, and total shipments. From 2014 to 2016, the quantity of total shipments decreased by *** percent. The quantity of U.S. shipments decreased by *** percent, while the quantity of export shipments increased by *** percent during 2014‐16.11 The value of total shipments decreased by *** percent between 2014 and 2016. The value of U.S. shipments decreased by *** percent, while the value of export shipments increased by *** percent during 2014‐16.
Table III-6 Carton closing staples: U.S. producers’ U.S. shipments, exports shipments, and total shipments, 2014-16
* * * * * * *
From 2014 to 2016, the unit value for total shipments decreased by *** percent and U.S. shipments decreased by *** percent. From 2014 to 2016, the unit value for export shipments increased by *** percent. From 2014 to 2016, the shares of quantity and value for U.S. shipments decreased by *** percentage points and *** percentage points, respectively.
In the staff conference, ISM stated that its export shipments to Mexico began in 2013, and increased more recently in the past year. Counsel for ISM stated that the level of exports in 2016 represented an effort to generate sales.12 During the staff conference, ISM indicated that despite its increase in export shipments, it was not going to be able to reach a production level that it needs to be sustainable in terms of capacity utilization.13
Table III‐7 presents U.S. producers’ U.S. shipments, export shipments, and total shipments, by type (roll staple or strip staple). From 2014 to 2016, the quantity of U.S. shipments of roll staples and staple strips decreased by *** percent and *** percent, respectively. During the same period, the quantity of total shipments of roll staples and staple strips decreased by *** percent and *** percent, respectively. From 2014 to 2016, the quantity of export shipments of roll staples and staple strips increased by *** percent and *** percent, respectively.
Table III-7 Carton closing staples: U.S. producers’ U.S. shipments, exports shipments, and total shipments, by type, 2014-16
* * * * * * *
11 In response to staff’s question regarding ISM’s export shipments, “I believe the only factor that may have mitigated somewhat this massive loss of production over the long‐term is there has been some pick up in export shipments, which has allowed the company to try to make up somewhat for the loss in domestic shipments.” Conference transcript, pp. 38‐39 (Drake).
12 Conference transcript, pp. 39‐40 (Farah and Drake). 13 Conference transcript, pp. 39 (Drake).

III‐5
From 2014 to 2016, the value of U.S. shipments of roll staples and staple strips decreased by *** percent and *** percent, respectively. During the same period, the value of total shipments of roll staples and staple strips decreased by *** percent and *** percent, respectively. From 2014 to 2016, the value of export shipments of roll staples and staple strips increased by *** percent and *** percent, respectively.
From 2014 to 2016, the unit value of U.S. shipments of roll staples decreased by *** percent, and the unit value for U.S. shipments of staple strips increased by *** percent. During the same period, the unit value of total shipments of roll staples decreased by *** percent, and the unit value for U.S. shipments of staple strips increased by *** percent. From 2014 to 2016, the unit value of export shipments of roll staples and staple strips increased by *** percent and *** percent, respectively.
U.S. PRODUCERS’ INVENTORIES
Table III‐8 presents U.S. producers’ end‐of‐period inventories and the ratio of these inventories to U.S. producers’ production, U.S. shipments, and total shipments. From 2014 to 2016, U.S. producers’ end‐of‐period inventories decreased by *** percent.14 The ratios for U.S. producers’ end‐of‐period inventories to production, U.S. shipments, and total shipments all fluctuated from 2014 to 2015 and then 2015 to 2016. The ratio to U.S. production decreased by *** percentage points from 2014 to 2016, while the ratio to total shipments decreased by *** percentage points over the same period. From 2014 to 2016, U.S. producers’ U.S. shipments ratio to end‐of‐period inventories increased by *** percentage points. Table III-8 Carton closing staples: U.S. producers’ inventories, 2014-16
* * * * * * *
U.S. PRODUCERS’ IMPORTS
Table III‐9 presents data on U.S. producers’ imports during 2014‐16. Of the two U.S. producers, only *** imported carton closed staples.15 As *** production began to decline in 2015, *** imports from China increased by *** percent during 2014‐16. From 2014 to 2015, *** ratio of U.S. imports from China to U.S. production increased by *** percentage points. In 2016, *** production in the United States ceased.
14 *** reported high end‐of‐period inventories of *** in 2014, but its inventory levels dropped to approximately *** in 2015. By 2016, ***, and the increased inventory levels at the end of 2016 were due to *** increased end‐of‐period inventory. *** U.S. producer questionnaire, section II‐7.
15 *** *** importer questionnaire response, section II‐4.

III‐6
Table IlI-9 Carton closing staples: U.S. producers’ direct imports, 2014-16
* * * * * * *
U.S. EMPLOYMENT, WAGES, AND PRODUCTIVITY
Table III‐10 presents U.S. producers’ employment‐related data. Employment declined to *** PRWs in 2016, a *** percent decrease from the *** PRWs in 2014.16 From 2014 to 2016, total hours worked decreased by *** percent, while hours worked per PRW decreased by *** hours and by *** percent. From 2014 to 2016, productivity (in 1,000 staples per hour) and hourly wages both increased by *** percent and by *** percent, respectively. Wages paid during 2014‐16 decreased by *** percent, while unit labor costs (dollars per 1,000 staples) decreased by *** percent over the same period.
Table III-10 Carton closing staples: Average number of production and related workers, hours worked, wages paid to such employees, hourly wages, productivity, and unit labor costs, 2014-16
* * * * * * *
16 *** ***. *** U.S. producer questionnaire responses, section II‐9.

IV‐1
PART IV: U.S. IMPORTS, APPARENT U.S. CONSUMPTION, AND MARKET SHARES
U.S. IMPORTERS
The Commission issued importer questionnaires to 138 firms believed to be importers of subject carton closing staples, as well as to all U.S. producers of carton closing staples.1 Usable questionnaire responses were received from 13 companies, representing at least two‐thirds of U.S. imports from all sources during 2016 under HTS subheadings 8305.20.0000 and 7317.00.6560.2 Table IV‐1 lists all responding U.S. importers of carton closing staples from China and other sources, their locations, and their shares of U.S. imports, in 2016.
Table IV-1 Carton closing product: U.S. importers by source, 2016
Firm Headquarters
Share of imports by source (percent)
China Taiwan All other sources
All import
sources Active Sales Santa Fe Springs, CA *** *** *** ***Ample Sycamore, IL *** *** *** ***Axxis Hope Hull, AL *** *** *** ***BeA Greensboro, NC *** *** *** ***Fastening Montgomery, AL *** *** *** ***LMS Maplewood, MN *** *** *** ***Markwell Norwood, MA *** *** *** ***NP Sales San Diego, CA *** *** *** ***Spotnails Rolling Meadows, IL *** *** *** ***SBD Towson, MD *** *** *** ***TC International, Inc. Whittier, CA *** *** *** ***Southern Omaha, NE *** *** *** ***Youngwoo Santa Fe Springs, CA *** *** *** ***
Total *** *** *** ***Source: Compiled from data submitted in response to Commission questionnaires.
1 The Commission issued questionnaires to those firms identified in the petition, along with firms that, based on a review of data provided by ***, may have accounted for more than one percent of total imports under HTS statistical reporting numbers 8305.20.0000 and 7317.00.6560 in 2016.
2 Based on a review of data provided by ***, staff received importer questionnaire responses that accounted for approximately *** short tons of the approximate *** short tons total for HTS statistical reporting numbers 8305.20.0000 and 7317.00.6560 in 2016.

IV‐2
U.S. IMPORTS
Table IV‐2 and figure IV‐1 present data for U.S. imports of carton closing staples from China and all other sources. The quantities of U.S. imports from China increased by 45.0 percent from 2014 to 2016, while the value of U.S. imports from China increased by 37.8 percent. The quantities of U.S. imports from China increased by 35.1 percent from 2015 to 2016.3 From 2014 to 2016, the quantities of imports from nonsubject sources increased by 20.1 percent, while the value of imports from nonsubject sources increased by 11.9 percent. From 2014 to 2016, the quantity of all import sources increased by 43.0 percent, while the value of all import sources increased by 35.1 percent.
The unit value of U.S. imports from China decreased by 5.0 percent from 2014 to 2016, while the unit value of U.S. imports from all other sources decreased by 6.9 percent over the same period. From 2014 to 2016, U.S. imports from China increased as a share of quantity by 1.3 percentage points, while U.S. imports from all other sources decreased by the 1.3 percentage points. During the same period, U.S. imports from China increased as a share of value by 1.8 percentage points, while U.S. imports from all other sources decreased by the same amount. U.S. imports of carton closing staples from China accounted for more than 90 percent of all imports each year from 2014 to 2016.
From 2014 to 2016, U.S. imports from China increased as a ratio to U.S. production by *** percentage points, while U.S. imports from all other sources as a ratio increased by *** percentage points. U.S. imports from all import sources increased as a ratio to U.S. production by *** percentage points.
3 The increase of imports from China was largely due to ***. *** imports from China accounted for *** percent of the increase for all U.S. imports from China during 2015‐16. In addition, *** increased its imports from China by *** percent between 2015 and 2016. *** imports from China accounted for *** percent of the increase for all U.S. imports from China during 2015‐16. Since 2014, *** acquired other distributors, contributing to its increase of imports from China. *** combined for *** percent of the increase for all U.S. imports from China during 2015‐16. *** importer questionnaires, section II‐5a.

IV‐3
Table IV-2 Carton closing staples: U.S. imports by source, 2014-16
Item Calendar year
2014 2015 2016 Quantity (1,000 staples) U.S. imports from.-- China 2,532,762 2,718,602 3,672,978
Nonsubject sources 229,360 197,273 275,756 All import sources 2,762,122 2,915,875 3,948,734
Value (1,000 dollars) U.S. imports from.-- China 3,271 3,443 4,506
Nonsubject sources 378 321 423 All import sources 3,649 3,764 4,929
Unit value (dollars per 1,000 staples) U.S. imports from.-- China 1.29 1.27 1.23
Nonsubject sources 1.65 1.63 1.53 All import sources 1.32 1.29 1.25
Share of quantity (percent) U.S. imports from.-- China 91.7 93.2 93.0
Nonsubject sources 8.3 6.8 7.0 All import sources 100.0 100.0 100.0
Share of value (percent) U.S. imports from.-- China 89.6 91.5 91.4
Nonsubject sources 10.4 8.5 8.6 All import sources 100.0 100.0 100.0
Ratio to U.S. production U.S. imports from.-- China *** *** ***
Nonsubject sources *** *** ***All import sources *** *** ***
Source: Compiled from data submitted in response to Commission questionnaires

IV‐4
Figure IV-1 Carton closing staples: U.S. import volumes and prices, 2014-16
Source: Compiled from data submitted in response to Commission questionnaires.
U.S. IMPORTERS’ SHIPMENTS OF IMPORTS BY TYPE
Table IV‐3 presents data for U.S. importers’ U.S. shipments of carton closing staples, by type, from 2014 to 2016.
Table IV-3 Carton closing staples: U.S. importers’ U.S. shipments, by product type, 2014-16
* * * * * * *
The quantities of U.S. importers’ U.S. shipments from China increased by 26.0 percent from 2014 to 2016, while the value of U.S. importers’ U.S. shipments from China increased by 13.1 percent. From 2014 to 2016, the quantities of U.S. importers’ U.S. shipments from nonsubject sources increased by 1.7 percent, while the value of U.S. importers’ U.S. shipments from nonsubject sources increased by 3.3 percent. During 2014‐16, the quantities of U.S. importers’ U.S. shipments from all sources increased by 23.9 percent, while the value of U.S. importers’ U.S. shipments from all sources increased by 12.1 percent.
The unit value of U.S. importers’ U.S. shipments from China decreased by 10.2 percent from 2014 to 2016, while the unit value of U.S. importers’ U.S. shipments from nonsubject sources increased by 1.3 percent during 2014‐16. The unit value of U.S. importers’ U.S. shipments from all import sources decreased by 9.5 percent from 2014 to 2016. From 2014 to 2016, the share of quantity of U.S. importers’ U.S. shipments from China, nonsubject sources, and all import sources increased for U.S. shipments of roll staples, while U.S. shipments of strip staples decreased by the same amount for each corresponding import source. U.S. shipments of imports of carton closing staples from China accounted for more than 90 percent of all shipments of imports each year from 2014 to 2016.

IV‐5
NEGLIGIBILITY
The statute requires that an investigation be terminated without an injury determination if imports of the subject merchandise are found to be negligible.4 Negligible imports are generally defined in the Tariff Act of 1930, as amended, as imports from a country of merchandise corresponding to a domestic like product where such imports account for less than 3 percent of the volume of all such merchandise imported into the United States in the most recent 12‐month period for which data are available that precedes the filing of the petition or the initiation of the investigation. However, if there are imports of such merchandise from a number of countries subject to investigations initiated on the same day that individually account for less than 3 percent of the total volume of the subject merchandise, and if the imports from those countries collectively account for more than 7 percent of the volume of all such merchandise imported into the United States during the applicable 12‐month period, then imports from such countries are deemed not to be negligible.5 Imports from China accounted for 93.2 percent of total imports of carton closing staples by quantity during March 2016 through February 2017. Table IV‐4 presents data for U.S. imports in the 12‐month period preceding the filing of the petition for which data are available, March 2016 through February 2017.
Table IV-4 Carton closing staples: U.S. imports in the 12-month period preceding the filing of the petition for which data are available
Item
March 2016 through February 2017
Quantity (1,000 staples) Share of quantity
(percent) U.S. imports from.-- China 3,637,586 93.2
Nonsubject sources 266,224 6.8 All import sources 3,903,810 100.0
Source: Compiled from data submitted in response to Commission questionnaires.
APPARENT U.S. CONSUMPTION AND U.S. MARKET SHARES
Table IV‐5, figure IV‐2, and figure IV‐3 present data on apparent U.S. consumption and U.S. market shares for carton closing staples.
4 Sections 703(a)(1), 705(b)(1), 733(a)(1), and 735(b)(1) of the Act (19 U.S.C. §§ 1671b(a)(1), 1671d(b)(1), 1673b(a)(1), and 1673d(b)(1)).
5 Section 771 (24) of the Act (19 U.S.C § 1677(24)).

IV‐6
Table IV-5 Carton closing staples: U.S. shipments of domestic product, U.S. shipments of imports, and apparent U.S. consumption, 2014-16
Item Calendar year
2014 2015 2016 Quantity (1,000 staples) U.S. producers' U.S. shipments *** *** ***U.S. importers' U.S. shipments from.-- China 2,445,623 2,559,712 3,081,183
Nonsubject sources 230,983 225,867 234,977 All import sources 2,676,606 2,785,579 3,316,160
Apparent U.S. consumption *** *** *** Value (1,000 dollars) U.S. producers' U.S. shipments *** *** ***U.S. importers' U.S. shipments from.-- China 4,729 4,865 5,349
Nonsubject sources 542 529 561 All import sources 5,271 5,394 5,910
Apparent U.S. consumption *** *** *** Share of quantity (percent) U.S. producers' U.S. shipments *** *** ***U.S. importers' U.S. shipments from.-- China *** *** ***
Nonsubject sources *** *** ***All import sources *** *** ***
Share of value (percent) U.S. producers' U.S. shipments *** *** ***U.S. importers' U.S. shipments from.-- China *** *** ***
Nonsubject sources *** *** ***All import sources *** *** ***
Note.—Nonsubjecct sources include Sweden, Korea, and possibly Austria.
Source: Compiled from data submitted in response to Commission questionnaires.
Figure IV-2 Carton closing staples: Apparent U.S. consumption, 2014-16
* * * * * * * Figure IV-3 Carton closing staples: Market shares, 2014-16
* * * * * * *

IV‐7
Apparent U.S. consumption by quantity increased by *** percent during 2014‐16, while apparent U.S. consumption by value decreased by *** percent over the same period. From 2014 to 2016, U.S. producers’ U.S. shipments decreased in quantity by *** percent and decreased in value by *** percent, respectively. U.S. importers’ U.S. shipments from China increased in quantity by 26.0 percent and by 13.1 percent in value, respectively, from 2014 to 2016. From 2014 to 2016, U.S. imports from nonsubject sources increased in quantity by 1.7 percent and 3.5 percent by value, respectively.
U.S. market share data are presented in table IV‐5.6 From 2014 to 2016, U.S. producers’ share of quantity of total U.S. shipments decreased by *** percentage points, while its share of value decreased by *** percentage points. U.S. importers’ U.S. shipments from China share of the quantity increased by *** percentage points, and its share of value increased by *** percentage points.7 From 2014 to 2016, the share of total quantity of U.S. importers’ U.S. shipments from nonsubject sources increased by *** percentage points and the share of the value from nonsubject sources increased by *** percentage points.
6 In response to staff questions about filling the demand for the domestic market share (compared to China) and the total size of the market, ISM stated, “based on and again I don't have access to what the total market size is but based on what they were doing in the past it is much, much larger than what we are doing today and it's the same machines. So I am pretty confident that we could handle probably most of the domestic market.” Conference transcript, pp.84‐85 (Farah).
7 Carl Schneider, President of Axxis, *** stated that, “ISM, has no idea of the size of the market, and makes no reference to the size of the markets of competing types of closure. We feel that the current market share leaders are Stanley Bostitch (SB) and Josef Kihlberg. We believe Stanley imports from China. JK markets only through select distributors in the U.S. and all staples are imported from Sweden at a higher cost than China.” Public statement submitted by Carl Schneider, the President/Owner of Axxis, LLC. April 26, 2017.


V‐1
PART V: PRICING DATA
FACTORS AFFECTING PRICES
Raw material costs
U.S. producers’ ratio of raw materials to the total cost of goods sold decreased from *** percent in 2014 to *** percent in 2016. U.S. producers’ unit raw material costs declined by *** percent from 2014 to 2016.
Low‐carbon steel wire is the main raw material used to produce carton closing staples.1 The wire is either coated with copper or zinc. Copper is most commonly used, but zinc is used for staples that may be exposed to moisture, such as in produce packaging.2 As shown in figure V‐1, steel wire rod prices declined by *** percent in 2014, declined by *** percent in 2015, and increased by *** percent in 2016, for a net decline of *** percent during 2014‐16. During January‐March 2017, steel wire rod prices increased by *** percent.
Figure V-1 Wire rod: Monthly average U.S. prices for industrial quality low carbon wire rod, January 2014-March 2017
* * * * * * *
*** reported that raw material prices have decreased since January 1, 2014 and *** reported that they increased. Among importers, five reported an increase, four reported a decrease, and four reported that raw material costs fluctuated. Importer *** stated that raw material prices had trended down until increasing over the last 6 months. Importer *** stated that costs have increased since January 2017.
U.S. inland transportation costs
*** responding U.S. producers and 11 of 12 responding importers reported that they typically arrange transportation to their customers. *** reported U.S. inland transportation costs of *** percent and *** stated that it did know the cost of transportation. Importers reported costs of 2 to 10 percent. Nine of the 12 responding importers reported shipping from a storage facility, and three reported shipping from the point of importation.
1 ISM uses low‐carbon wire rod for its staples production. Conference transcript, p. 69 (Tyndall). 2 Conference transcript, p. 16 (Tyndall). ISM prices copper‐coated and zinc‐coated staples the same.
Conference transcript, p. 53 (Tyndall).

V‐2
PRICING PRACTICES
Pricing methods
Prices of carton closing staples vary by the size of the staples and by form, with staple rolls generally priced higher than stick staples.3
ISM reported that it publishes retail prices on its website and has three levels of discounts to its distributors based on volume of sales.4 It stated that there is no price premium for branding in the carton closing staples market.5 On the other hand, ***.
***. Most importers reported using transaction‐by‐transaction negotiations and set price lists. Two importers, ***, reported contract sales. Table V-1 Carton closing staples: U.S. producers’ and importers’ reported price setting methods, by number of responding firms1
Method U.S. producers Importers Transaction-by-transaction *** 8 Contract *** 2 Set price list *** 6 Other *** 1 Responding firms 2 13
1The sum of responses down may not add up to the total number of responding firms as each firm was instructed to check all applicable price setting methods employed. Source: Compiled from data submitted in response to Commission questionnaires.
U.S. producers and importers reported selling carton closing staples primarily in the spot market (table V‐2). ISM reported that it sells staples on a spot basis,6 with ***. ***.7 ***.
Table V-2 Carton closing staples: U.S. producers’ and importers’ shares of U.S. commercial shipments by type of sale, 2016
* * * * * * *
3 Petition, p. I‐6. 4 Conference transcript, pp. 49‐50 (Tyndall). ***. 5 Conference transcript, p. 46 (Farah). 6 Conference transcript, p. 18 (Tyndall). 7 ***.

V‐3
Sales terms and discounts
***. Most importers reported that they typically quote prices on an f.o.b. basis.8 *** ISM indicated at the staff conference that it provides discounts based on volume of sales. ***. Nine of the 13 responding importers reported no discount policy, four reported quantity discounts, and two reported total volume discounts.
*** U.S. producers and all 12 responding importers reported sales terms of net 30 days, with one importer also offering terms of net 60 and one also offering terms of 2/10 net 30.
PRICE DATA
The Commission requested U.S. producers and importers of Chinese product to provide quarterly data for the total quantity and f.o.b. value of the following carton closing staples products shipped to unrelated U.S. distributors during 2014‐16.9
Product 1.‐‐ Stick staple, size A 7/8” or equivalent. Product 2.‐‐ Stick staple, size C 5/8” or equivalent. Product 3.‐‐ Roll staple, size GR1 5/8” or equivalent. Product 4.‐‐ Roll staple, size RR1 5/8” or equivalent.
For the stick staple products (1 and 2), size A has a crown of 1 3/8 inches and size C has a crown of 1 ¼ inches; 7/8 and 5/8 inches refer to the leg length.10 The roll staple size GR1 corresponds with size A stick staples in terms of crown size and wire thickness, and the size RR1 corresponds with size C stick staples.11
Two U.S. producers and ten importers provided usable pricing data for sales of the requested products, although not all firms reported pricing for all products for all quarters.12 Pricing data reported by these firms accounted for slightly more than one half (*** percent) of U.S. producers’ U.S. commercial shipments of carton closing staples and slightly less than one half (*** percent) of reported U.S. commercial shipments of imports from China in 2016.
8 Eight of 11 responding importers reported selling on an f.o.b. basis and 3 reported selling on a delivered basis.
9 Data were also requested for nonsubject imports from Taiwan; however no responding importer reported imports from Taiwan.
10 Petition, p. I‐9. 11 Petition, p. I‐4; Petitioner’s conference exhibit, Powerpoint, p. 6. 12 Per‐unit pricing data are calculated from total quantity and total value data provided by U.S.
producers and importers. The precision and variation of these figures may be affected by rounding, limited quantities, and producer or importer estimates.
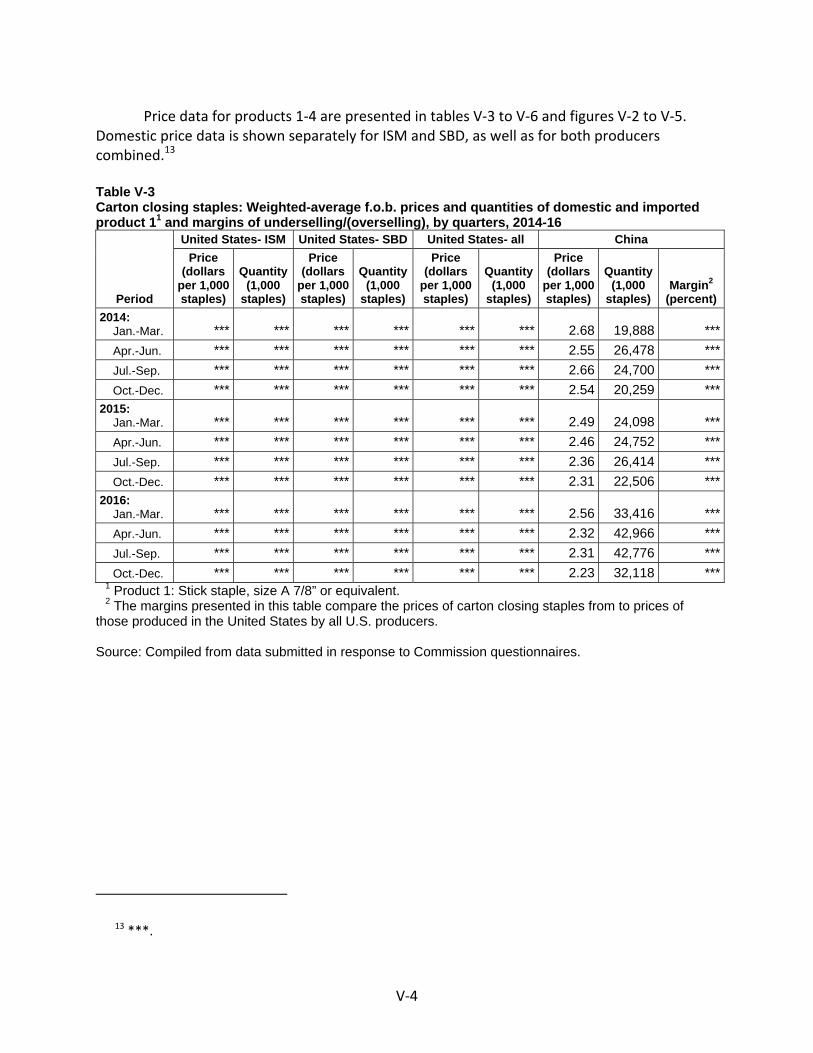
V‐4
Price data for products 1‐4 are presented in tables V‐3 to V‐6 and figures V‐2 to V‐5. Domestic price data is shown separately for ISM and SBD, as well as for both producers combined.13
Table V-3 Carton closing staples: Weighted-average f.o.b. prices and quantities of domestic and imported product 11 and margins of underselling/(overselling), by quarters, 2014-16
Period
United States- ISM United States- SBD United States- all China Price
(dollars per 1,000 staples)
Quantity (1,000
staples)
Price (dollars
per 1,000 staples)
Quantity (1,000
staples)
Price (dollars
per 1,000 staples)
Quantity (1,000
staples)
Price (dollars
per 1,000 staples)
Quantity (1,000
staples) Margin2
(percent) 2014: Jan.-Mar. *** *** *** *** *** *** 2.68 19,888 *** Apr.-Jun. *** *** *** *** *** *** 2.55 26,478 *** Jul.-Sep. *** *** *** *** *** *** 2.66 24,700 *** Oct.-Dec. *** *** *** *** *** *** 2.54 20,259 ***2015: Jan.-Mar. *** *** *** *** *** *** 2.49 24,098 *** Apr.-Jun. *** *** *** *** *** *** 2.46 24,752 *** Jul.-Sep. *** *** *** *** *** *** 2.36 26,414 *** Oct.-Dec. *** *** *** *** *** *** 2.31 22,506 ***2016: Jan.-Mar. *** *** *** *** *** *** 2.56 33,416 *** Apr.-Jun. *** *** *** *** *** *** 2.32 42,966 *** Jul.-Sep. *** *** *** *** *** *** 2.31 42,776 *** Oct.-Dec. *** *** *** *** *** *** 2.23 32,118 ***
1 Product 1: Stick staple, size A 7/8” or equivalent. 2 The margins presented in this table compare the prices of carton closing staples from to prices of those produced in the United States by all U.S. producers. Source: Compiled from data submitted in response to Commission questionnaires.
13 ***.

V‐5
Table V-4 Carton closing staples: Weighted-average f.o.b. prices and quantities of domestic and imported product 21 and margins of underselling/(overselling), by quarters, 2014-16
Period
United States- ISM United States- SBD United States- all China Price
(dollars per 1,000 staples)
Quantity (1,000
staples)
Price (dollars
per 1,000 staples)
Quantity (1,000
staples)
Price (dollars
per 1,000 staples)
Quantity (1,000
staples)
Price (dollars
per 1,000 staples)
Quantity (1,000
staples) Margin2
(percent)2014: Jan.-Mar. *** *** *** *** *** *** 1.49 169,470 *** Apr.-Jun. *** *** *** *** *** *** 1.50 217,307 *** Jul.-Sep. *** *** *** *** *** *** 1.50 181,938 *** Oct.-Dec. *** *** *** *** *** *** 1.53 178,455 ***2015: Jan.-Mar. *** *** *** *** *** *** 1.49 216,294 *** Apr.-Jun. *** *** *** *** *** *** 1.50 178,846 *** Jul.-Sep. *** *** *** *** *** *** 1.44 204,619 *** Oct.-Dec. *** *** *** *** *** *** 1.40 181,968 ***2016: Jan.-Mar. *** *** *** *** *** *** 1.43 187,393 *** Apr.-Jun. *** *** *** *** *** *** 1.43 173,033 *** Jul.-Sep. *** *** *** *** *** *** 1.40 213,242 *** Oct.-Dec. *** *** *** *** *** *** 1.36 190,985 ***
1 Product 2: Stick staple, size C 5/8” or equivalent. 2 The margins presented in this table compare the prices of carton closing staples from to prices of those produced in the United States by all U.S. producers. Source: Compiled from data submitted in response to Commission questionnaires. Table V-5 Carton closing staples: Weighted-average f.o.b. prices and quantities of domestic and imported product 3 and margins of underselling/(overselling), by quarters, 2014-16
* * * * * * * Table V-6 Carton closing staples: Weighted-average f.o.b. prices and quantities of domestic and imported product 4 and margins of underselling/(overselling), by quarters, 2014-16
* * * * * * * Figure V-2 Carton closing staples: Weighted-average prices and quantities of domestic and imported product 1, by quarters, 2014-16
* * * * * * *
V‐6
Figure V-3 Carton closing staples: Weighted-average prices and quantities of domestic and imported product 2, by quarters, 2014-16
* * * * * * * Figure V-4 Carton closing staples: Weighted-average prices and quantities of domestic and imported product 3, by quarters, 2014-16
* * * * * * * Figure V-5 Carton closing staples: Weighted-average prices and quantities of domestic and imported product 4, by quarters, 2014-16
* * * * * *
Price trends
Prices for all four pricing products decreased during 2014‐16. Table V‐7 summarizes the price trends, by country and by product. Data are shown for both U.S. producers combined as well as separately by U.S. producer. As shown in the table, average domestic price decreases ranged from *** to *** percent during 2014‐16 while import price decreases ranged from *** to 16.9 percent. ***.
Price comparisons
As shown in table V‐8, prices for carton closing staples imported from China were below those for U.S.‐produced product in 41 of 48 instances (3,358 million staples); margins of underselling ranged from 0.1 to 26.8 percent. In the remaining seven instances (337 million staples), prices for carton closing staples from China were between 0.2 and 12.2 percent above prices for the domestic product.
The Chinese product was priced lower than the domestic product in every quarter for the two stick staple pricing products (products 1 and 2), and was priced lower than the domestic product in all but one instance for product 3. Pricing product 4 showed a mix of underselling and overselling, with all of the instances of overselling occurring in 2015 and 2016.14
14 ***.

V‐7
Table V-7 Carton closing staples: Summary of weighted-average f.o.b. prices for products 1-4 from the United States and China
Item Number of quarters
Low price (dollars per 1,000 staples)
High price (dollars per 1,000
staples)
Change in price over period1
(percent) Product 1: United States 12 *** *** ***
ISM *** *** *** *** SBD *** *** *** ***China 12 2.23 2.68 (16.9)
Product 2: United States 12 *** *** ***
ISM *** *** *** *** SBD *** *** *** ***China 12 1.36 1.53 (9.1)
Product 3: United States 12 *** *** ***
ISM *** *** *** *** SBD *** *** *** ***China 12 *** *** ***
Product 4: United States 12 *** *** ***
ISM *** *** *** ***China 12 *** *** ***
1 Percentage change from first quarter 2014 to fourth quarter 2016. ***. Source: Compiled from data submitted in response to Commission questionnaires.

V‐8
Table V-8 Carton closing staples: Instances of underselling/overselling and the range and average of margins, by product, 2014-16
Source
Underselling
Number of quarters
Quantity (1,000 staples)
Average margin
(percent)
Margin range (percent)
Min Max Product 1 12 *** *** *** ***Product 2 12 *** *** *** ***Product 3 11 *** *** *** ***Product 4 6 *** *** *** ***
Total, underselling 41 3,358,133 12.7 0.1 26.8
Source
(Overselling)
Number of quarters
Quantity (1,000 staples)
Average margin
(percent)
Margin range (percent)
Min Max Product 1 0 *** --- --- ---Product 2 0 *** --- --- ---Product 3 1 *** *** *** ***Product 4 6 *** *** *** ***
Total, overselling 7 336,550 (4.2) (0.2) (12.2)Source: Compiled from data submitted in response to Commission questionnaires.
LOST SALES AND LOST REVENUE
*** responding U.S. producers reported that they had to reduce prices because of lower priced carton closing staples from China, and *** reported that they had lost sales. *** submitted lost sales and lost revenue allegations.15 *** identified 40 firms where it lost sales or revenue (all consisting of both lost sales allegations and lost revenue allegations). The total quantity of lost sales was *** staples. The general time period identified was 2012 to 2016, the method of sale was telephone, internet, and/or fax, and the product identified was staples.
Staff contacted 37 purchasers and received responses from nine purchasers.16 Responding purchasers reported purchasing 357 million carton closing staples during 2016 (table V‐9). Table V-9 Carton closing staples: Purchasers’ responses to purchasing patterns
* * * * * * *
15 ***. 16 Two purchasers accounted for more than half of the alleged lost sales volume. One of these firms,
***, which accounted for *** percent of the volume, is no longer in business. Staff telephone interview with ***, April 21, 2017. The second firm, ***.

V‐9
During 2016, responding purchasers purchased 1.1 percent from U.S. producers, 47.5 percent from China, 12.8 percent from nonsubject countries, and 38.6 percent from “unknown source” countries.17 Of the responding purchasers, one reported decreasing purchases from domestic producers, two reported increasing purchases, one reported fluctuating purchases, and five did not purchase any domestic product.18 The one purchaser that indicated decreased domestic purchases explained that Bostitch starting importing. Explanations for increasing purchases of domestic product were customer growth and sales growth. Two purchasers stated reasons for not purchasing domestic product: *** stated that it was never called on by domestic manufacturers and *** cited ISM’s inability to supply and quality.
Of the nine responding purchasers, seven reported that, since 2014, they had purchased imported carton closing staples from China instead of U.S.‐produced product (table V‐10). Two of these purchasers reported that subject import prices were lower than U.S.‐produced product, and one of these purchasers reported that price was a primary reason for the decision to purchase imported product rather than U.S.‐produced product. This purchaser did not provide the quantity of imports purchased instead of domestic product. Purchasers identified the following non‐price reasons for purchasing imported rather than U.S.‐produced product: availability, service, convenience, logistics, consistent quality, lead times, Bostitch started importing, and never being called on by domestic producers.
Of the nine responding purchasers, none reported that U.S. producers had reduced prices in order to compete with lower‐priced imports from subject countries (table V‐11; eight reported that they did not know). Table V-10 Carton closing staples: Purchasers’ responses to purchasing subject imports instead of domestic product
* * * * * * * Table V-11 Carton closing staples: Purchasers’ responses to U.S. producer price reductions
* * * * * * *
17 Most of the 2016 unknown origin purchases were reported by ***. The remainder were reported by ***.
18 Of the nine responding purchasers, three purchasers indicated that they did not know the source of at least some of the carton closing staples that they purchased.

V‐10
In responding to the lost sales lost revenue survey, some purchasers provided additional information on purchases and market dynamics. *** stated that it purchases from a U.S. company that also sells a variety of other staples, stapling tools and equipment, and that it had been unaware that these staples were made in China. It stated that it has not been actively solicited by a U.S. staple manufacturer and does not know whether it is paying more or paying less for the Chinese staples. Finally it stated that “while price is always a consideration, it is less important than the reliability, knowledge and accessibility of the supplier.” Purchaser *** stated that it has seen a drop in the carton fastener business. It also stated that *** have flooded the market with cheaper Chinese staples. Purchaser *** stated that its carton closing staple business used to be much larger but has decreased over the last 10 to 20 years as customers have moved to other methods of closing cartons such as tape, glue, or other adhesives.

VI‐1
PART VI: FINANCIAL EXPERIENCE OF U.S. PRODUCERS
BACKGROUND
Two U.S. producers (ISM and SBD) reported their financial results on carton closing staples.1 These data are believed to account for all U.S. production of carton closing staples from January 2014 to December 2016. ***, SBD ceased production of carton closing staples in the United States; leaving ISM as the sole U.S. producer of carton closing staples ***.2 *** represented the majority of carton closing staples sales quantity ***. *** reported internal consumption or tolling. ***. ***.
OPERATIONS ON CARTON CLOSING STAPLES
Table VI‐1 presents aggregated data on U.S. producers’ operations on carton closing staples during 2014‐16, while table VI‐2 presents selected company‐specific financial data. Net sales
***. As shown in table VI‐1, total net sales quantity and value ***. ***. As shown in
table VI‐2, ***.3 4 As shown in Table VI‐1, the per‐unit net sales value decreased from $*** in 2014 to
$*** in 2015 and to $*** in 2016. As shown in table VI‐2, company‐specific per‐unit data ***. ***. ***.5
Table VI-1 Carton closing staples: Results of operations of U.S. producers, 2014-16
* * * * * * * Table VI-2 Carton closing staples: Results of operations of U.S. producers, by firm, 2014-16
* * * * * * *
1 Both U.S. producers reported their financial results on a calendar‐year basis. 2 ***. U.S. producers’ questionnaire, question II‐2 and question III‐15. 3 ***. ***. 4 ***. ***. 5 ***.

VI‐2
Cost of goods sold and gross profit or (loss)
As shown in table VI‐1, other factory costs represented the largest component of COGS, accounting for *** percent in 2014, *** percent in 2015, and *** percent in 2016. ***.6
Direct labor was the second largest component of COGS, representing *** percent in 2014, *** percent in 2015, and *** percent in 2016. ***.7
As shown in table VI‐1, the average unit value of raw materials steadily ***.8 9 ***. ***.10 ***.
Selling general and administrative expenses and operating profit or (loss)
As shown in table VI‐1, the industry’s selling, general, and administrative (“SG&A”) expenses ratio (i.e., total SG&A expenses divided by total revenue) steadily increased from *** percent in 2014 to *** percent in 2015 and then to *** percent in 2016, largely reflecting SBD’s cessation of production. Table VI‐2 shows company‐specific SG&A expenses. ***. 11
U.S. producers collectively reported ***. ***. ***.
All other expenses and net income or (loss)
All other expenses ***. *** reported other income or expenses during 2014‐16. Net income followed the same trend as operating income. ***.
Variance analysis
A variance analysis is not presented in this report due to ***.
CAPITAL EXPENDITURES AND RESEARCH AND DEVELOPMENT EXPENSES
***.
6 ***. ***. 7 ***. ***. 8 ***. ***. 9 Maroune Farah, President of ISM, testified that carton closing staples from China have been quoted
at prices that are below ISM’s cost of production and even below the cost of the primary raw material. Conference transcript, p. 9 (Farah).
10 ***. ***. 11 ***. ***.

VI‐3
ASSETS AND RETURN ON ASSETS
Table VI‐3 presents data on the U.S. producers’ total assets and their return on assets (“ROA”). Total assets decreased from $*** in 2014 to $*** in 2015 and then increased to $*** in 2016. The ROA was ***.12 13 Table VI-3 Carton closing staples: U.S. producers’ total assets and ROA, 2014-16
* * * * * * *
CAPITAL AND INVESTMENT
The Commission requested U.S. producers of carton closing staples to describe any actual or potential negative effects of imports of carton closing staples from China on their firms’ growth, investment, ability to raise capital, development and production efforts, or the scale of capital investments. Table VI‐4 presents U.S. producers’ responses in a tabulated format and table VI‐5 provides the narrative responses. Table VI-4 Carton closing staples: Actual and anticipated negative effects of imports on investment, growth, and development, since January 1, 2014
* * * * * * *
***.14 ISM testified that it has not been able to secure any bank loans or government grants
because of losses stemming from the lack of sales. Rather, ISM has relied on personal investment and funds borrowed from private parties.15
ISM is the only remaining U.S. producer of carton closing staples. It attributes its level of capacity utilization and financial performance to competition with the subject imports from China. “If relief is not imposed, the company is at risk of closure, and the domestic industry will cease to exist.”16
12 With respect to a company’s overall operations, staff notes that a total asset value (i.e., the bottom line number on the asset side of a company’s balance sheet) reflects an aggregation of a number of assets which generally are not product specific. Thus, high‐level allocation factors and estimates may have been required in order to report a total asset value for carton closing staples.
13 ***. ***. 14 ***. 15 Conference transcript, p. 15 (Farah). 16 Petitioner’s postconference brief, p. 1.

VI‐4
Table VI-6 Carton closing staples: Narratives relating to the actual and anticipated negative effects of imports on investment, growth, and development, since January 1, 2014
* * * * * * *

VII‐1
PART VII: THREAT CONSIDERATIONS AND INFORMATION ON NONSUBJECT COUNTRIES
Section 771(7)(F)(i) of the Act (19 U.S.C. § 1677(7)(F)(i)) provides that—
In determining whether an industry in the United States is threatened with material injury by reason of imports (or sales for importation) of the subject merchandise, the Commission shall consider, among other relevant economic factors1‐‐ (I) if a countervailable subsidy is involved, such information as may
be presented to it by the administering authority as to the nature of the subsidy (particularly as to whether the countervailable subsidy is a subsidy described in Article 3 or 6.1 of the Subsidies Agreement), and whether imports of the subject merchandise are likely to increase,
(II) any existing unused production capacity or imminent, substantial increase in production capacity in the exporting country indicating the likelihood of substantially increased imports of the subject merchandise into the United States, taking into account the availability of other export markets to absorb any additional exports,
(III) a significant rate of increase of the volume or market penetration of imports of the subject merchandise indicating the likelihood of substantially increased imports,
(IV) whether imports of the subject merchandise are entering at prices that are likely to have a significant depressing or suppressing effect on domestic prices, and are likely to increase demand for further imports,
(V) inventories of the subject merchandise,
1 Section 771(7)(F)(ii) of the Act (19 U.S.C. § 1677(7)(F)(ii)) provides that “The Commission shall consider {these factors} . . . as a whole in making a determination of whether further dumped or subsidized imports are imminent and whether material injury by reason of imports would occur unless an order is issued or a suspension agreement is accepted under this title. The presence or absence of any factor which the Commission is required to consider . . . shall not necessarily give decisive guidance with respect to the determination. Such a determination may not be made on the basis of mere conjecture or supposition.”

VII‐2
(VI) the potential for product‐shifting if production facilities in the foreign country, which can be used to produce the subject merchandise, are currently being used to produce other products,
(VII) in any investigation under this title which involves imports of both a raw agricultural product (within the meaning of paragraph (4)(E)(iv)) and any product processed from such raw agricultural product, the likelihood that there will be increased imports, by reason of product shifting, if there is an affirmative determination by the Commission under section 705(b)(1) or 735(b)(1) with respect to either the raw agricultural product or the processed agricultural product (but not both),
(VIII) the actual and potential negative effects on the existing development and production efforts of the domestic industry, including efforts to develop a derivative or more advanced version of the domestic like product, and
(IX) any other demonstrable adverse trends that indicate the probability that there is likely to be material injury by reason of imports (or sale for importation) of the subject merchandise (whether or not it is actually being imported at the time).2
Information on the volume and pricing of imports of the subject merchandise is presented in Parts IV and V; and information on the effects of imports of the subject merchandise on U.S. producers’ existing development and production efforts is presented in Part VI. Information on inventories of the subject merchandise; foreign producers’ operations, including the potential for “product‐shifting;” any other threat indicators, if applicable; and any dumping in third‐country markets, follows. Also presented in this section of the report is information obtained for consideration by the Commission on nonsubject countries.
THE INDUSTRY IN CHINA
The Commission issued foreign producers’ or exporters’ questionnaires to 50 firms believed to produce and/or export carton closing staples from China.3 Useable responses to the
2 Section 771(7)(F)(iii) of the Act (19 U.S.C. § 1677(7)(F)(iii)) further provides that, in antidumping investigations, “. . . the Commission shall consider whether dumping in the markets of foreign countries (as evidenced by dumping findings or antidumping remedies in other WTO member markets against the same class or kind of merchandise manufactured or exported by the same party as under investigation) suggests a threat of material injury to the domestic industry.”
3 These firms were identified through a review of information submitted in the petition and contained in *** records.

VII‐3
Commission’s questionnaire were received from four firms: Tianjin, Unicorn, and SBD Langfang, and Zhejiang. These firms’ exports to the United States accounted for approximately one half (*** percent) of U.S. imports of carton closing staples from China in 2016.4 According to estimates requested of the responding Chinese producers, the production of carton closing staples in China reported in Part VII of the report accounts for less than one half of overall production of carton closing staples in China.5 Table VII‐1 presents information on the carton closing staples operations of the responding producers and exporters in China. Table VII-1 Carton closing staples: Summary data for producers in China, 2016
* * * * * * *
Changes in operations
As presented in table VII‐2 producers in China reported several operational and organizational changes since January 1, 2014. Table VII-2 Carton closing staples: China’s producers' reported changes in operations, since January 1, 2014
* * * * * * *
Operations on carton closing staples
Table VII‐3 presents information on the carton closing staples operations of the responding producers and exporters in China. The Chinese industry’s capacity increased by *** percent, while total production increased by *** percent between 2014 and 2016. The increase in production includes additional volume from ***. Export shipments to the United States rose from 2014 to 2016, increasing by *** percent. Total shipments increased by *** percent, as total exports increased by *** percent between 2014 and 2016, while total home market shipments decreased by *** percent. Capacity utilization increased by *** percentage points
4 Of the four foreign producers, *** were the only firms that estimated their share of exports to the United States compared to all exports from China. *** did not provide estimates, and each indicated that its firm did not know its share of exports. Foreign producers’ questionnaire responses, sections II‐7 and II‐12.
5 *** reported for 2016 that its share of production of carton closing staples is approximately *** percent of all production in China, while *** did not report its 2016 share of production. Comparatively, *** reported that its share of production in China during the same period was *** percent of all Chinese production of carton closing staples. *** produced more than *** the quantity as ***, while *** produced nearly *** the quantity that *** did in 2016. *** exports and production were reported identically in the foreign producer questionnaire submitted by ***. ***. *** foreign producer questionnaire, sections II‐6 and II‐7. Email from ***, April 30, 2017.

VII‐4
between 2014 and 2016, while the inventories to production and inventories to total shipments ratios both decreased ***. From 2014 to 2016, the share in quantity for export shipments to the United States increased by *** percentage points, while the share in quantity for total exports increased by *** percentage points during 2014‐16. From 2014 to 2016, the share in quantity for total home market shipments in China decreased by *** percentage points. Table VII-3 Carton closing staples: Data for producers in China, 2014-16
* * * * * * *
Alternative products
As shown in table VII‐4, responding Chinese firms produced other products on the same equipment and machinery used to produce carton closing staples (measured in pounds). The producers in China had an overall capacity increase of *** percent, while total in‐scope production increased by *** percent between 2014 and 2016. Out‐of‐scope production increased during 2014‐16 by *** percent, while total production on the same machinery increased by *** percent over the same period. The overall capacity utilization ratio increased by *** from 2014 to 2016, while the share of production of carton closing staples decreased by *** percentage points.
Table VII-4 Carton closing staples: China’s producers' overall capacity and production on the same equipment as subject production, 2014-16
* * * * * * *
Exports
According to GTA, the leading export markets for carton closing staples from China are the United States, Japan, and Canada (table VII‐5). These data are compiled using the Global Trade Atlas which provides data only to a 6‐digit classification level (HS 7317.00 and 8305.20) and therefore, includes products that are not within the scope of this investigation. During 2016, the United States was the top export market for carton closing staples from China, accounting for a 27.4 percent share of the quantity (measured in pounds), followed by the Japan, accounting for 7.3 percent share of the quantity. From 2014 to 2016, the quantity of exports from China to the United States increased by 19.5 percent, while the value of exports decreased by 4.3 percent over the same period. During 2014‐16, the share of quantity of exports from China to the United States increased by 4.9 percent.

VII‐5
Table VII-5 Carton closing staples: Exports from China, 2014-16
Destination market Calendar year
2014 2015 2016 Quantity (1,000 pounds) Exports from China to the United States 561,016 621,928 670,673 Exports from China to other major destination markets.-- Japan 176,753 176,123 177,784
Canada 129,430 134,553 141,555 Korea South 86,573 99,075 108,046 Indonesia 92,579 85,859 73,853 United Kingdom 63,526 60,349 62,487 Germany 57,481 59,932 57,851 United Arab Emirates 71,998 73,977 54,547 Philippines 49,118 34,022 44,173 All other destination markets 1,205,188 1,230,705 1,060,824
Total exports from China 2,493,659 2,576,524 2,451,793 Value (1,000 dollars) Exports from China to the United States 300,154 318,592 287,282 Exports from China to other major destination markets.-- Japan 91,848 78,608 76,662
Canada 63,325 58,161 54,909 Korea South 41,638 37,573 40,201 Indonesia 66,744 74,628 40,786 United Kingdom 39,823 35,042 32,667 Germany 34,568 32,533 26,811 United Arab Emirates 36,076 35,269 24,665 Philippines 30,863 26,806 24,884 All other destination markets 777,569 838,616 630,041
Total exports from China 1,482,608 1,535,828 1,238,908 Table continued on next page.

VII‐6
Table VII-5: Continued Carton closing staples: Exports from China, 2014-16
Destination market Calendar year
2014 2015 2016 Unit value (dollars per pound) Exports from China to the United States 0.54 0.51 0.43Exports from China to other major destination markets.-- Japan 0.52 0.45 0.43
Canada 0.49 0.43 0.39Korea South 0.48 0.38 0.37Indonesia 0.72 0.87 0.55United Kingdom 0.63 0.58 0.52Germany 0.60 0.54 0.46United Arab Emirates 0.50 0.48 0.45Philippines 0.63 0.79 0.56All other destination markets 0.65 0.68 0.59
Total exports from China 0.59 0.60 0.51 Share of quantity (percent) Exports from China to the United States 22.5 24.1 27.4 Exports from China to other major destination markets.-- Japan 7.1 6.8 7.3
Canada 5.2 5.2 5.8 Korea South 3.5 3.8 4.4 Indonesia 3.7 3.3 3.0 United Kingdom 2.5 2.3 2.5 Germany 2.3 2.3 2.4 United Arab Emirates 2.9 2.9 2.2 Philippines 2.0 1.3 1.8 All other destination markets 48.3 47.8 43.3
Total exports from China 100.0 100.0 100.0 Source: GTIS/GTA database.
U.S. INVENTORIES OF IMPORTED MERCHANDISE
Table VII‐6 presents data on U.S. importers’ reported inventories of carton closing staples. From 2014 to 2016, inventories of carton closing staples from China increased by *** percent, while inventories of U.S. imports from nonsubject sources increased by *** percent.6 The ratios of inventories of U.S. imports, U.S. shipments of imports, and total shipments of imports slightly increased during 2014‐16 for every comparison other than as a ratio to U.S. imports from nonsubject sources.
6 ***. Email from ***, April 28, 2017.

VII‐7
Table VII-6 Carton closing staples: U.S. importers’ inventories, 2014-16
* * * * * * *
U.S. IMPORTERS’ OUTSTANDING ORDERS
The Commission requested importers to indicate whether they imported or arranged for the importation of carton closing staples from China after December 31, 2016. Arranged imports from China ***, while arranged imports from all other sources *** in the fourth quarter of 2017.
Table VII-7 Carton closing staples: Arranged imports, January 2017 through December 2017
Item Period
Jan-Mar 2017 Apr-Jun 2017 Jul-Sept 2017 Oct-Dec 2017 Total Arranged U.S. imports from.-- China *** *** *** *** ***
All other sources *** *** *** *** ***All import sources *** *** *** *** ***
Source: Compiled from data submitted in response to Commission questionnaires.
ANTIDUMPING OR COUNTERVAILING DUTY ORDERS IN THIRD‐COUNTRY MARKETS
There are no known trade remedy actions on carton closing staples in third‐country markets.
INFORMATION ON NONSUBJECT COUNTRIES
Tables VII‐8 through VII‐10 present global export data for carton closing staples from 2014 to 2016. These data are compiled using the Global Trade Atlas which provides data only to a 6‐digit classification level (HS 7317.00 and 8305.20) and therefore, includes products that are not within the scope of this review. Export data for Taiwan and Sweden are shown individually because Taiwan is the leading nonsubject exporter of staples to the United States and Sweden was previously the subject country in an investigation concerning carton closing staple imports to the United States.7
7 Carton‐Closing Staples and Nonautomatic Carton‐Closing Staple Machines from Sweden, Inv. Nos. 731‐TA‐116 and 117 (Final), USITC Publication 1454, December 1983.

VII‐8
Taiwan
Taiwan’s largest export market by quantity and value for HS 7317.00 and 8305.20 is the United States (table VII‐8), which accounted for 84.4 percent of the volume of such exports in 2016. Pakistan was the second leading destination for exports from Taiwan, but only accounted for 2.3 percent of the volume of exports. Table VII-8 Staples: Exports from Taiwan by destination market, 2014-16
Destination market Calendar year
2014 2015 2016 Quantity (1,000 pounds) Exports from Taiwan to the United States 167,157 188,997 183,371Exports from Taiwan to other major destination markets.-- Pakistan 4,923 4,750 4,919
Japan 7,208 5,195 4,774 Oman 2,434 2,646 2,910 Saudi Arabia 2,151 2,407 2,518 Australia 2,399 2,684 1,716 China 1,228 1,687 1,438 Belgium 898 1,102 1,129 Qatar 1,045 1,180 871 All other destination markets 16,376 13,612 13,723
Total exports from Taiwan 205,818 224,260 217,368 Value (1,000 dollars) Exports from Taiwan to the United States 104,698 107,499 94,933 Exports from Taiwan to other major destination markets.-- Pakistan 4,032 3,769 3,205
Japan 7,227 6,079 5,688 Oman 2,120 2,206 2,230 Saudi Arabia 2,007 1,979 1,933 Australia 2,667 2,544 1,849 China 1,506 1,988 1,372 Belgium 1,428 1,610 1,500 Qatar 909 997 676 All other destination markets 21,083 17,271 16,903
Total exports from Taiwan 147,677 145,942 130,288 Table continued on next page.

VII‐9
Table VII-8--Continued Staples: Exports from Taiwan by destination market, 2014-16
Destination market Calendar year
2014 2015 2016 Unit value (dollars per pound) Exports from Taiwan to the United States 0.63 0.57 0.52Exports from Taiwan to other major destination markets.-- Pakistan 0.82 0.79 0.65
Japan 1.00 1.17 1.19Oman 0.87 0.83 0.77Saudi Arabia 0.93 0.82 0.77Australia 1.11 0.95 1.08China 1.23 1.18 0.95Belgium 1.59 1.46 1.33Qatar 0.87 0.84 0.78All other destination markets 1.29 1.27 1.23
Total exports from Taiwan 0.72 0.65 0.60 Share of quantity (percent) Exports from Taiwan to the United States 81.2 84.3 84.4Exports from Taiwan to other major destination markets.-- Pakistan 2.4 2.1 2.3
Japan 3.5 2.3 2.2Oman 1.2 1.2 1.3Saudi Arabia 1.0 1.1 1.2Australia 1.2 1.2 0.8China 0.6 0.8 0.7Belgium 0.4 0.5 0.5Qatar 0.5 0.5 0.4All other destination markets 8.0 6.1 6.3
Total exports from Taiwan 100.0 100.0 100.0Source: Official exports statistics under HS subheading 8350.20 and 7317.00 as reported by Taiwan's Directorate General of Customs in the IHS/GTA database, accessed March 18, 2017

VII‐10
Sweden
Sweden’s largest export market by quantity and value for HS 7317.00 and 8305.20 is Norway (table VII‐9), which accounted for 41.4 percent of the volume of such exports in 2016. The United States was the fourth leading destination for Sweden’s exports and accounted for 4.5 percent of the volume of exports. Table VII-9 Staples: Exports from Sweden by destination market, 2014-16
Destination market Calendar year
2014 2015 2016 Quantity (1,000 pounds) Exports from Sweden to the United States 1,581 1,302 1,359 Exports from Sweden to other major destination markets.-- Norway 13,111 13,628 12,455
Denmark 3,781 3,655 5,565 Netherlands 2,825 2,892 2,829 Germany 938 921 1,087 Finland 1,569 1,230 977 France 1,168 846 924 Latvia 339 658 803 Turkey 493 643 692 All other destination markets 4,087 4,077 3,371
Total exports from Sweden 29,892 29,850 30,063 Value (1,000 dollars) Exports from Sweden to the United States 3,149 2,526 2,152 Exports from Sweden to other major destination markets.-- Norway 22,081 18,078 15,949
Denmark 6,061 4,795 6,842 Netherlands 5,999 5,272 5,212 Germany 1,864 1,600 1,708 Finland 3,391 2,269 1,919 France 1,563 1,133 1,118 Latvia 454 661 831 Turkey 1,317 1,403 1,695 All other destination markets 11,572 11,015 9,396
Total exports from Sweden 57,450 48,752 46,822 Table continued on next page.

VII‐11
Table VII-9--Continued Staples: Exports from Sweden by destination market, 2014-16
Destination market Calendar year
2014 2015 2016 Unit value (dollars per pound) Exports from Sweden to the United States 1.99 1.94 1.58 Exports from Sweden to other major destination markets.-- Norway 1.68 1.33 1.28
Denmark 1.60 1.31 1.23 Netherlands 2.12 1.82 1.84 Germany 1.99 1.74 1.57 Finland 2.16 1.85 1.96 France 1.34 1.34 1.21 Latvia 1.34 1.01 1.04 Turkey 2.67 2.18 2.45 All other destination markets 2.83 2.70 2.79
Total exports from Sweden 1.92 1.63 1.56 Share of quantity (percent) Exports from Sweden to the United States 5.3 4.4 4.5 Exports from Sweden to other major destination markets.-- Norway 43.9 45.7 41.4
Denmark 12.6 12.2 18.5 Netherlands 9.5 9.7 9.4 Germany 3.1 3.1 3.6 Finland 5.2 4.1 3.2 France 3.9 2.8 3.1 Latvia 1.1 2.2 2.7 Turkey 1.6 2.2 2.3 All other destination markets 13.7 13.7 11.2
Total exports from Sweden 100.0 100.0 100.0 Source: Official exports statistics under HS subheading 8350.20 and 7317.00 as reported by Eurostat in the IHS/GTA database, accessed April 29, 2017.
Global export market
Table VII‐10 presents information on exports by value for HS 7317.00 and 8305.20 during 2014‐2016 as reported by the Global Trade Atlas. Data was not presented in quantities due to different measures for each reporting country. In 2016, China was the leading export source, while Germany and Taiwan were the second and third leading sources, respectively. The United States was the sixth leading export source.
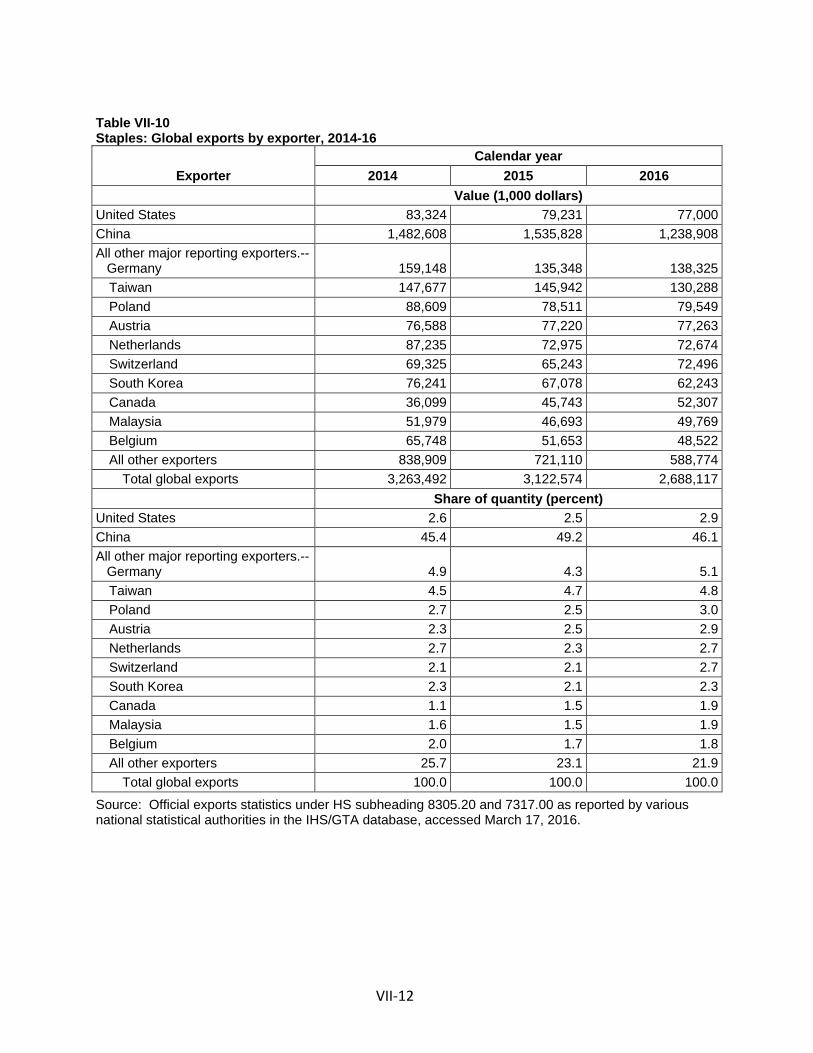
VII‐12
Table VII-10 Staples: Global exports by exporter, 2014-16
Exporter Calendar year
2014 2015 2016 Value (1,000 dollars) United States 83,324 79,231 77,000 China 1,482,608 1,535,828 1,238,908 All other major reporting exporters.-- Germany 159,148 135,348 138,325
Taiwan 147,677 145,942 130,288 Poland 88,609 78,511 79,549 Austria 76,588 77,220 77,263 Netherlands 87,235 72,975 72,674 Switzerland 69,325 65,243 72,496 South Korea 76,241 67,078 62,243 Canada 36,099 45,743 52,307 Malaysia 51,979 46,693 49,769 Belgium 65,748 51,653 48,522 All other exporters 838,909 721,110 588,774
Total global exports 3,263,492 3,122,574 2,688,117 Share of quantity (percent) United States 2.6 2.5 2.9 China 45.4 49.2 46.1 All other major reporting exporters.-- Germany 4.9 4.3 5.1
Taiwan 4.5 4.7 4.8 Poland 2.7 2.5 3.0 Austria 2.3 2.5 2.9 Netherlands 2.7 2.3 2.7 Switzerland 2.1 2.1 2.7 South Korea 2.3 2.1 2.3 Canada 1.1 1.5 1.9 Malaysia 1.6 1.5 1.9 Belgium 2.0 1.7 1.8 All other exporters 25.7 23.1 21.9
Total global exports 100.0 100.0 100.0
Source: Official exports statistics under HS subheading 8305.20 and 7317.00 as reported by various national statistical authorities in the IHS/GTA database, accessed March 17, 2016.
A‐1
APPENDIX A
FEDERAL REGISTER NOTICES


A‐3
The Commission makes available notices relevant to its investigations and reviews on its
website, www.usitc.gov. In addition, the following tabulation presents, in chronological order,
Federal Register notices issued by the Commission and Commerce during the current
proceeding.
Citation Title Link 82 FR 17036 April 7, 2017
Carton Closing Staples From China; Institution of Antidumping Duty Investigation and Scheduling of Preliminary Phase Investigation
https://www.gpo.gov/fdsys/pkg/FR-2017-04-07/pdf/2017-06928.pdf
82 FR 19351 April 27, 2017
Carton-Closing Staples From the People's Republic of China: Initiation of Less-Than-Fair-Value Investigation
https://www.gpo.gov/fdsys/pkg/FR-2017-04-27/pdf/2017-08526.pdf
82 FR 23064 May 19, 2017
Carton Closing Staples From China https://www.gpo.gov/fdsys/pkg/FR-2017-05-19/pdf/2017-10142.pdf


B‐1
APPENDIX B
CONFERENCE WITNESSES


B‐3
CALENDAR OF PUBLIC PRELIMINARY CONFERENCE
Those listed below appeared as witnesses at the United States International Trade Commission’s preliminary conference:
Subject: Carton Closing Staples from China
Inv. No.: 731-TA-1359 (Preliminary)
Date and Time: April 20, 2017 - 12:30 p.m.
A session was held in connection with this preliminary phase investigation in Courtroom B (room 111), 500 E Street, S.W., Washington, DC.
OPENING REMARKS: Petitioners (Elizabeth J. Drake, Stewart and Stewart) In Support to the Imposition of
Antidumping Duty Orders: Stewart and Stewart Washington, DC on behalf of North American Steel & Wire, Inc./ISM Enterprises Maroune Farah, Owner, North American Steel & Wire, Inc./ISM Enterprises Ross Tyndall, Management Consultant, North American Steel & Wire, Inc./ISM Enterprises Elizabeth J. Drake ) Philip A. Butler ) – OF COUNSEL Jennifer M. Smith ) CLOSING REMARKS: Petitioners (Elizabeth J. Drake, Stewart and Stewart)
-END-


C‐1
APPENDIX C
SUMMARY DATA

C‐2
CONTENTS
Page
Table C‐1: Staples summary data ................................................................................................ C‐3
Table C‐2: Staples summary data, excluding U.S. producer *** ................................................. C‐5
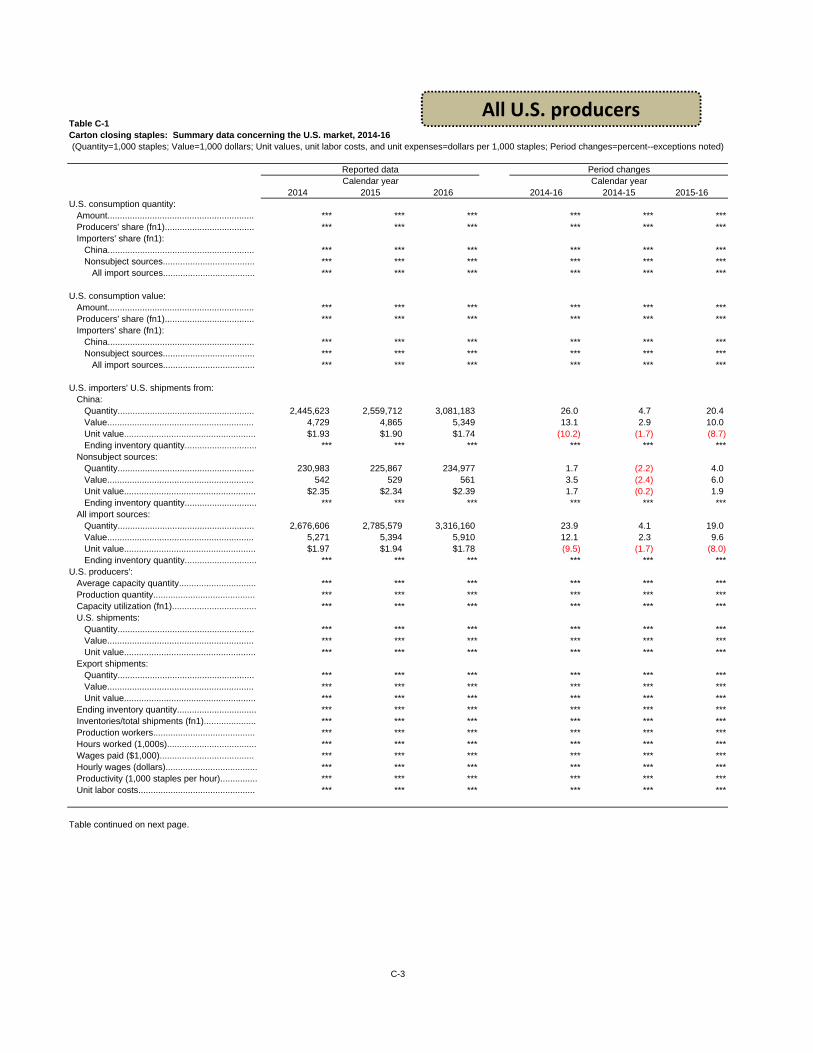
Table C-1Carton closing staples: Summary data concerning the U.S. market, 2014-16
2014 2015 2016 2014-16 2014-15 2015-16U.S. consumption quantity:
Amount........................................................... *** *** *** *** *** ***Producers' share (fn1).................................... *** *** *** *** *** ***Importers' share (fn1):
China........................................................... *** *** *** *** *** ***Nonsubject sources..................................... *** *** *** *** *** ***
All import sources..................................... *** *** *** *** *** ***
U.S. consumption value:Amount........................................................... *** *** *** *** *** ***Producers' share (fn1).................................... *** *** *** *** *** ***Importers' share (fn1):
China........................................................... *** *** *** *** *** ***Nonsubject sources..................................... *** *** *** *** *** ***
All import sources..................................... *** *** *** *** *** ***
U.S. importers' U.S. shipments from:China:
Quantity....................................................... 2,445,623 2,559,712 3,081,183 26.0 4.7 20.4 Value........................................................... 4,729 4,865 5,349 13.1 2.9 10.0 Unit value..................................................... $1.93 $1.90 $1.74 (10.2) (1.7) (8.7)Ending inventory quantity............................. *** *** *** *** *** ***
Nonsubject sources:Quantity....................................................... 230,983 225,867 234,977 1.7 (2.2) 4.0 Value........................................................... 542 529 561 3.5 (2.4) 6.0 Unit value..................................................... $2.35 $2.34 $2.39 1.7 (0.2) 1.9 Ending inventory quantity............................. *** *** *** *** *** ***
All import sources:Quantity....................................................... 2,676,606 2,785,579 3,316,160 23.9 4.1 19.0 Value........................................................... 5,271 5,394 5,910 12.1 2.3 9.6 Unit value..................................................... $1.97 $1.94 $1.78 (9.5) (1.7) (8.0)Ending inventory quantity............................. *** *** *** *** *** ***
U.S. producers':Average capacity quantity............................... *** *** *** *** *** ***Production quantity......................................... *** *** *** *** *** ***Capacity utilization (fn1).................................. *** *** *** *** *** ***U.S. shipments:
Quantity....................................................... *** *** *** *** *** ***Value........................................................... *** *** *** *** *** ***Unit value..................................................... *** *** *** *** *** ***
Export shipments:Quantity....................................................... *** *** *** *** *** ***Value........................................................... *** *** *** *** *** ***Unit value..................................................... *** *** *** *** *** ***
Ending inventory quantity................................ *** *** *** *** *** ***Inventories/total shipments (fn1)..................... *** *** *** *** *** ***Production workers......................................... *** *** *** *** *** ***Hours worked (1,000s).................................... *** *** *** *** *** ***Wages paid ($1,000)...................................... *** *** *** *** *** ***Hourly wages (dollars)..................................... *** *** *** *** *** ***Productivity (1,000 staples per hour)............... *** *** *** *** *** ***Unit labor costs............................................... *** *** *** *** *** ***
Table continued on next page.
C-3
(Quantity=1,000 staples; Value=1,000 dollars; Unit values, unit labor costs, and unit expenses=dollars per 1,000 staples; Period changes=percent--exceptions noted)
Reported data Period changesCalendar year Calendar year
All U.S. producers

Table C-1--ContinuedCarton closing staples: Summary data concerning the U.S. market, 2014-16
2014 2015 2016 2014-16 2014-15 2015-16U.S. producers':
Net sales:Quantity....................................................... *** *** *** *** *** ***Value........................................................... *** *** *** *** *** ***Unit value..................................................... *** *** *** *** *** ***
Cost of goods sold (COGS)............................ *** *** *** *** *** ***Gross profit or (loss)....................................... *** *** *** *** *** ***SG&A expenses............................................. *** *** *** *** *** ***Operating income or (loss).............................. *** *** *** *** *** ***Net income or (loss)........................................ *** *** *** *** *** ***Capital expenditures....................................... *** *** *** *** *** ***Unit COGS...................................................... *** *** *** *** *** ***Unit SG&A expenses...................................... *** *** *** *** *** ***Unit operating income or (loss)....................... *** *** *** *** *** ***Unit net income or (loss)................................. *** *** *** *** *** ***COGS/sales (fn1)........................................... *** *** *** *** *** ***Operating income or (loss)/sales (fn1)............ *** *** *** *** *** ***Net income or (loss)/sales (fn1)...................... *** *** *** *** *** ***
Notes:
fn1.--Reported data are in percent and period changes are in percentage points.fn2.--Undefined.
Source: Compiled from data submitted in response to Commission questionnaires.
C-4
(Quantity=1,000 staples; Value=1,000 dollars; Unit values, unit labor costs, and unit expenses=dollars per 1,000 staples; Period changes=percent--exceptions noted)
Reported data Period changesCalendar year Calendar year

C-5
Related Party Exclusion
Table C-2 Carton closing staples: Summary data concerning the U.S. market excluding U.S. producer ***, 2014-16 (Quantity=1,000 staples; Value=1,000 dollars; Unit values, unit labor costs, and unit expenses=dollars per 1,000 staples; Period changes=percent--exceptions noted)
U.S. consumption quantity:
Reported data Period changes
Calendar year Calendar year 2014 2015 2016 2014-16 2014-15 2015-16
Amount........................................................... *** *** *** *** *** *** Producers' share (fn1):
Included producer........................................ *** *** *** *** *** *** Excluded producer....................................... *** *** *** *** *** ***
All U.S. producers..................................... *** *** *** *** *** *** Importers' share (fn1):
China........................................................... *** *** *** *** *** ***Nonsubject sources..................................... *** *** *** *** *** ***
All import sources..................................... *** *** *** *** *** ***
U.S. consumption value:
Amount........................................................... Producers' share (fn1):
Included producer........................................
***
***
***
***
***
***
***
***
***
***
***
***Excluded producer....................................... *** *** *** *** *** ***
All U.S. producers..................................... *** *** *** *** *** ***Importers' share (fn1):
China........................................................... *** *** *** *** *** ***Nonsubject sources..................................... *** *** *** *** *** ***
All import sources..................................... *** *** *** *** *** ***
U.S. importers' U.S. shipments from: China:
Quantity....................................................... 2,445,623 2,559,712 3,081,183 26.0 4.7 20.4Value........................................................... 4,729 4,865 5,349 13.1 2.9 10.0Unit value..................................................... $1.93 $1.90 $1.74 (10.2) (1.7) (8.7)Ending inventory quantity............................. *** *** *** *** *** ***
Nonsubject sources:
Quantity....................................................... 230,983 225,867 234,977 1.7 (2.2) 4.0Value........................................................... 542 529 561 3.5 (2.4) 6.0Unit value..................................................... $2.35 $2.34 $2.39 1.7 (0.2) 1.9Ending inventory quantity............................. *** *** *** *** *** ***
All import sources:
Quantity....................................................... 2,676,606 2,785,579 3,316,160 23.9 4.1 19.0Value........................................................... 5,271 5,394 5,910 12.1 2.3 9.6Unit value..................................................... $1.97 $1.94 $1.78 (9.5) (1.7) (8.0)Ending inventory quantity............................. *** *** *** *** *** ***
U.S. producers' (excluding ***):
Average capacity quantity............................... Production quantity......................................... Capacity utilization (fn1).................................. U.S. shipments:
Quantity....................................................... Value........................................................... Unit value.....................................................
*** *** ***
*** *** ***
*** *** ***
*** *** ***
*** *** ***
*** *** ***
*** *** ***
*** *** ***
*** *** ***
*** *** ***
*********
*********
Export shipments: Quantity....................................................... *** *** *** *** *** ***Value........................................................... *** *** *** *** *** ***Unit value..................................................... *** *** *** *** *** ***
Ending inventory quantity................................ *** *** *** *** *** ***Inventories/total shipments (fn1)..................... *** *** *** *** *** ***Production workers......................................... *** *** *** *** *** ***Hours worked (1,000s).................................... *** *** *** *** *** ***Wages paid ($1,000)...................................... *** *** *** *** *** ***Hourly wages (dollars)..................................... *** *** *** *** *** ***Productivity (1,000 staples per hour)............... *** *** *** *** *** ***Unit labor costs............................................... *** *** *** *** *** ***
Table continued on next page.

C-6
Table C-2--Continued Carton closing staples: Summary data concerning the U.S. market excluding U.S. producer ***, 2014-16 (Quantity=1,000 staples; Value=1,000 dollars; Unit values, unit labor costs, and unit expenses=dollars per 1,000 staples; Period changes=percent--exceptions noted)
U.S. producers' (excluding ***): Net sales:
Reported data Period changes
Calendar year Calendar year 2014 2015 2016 2014-16 2014-15 2015-16
Quantity....................................................... *** *** *** *** *** ***Value........................................................... *** *** *** *** *** ***Unit value..................................................... *** *** *** *** *** ***
Cost of goods sold (COGS)............................ *** *** *** *** *** ***Gross profit or (loss)....................................... *** *** *** *** *** ***SG&A expenses............................................. *** *** *** *** *** ***Operating income or (loss).............................. *** *** *** *** *** ***Net income or (loss)........................................ *** *** *** *** *** ***Capital expenditures....................................... *** *** *** *** *** ***Unit COGS...................................................... *** *** *** *** *** ***Unit SG&A expenses...................................... *** *** *** *** *** ***Unit operating income or (loss)....................... *** *** *** *** *** ***Unit net income or (loss)................................. *** *** *** *** *** ***COGS/sales (fn1)........................................... *** *** *** *** *** ***Operating income or (loss)/sales (fn1)............ *** *** *** *** *** ***Net income or (loss)/sales (fn1)...................... *** *** *** *** *** ***
Notes:
fn1.--Reported data are in percent and period changes are in percentage points. fn2.--Undefined.
Source: Compiled from data submitted in response to Commission questionnaires.