case for inclusion - united cerebral palsy’s 2015...
TRANSCRIPT
1CASE FOR INCLUSION 2015UNITED CEREBRAL PALSY’S 2015 REPORT
2015
2CASE FOR INCLUSION 2015
E very year since 2006, United Cerebral Palsy (UCP) produces The Case for Inclusion, an annual ranking of how well State Medicaid programs serve Americans with intellectual and developmental disabilities (ID/DD) and their families. Individuals with ID/DD, including the young and the aging,
want and deserve the same opportunities and quality of life as all Americans.
Medicaid impacts so many — children and adults with disabilities, the elderly and families living in poverty. It is the critical safety net that provides financial and health care security and community support to Americans, including those with ID/DD, so their desired opportunities, quality of life and community participation can be fully realized.
It is both a duty and a necessity of a civil society such as ours to aid and empower these individuals, who are often the most vulnerable among us, to succeed. We are all stronger together.
Yet some States do much better than others in demonstrating the needed political will and sound policies necessary to achieve this ideal. The Case for Inclusion ranks all 50 States and the District of Columbia (DC) — not on their spending – but on their outcomes for Americans with ID/DD.
The Case for Inclusion is a tool that gives us glimpses at how well each individual State is performing overall; how each State matches up against other States regarding key data measures; and, most importantly, the policies and practices of top performing States that may be considered as best practices.
INTRODUCTION
MEDICAID FACTTOTAL SPENDING
(STATE AND FEDERAL) $432 BILLION
Individuals with ID/DD $40.7 billion (9.4%)
TOTAL ENROLLMENT58.6 MILLION PEOPLE Individuals with ID/DD
805,000 (1.4%)Source: Most recent data
available from FY2012 from the Medicaid 2013 Actuarial Report &
the Research and Training Center on Community Living.

3CASE FOR INCLUSION 2015
ABOUT UNITED CEREBRAL PALSYUnited Cerebral Palsy (UCP) educates, advocates and provides support services through an affiliate network to ensure a life without limits for people with a spectrum of disabilities. Together with nearly 100 affiliates, UCP has a mission to advance the independence, productivity and full citizenship of people with disabilities by supporting more than 176,000 children and adults every day—one person at a time, one family at a time. UCP works to enact real change—to revolutionize care, raise standards of living and create opportunities—impacting the lives of millions living with disabilities. For more than 60 years, UCP has worked to ensure the inclusion of individuals with disabilities in every facet of society. Together, with parents and caregivers, UCP will continue to push for the social, legal and technological changes that increase accessibility and independence, allowing people with disabilities to dream.
FOUR KEY ASPECTS OF A HIGH FUNCTIONING MEDICAID PROGRAMThe University of Minnesota’s Research and Training Center on Community Living identifies the four key aspects of a high functioning and effective Medicaid program, which have also been articulated in a number of legislative, administrative and judicial statements describing national policy.1 The Case for Inclusion’s five major outcome areas align, as indicated, with the following four-part holistic approach:
The Case for Inclusion’s major
outcome areas align with a
four-part holistic approach.
12
3
4
Promoting Independence: People with disabilities will live in and participate in their communities.
Promoting Productivity: People with disabilities will have satisfying lives and valued social roles.
Keeping Families Together and Reaching Those in Need: People with disabilities will have sufficient access to needed support, and control over that support so that the assistance they receive contributes to lifestyles they desire.
Tracking Health, Safety, and Quality of Life: People will be safe and healthy in the environments in which they live.
iThe University of Minnesota Research and Training Center on Community Living. “Medicaid Home andCommunity Based Services for Persons with Intellectual and Developmental Disabilities - Interim Report.”September 26, 2005. Page 3.

4CASE FOR INCLUSION 2015
MAJOR ENHANCEMENTS IN 2014 AND MORE STATES’ OUTCOME DATA FOR 2015Since 2006, UCP’s Case for Inclusion rankings have revealed how State’s Medicaid programs measure up in areas including how many individuals are supported in the community, how many participate in competitive employment and family support services and how States are doing helping those in need, including serving those languishing on waiting lists.
Responding to feedback from UCP affiliates, policymakers and advocates asking for more person-centered, outcome-oriented measurements to showcase if and how individuals are faring as an active part of their community, UCP made several major enhancements to the 2014 Case for Inclusion report to take a closer look at how Americans with intellectual and developmental disabilities are faring throughout the United States. The issue of inclusion remains UCP’s primary focus, but a more person-centered approach creates a better understanding of how it is defined. While it is a step in the right direction to close large State institutions that isolate individuals from the rest of their community and allow individuals a meaningful choice to live more independently in their own home or apartment or in small home-like settings, true inclusion means so much more:
• Are individuals still isolated at their non-institutional home? Are they happy or lonely? Do they have meaningful relationships and friends?
• Are individuals stuck in their residence, or do they regularly go out into the community and have an active and social presence in their neighborhoods?
• Are individuals getting healthier, since good health is key to a high quality of life?
• Are the families of individuals with disabilities healthy and functional? Are they receiving support in the community?
To better answer these questions about the true quality of life for Americans with intellectual and developmental disabilities and their families, substantial revisions were made to the Case for Inclusion index. A critical part of these changes was to emphasize the importance of the National Core Indicators (NCI), a survey that uses in-person interviews and extensive questioning to better reflect the true health, safety and quality of life of individuals, with 39 States participating and 19 States publicly reporting their survey results in 2014.
For the 2015 index, 42 States participated in NCI and 29 States reported their person-centered survey results for a much more national perspective and comparison. That makes this year’s ranking the most comprehensive look at person and family centered outcomes in those 29 States since UCP first started the Case for Inclusion in 2006.
UCP made several major enhancements to the 2014 Case for
Inclusion report to take a closer look at how Americans
with intellectual and developmental
disabilities are faring throughout the United States.
5CASE FOR INCLUSION 2015
In the past, UCP’s Case for Inclusion scored States on whether or not they participated in the NCI survey. Beginning in 2014, UCP used nine different NCI data measures from the survey, to paint a more complete picture of the quality of life and inclusion for individuals. In addition, UCP began ranking States on whether or not they participate in the NCI’s child survey, as part of the Keeping Families Together section of the Case for Inclusion ranking. In total, NCI-related data measures now make up 18 points of the 100-point Case for Inclusion scale, up from six points in prior rankings. States not participating and tracking outcomes through NCI see a loss of up to 20 points (States are given two points in Keeping Families Together if they also participate in NCI’s Child and Family Survey).
In addition, in 2014 UCP enhanced the Promoting Productivity section of the ranking by including measures on how successful States are at placing individuals in work through vocational rehab, the average number of hours worked and the placement rate of individuals participating in the program after one year.
In summary, in 2014, UCP added 14 new data measures (25 points out of 100), eliminated four measures that were no longer regularly updated or were not changing (15.5 points out of 100) and re-weighted another six measures to keep the full scale consistent at 100 points.
As always, the rankings in this report are a snapshot in time. Most data is from 2013, which is the most recent data available from credible, national sources. All data is sourced directly from the States to the federal government and in response to public surveys. Notably, there are weaknesses in some of the data sources. UCP references data from credible recognized sources, but much of the data is self-reported to those sources by the State themselves. UCP has experienced inherent definitional and numerical disparities in some data reported. For example, prior to 2010 Alaska estimated the number of individuals being served in a family home. In 2010, the State reported an exact number that was less than 10 percent of the prior estimate. UCP has also uncovered definitional variances between certain States in what qualifies as “competitive employment,” despite widely accepted definitions. When UCP discovers glaring anomalies in the data, our protocol is to follow up with the data sources and provide them an opportunity to correct the data. Nonetheless, UCP expects that there will be some inherent inconsistencies in data that is self-reported by all fifty States and the District of Columbia.

6CASE FOR INCLUSION 2015
Category Measure 2007–2013
2014 – 2015
2015 Data Source
Promoting Independence
Community-Based % of Recipients with ID/DD on HCBS 9
50
9
50
RTC% of ID/DD Expenditures on HCBS 7 7 RTC% of ID/DD Expenditures on Non-ICF-MR 8 8 Coleman
Residential Services in the Community (includes all types)
1-3 Residents - % 13 13 RTC1-6 Residents -% 11 11 RTC16+ Residents % (smaller %, higher rank) -4 -4 RTC% in Large State Facilities -3 -3 RTC
Waivers Promoting Self-Determination 2NCI - % Self-Directed 2 NCI
Tracking Health, Safety
& Quality of Life
Quality Assurance - NCI Participation 6
12
0
14
NCI - Recent Dental Visit 2.8 NCINCI - Lonely Less than Half the Time 2.8 NCINCI - Not Scared in Own Home 2.8 NCINCI - Inclusion (sum of 4 measures) 2.8 NCINCI - Relationships Other than Staff and Family 2.8 NCIAbuse 6
Keeping Families Together
Family Support per 100k 612
38
Coleman% in a Family Home 6 3 ColemanNCI - Child/Family Survey Participation 2 NCI
Promoting Productivity
Has Medicaid Buy-In Program 2
10
2
12
MathematicaCompetitive Employment - % 6.5 4.0 ICIVoc Rehab - per 100k 1.5Voc Rehab - Rehab Rate (finding a job) 2 ICIVoc Rehab - Number of Hours Worked 2 ICIVoc Rehab - Retain Job for One Year 2 ICI
Reaching Those in Need
Waiting List - Average % Growth for Residential and HCBS 9
16
9
16
RTC,KaiserIndividuals with ID/DD Served per 100k of Population 3 2 RTCRatio of Prevalence to Individuals Served 4 2 CensusUses Federal Functional Definition for Eligibility or Broader 3 NASDDDS
100 100
CENSUS: U.S. Census Bureau’s Annual Community Survey 2010.COLEMAN: The Coleman Institute for Cognitive Disabilities, University of Colorado — The State of the States in Developmental Disabilities’ State profiles (through fiscal year 2013).ICI: University of Massachusetts’ Institute for Community Inclusion – StateData: The National Report on Employment Services and Outcomes 2013.KAISER: Kaiser Family Foundation’s State Indicators – Waiting Lists for HCBS Waivers 2013.MATHEMATICA: Mathematica’s Enrollment, Employment, and Earnings in the| Medicaid Buy-In Program, 2011
NASDDDS: National Association of State Directors of Developmental Disabilities Services and Rutgers Center for State Health Policy — State Strategies for Determining Eligibility and Level of Care for ICF/MR and Waiver Program Participants 2008.NCI: Human Services Research Institute’s National Core Indicators Adult Consumer Survey for FY 2013–2014 and Child Family Survey for FY2012–2013 and FY2013–2014. RTC: University of Minnesota’s Research and Training Center’s — In-Home and Residential Long-Term Supports and Services for Persons with Intellectual or Developmental Disabilities: Status and Trends Through 2012 — Residential Information Systems Project (RISP) – advance copies of the 2015 report provided to UCP. The 2014 report is available online.
7CASE FOR INCLUSION 2015
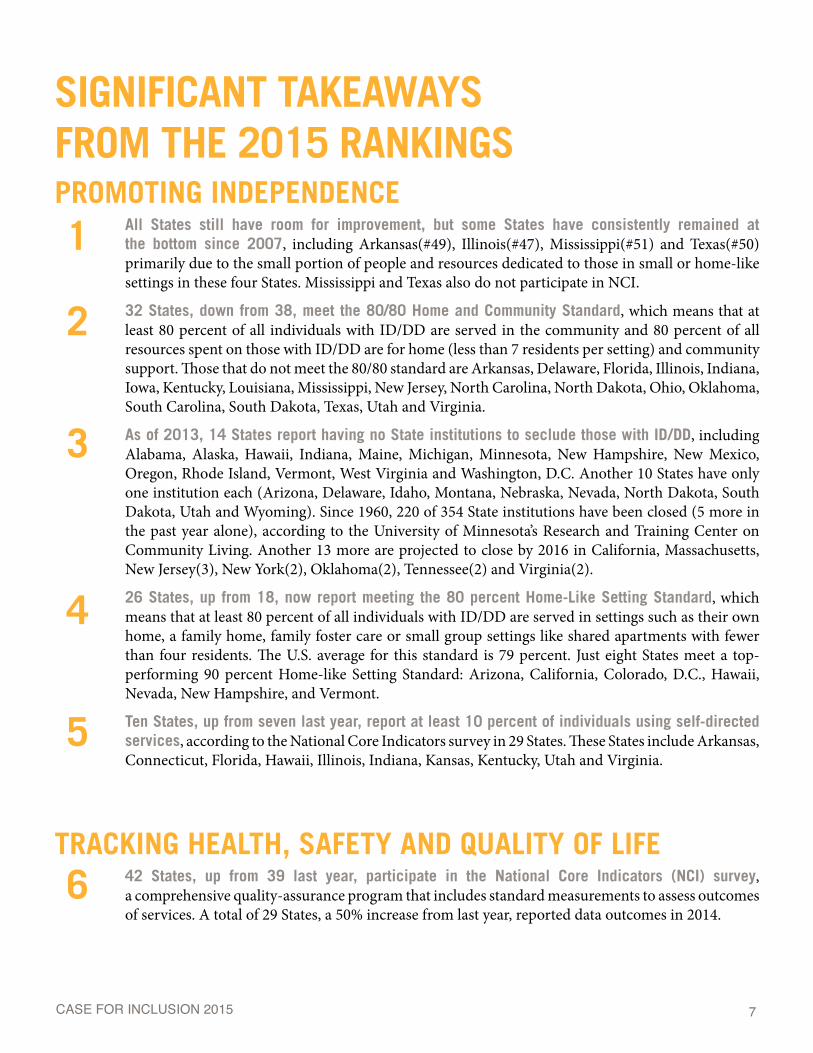
SIGNIFICANT TAKEAWAYS FROM THE 2015 RANKINGSPROMOTING INDEPENDENCE
All States still have room for improvement, but some States have consistently remained at the bottom since 2007, including Arkansas(#49), Illinois(#47), Mississippi(#51) and Texas(#50) primarily due to the small portion of people and resources dedicated to those in small or home-like settings in these four States. Mississippi and Texas also do not participate in NCI.
32 States, down from 38, meet the 80/80 Home and Community Standard, which means that at least 80 percent of all individuals with ID/DD are served in the community and 80 percent of all resources spent on those with ID/DD are for home (less than 7 residents per setting) and community support. Those that do not meet the 80/80 standard are Arkansas, Delaware, Florida, Illinois, Indiana, Iowa, Kentucky, Louisiana, Mississippi, New Jersey, North Carolina, North Dakota, Ohio, Oklahoma, South Carolina, South Dakota, Texas, Utah and Virginia.
As of 2013, 14 States report having no State institutions to seclude those with ID / DD, including Alabama, Alaska, Hawaii, Indiana, Maine, Michigan, Minnesota, New Hampshire, New Mexico, Oregon, Rhode Island, Vermont, West Virginia and Washington, D.C. Another 10 States have only one institution each (Arizona, Delaware, Idaho, Montana, Nebraska, Nevada, North Dakota, South Dakota, Utah and Wyoming). Since 1960, 220 of 354 State institutions have been closed (5 more in the past year alone), according to the University of Minnesota’s Research and Training Center on Community Living. Another 13 more are projected to close by 2016 in California, Massachusetts, New Jersey(3), New York(2), Oklahoma(2), Tennessee(2) and Virginia(2).
26 States, up from 18, now report meeting the 80 percent Home-Like Setting Standard, which means that at least 80 percent of all individuals with ID/DD are served in settings such as their own home, a family home, family foster care or small group settings like shared apartments with fewer than four residents. The U.S. average for this standard is 79 percent. Just eight States meet a top-performing 90 percent Home-like Setting Standard: Arizona, California, Colorado, D.C., Hawaii, Nevada, New Hampshire, and Vermont.
Ten States, up from seven last year, report at least 10 percent of individuals using self-directed services, according to the National Core Indicators survey in 29 States. These States include Arkansas, Connecticut, Florida, Hawaii, Illinois, Indiana, Kansas, Kentucky, Utah and Virginia.
TRACKING HEALTH, SAFETY AND QUALITY OF LIFE42 States, up from 39 last year, participate in the National Core Indicators (NCI) survey, a comprehensive quality-assurance program that includes standard measurements to assess outcomes of services. A total of 29 States, a 50% increase from last year, reported data outcomes in 2014.
1
2
3
4
5
6

8CASE FOR INCLUSION 2015
KEEPING FAMILIES TOGETHEROnly 14 States report that they are supporting a large share of families through family support (at least 200 families per 100,000 of population). These support services provide assistance to families that are caring for children with disabilities at home, which helps keep families together, and people with disabilities living in a community setting. These family-focused State programs were in Arizona, California, Delaware, Louisiana, Minnesota, Montana, New Hampshire, New Mexico, New York, South Carolina, South Dakota, Vermont, Wisconsin, and Wyoming. Alabama and Pennsylvania reported that they were providing higher levels of family support in last year’s ranking.
PROMOTING PRODUCTIVITYJust 8 States, down from 10 last year, report having at least 33 percent of individuals with ID/DD working in competitive employment. These States include Connecticut, Maryland, New Hampshire (newly added), New Mexico, Oklahoma, Vermont, Washington, and West Virginia (newly added). Louisiana, Nebraska, Oregon and Virginia reported that they met this threshold in last year’s ranking, but reported a decrease in competitive employment this year.
14 States report successfully placing at least 60 percent of individuals in vocational rehabilitation in jobs, with fifteen States reporting the average number of hours worked for those individuals placed being at least 25 hours and three States reporting at least half of those served getting a job within one year. Only California met the standard on all three success measures this year compared to last year’s ranking, when Nebraska and South Dakota were the only two States to report meeting all three thresholds.
SERVING THOSE IN NEEDWaiting lists for residential and community services are high and show the unmet need. More than 322,000 people, 5,000 more than last year, are on a waiting list for Home and Community-Based Services. This requires a daunting 44 percent increase in States’ HCBS programs. 16 States, a decrease from 22 last year, report no waiting list or a small waiting list (requiring less than 10 percent program growth).
7
8
9
10
9CASE FOR INCLUSION 2015
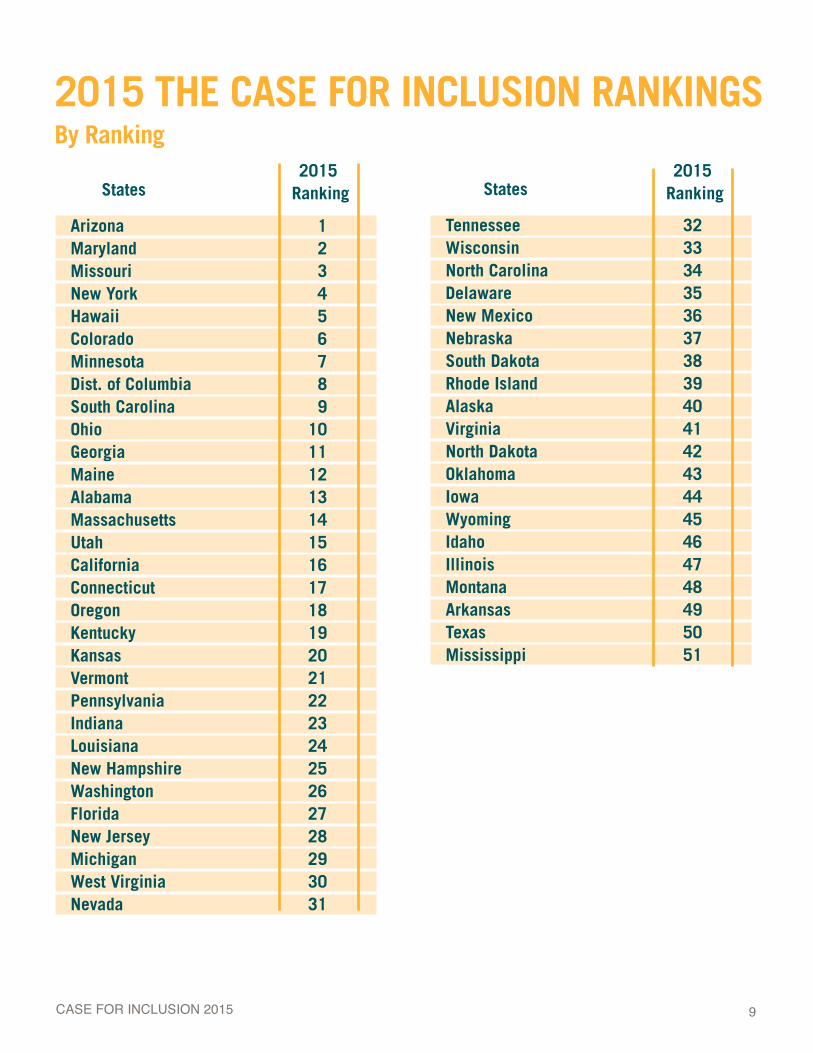
2015 THE CASE FOR INCLUSION RANKINGS
Tennessee 32Wisconsin 33North Carolina 34Delaware 35New Mexico 36Nebraska 37South Dakota 38Rhode Island 39Alaska 40Virginia 41North Dakota 42Oklahoma 43Iowa 44Wyoming 45Idaho 46Illinois 47Montana 48Arkansas 49Texas 50Mississippi 51
Arizona 1Maryland 2Missouri 3 New York 4Hawaii 5Colorado 6Minnesota 7Dist. of Columbia 8South Carolina 9Ohio 10Georgia 11Maine 12Alabama 13Massachusetts 14Utah 15California 16Connecticut 17Oregon 18Kentucky 19Kansas 20Vermont 21Pennsylvania 22Indiana 23Louisiana 24New Hampshire 25Washington 26Florida 27New Jersey 28Michigan 29West Virginia 30Nevada 31
StatesStates
By Ranking2015
Ranking2015
Ranking
10CASE FOR INCLUSION 2015
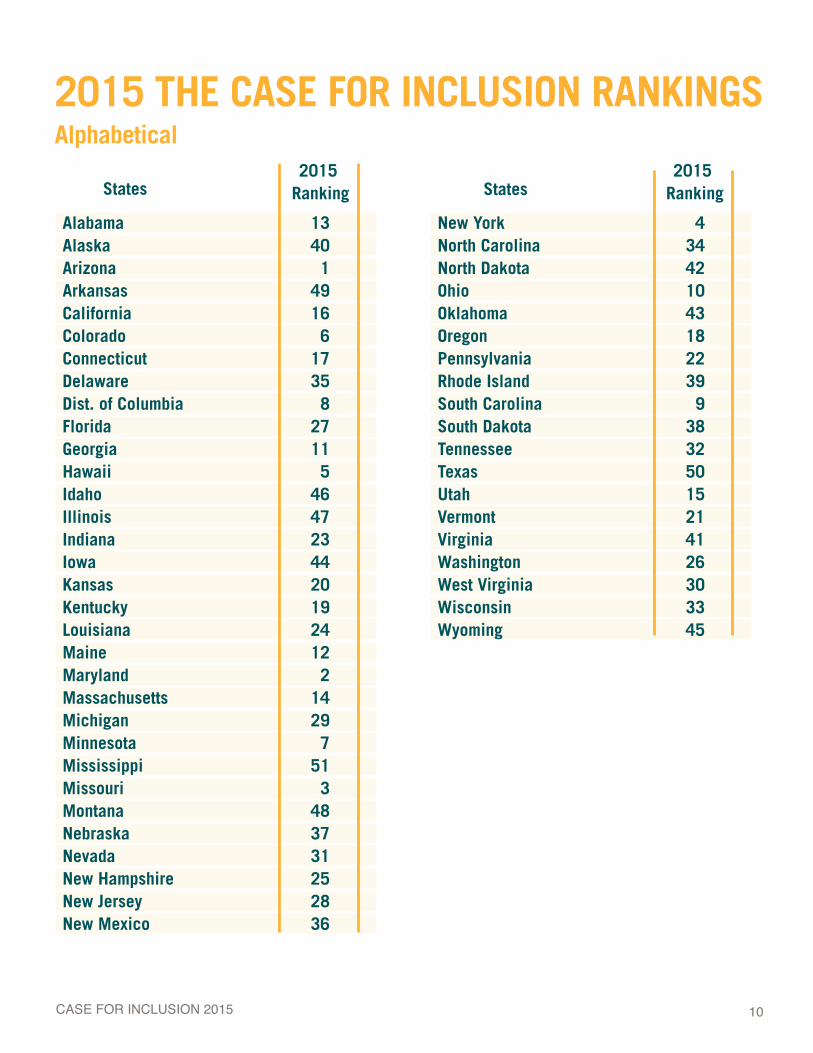
2015 THE CASE FOR INCLUSION RANKINGS Alphabetical
New York 4North Carolina 34North Dakota 42Ohio 10Oklahoma 43Oregon 18Pennsylvania 22Rhode Island 39South Carolina 9South Dakota 38Tennessee 32Texas 50Utah 15Vermont 21Virginia 41Washington 26West Virginia 30Wisconsin 33Wyoming 45
Alabama 13Alaska 40Arizona 1Arkansas 49California 16Colorado 6Connecticut 17Delaware 35Dist. of Columbia 8Florida 27Georgia 11Hawaii 5Idaho 46Illinois 47Indiana 23Iowa 44Kansas 20Kentucky 19Louisiana 24Maine 12Maryland 2Massachusetts 14Michigan 29Minnesota 7Mississippi 51Missouri 3Montana 48Nebraska 37Nevada 31New Hampshire 25New Jersey 28New Mexico 36
2015 Ranking
2015 Ranking StatesStates
11CASE FOR INCLUSION 2015
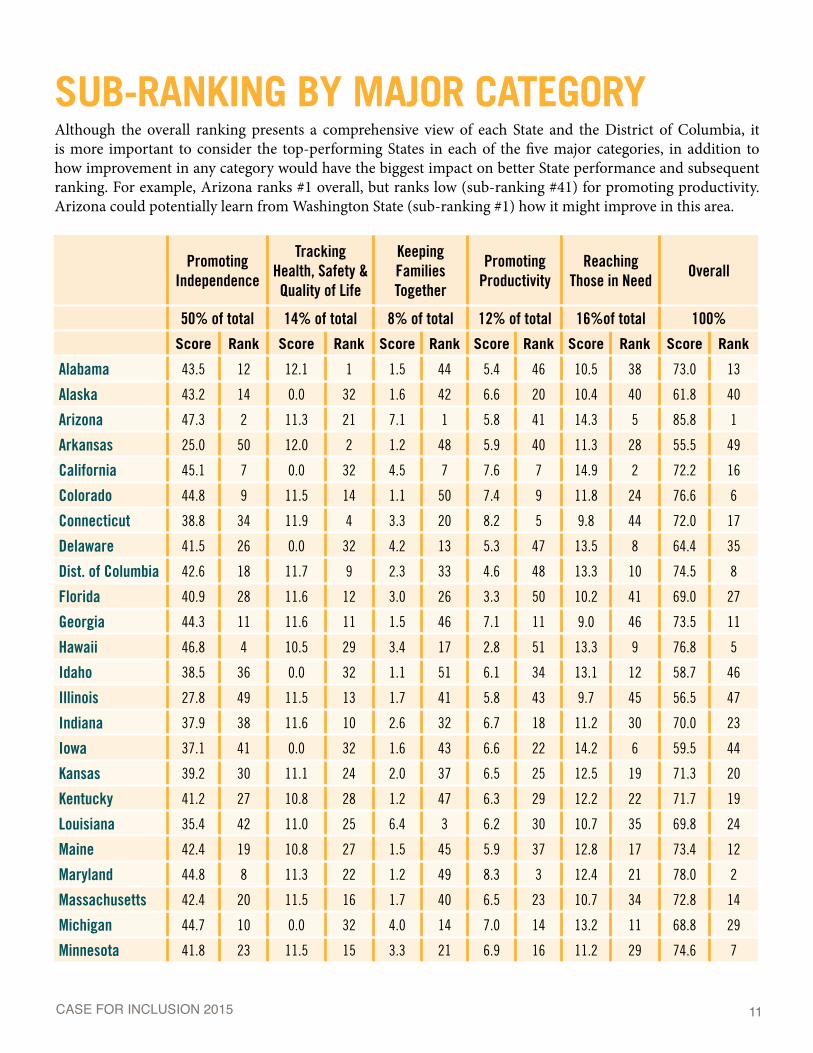
SUB-RANKING BY MAJOR CATEGORYAlthough the overall ranking presents a comprehensive view of each State and the District of Columbia, it is more important to consider the top-performing States in each of the five major categories, in addition to how improvement in any category would have the biggest impact on better State performance and subsequent ranking. For example, Arizona ranks #1 overall, but ranks low (sub-ranking #41) for promoting productivity. Arizona could potentially learn from Washington State (sub-ranking #1) how it might improve in this area.
Promoting Independence
Tracking Health, Safety & Quality of Life
Keeping Families Together
Promoting Productivity
Reaching Those in Need
Overall
50% of total 14% of total 8% of total 12% of total 16%of total 100%
Score Rank Score Rank Score Rank Score Rank Score Rank Score Rank
Alabama 43.5 12 12.1 1 1.5 44 5.4 46 10.5 38 73.0 13
Alaska 43.2 14 0.0 32 1.6 42 6.6 20 10.4 40 61.8 40
Arizona 47.3 2 11.3 21 7.1 1 5.8 41 14.3 5 85.8 1
Arkansas 25.0 50 12.0 2 1.2 48 5.9 40 11.3 28 55.5 49
California 45.1 7 0.0 32 4.5 7 7.6 7 14.9 2 72.2 16
Colorado 44.8 9 11.5 14 1.1 50 7.4 9 11.8 24 76.6 6
Connecticut 38.8 34 11.9 4 3.3 20 8.2 5 9.8 44 72.0 17
Delaware 41.5 26 0.0 32 4.2 13 5.3 47 13.5 8 64.4 35
Dist. of Columbia 42.6 18 11.7 9 2.3 33 4.6 48 13.3 10 74.5 8
Florida 40.9 28 11.6 12 3.0 26 3.3 50 10.2 41 69.0 27
Georgia 44.3 11 11.6 11 1.5 46 7.1 11 9.0 46 73.5 11
Hawaii 46.8 4 10.5 29 3.4 17 2.8 51 13.3 9 76.8 5
Idaho 38.5 36 0.0 32 1.1 51 6.1 34 13.1 12 58.7 46
Illinois 27.8 49 11.5 13 1.7 41 5.8 43 9.7 45 56.5 47
Indiana 37.9 38 11.6 10 2.6 32 6.7 18 11.2 30 70.0 23
Iowa 37.1 41 0.0 32 1.6 43 6.6 22 14.2 6 59.5 44
Kansas 39.2 30 11.1 24 2.0 37 6.5 25 12.5 19 71.3 20
Kentucky 41.2 27 10.8 28 1.2 47 6.3 29 12.2 22 71.7 19
Louisiana 35.4 42 11.0 25 6.4 3 6.2 30 10.7 35 69.8 24
Maine 42.4 19 10.8 27 1.5 45 5.9 37 12.8 17 73.4 12
Maryland 44.8 8 11.3 22 1.2 49 8.3 3 12.4 21 78.0 2
Massachusetts 42.4 20 11.5 16 1.7 40 6.5 23 10.7 34 72.8 14
Michigan 44.7 10 0.0 32 4.0 14 7.0 14 13.2 11 68.8 29
Minnesota 41.8 23 11.5 15 3.3 21 6.9 16 11.2 29 74.6 7
12CASE FOR INCLUSION 2015
Mississippi 8.4 51 2.6 30 2.1 35 5.6 45 10.5 37 29.2 51
Missouri 42.2 21 11.4 19 4.5 8 7.0 12 12.8 16 77.8 3
Montana 35.1 44 0.0 32 3.4 18 6.0 36 11.4 26 55.9 48
Nebraska 41.7 24 0.0 32 1.9 38 7.0 13 12.5 20 63.1 37
Nevada 45.6 6 0.0 32 3.0 25 6.7 19 10.1 42 65.4 31
New Hampshire 47.0 3 0.0 32 2.7 28 7.2 10 12.8 15 69.7 25
New Jersey 35.4 43 11.9 5 2.6 31 6.2 31 12.9 14 69.0 28
New Mexico 43.2 15 2.4 31 4.5 9 6.2 32 7.5 47 63.8 36
New York 39.2 32 11.4 20 4.3 12 6.4 26 15.5 1 76.8 4
North Carolina 30.3 48 11.8 6 4.4 11 6.5 24 11.8 23 64.9 34
North Dakota 37.3 40 0.0 32 2.2 34 6.6 21 14.3 4 60.4 42
Ohio 39.2 31 11.4 17 5.9 4 6.1 33 11.2 31 73.8 10
Oklahoma 34.6 45 11.4 18 2.0 36 5.9 38 5.6 49 59.5 43
Oregon 45.8 5 0.0 32 4.4 10 7.7 6 14.0 7 72.0 18
Pennsylvania 39.2 33 11.8 7 3.2 22 6.4 28 10.0 43 70.6 22
Rhode Island 43.4 13 0.0 32 2.7 29 5.7 44 10.6 36 62.4 39
South Carolina 38.3 37 11.7 8 6.4 2 6.9 15 10.9 32 74.3 9
South Dakota 37.8 39 0.0 32 3.1 24 7.6 8 14.5 3 63.0 38
Tennessee 42.7 17 12.0 3 1.7 39 4.0 49 4.7 50 65.1 32
Texas 31.6 47 0.0 32 3.3 19 5.8 42 0.8 51 41.5 50
Utah 40.2 29 10.9 26 3.7 16 6.4 27 11.6 25 72.8 15
Vermont 47.3 1 0.0 32 3.8 15 8.6 2 10.9 33 70.6 21
Virginia 33.9 46 11.2 23 2.7 30 5.9 39 7.3 48 61.0 41
Washington 41.8 22 0.0 32 4.6 6 10.1 1 13.0 13 69.5 26
West Virginia 41.7 25 0.0 32 3.1 23 8.3 4 12.6 18 65.7 30
Wisconsin 42.8 16 0.0 32 4.7 5 6.1 35 11.3 27 64.9 33
Wyoming 38.8 35 0.0 32 2.9 27 6.8 17 10.4 39 58.9 45
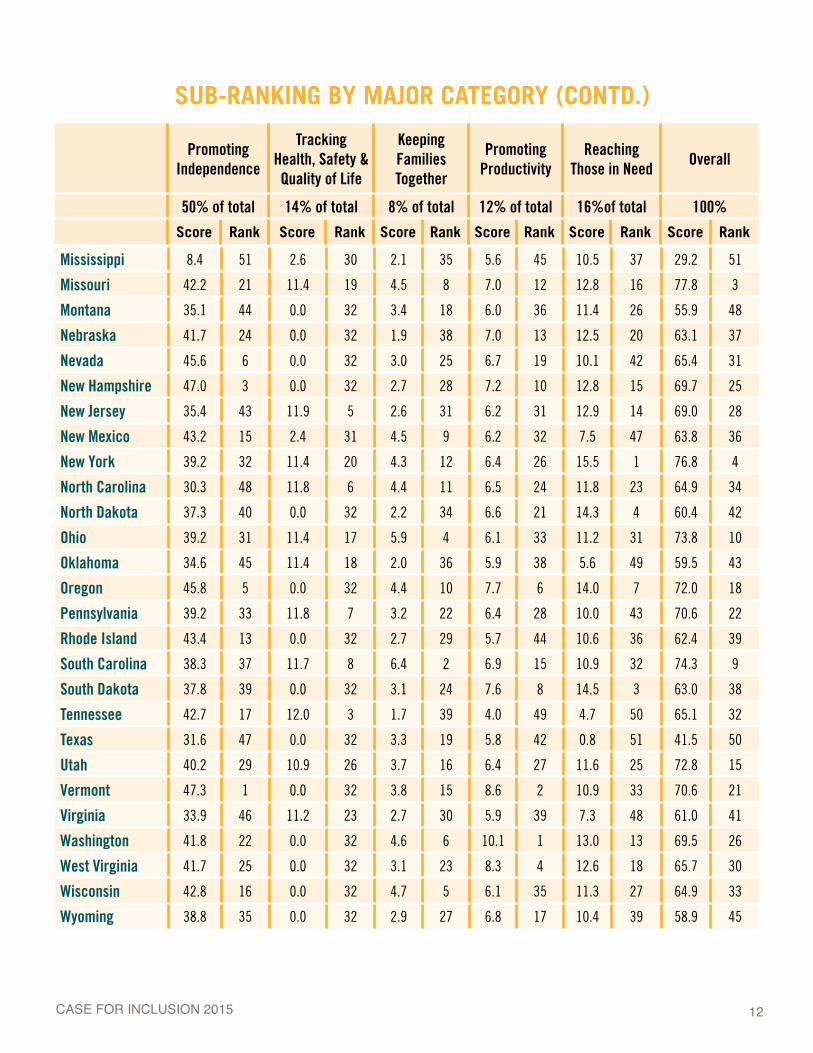
SUB-RANKING BY MAJOR CATEGORY (CONTD.)
Promoting Independence
Tracking Health, Safety & Quality of Life
Keeping Families Together
Promoting Productivity
Reaching Those in Need
Overall
50% of total 14% of total 8% of total 12% of total 16%of total 100%
Score Rank Score Rank Score Rank Score Rank Score Rank Score Rank

13CASE FOR INCLUSION 2015
MOST IMPROVED AND BIGGEST DROPS SINCE 2007
Dist. of Columbia 8 49 41Missouri 3 41 38Ohio 10 48 38Maryland 2 33 31Kentucky 19 40 21Utah 15 36 21Louisiana 24 44 20Alabama 13 32 19Georgia 11 30 19
Vermont 21 3 -18Michigan 29 9 -20Delaware 35 14 -21Idaho 46 25 -21New Mexico 36 13 -23Wyoming 45 17 -28Montana 48 19 -29Alaska 40 2 -38
2015 Difference 07–152007
IMPROVED
DROPPEDMOST IMPROVED STATES
District of Columbia Reports a significant increase in the share of individuals (from 44 percent to 82 percent) and resources (from 10 percent to 64 percent) dedicated to those receiving home and community-based services. Now reports 92% of those served are in home-like settings.
Missouri Dramatically increased the portion of resources dedicated to people in the community (from 59 percent to 86 percent), closed six State institutions, reducing by 57 percent the number
of individuals isolated in large State institutions, and started participating in and reporting outcomes for the NCI.
Ohio Dramatically increased the share of individuals (from 63 percent to 83 percent) and resources (from 50 percent to 64 percent) dedicated to the community, closed a State institution, reduced by more than half the portion of individuals served in large institutions (from 18 percent to 6 percent), started participating in and reporting outcomes for the NCI.
41 places
38places
38places

14CASE FOR INCLUSION 2015
Maryland Substantially increased the portion of resources dedicated to people in the community (from 86 percent to 100 percent), dramatically increased the portion of people served in home-like settings (from 74 percent to 83 percent), closed the last two State institutions, started participating and reporting outcomes for the NCI, and added a Medicaid Buy-In program.
Kentucky Reports an increase in the share of individuals (from 79 percent to 97 percent) and resources (from 63 percent to 73 percent) dedicated to the community and reduced the population at State institutions by 59 percent. It also added a Medicaid Buy In program to support coverage when individuals work and increase their income.
Utah Substantially increased the portion of resources dedicated to people in the community (from 64 percent to 83 percent), and started participating and reporting outcomes for the NCI.
Louisiana Had a huge improvement in the portion of individuals (from 49 percent to 73 percent) and resources (from 41 percent to 54 percent) dedicated to community services, closed six large State institutions and had a significant drop in the portion of individuals served in large institutions (from 18 percent to 2 percent).
Alabama Closed its only large State institution and reports a significant increase in competitive employment (from 4 percent to 24 percent).
Georgia Reports a significant increase in the share of individuals (from 88 percent to 95 percent) and resources (from 73 percent to 88 percent) dedicated to the community, closed three large State institutions and reduced the population at State institutions by 75 percent.
STATES WITH THE BIGGEST DROPSAlaska Fell dramatically because the number of people being served in a family home was previously estimated (by the State) at 3,700 for the 2007 ranking. Beginning with the 2010 ranking, it was reported accurately at around 200 people served in a family home. Alaska does not participate in NCI and therefore loses out gaining a better understanding of individuals’ true quality of life and inclusion and the related points participating in that survey provides.
Montana down 29 places: Reported a significant 46 percent reduction in the portion of individuals served in home-like settings (from 80 percent to 44 percent) and does not participate in the NCI.
Wyoming Primarily due to the fact that it does not participate in NCI. Remained stagnant while most other States improved overall causing the State to fall in comparison to others, and had a drop in competitive employment (from 25 percent to 18 percent).
31places
21places
21places
20places
19places
19places
38places
28places
29places
15CASE FOR INCLUSION 2015
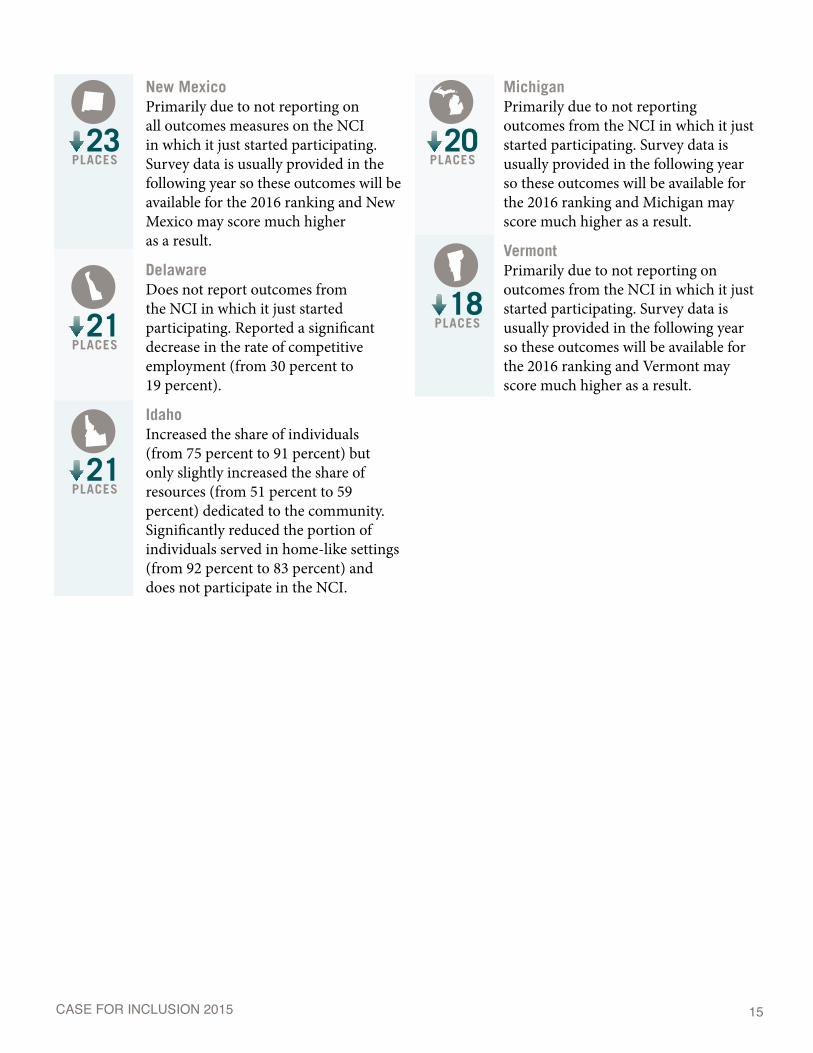
New Mexico Primarily due to not reporting on all outcomes measures on the NCI in which it just started participating. Survey data is usually provided in the following year so these outcomes will be available for the 2016 ranking and New Mexico may score much higher as a result.
Delaware Does not report outcomes from the NCI in which it just started participating. Reported a significant decrease in the rate of competitive employment (from 30 percent to 19 percent).
Idaho Increased the share of individuals (from 75 percent to 91 percent) but only slightly increased the share of resources (from 51 percent to 59 percent) dedicated to the community. Significantly reduced the portion of individuals served in home-like settings (from 92 percent to 83 percent) and does not participate in the NCI.
Michigan Primarily due to not reporting outcomes from the NCI in which it just started participating. Survey data is usually provided in the following year so these outcomes will be available for the 2016 ranking and Michigan may score much higher as a result.
Vermont Primarily due to not reporting on outcomes from the NCI in which it just started participating. Survey data is usually provided in the following year so these outcomes will be available for the 2016 ranking and Vermont may score much higher as a result.
21places
21places
23places
20places
18places
16CASE FOR INCLUSION 2015
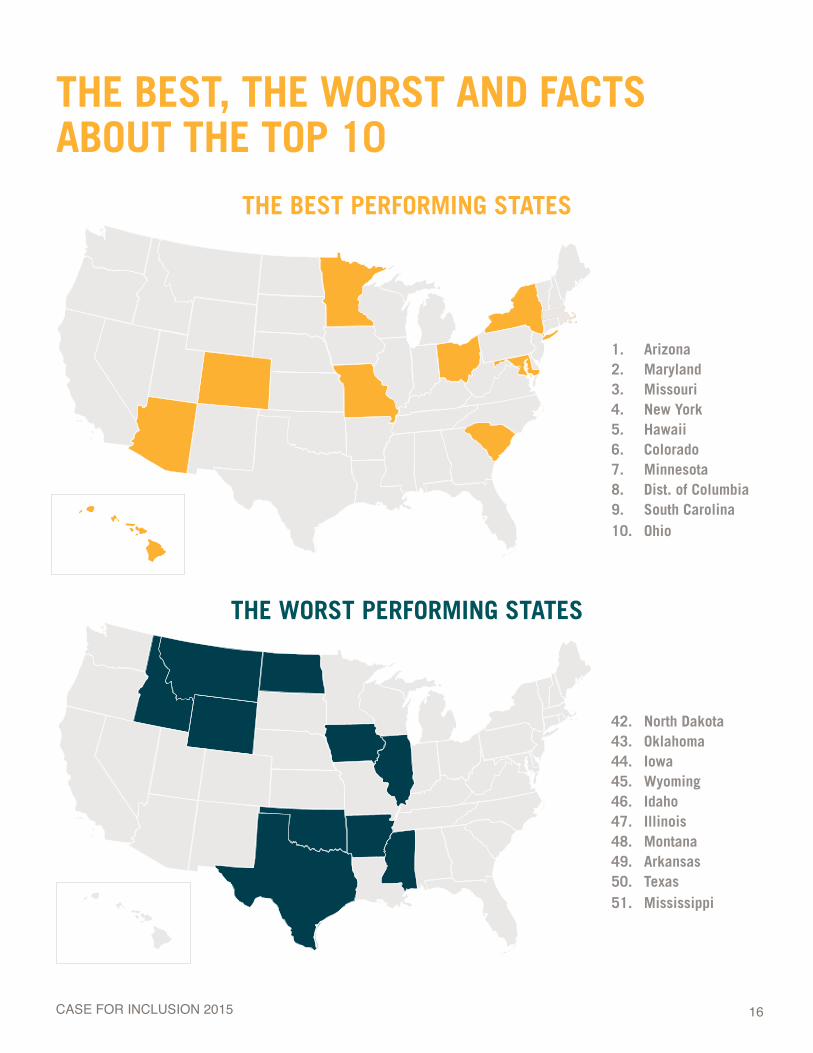
THE BEST, THE WORST AND FACTS ABOUT THE TOP 10
THE BEST PERFORMING STATES
THE WORST PERFORMING STATES
1. Arizona2. Maryland3. Missouri4. New York5. Hawaii6. Colorado7. Minnesota8. Dist. of Columbia9. South Carolina10. Ohio
42. North Dakota43. Oklahoma44. Iowa45. Wyoming46. Idaho47. Illinois48. Montana49. Arkansas50. Texas51. Mississippi
17CASE FOR INCLUSION 2015
FACTS ABOUT THE BEST PERFORMING STATES
Top Performers are both big and small States in population — “big” population States include New York (3rd biggest) and Ohio (#7) as well as “small” population States such as Hawaii (#40) and the District of Columbia (#49).
Top Performers are both rich and poor States in terms of median family income — “rich” States include Maryland (2nd richest), Hawaii (8th richest), and D.C. (9th richest) and less affluent States such as Ohio (#40) and South Carolina (#44).
Top Performers are high tax and low tax burden States — “high tax burden” States include New York (#1), Minnesota (#6), and Maryland (#7) and “low tax burden” States include Arizona (#35), South Carolina (#42), and Missouri and Colorado (tied for #33).
Top Performers are big and low spenders per person served through the Home and Community-Based Services — “big spender” States are New York (#11) and D.C. (#3) and “low spender” States include Arizona (#50), Maryland (#44), and South Carolina (#45).
Top Performers are politically diverse. Seven of the top ten are “Blue States,” according to their 2012 Presidential Election results, while three “Red States” were in the top ten.
1
2
3
4
5
Population and Median Family Income data is from the Kaiser Family Foundation using U.S. Census Bureau data. Tax burden data is from the Tax Foundation. And spending data is from Research and Training Center’s RISP 2014 Report (table 4.2).
Transition Case Study
18CASE FOR INCLUSION 2015
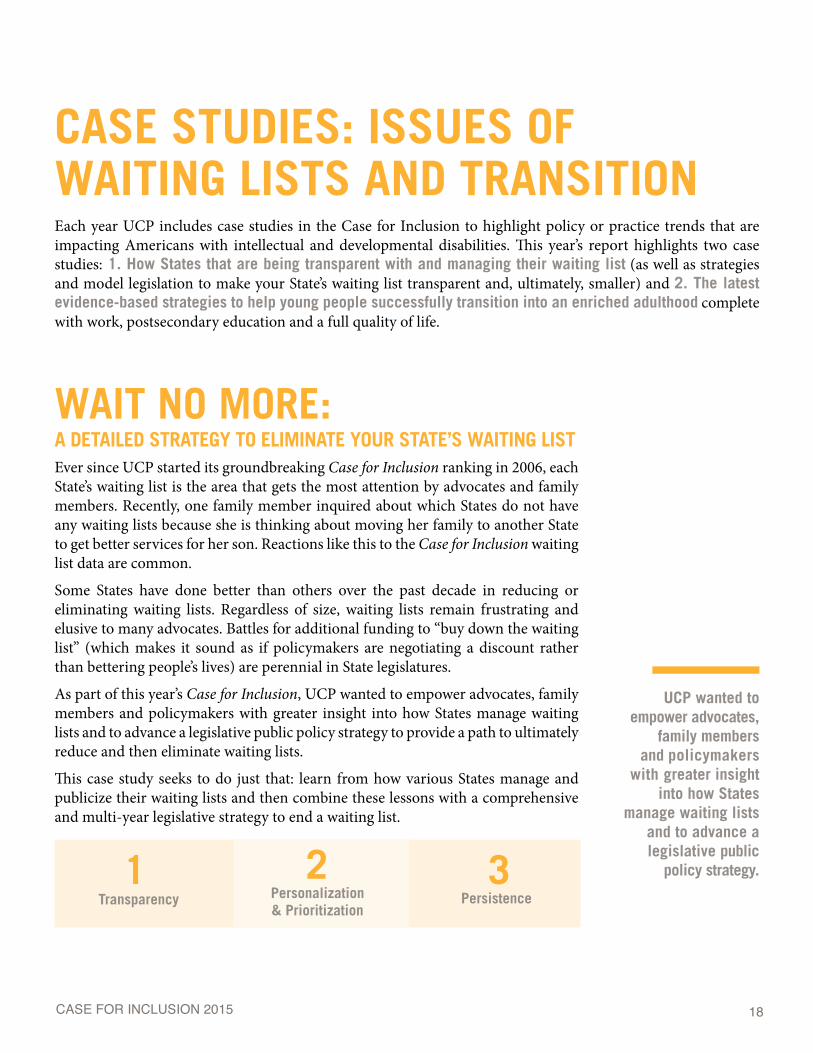
Each year UCP includes case studies in the Case for Inclusion to highlight policy or practice trends that are impacting Americans with intellectual and developmental disabilities. This year’s report highlights two case studies: 1. How States that are being transparent with and managing their waiting list (as well as strategies and model legislation to make your State’s waiting list transparent and, ultimately, smaller) and 2. The latest evidence-based strategies to help young people successfully transition into an enriched adulthood complete with work, postsecondary education and a full quality of life.
CASE STUDIES: ISSUES OF WAITING LISTS AND TRANSITION
WAIT NO MORE: A DETAILED STRATEGY TO ELIMINATE YOUR STATE’S WAITING LISTEver since UCP started its groundbreaking Case for Inclusion ranking in 2006, each State’s waiting list is the area that gets the most attention by advocates and family members. Recently, one family member inquired about which States do not have any waiting lists because she is thinking about moving her family to another State to get better services for her son. Reactions like this to the Case for Inclusion waiting list data are common.
Some States have done better than others over the past decade in reducing or eliminating waiting lists. Regardless of size, waiting lists remain frustrating and elusive to many advocates. Battles for additional funding to “buy down the waiting list” (which makes it sound as if policymakers are negotiating a discount rather than bettering people’s lives) are perennial in State legislatures.
As part of this year’s Case for Inclusion, UCP wanted to empower advocates, family members and policymakers with greater insight into how States manage waiting lists and to advance a legislative public policy strategy to provide a path to ultimately reduce and then eliminate waiting lists.
This case study seeks to do just that: learn from how various States manage and publicize their waiting lists and then combine these lessons with a comprehensive and multi-year legislative strategy to end a waiting list.
1 2Personalization & Prioritization
Transparency Persistence3
UCP wanted to empower advocates,
family members and policymakers
with greater insight into how States
manage waiting lists and to advance a legislative public
policy strategy.
19CASE FOR INCLUSION 2015
1. TRANSPARENCYKnowledge is power but withholding knowledge is even more power.
In many State Medicaid programs serving those with intellectual and developmental disabilities, this truism is not just known but it is a preferred business practice. When a State does not maintain a waiting list or maintains one with minimal or outdated information, that withheld knowledge means that advocates do not have the tools to adequately define the scope of the need and family members waiting have no sense of context of when their need may be addressed. In addition, legislatures do not necessarily have all the information that enables them to make sound, evidenced-based legislative decisions.
It doesn’t have to be this way. In many States it is not. In all States it should not.
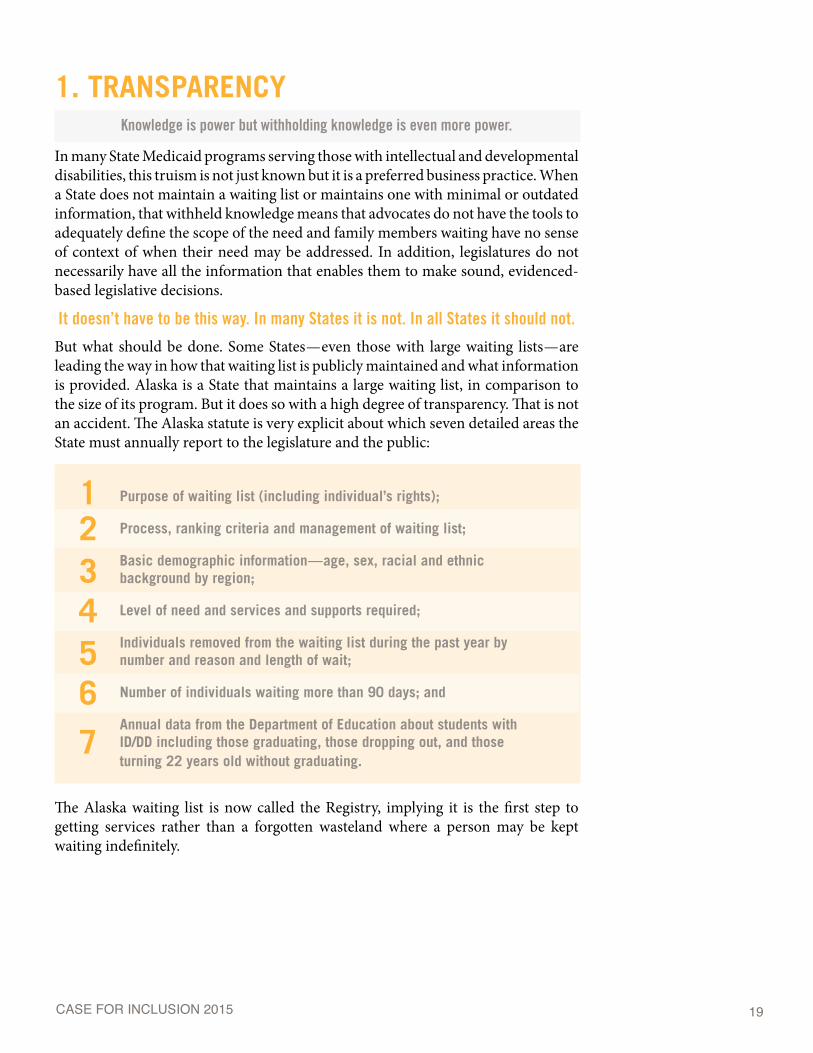
But what should be done. Some States — even those with large waiting lists — are leading the way in how that waiting list is publicly maintained and what information is provided. Alaska is a State that maintains a large waiting list, in comparison to the size of its program. But it does so with a high degree of transparency. That is not an accident. The Alaska statute is very explicit about which seven detailed areas the State must annually report to the legislature and the public:
Purpose of waiting list (including individual’s rights);
Process, ranking criteria and management of waiting list;
Basic demographic information — age, sex, racial and ethnic background by region;
Level of need and services and supports required;
Individuals removed from the waiting list during the past year by number and reason and length of wait;
Number of individuals waiting more than 90 days; and
Annual data from the Department of Education about students with ID/DD including those graduating, those dropping out, and those turning 22 years old without graduating.
1234567
The Alaska waiting list is now called the Registry, implying it is the first step to getting services rather than a forgotten wasteland where a person may be kept waiting indefinitely.

20CASE FOR INCLUSION 2015
• The number of people on the waiting list has dropped to 613 in 2013 from 1006 in 2006, a drop of 39%.
• The number of kids on the waiting list (those under 22 years old) has dropped to 431 in 2013 from 818 in 2006, a drop of 47%.
• Most of those on the waiting lists are under 22 (70%).
• The average wait time for someone on the waiting list is 41 months (about the same as it was in 2006 at 38 months).
• It would require $23 million in State Medicaid funding to meet the annual need for the waiting list, and these taxpayer costs are broken out in detail by type of service and number of people needing that service.
• In 2013, 363 people moved off the waiting list (59% of the total waiting) during the year, showing how dynamic the Registry is. Most of those (209 or 34%) were moved off the waiting list because they received services. Those individuals spent an average of 25 months on the Registry. Another 119 were unresponsive to information requests to update their status.
The report further breaks down the waiting list by region, gender, and age in much more detail.
This compares to another State such as Utah. Utah publishes an extensive annual report (2012 edition) of services provided by its Division of Services for People with Disabilities. That report has some detailed service information and a fair amount of historical data. However, its waiting list data consists of one page with six charts and no detail, unlike that provided by the State of Alaska. That is, in part, because the Utah Division decides what data and level of detail will be provided, and that can vary from year to year. That lack of transparency in one place means that advocates and family members do not readily have the tools to understand the need on the waiting list and then advocate for funding or prioritization of those needs. In its defense, the State of Utah does host extensive dashboards of services provided and of people waiting by service. But this information is still not as comprehensive on those waiting as that provided by Alaska. But despite Utah’s lack of transparency, it is still more comprehensive than what Minnesota provides. Its annual waiting list report is simply a list of the number of individuals waiting by county, with no further detail.
To have full transparency, advocates should work with State legislators to have the following waiting list model legislation, built off the Alaska statute, passed into law in their State:
Looking at the 2013 report compared to the 2006 one, one learns that:
MODEL LEGISLATIONAn Act to Create a Transparent Waiting List for Those with Intellectual and Developmental Disabilities in Need

21CASE FOR INCLUSION 2015
Describe the purpose for the waiting list and the strategies used to notify persons about the waiting list, and must include a copy of the information used by the department to inform individuals and families about their rights and responsibilities under [relevant section of State law];
Explain how an individual is placed on the waiting list, what criteria determine rank on the list, with at least quarterly updates to such assessments, and how the waiting list is used to select individuals equitably and fairly across the State;
Give the basic demographic information across all regions about the age (under 22 years old, from 23 to 39 years old, from 40 to 59 years old and more than 59 years old), gender, and racial and ethnic background of the individuals on the waiting list;
Identify the level of need and preferences of the individuals and families on the waiting list for the services and the supports that may be necessary to meet their needs and project an annual cost to meet this need and show these costs by age and length of time the individual has remained on the waiting list;
Identify how many individuals were removed from the waiting list during the 12 months covered by the report, why they were removed from the list, and how long the individuals had been waiting for services or supports before they were removed from the list, shown by age;
List the number of individuals who have been on the waiting list for 6 months, 12 months, 24 months, 36 months, 48 months, or more by age and with an account of the department's steps to regularly review each individual's status while waiting for services or supports;
Report annual data from the [education department] about the number of students in special education with developmental disabilities graduating from high school, dropping out of high school before reaching age 22, or reaching age 22 without graduating from high school.
1
2
3
4
5
6
7
[To amend State statute delineating the duties of the Department serving those with intellectual and developmental disabilities]
When State funding is not adequate to meet service needs, the department shall establish a waiting list, to be called the registry, for persons with developmental disabilities who would be eligible to receive State-funded services under [reference relevant statute] if adequate State funding were available. The department shall, on an annual basis, review the waiting list and submit a report to the governor containing the information required under this subsection. The department shall send a copy of the report to the persons chairing the House and Senate finance committees and the persons chairing the House and Senate health, education and social services committees and shall notify the full legislature that the report is available to all legislators. The report must:

22CASE FOR INCLUSION 2015
2. PERSONALIZATION AND PRIORITIZATIONTransparency gives advocates a complete picture of those on the waiting list. However, the challenge with advocates mobilizing in support of prioritizing services for those on the waiting list is that the State solely maintains that list and the contact information of those on it. That greatly limits the ability to easily educate the family members and those on the waiting list. Without this, the ability to influence the department, the governor’s budget staff and legislators is greatly diminished.
UCP affiliates have shown how informed individuals, advocates and family members can accomplish great things. The same would be true of those on the waiting list. But more than that, those on the waiting list need to access the same accountability structure that those actually receiving HCBS services have. That is why States should be required to refer all those individuals approved for the waiting list to the Protection and Advocacy Systems that ensure the legal rights of those receiving services are respected. In addition, the primary care physician for the medical services that Medicaid is funding should be informed of the fact that his or her patient is on the waiting list and of that patient’s rank on the list. This will ensure that if the physician has information that may affect the State’s determination of the patient’s rank on the list, then the physician is aware and can follow-up with the State to provide more information and context.
It is vital to humanize and personalize those on the waiting list. The perennial fight for additional funding for those on the waiting list is made so much more difficult when the media and advocates are limited in finding real people languishing. But the physicians and Protection and Advocacy Systems, receiving permission from those waiting individuals and working with their family members, can tell their stories in the media and mobilize them to testify before the legislature and to contact policymakers in support of prioritized services and funding. That personalization and prioritization is vital in any public policy reform strategy. The challenge is for advocates to be able to rise above the noise of other pressing public policy issues facing the governor and lawmakers. The best way to do that is to put a face – or dozens of faces – on the situation. The best faces are those who are in the greatest need and who have been waiting the longest.
In 2007, UCP published the Plan for Inclusion, a detailed strategy on how to advance public policy reforms in your State that improve the lives and services for those with intellectual and developmental disabilities. This Plan includes detailed strategies and tactics that allow advocates to personalize and prioritize the people that would be helped with additional funding to reduce the waiting list.
23CASE FOR INCLUSION 2015
3. PERSISTENCENow with the information to understand the waiting list (Transparency) and the structure to Personalize and Prioritize, the last step is Persistence. Public change and additional funding to reduce the waiting list does not happen overnight. Medicaid was first established in 1965, fifty years ago. Waiting lists have been an issue for a long time. However, as with so many initiatives, it requires persistence and sustained effort over many years to accomplish something as important and monumental as reducing and eventually eliminating the waiting list.
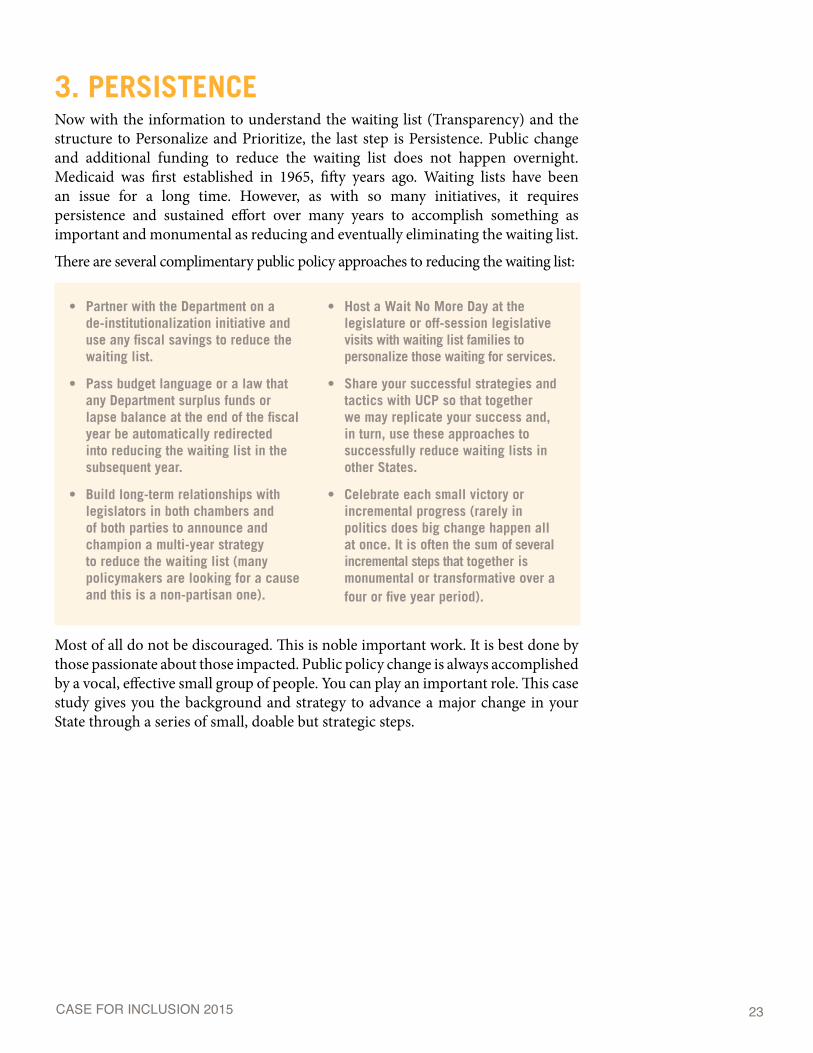
There are several complimentary public policy approaches to reducing the waiting list:
• Partner with the Department on a de-institutionalization initiative and use any fiscal savings to reduce the waiting list.
• Pass budget language or a law that any Department surplus funds or lapse balance at the end of the fiscal year be automatically redirected into reducing the waiting list in the subsequent year.
• Build long-term relationships with legislators in both chambers and of both parties to announce and champion a multi-year strategy to reduce the waiting list (many policymakers are looking for a cause and this is a non-partisan one).
• Host a Wait No More Day at the legislature or off-session legislative visits with waiting list families to personalize those waiting for services.
• Share your successful strategies and tactics with UCP so that together we may replicate your success and, in turn, use these approaches to successfully reduce waiting lists in other States.
• Celebrate each small victory or incremental progress (rarely in politics does big change happen all at once. It is often the sum of several incremental steps that together is monumental or transformative over a four or five year period).
Most of all do not be discouraged. This is noble important work. It is best done by those passionate about those impacted. Public policy change is always accomplished by a vocal, effective small group of people. You can play an important role. This case study gives you the background and strategy to advance a major change in your State through a series of small, doable but strategic steps.
24CASE FOR INCLUSION 2015
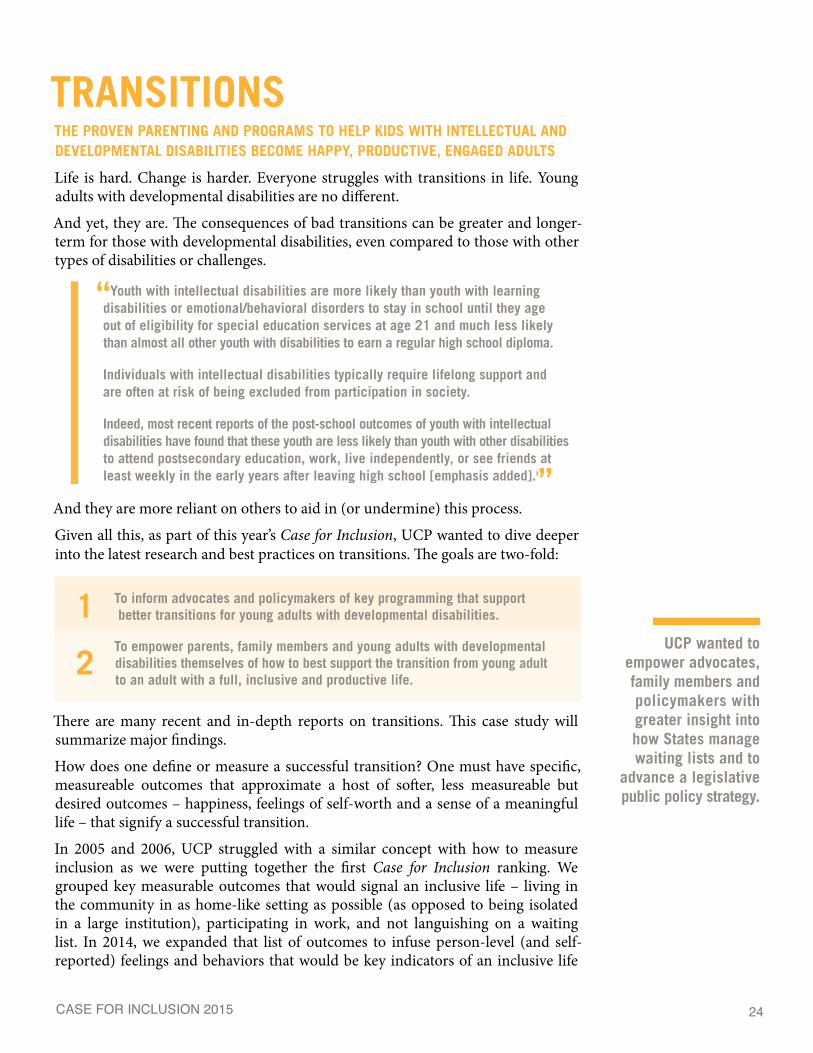
TRANSITIONS THE PROVEN PARENTING AND PROGRAMS TO HELP KIDS WITH INTELLECTUAL AND DEVELOPMENTAL DISABILITIES BECOME HAPPY, PRODUCTIVE, ENGAGED ADULTS
Life is hard. Change is harder. Everyone struggles with transitions in life. Young adults with developmental disabilities are no different.
And yet, they are. The consequences of bad transitions can be greater and longer-term for those with developmental disabilities, even compared to those with other types of disabilities or challenges.
1
2
To inform advocates and policymakers of key programming that support better transitions for young adults with developmental disabilities.
To empower parents, family members and young adults with developmental disabilities themselves of how to best support the transition from young adult to an adult with a full, inclusive and productive life.
There are many recent and in-depth reports on transitions. This case study will summarize major findings.
How does one define or measure a successful transition? One must have specific, measureable outcomes that approximate a host of softer, less measureable but desired outcomes – happiness, feelings of self-worth and a sense of a meaningful life – that signify a successful transition.
In 2005 and 2006, UCP struggled with a similar concept with how to measure inclusion as we were putting together the first Case for Inclusion ranking. We grouped key measurable outcomes that would signal an inclusive life – living in the community in as home-like setting as possible (as opposed to being isolated in a large institution), participating in work, and not languishing on a waiting list. In 2014, we expanded that list of outcomes to infuse person-level (and self-reported) feelings and behaviors that would be key indicators of an inclusive life
“Youth with intellectual disabilities are more likely than youth with learning disabilities or emotional/behavioral disorders to stay in school until they age out of eligibility for special education services at age 21 and much less likely than almost all other youth with disabilities to earn a regular high school diploma.
Individuals with intellectual disabilities typically require lifelong support and are often at risk of being excluded from participation in society.
Indeed, most recent reports of the post-school outcomes of youth with intellectual disabilities have found that these youth are less likely than youth with other disabilities to attend postsecondary education, work, live independently, or see friends at least weekly in the early years after leaving high school [emphasis added].i”
And they are more reliant on others to aid in (or undermine) this process.
Given all this, as part of this year’s Case for Inclusion, UCP wanted to dive deeper into the latest research and best practices on transitions. The goals are two-fold:
UCP wanted to empower advocates, family members and policymakers with greater insight into how States manage waiting lists and to
advance a legislative public policy strategy.

25CASE FOR INCLUSION 2015
– self-directing services and providers, regularly going into the community (church, errands, for entertainment, and for dining), having (non-staff) friends, not feeling lonely, feeling safe, and receiving health care.
The transitions research takes a similar approach.
To best measure a successful transition, researchers used a national longitudinal survey of parents, youth, teachers and school officials called the National Longitudinal Transition Study-2 (NLTS2) which ran from 2000 to 2009 (for those ages 13 to 16 at the start of the study) to chart four key outcomes to best measure a successful transition within four years after high school for 490 youthii:
So if those are the outcomes one wants for youth to have through a successful transition. What does it take to accomplish them? Using regression analysis, researchers identified key characteristics (demographic and family involvement) and best practices (formal school transition program activities) that had the strongest impact on a student having success in all four transition outcome areas. Even more interesting, was the extent of that impact.
Positive Outcome Characteristic Impact
Employment
Parent expects employment 32x more likely to be employed
High family income 7x more likely to be employed
Completed high school 6x more likely to be employed
High functional academics 3x more likely to be employed
Postsecondary
Education
Parent expects employment 4x more likely to be enrolled
High functional academics 4x more likely to be enrolled
Parent expects postsecondary education 3x more likely to be enrolled
Medium family income 2x more likely to be enrolled
Enjoyment of Life Parent expects employment 6x more likely to enjoy life
Social Interactions Completed high school 12x more likely to be social
Key Family Characteristics for a Successful Transition within Two to Four Yearsiii
34
1
2
Positive Outcome Details
Percent Reporting
within 2– 4 Years after High School
Employment In any job, for any number of hours 41%
Postsecondary Education Enrolled after high school training 35%
Enjoyment of Life Answering “a lot” or “most” of the time to a survey question about how often the
individual enjoys life74%
Social Interactions
Answering at least weekly to a survey question about how often the individual
gets together with friends outside of organized activities or groups
72%
12
3
4

26CASE FOR INCLUSION 2015
From this, it is clear that families have a tremendous impact on the successful transition of their children into a full and rich adulthood. Most importantly, parents must:
Expect employment for their child 85% of parents said they did
Expect postsecondary education for their child Only 38% of parents said they did
Ensure high functional academic skills are realized by their child Only 45% of students reported high functional skills in four key areas
Ensure their child completes high school 81% of students did
And while having a medium to high family income helps with a successful transition to employment and postsecondary education, it is not the most important characteristic and clearly this is not something families can easily change. The other four strategies for parents listed above can be accomplished regardless of income and, often, regardless of location (urban or rural). That’s exciting and provides a clear, focused roadmap of how parents can lead their child into a successful transition and, ultimately, a full adult life.
Now, what about the student. What programming should the student receive that will equip him or her to transition successfully into adulthood? This same research asked that question and look at the key programming that aided in that transition.
3
4
12
Most Impactful Programs for a Successful Transition within Two to Four Years i v
Positive Outcome Best Practice Impact
Employment Received work experiences 5x more likely to be employed
Received youth involvement 5x more likely to be employed
Postsecondary Education
Received family involvement 41x more likely to be enrolled
Received life skills instruction 9x more likely to be enrolled
Received youth involvement 2x more likely to be enrolled
Enjoyment of Life
Received interagency involvement 12x more likely to enjoy life
Received family involvement 6x more likely to enjoy life
Social Interactions Received interagency involvement 2x more likely to be social
3
4
1
2
Just like with parents, from this program list we can see the profound impact that particular services have on youth successfully transitioning. While this in no way is to suggest that other services are not important or helpful, this list clearly outlines those services most proven to help youth become complete adults. Sadly, some of these program services are not common. That means that a majority of students are not getting what they need to be successful.
27CASE FOR INCLUSION 2015
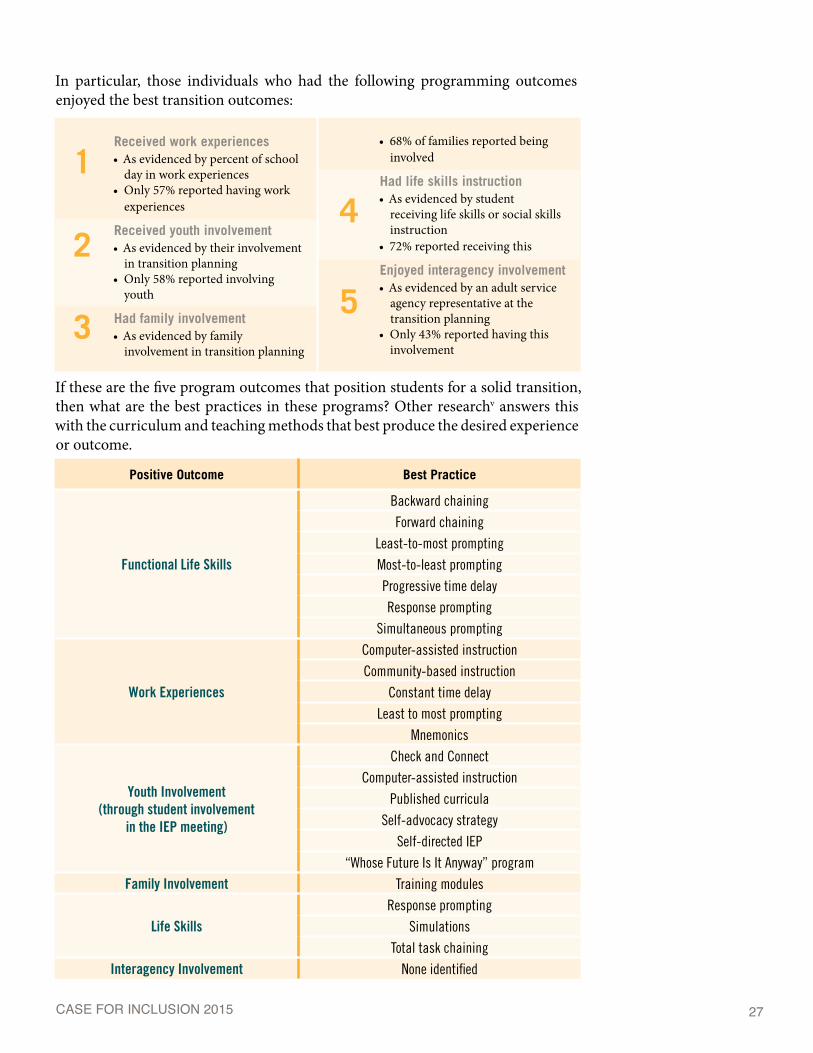
In particular, those individuals who had the following programming outcomes enjoyed the best transition outcomes:
Received work experiences • As evidenced by percent of school
day in work experiences• Only 57% reported having work
experiences
Received youth involvement • As evidenced by their involvement
in transition planning• Only 58% reported involving
youth
Had family involvement • As evidenced by family
involvement in transition planning
• 68% of families reported being involved
Had life skills instruction • As evidenced by student
receiving life skills or social skills instruction
• 72% reported receiving this
Enjoyed interagency involvement• As evidenced by an adult service
agency representative at the transition planning
• Only 43% reported having this involvement
If these are the five program outcomes that position students for a solid transition, then what are the best practices in these programs? Other researchv answers this with the curriculum and teaching methods that best produce the desired experience or outcome.
3
41
2
5
Positive Outcome Best Practice
Functional Life Skills
Backward chainingForward chaining
Least-to-most promptingMost-to-least promptingProgressive time delayResponse prompting
Simultaneous prompting
Work Experiences
Computer-assisted instructionCommunity-based instruction
Constant time delayLeast to most prompting
Mnemonics
Youth Involvement (through student involvement
in the IEP meeting)
Check and ConnectComputer-assisted instruction
Published curriculaSelf-advocacy strategy
Self-directed IEP“Whose Future Is It Anyway” program
Family Involvement Training modules
Life SkillsResponse prompting
SimulationsTotal task chaining
Interagency Involvement None identified
28CASE FOR INCLUSION 2015
Transitions are tough. But with the right parent expectations and evidence-based programming for their students, youth with developmental disabilities can have a solid transition to an adult life rich with work, education, experiences and relationships.
Sadly, we do not have State-level data on what portion of students have achieved the employment, education and quality of life outcomes indicative of a successful transition. That means, at this time, we cannot rank States based on how well they accomplish this.
The purpose of this case study is to be a starting point and to create a basic roadmap for parents and advocates of how they can help their student achieve a solid transition to adulthood. As UCP adapts and expands the Case for Inclusion in future years, we will look for survey and State-level outcome data that can successfully paint a better picture of how well States are facilitating transition and rank them accordingly.
i Papay, Clare K, Ph.D. and Linda M. Bambara, Ed.D. “Best Practices in Transition to Adult Life for Youth With Intellectual Disabilities.” Hammill Institute on Disabilities. Page 137. Available at: http://cde.sagepub.com/content/37/3/136.full.pdf+htmlii IBID. page 138.iii IBID. page 143.iv IBID. page 143.v Test, David, Catherine Fowler, and Paula Kohler. “Evidence-Based Practices and Predictors in Secondary Transition: What We Know and What We Still Need to Know.” National Secondary Transition Technical Assistance Center. Revised October 2012. Available at: http://www.nsttac.org/sites/default/files/assets/pdf/pdf/ebps/ExecsummaryPPs.pdf

29CASE FOR INCLUSION 2015
HOW TO USE & HOW THE RANKINGS WERE DEVELOPEDUSING THE CASE FOR INCLUSION REPORT: This report puts each State’s progress in serving individuals with intellectual and developmental disabilities into a national context. It is intended to help advocates and policymakers understand:
123
How their State performs overall in serving individuals with intellectual and developmental disabilities?
What services and outcomes need attention and improvement in their State?
Which States are top performers in key areas, so advocates and officials in those top-performing States can act as a resource for those States desiring to improve in key areas?
ADVOCATES should use this information to educate other advocates, providers, families and individuals, policymakers and State administrations on key achievements and areas needing improvement within each State. The facts and figures can support policy reforms and frame debates about resource allocation for the ID/DD population. Advocates can also use the information to prioritize those areas that need the most immediate attention and use the facts to support adequate and ongoing funding to maintain high quality outcomes, eliminate waiting lists and close large institutions.
ELECTED OFFICIALS should use this report as a guiding document on which issues and States need time and attention and, possibly, additional resources or more inclusive State policies to improve outcomes for individuals with intellectual and developmental disabilities.
THOSE WITHIN FEDERAL AND STATE ADMINISTRATIONS should use this report to put their work and accomplishments in context and to chart a course for the next focus area in the quest for continuous improvement and improved quality of life. The States should replicate this data reporting in more detail at the State and county level to identify areas of excellence and to target critical issues needing attention.
HOW THE RANKINGS WERE DEVELOPED:The Case for Inclusion rankings were developed through a broad, data-driven effort. Demographic, cost, utilization, key data elements and outcomes statistics were assembled for all 50 States and the District of Columbia. Ninety-nine individual data elements from numerous governmental non-profit and advocacy organizations

30CASE FOR INCLUSION 2015
were reviewed. Dozens of Medicaid, disability and ID/DD policy experts were consulted as well as members of national advocacy and research organizations. They were asked to consider the attributes of top performing Medicaid programs and offer opinions and recommendations on key data measures and outcomes.
To comprehensively determine the top-performing States, a weighted scoring methodology was developed. Thirty key outcome measures and data elements were selected and individually scored in five major categories on a total 100-point scale. If a person is living in the community, it is a key indicator of inclusion; therefore the “Promoting Independence” category received half of all possible points.
WEIGHTING OF CASE FOR INCLUSION SCORES — 100 TOTAL POSSIBLE POINTS
Category Measure Points Assigned
Promoting Independence
Community-Based% of Recipients with ID/DD on HCBS 9
50
% of ID/DD Expenditures on HCBS 7% of ID/DD Expenditures on non-ICF-MR 8
Residential Services in the Community (includes all types)
1–3 Residents % 131–6 Residents % 1116+ Residents % (smaller %, higher rank) -4% in Large State Facilities -3
NCI - % Self-Directed 2
Tracking Health, Safety & Quality of
Life
Quality Assurance - NCI Participation 0
14
NCI - Recent Dental Visit 2.8NCI - Lonely Less than Half the Time 2.8NCI - Not Scared in Own Home 2.8NCI - Inclusion (sum of 4 measures) 2.8NCI - Relationships Other than Staff and Family 2.8
Keeping Families Together
Family Support per 100k 38% in a Family Home 3
NCI - Child/Family Survey Participation 2
Promoting Productivity
Has Medicaid Buy-In Program 2
12Competitive Employment - % 4.0Voc Rehab - Rehab Rate (finding a job) 2Voc Rehab - Number of Hours Worked 2Voc Rehab - Retain Job for One Year 2
Reaching Those in Need
Waiting List - Average % Growth for Residential and HCBS 9
16Individuals with ID/DD Served per 100k of Population 2Ratio of Prevalence to Individuals Served 2Uses Federal Functional Definition for Eligibility or Broader 3
100
In general, the top-performing State for each measure was assigned the highest possible score in that category. The worst-performing State was assigned a zero score in that category. All other States were apportioned accordingly based on their outcome between the top- and worst-performing.

31CASE FOR INCLUSION 2015
As noted, most data is from 2013, but all data is the most recently available from credible national sources. Much of the data is self-reported by the States. These State rankings are a snapshot in time, and policy changes or reforms enacted or beginning in 2014 or later would not have an impact on the data.
When reviewing an individual State’s ranking, it is important to consider action taken since 2013, if any, to accurately understand both where that State was and where it is presently. Also, it is important to note that not all individuals with disabilities were considered, only those with intellectual and developmental disabilities. This limited the scope of the effort, allowing focus on subsequent initiatives of meaningful, achievable improvement.
A note of caution: Although more than 56 points separate the top performing State from the poorest performing State, 12 points separate the top 10 States, 16 points separate the top 25 States and only 10 points separate the middle 25 States. Therefore, minor changes in State policy or outcomes could significantly affect how a State ranks on future or past Case for Inclusion reports.
ACKNOWLEDGEMENTSA special thank you to Sheryl A. Larson, Senior Research Associate at the University of Minnesota’s Research and Training Center on Community Living, who again provided an advance copy of data tables for their 2015 report. It should be noted that the Research and Training Center’s data is drawn from their own surveys of State developmental disability directors, but, when these directors do not or are not able to respond with the requested information then data is drawn from Coleman Institute, Kaiser Family Foundation and American Health Care Association reports. This was the case for one or more RTC data elements used for Delaware, Florida, Georgia, Idaho, Kansas, Kentucky, Maryland, Michigan, Mississippi, New Jersey, New Mexico, North Dakota, Oklahoma, Rhode Island, Texas, Virginia and Wyoming.

32CASE FOR INCLUSION 2015
1825 K Street NW • Suite 600 • Washington • DC 20006 www.ucp.org • 800.872.5827 • 202.776.0406