case network studies & analyses no.391 - pay more, earn
TRANSCRIPT

brought to you by COREView metadata, citation and similar papers at core.ac.uk
provided by Research Papers in Economics
CASE Network Studies & Analyses No.391 - Pay More, Earn Less, Work Harder - New Evidence …
1
Materials published here have a working paper character. They can be subject to further
publication. The views and opinions expressed here reflect the author(s) point of view and
not necessarily those of CASE Network.
This paper was produced in the framework of MICRO-DYN www.micro-dyn.eu , an
international economic research project focusing on the competitiveness of firms, regions
and industries in the knowledge-based economy. The project is funded by the EU Sixth
Framework Programme (www.cordis.lu). This publication reflects only the author's views, the
European Community is not liable for any use that may be made of the information contained
therein.
The project was carried out by a consortium of 16 European universities and institutes
(including CASE - Center for Social and Economic Research) and led by WIIW - Vienna
Institute for International Economic Studies.
The publication was financed from an institutional grant extended by Rabobank Polska S.A. Keywords: multinational firms, economic growth, firm performance, spillovers JEL Codes: F23, L25, O14, O33
© CASE – Center for Social and Economic Research, Warsaw, 2009
Graphic Design: Agnieszka Natalia Bury
EAN 978-83-7178-494-1
Publisher:
CASE-Center for Social and Economic Research on behalf of CASE Network
12 Sienkiewicza, 00-010 Warsaw, Poland
tel.: (48 22) 622 66 27, 828 61 33, fax: (48 22) 828 60 69
e-mail: [email protected]
http://www.case-research.eu

CASE Network Studies & Analyses No.391 - Pay More, Earn Less, Work Harder - New Evidence …
2
The CASE Network is a group of economic and social research centers in Poland,
Kyrgyzstan, Ukraine, Georgia, Moldova, and Belarus. Organizations in the network regularly
conduct joint research and advisory projects. The research covers a wide spectrum of
economic and social issues, including economic effects of the European integration process,
economic relations between the EU and CIS, monetary policy and euro-accession,
innovation and competitiveness, and labour markets and social policy. The network aims to
increase the range and quality of economic research and information available to policy-
makers and civil society, and takes an active role in on-going debates on how to meet the
economic challenges facing the EU, post-transition countries and the global economy.
The CASE network consists of:
• CASE – Center for Social and Economic Research, Warsaw, est. 1991,
www.case-research.eu
• CASE – Center for Social and Economic Research – Kyrgyzstan, est. 1998,
www.case.elcat.kg
• Center for Social and Economic Research - CASE Ukraine, est. 1999,
www.case-ukraine.kiev.ua
• CASE –Transcaucasus Center for Social and Economic Research, est. 2000,
www.case-transcaucasus.org.ge
• Foundation for Social and Economic Research CASE Moldova, est. 2003,
www.case.com.md
• CASE Belarus - Center for Social and Economic Research Belarus, est. 2007.

CASE Network Studies & Analyses No.391 - Pay More, Earn Less, Work Harder - New Evidence …
3
Contents
1. INTRODUCTION..................................................................................................................6
2. HOW AND WHY DO FOREIGN SUBSIDIARIES PERFORM BETTER?............................8
2.1. WHAT FACTORS ARE USUALLY CONTROLLED FOR?..........................................................8 2.2. SHOULD ASSET HISTORY NOT MATTER?...........................................................................9 2.3. DISENTANGLING COMPETITION AND SPILLOVER EFFECTS..................................................9
3. DATA .................................................................................................................................13
4. REGRESSİON RESULTS..................................................................................................17
4.1. BASIC PERFORMANCE DIFFERENCES..............................................................................18 4.2. DYNAMIC PANEL REGRESSION RESULTS ON OWNERS AND ASSETS..................................20 4.3. ESTIMATING COMPETITION AND SPILLOVER EFFECTS......................................................23
5. POLICY IMPLICATIONS ...................................................................................................26
REFERENCES.......................................................................................................................28
APPENDIX 1. .........................................................................................................................31
APPENDIX 2. .........................................................................................................................35

CASE Network Studies & Analyses No.391 - Pay More, Earn Less, Work Harder - New Evidence …
4
Camilla Jensen has a Master of Art (Cand.negot.) in Languages and Economics and a PhD
in Economics from Odense University, Denmark. Her specialisation is in applied economics
and industrial organisation with a focus on multinational firms. She has worked as Assistant
and Associate Professor at Copenhagen Business School and is currently Visiting Professor
at Kadir Has University in Istanbul, Turkey. She has published numerous articles and
chapters on the role of multinational firms for economic development and growth in the
transition and emerging market economies.
CASE Network Studies & Analyses No.391 - Pay More, Earn Less, Work Harder - New Evidence …
5
Abstract
Foreign subsidiary performance and market efficiency effects are estimated and confronted
in this paper using a rich firm-level panel for Polish manufacturing. Besides estimating total
factor productivity, other performance measures are calculated and contrasted such as labor
productivity, employment growth, markup levels and profitability. The findings show that
foreign subsidiaries in Poland pay more (in wages and capital), earn less (in terms of
profitability or ROA) and work harder (in terms of TFP and labor productivity) relative to their
domestic counterparts. Foreign subsidiaries contribute with higher employment growth than
other domestic and new firms. There is no evidence that foreign subsidiaries have
significantly reduced market efficiency within the period of study and across the industries
and entry modes investigated on average. Controlling for competition (which is found to have
a negative effect on efficiency) the paper documents significant intra-industry spillovers. The
effect is estimated to be twice as high within the foreign owned industrial communities as
compared to the cross effect to domestic firms.

CASE Network Studies & Analyses No.391 - Pay More, Earn Less, Work Harder - New Evidence …
6
1. INTRODUCTION
The objective of the paper is to contribute to the literature on the impact of foreign direct
investment (FDI) on firm performance in emerging markets. The paper distinguishes between
the direct (within firm) and indirect (across firm within industry) effects emanating from the
presence of a foreign ownership class, following the established traditions of the field. The
direct effect is strong and well documented in the literature and often ascribed to the superior
technology of multinational firms. Oppositely is the indirect effect disputed and prone for
measurement problems and errors due to difficulties of disentangling e.g. competition and
spillover (technology diffusion) effects.
In relation to these overall research questions about the direct and indirect effects, the study
seeks answers to some of the following questions using a panel data set for Poland: Is
performance higher in foreign subsidiaries established as new firms (Greenfield)? Are foreign
acquisitions as detrimental to market efficiency as the theoretical literature seems to
suggest? Having the possibility to control for competition is there any evidence of a positive
FDI spillover effect in the firm level panel for Poland?
The paper seeks to contribute to the ongoing debate about FDI and the welfare effects of
globalization. By building a bridge to the literature on privatization the study offers a more
leveled approach to the question about direct impacts in emerging markets that underwent a
rapid process of asset sales to owners abroad. Heterogeneity in terms of asset history (new
vs. old assets equating with the differential entry modes of Greenfield and acquisition FDI) is
often not controlled for in the literature that focuses on FDI.
It is shown that a part of the foreign firm premia can be ascribed to the differential degree to
which the ownership classes have been ‘burdened’ with assets that are inherited from the
past. However, the study shows that this ‘burden’ more readily has been changed to one of
future competitive advantage. Perhaps under the more capable but certainly also less
resource restrained hands of foreign subsidiary managers.
In terms of performance, the applied economic literature often focuses on total factor
productivity or other measures of productivity such as labor productivity. But other measures
of performance should perhaps receive more weight in combined considerations of the
efficiency of self-interested firms and the efficiency of the market. By including a broader

CASE Network Studies & Analyses No.391 - Pay More, Earn Less, Work Harder - New Evidence …
7
variety of performance measures the competitive process that foreign entry entails can be
studied in more detail.
The results offered here suggest that in the balancing act of ownership advantages, location
advantages and disadvantages foreign subsidiaries may in fact pay more (in wages and in
capital investment), earn less (in terms of ROA) and work harder (in terms of TFP). At the
same time is there found no evidence, within the period of study that the higher capital
investments have resulted in significant barriers to entry (in terms of increases in markup
levels). But markups are found to grow much faster among foreign and new firms.
By focusing on the broader within industry effects of the entry process of foreign firms in
Poland during the period 1993-2004, the study provides some new evidence on spillover
effects from FDI. Intra-industry spillovers are modeled with considerably more detail than any
previous study, by combining firm level data with 3-digit industrial aggregates on number of
competitors and foreign held market shares.
The findings show that total factor productivity, markups and ROA may have an important
common component that depends on the share of the market held by foreign firms. This
effect, even though positive for all firms, is often found to have twice the impact on other
foreign firms relative to the impact it has on domestically held firms. Other performance
indicators are documented to have cross effects. For example increases in foreign market
shares tend to reduce employment growth with domestic firms.
Section 2 introduces the literature on FDI and host country benefits focusing on control
factors of firm heterogeneity in the literature and the extent to which past studies have been
able to disentangle competition from spillover effects. Section 3 describes the data. Section 4
provides descriptive statistical results on the foreign held and new firm premia. This is
followed by dynamic panel regression results on the direct and indirect effects of foreign
entry into Polish manufacturing. Section 5 concludes the paper by expanding on the results
summarized here in the introduction in terms of potential policy implications of the study.
CASE Network Studies & Analyses No.391 - Pay More, Earn Less, Work Harder - New Evidence …
8
2. HOW AND WHY DO FOREIGN SUBSIDIARIES PERFORM BETTER?
Several theories offer explanations for why ownership classes should matter to performance.
Multinational firms are expected to exhibit superior performance relative to local firms both
according to the knowledge capital model proposed by Markusen (1995) based on theories
of imperfect competition and the eclectic paradigm proposed by John Dunning (1981). In the
eclectic paradigm the ownership advantages of the multinational firms are explained by the
resource based theory of the firm (Hymer, 1970, Demsetz, 1988). Ownership advantages
include not only firm-specific technology of the multinational firm, but also its access to better
exploitation of scale economies through its established network and its access to other
mobile network resources such as capital. However, the eclectic paradigm includes the
perspective that subsidiaries are established in a weighing of the strength of the ownership
advantages and the location advantages and disadvantages. In the eclectic paradigm the
ownership advantages must be sufficient to outweigh any potential location disadvantage
due to e.g. lack of developed social infrastructure, institutional or cultural favoritism,
sensitivity of assets deployment to local skill and knowledge or due to intense rivalry in the
host country (Anand and Delios, 1997).
With background in theory it is therefore not surprising that foreign ownership is generally
found to come with a performance premium. Typically the performance premium is found to
increase with the development gap between host and home countries (see e.g. Görg and
Strobl, 2001). In particular taxing, hostile and/or competitive environments the performance
premium may be absent even though it has been rarely observed in practice. A study of the
United States shows that it matters with whom the multinational firms are compared.
Multinational firms investing in the United States are not exhibiting higher performance
relative to those domestic counterparts that are themselves multinationals abroad (Corrado
et al., 2008).
2.1. What factors are usually controlled for? Several aspects of firm heterogeneity have been addressed in the literature to test for the
robustness of the performance premium result. Standard controls include firm size, capital
intensity and industry affiliation. The most stringent control test to date includes the
difference in difference approach whereby especially the performance premium in foreign

CASE Network Studies & Analyses No.391 - Pay More, Earn Less, Work Harder - New Evidence …
9
acquisitions have been subjected to a rigorously controlled for comparator sample. In a study
of Indonesia, Arnold and Smarzynska (2005) include controls for skill intensity and company
history (age). Karpaty (2007) on acquisitions in Sweden includes controls for R&D intensity
and region of the firm. Instead of structural variables such as industry and region some
studies operate with a firm specific effect see e.g. Conyon et al., 2002. Other studies of
mergers and acquisitions include dynamic aspects of entry, such as time having passed
between the events studied and outcomes observed (see e.g. Berger et al., 2005, Conyon et
al., 2002). Especially the literature on mergers and acquisitions has driven results towards
the inclusion of a larger number of control factors. (Perhaps because the effects have been
more difficult to discern and because of selection biases.) In practice controls reflect the
particular objectives of the study, type of performance measurement and data availability.
2.2. Should asset history not matter? The differential performance of ownership classes has been an important area of
investigation among the new EU member states. The research has been driven by the
objective to understand how FDI is affecting the restructuring process in the former socialist
countries. Related policy concerns are how to maximize technology spillovers for
domestically held firms (see e.g. Damijan et al., 2008). Somewhat in overlap herewith is the
question about the impact that privatization has on firm performance. However, little attention
has been paid to the combined role of asset history and relative performance of firms from
different ownership classes in this literature. This is peculiar and might be of some
importance to better understand the developmental role of FDI under the specific
circumstances facing many new market economies (trying to implement technological
upgrading policies in combination with undergoing fundamental institutional changes). New
meta-analytical studies on privatization (see e.g. Estrin et al., 2009) showing the combined
roles of ownership and asset history in the restructuring process of former socialist countries
suggest that some firm heterogeneity is left uncontrolled for in studies that only focus on
ownership. New studies of internationalization in the banking industry include controls for
both ownership and asset history (see e.g. Berger et al., 2005).
2.3. Disentangling competition and spillover effects The topic of spillovers has been subject to particular scrutiny in the literature due to its high
importance for policy makers and the overall welfare prospects of globalization for local firms
and consumers. The main issue in spillover studies has been to investigate the sign of
spillovers. A fairly high number of meta-analytical studies have become available. They try to
factor out by comparing results across individual research papers the underlying reasons for

CASE Network Studies & Analyses No.391 - Pay More, Earn Less, Work Harder - New Evidence …
10
different spillover effects across countries (see e.g. Görg and Strobl, 2001, Lipsey and
Blomström, 2005, Crespo and Fontoura, 2007, Damijan et al., 2008). But neither the
literature nor its overview provide us with any easy answer.
A main underlying theme in some of the recent literature is that there is a need to disentangle
the pure externality or what is rightfully a spillover effect from another effect which is due to
the competitive pressure that the emergence of a foreign ownership class in the local
economy exerts on domestic firms.
Early studies of spillovers such as Haddad and Harrison (1993) and Kokko (1996)
recognized the role of competition in their results but had to lump together spillovers with the
competition effect in order to interpret their results.
As better data and new techniques have become available more recent studies have tried to
tackle the question about a separate competition effect and how it interacts with or differs
from the ‘true’ spillover or externality effect of FDI. Some of these studies are reviewed in
Table 1.
The results in the available studies show a very low degree of homogeneity in several ways.
None of the studies reviewed used the same concept of competition. Few of the studies used
a dynamic concept of competition.
What is perhaps common to the studies reviewed is that they all are concerned with
combined events of trade and investment liberalization. (Note that Fernandes (2007) focuses
exclusively on trade liberalization and does not include ownership controls). Only Romania
and Hungary may be different in their timing since the Europe Agreements allowed for more
sheltering from foreign trade competition relative to a very liberal policy of opening up to
foreign direct investors in the early years of transition. Continued subsidies to locally held
firms may have given room for a honeymoon effect in some transition countries. Both
available studies for Eastern Europe report that the spillover effect declined over the period
of study and spillover effects became negative in late transition due to stronger competition.
In terms of timing of the two effects Barrios et al. (2005) argue for the reverse pattern,
however, studying a much more mature market economy with a longer and different history
of liberalization.
CASE Network Studies & Analyses No.391 - Pay More, Earn Less, Work Harder - New Evidence …
11
None of the studies used competition as a dynamic control variable, but either studied
competition in a way that made it impossible to disentangle from the spillover effect or
studied it in a cross sectional way in order to observe how spillovers vary with the level of
competition. Hence the studies have a problem that seems to be ontological before
methodological in character due to the lacking theoretical conception of competition and
spillover effects as separate phenomena in the overall process of competition. For example
some studies argue for an additive effect (Barrios et al., 2005 and Altomonte and Pennings,
2005). Other studies consider one effect (e.g. competition) as a precondition for the other
(spillovers) or as multiplicative (e.g. Blomström and Sjöholm, 1999).
Another but methodological problem of many studies (and all panel studies, see e.g. Frees,
2005) is that of attrition or in other words how exit by firms are handled in the data collection
procedures. It is possible that the competition effect is more likely to take a negative sign in
studies that rely on data collected by local authorities (censor studies) that may follow exiting
firms to the door. Oppositely in studies relying on cross sections at different points in time or
databases such as Amadeus and Orbis published by Bureau van Dijk, the competition effect
(or spillover effect if lumped together) may be more likely to show up as positive because
only the surviving firms will be included in the published data sensitive to the specific time
perspective.

CASE Network Studies & Analyses No.391 - Pay More, Earn Less, Work Harder - New Evidence …
12
TABLE 1: Disentangling the competition and spillover effects from FDI Author(s) Country/Year(s) Competition proxy Results Sjöholm Indonesia Herfindahl Index Firms in high competition
(1999) 1980 and 1991 ERP (effective industries benefited more
rate of protection) from spillovers
Blomström Indonesia Dummy control Spillovers are restricted to
and Sjöholm 1991 for local firms the non-exporters
(1999) that are exporters FDI increases productivity
in domestic firms through
competition
Altomonte Romania No. of foreign Spillovers are maximised
and Pennings 1995-2001 entrants over at a certain threshold level
(2005) time (dynamic) after which the marginal effect of
more foreign entrants become
negative
Barrios, Görg Ireland Net entry rate Initially the competition effect is
and Strobl 1972-2000 of new domestic so strong that it deters entry, even-
(2005) firms (dynamic) tually it is outweighed by a
positive externality effect that
crowds-in domestic entry
Fernandes Colombia Herfindahl Index Trade liberalization affects more
(2007) 1977-1991 Turnover rates strongly TFP in less
competitive
industries
Görg, Hijzen Hungary Dummy control Local market oriented MNCs
and Murakozy 1992-2003 for export oriented have a negative impact on
(2009) MNCs TFP levels with domestic firms
whereas export oriented MNCs
have no impact
CASE Network Studies & Analyses No.391 - Pay More, Earn Less, Work Harder - New Evidence …
13
3. DATA
The data used in the study comes from two main sources – the Amadeus Databank
published by Bureau Van Dijk in Holland and information about number of active firms at the
industry level including industry specific market shares obtained from GUS (National
Statistical Office of Poland) in Warsaw.
The firm specific data which is an unbalanced panel covering the period 1993-2004 was
downloaded in 2005 as unconsolidated data (for the plant level). In this data there is the
possibility to identify owners through information about the majority shareholder. Foreign
firms are hence classified as those firms being held by a foreign majority shareholder.
Domestic firms are classified when held by a domestic majority shareholder. Old firms are
classified as those firms having been established prior to or in 1989 and oppositely for new
firms after 1989.
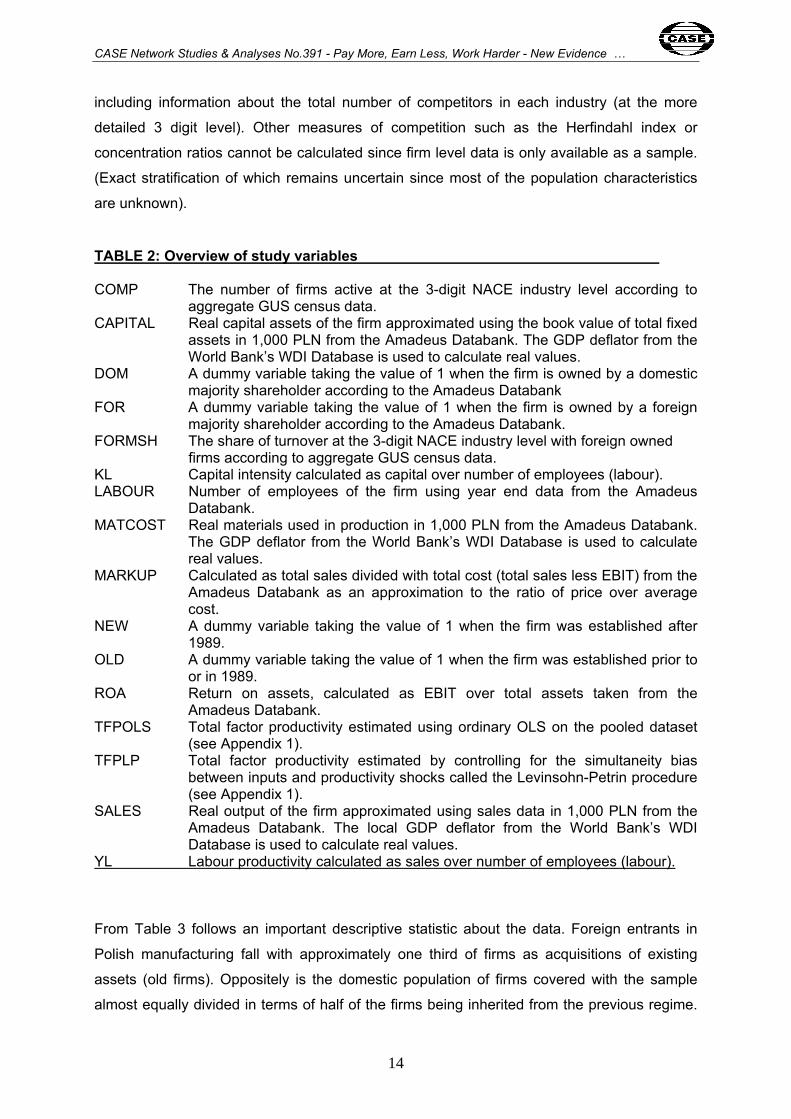
All the variables, exact calculations and their sources are summarized in Table 2.
The panel dataset is bound together by a number of identifiers. The main identifier in the
panel is the individual plant. The firm level data is combined with the industry level data using
industry codes (NACE) at the 3 digit level.
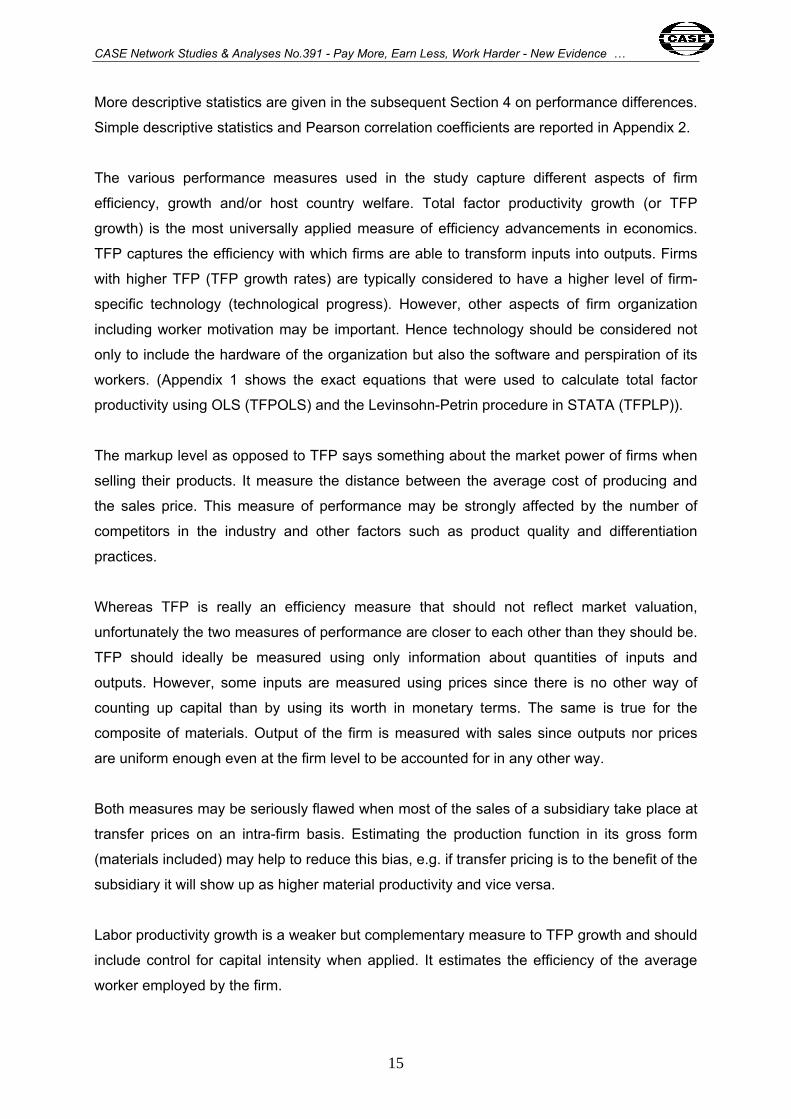
Sample characteristics on the main classifying variables are shown with Table 3. (More
descriptive statistics and correlation coefficients are reported in Appendix 2.) This is a
snapshot in time of the panel. The year 2000 has the highest number of observations,
whereas the panel tends to become more unbalanced around the start and end dates.
Juxtaposing the firm level data with GUS industry level data (here at the 2 digit level) gives
an estimation of sample representation (last column). On average the sample is drawn
representing half of industry sales. Generally the least and most concentrated industries
have lower representation or in some industries unknown representation. In industries or
subgroups of industries with only a few active firms GUS is not allowed to publish the sales
data. From an industrial economics perspective a firm level panel of this type will typically
cover all or some of the main actors in the industry, whereas the smaller fringe firms will be
left out. Hence results will reflect those of the industry main actors, whereas knowledge
about the typically more adaptive fringe will remain unknown. In terms of competitive
pressure however, the fringe may be very important. The study tries to control for this by
CASE Network Studies & Analyses No.391 - Pay More, Earn Less, Work Harder - New Evidence …
14
including information about the total number of competitors in each industry (at the more
detailed 3 digit level). Other measures of competition such as the Herfindahl index or
concentration ratios cannot be calculated since firm level data is only available as a sample.
(Exact stratification of which remains uncertain since most of the population characteristics
are unknown).
TABLE 2: Overview of study variables COMP The number of firms active at the 3-digit NACE industry level according to
aggregate GUS census data. CAPITAL Real capital assets of the firm approximated using the book value of total fixed
assets in 1,000 PLN from the Amadeus Databank. The GDP deflator from the World Bank’s WDI Database is used to calculate real values.
DOM A dummy variable taking the value of 1 when the firm is owned by a domestic majority shareholder according to the Amadeus Databank
FOR A dummy variable taking the value of 1 when the firm is owned by a foreign majority shareholder according to the Amadeus Databank.
FORMSH The share of turnover at the 3-digit NACE industry level with foreign owned firms according to aggregate GUS census data. KL Capital intensity calculated as capital over number of employees (labour). LABOUR Number of employees of the firm using year end data from the Amadeus
Databank. MATCOST Real materials used in production in 1,000 PLN from the Amadeus Databank.
The GDP deflator from the World Bank’s WDI Database is used to calculate real values.
MARKUP Calculated as total sales divided with total cost (total sales less EBIT) from the Amadeus Databank as an approximation to the ratio of price over average cost.
NEW A dummy variable taking the value of 1 when the firm was established after 1989.
OLD A dummy variable taking the value of 1 when the firm was established prior to or in 1989.
ROA Return on assets, calculated as EBIT over total assets taken from the Amadeus Databank.
TFPOLS Total factor productivity estimated using ordinary OLS on the pooled dataset (see Appendix 1).
TFPLP Total factor productivity estimated by controlling for the simultaneity bias between inputs and productivity shocks called the Levinsohn-Petrin procedure (see Appendix 1).
SALES Real output of the firm approximated using sales data in 1,000 PLN from the Amadeus Databank. The local GDP deflator from the World Bank’s WDI Database is used to calculate real values.
YL Labour productivity calculated as sales over number of employees (labour).
From Table 3 follows an important descriptive statistic about the data. Foreign entrants in
Polish manufacturing fall with approximately one third of firms as acquisitions of existing
assets (old firms). Oppositely is the domestic population of firms covered with the sample
almost equally divided in terms of half of the firms being inherited from the previous regime.
CASE Network Studies & Analyses No.391 - Pay More, Earn Less, Work Harder - New Evidence …
15
More descriptive statistics are given in the subsequent Section 4 on performance differences.
Simple descriptive statistics and Pearson correlation coefficients are reported in Appendix 2.
The various performance measures used in the study capture different aspects of firm
efficiency, growth and/or host country welfare. Total factor productivity growth (or TFP
growth) is the most universally applied measure of efficiency advancements in economics.
TFP captures the efficiency with which firms are able to transform inputs into outputs. Firms
with higher TFP (TFP growth rates) are typically considered to have a higher level of firm-
specific technology (technological progress). However, other aspects of firm organization
including worker motivation may be important. Hence technology should be considered not
only to include the hardware of the organization but also the software and perspiration of its
workers. (Appendix 1 shows the exact equations that were used to calculate total factor
productivity using OLS (TFPOLS) and the Levinsohn-Petrin procedure in STATA (TFPLP)).
The markup level as opposed to TFP says something about the market power of firms when
selling their products. It measure the distance between the average cost of producing and
the sales price. This measure of performance may be strongly affected by the number of
competitors in the industry and other factors such as product quality and differentiation
practices.
Whereas TFP is really an efficiency measure that should not reflect market valuation,
unfortunately the two measures of performance are closer to each other than they should be.
TFP should ideally be measured using only information about quantities of inputs and
outputs. However, some inputs are measured using prices since there is no other way of
counting up capital than by using its worth in monetary terms. The same is true for the
composite of materials. Output of the firm is measured with sales since outputs nor prices
are uniform enough even at the firm level to be accounted for in any other way.
Both measures may be seriously flawed when most of the sales of a subsidiary take place at
transfer prices on an intra-firm basis. Estimating the production function in its gross form
(materials included) may help to reduce this bias, e.g. if transfer pricing is to the benefit of the
subsidiary it will show up as higher material productivity and vice versa.
Labor productivity growth is a weaker but complementary measure to TFP growth and should
include control for capital intensity when applied. It estimates the efficiency of the average
worker employed by the firm.

CASE Network Studies & Analyses No.391 - Pay More, Earn Less, Work Harder - New Evidence …
16
Labor or employment growth is a performance measure that shows whether individual firms
are growing or shrinking over time. Better performing firms are typically expected to grow and
vice-versa, except in situations where there may be increasing industry concentration or in
periods where firms restructure by increasing their specialization.
Return on Assets (ROA) measures performance from the perspective of the capital owners
of the firm. As it is calculated in this study (EBIT over total assets) it shows the gross return
to the investment of capital with the firm. It is directly comparable across firms but is gross in
the sense that it does take into account neither the cost of borrowing nor the opportunity cost
of investing the capital.
All the performance measures are related. For example, assuming constant demand an
increase in market power (markup levels) may come about by shrinking the size of
production (and hence employment) and/or reducing the cost and/or increasing efficiency.
Increases in market power are associated with higher levels of profitability or ROA and lower
levels of competition in the static perspective of market efficiency. It is important to note that
market power through markup levels and efficiency may co vary both in a positive and
negative way. Technological progress may be equally likely to be associated with a market
structure that becomes more or less concentrated over time (Demsetz, 1973). Similarly
under expanding
demand or rapid technological progress, markup levels may be positively correlated with
competition. In the static market efficiency perspective consumer welfare goes up with a
lowering of market power. However, in a dynamic perspective (some) market power is not
necessarily bad if it leads to technological progress through a cyclical process of innovation
and diffusion.
CASE Network Studies & Analyses No.391 - Pay More, Earn Less, Work Harder - New Evidence …
17
TABLE 3: Basic sample characteristics Year=2000
No. of firms Foreign Domestic Sample/Population New Old New Old (% of total sales)
Industry 15 - Food 71 39 161 102 47 16 – Beverages** - 4 - 2 48 17 – Textile 13 3 17 44 63 18 – Clothing 13 5 21 16 27 19 - Leather 4 1 11 11 36 20 – Wood 18 1 30 26 52 21 - Paper 20 11 23 10 80 22 – Printing 31 1 32 26 97* 23 – Fuel** 2 - 4 6 28 24 - Chemical 26 14 29 49 63 25 – Plastic 47 8 47 27 43 26 – Mineral 42 32 40 46 63 27 – Metal 6 4 10 34 62 28 - Metallurgy 34 10 70 66 51 29 – Machinery 23 18 54 107 48 30 – Office mach.** 1 - 4 1 52 31 – Electrical mach. 26 15 30 23 53 32 – Radio, TV 11 1 12 11 66 33 – Precision mach. 3 1 8 9 20* 34 – Vehicles 26 11 7 23 50 35 – Other transp. 5 5 13 18 53 36 – Furniture, other 31 6 26 26 48 37 – Recycling 3 2 5 4 64 Total manufacturing 456 192 654 687 50 *The industry level data that the sample totals are compared with is not reliable for these industries because data is not released by GUS when concentration could lead to identification of individual firms. **These industries have been excluded from the calculations due to insufficient number of observations. Source: Amadeus Database, Bureau Van Dijk, Holland and National Statistical Office of Poland (GUS).
4. Regression results
The first method used to present the statistical results of the analysis falls in between
descriptive statistics and regression analysis. Simple structural equations are adopted
treating the data as a pool towards describing the basic dimensions of the sample and
focusing on the characteristics that are of main interest. Subsequently the data is analyzed
using more advanced panel data regression techniques. Simple descriptive statistics are
reported in Appendix 2.
CASE Network Studies & Analyses No.391 - Pay More, Earn Less, Work Harder - New Evidence …
18
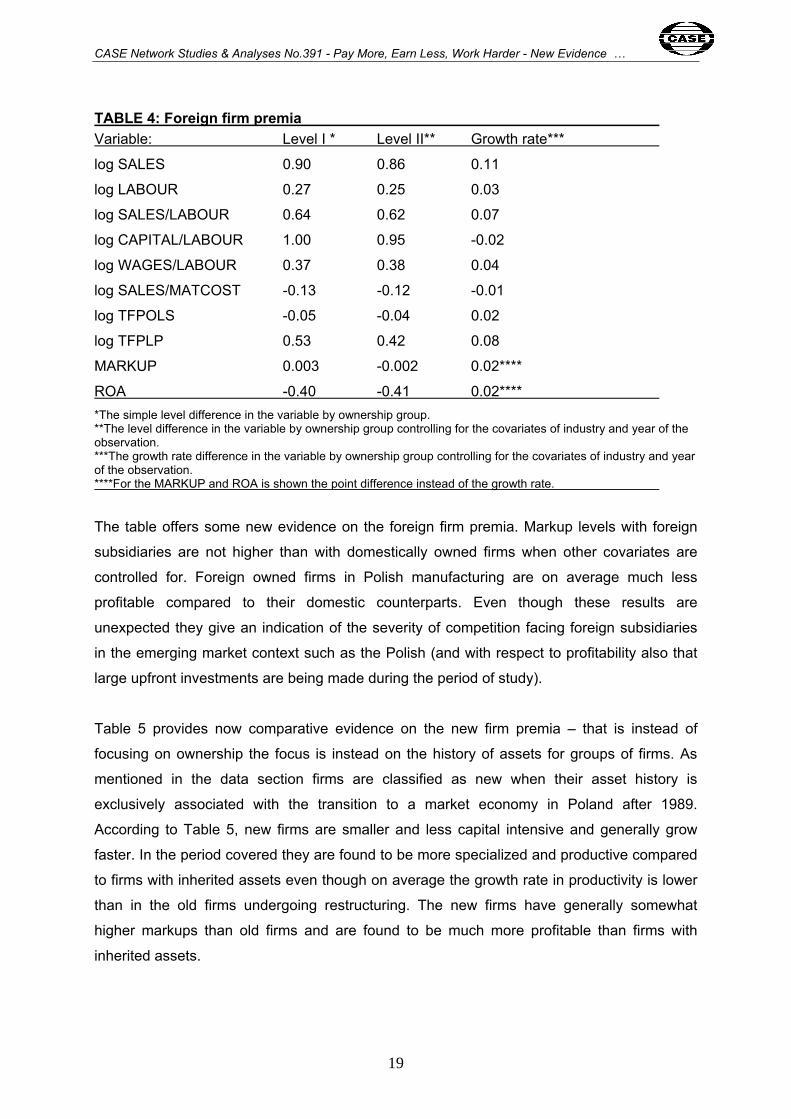
4.1. Basic performance differences In Table 4 the foreign owned firms are compared with the domestically owned firms on a
number of basic variables, ratios and for the specific performance variables that are used
subsequently as dependent variables in the panel regression analysis. Each column in Table
4 gives a different estimate of the premium of being a foreign owned firm. The first column
compares e.g. level in sales without controlling for firm-specific characteristics such as
industry affiliation. The second column compares again the level in sales but through a
simple structural equation that controls for the impact that covariates such as industry and
year may have on the reported variable. Finally in the last column is shown the foreign
premium for the annual growth rate in sales, again using the same structural equation as in
column 2 to control for other relevant covariates. The first row in Table 4 reads: foreign
owned firms in a simple comparison are found to have sales that are on average 84 % higher
than that of domestically held firms, controlling for basic characteristics of each data point
(industry and year). This premium shrinks only a little bit to 80%. Finally foreign owned firms
register an annual growth rate in their sales that is 8% higher than the growth rate of
domestically owned firms.
From Table 4 it is seen that the sample for Poland confirms what is found for a host of other
foreign-domestic samples in emerging markets. Foreign firms are on average larger, much
more capital intensive (even though this is slowly changing since the growth rate in the
capital labor ratio is lower than that of the growth rate in the domestically held firms) and
more productive (when measured using labor productivity and some of the measures of total
factor productivity). The next two rows show that foreign firms pay considerably higher
wages. The sales to material cost ratio would suggest (even though a very rough measure)
that foreign subsidiaries are more specialized compared to their domestic counterparts. This
is perhaps not surprising remembering that the domestic part of the sample contains a
relatively larger share of firms with assets inherited from socialism.
CASE Network Studies & Analyses No.391 - Pay More, Earn Less, Work Harder - New Evidence …
19
TABLE 4: Foreign firm premia Variable: Level I * Level II** Growth rate***
log SALES 0.90 0.86 0.11
log LABOUR 0.27 0.25 0.03
log SALES/LABOUR 0.64 0.62 0.07
log CAPITAL/LABOUR 1.00 0.95 -0.02
log WAGES/LABOUR 0.37 0.38 0.04
log SALES/MATCOST -0.13 -0.12 -0.01
log TFPOLS -0.05 -0.04 0.02
log TFPLP 0.53 0.42 0.08
MARKUP 0.003 -0.002 0.02****
ROA -0.40 -0.41 0.02**** *The simple level difference in the variable by ownership group. **The level difference in the variable by ownership group controlling for the covariates of industry and year of the observation. ***The growth rate difference in the variable by ownership group controlling for the covariates of industry and year of the observation. ****For the MARKUP and ROA is shown the point difference instead of the growth rate.
The table offers some new evidence on the foreign firm premia. Markup levels with foreign
subsidiaries are not higher than with domestically owned firms when other covariates are
controlled for. Foreign owned firms in Polish manufacturing are on average much less
profitable compared to their domestic counterparts. Even though these results are
unexpected they give an indication of the severity of competition facing foreign subsidiaries
in the emerging market context such as the Polish (and with respect to profitability also that
large upfront investments are being made during the period of study).
Table 5 provides now comparative evidence on the new firm premia – that is instead of
focusing on ownership the focus is instead on the history of assets for groups of firms. As
mentioned in the data section firms are classified as new when their asset history is
exclusively associated with the transition to a market economy in Poland after 1989.
According to Table 5, new firms are smaller and less capital intensive and generally grow
faster. In the period covered they are found to be more specialized and productive compared
to firms with inherited assets even though on average the growth rate in productivity is lower
than in the old firms undergoing restructuring. The new firms have generally somewhat
higher markups than old firms and are found to be much more profitable than firms with
inherited assets.
CASE Network Studies & Analyses No.391 - Pay More, Earn Less, Work Harder - New Evidence …
20
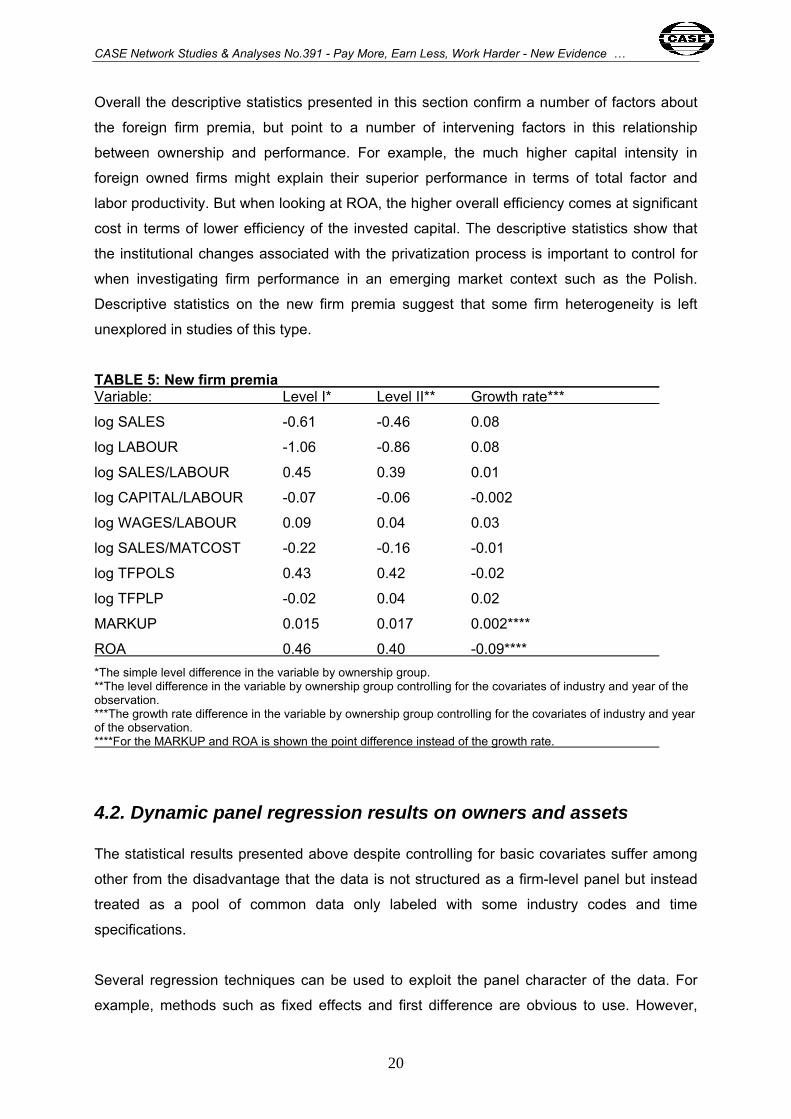
Overall the descriptive statistics presented in this section confirm a number of factors about
the foreign firm premia, but point to a number of intervening factors in this relationship
between ownership and performance. For example, the much higher capital intensity in
foreign owned firms might explain their superior performance in terms of total factor and
labor productivity. But when looking at ROA, the higher overall efficiency comes at significant
cost in terms of lower efficiency of the invested capital. The descriptive statistics show that
the institutional changes associated with the privatization process is important to control for
when investigating firm performance in an emerging market context such as the Polish.
Descriptive statistics on the new firm premia suggest that some firm heterogeneity is left
unexplored in studies of this type.
TABLE 5: New firm premia Variable: Level I* Level II** Growth rate***
log SALES -0.61 -0.46 0.08
log LABOUR -1.06 -0.86 0.08
log SALES/LABOUR 0.45 0.39 0.01
log CAPITAL/LABOUR -0.07 -0.06 -0.002
log WAGES/LABOUR 0.09 0.04 0.03
log SALES/MATCOST -0.22 -0.16 -0.01
log TFPOLS 0.43 0.42 -0.02
log TFPLP -0.02 0.04 0.02
MARKUP 0.015 0.017 0.002****
ROA 0.46 0.40 -0.09**** *The simple level difference in the variable by ownership group. **The level difference in the variable by ownership group controlling for the covariates of industry and year of the observation. ***The growth rate difference in the variable by ownership group controlling for the covariates of industry and year of the observation. ****For the MARKUP and ROA is shown the point difference instead of the growth rate.
4.2. Dynamic panel regression results on owners and assets The statistical results presented above despite controlling for basic covariates suffer among
other from the disadvantage that the data is not structured as a firm-level panel but instead
treated as a pool of common data only labeled with some industry codes and time
specifications.
Several regression techniques can be used to exploit the panel character of the data. For
example, methods such as fixed effects and first difference are obvious to use. However,
CASE Network Studies & Analyses No.391 - Pay More, Earn Less, Work Harder - New Evidence …
21
because of the structural character (time invariant) of the main explanatory factors especially
a fixed effect approach is less useful as the effects to be observed will tend to be suppressed
by the fixed effects. The first difference approach is useful if there are a lot of time variant
explanatory factors. However, that is not the case here since the number of explanatory
factors are somewhat limited as most of the dependent variables are already secondarily
derived using such explanatory factors.
Instead is used a dynamic panel data approach. The dependent variables are specified as
dynamic (since we are more interested in their growth rates than their levels). To account for
the time series dimension is adopted the lagged dependent variable approach. The main
effects are ownership classes (foreign and domestic) and asset histories (new and old). The
size of firms is controlled for by inclusion of the number of employees as lagged variable.
Industry, region and year effects are controlled for as dummy fixed effects. Finally to account
for the cross section dimension a locally weighted equation (FGLS) is used. This
specification allows for an error term component that is heteroscedastic or specific to each
firm (cross section).
The results are reported with regression Table 6.
CASE Network Studies & Analyses No.391 - Pay More, Earn Less, Work Harder - New Evidence …
22
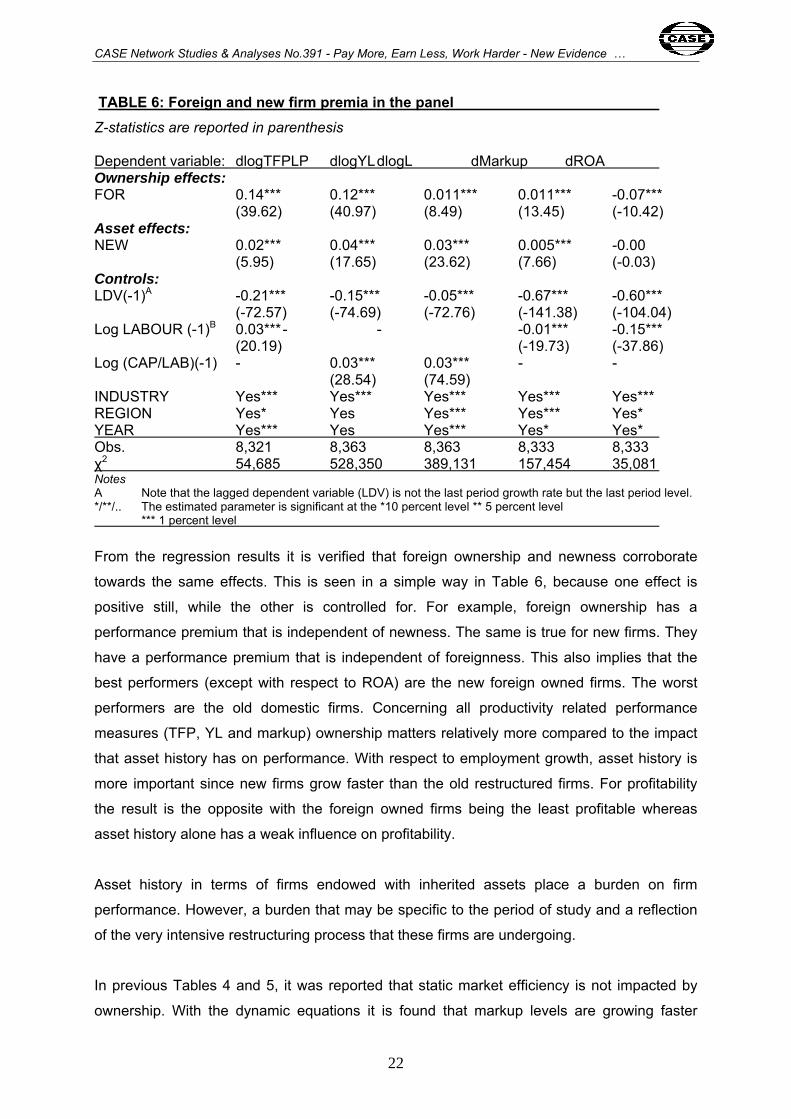
TABLE 6: Foreign and new firm premia in the panel Z-statistics are reported in parenthesis Dependent variable: dlogTFPLP dlogYL dlogL dMarkup dROA Ownership effects: FOR 0.14*** 0.12*** 0.011*** 0.011*** -0.07*** (39.62) (40.97) (8.49) (13.45) (-10.42) Asset effects: NEW 0.02*** 0.04*** 0.03*** 0.005*** -0.00 (5.95) (17.65) (23.62) (7.66) (-0.03) Controls: LDV(-1)A -0.21*** -0.15*** -0.05*** -0.67*** -0.60*** (-72.57) (-74.69) (-72.76) (-141.38) (-104.04) Log LABOUR (-1)B 0.03*** - - -0.01*** -0.15*** (20.19) (-19.73) (-37.86) Log (CAP/LAB)(-1) - 0.03*** 0.03*** - - (28.54) (74.59) INDUSTRY Yes*** Yes*** Yes*** Yes*** Yes*** REGION Yes* Yes Yes*** Yes*** Yes* YEAR Yes*** Yes Yes*** Yes* Yes* Obs. 8,321 8,363 8,363 8,333 8,333 χ2 54,685 528,350 389,131 157,454 35,081 Notes A Note that the lagged dependent variable (LDV) is not the last period growth rate but the last period level. */**/.. The estimated parameter is significant at the *10 percent level ** 5 percent level *** 1 percent level
From the regression results it is verified that foreign ownership and newness corroborate
towards the same effects. This is seen in a simple way in Table 6, because one effect is
positive still, while the other is controlled for. For example, foreign ownership has a
performance premium that is independent of newness. The same is true for new firms. They
have a performance premium that is independent of foreignness. This also implies that the
best performers (except with respect to ROA) are the new foreign owned firms. The worst
performers are the old domestic firms. Concerning all productivity related performance
measures (TFP, YL and markup) ownership matters relatively more compared to the impact
that asset history has on performance. With respect to employment growth, asset history is
more important since new firms grow faster than the old restructured firms. For profitability
the result is the opposite with the foreign owned firms being the least profitable whereas
asset history alone has a weak influence on profitability.
Asset history in terms of firms endowed with inherited assets place a burden on firm
performance. However, a burden that may be specific to the period of study and a reflection
of the very intensive restructuring process that these firms are undergoing.
In previous Tables 4 and 5, it was reported that static market efficiency is not impacted by
ownership. With the dynamic equations it is found that markup levels are growing faster
CASE Network Studies & Analyses No.391 - Pay More, Earn Less, Work Harder - New Evidence …
23
especially in the new foreign owned firms. But also other factors (and besides those of
industry and region already controlled for) such as market structure, differentiation practices
and export intensity may be quite important in explaining markup levels.
Despite the lower efficiency levels, the investment in old firms has been more profitable
relative to establishment of new firms when the owner is foreign (not shown). It is only with
respect to ROA (profitability) that the average ranking for ownership classes and asset
histories is generally not confirmed. This might indicate that Greenfield investments abroad
are more risky because of the downsides of location disadvantage. It might be an indication
of the significant capital investment involved and that the profitability from investment in
capacity has a longer time horizon. The difference in ROA could also be explained by cost of
capital differences, e.g. that the capital of the old firms has been acquired at a certain rebate.
4.3. Estimating competition and spillover effects In Table 7 the same regressions are run as with Table 6, but now including the estimation of
spillover effects using the proxy SHFOR and controlling for competition with the variable
COMP. Results are reported for the full sample, but the spillover proxy is interacted with the
ownership groups to observe the differential impact that the emergence of the foreign
ownership class has on other foreign and domestic owners. Only the latter effect is what is
typically associated with the spillover effect in studies of this type. However, foreign
subsidiaries themselves may benefit from the spillovers from other foreign subsidiaries. The
competition proxy is included in an attempt to control for the independent effect that
competition has on performance.
The hypothesis is that either effect could be positive or negative depending on the specific
situation. The sign of the competition effect will depend both on changes in demand and
static and dynamic changes in firms’ average cost curves. Even in a scenario of constant
demand and cost conditions the entry effect may be ambiguous for the competition effect.
For example, if firms compete in Cournot, TFP and markups should go down because of
declining prices. Oppositely, if firms compete in Bertrand, there may not be room for a price
decline, hence hampering TFP if firms already operate at MES and leaving markups
unchanged at zero.

CASE Network Studies & Analyses No.391 - Pay More, Earn Less, Work Harder - New Evidence …
24
TABLE 7: Competition and spillover effects in the panel Z-statistics are reported in parenthesis Dependent variable: dlogTFPLP dlogYL dlogL dMarkup dROA Ownership effects: FOR 0.10*** 0.10*** -0.02*** 0.020*** -0.16*** (15.79) (17.69) (-5.64) (11.81) (-11.44) Asset effects: NEW 0.03*** 0.05*** 0.04*** 0.014*** 0.12*** (8.91) (20.66) (26.59) (18.86) (18.07) Controls: LDV(-1) A -0.22*** -0.17*** -0.05*** -0.711*** -0.18*** (-76.63) (-82.13) (-72.22) (-175.89) (-43.24) LABOUR (-1) 0.03*** - - -0.005*** -0.18*** (18.15) (-15.85) (-43.24) Log (CAP/LAB)(-1) - 0.03*** 0.03*** - - (26.95) (50.52) INDUSTRY Yes*** Yes*** Yes*** Yes*** Yes** REGION Yes*** Yes*** Yes*** Yes*** Yes*** YEAR Yes*** Yes*** Yes*** Yes*** Yes*** Spillovers: D(Log COMP) -0.05*** 0.12*** -0.10*** 0.001 0.05** (3.06) (10.53) (-17.15) (0.49) (1.81) FORMSH 0.09*** 0.07*** -0.05 0.084*** 0.12*** *DOM (8.09) (8.49) (-12.56) (37.44) (5.82) FORMSH 0.21*** 0.14*** 0.01 0.055*** 0.24*** *FOR (16.54) (10.57) (1.08) (14.81) (7.60) Obs. 6,991 7,030 7,030 7,009 7,009 χ2 1,318,983 4*107 116,804 7,7*1010 73,152 Notes A Note that the lagged dependent variable (LDV) is not the last period growth rate but the last period level. */**/.. The estimated parameter is significant at the *10 percent level ** 5 percent level *** 1 percent level
However, competition in itself may force firms to work harder or look for new markets which
could give a positive effect.
The spillover effect is hypothesized in most situations to be close to zero or positive. Only in
rare situation should it be negative. For example, bad product reputation from a specific firm
may spill over negatively on all other producers in the same industry. We could also imagine
other types of negative spillovers associated with adoption of suboptimal or flawed methods
of production (industry fads) which may spill over on other firms before their inherent
problems are discovered. But in most cases productivity spillovers or technology diffusion
must be assumed to be either zero or positive. If the competition proxy for some reason is
CASE Network Studies & Analyses No.391 - Pay More, Earn Less, Work Harder - New Evidence …
25
not sufficient it can also be negative. (In which case the effects cannot be separated on
methodological grounds).
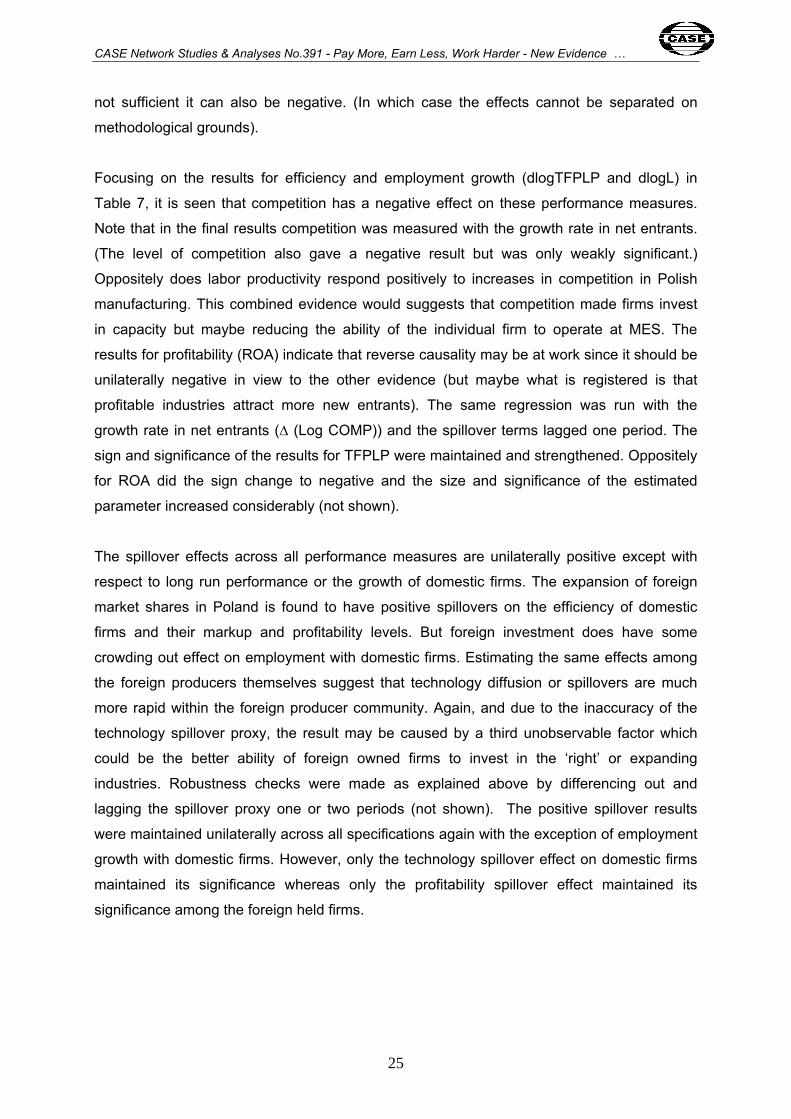
Focusing on the results for efficiency and employment growth (dlogTFPLP and dlogL) in
Table 7, it is seen that competition has a negative effect on these performance measures.
Note that in the final results competition was measured with the growth rate in net entrants.
(The level of competition also gave a negative result but was only weakly significant.)
Oppositely does labor productivity respond positively to increases in competition in Polish
manufacturing. This combined evidence would suggests that competition made firms invest
in capacity but maybe reducing the ability of the individual firm to operate at MES. The
results for profitability (ROA) indicate that reverse causality may be at work since it should be
unilaterally negative in view to the other evidence (but maybe what is registered is that
profitable industries attract more new entrants). The same regression was run with the
growth rate in net entrants (∆ (Log COMP)) and the spillover terms lagged one period. The
sign and significance of the results for TFPLP were maintained and strengthened. Oppositely
for ROA did the sign change to negative and the size and significance of the estimated
parameter increased considerably (not shown).
The spillover effects across all performance measures are unilaterally positive except with
respect to long run performance or the growth of domestic firms. The expansion of foreign
market shares in Poland is found to have positive spillovers on the efficiency of domestic
firms and their markup and profitability levels. But foreign investment does have some
crowding out effect on employment with domestic firms. Estimating the same effects among
the foreign producers themselves suggest that technology diffusion or spillovers are much
more rapid within the foreign producer community. Again, and due to the inaccuracy of the
technology spillover proxy, the result may be caused by a third unobservable factor which
could be the better ability of foreign owned firms to invest in the ‘right’ or expanding
industries. Robustness checks were made as explained above by differencing out and
lagging the spillover proxy one or two periods (not shown). The positive spillover results
were maintained unilaterally across all specifications again with the exception of employment
growth with domestic firms. However, only the technology spillover effect on domestic firms
maintained its significance whereas only the profitability spillover effect maintained its
significance among the foreign held firms.

CASE Network Studies & Analyses No.391 - Pay More, Earn Less, Work Harder - New Evidence …
26
5. POLICY IMPLICATIONS The quantitative results obtained in the paper have already been summarized in the
introduction part. The conclusion will therefore focus on addressing the potential policy and
research implications of the study.
Helping firm performance in emerging markets is a balancing act between optimizing both
subsidiary and local firm performance. One cannot be understood without the other as a long
tradition of research on FDI and firm performance in this context shows. To optimize
subsidiary and local firm performance requires attention to be paid both to the direct and
indirect impacts of FDI on firm performance. This problem is very similar to the fundamental
problem of economic growth being that of finding institutional setups that can give incentives
for innovation, while not sheltering innovators too much from the competitive process that
involves both competition per se and technology diffusion. Helping foreign subsidiary
performance in emerging markets will in most cases also have a positive effect on local
firms. So in the conclusion I will try to focus on areas where policy-makers in the new or
emerging market economies can set in to assure that this will be the case.
The first area of general concern is the relationship between market efficiency and how FDI
affects both short or static and long run market efficiency. This has rarely been addressed in
the empirical literature in concrete and practical ways. For Poland it was found that especially
the selling of assets to owners abroad did not raise concerns for short run market efficiency.
However, this result may in some ways be peculiar to the specific polish institutional context
and Poland’s transition path. Privatization in Poland has followed a gradualist approach and
privatization has been high quality in the sense that a relatively large amount of resources
have been invested in the matching of assets to be privatized with that of new and more
efficient owners. Social concerns and short run job protection has played a considerable role
in these negotiations. Different institutional contexts should be studied to better understand
the implications of FDI for market efficiency.
One potential area of concern with respect to market efficiency is the large gap in capital
intensity across foreign and domestic held firms which could be a signal that barriers to entry
are increasing over time. Hence market efficiency outcomes need to be monitored on a
continuous basis. When rebates or discounts on taxes or investments are given policy-
makers should be concerned that such schemes are available equally to all firms.
CASE Network Studies & Analyses No.391 - Pay More, Earn Less, Work Harder - New Evidence …
27
With respect to spillover effects the study shows that there may be a high element of
antagonism and rivalry across ownership groups. This may be in particular true for long run
performance or firm growth. To maximize spillovers policy-makers should support institutions
and initiatives that will reduce the tendency of advancement of one ownership group at the
expense of the other. No doubt socialization and communication have a large bearing on
spillover effects also in industrial communities. Although not addressed in this study, barriers
to communication, such as language and cultural differences, are among the most important
to be removed.
The results on spillovers and competition documented in the present research should be
complemented by results focusing on particular industry cases whereby it will be possible to
measure the evolution in efficiency, markup levels, competition and spillover effects in more
exact ways. Partly the problems incurred in the present research can also be resolved by
using panels where the time dimension takes greater prominence in the results. Other long
run performance measures should be the object of analysis such as entry and exit rates.
CASE Network Studies & Analyses No.391 - Pay More, Earn Less, Work Harder - New Evidence …
28
REFERENCES
Altomonte, Carlo and Enrico Pennings (2005): ‘Searching for horizontal spillovers through
incremental foreign direct investment’, Tinbergen Institute Discussion Paper, TI-2005 101/4,
Erasmus University, Holland.
Anand, Jaideep and Andrew Delios (1997): ‘Location Specificity and the Transferability of
Downstream Assets to Foreign Subsidiaries’, Journal of International Business Studies, Vol.
28, No. 3, pp 579-603.
Arnold, Jens Matthias and Beata Smarzynska Javorcik (2005): ‘Gifted Kids or Pushy
Parents? Foreign Acquisitions and Plant Performance in Indonesia’, CEPR Discussion
Paper, No. 5065, London.
Barrios, Salvador, Holger Görg and Eric Strobl (2005): ‘Foreign Direct Investment,
Competition and Industrial Development in the Host Country’, European Economic Review,
Vol. 49, No. 7, pp 1761-1784.
Berger, Allen N., George R.G. Clarke, Robert Cull, Leora Klapper and Gregory F. Udell
(2005): ‘Corporate governance and bank performance: A joint analysis of the static,
selection, and dynamic effects of domestic, foreign and state ownership’, Journal of Banking
and Finance, Vol. 29, pp 2179-2221.
Blomström, Magnus and Fredrik Sjöholm (1999): ‘Technology transfer and spillovers: Does
local participation with multinationals matter?’, European Economic Review, Vol. 43, No. 4-6,
pp 915-923.
Conyon, Marin J., Sourafel Girma, Steve Thompson and Peter W. Wright (2002): ‘The
Productivity and Wage Effects of Foreign Acquisition in the United Kingdom’, The Journal of
Industrial Economics, Vol. 50, No. 1, pp 85-102.
Corrado, Carol, Paul Lengermann and Larry Slifman (2008): ‘The Contribution of
Multinational Corporations to U.S. Productivity Growth, 1977-2000’, in Reinsdorff, Marshall
and Matthew Slaughter (eds.) International Trade in Services and Intangibles in the Era of
Globalization, forthcoming from the University of Chicago Press.
CASE Network Studies & Analyses No.391 - Pay More, Earn Less, Work Harder - New Evidence …
29
Crespo, Nuno and Maria Paula Fontoura (2007): ‘Determinant Factors of FDI Spillovers –
What Do We Really Know?’, World Development, Vol. 35, No. 3, pp 410-425.
Damijan, Joze P., Matija Rojec, Boris Majcen and Mark Knell (2008): ‘Impact of Firm
Heterogeneity on Direct and Spillover Effects of FDI: Micro Evidence from Ten Transition
Countries’, LICOS Discussion Paper Series, No. 218/2008, LICOS Centre for Institutions and
Economic Performance, Katholieke Universiteit Leuven.
Demsetz, Harold (1988): ‘The Theory of the Firm Revisited’, Journal of Law, Economics and
Organization, Vol. 4, No. 1, pp 141-161.
Demsetz, Harold (1973): ‘Industry Structure, Market Rivalry and Public Policy’, Journal of
Law and Economics, Vol. 16, No. 1, pp 1-9.
Dunning, John H. (1981): International Production and the Multinational enterprise, George
Allen & Unwin, London.
Estrin, Saul, Jan Hanousekm Evzen Kocenda and Jan Svejnar (2009): ‘Effects of
Privatization and Ownership in Transition Economies’, World Bank Policy Research Working
Paper, No. 4811, The World Bank, Washington D.C.
Fernandes, Ana M. (2007): ‘Trade policy, trade volumes and plant-level productivity in
Colombian manufacturing industries’, Journal of International Economics, Vol. 71, No. 1, pp
52-71.
Frees, Edward W. (2005): Longitudinal and Panel Data – Analysis and applications in the
social sciences, Cambridge University Press, New York.
Görg, Holger and Eric Strobl (2001): ‘Multinational Companies and Productivity Spillovers: A
Meta-Analysis’, The Economic Journal, Vol. 111, No. 475, pp F723-F739.
Görg, Holger, Alexander Hijzen and Balazs Muraközy (2009): ‘The role of production
technology for productivity spillovers from multinationals: Firm-level evidence for Hungary’,
Kiel Working Papers, No. 1482, Kiel Institute for the World Economy.
CASE Network Studies & Analyses No.391 - Pay More, Earn Less, Work Harder - New Evidence …
30
Haddad, Mona and Ann E. Harrison (1993): ‘Are There Positive Spillovers from Direct
Foreign Investment? Evidence from Panel Data for Morocco’, Journal of Development
Economics, Vol. 42, No 1, pp 51-74.
Hymer, Stephen (1970): ‘The Efficiency (Contradictions) of Multinational Corporations’, The
American Economic Review, Vol. 60, no. 2, Papers and Proceedings of the Eighty-second
Annual Meeting of the American Economic Association, pp 441-448.
Karpaty, Patrik (2007): ‘Productivity Effects of Foreign Acquisitions in Swedish
Manufacturing: The FDI Productivity Issue Revisited’, International Journal of the Economics
of Business, Vol. 14, No. 2, pp 241-260.
Kokko, Ari (1996): ‘Productivity spillovers from competition between local firms and foreign
affiliates’, Journal of International Development, Vol. 8, No. 4, pp 517-530.
Lipsey, Robert E. and Fredrik Sjöholm (2005): ‘The Impact of Inward FDI on Host Countries:
Why such different answers?’ in Moran, Theodore H. , E.M. Graham and M. Blomström
(eds.) Does foreign direct investment promote development? Peterson Institute for
International Economics, Washington D.C.
Markusen, James R. (1995): ‘Incorporating the multinational enterprise into the theory of
international trade’, Journal of Economic Perspectives Vol. 9, pp 169–189.
Sjöholm, Fredrik (1999): ‘Technology gap, competition and spillovers from direct foreign
investment: evidence from establishment data’, Journal of Development Studies, Vol. 36, No.
1, pp 53-73.

CASE Network Studies & Analyses No.391 - Pay More, Earn Less, Work Harder - New Evidence …
31
APPENDIX 1. Methodologies used to estimate Total Factor Productivity Two different methods towards estimating total factor productivity have been used, re.
TFPOLS (the OLS method) and TFPLP (the Levinsohn-Petrin method) reported in the paper.
Following the literature on estimates of total factor productivity, the OLS estimates may be
seriously biased due to problems of simultaneity (Olley and Pakes, 1996, Levinsohn and
Petrin, 2003).
Under the OLS method TFP is calculated as the residual under the BLUE assumptions (error
terms are serially uncorrelated, homoscedastic and reflect random and unobserved shocks
that are i.i.d. ):
iataiataiataiatiatiat mlkyyy γβα ˆˆˆˆ −−−=− (A1.1)
Where output y is sales revenue (when materials are included otherwise value added), k is
capital, l is labor and m is material inputs. (Small letters denote logarithmic transformation.)
The problem of simultaneity is widely discussed and addressed in the literature. It arises
because if productivity shocks are partially and differently observed by managers across
firms it may violate the BLUE assumptions. For example assume ω in this production
function is observed by managers before deciding inputs and hence error terms are no
longer i.i.d.:
tttttt mlky εωγβαχ +++++= 0 (A1.1)
One way to approach the problem is to use semi-parametric estimation techniques. Olley
and Pakes (1996) introduce the first attempt using inputs of capital as a proxy for the
observed part of the productivity shock. Levinsohn and Petrin (2003) correct the Olley and
Pakes method in view to non-linearity in the investment function suggesting instead usage of
variable inputs such as materials or energy as a proxy for the observed part of the
productivity shock. Estimates of α, β and γ in A1.1 are now obtained using that ω is a
function of the inputs of capital and materials.

CASE Network Studies & Analyses No.391 - Pay More, Earn Less, Work Harder - New Evidence …
32
It has been documented that with the OLS approach the productivity parameters for labor
and other variable inputs such a materials have been overestimated, whereas the parameter
for capital tends to be underestimated. On balance Petrin et al. (2004) show that economies
of scale are exaggerated by OLS and hence total factor productivity is underestimated.
The routine is fairly complex and described in detail in Levinsohn and Petrin (2003) and
Petrin et al. (2004). However, it can easily be implemented in STATA invoking the LEVPET
routine if first installed. The approach used here is based on the production function in its net
form (using value added as dependent variable) and using the default set up (two lags for
instruments and the nl command as minimizing routine).
Under the OLS method the parameters can be estimated with one expanded equation
rendering the same results as estimating the production function separately by industry and
ownership groups. Under the LP method parameters must be obtained by estimating it
separately by industry
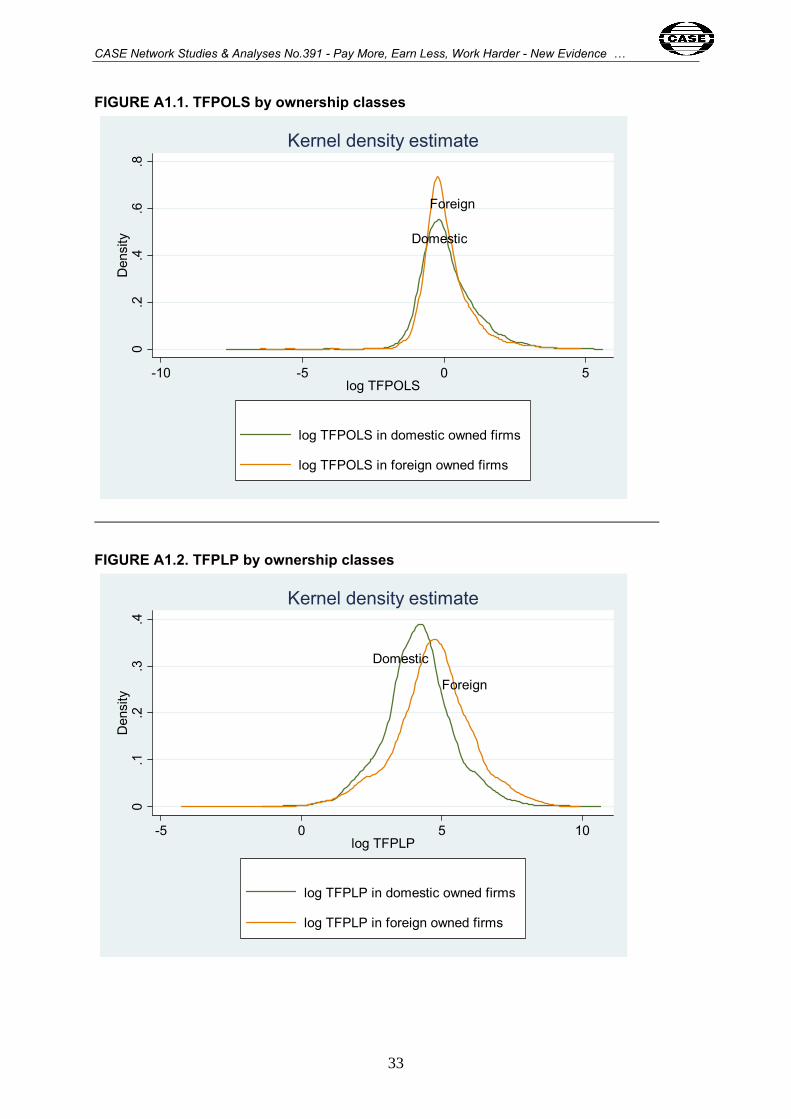
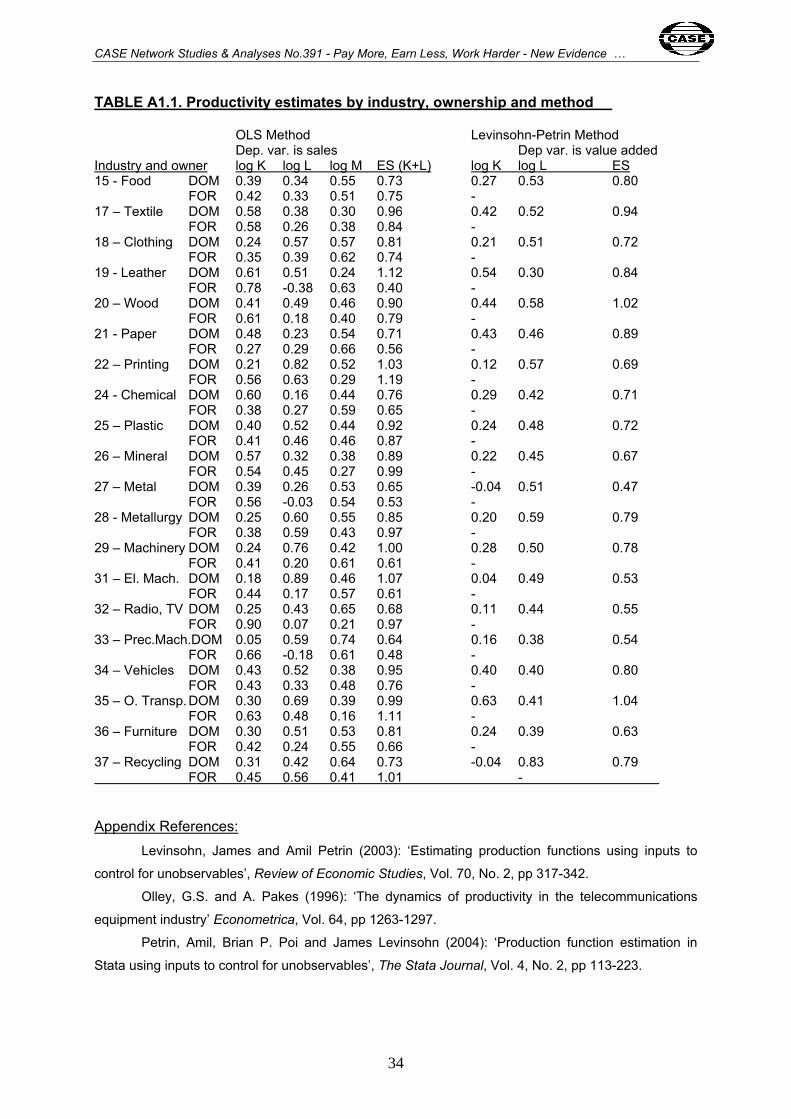
Comparative parameter estimates are reported in Table A1.1. and the estimated Kernel
distributions of obtained TFP by ownership classes are reported with Figures A.1.1 and A.1.2
respectively.
It should be noted that the Levinsohn-Petrin procedure has higher computational
requirements in terms of numbers of observations needed to obtain reliable parameter
estimates. Hence it is not possible to calculate productivity parameters and residuals (TFP)
for all industries and ownership groups separately for this specific dataset. Furthermore,
productivity parameters vary at least as much with asset history as by ownership group in
this specific panel. Instead common parameters are estimated by industry under this method
and the remaining heterogeneity is addressed with the subsequent equations as reported in
the paper. This is not an optimal but necessary solution due to the relatively low number of
observations available for many industries in the study. The alternative approach being
excluding industries selectively could raise other issues of selection bias.
CASE Network Studies & Analyses No.391 - Pay More, Earn Less, Work Harder - New Evidence …
33
FIGURE A1.1. TFPOLS by ownership classes
Domestic
Foreign
0.2
.4.6
.8D
ensi
ty
-10 -5 0 5log TFPOLS
log TFPOLS in domestic owned firms
log TFPOLS in foreign owned firms
Kernel density estimate
FIGURE A1.2. TFPLP by ownership classes
Foreign
Domestic
0.1
.2.3
.4D
ensi
ty
-5 0 5 10log TFPLP
log TFPLP in domestic owned firms
log TFPLP in foreign owned firms
Kernel density estimate
CASE Network Studies & Analyses No.391 - Pay More, Earn Less, Work Harder - New Evidence …
34
TABLE A1.1. Productivity estimates by industry, ownership and method OLS Method Levinsohn-Petrin Method Dep. var. is sales Dep var. is value added Industry and owner log K log L log M ES (K+L) log K log L ES 15 - Food DOM 0.39 0.34 0.55 0.73 0.27 0.53 0.80 FOR 0.42 0.33 0.51 0.75 - 17 – Textile DOM 0.58 0.38 0.30 0.96 0.42 0.52 0.94 FOR 0.58 0.26 0.38 0.84 - 18 – Clothing DOM 0.24 0.57 0.57 0.81 0.21 0.51 0.72 FOR 0.35 0.39 0.62 0.74 - 19 - Leather DOM 0.61 0.51 0.24 1.12 0.54 0.30 0.84 FOR 0.78 -0.38 0.63 0.40 - 20 – Wood DOM 0.41 0.49 0.46 0.90 0.44 0.58 1.02 FOR 0.61 0.18 0.40 0.79 - 21 - Paper DOM 0.48 0.23 0.54 0.71 0.43 0.46 0.89 FOR 0.27 0.29 0.66 0.56 - 22 – Printing DOM 0.21 0.82 0.52 1.03 0.12 0.57 0.69 FOR 0.56 0.63 0.29 1.19 - 24 - Chemical DOM 0.60 0.16 0.44 0.76 0.29 0.42 0.71 FOR 0.38 0.27 0.59 0.65 - 25 – Plastic DOM 0.40 0.52 0.44 0.92 0.24 0.48 0.72 FOR 0.41 0.46 0.46 0.87 - 26 – Mineral DOM 0.57 0.32 0.38 0.89 0.22 0.45 0.67 FOR 0.54 0.45 0.27 0.99 - 27 – Metal DOM 0.39 0.26 0.53 0.65 -0.04 0.51 0.47 FOR 0.56 -0.03 0.54 0.53 - 28 - Metallurgy DOM 0.25 0.60 0.55 0.85 0.20 0.59 0.79 FOR 0.38 0.59 0.43 0.97 - 29 – Machinery DOM 0.24 0.76 0.42 1.00 0.28 0.50 0.78 FOR 0.41 0.20 0.61 0.61 - 31 – El. Mach. DOM 0.18 0.89 0.46 1.07 0.04 0.49 0.53 FOR 0.44 0.17 0.57 0.61 - 32 – Radio, TV DOM 0.25 0.43 0.65 0.68 0.11 0.44 0.55 FOR 0.90 0.07 0.21 0.97 - 33 – Prec.Mach.DOM 0.05 0.59 0.74 0.64 0.16 0.38 0.54 FOR 0.66 -0.18 0.61 0.48 - 34 – Vehicles DOM 0.43 0.52 0.38 0.95 0.40 0.40 0.80 FOR 0.43 0.33 0.48 0.76 - 35 – O. Transp. DOM 0.30 0.69 0.39 0.99 0.63 0.41 1.04 FOR 0.63 0.48 0.16 1.11 - 36 – Furniture DOM 0.30 0.51 0.53 0.81 0.24 0.39 0.63 FOR 0.42 0.24 0.55 0.66 - 37 – Recycling DOM 0.31 0.42 0.64 0.73 -0.04 0.83 0.79 FOR 0.45 0.56 0.41 1.01 -
Appendix References: Levinsohn, James and Amil Petrin (2003): ‘Estimating production functions using inputs to
control for unobservables’, Review of Economic Studies, Vol. 70, No. 2, pp 317-342.
Olley, G.S. and A. Pakes (1996): ‘The dynamics of productivity in the telecommunications
equipment industry’ Econometrica, Vol. 64, pp 1263-1297.
Petrin, Amil, Brian P. Poi and James Levinsohn (2004): ‘Production function estimation in
Stata using inputs to control for unobservables’, The Stata Journal, Vol. 4, No. 2, pp 113-223.

CASE Network Studies & Analyses No.391 - Pay More, Earn Less, Work Harder - New Evidence …
35
APPENDIX 2. About the data TABLE A2.1. Descriptive statistics and Pearson correlation coefficients Calculated in STATA on full sample 1. 2. 3. 4. 5. 6. 7. 8. 9. 10. 11. 12. 1. COMP (number of) Mean 166 SD (143) 1.00 2. CAPITAL (thous. PLN) 19,901 (91,205) -0.097 1.00 3. DOM (dummy) 0.67 (0.47) 0.023 -0.101 1.00 4. SHAREFOR (share) 0.34 (0.22) -0.151 0.031 -0.178 1.00 5. LABOUR (number of) 323 (746) -0.083 0.778 -0.036 -0.055 1.00 6. MATCOST (thous. PLN) 25,816 (160,979) -0.070 0.766 -0.123 0.062 0.690 1.00 7. MARKUP (ratio) 1.06 (0.22) -0.009 0.009 -0.003 0.050 -0.016 0.004 1.00 8. OLD (dummy) 0.41 (0.49) -0.093 0.099 0.164 -0.053 0.202 0.053 -0.029 1.00 9. ROA (ratio) 0.57 (7.88) 0.006 -0.012 0.029 0.015 -0.018 -0.006 0.065 -0.027 1.00 10. SALES (thous. PLN) 47,912 (156,654) -0.089 0.818 -0.151 0.064 0.730 0.944 0.016 0.090 -0.080 1.00 11. TFPLP (parameter) 212.15 (757.63) -0.143 0.499 -0.114 0.056 0.493 0.430 0.032 0.028 0.032 0.486 1.00 12. TFPOLS (parameter) 2.15 (6.29) -0.007 -0.047 0.020 0.004 -0.076 -0.050 0.037 -0.092 0.180 -0.035 0.094 1.00