case network studies and analyrses 273 - eu enlargement: benefits of the single market expansion for...
TRANSCRIPT

S t u d i a i A n a l i z y
S t u d i e s & A n a l y s e s C e n t r u m A n a l i z
S p o ł e c z n o – E k o n o m i c z n y c h
C e n t e r f o r S o c i a l
a n d E c o n o m i c R e s e a r c h
2 7 3
Maryla Maliszewska
EU Enlargement: Benefits of the Single Market Expansion for Current and New Member States
W a r s a w , J a n u a r y 2 0 0 4
Materials published here have a working paper character. They can be subject to further
publication. The views and opinions expressed here reflect the author(s) point of view and not
necessarily those of the CASE.
Keywords: computable general equilibrium, EU enlargement, sin gle market.
© CASE – Center for Social and Economic Research, Warsaw 2004
Graphic Design: Agnieszka Natalia Bury
ISSN 1506-1701, ISBN: 83-7178-333-7
Publisher:
CASE – Center for Social and Economic Research
12 Sienkiewicza, 00-944 Warsaw, Poland
tel.: (48 22) 622 66 27, 828 61 33, fax: (48 22) 828 60 69
e-mail: [email protected] http://www.case.com.pl/

Contents Abstract ........................................... ................................................................................................ 5
1. Introduction .................................... ............................................................................................. 6
2. Previous studies of EU-CEECs’ integration ....... ...................................................................... 7
3. The model ....................................... ............................................................................................. 9
4. Defining accession. ............................. ..................................................................................... 11
4.1 Formation of the customs union......................................................................................... 12
4.2 Single Market Access ........................................................................................................ 13
4.2.1 Border costs............................................................................................................................ 14
4.2.2 Standards costs ...................................................................................................................... 15
5. Results of the static experiments............... ............................................................................. 18
5.1 Adoption of the Common External Tariff ............................................................................ 19
5.2 Impact of the Customs Union............................................................................................. 21
5.3 Impact of the Single Market ............................................................................................... 23
6. Steady state scenarios .......................... ................................................................................... 28
6.1 The enlargement scenario ................................................................................................. 29
6.2 The enlargement scenario with increased substitution possibilities................................... 32
7. Sensitivity analysis............................ ....................................................................................... 38
8. Discussion of the results ....................... .................................................................................. 41
9. Conclusions ..................................... ......................................................................................... 43
References......................................... ............................................................................................ 44
Studies & Analyses No. 273 – EU Enlargement: Benefits of the Single Market Expansion..
4
Maryla Maliszewska
Maryla Maliszewska (born 1973) has been working with the CASE Foundation since 1996. She
is the author of papers on the modelling of international trade flows, determinants of the real
exchange rate, location of production and agglomeration externalities in transition, as well as the
impact of Poland's accession to the EU within a computable general equilibrium framework. In the
years 1997-98 and in 1999, she worked as a CASE representative in the ProDemocratia advisory
mission in Romania. In 2000 she was employed as a summer intern at the World Bank, where she
worked on the empirical assessment of the impact of international trade on employment in Poland.
Maryla Maliszewska is a graduate of the University of Sussex (1996) and Warsaw University's
Department of Economics (1997). This publication constitutes the fourth chapter of her DPhil thesis
entitled “Four Essays on International Trade and Location of Production in Transition Countries”
submitted at the University of Sussex in October 2003.
Studies & Analyses No. 273 – Maryla Maliszewska
5
Abstract
This paper evaluates the implications of Eastern EU enlargement with the use of a computable
general equilibrium model. The focus is on accession to the Single Market, with explicit modelling
of the removal of border costs and costs of producing to different national standards. The results
indicate significant welfare gains for the CEECs (volume of GDP increases by 1.4-2.4%) and
modest gains for the EU. The steady state scenarios, which allow for the capital stock adjustment
in response to higher return to capital, more than double the static welfare gains.

Studies & Analyses No. 273 – EU Enlargement: Benefits of the Single Market Expansion..
6
1. Introduction 1
The aim of this paper is to evaluate the economic implications of enlargement of the European
Union (EU) to include the Central and Eastern European countries (CEECs). It is a commonly
accepted view that further integration with the European structures will be beneficial to the CEECs
in a political and economic sense; however the estimates of the potential economic gains vary
widely. Even though the impact of EU accession will be advantageous for the applicant countries
as a whole, many sectors will actually see their production decreasing and some employees might
see their wages declining in relative terms. The objective of this study is to estimate the scale and
nature of the structural adjustments resulting from accession by quantifying its impact on
production, employment and wages in different sectors of new members’ economies.
The focus is on technical barriers to trade (TBT), as by the end of 2002 all tariffs on
manufacturing goods will be removed in accordance with the Europe Agreements. Access to the
Single market is defined as adoption of the EU standards and removal of internal borders.
Business surveys conducted before completion of the Single Market indicated that simplification of
border formalities and harmonisation of product and safety standards were viewed as the most
important internal market barriers. The removal of these barriers is therefore likely to be also the
major benefit of accession for the CEECs.
The paper is organised as follows. The next section briefly presents previous studies on EU-
CEECs’ integration and discusses the ways in which this paper contributes to the literature.
Section 3 describes the model. The next section discusses the process of enlargement and how it
is translated into experiments conducted in this study. Sections 5 and 6 present the static and long
run results of the adoption of the Common External Tariff (CET), customs union and Single Market
access. The next section includes sensitivity analysis. The last section puts the results of this study
into the perspective of the results of existing empirical work.
Finally, a large part of important material was relegated to appendices for the sake of clarity of
presentation. Appendix A provides equations, description of the model, parameters and calibration.
Appendix B discusses the data on protection employed in this study and compares it with data
used in most of the previous computable general equilibrium studies. It also describes the creation
of benchmark equilibrium and presents the most important economic features of the regions at the
time of enlargement. Appendix C looks at the importance of technical barriers to trade in the EU
and in trade between the CEECs and the EU. Appendices are available from the author on
request.
1 I would like to thank my supervisors Professor A. Smith and Professor L.A. Winters; and Dr M. Gasiorek for helpful
comments and suggestions. I also benefited from comments received at the GTAP Fifth Annual Conference on Global Economic Analysis in Taipei in June 2002. All interpretations and remaining errors are my own responsibility.
Studies & Analyses No. 273 – Maryla Maliszewska
7
2. Previous studies of EU-CEECs’ integration
Most studies conducted so far focus on the economic effects of the eastern enlargement of the
EU on the current member states. The implications of the accession for the CEECs are given less
attention. A brief discussion of the previous studies is presented below.
Winters and Wang (1994) quantify the expected results of the Europe Agreements focusing on
sensitive sectors: iron, steel, clothing and footwear. They conclude that there are substantial gains
for the CEECs from this trade liberalisation.
Winters (1994) focuses on the steel industry. Looking at what would have happened if the
Europe Agreements (EA) existed in 1992 and allowing complete steel liberalisation, he found out
that it would have led to substantial gains for EU consumers, and for CEECs’ producers.
Rollo and Smith (1993) use a computable partial equilibrium model to analyse the effects of
the EAs, focusing on sensitive sectors. They show that even a huge increase in CEECs’ exports of
other sensitive products will have a diverse, but not a significant impact on current member states.
They also analyse the inclusion of the CEECs into the Common Agricultural Policy (CAP).
Gasiorek, Smith and Venables (1994) model the economic impact of the increased trade with
the CEECs on the EU within the computable general equilibrium (CGE) framework. They conclude
that even a substantial trade growth will have little influence on the output and welfare in EU
countries.
However, the studies by Brown et al. (1995), Baldwin et al. (1997), Francois (1998) and Forslid
et al. (1999) focus on the economic implications of the integration for the CEECs. The results of
these studies will be discussed in greater detail in the section presenting the results of this study.
Brown et al. (1995) use a CGE model to evaluate the implications of Poland-Hungary-Czech
Republic-EU integration on economic welfare, trade, output, employment by sector as well as the
real returns to capital and labour in the CEECs and the EU. They model the effects of reduction of
tariffs and non-tariff barriers (NTBs) and the rationalisation of the production process by capturing
scale economies and increasing product variety. The results suggest that as a result of integration
the CEECs will experience substantial economic welfare gains. The impact on output, wages and
employment in the CEECs is unequally distributed among sectors. In Czechoslovakia and Poland
output and employment tend to expand across virtually all sectors. Hungary exhibits a great degree
of specialisation with some sectors expanding and some declining.
Baldwin et al. (1997) analyse the implications of the elimination of all trade barriers between
CEECs and the EU, adoption of the common external tariff and accession to the Single Market in a
CGE framework. According to their estimates, all European regions gain from the enlargement and
the CEECs gain much more in relative terms. The authors also model the implications of a
decrease of investment risk in the CEECs and increase of their capital stock as a result of
accession. When the accumulation effects are taken into account the expected gains for the
CEECs are much higher.

Studies & Analyses No. 273 – EU Enlargement: Benefits of the Single Market Expansion..
8
Francois’s (1998) paper is based on a similar model to Baldwin et al. (1997). It also looks at
the impact of free trade between the EU and the CEECs, the reduction in transaction costs and
decreased investment risk in the CEECs. However, Francois (1998) decomposes the impact of
accession into static allocation, accumulation and pro-competitive effects. This allows him to
conclude that major gains for the CEECs come from the accumulation of capital and efficiency
gains following the integration of imperfectly competitive industries. Francois (1998) stresses that
long run benefits to the CEECs will be connected with deep structural adjustments, as some
sectors will see their output decreasing by as much as 90% of the benchmark level.
Forslid et al. (1999) study the effects of increased integration between CEECs and the EU by
modelling a 5% fall in import barriers, export subsidies and transport costs. Similar to the previous
studies, the results show that further integration between the two regions produces significant
welfare gains to the CEECs, while the EU gains are small. Exports from the CEECs are expected
to increase across all manufacturing sectors, with production shifting towards labour-intensive
products.
The existing research does not provide a comprehensive picture of the implications of
accession for the individual applicant countries. The study by Brown et al. (1995) models the
implications of free trade area and not accession. In the models of Baldwin et al. (1997), Francois
(1998) and Forslid et al. (1999), seven CEECs are treated as an entity and therefore it is not
possible to assess the impact of accession on individual countries. Furthermore, the modelling
work is based on data from 1992 or older. However, probably the main weakness of the empirical
work conducted so far is that it does not include an implicit modelling of the Single Market, but
employs the somewhat arbitrary assumption of an across-the-board equal reduction of real costs of
trade. The consequences of enlargement for employment and relative wages of manual and non-
manual workers are not analysed either.
The above shortcomings must have also led other authors to the conclusion that more
research on accession was needed, as a more recent study by Lejour, de Mooij and Nahuis (LMN,
2001) – published only after I started my work – deals with most of the above limitations. This
paper looks at the implications of formation of a customs union, accession to the Single market and
labour migration. Due to the use of protection levels from the Global Trade Analysis Project
(GTAP) database the Europe Agreements form part of the EU accession scenario.2 The authors
estimate the impact of the Single market on trade with the use of gravity equations. LMN (2001)
compare the trade intensity between the EU members with two otherwise equivalent countries,
which are not members of the EU, to calculate potential trade flows between the EU and the
CEECs following the Single market enlargement. Then the potential trade increases per sector are
translated into Samuelsonian iceberg trade-cost equivalents of the barriers (non-tariff barriers). The
abolition of those non-tariff barriers in the CGE model results in trade flows that correspond to
predictions from the gravity model. The derived barriers to trade differ significantly between sectors
2 The GTAP database does not incorporate the provisions of the Europe Agreements and the Uruguay Round (UR)
commitments.

Studies & Analyses No. 273 – Maryla Maliszewska
9
and vary between 0% (Metals, Other Manufacturing, Raw Materials) and 17% (Agriculture).
Sectors, where the potential impact of the Single market access on trade is the highest include
Trade Services (17.2%), Textiles and Leather (14.5%), Non-metallic Minerals (13.1%) and
Transport Equipment (11.4%).
My modelling exercise differs in three major ways from that of LMN (2001). Firstly, I employ the
actual pre-accession protection data on trade between Poland, Hungary and the EU based on the
World Trade Organisation (WTO) Trade Policy Reviews. Tariff margins are a crucial factor
influencing the results of trade policy experiments, therefore the construction of data and definition
of policy experiments require careful consideration. Based on the actual protection levels in 1997
and the subsequent tariff liberalisations I simulate benchmark equilibrium at the time of accession.3
Secondly, I model border and standards costs explicitly as additional transport costs and value
added in production respectively, while LMN (2001) employ tariff equivalents of non-tariff barriers.
To this end I employ estimates of these barriers in the pre-1992 EU. Finally, I assume imperfectly
competitive behaviour in selected sectors, which seems to be a more realistic assumption as to the
nature of competitive interactions between firms in several industries.
3. The model
The model employed in this study is a standard static computable general equilibrium model. It
includes several price-wedge distortions such as factor taxes in production, value-added taxes,
import tariffs and export subsidies. Factor taxes in production and value-added taxes remain
unchanged in simulations. Production involves combination of intermediate inputs and primary
factors (capital, skilled and unskilled labour). We assume a Constant Elasticity of Substitution
(CES) function over primary factors and a Leontief production function combining intermediate
inputs with factors of production composite. Primary factors are mobile across sectors within a
region, but immobile internationally. Each region has a government, whose revenue is held
constant at the benchmark level and a single representative consumer. The trade balance is also
held constant in counterfactual simulations.
Demand for final goods arises from a Cobb-Douglas utility function. The demand structure is
illustrated in Figure 1. Within each region, final and intermediate demands are composed of the
same Armington aggregate of domestic and imported varieties. The composite supply is a nested
CES function, where consumers first allocate their expenditures among domestic and imported
varieties and then choose among imported varieties. In the imperfect competition case firm
varieties enter at the bottom of the CES function. This approach allows for the differentiation in
preferences for home and imported goods. The special form of this demand structure is firm level
product differentiation. It requires the assumption that all elasticities of substitution between firms
and products are equal. Demand is then represented by a single level CES function with all
domestic and imported varieties competing directly, as illustrated in Figure 2.
3 For details see Appendix B.

Studies & Analyses No. 273 – EU Enlargement: Benefits of the Single Market Expansion..
10
Figure 1. Demand structure in the IRTS scenario – f irm level product differentiation within an Armington aggregate
Variety 1 Variety 2 Variety 3
Domestic Composite
Variety 1 Variety 2 Variety 3
EU Goods
Variety 1 Variety 2 Variety 3
ROW Goods
Import Composite
Armington Composite
Source: HRT (1996a).
Figure 2. Armington composite with equal elasticiti es of substitution for all product varieties
DomesticVariety 1
DomesticVariety 2
EUVariety 1
EUVariety 2
ROWVariety 1
ROWVariety 2
Armington Composite
Source: HRT (1996a).
There is strong empirical evidence for modelling selected sectors as imperfectly competitive
(e.g. Pratten, 1988). Increasing returns to scale (IRTS) in production are assumed in 15 out of 26
industries. These sectors generate around 40% of value added in Poland and Hungary. Production
in IRTS sectors requires a fixed cost and marginal cost is assumed to be constant. Firms act as
Cournot competitors and free entry and exit ensures zero profits. Section 3 in Appendix A covers
derivation of markup equations and calibration of equilibrium conditions in IRTS sectors, as well as
the values of the returns to scale employed.
A detailed description of the model equations, calibration and parameters employed is
provided in Appendix A. It is based on the MRT – Multiregional Trade Model – by Harrison,
Rutherford and Tarr (HRT) implemented in their evaluation of the impact of completion of the
Single Market (HRT, 1994 and HRT, 1996a). The HRT model is modified in the sensitivity section.
My application includes fifteen regions and twenty six sectors, of which seventeen are
manufacturing industries.
Studies & Analyses No. 273 – Maryla Maliszewska
11
The data originates from the Global Trade Analysis Project Version 5 database, which includes
the national and regional input-output structures, bilateral trade flows, final demands pattern and
government intervention benchmarked to 1997. The GTAP protection data does not incorporate
the preferential trade agreements between the EU and the CEECs (Europe Agreements) and
between the CEECs themselves (Central European Free Trade Area, CEFTA). Therefore, the
protection data is first updated based on the 1997 applied tariffs and imposed on the initial set of
the social accounting matrices (SAMs). Then the impact of further trade liberalisation between
1997 at the time of accession is modelled with the use of a CGE model described above. The
resulting set of accounting matrices is referred to as the benchmark.
Appendix B includes a detailed description of trade protection of Poland, Hungary and the EU
in 1997 and at the time of accession and differences in protection data employed in this study and
as reported in GTAP. These differences are substantial and the use of the updated tariff rates has
a crucial impact on the results of this modelling exercise. The following sections of Appendix B
present the methodology employed in the creation of the benchmark equilibrium and the main
characteristics of Poland, Hungary and the EU at the time of enlargement. The discussion of trade
penetration by sectors and differences in factor shares in value added allows for better
understanding of the welfare implications of enlargement and its impact on industrial structures.
4. Defining accession.
The admission of CEECs to the EU can be viewed as a three-stage process. The first step is
full integration into the customs union with the freedom of movement of non-CAP goods, of
services and of capital. The second step is a full integration of the CEECs into the CAP and free
movement of labour. The last step is economic and monetary union. Ideally, the quantification of
the impact of accession on the CEECs should capture all of the above elements of membership.
However, as discussed by Smith et al. (1995) or Mayhew (1998), the accession of the CEECs to
the European Monetary Union (EMU) is likely to come at a much later stage of integration. Full
integration into the CAP will be preceded by a ten-year transition period, during which prices of
agricultural products and income support to producers will be gradually adjusted to the EU level.4
The modelling of the whole process of accession would be extremely difficult, as it would involve a
lot of guessing and forecasting of the long-term developments in the CEECs and the EU. It is
therefore sensible to concentrate the modelling effort on the following factors, which will come in
the early stages of accession:
• integration into the customs union, which will involve elimination of all remaining
tariff and non-tariff barriers to trade and adoption of the Common External Tariff
by the CEECs,
4 The long-term reform of the CAP has been agreed upon and accession negotiations have been concluded, but
those issues were not resolved yet when I did my work.

Studies & Analyses No. 273 – EU Enlargement: Benefits of the Single Market Expansion..
12
• accession to the Single Market, which will lead to the reduction in real transaction
costs as a result of simplification of border formalities, harmonised product and
safety standards, similarity of business environment etc.
In what follows I will use the term “accession” to refer to enlargement of the customs union and
the Single Market.
4.1 Formation of the customs union
The first development in formation of the customs union was negotiation of the Europe
Agreements (EAs) with the associated countries. Poland signed an Association (Europe)
Agreement with the EU in December 1991. The agreement became fully effective in February
1994. The EA aimed to establish a free trade area over a maximum period of ten years. Polish
industrial exports have benefited from duty free treatment since January 1995, except for coal,
steel and textiles, which were granted duty free access in 1996 and 1997 respectively. Poland
eliminated duties on industrial products imported from the EU on 1 January 1999, except for steel
and petroleum on which duties were abolished in 2000, and automobiles on 1 January 2002. In the
case of agricultural products the EA included reciprocal concessions in the form of reduced tariffs
on a number of products and increased quotas (WTO, 2000). Hungary also negotiated its trade
agreements with the EU in December 1991. The content of EAs was broadly similar for all
associated countries. The EU eliminated the majority of its tariffs on industrial products imported
from Hungary by 1992. The tariffs on sensitive products other than textiles and clothing were
abolished on 1 January 1995. Duties on textiles and clothing were removed on 1 January 1997 and
quantitative restrictions were abolished a year later. As of 1 January 1998 Hungarian goods have
enjoyed duty free access to the EU market. Hungary eliminated its duties in two steps i.e. on 1
January 1994 and 1997. Hungary still kept duties on “sensitive” products such as chemicals,
textiles and clothing and steel products. The complete elimination of duties on EU industrial
imports took place on 1 January 2001. Trade in agricultural goods is also being liberalised in
accordance with the EAs and new agreements on reciprocal concessions (see Appendix B for
details). The accession itself will lead to complete elimination of the remaining tariffs and non-tariff
barriers in trade between the CEECs and the EU.
In addition, the CEECs will adopt the Common External Tariff (CET) applied by the EU in trade
with the third countries. After the Uruguay Round (UR) tariff bindings, the majority of Polish and
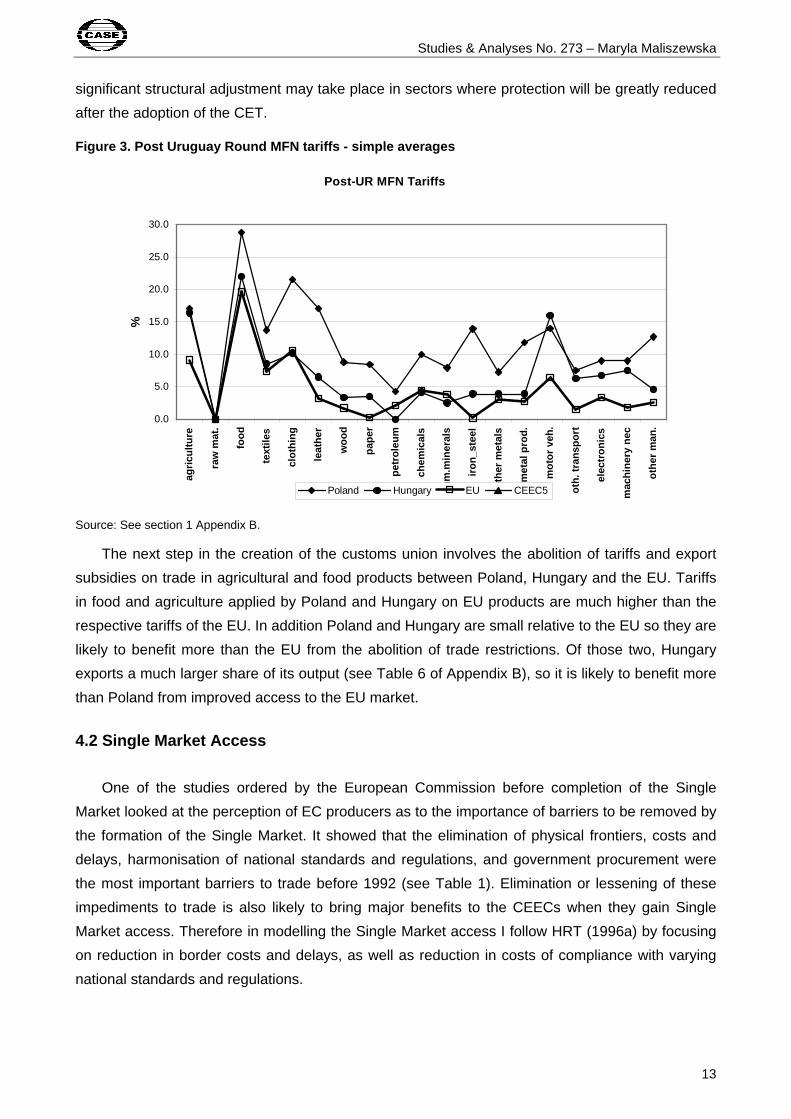
Hungarian duties still exceed those applied by the EU (see Figure 3). The average post-UR tariff
for industrial goods weighted by most favoured nation (MFN) imports amounts to 2.9% in the EU,
6.9% in Poland and 6.7% in Hungary (Finger, Ingco and Reincke, 1996). Only the Hungarian tariffs
on imports of Clothing, Petroleum, Chemicals and Non-metallic Minerals are lower than the EU
tariffs. The protection of Hungary is significantly higher than that of the EU in the case of imports of
Motor Vehicles, Machinery and Equipment and Other Transport Equipment. In Poland the same is
true in the case of Leather, Iron and Steel, Clothing, Metal Products, Paper and Motor Vehicles. A
Studies & Analyses No. 273 – Maryla Maliszewska
13
significant structural adjustment may take place in sectors where protection will be greatly reduced
after the adoption of the CET.
Figure 3. Post Uruguay Round MFN tariffs - simple a verages
Post-UR MFN Tariffs
0.0
5.0
10.0
15.0
20.0
25.0
30.0
agric
ultu
re
raw
mat
.
food
text
iles
clot
hing
leat
her
woo
d
pape
r
petr
oleu
m
chem
ical
s
nm.m
iner
als
iron_
stee
l
othe
r m
etal
s
met
al p
rod.
mot
or v
eh.
oth.
tran
spor
t
elec
tron
ics
mac
hine
ry n
ec
othe
r m
an.
%
Poland Hungary EU CEEC5
Source: See section 1 Appendix B.
The next step in the creation of the customs union involves the abolition of tariffs and export
subsidies on trade in agricultural and food products between Poland, Hungary and the EU. Tariffs
in food and agriculture applied by Poland and Hungary on EU products are much higher than the
respective tariffs of the EU. In addition Poland and Hungary are small relative to the EU so they are
likely to benefit more than the EU from the abolition of trade restrictions. Of those two, Hungary
exports a much larger share of its output (see Table 6 of Appendix B), so it is likely to benefit more
than Poland from improved access to the EU market.
4.2 Single Market Access
One of the studies ordered by the European Commission before completion of the Single
Market looked at the perception of EC producers as to the importance of barriers to be removed by
the formation of the Single Market. It showed that the elimination of physical frontiers, costs and
delays, harmonisation of national standards and regulations, and government procurement were
the most important barriers to trade before 1992 (see Table 1). Elimination or lessening of these
impediments to trade is also likely to bring major benefits to the CEECs when they gain Single
Market access. Therefore in modelling the Single Market access I follow HRT (1996a) by focusing
on reduction in border costs and delays, as well as reduction in costs of compliance with varying
national standards and regulations.

Studies & Analyses No. 273 – EU Enlargement: Benefits of the Single Market Expansion..
14
Table 1. Perceived importance of internal market ba rriers (ranks)
Total industry EUR12
National standards and regulations 2
Government procurement 1
Administrative barriers 8
Physical frontier delays and costs 3
Differences in VAT 6/7
Regulations of freight transport 6/7
Restrictions in capital market 5
Community law 5
Q: How important do you consider these barriers to be removed? 1 = most important 8 = least important Source: European Commission (1987).
4.2.1 Border costs
One of the most observable barriers to trade is due to the existence of borders and customs
formalities, which involve delays and various kinds of administrative costs. At the moment all goods
from the CEECs exported to the EU and vice versa are stopped at the EU border for customs
clearance. Following enlargement the customs and fiscal controls in trade with the EU will be
conducted directly from firms’ offices. However, due to restrictions on the movement of persons in
the first years following enlargement there will remain some costs related to the existence of
physical borders.
According to Cawley and Davenport (1988, Tables B2 and A3), the unweighted average of the
border costs before completion of the Single Market amounted to 1.7 % of the total amount traded.
In order to update those figures to the post-Single Market 1997 values, I use the results of the
survey from European Commission (1997b). This study includes the results of a large business
survey, where firms were asked to evaluate the Single Market’s effect on delays at the borders.
According to this survey 56% of firms believed that the Single Market had a positive effect by
eliminating delays at the borders. I follow Hoffmann (2000) in assuming that the proportion of
border costs removed in a given country equals to the share of positive responses from given
country firms. Therefore if the initial trade cost amounted to 1.7% and 56% of this cost was
eliminated, the post 1992 border cost amounts to 0.75, i.e. 1.7-(1-0.56) = 0.75. This constitutes an
upper bound of the possible elimination of border costs as this calculation assumes that for those
firms where the Single Market had a positive impact on elimination of border costs, the border
costs were eliminated completely. Border costs in all remaining regions of the model i.e. in all
countries except for the EU are assumed to be equal to 2%.

Studies & Analyses No. 273 – Maryla Maliszewska
15
Table 2. Border Costs Before and After 1992 in the current member states
Exporter Border costs before 1992 as a per cent of total exports
Post-1992 border costs
Austria 1.3 0.65
France 1.437 0.632
Germany 1.562 0.687
Greece 1.5 0.75
Great Britain 1.176 0.788
Italy 1.378 0.524
Netherlands 1.441 0.778
Portugal 1.379 0.593
Spain 1.451 0.348
Rest of the EU 1.508 0.329
Source: see text.
Border costs are modelled as additional purchases of a domestic transportation good, which
includes shipping, handling and warehousing for customs purchases. With the establishment of the
customs union, these costs will be greatly reduced.
4.2.2 Standards costs
The EC has been concerned with the elimination of the technical barriers to trade since its
creation. However, the major effort of elimination of barriers to trade imposed by differing national
regulations and standards was undertaken with the creation of the Single Market. Appendix C
includes a detailed discussion of standards and technical regulations and the importance of those
barriers in trade between the EU and the CEECs.
The Single Market measures consist of 2,556 different mandated standards. This number rises
to more than 20,000 when voluntary standards are considered. By October 1997 the number of
standards approved in all EU member states amounted to only 32% of the total number of
mandated standards. The process of implementing standards is slow, as in the survey conducted
for the European Commission only 39% of the businessman in the EU believed that the Single
Marked had eliminated barriers to trade, while 20% believed that it had no effect (EC, 1997). In
1998 only 25% of the intra-EU trade was free from any technical barriers to trade (Brenton et al.
2001).
HRT (1996a) and Hoffmann (2001) assume that the sum of border and standards costs
amounts to 2.5% and calculate the costs of compliance with foreign standards as the residual
between 2.5% and border costs discussed above. This approach seems rather arbitrary. I follow a
different approach by using the rough numbers from the Cost of Non-Europe study (European
Commission, 1988). Based on the extensive interviews of EC firms the costs of obstacles to
transborder activity were expressed as a per cent of turnover. One of the obstacles considered

Studies & Analyses No. 273 – EU Enlargement: Benefits of the Single Market Expansion..
16
were technical standards. The authors assign to each industry a number between 0 and 4. In this
index “0” indicates no costs implied by a given barrier, “1” corresponds to a cost of less than 1% of
turnover and indicates that respondents experience a significant but not prohibitive nuisance, and
“4” indicates a cost of 3% or more and significant barriers to trade. The resulting costs of
standards and technical regulations before completion of the Single Market are presented in Table
3 below (column 3 and 4 are useful in further discussion).
Table 3. Standards cost rate before and after 1992
Standards Cost Rate in the EU (%) Exports as a shar e of total exports (%)
1988 1997 Hungary Poland
Agriculture 2 0 3 1
Raw materials 1 0 3 30
Food 2 0 6 5
Textiles 1 0 2 2
Clothing 1 0 4 5
Leather 1 0 2 3
Wood 1 0.7 2 6
Paper 1 0.3 1 2
Petroleum 1 0 1 2
Chemicals 2 1.2 8 5
Non-metallic Minerals 1 0.7 2 2
Iron, steel 1 0.6 1 3
Other metals 1 0.5 2 3
Metal prod. 1 0.6 2 3
Motor vehicles 2 1.6 10 3
Other transport equipm. 3 1.3 1 1
Electronics 3 2.2 13 2
Machinery n.e.c. 2 0.4 14 8
Manufacturing n.e.c. 1 0.7 2 3
Utilities 1 0.2 2 1
Trade 1 0.4 2 2
Transport 1 0.2 4 6
Financial services 1 0.2 6 5
Source: columns 1 and 2: see main text, columns 3 and 4: pre-accession levels in Table 6 of Appendix B.
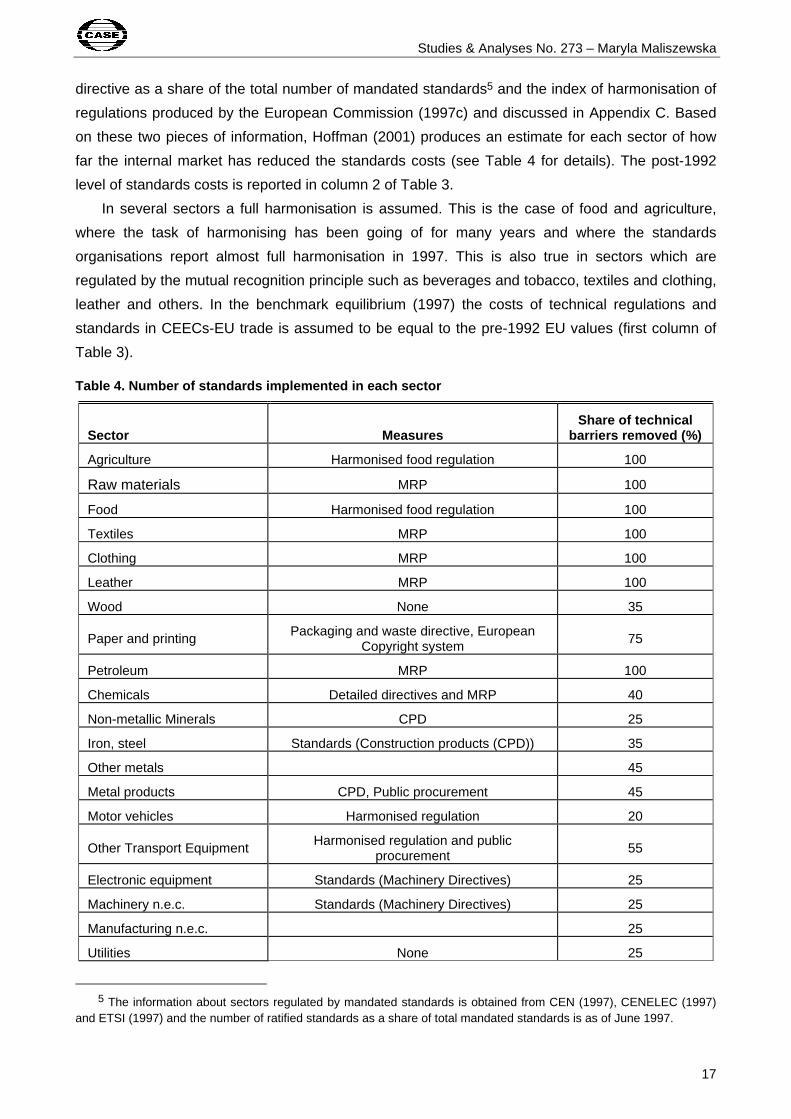
These numbers need to be updated to their post-Single Market values. To this end I employ
the same methodology as Hoffmann (2001). In evaluating the size of reduction of technical barriers
he takes into account two measures. These are the number of ratified standards related to each
Studies & Analyses No. 273 – Maryla Maliszewska
17
directive as a share of the total number of mandated standards5 and the index of harmonisation of
regulations produced by the European Commission (1997c) and discussed in Appendix C. Based
on these two pieces of information, Hoffman (2001) produces an estimate for each sector of how
far the internal market has reduced the standards costs (see Table 4 for details). The post-1992
level of standards costs is reported in column 2 of Table 3.
In several sectors a full harmonisation is assumed. This is the case of food and agriculture,
where the task of harmonising has been going of for many years and where the standards
organisations report almost full harmonisation in 1997. This is also true in sectors which are
regulated by the mutual recognition principle such as beverages and tobacco, textiles and clothing,
leather and others. In the benchmark equilibrium (1997) the costs of technical regulations and
standards in CEECs-EU trade is assumed to be equal to the pre-1992 EU values (first column of
Table 3).
Table 4. Number of standards implemented in each se ctor
Sector Measures Share of technical
barriers removed (%)
Agriculture Harmonised food regulation 100
Raw materials MRP 100
Food Harmonised food regulation 100
Textiles MRP 100
Clothing MRP 100
Leather MRP 100
Wood None 35
Paper and printing Packaging and waste directive, European Copyright system
75
Petroleum MRP 100
Chemicals Detailed directives and MRP 40
Non-metallic Minerals CPD 25
Iron, steel Standards (Construction products (CPD)) 35
Other metals 45
Metal products CPD, Public procurement 45
Motor vehicles Harmonised regulation 20
Other Transport Equipment Harmonised regulation and public procurement
55
Electronic equipment Standards (Machinery Directives) 25
Machinery n.e.c. Standards (Machinery Directives) 25
Manufacturing n.e.c. 25
Utilities None 25
5 The information about sectors regulated by mandated standards is obtained from CEN (1997), CENELEC (1997)
and ETSI (1997) and the number of ratified standards as a share of total mandated standards is as of June 1997.
Studies & Analyses No. 273 – EU Enlargement: Benefits of the Single Market Expansion..
18
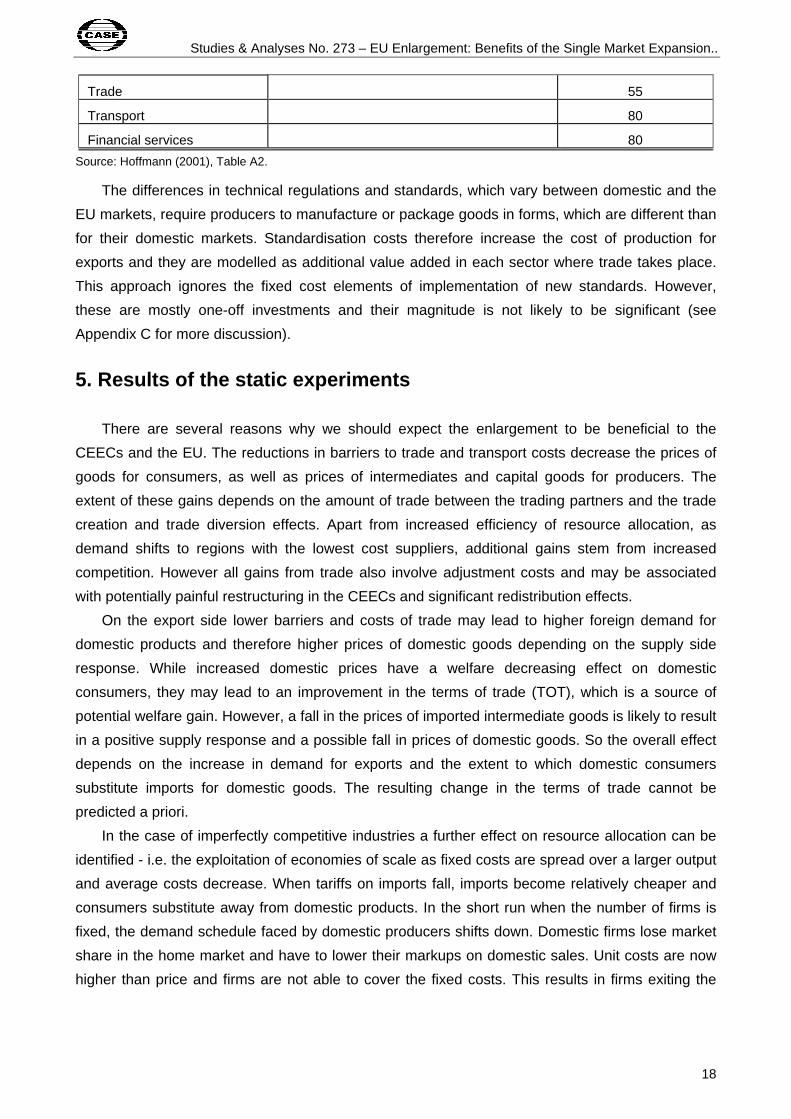
Trade 55
Transport 80
Financial services 80
Source: Hoffmann (2001), Table A2.
The differences in technical regulations and standards, which vary between domestic and the
EU markets, require producers to manufacture or package goods in forms, which are different than
for their domestic markets. Standardisation costs therefore increase the cost of production for
exports and they are modelled as additional value added in each sector where trade takes place.
This approach ignores the fixed cost elements of implementation of new standards. However,
these are mostly one-off investments and their magnitude is not likely to be significant (see
Appendix C for more discussion).
5. Results of the static experiments
There are several reasons why we should expect the enlargement to be beneficial to the
CEECs and the EU. The reductions in barriers to trade and transport costs decrease the prices of
goods for consumers, as well as prices of intermediates and capital goods for producers. The
extent of these gains depends on the amount of trade between the trading partners and the trade
creation and trade diversion effects. Apart from increased efficiency of resource allocation, as
demand shifts to regions with the lowest cost suppliers, additional gains stem from increased
competition. However all gains from trade also involve adjustment costs and may be associated
with potentially painful restructuring in the CEECs and significant redistribution effects.
On the export side lower barriers and costs of trade may lead to higher foreign demand for
domestic products and therefore higher prices of domestic goods depending on the supply side
response. While increased domestic prices have a welfare decreasing effect on domestic
consumers, they may lead to an improvement in the terms of trade (TOT), which is a source of
potential welfare gain. However, a fall in the prices of imported intermediate goods is likely to result
in a positive supply response and a possible fall in prices of domestic goods. So the overall effect
depends on the increase in demand for exports and the extent to which domestic consumers
substitute imports for domestic goods. The resulting change in the terms of trade cannot be
predicted a priori.
In the case of imperfectly competitive industries a further effect on resource allocation can be
identified - i.e. the exploitation of economies of scale as fixed costs are spread over a larger output
and average costs decrease. When tariffs on imports fall, imports become relatively cheaper and
consumers substitute away from domestic products. In the short run when the number of firms is
fixed, the demand schedule faced by domestic producers shifts down. Domestic firms lose market
share in the home market and have to lower their markups on domestic sales. Unit costs are now
higher than price and firms are not able to cover the fixed costs. This results in firms exiting the

Studies & Analyses No. 273 – Maryla Maliszewska
19
industry and output per firm of the surviving firms increasing as they slide down their average cost
curves.
In all experiments presented in this paper I model the impact of greater integration with the EU
of only Poland and Hungary. The first reason is that the CEECs-5 aggregate contains three
countries which are first wave candidates (the Czech Republic, Slovakia and Slovenia) and some
which are likely to become EU members at some later stage (Romania and Bulgaria). However
the main reason for not including the CEECs-5 is that the data on trade protection of those
countries was not available to the author. As in the case of Poland and Hungary there are
considerable differences between tariffs reported by GTAP and applied tariffs in 1997. Modelling
the impact of accession in the CEECs-5 would overstate the true impact of enlargement if the initial
protection data were too high. In concentrating on the implications of enlargement for Poland and
Hungary we illustrate the possible impact on the second wave of applicants left outside the EU for
some more years. Leaving the CEECs-5 outside the EU in the experiments does not affect the
results for Hungary and Poland, as simulations not reported here show there are virtually no
spillovers between those regions.
5.1 Adoption of the Common External Tariff
Welfare implications of the adoption of the CET by Poland and Hungary are presented in Table
5. In the IRTS scenario Poland gains 0.27% (equivalent variation as a percent of GDP) and
Hungary gains just 0.16%, while welfare changes in other regions are close to nil. Poland
experiences larger welfare gains, because its external tariffs are much higher than those of the EU
and so there are more efficiency gains to be reaped. The welfare impact of the adoption of CET is
not big, because trade with the rest of the world (ROW) accounts for less than one third of total
trade of Poland and Hungary. In addition the adjustments in sectoral outputs are also modest.
Table 5. Welfare effects of the Customs Union (equi valent variation as a percent of GDP):
Common External Tariff CEt and free trade in cap g oods
CRTS IRTS CRTS IRTS
EU15 -0.01 -0.01 0 0
Austria -0.006 -0.007 0.001 0.007
Rest of the EU -0.01 -0.011 -0.006 0.002
France -0.004 -0.004 -0.003 -0.001
Germany -0.011 -0.012 -0.002 0.005
Great Britain -0.006 -0.004 -0.004 0
Greece -0.004 -0.003 0.001 0.008
Portugal -0.005 -0.004 -0.008 -0.007
Spain -0.005 -0.005 -0.004 -0.001
Italy -0.007 -0.006 -0.006 -0.001

Studies & Analyses No. 273 – EU Enlargement: Benefits of the Single Market Expansion..
20
Netherlands -0.013 -0.013 -0.005 0.017
Hungary 0.114 0.161 1.585 1.717
Poland 0.237 0.27 0.96 1.031
CEECs-5 -0.005 -0.007 -0.031 -0.031
Former Soviet Union 0.004 0.004 0.003 0.002
Rest of the World 0.004 0.008 0.002 0.006
Source: Model simulations.
Table 6 reports the sectoral impact of the adoption of the CET in Poland and Hungary. Output
changes in all other regions are very small, only in few cases exceeding 1%. Following the
adoption of the CET goods from the ROW become relatively cheaper compared to domestically
produced goods. ROW exports of agricultural and food products to Poland and Hungary increase
substantially. As a result domestic production in those sectors falls, except for food in Hungary,
where the production increases slightly due to lower agricultural prices. Increased competition on a
domestic market coupled with cheaper intermediate inputs reduces the prices of most
manufacturing goods in Poland and Hungary. Lower prices raise demand for Polish and Hungarian
products abroad and lead to production and exports expansion. In Poland sectors enjoying
significant production expansion include Other Metals, Iron and Steel, Wood, Motor Vehicles and
Clothing. In Hungary major expansion of output is recorded in production of Electronic Equipment,
Motor Vehicles, Machinery and Equipment. These are mainly sectors where the share of exports in
production and tariffs’ reductions following the imposition of CET are the highest.
Table 6. Sectoral effects (relative changes in outp ut) of the adoption of the CET and in the customs union scenarios (IRTS scenario).
CET CET and Free Trade in CAP Goods
Hungary Poland Hungary Poland France Germany UK Italy
Agriculture -1.1 -1.9 15.7 1.4 -0.2 0.4 -0.2
Raw materials 0.2 0.5 -9.1 -1.4 0.3 -0.1 0.1
Food 0.5 -1.3 53.3 13.6 -0.7 -0.6 -0.3 -0.3
Textiles -0.5 0.4 -9.7 -5.2 0.1 -0.3 -0.1
Clothing -0.6 1 -14 -5.3 0.1 -0.4
Leather -1.3 -3.7 -14 -7.5 0.1 -1.1 -0.1 -0.3
Wood -0.4 1.5 -9.2 -3.9 0.1 0.2 0.1 0.1
Paper -0.5 -0.4 -4.8 -1.7 0.1
Petroleum -0.5 0.1 -1.5 -0.5
Chemicals -0.7 -0.3 -7 -3.6 0.1 0.2
Non-metallic Min. -0.1 0.4 -6.5 -2.8 0.1 0.1 0.1
Iron, steel 0.3 1.7 -6 -3.9 -0.1 -0.2 0.1
Other metals -0.1 3.7 -8.9 -2.1 0.2 -0.1 2.1 0.4
Metal products -0.2 -0.3 -8.3 -4.2 -0.1 -0.1 0.2

Studies & Analyses No. 273 – Maryla Maliszewska
21
Motor vehicles 3.4 1.9 -2.8 -0.4 -0.1 -0.2 -0.1
Other transport equipment
1.2 -1.4 -6.9 -4.3 0.2 0.5 -0.1 -0.1
Electronics 3.7 -0.9 -3.5 -4.7 0.1 -0.1
Machinery n.e.c. 2.3 0.1 -7.6 -4.3 -0.1 0.2
Manufact. n.e.c. -1 -1.6 -6.9 -3.8 -0.1 0.1 0.1
Utilities -0.2 -1.1 -1
Construction 0.4 0.4 1.2 -0.3
Trade 0.1 0.3 -0.3
Transport 1.2 0.1 0.2 3.1 0.1 0.2 0.1
Financial services -0.2 0.1 -2.1 -1.5
Note: Sectors in bold are subject to IRTS. Source: Model simulations.
Table 5 also presents welfare implications of the adoption of the CET under the assumption of
constant returns to scale (CRTS). The differences in welfare implications between CRTS and IRTS
are very small in this experiment. As already noted above, the additional gains arise from
rationalisation in the use of fixed costs and a decrease in consumption deadweight loss due to
lower markups. Output changes under CRTS (not reported here) have the same sign as under the
assumption of IRTS, but the magnitude of output changes under IRTS is generally larger in
absolute terms. Therefore it seems that traditional determinants of resource allocation, factor
intensities and taxes play a crucial role in influencing industrial structures. Shifts in relative costs
that occur in CRTS provide an impulse for output fall or expansion. If policy changes lead to
expansion of output in a given sector, then under IRTS this results in a decline of average cost and
price with output expanding even further.
5.2 Impact of the Customs Union
As mentioned above, the Europe Agreements provide for the complete elimination of
protection in trade in manufacturing goods by the time of accession. Therefore the second scenario
looks at the implications of formation of the Customs Union, where in addition to the adoption of
the CET by Hungary and Poland barriers to trade in food and agricultural goods between the EU
and Poland and Hungary are eliminated. In the IRTS scenario the expected welfare gains increase
to 1.7% of GDP in Hungary and 1% of GDP in Poland (see Table 5). Protection levels in food and
agriculture are very high in the benchmark equilibrium (see Appendix B). In addition all countries
provide export subsidies in agriculture and food processing, with EU export support being the
highest (GTAP, 2001). Therefore, the abolition of all barriers to trade results in major changes in
output of agricultural and food products (see Table 6).
In Poland, the substantially lower tariffs on agricultural goods from ROW result in much higher
imports from this region and only a small increase in production of agricultural goods. In addition,
since only a small share of output is exported, sales to foreign markets cannot provide a significant

Studies & Analyses No. 273 – EU Enlargement: Benefits of the Single Market Expansion..
22
boost to domestic production. In Hungary, which had initially lower tariffs on ROW imports in
agriculture and exports a large share of its output to the EU, the situation is quite different. Here
better access to the EU market leads to a significant increase in production of agricultural products.
However, the production of food rises in both countries, as in addition to better access to the EU
market, the prices of major inputs - i.e. agricultural goods - fall significantly. Again the rise in food
production in Hungary is much higher than in Poland, because Hungary exports a large share of its
output to the EU and has a positive trade balance with the EU in this sector.
As a result of the adoption of the CET the protection of manufacturing goods falls and imports
from the ROW become relatively cheaper. This exerts downward pressure on the prices of
manufacturing products in Poland and Hungary. Lower prices of manufactures should lead to an
increase in exports, but expanding food and agricultural sectors attract factors of production away
from industry leading to a fall in production of all manufacturing goods. The transport sector enjoys
a modest increase in output due to rise in trade flows, which increases demand for transportation
services.
In most EU countries the impact on production is almost negligible. However, France,
Germany and Italy record a small increase in production of Other and Transportation Equipment
and the UK increases production on Non-Ferrous Metals. Exports from these countries to other EU
members replace imports from Poland and Hungary.
This scenario seems too extreme, as with output quotas imposed by the EU on new member
states, food production in Poland and Hungary will not be allowed to expand by 14%-53%. In
addition the marketing ability of the CEECs’ producers and the quality of food products will
severely limit the ability of expansion of Polish and, to a lesser extent, Hungarian food sales in the
EU. One more significant factor, which will hamper such an expansion of exports of agricultural
and food products of Poland and Hungary to the EU, is the fact that the price advantage of CEECs’
products has been eroded significantly since 1997. Not only are domestic prices rising with
increasing domestic support, but also the real appreciation of national currencies also increases
the prices of Polish and Hungarian products in euros.
Negotiations on quotas on production, direct payments to Polish and Hungarian farmers and
the conditions of the market access between the candidate countries and the EU were still not
concluded when this analysis was conducted. However, given the focus on manufacturing and
therefore the level of sectoral aggregation chosen for this model it would have been impossible to
incorporate the most important elements of the CAP for agricultural and food products. However,
the results of the customs union scenario provide a rough estimate of possible implications of the
abolition of protection on CAP products and the tremendous pressures within the CAP.
Studies & Analyses No. 273 – Maryla Maliszewska
23
5.3 Impact of the Single Market
This section presents the implications of the elimination of border and standards costs. Border
costs are similar to import tariffs, because they also raise the price of exports in the foreign market.
Therefore a decrease in border costs has a similar impact on integrating regions as a tariff
reduction. It leads to trade creation and trade diversion and changes in the terms of trade. It also
affects the incentives to invest. There are, however, two major differences as compared to the
impact of tariffs. The first is that border costs do not generate any revenue to the government and
their reduction leads to terms-of-trade gain. A bilateral reduction of these costs may lead to TOT
gains in both regions. As border costs are included in the cif price of imports, but not in the fob
price of exports, a reduction in border costs raises the price of exports relative to the price of
imports. The second difference is that border costs are symmetric, so that their reduction induces
fiercer competition on the home market and a better competitive position on the foreign market.
This is also the case of standards costs. They increase the cost of production for exports and their
reduction simultaneously improves home country firms’ positions in foreign markets and exposes
them to more intense competition at home.
In the Single Market scenario I look at the implications of a symmetric reduction in border and
standards costs between Poland, Hungary and the EU. The impact of accession on the costs of
compliance with national standards and regulations requires more discussion. Most foreign
companies that invested in the region already incorporate the necessary requirements. This is also
the case of producers already exporting to the EU, whose products already comply with EU
regulations. For those firms accession to the internal market is likely to reduce the costs of
compliance due to greater availability of the conformity assessment centres in the home countries
and greater competition between them. The Union has begun to sign European Conformity
Assessment Agreements with the associated countries. These agreements establish that the
CEECs can propose conformity assessment centres and testing laboratories for particular product
groups for testing by EU experts, with a view to their acceptance by the EU as registered
assessment centres. Products declared as complying with national standards in these home
based centres will be allowed to be traded within the internal market. This is likely to shorten the
time required to obtain a declaration of conformity with national regulation and lower the costs of
this process. In addition, products approved for sale in the EU could be also exported to other new
member states without any additional certification.
On the other hand, for small Polish and Hungarian firms which have been producing only for
domestic market, the introduction of EU regulations, in some cases stricter than domestic
regulation, may impose additional investment. A certain part of this investment will be undertaken
in the normal course of replacing existing equipment over the coming years. However, in some
cases the costs of compliance may be significant, e.g. in the dairy industry. A study of a small
sample of manufacturing firms was conducted by the Polish research institute (IKCHZ, 2002). It

Studies & Analyses No. 273 – EU Enlargement: Benefits of the Single Market Expansion..
24
indicates that firms that already comply with the EU regulations needed between 6 months to 3
years to obtain necessary certificates and adjust production processes. The estimated costs of
compliance amounted to about 0.5%-2% of the firms’ annual sales. The small and medium firms
which do not comply yet with EU regulations will also benefit from the establishment of the network
of conformity assessment centres and lower costs of getting products certified in conformity with
national regulation. Despite significant costs, the small firms are likely to benefit most from the
ability to export to the enlarged EU, as three quarters of small firms declare that foreign standards
and technical regulations are the major barriers to their exports to the EU. In addition they will be
able to place their products on other CEECs’ markets without any additional costs due to the
uniformity of regulations.
Overall, it seems likely that all firms will experience some reduction in standards costs. This
was certainly the case of the EU firms with completion of the internal market. In the business
survey of several industrial sectors, commissioned by Eurostat as a part of the 1997 Single Market
Review (European Commission, 1997b), between 23.6% and 48.8% of respondents in various
industries replied that the Single Market has decreased the costs of testing and certification. A
much smaller number of respondents believed that the Single Market increased the costs of testing
and certification. This answer was given by between 3.5% and 12.3% of firms from different
industries, with the exceptionally high share of 21.8% in case of manufacture of office machinery
and computers, where 40.7% of firms believed to the contrary. So overall in all industries the
majority of respondents declared that their standards cost have fallen. This is also what I believe
will happen in case of Polish and Hungarian firms with the EU accession.
At the same time, EU firms will benefit from harmonisation of standards and regulations in the
CEECs, as they will no longer need to alter their products in order to comply with the national
regulations. Since I do not have any prior expectations as to whether the EU firms will be gaining
better access to the CEECs’ markets at a faster pace or not, I simply assume that reductions in
border and standards costs are symmetrical in terms of fraction of costs being dismantled as a
result of the Single Market. I study the impact of reduction of these costs by 25, 50, 75 and 100%.
Table 7. Welfare effects of elimination of border a nd standards costs (equivalent variation as a percent of GDP)
ACC25 ACC50 ACC75 ACC100 ACC25 ACC50 ACC75 ACC100
CRTS IRTS
EU15 0.01 0.01 0.02 0.01 0.01 0.02
Austria 0.014 0.029 0.046 0.064 0.017 0.036 0.056 0.079
Rest of the EU 0.004 0.008 0.013 0.018 0.004 0.009 0.014 0.02
France 0.001 0.002 0.004 0.005 -0.001 0.001 0.002 0.003
Germany 0.006 0.014 0.022 0.031 0.006 0.015 0.025 0.036
Great Britain 0.001 0.003 0.005 0.007 0.002 0.004 0.005 0.007
Greece 0.004 0.006 0.009 0.013 0.004 0.007 0.01 0.014
Portugal 0.002 0.003 0.004 0.005 0.002 0.002 0.003 0.003
Studies & Analyses No. 273 – Maryla Maliszewska
25
Spain 0.002 0.003 0.005 0.007 0.001 0.003 0.005 0.006
Italy 0.001 0.004 0.008 0.011 0.004 0.007 0.011 0.015
Netherlands 0.005 0.011 0.017 0.024 0.006 0.012 0.019 0.026
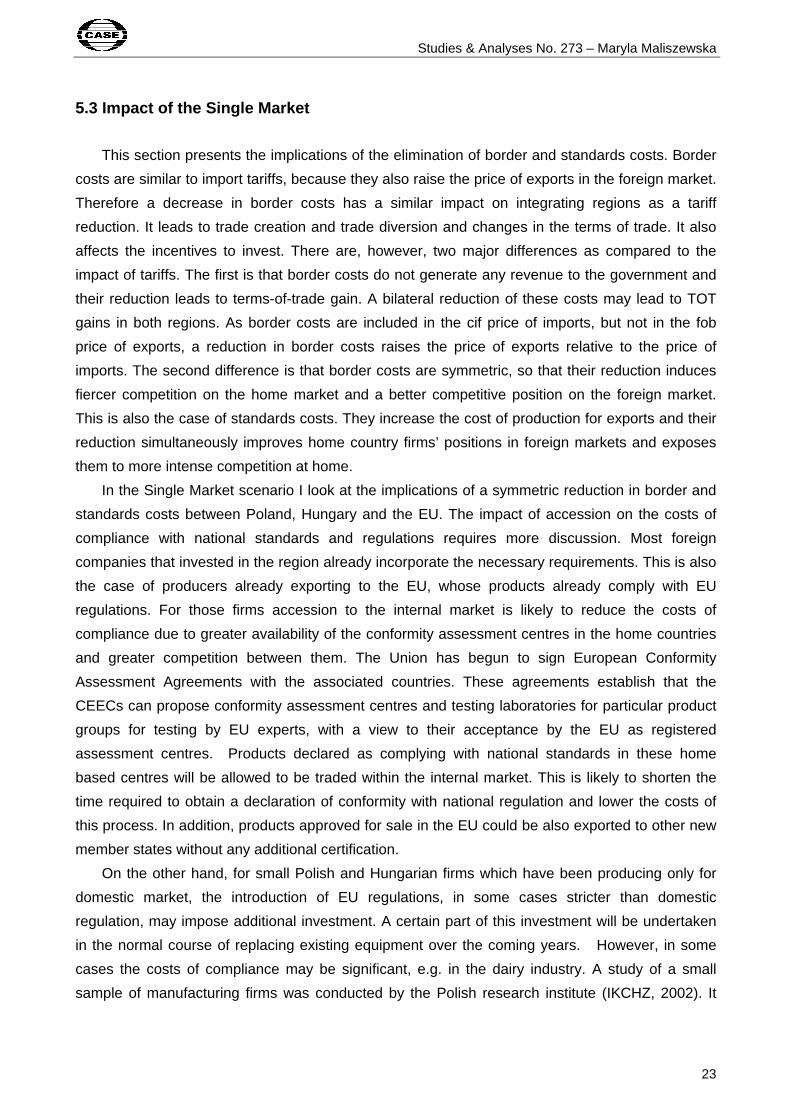
Hungary 0.473 0.975 1.508 2.074 0.537 1.108 1.717 2 .367
Poland 0.277 0.571 0.881 1.208 0.313 0.643 0.991 1. 358
CEECs-5 -0.013 -0.026 -0.038 -0.051 -0.015 -0.028 -0.041 -0.054
FSU -0.004 -0.007 -0.009 -0.012 -0.005 -0.008 -0.011 -0.014
ROW -0.001 -0.001 -0.002 0.001 -0.001 -0.002 -0.003
ACC25 – 25% reduction in border and standards costs ACC100 – 100% reduction in border and standards costs Source: Model simulations.
A complete reduction of the border and standards costs is quite unrealistic. In the case of
standards costs, the Single Market has not eliminated completely differences in national
regulations (see also Appendix C), so it is quite unlikely that accession will lead to full elimination of
these costs for the CEECs. With border controls on the movement of people and perhaps CAP
goods in place during transition period, border costs will neither be completely eliminated as a
result of accession. It is also possible that there exists some level of border and standard cost
below which these costs cannot be reduced any further, as engaging in exports might be always
slightly more costly than production for domestic market. Therefore the AC100 (complete
elimination of border and standards costs) presents the upper bound of the possible welfare gains,
however the gains of this magnitude may not materialise. Table 7 presents welfare implications of
the Single Market access.
The impact of the Single Market by far exceeds the impact of adoption of the CET.
Consecutive elimination of border and standards costs leads to gains proportionate to the size of
reduction. When production for exports becomes equally costly as domestic production the
expected welfare gains amount to 1.7% of GDP in Hungary and to 1.1% in Poland. There are two
reasons while Single Market access generates much higher welfare gains as compared to the
adoption of the CET despite the fact that the magnitude of border and standards costs is much
smaller than the level of external tariffs of Poland and Hungary before accession. The major
difference is that the CET applies to a much smaller amount of trade, as trade with the EU
accounts for roughly 70% of Polish and Hungarian trade flows. Secondly, access to the internal
market involves reduction of real costs of trade for all trading partners, while tariffs reflect
distortions in relative prices accompanied by government revenue.
The gains from Single Market access are higher for Hungary than for Poland. This is because
standards costs are higher in sectors where Hungarian comparative advantage lies (see Table 3).
The highest standards costs are recorded in sectors which account for the highest share of
Hungarian exports. This is the case of Electronic Equipment, Machinery and Equipment and Motor
Vehicles. Also, Hungary is much more open than Poland so that a larger share of its trade is
affected by the removal of NTBs (see Tables 6 and 7 in Appendix B).

Studies & Analyses No. 273 – EU Enlargement: Benefits of the Single Market Expansion..
26
Among the EU countries the major gains are recorded in Germany, Austria, Netherlands and
Italy. These are the member states that trade most with the CEECs. The regions left outside the
increasing integration zone suffer slight welfare losses due to trade diversion. As products from
Poland and Hungary face improved access to the EU market, their major competitors from CEECs,
the Former Soviet Union (FSU) and ROW are put at a disadvantage.
Finally, Table 8 presents the sectoral implications of the Single Market access. To restate, the
reduction of border and standards costs leads to fiercer competition at home and better access to
foreign markets. This via various linkages of consumption, investment and intermediate input
demand affects production structures of the countries involved. The lowering of real costs of trade
reduces the prices of intermediate inputs, decreasing the costs of production. The resulting
changes in factor prices further affect the costs of production. The overall effect depends on trade
intensity of sectors, input-output linkages and comparative advantage of regions.
Output of several sectors increases substantially as a result of Single Market access. This is
at the expense of most service sectors, Raw Materials, Paper, Chemicals and Non-metallic
Minerals. In Hungary the highest increase is recorded in Electronic Equipment and Motor Vehicles.
These are export-oriented sectors, where exports account respectively for 82% and 72% of
production. In addition initial standards costs are relatively high in those sectors, so that their
reduction generates greater incentives for export expansion. In these industries the impact of
better access to the EU market outweighs the negative impact of increased competition at home.
This is also the case of Other Metals, Motor Vehicles, Clothing and Textiles in Poland.
Output in most service sectors in Poland and Hungary falls. This is due to two factors. Real
trade costs in services are low - i.e. 1% - and trade in these sectors is rather small, so there are
few incentives for output expansion. In addition, as a result of strong expansion of some
manufacturing industries, factors of production move away from services. The impact of the Single
Market on these sectors is therefore determined by input-output linkages and relative profitability.
As the overall GDP level increases, some expansion is recorded in selected service sectors such
as Construction and Trade.
Table 8. Output changes in selected countries resul ting from a 50% and 100% reduction in border and standards costs (IRTS scenario)
ACC50 ACC100
Hungary Poland Hungary Poland Austria France Germa ny
Agriculture -0.1 -0.2 -0.1 -0.4 -0.1 -0.1 0.2
Raw materials -2.5 -0.1 -4 -0.4 -0.2 -0.1 -0.1
Food 0.9 0.1 1.8 0.2 0.1
Textiles 0.4 2.2 0.3 5 0.7 0.1 0.6
Clothing 1.2 5.3 1.3 11.1 0.7 -0.1 0.1
Leather 2.1 0.2 3.4 0.6 0.1 0.1 0.8
Wood 1.1 1.9 2.3 3.9 -0.4 -0.1 -0.1
Paper -1.1 -2.1 -2.4 -4.1 0.3 0.1 0.2

Studies & Analyses No. 273 – Maryla Maliszewska
27
Petroleum 0.1 -0.8 0.4 -1.6 -0.1 0.1 0.2
Chemicals -2.2 -1.7 -4.6 -3.3 0.6 0.1 0.2
Non-metallic Min. -1.6 -0.9 -3.7 -1.8 0.1 0.1 0.1
Iron, steel 3.3 1.3 7.1 2 -0.2 -0.2 -0.1
Other metals 5.7 5.7 12.1 8.9 0.4 -0.2 -0.1
Metal products 1.7 1 3.6 1.5 0.1 -0.1 -0.1
Motor vehicles 17 6.5 38.6 14.7 -0.2 -0.3 -0.1
Other transport equipment 9.8 2.1 21.7 4.3 1.3 0.1 0.4
Electronics 17.4 4.5 39.6 10.4 2.7 -0.2 -0.1
Machinery n.e.c. 10.8 1.4 23.4 2.9 0.3 -0.1 -0.1
Manufacturing n.e.c. -0.6 0.3 -1.6 0.3 -0.1 0.2 0.1
Utilities -0.7 -0.1 -1.1 -0.2
Construction 1.3 0.6 2.7 1.3 0.1
Trade 0.1 0.3 0.1
Transport -1.6 -0.5 -3.6 -1.3 -0.4 -0.1 0.1
Financial services -1.1 -0.7 -2.4 -1.4 -0.1
Public administration -0.3 -0.6
Source: Model simulations.
Table 9 presents the impact of Single Market on factor rewards in Poland and Hungary. The
returns to factors in the EU do not change except for a 0.1% rise of wages of both types of workers
in Austria and 0.1% rise of land rent in Netherlands and a 0.1% fall in wages of unskilled workers in
Portugal. In Poland and Hungary all factors benefit from accession to the internal market. Relative
wages of unskilled workers increase as production expands in unskilled labour-intensive sectors.
The return to capital rises more in Hungary than in Poland, because the Single Market access
leads to expansion of capital-intensive sectors in this country.
Table 9. Impact of the Single Market access on fact or rewards (% changes) – ACC100, IRTS scenario
Hungary Poland
Land 2.6 1.4
Skilled Labour 3.2 2.1
Unskilled Labour 3.7 2.3
Capital 3 2
Source: Model simulations.
In several EU countries output changes are very small (less than 0.5%) and therefore not
reported in Table 8. This is perhaps not surprising, as the Polish and Hungarian markets are
relatively small for the EU countries so the potential gains from reduction in real costs of trade are
not big. In addition the expansion of those sectors in the CEECs reduces imports from the EU. The
Studies & Analyses No. 273 – EU Enlargement: Benefits of the Single Market Expansion..
28
expansion of Electronic Equipment and Machinery and Equipment in Austria is due to higher
investment demand in Poland and Hungary.
6. Steady state scenarios
The calculation of steady state growth effects follows HRT (1996a). In the above scenarios the
price of capital was allowed to vary within each country, while capital stock was held constant. In
the steady state scenario capital stock in each country is allowed to adjust, while the price of
capital in each country is held constant. This approach is in the spirit of the equilibrium concept in
multisectoral planning models as proposed by Hansen and Koopmans (1972) and Dantzig and
Manne (1974). It assumes that there exists an invariant capital stock equilibrium. It is defined as a
set of prices, production and investment levels for which the economy is able to grow at a steady
rate with constant relative prices.
I follow HRT (1996a) by defining the optimal capital stock as the capital stock such that the
cost of investment, including depreciation and interest, is exactly equal to the capital rental rate.
However, the commodity composition of investment is not modelled explicitly. Instead I use the
assumption that the price of capital within each region is equal to the price of a basket of
consumption goods. Further, it is assumed that given the return to capital in benchmark
equilibrium, the capital stock in each country is optimal. The steady state calculation fixes the price
of capital and allows the capital stock to find an endogenous level.
This approach provides an upper bound of the potential welfare gains as it ignores the
adjustment costs and foregone consumption necessary to increase investment. For sufficiently
high discount rates the costs of forgone consumption could overturn the benefits of capital
accumulation. Baldwin (1992) suggests that that the welfare effect is much smaller than the output
effect for this component of the gains. Although in the steady state scenarios we continue to
measure welfare as equivalent variation as a share of GDP, it has to be born in mind that
incorporation of the cost of the investment required to build up the capital stock may substantially
reduce the estimates of welfare gains cited below. On the other hand our approach does not
incorporate the potential gains due to productivity improvements or endogenous growth theory
“learning by doing” effects.
Given that in the static scenario the return to capital in the CEECs increases as a result of
accession, the capital stock in this region is no longer optimal and expands to bring the rate of
return to capital to the benchmark level. The expansion of the capital stock increases the amount
of resources in the economy and generates output growth.
In the following section I discuss the steady state implications of the joint scenario, which
includes the adoption of the CET and the Single Market access. Further, I incorporate additional
benefits of standardisation. I do not analyse the steady state impact of the customs union, as this
scenario was only for illustrative purposes and is not a realistic representation of the outcome of
enlargement.

Studies & Analyses No. 273 – Maryla Maliszewska
29
6.1 The enlargement scenario
The enlargement scenario combines two scenarios analysed in previous sections - i.e. the
adoption of the CET and reduction of border and standards costs. I will also refer to it as the “base
case scenario”. The first column of Table 10, where no change in standards and border costs is
assumed, presents the steady state welfare effects of the adoption of the CET. The analysis of
detailed production, trade and pricing patterns reveals the same story as in the static scenario, with
the only exception that the capital stock is allowed to grow or contract to the level that keeps the
price of capital at its benchmark value. This magnifies the static welfare effects. The expansion or
contraction of the capital stock works as an endowment effect, so that with more resources to be
employed larger welfare gains are generated.
Table 10. Welfare effects of the adoption of the CE T and the reduction in border and standards costs (equivalent variation as a percent of GDP)
ACC0 ACC25 ACC50 ACC75 ACC100 ACC0 ACC25 ACC50 ACC75 ACC100
CRTS IRTS
EU15 0.01 0.02 0.02 0.03 0.01 0.02 0.02 0.03 0.03
Austria -0.005 0.034 0.068 0.105 0.145 -0.004 0.046 0.083 0.126 0.173
Rest of the EU -0.006 0.007 0.012 0.017 0.02 0.002 0.012 0.015 0.02 0.024
France 0.004 0.014 0.009 0.001 -0.006 0.019 0.023 0.012 0.001 -0.01
Germany -0.023 -0.002 0.012 0.026 0.041 -0.017 0.003 0.017 0.033 0.05
Great Britain 0.013 0.02 0.018 0.017 0.014 0.028 0.031 0.026 0.023 0.018
Greece -0.004 0.008 0.009 0.003 0.006 -0.003 -0.001 0.008 0.005 0.008
Portugal -0.005 -0.006 -0.005 -0.003 -0.002 -0.004 -0.005 -0.004 -0.003 -0.002
Spain 0.005 0.013 0.012 0.008 0.003 0.018 0.023 0.015 0.009 0.003
Italy 0.017 0.038 0.042 0.044 0.046 0.048 0.063 0.061 0.062 0.063
Netherlands -0.011 0.004 0.011 0.017 0.023 -0.004 0.011 0.015 0.021 0.027
Hungary 0.437 1.762 3.17 4.686 6.317 0.554 2.015 3. 528 5.189 6.974
Poland 0.286 0.906 1.563 2.26 2.999 0.386 1.082 1.8 08 2.583 3.407
CEECs-5 -0.004 -0.034 -0.062 -0.091 -0.121 -0.004 -0.015 -0.066 -0.096 -0.128
FSU 0.01 0.011 0.004 0.003 -0.009 0.016 0.011 0.005 -0.004 -0.014
ROW 0.07 0.074 0.063 0.05 0.037 0.088 0.084 0.067 0.052 0.035
ACC25 – 25% reduction in border and standards costs ACC100 – 100% reduction in border and standards costs Source: Model simulations.
The welfare and output effects of full abolition of standards and border costs and adoption of
the CET represent an upper bound of possible implications of Single Market enlargement. As
already discussed above the full abolition of “sand in the gears” did not materialise in the case of
the EU and is not a realistic assumption. According to my model, the upper limit of benefits
amounts to a sizeable 7% of GDP in Hungary and to 3.4% in Poland. The CEECs left outside the

Studies & Analyses No. 273 – EU Enlargement: Benefits of the Single Market Expansion..
30
enlarged Union and the FSU lose slightly due to trade diversion. The impact on the EU is positive,
except for Portugal. The economies which trade most with Hungary and Poland (i.e. Austria, Italy
and Germany) record small welfare gains (0.17%, 0.06% and 0.05% respectively). Portugal
experiences a negligible welfare loss. Portugal specialises in exports of similar products as Poland
and Hungary, so better access to the EU market for the new member states leads to reduction of
demand for Portuguese goods.
Table 11. Output changes resulting from a 50% reduc tion and full abolition of border and standards costs and adoption of the CET (IRTS scenario)
ACC50 ACC100
Hungary Poland Hungary Poland Austria France Germany Italy
Agriculture -0.2 -1.4 0.3 -1 -0.1
Raw materials -0.5 0.4 -1.7 0.2 0.2 0.5 0.2 0.2
Food 2.7 -0.3 4.9 0.6 -0.1
Textiles 1.1 3.6 2.4 7.1 0.8 0.4
Clothing 0.7 7.3 1.2 13.8 0.6 -0.2 -0.6 -0.1
Leather 0.4 -1.7 1.4 0.4 -0.3 -0.3 -0.2
Wood 2 5.3 4 9 -0.4 -0.1 -0.2 -0.1
Paper 0.7 -0.3 1.6 -0.5 0.4 0.2 0.1
Petroleum 2.3 -0.4 4.4 -0.4 0.1 0.1
Chemicals 0.5 -0.4 1.3 -0.5 0.7 0.1 0.3 0.1
Non-metallic Min. 1.1 0.7 1.7 0.8 0.3 0.1 0.2 0.1
Iron, steel 5.6 2.7 11.3 3.8 -0.1 -0.2 0.2
Other metals 7.3 6.4 15.4 9.5 0.8 -0.1 0.1 0.5
Metal products 3.9 1.5 8.1 3.3 0.1 -0.2 0.3
Motor vehicles 23.1 9.6 48.1 19.5 -0.4 -0.4 -0.1 -0.1
Other transport equipment
12.7 1.5 26.3 4.7 1.1 0.2 0.5 0.4
Electronics 24.1 5.4 50.3 13.4 2.2 -0.2 -0.2 -0.1
Machinery n.e.c. 15.2 2.5 30.3 5.4 0.2 -0.1 0.3
Manufacturing n.e.c. 0.7 -0.3 2 1 0.1 0.2
Utilities 1.9 1.1 3.8 2.1 0.1 0.1
Construction 4.1 2 7.9 3.7 0.1 0.1 0.1
Trade 2.6 1.5 5.1 2.9 0.1 0.1
Transport 1.3 1.8 2 2.1 -0.2 -0.1
Financial services 2.4 1 4.7 1.9 0.1 0.1
Public administration 1.6 0.5 3.3 1.1 0.2
Source: Model simulations.
Studies & Analyses No. 273 – Maryla Maliszewska
31
The sectoral implications of a 50% reduction and full elimination of border and standards costs
and adoption of the CET are presented in Table 11. The pattern of results is similar to the static
scenario of the Single Market access (Table 8). However, changes in output are magnified. Again
in Poland and Hungary, sectors gaining most from accession include Motor Vehicles, Electronic
Equipment, Other Metals, Textiles and Clothing. When border and standards costs are halved
output of Electronic Equipment and Motor Vehicles in Hungary expands by 24% and 23%
respectively. In Poland the production of Motor Vehicles increases by almost 10%, while
production of Clothing expands by 7%.
The impact on production in the remaining regions never reaches 1% of the pre-accession
output level even in case of full elimination of border and standard costs. In this scenario Austria,
France, Germany and the CEECs-5 record a small fall in production of Motor Vehicles and
Clothing as a result of expansion of these sectors in Poland and Hungary. However, the output of
selected sectors such as Electronic Equipment, Other Transport Equipment and Non-Ferrous
Metals increases in Austria, Germany and Italy.
The full abolition of border and standards costs and the adoption of the CET have serious
implications for the trade flows. Following liberalisation, markups in IRTS sectors and prices fall
significantly resulting in trade expansion. Total exports of Poland increase by 16%; an increase is
recorded in all sectors except for Utilities and Financial Services. Hungarian exports increase by
19% and only Agriculture, Raw Materials and all service sectors record a fall in exports. Imports in
all sectors increase significantly. Total imports increase by 14% in Poland and by 18% in Hungary.
The trade balance is held fixed in the simulations. There is a clear trade diversion of Polish and
Hungarian exports to EU markets away from the ROW. This is because the reduction of border
and standards costs does not affect trade with the ROW. The overall increase in imports from the
EU is greater than imports from the ROW in the case of Hungary. The opposite is true in the case
of Poland. This is mainly because in Poland adoption of the CET leads to a substantial reduction in
tariffs on ROW imports, while Hungarian pre-accession tariffs were already quite low.
The impact of enlargement on EU trade is very small. Only Austria and Germany record minor
falls in imports and exports with the EU15 of 1% and a similar increase in trade with non-EU15
countries. Also, exports of Italy, Netherlands and Portugal to non-EU15 countries increase by 1%.
However, the impact on selected sectors is quite sizeable. For example the exports of Electronic
Equipment from Austria rise by 5%, while imports increase by 3%. Imports of Raw Materials
increase between 2-4% in Austria, Germany, Spain and Italy. Imports of Motor Vehicles to Greece
rise by 13%. Greece increases imports of Motor Vehicles from Poland and Hungary, where
enlargement leads to fall in prices and expansion of production. The detailed results on the trade
implications of this scenario are presented in Appendix D.
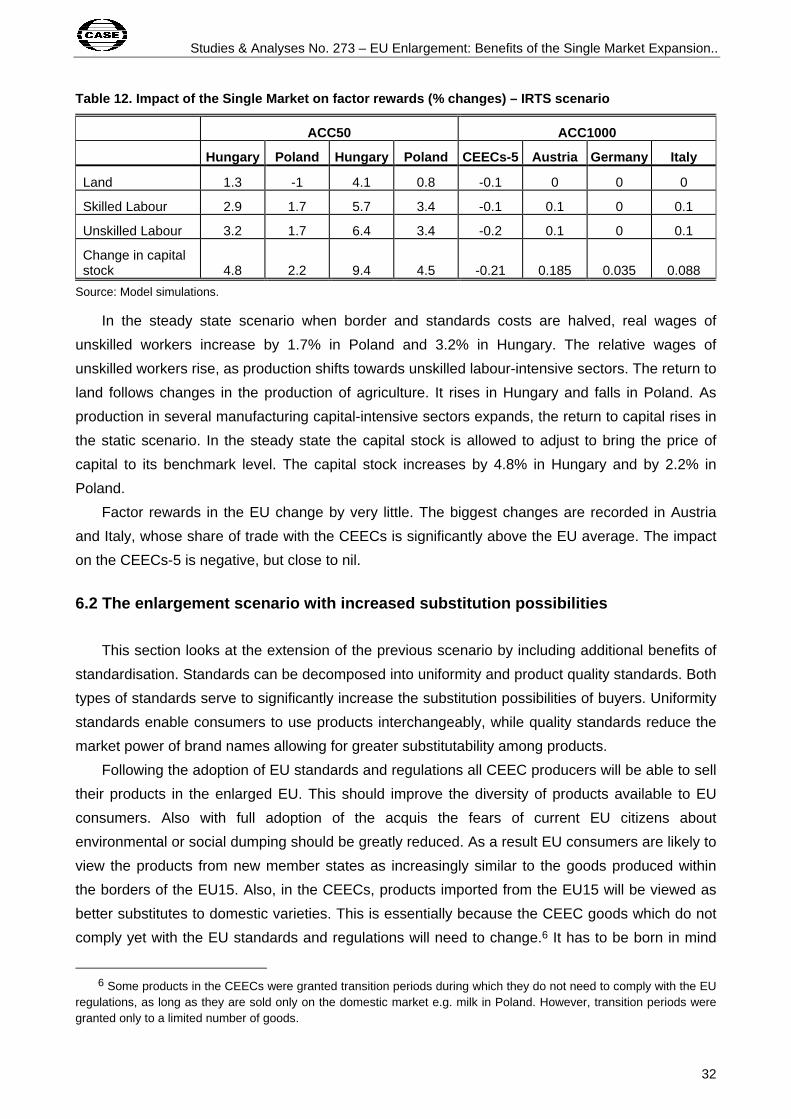
Studies & Analyses No. 273 – EU Enlargement: Benefits of the Single Market Expansion..
32
Table 12. Impact of the Single Market on factor rew ards (% changes) – IRTS scenario
ACC50 ACC1000
Hungary Poland Hungary Poland CEECs-5 Austria Germany Italy
Land 1.3 -1 4.1 0.8 -0.1 0 0 0
Skilled Labour 2.9 1.7 5.7 3.4 -0.1 0.1 0 0.1
Unskilled Labour 3.2 1.7 6.4 3.4 -0.2 0.1 0 0.1
Change in capital stock 4.8 2.2 9.4 4.5 -0.21 0.185 0.035 0.088
Source: Model simulations.
In the steady state scenario when border and standards costs are halved, real wages of
unskilled workers increase by 1.7% in Poland and 3.2% in Hungary. The relative wages of
unskilled workers rise, as production shifts towards unskilled labour-intensive sectors. The return to
land follows changes in the production of agriculture. It rises in Hungary and falls in Poland. As
production in several manufacturing capital-intensive sectors expands, the return to capital rises in
the static scenario. In the steady state the capital stock is allowed to adjust to bring the price of
capital to its benchmark level. The capital stock increases by 4.8% in Hungary and by 2.2% in
Poland.
Factor rewards in the EU change by very little. The biggest changes are recorded in Austria
and Italy, whose share of trade with the CEECs is significantly above the EU average. The impact
on the CEECs-5 is negative, but close to nil.
6.2 The enlargement scenario with increased substit ution possibilities
This section looks at the extension of the previous scenario by including additional benefits of
standardisation. Standards can be decomposed into uniformity and product quality standards. Both
types of standards serve to significantly increase the substitution possibilities of buyers. Uniformity
standards enable consumers to use products interchangeably, while quality standards reduce the
market power of brand names allowing for greater substitutability among products.
Following the adoption of EU standards and regulations all CEEC producers will be able to sell
their products in the enlarged EU. This should improve the diversity of products available to EU
consumers. Also with full adoption of the acquis the fears of current EU citizens about
environmental or social dumping should be greatly reduced. As a result EU consumers are likely to
view the products from new member states as increasingly similar to the goods produced within
the borders of the EU15. Also, in the CEECs, products imported from the EU15 will be viewed as
better substitutes to domestic varieties. This is essentially because the CEEC goods which do not
comply yet with the EU standards and regulations will need to change.6 It has to be born in mind
6 Some products in the CEECs were granted transition periods during which they do not need to comply with the EU
regulations, as long as they are sold only on the domestic market e.g. milk in Poland. However, transition periods were granted only to a limited number of goods.

Studies & Analyses No. 273 – Maryla Maliszewska
33
that this does not necessarily mean that domestic products were seen as worse or better than EU
products before accession. However, their characteristics are likely to become more similar when
Polish and Hungarian products satisfy the same standards and technical requirements as goods
imported from the EU.
Summing up, this scenario assumes that as a result of harmonisation of standards consumers
will be able to substitute more easily between products from old and new member states. In the
base case scenario consumers are assumed to possess weakly separable utility functions, which
allow multiple stage budgeting of their consumption decisions as illustrated in Figure 1. First,
consumers choose between different composite goods based on a Cobb-Douglas utility function.
Then consumers choose between domestic and imported goods within a given composite, based
on a CES sub-utility function. And finally consumers choose between products from different
regions based on a CES sub-utility function. In the scenario modelled in this section consumers
have a different structure of preferences to reflect the fact that products in the enlarged EU
became better substitutes for each other as a result of standardisation. The preference structure is
still very similar to that depicted in Figure 1. The major difference is that domestic variety now
includes not only the varieties produced in a home country, but all other EU products as well. The
elasticities of substitution remain unchanged, but with the inclusion of other EU products in the
domestic composite the elasticity of substitution between domestic and other EU products changes
from 5 (elasticity of substitution between domestic and imported varieties) to 15 (elasticity of
substitution between domestic varieties). I follow the approach of HRT (1994) in modelling the
changes in preferences over a continuum where at the limit all EU consumers view domestic and
imported EU products as equally substitutable.
The two preference structures discussed above present two extreme views of the demand
structure. I choose to model the path towards full recognition of varieties from other EU countries
as home varieties as a weighted average of these two approaches. The assumption that 50% of
the EU market is integrated means that 50% of EU consumers in each EU country perceive no
change in the substitutability of EU varieties, while 50% view EU produced varieties as equally
substitutable with home varieties. A similar approach was adopted by HRT (1994), however the
major difference is that in HRT (1994) the benchmark level of integration is zero, because it
represents the EC before 1992. If indeed the Single Market program led to better substitutability
between EU products as postulated in Appendix C, then at the time of enlargement this change in
preference structures must already be taken into account.
It seems that full integration is unlikely ever to take place, as there will always be some bias
toward domestically produced goods. I assume that the share of standards approved is a good
proxy for the level of integration of EU markets in the sense discussed above. By October 1997 the
number of standards approved in all EU member states amounted to only 32% of the total number
of mandated standards. I expect that further efforts of the EU countries will raise the share of
adopted standards to 50% by the time of enlargement. Therefore I assume that in the benchmark
the initial level of integration is an arbitrary 50%. The change of preferences does not affect the

Studies & Analyses No. 273 – EU Enlargement: Benefits of the Single Market Expansion..
34
benchmark SAMs, but it affects the number of firms and markups in the EU countries. The
markups on domestic markets are higher as compared to the base scenario, while markups on
foreign markets are lower.
The intuition into how integration affects markups can be gained by the examination of the
markup equations derived in Appendix A. The markup for firms from one EU country (r) selling into
another EC country (s) in the segmented market situation is denoted mrsSEG and mrs
INT in a fully
integrated equilibrium. Following equations (44) and (45) in Appendix A the markup under
segmented markets is as follows:
(1) r
rs
DMMsr
rs
MMDMMM
SEGrs N
11
N
111m
θ
σ−+
θθ
σ−
σ+
σ=
and the markup under integrated markets is as follows:
(2)
σ−+
θ−θ
σ−
σ+
σ=
DMEUsr
rs
MMDMMM
INTra
11
)1(N
111m
Then the change in markup following greater integration is equal to:
(3)
σ−
σθ−
σ−
σθθ
+
σ−
σ=−
MMDMMsDDDM
EUsr
rs
MMDD
SEGrs
INTrs
111111
N
11mm
where
σDD – elasticity of substitution between varieties supplied by domestic firms
σMM – elasticity of substitution between products of any two foreign suppliers
σDM – elasticity of substitution between domestic and imported varieties
Nr – number of firms producing in region r
θrs – the market share of region r firms in region s
θsEU – the market share of supply from the EU in region s
θsM – the market share of imports in region s.
When expression (3) is negative the markups will fall relative to the segmented market
equilibrium and ceteris paribus intra-EU trade will expand. Given our assumption about the values
of elasticities (see section 3.3 of Appendix A) the first term in equation (1) is negative (-0.033), but
the sign of the second term is ambiguous. The second term will be positive the smaller is θsEU in
relation to θsM, i.e. the smaller the share of EU firms on the domestic market relative to non-EU
imports. Given the assumptions about the elasticities of substitution the change in markup is as
follows:
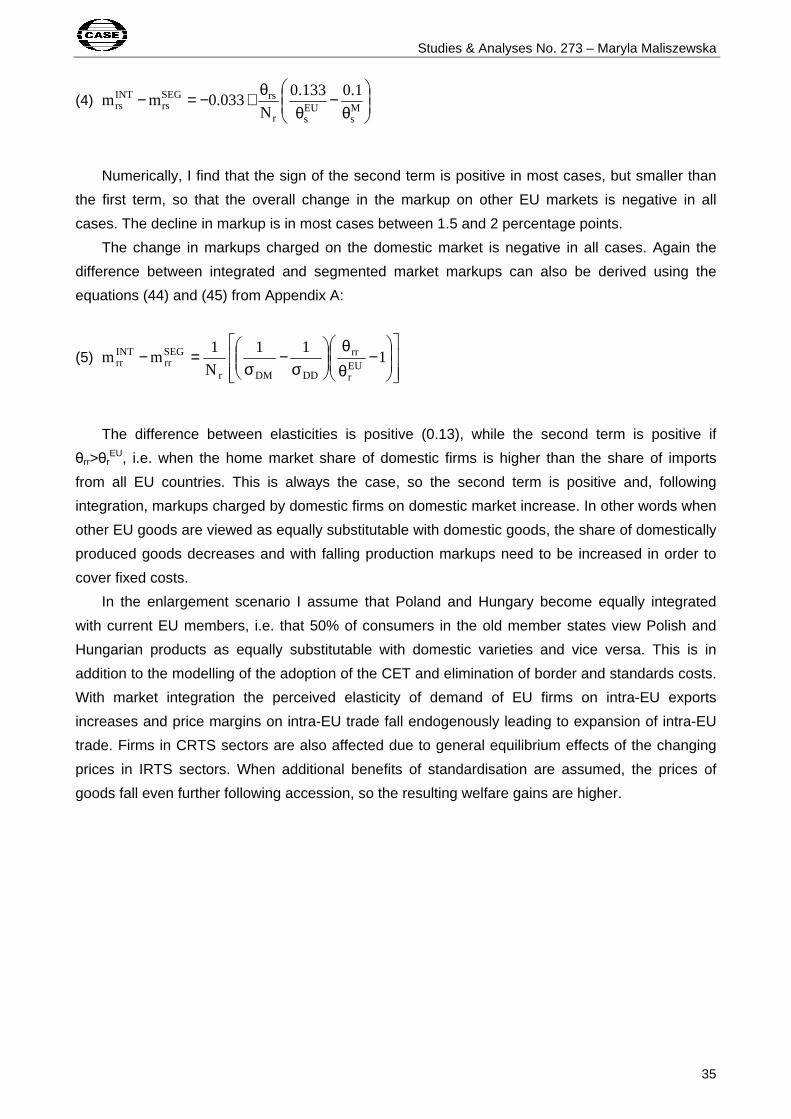
Studies & Analyses No. 273 – Maryla Maliszewska
35
(4)
θ−
θθ+−=−
Ms
EUsr
rsSEGrs
INTrs
1.0133.0
N033.0mm
Numerically, I find that the sign of the second term is positive in most cases, but smaller than
the first term, so that the overall change in the markup on other EU markets is negative in all
cases. The decline in markup is in most cases between 1.5 and 2 percentage points.
The change in markups charged on the domestic market is negative in all cases. Again the
difference between integrated and segmented market markups can also be derived using the
equations (44) and (45) from Appendix A:
(5)
−θθ
σ−
σ=− 1
11
N
1mm
EUr
rr
DDDMr
SEGrr
INTrr
The difference between elasticities is positive (0.13), while the second term is positive if
θrr>θrEU, i.e. when the home market share of domestic firms is higher than the share of imports
from all EU countries. This is always the case, so the second term is positive and, following
integration, markups charged by domestic firms on domestic market increase. In other words when
other EU goods are viewed as equally substitutable with domestic goods, the share of domestically
produced goods decreases and with falling production markups need to be increased in order to
cover fixed costs.
In the enlargement scenario I assume that Poland and Hungary become equally integrated
with current EU members, i.e. that 50% of consumers in the old member states view Polish and
Hungarian products as equally substitutable with domestic varieties and vice versa. This is in
addition to the modelling of the adoption of the CET and elimination of border and standards costs.
With market integration the perceived elasticity of demand of EU firms on intra-EU exports
increases and price margins on intra-EU trade fall endogenously leading to expansion of intra-EU
trade. Firms in CRTS sectors are also affected due to general equilibrium effects of the changing
prices in IRTS sectors. When additional benefits of standardisation are assumed, the prices of
goods fall even further following accession, so the resulting welfare gains are higher.
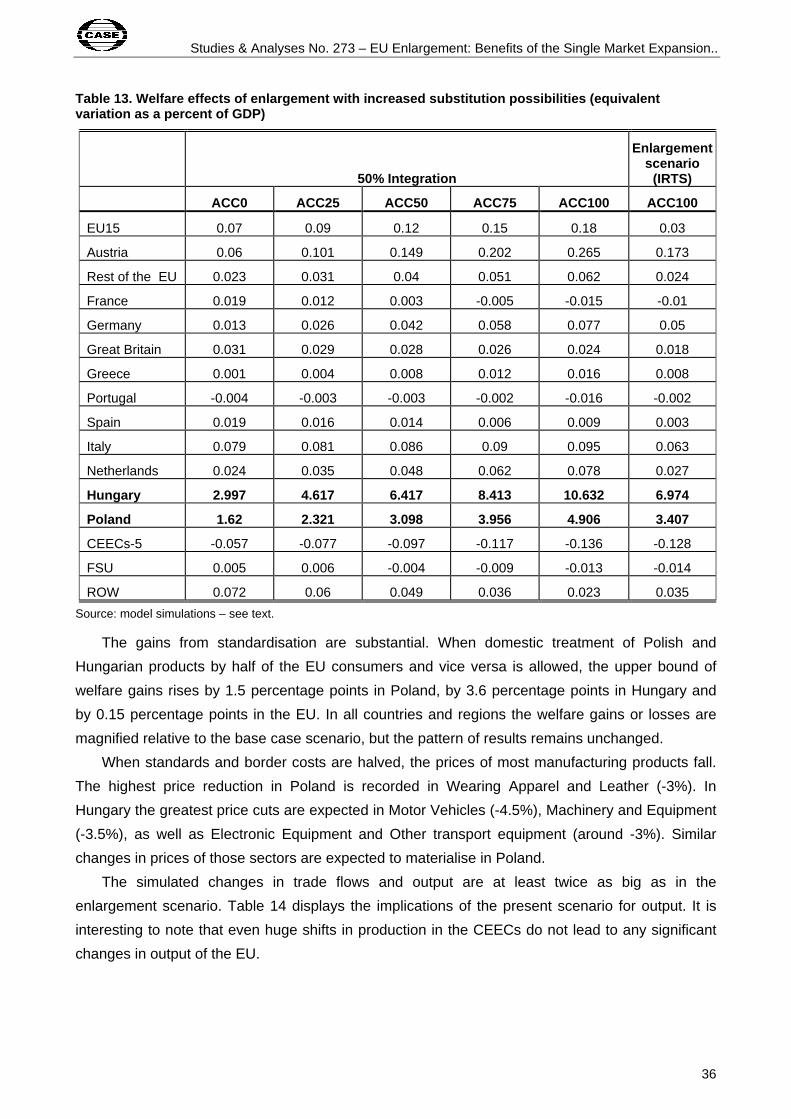
Studies & Analyses No. 273 – EU Enlargement: Benefits of the Single Market Expansion..
36
Table 13. Welfare effects of enlargement with incre ased substitution possibilities (equivalent variation as a percent of GDP)
50% Integration
Enlargement scenario
(IRTS)
ACC0 ACC25 ACC50 ACC75 ACC100 ACC100
EU15 0.07 0.09 0.12 0.15 0.18 0.03
Austria 0.06 0.101 0.149 0.202 0.265 0.173
Rest of the EU 0.023 0.031 0.04 0.051 0.062 0.024
France 0.019 0.012 0.003 -0.005 -0.015 -0.01
Germany 0.013 0.026 0.042 0.058 0.077 0.05
Great Britain 0.031 0.029 0.028 0.026 0.024 0.018
Greece 0.001 0.004 0.008 0.012 0.016 0.008
Portugal -0.004 -0.003 -0.003 -0.002 -0.016 -0.002
Spain 0.019 0.016 0.014 0.006 0.009 0.003
Italy 0.079 0.081 0.086 0.09 0.095 0.063
Netherlands 0.024 0.035 0.048 0.062 0.078 0.027
Hungary 2.997 4.617 6.417 8.413 10.632 6.974
Poland 1.62 2.321 3.098 3.956 4.906 3.407
CEECs-5 -0.057 -0.077 -0.097 -0.117 -0.136 -0.128
FSU 0.005 0.006 -0.004 -0.009 -0.013 -0.014
ROW 0.072 0.06 0.049 0.036 0.023 0.035
Source: model simulations – see text.
The gains from standardisation are substantial. When domestic treatment of Polish and
Hungarian products by half of the EU consumers and vice versa is allowed, the upper bound of
welfare gains rises by 1.5 percentage points in Poland, by 3.6 percentage points in Hungary and
by 0.15 percentage points in the EU. In all countries and regions the welfare gains or losses are
magnified relative to the base case scenario, but the pattern of results remains unchanged.
When standards and border costs are halved, the prices of most manufacturing products fall.
The highest price reduction in Poland is recorded in Wearing Apparel and Leather (-3%). In
Hungary the greatest price cuts are expected in Motor Vehicles (-4.5%), Machinery and Equipment
(-3.5%), as well as Electronic Equipment and Other transport equipment (around -3%). Similar
changes in prices of those sectors are expected to materialise in Poland.
The simulated changes in trade flows and output are at least twice as big as in the
enlargement scenario. Table 14 displays the implications of the present scenario for output. It is
interesting to note that even huge shifts in production in the CEECs do not lead to any significant
changes in output of the EU.

Studies & Analyses No. 273 – Maryla Maliszewska
37
Table 14. Output changes in enlargement scenario wi th increased substitution possibilities (IRTS scenario)
ACC50 ACC100
Hungary Poland Hungary Poland Austria France Germany Portugal
Agriculture -0.6 -1.5 -1.1 -1.9 0 0.1 0.1 0.1
Raw materials -2 -0.1 -3.3 -0.3 -0.2 0.7 0.2 1.2
Food 5.5 0.2 7.6 0.5 -0.3 -0.2 0.1 0
Textiles -4.2 4.6 -5 8 0.9 0.2 0.6 -0.1
Clothing -6.3 8.5 -8.1 16.4 1.3 -0.2 -0.8 -0.3
Leather -6.8 -1 -7.9 0.2 0 0.1 -0.1 0.2
Wood -0.8 5.2 -0.6 9.9 -0.4 -0.1 -0.4 0
Paper -3.1 -3.2 -4.3 -5 0.9 0.1 0.5 0.1
Petroleum 3.8 -3.7 6.2 -4.7 -0.5 0.1 0.2 0
Chemicals -3.5 -4.1 -4.9 -5.9 1.2 0.2 0.6 0
Non-metallic Min. -1 -1.1 -3.1 -2.4 0.5 0.2 0.3 0.3
Iron, steel 11.3 4.9 17.3 6.1 0.2 -0.2 0.2 -0.4
Other metals 17.6 13.7 27.8 18 1.4 -0.7 -0.1 -0.5
Metal products 6.2 4 8.8 5.7 0.6 -0.3 -0.2 0.5
Motor vehicles 68.4 28.1 117.4 47.9 -0.8 -0.8 -0.6 -1.5
Other transport 27.8 6.4 47.2 11.2 2.2 0.1 0.5 0.1
Electronics 46.4 11.9 88.6 24.3 1.8 -0.6 -0.5 -0.4
Machinery n.e.c. 26.1 4.2 46.8 7.9 0.6 -0.2 0.1 -0.1
Manufacturing n.e.c. -3.1 -0.3 -5.2 -0.1 0.1 0.2 0.2 0
Utilities 3.2 2 5.1 3.2 0.2 0 0.1 0
Construction 7.5 3.4 12.1 5.4 0.2 0 0.1 0
Trade 5.4 2.8 9.1 4.5 0.2 0 0 0
Transport 4.2 4.8 5 5.5 -0.2 0 0.1 0
Financial services 3.7 1.3 6 2 0.1 0 0.1 0.1
Public administration 4 1.1 6.7 1.9 0.2 0 0.1 0
Source: Model simulations.
When we allow for greater substitution between domestic and imported goods, the expansion
of capital stock is much higher than in the enlargement scenario. In case of full abolition of border
and standards costs it amounts to 14.6% in Hungary and 6.1% in Poland. The wages of unskilled
workers improve in real terms by 9.3% in Hungary and 4.7% in Poland. Changes in wages of other
countries are negative in some cases, but negligible. This is to be expected, as the impact of
enlargement on output of the EU is very small.

Studies & Analyses No. 273 – EU Enlargement: Benefits of the Single Market Expansion..
38
7. Sensitivity analysis
This section is dedicated to the sensitivity analysis of the main results of the model - i.e. the
welfare implications of enlargement in the steady state (base case) scenario. I look at the
implications of two variations in the parameters of the model, a change in the nature of competition
in IRTS sectors and two changes in the assumptions about the costs of harmonisation of
standards. The first scenario looks at the adoption of the CET and Single Market access using the
middle value for estimated cost disadvantage ratio (CDR - see section 3.5 of Appendix A). In the
next scenario the assumed values for the elasticities of substitution are halved. The third simulation
changes the nature of competition to firm-level competition as depicted in Figure 2. The final two
scenarios assume that in order to comply with EU standards and regulations producers in Poland
and Hungary are forced to make additional investments equivalent to 0.5% (scenario 4) and 1%
(scenario 5) of value added.
In case of the first three scenarios I re-calibrate the benchmark equilibrium to the new
parameters, as well as using them in the counterfactual simulations. This means that the Hicksian
equivalent variation measure of welfare is well defined, as the new structure of demand reproduces
the initial benchmark equilibrium without any changes. Given prices, income and quantity choices
the initial data point can be calibrated as an optimum for any value of the elasticity of substitution.
The changes of elasticities in sensitivity analysis alter the curvature of the utility function in
benchmark equilibrium and affect the results of counterfactual scenarios, but they do not change
the initial optimum point of consumption.
The first scenario assumes much greater unrealised economies of scale. The differences are
significant, as for example the assumed CDRs increase from 8 to 14 in the Other Transportation
Equipment or from 5 to 9 in Non-Metallic Minerals as compared to the base case scenario. With
higher unrealised economies of scale the calibrated number of firms is much smaller and markups
charged by them are higher. The liberalisation of trade leads to a stronger increase in competition
and more significant fall in prices than in the base case scenario, as the slope of average cost
curve is steeper in the medium CDR scenario. The greater the absolute value of a decline in the
markup the larger will be the welfare benefits from rationalisation and consumption efficiency. The
results of the experiment with medium values of CDR are presented in column 2 of Table 15.
Indeed, all regions record much higher welfare gains as compared to the base case scenario. The
additional gain for the EU amounts to 0.4 percentage points and to 0.8 and 0.4 percentage points
in case of Hungary and Poland respectively. Countries with high shares of trade with Poland and
Hungary such as Italy, Germany, Netherlands and France gain between 0.4-0.6% of GDP. In this
scenario some EU countries gain more than Poland. This is mainly a feature of modelling, as we
assume that further harmonisation of law between the current EU member states leads to
reduction of border and standard costs in trade between themselves. The impact of lowering of
trade costs within EU15 has greater impact on prices and welfare under the assumption of medium
CDR than in the base case scenario.

Studies & Analyses No. 273 – Maryla Maliszewska
39
In the second scenario the elasticities of substitution are scaled down by 50%, so that the
elasticity of substitution between domestic varieties is equal to 7.5, between imported varieties to 5
and between domestic and imported goods to 2.5. With lower values of elasticities, the benchmark
markups are almost twice as high as in the base case scenario and changes in prices following
enlargement are smaller. This is also the case of changes in output, which in case of greater
product differentiation tend to be lower. Smaller changes in prices and output are associated with
lower welfare gains, as indicated in column 3 of Table 15. The welfare gains for Hungary and for
Poland are 2.1 and 0.6 percentage points lower than in the base case. Although the elasticities of
substitution are crucial for the results, I cannot base the modelling effort on estimates of those
elasticities for Europe or the CEECs, as to my best knowledge there are no estimates based on the
demand structure used in this model. It is important to note that the results of HRT (1994) were
very close to the results of other studies using very dissimilar methodologies to evaluate the impact
of Europe 1992 (see HRT, 1994, p. 33-39). This in my view supports their choice of methodology
and assumptions about the crucial parameters. Using the assumptions about the elasticities of
substitution employed by HRT (1994) allows also for comparisons between the impact of
accession to the Single Market by Poland and Hungary to the impact of the creation of the Single
Market in 1992.
The third scenario looks at the implications of firm-level competition, which is independent of
country of origin. This amounts to choosing the same value for the elasticity of substitution
between varieties supplied by domestic firms (σDD), the elasticity of substitution between products
of any two foreign suppliers (σMM) and the elasticity of substitution between domestic and imported
varieties (σDM). In this scenario the value chosen is equal to the elasticity of substitution between
varieties supplied by domestic firms from the base case, i.e. 15. This scenario is similar to the
market integration scenario, except that now products of all (not only EU) firms are viewed as
equally substitutable with domestic varieties. In a new benchmark domestic firms charge higher
markups on the domestic market. At the same time there is an increase in the perceived elasticity
of demand on the home market. Therefore foreign markets induce domestic firms to charge lower
markups. Fiercer competition results in bigger changes in prices and output following enlargement
and greater welfare gains. Hungary gains an additional 1 percentage point, while welfare gains for
Poland amount to only 0.12%.
Table 15. Welfare effects of enlargement under vari ous assumptions – AC100, IRTS steady state scenarios (equivalent variation as a percent of GDP )
Costs of standards for domestic market
Base case (irts) Medium cdr
Lower elasticties of substitution
Firm level competition 0.5% 1%
(1) (2) (3) (4) (5) (6)
EU15 0.03 0.41 0.04 0.06 0.03 0.03
Austria 0.173 0.233 0.164 0.219 0.171 0.167
Rest of the EU 0.024 0.324 0.031 0.063 0.024 0.023

Studies & Analyses No. 273 – EU Enlargement: Benefits of the Single Market Expansion..
40
France -0.01 0.484 0.012 0.023 -0.009 -0.011
Germany 0.05 0.42 0.06 0.064 0.05 0.048
Great Britain 0.018 0.269 0.026 0.038 0.018 0.016
Greece 0.008 0.172 0.008 0.022 0.008 0.008
Portugal -0.002 0.165 0.001 -0.003 -0.003 -0.003
Spain 0.003 0.381 0.018 0.032 0.003 0.003
Italy 0.063 0.607 0.073 0.105 0.062 0.06
Netherlands 0.027 0.445 0.04 0.078 0.027 0.018
Hungary 6.974 7.778 4.863 8.059 6.292 5.629
Poland 3.407 3.791 2.763 3.527 2.549 1.714
CEECs-5 -0.128 0.142 -0.088 -0.076 -0.127 -0.126
FSU -0.014 0.242 0.007 0.002 -0.017 -0.02
ROW 0.035 0.358 0.043 0.052 0.035 0.033
Source: model simulations – see text.
Further I look at two more experiments. In the earlier modelling of the Single Market access I
assume that as soon as products certified for use in Poland and Hungary will be accepted for sale
in the EU the costs of testing and certification of goods for exports to the EU will fall. However,
there is a possibility that more stringent than local regulations will impose additional costs on
production for the domestic markets of the CEECs. The standard costs for the EU countries before
completion of the Single Market oscillated between 0 and 2%. The estimated costs of compliance
with EU regulations in Poland amounted to 0.5%-2% of annual sales (IKCHZ, 2002).7 Therefore I
look at two scenarios where the additional value added in production for the domestic market
amounts to 0.5% and 1% of the initial value added. As expected the welfare implications of
additional costs of production for the domestic market are negative and significant. In the case of
the 1% increase in value added (column 6 of Table 15) the welfare gain of Poland is almost halved,
while Hungary loses 1.3 percentage points relative to the base case. Since all of the firms
exporting to the EU and firms with relatively new production technologies already comply with EU
standards and regulations, it seems that the likely impact on the rise of costs of production for the
domestic market will be in the rage of 0-0.5%. It therefore should not have a big impact on the
welfare implications of enlargement.
Overall the level of unrealised economies of scale or the nature of competition do not affect the
welfare implications of enlargement very much. However, one has to bear in mind that the
parameters employed in the modelling work such that the elasticities of substitution in demand are
important determinants of the results. This points to the need for more research on the specific
demand functions and their parameters in the CEECs.
7 Unfortunately, this study covers only a very small sample of firms (25 of them provided the costs of compliance), so
it cannot be used to formulate sector specific assumptions regarding the cost of compliance with EU regulations.
Studies & Analyses No. 273 – Maryla Maliszewska
41
8. Discussion of the results
The results of this paper are not directly comparable to studies by Brown et al. (1995) and
Baldwin, Francois and Portes (BFP 1995) and Francois (1998), as all of these studies include the
Europe Agreements as part of the enlargement scenario. In addition, these studies had the 1992
database as the benchmark, when trade barriers between Poland and the EU were very high. This
significantly increases the gains from accession. I cite the results of those studies only as a
reference.
The impact of Single Market access can be compared to the Brown et al. (1995) scenario D,
where all tariff barriers and non-tariff barriers to trade in industrial goods are removed. The authors’
estimates indicate that the gains for Poland and Hungary amount to about 5.6 and 6.8% of GDP.
BFP (1997) and Francois (1998) study the impact of the customs union, adoption of the CET
and across-the-board reduction of transaction costs of trade by 10%. According to their results the
CEECs gain 1% of GDP due to static efficiency effect and an additional 11.5% due to pro-
competitive effect in IRTS sectors. The impact on the EU is very small as the sum of these two
effects amounts to 0.2% of benchmark GDP.
In the “less conservative” scenario BFP (1997) and Francois (1998) assume that in the long-
run the investment risk in the CEECs falls to the level of the investment risk of Portugal as a result
of the EU membership. This is equivalent to a drop in the relative return on investment in this
region of 15%. Reduced investment risk induces greater investment in the region. The
accumulation effect constitutes an additional source of welfare gain, which is quite substantial for
the CEECs. It amounts to almost 20% of the benchmark GDP. This relatively high number is due to
a predicted increase of capital stock in the CEECs of 68%. I conducted a similar experiment by
looking at the implications of a 15% increase in the rate of return to capital in Poland and Hungary
in addition to the adoption of the CET and complete abolition of standards and border costs. The
results are of similar order of magnitude as those obtained by BFP (1997). The welfare in CEECs-7
increases by 18.8%, while in my model Polish welfare increases by 19.4% and Hungarian by
32.6%. This is associated with an increase of the capital stock of 47.5% in Poland and 68.5% in
Hungary, compared to 68% estimated by BFP (1997) for the CEECs-7. This exercise serves as a
robustness test for my model. It is reassuring that although BFP (1997) include the impact of EAs
and use different model and earlier benchmark data, the orders of magnitude of results are similar.
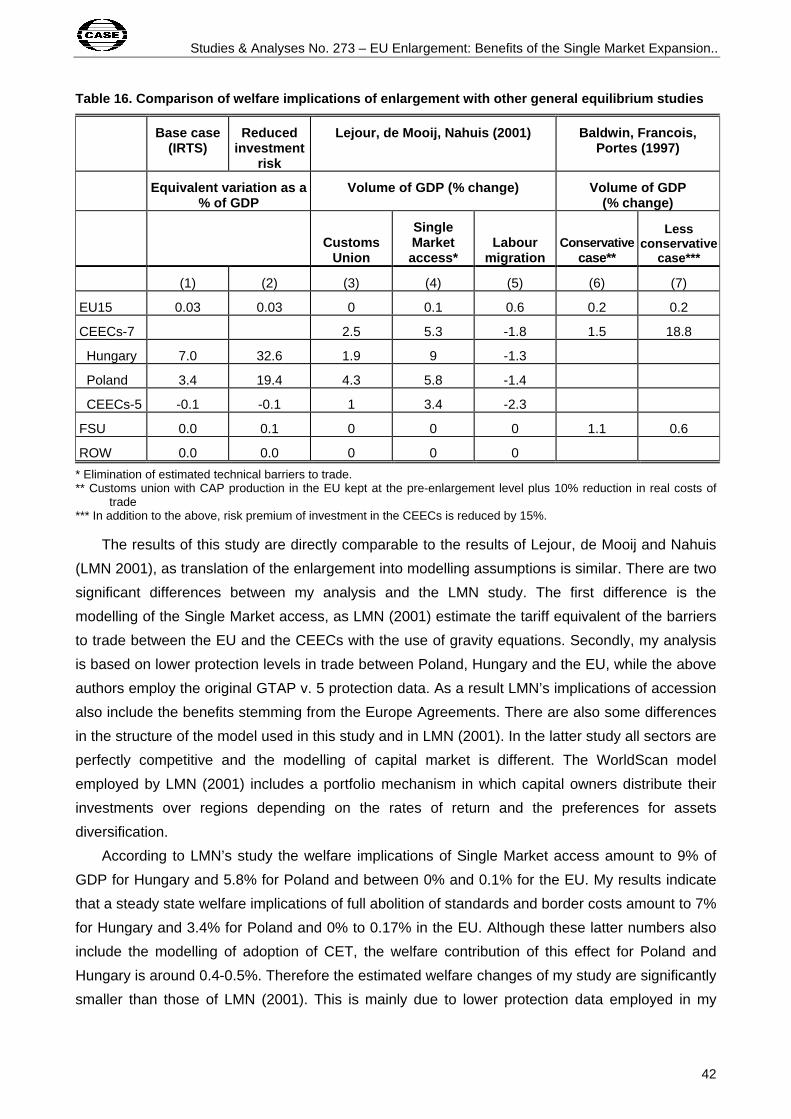
Studies & Analyses No. 273 – EU Enlargement: Benefits of the Single Market Expansion..
42
Table 16. Comparison of welfare implications of enl argement with other general equilibrium studies
Base case (IRTS)
Reduced investment
risk
Lejour, de Mooij, Nahuis (2001) Baldwin, Francois, Portes (1997)
Equivalent variation as a % of GDP
Volume of GDP (% change) Volume of GDP (% change)
Customs
Union
Single Market access*
Labour migration
Conservative case**
Less conservative
case***
(1) (2) (3) (4) (5) (6) (7)
EU15 0.03 0.03 0 0.1 0.6 0.2 0.2
CEECs-7 2.5 5.3 -1.8 1.5 18.8
Hungary 7.0 32.6 1.9 9 -1.3
Poland 3.4 19.4 4.3 5.8 -1.4
CEECs-5 -0.1 -0.1 1 3.4 -2.3
FSU 0.0 0.1 0 0 0 1.1 0.6
ROW 0.0 0.0 0 0 0
* Elimination of estimated technical barriers to trade. ** Customs union with CAP production in the EU kept at the pre-enlargement level plus 10% reduction in real costs of
trade *** In addition to the above, risk premium of investment in the CEECs is reduced by 15%.
The results of this study are directly comparable to the results of Lejour, de Mooij and Nahuis
(LMN 2001), as translation of the enlargement into modelling assumptions is similar. There are two
significant differences between my analysis and the LMN study. The first difference is the
modelling of the Single Market access, as LMN (2001) estimate the tariff equivalent of the barriers
to trade between the EU and the CEECs with the use of gravity equations. Secondly, my analysis
is based on lower protection levels in trade between Poland, Hungary and the EU, while the above
authors employ the original GTAP v. 5 protection data. As a result LMN’s implications of accession
also include the benefits stemming from the Europe Agreements. There are also some differences
in the structure of the model used in this study and in LMN (2001). In the latter study all sectors are
perfectly competitive and the modelling of capital market is different. The WorldScan model
employed by LMN (2001) includes a portfolio mechanism in which capital owners distribute their
investments over regions depending on the rates of return and the preferences for assets
diversification.
According to LMN’s study the welfare implications of Single Market access amount to 9% of
GDP for Hungary and 5.8% for Poland and between 0% and 0.1% for the EU. My results indicate
that a steady state welfare implications of full abolition of standards and border costs amount to 7%
for Hungary and 3.4% for Poland and 0% to 0.17% in the EU. Although these latter numbers also
include the modelling of adoption of CET, the welfare contribution of this effect for Poland and
Hungary is around 0.4-0.5%. Therefore the estimated welfare changes of my study are significantly
smaller than those of LMN (2001). This is mainly due to lower protection data employed in my

Studies & Analyses No. 273 – Maryla Maliszewska
43
study. The simulations not reported here show that my results become very close to LMN’s results
when I use the original GTAP protection levels. Therefore mainly the data and not the methodology
are responsible for the differences in results between those two studies.
The sectoral effects of Single Market access of LMN (2001) also display a similar pattern to the
results of this study. However, again the estimated changes in output are smaller according to my
estimates. The direction of changes in output is consistent between those two studies, with only
few exceptions. LMN also expect large increases of output in Transport Equipment and Electronic
Equipment, Textiles, Leather, Machinery Equipment in Hungary and Poland. The results for other
regions also display a high degree of similarity. The fact that sectoral results are similar despite
significant differences in construction of the modelling exercise is very reassuring. It suggests that
different ways of capturing Single Market access show a consistent picture of possible significant
welfare gains for the acceding countries and modest welfare gains or negligible losses of welfare in
the EU. The exact estimates of the welfare gains are very sensitive to the benchmark protection
levels and I believe that the tariff data employed in my study constitute a better representation of
the protection at the time of accession.
9. Conclusions
This paper looks at the implications of Eastern EU enlargement with the focus on Single
Market access. It differs from previous studies in several respects. Firstly, I create a benchmark set
of social accounting matrices at the time of accession by incorporating the provisions of the
preferential trade agreements between Poland, Hungary and the EU and the UR commitments.
Therefore, I am able to avoid the inclusion of Europe Agreements as part of the accession
scenario. Secondly, the Single Market access is modelled explicitly. The modelling assumptions
regarding the reduction of costs of crossing the border and compliance with foreign regulations and
standards are based on the literature on the completion of the Single Market in Europe. Finally, the
paper includes a thorough sensitivity analysis regarding the main parameters of the model and
modelling assumptions.
The results of this study suggest that Eastern EU enlargement will be beneficial to the new
members, while most EU countries will record minor welfare gains. Poland is expected to gain
3.4% of GDP, while Hungary almost 7%. The new members will experience production increases
across almost all sectors, while the impact on EU production in some sectors is negative, but very
small. In Poland and Hungary real wages rise, with wages of unskilled workers increasing at a
faster pace than wages of skilled workers. The welfare implications of accession are smaller than
compared to other studies on this subject. Lejour, de Mooij and Nahuis (2001) find that the gains
from the Single Market are equivalent to 9% of GDP in Hungary and 5.8% in Poland. Despite
significant differences in methodology, the main reason for divergence of the results is that LMN
(2001) employ higher trade protection data, which does not incorporate provisions of the Europe
Agreements and other trade policy changes.

Studies & Analyses No. 273 – EU Enlargement: Benefits of the Single Market Expansion..
44
This study focuses on the impact of trade liberalisation and reduction of technical barriers to
trade. A complete analysis of the impact of enlargement on existing and prospective members
should clearly also include the implications of accession to the CAP and transfers from the EU
budget such as Structural Funds.
References
AMAD, Agricultural Market Access Database (www.amad.org).
Baldwin, R.E., J. F. Francois, R. Portes (1997). The Cost and Benefits of Eastern Enlargement:
The Impact on the EU and Central Europe, Economic Policy, April 1997, str.125-176.
Brenton, P., J. Sheehy and M. Vancauteren (2001). Technical Barriers to Trade in the European
Union: Importance for Accession Countries, Journal of Common Market Studies, June 2001,
Vo. 29(2), pp. 265-84.
Brown D.K., Deardorff A.V., Djankov S.D., Stern R.M. (1995). An Economic Assessment of the
Integration of Czechoslovakia, Hungary, and Poland into the European Union, Research
Seminar in International Economics, Discussion Paper no. 380, University of Michigan.
Cawley, R. and M. Davenport (1988). Partial Equilibrium Calculations of the Impact of Internal
Market Barriers in the European Community, [in:] Research on the „Cost of Non-Europe” basic
findings, Vol. 2., Brussels, European Commission.
CEN (1997). Standards and Technical Regulations 83/189, Brussels: Consultative Committee.
CENELEC (1997). Standards and Technical Regulations 83/189, Brussels: Consultative
Committee.
Dimaranan, B.V. (2002). Construction of the Protection Data Base, chapter 16A in Dimaranan and
McDougall (2002).
Dimaranan, B.V. and R. A. McDougall (2002). Global Trade, Assistance, and Production: The
GTAP 5 Data Base, Center for Global Trade Analysis, Purdue University.
(http://www.gtap.agecon.purdue.edu/databases/v5/v5_doco.asp)
ETSI (1997). Standards and Technical Regulations 83/189, Brussels: Consultative Committee.
European Commission (1988). The Completion of the Internal Market: a Survey of European
Industry’s Perception of the Likely Effects, Brussels: European Commission.
European Commission (1997a). Single Market and Tomorrow’s Europe, Brussels: European
Commission.
European Commission (1997b.) Results of the Business Survey, Brussels: European
Commission.
European Commission (1997c). Technical Barriers to Trade, Brussels: European Commission.
European Commission (1997d.) Customs and Fiscal Formalities at Frontiers, Brussels: European
Commission.
European Commission (1997e). Report Concerning the Implementation of the Internal Market
Directives, Brussels: European Commission.

Studies & Analyses No. 273 – Maryla Maliszewska
45
European Commission (2001a). Regular Report on Poland’s Progress Towards Accession,
Brussels: European Commission.
European Commission (2001b). Regular Report on Hungary’s Progress Towards Accession,,
Brussels: European Commission.
Finger, J.M., M.D.Ingco, U.Reincke (1996). The Uruguay Round: Statistics on Tariff Concessions
Given and Received, The World Bank, Washington D.C.
Forslid, R., J.I. Haaland, K.H.M. Knarvik and O. Mæstad (1999). Integration and Transition:
Scenarios for Location of Production and Trade in Europe, Paper prepared for the Second
Annual Conference on Global Economic Analysis, Denmark, 20-22 June, 1999.
Francois, J.F. (1998). Scale Economies, Imperfect Competition and the Eastern Expansion of the
EU, May 1998, mimeo.
Gasiorek, M., Smith, A., Venables, A.(1994). Modelling the effect of Central and East European
trade on the European Community, European Economy, No.6, pp.521-538.
Harrison, G., T. Rutherford and D. Tarr,(1994). Product Standards, Imperfect Competition, and
Completion of the Market in the European Union, Policy Research Working Paper, 1293, The
World Bank.
Harrison, G., F.Rutherford, D.G.Tarr (1995). Quantifying the Outcome of the Uruguay Round,,
Finance & Development, 32(4), December 1995, 38-41.
Harrison, G., T. Rutherford. and D. Tarr (1996a). Increased Competition and Completion of the
Market in the European Union, Journal of Economic Integration, 11(3), pp. 332-365.
Harrison, G., F.Rutherford, D.G.Tarr (1996b). Quantifying the Uruguay Round, in W. Martin and
L.A. Winters (eds.), The Uruguay Round and Developing Economies, New York: Cambridge
University Press.
Harrison, G., F.Rutherford, D.G.Tarr (1996). Increased Competition and Completion of the Market
in the European union, Journal of Economic Integration, 11(3), September 1996, 332-365.
Hoffmann, A.N. (2000). The Gains from Partial Completion of the Single Market,
Weltwirtschaftliches Archiv, 2000 no.4.
IKCHZ (2002). The accession of Poland to the Single Market – Benefits and Costs for selected
groups and sectors (in Polish), December 2002, mimeo.
Lejour, A.M, R.A. de Mooj and R. Nahuis, 2001, EU Enlargement: economic implications for
countries and industries, CESifo Working Paper No. 585, October 2001, CESifo, Munich:
Germany.
Maliszewska M., M.A.M. Smith and J.J. Michalek (1999). EU Accession and Poland’s external
trade policy, Economic Discussion Papers No. 45, Faculty of Economic Sciences, Warsaw
University, Warsaw.
Messerlin P.A. (2001). Measuring the Costs of Protection in Europe: European Commercial Policy
in the 2000s, Institute for International Economics, Washington DC, September 2001.

Studies & Analyses No. 273 – EU Enlargement: Benefits of the Single Market Expansion..
46
Pouliquen A. (2001). Competitiveness and Farm Incomes in the CEEC Agri-Food Sectors:
Implications Before and After Accession for EU Markets and Policies, Report for the European
Commission, October 2001.
Pratten, C. (1988) A Survey of the Economics of Scale. Research on the „Cost of Non-Europe
basic findings Vol. 2., Brussels: The EU Commission.
Preston, C. and A. Michonski (1999). Negotiating regulatory alignment in Central Europe: the case
of Poland EU European Conformity Assessment Agreement, SEI Working Paper 31, March
1999, Sussex European Institute.
Rollo, J. and A. Smith (1993). EC Trade with Eastern Europe, Economic Policy, 16, April 1993, pp.
140-181.
Rutherford, T. (2002). Gtap5inGams package, http://debreu.colorado.edu/gtap5/.
Smith, M.A.M, P. Holmes, U. Sedelmeier, E. Smith, A. Young, H. Wallence (1995). The European
Union and Central and Eastern Europe: Pre-Accession Strategies, Sussex European Institute
Working Paper, No.15.
TRAINS, Trade Analysis and Information System database, UNCTAD.
Winters, A. (1994). The Liberalisation of European Steel Trade, CEPR Discussion Paper, No. 1002
Winters, A. and Z. Wang (1994). Eastern Europe’s International Trade, Manchester University
Press.
World Trade Organisation (1998a). Trade Policy Review: European Union 1997, Geneva: World
Trade Organisation, March 1998.
World Trade Organisation (1998b). Trade Policy Review: Hungary 1998, Geneva: World Trade
Organisation, December 1998.
World Trade Organisation (2000a). Trade Policy Review: Poland 2000, Geneva: World Trade
Organisation, October 2000.
World Trade Organisation (2000b). Trade Policy Review: European Union 2000, Geneva: World
Trade Organisation, November 2000.