case studies on kenya, ghana, uganda and tanzaniaunctad.org/en/docs/iteipcmisc13_en.pdfcase studies...
TRANSCRIPT
AFRICA'S TECHNOLOGY GAP
Case Studies on
Kenya, Ghana, Uganda and Tanzania
July 2003
ii
Note
UNCTAD serves as the focal point within the United Nations Secretariat for all matters related to foreign direct investment and transnational corporations. In the past, the Programme on Transnational Corporations was carried out by the United Nations Centre on Transnational Corporations (1975-1992). UNCTAD’s work is carried out through intergovernmental deliberations, research and analysis, technical assistance activities, seminars, workshops and conferences.
The term "country" as used in this study also refers, as appropriate, to territories
or areas; the designations employed and the presentation of the material do not imply the expression of any opinion whatsoever on the part of the Secretariat of the United Nations concerning the legal status of any country, territory, city or area or of its authorities, or concerning the delimitation of its frontiers or boundaries. In addition, the designations of country groups are intended solely for statistical or analytical convenience and do not necessarily express a judgement about the stage of development reached by a particular country or area in the development process.
The following symbols have been used in the tables:
• Two dots (..) indicate that data are not available or are not separately reported. Rows in tables have been omitted in those cases where no data are available for any of the elements in the row; • A dash (-) indicates that the item is equal to zero or its value is negligible; • A blank in a table indicates that the item is not applicable; • A slash (/) between dates representing years, e.g. 1994/95, indicates a financial year; • Use of a hyphen (-) between dates representing years, e.g. 1994-1995, signifies the full period involved, including the beginning and end years.
Reference to "dollars" ($) means United States dollars, unless otherwise indicated. Annual rates of growth or change, unless otherwise stated, refer to annual compound rates. Details and percentages in tables do not necessarily add to totals because of rounding. The material contained in this study may be freely quoted with appropriate acknowledgement.
UNCTAD/ITE/IPC/Misc.13
UNITED NATIONS PUBLICATIONS
Copyright © United Nations, 2003
All right reserved
iii
PREFACE
The ability to create, acquire and adapt new technologies is a critical requirement for competing successfully in the global marketplace. Various international forums and agreements on technology access and technological capacity building have recognized the importance of the transfer of technology, especially to developing countries. It is also a well-documented fact that the African continent has not kept pace with technological advancement. Africa's technological gap could be the source of its increasing economic deterioration because other developing regions are constantly upgrading their own technological capabilities, and the global marketplace has become increasingly liberalized and competitive.
This report has been prepared in close cooperation with the Governments of the study countries. It offers decision makers in developing countries in general, and in the case study countries in particular, an assessment of existing conditions governing the transfer of technology and the requirements for upgrading technological capacity. Drawing on lessons from East and South-East Asian countries, the report aims to accelerate Africa's technological advancement by identifying weaknesses in the individual countries’ technology frameworks, including at the policy level and in institutional set-up. It also recommends ways to address these shortcomings and options for upgrading technological capacities.
This study was prepared by Sanjaya Lall and Carlo Pietrobello, with the
assistance of Joseph Oko Gogo (Ghana), Geoffrey Ngugi Mokabi (Kenya), Godwill George Wanga (United Republic of Tanzania), and Paul N. S. Sagala (Uganda). It has benefited from the comments of Ümit Efendioglu and Mongi Hamdi; from consultations with policy makers and other concerned officials; and from on-site visits of business concerns and in-depth interviews with business leaders and representatives of academia. UNCTAD staff members who participated in this project include Khalil Hamdani, Menelea Masin, Bonapas Onguglo, and Taffere Tesfachew. Production assistance was provided by Laila Sede and Deborah Wolde-Berhan.
This study was undertaken as part of the Joint Integrated Technical Assistance Programme (JITAP), a project undertaken jointly by UNCTAD, the World Trade Organization and the International Trade Centre to assist the integration of selected least-developed and other African countries into the multilateral trading system. JITAP identifies policies and institutions required to build and/or reinforce local supply capacity, as well as to improve the competitiveness of enterprises. One of JITAP’s objectives is to carry out country-specific studies to help Governments better assess the potential impact of the multilateral trading system and to adopt effective and timely export strategies for taking advantage of emerging trading opportunities.
iv
Contents
Preface ....................................................................................................... iii Abbreviations ....................................................................................................... vii Chapter 1 An Overview…........................................................................................ 1
A Introduction........................................................................................................... 1 B. The analytical framework ................................................................................ 1
C. The industrial setting ....................................................................................... 2 D. The technological structure of the manufactured exports sector.......................... 4
E. Industrial performance ..................................................................................... 8 F. Human capital .................................................................................................. 9 G. Technological activity...................................................................................... 12
H. Technology licensing and foreign direct investment inflows .......................... 13 I. Capital goods imports ...................................................................................... 14 J. Intellectual property regimes ........................................................................... 15 K. Summary .......................................................................................................... 15 Chapter 2 The Case of Kenya .............................................................................. 17
A. Introduction...................................................................................................... 17 B. Industrial background ........................................................................................... 18 C. Science and technology policies........................................................................... 19
D. Technology imports and technological activity............................................... 22 E. Inward foreign direct investment.......................................................................... 25
F. Export processing zones................................................................................... 28 G. Technology infrastructure..................................................................................... 29
H. Conclusions on technological capabilities ....................................................... 33 I. Policy recommendations....................................................................................... 34
Chapter 3 The Case of Ghana.................................................................................. 43
A. Introduction...................................................................................................... 43 B. Industrial background ...................................................................................... 43 C. The policy framework for industry .................................................................. 45
D. Science and technology policies........................................................................... 45 E. Technology transfer and technological activities............................................. 50 F. Human capital .................................................................................................. 51 G. The science and technology infrastructure....................................................... 52 H. Major science and technology training and educational institutions in Ghana ....................................................................................................... 58 I. Conclusions...................................................................................................... 59
J. Policy recommendations .................................................................................. 59
Chapter 4 The Case of Tanzania ............................................................................. 67
v
A. Introduction...................................................................................................... 67 B. Industrial background ...................................................................................... 68 C. Science and technology policies ...................................................................... 69 D. Intellectual property rights ............................................................................... 70 E. Technological imports and activities ............................................................... 71 F. Foreign direct investment................................................................................. 72 G. Technology infrastructure ................................................................................ 73
H. Conclusions...................................................................................................... 80 I. Policy Recommendations................................................................................. 81 J. Final words....................................................................................................... 88
Chapter 5 The Case of Uganda ................................................................................ 89
A. Introduction........................................................................................................... 89 B. The policy framework for technology development........................................ 91 C. Technology transfer to Uganda........................................................................ 94 D. Human capital .................................................................................................. 96 E. Science and technology infrastructure............................................................. 98 F. Conclusions ..................................................................................................... 103 References ................................................................................................................ 107
Boxes
2.1 Teecchhnnoollooggiiccaall uuppggrraaddiinngg bbyy PPoowweerr TTeecchhnniiccss,, KKeennyyaa............................................... 23 2.2 Technology Initiative for the Private Sector (TIPS) Project in Sri Lanka ................ 25 2.3 Singapore's use of FDI to upgrade technology.......................................................... 27 2.4 The Information services of the Thai Board of Investment ..................................... 28 2.5 Promoting high-technology SEEs (technopreneurs) in Singapore............................ 41 3.1 Cooperation between Governments and transnational corporations on training: The case of Singapore ............................................................................................... 61 3.2 The Ghana Free Zones Board: The experiences of two transnational corporations ............................................................................................................... 63 4.1 The Tanzania Cigarette Company............................................................................. 73 4.2 Support for SMEs in Taiwan Province of China....................................................... 77 4.3 Skills development for technology-based industrialization in Singapore ................. 84 5.1 Training and skills development by transnational corporations: Unilever Uganda .. 95 5.2 Emerging exports and the lack of a national technology system: Uganda's cut-flower exports ...................................................................................... 102
Tables
1.1 Annual growth rates and distribution of world exports, 1980–2000......................... 5 1.2 Annual growth rates and shares of manufactured exports, 1980-2000 ..................... 6 1.3 Percent share of regions in developing countries' exports, 1980-2000 ..................... 7 1.4 Shares of primary products in total exports, 1980 and 2000..................................... 8 1.5 Manufacturing value added in case study and comparator countries, 1980-2000.... 9 1.6 Enrolment ratios as percent of age groups, 1980-1995............................................. 10
vi
1.7 Tertiary-level enrolment in technical subjects, 1995............................................ 10 1.8 HMI ranks, 1995 and 1957–58 ............................................................................. 11 1.9 Research and development by major country groups ........................................... 12 1.10 ISO 9000 certificates in selected African and comparator countries, 1998 ......... 13 1.11 Foreign direct investment inflows, 1986-2000 ..................................................... 14 1.12 Equipment imports of selected countries, 1999.................................................... 15 1.13 Technology index of sample manufacturing firms, 1995 ..................................... 16 2.1 Number of patents registered, 1990-1999............................................................. 21 2.2 Technology inflows into Kenya............................................................................ 22 2.3 Sectoral shares of research and development expenditures in public research
institutions, 1996–97 ............................................................................................. 24 3.1 Growth rate indices of selected industries, Ghana, 1986–97................................ 44 3.2 Manufactured exports of Ghana and other SSA countries, 1980–95.................... 44 3.3 MEST annual budget, 1996–99 ............................................................................ 49 3.4 Total government funding of CSIR, 1996–98 ...................................................... 49 3.5 R&D funding, by the Government of Ghana and its development partners......... 50 3.6 Training in Ghanaian manufacturing enterprises ................................................. 52 3.7 Revenues and expenditures of the Ghana Standards Board.................................. 54 4.1 Manufacturing performance of the United Republic of Tanzania, 1992–98 ......... 69 5.1 Sectoral contribution to GDP, 1990–2001............................................................. 89 5.2 Manufactured exports, 1993-1997 ......................................................................... 90 5.3 Capital goods imports, 1993 and 1999 .................................................................. 94 5.4 Technical skills in selected Ugandan enterprises, 1998......................................... 97 5.5 Makerere University science graduates by specialization, 1991 and 1997 ........... 98
Figure
3.1 The science and technology system in Ghana........................................................... 47
vii
ABBREVIATIONS
FDI Foreign direct investment
GDP Gross domestic product
IPR Intellectual property rights
ISO International Standards Organization
LT, MT, HT Low-, Medium-, and High-Technology products
MVA Manufacturing value added
OECD Organisation for Economic Co-operation and Development
R&D Research and development
RB Resource-based products
SEEs State-owned economic enterprises
SMEs Small- and medium-sized enterprises
TRIPS Trade-related aspects of intellectual property rights
UNCTAD United Nations Conference on Trade and Development
UNDP United Nations Development Programme
UNESCO United Nations Educational, Scientific and Cultural
Organization
UNIDO United Nations Industrial Development Organization
Chapter 1 An Overview
A. Introduction
Set against a global economy characterized by rapid technological advances, intensifying competition and growing liberalization, this study examines the “technology system” in four sub-Saharan countries, with a focus on the transfer of technology, as well as its absorption and use, in the manufacturing industry. It analyses the main institutions supporting technology import and absorption in Ghana, Kenya, Uganda and Tanzania and draws comparisons with other developing countries, particularly industrializing countries in East and South-East Asia. Further, it provides a strategic perspective on how Governments address the technological requirements for competitiveness, gain access to new technology, and nurture local technological development. This chapter provides an overview of the individual country studies, including the analytical framework for technology policy discussion, the industrial setting, and the main determinants of technology development.
B. The analytical framework
Effective technology strategies are based on a clear understanding of the basic unit of technological activity, the industrial firm, which imports, masters, uses and improves technology. It also subsequently stimulates the demand for innovative technologies. For the process to thrive, it needs active, supportive and dynamic government policies and institutions. Efficient technology use goes beyond importing machinery. It entails building capabilities, technical understanding and an informational base; acquiring new technical skills and managerial practices; and forging linkages with other firms and institutions. It requires the ability to understand and master new technology; to adapt it to local factors and conditions; and to upgrade it as technologies improve and new products appear. Different firms use the same technology at vastly different levels of efficiency. Moreover, countries vary in their technological capabilities.
Technological competitiveness lies in the effectiveness with which countries promote capabilities. Firms in developing countries often lack the expertise to determine which new skills, technical knowledge and organizational techniques are required to make newly imported technologies function at optimal levels. Changes in traditional mindsets are required to form interactions and linkages with other firms or institutions, and to build technical know-how, as well as to overcome the problem of “leakage” of trained workers. Firms may not have access to the information, skills, financing or other factors needed to develop their capabilities.
Furthermore, not all activities involve the same degree of effort or cost. For instance, learning needs may be lesser in apparel manufacturing than in the making of advanced electronics or machinery. They also vary with ownership: new knowledge and technology might be more accessible to multinational affiliates than to local small and medium-sized enterprises (SMEs). Effective learning is further constrained among firms by a lack of coordination. Restrictions on learning within firms include reluctance to change, risk aversion, lack of knowledge and inability to undertake learning processes. Corrective policies are needed in order to promote national technological growth. This is the essence of technology policy: to promote in-firm learning and skill development; to improve the supply of information and skills from
AAffrriiccaa''ss TTeecchhnnoollooggyy GGaapp
2
markets and institutions; and to coordinate collective learning within and across related industries, or industrial clusters.
In addition to competition and trade policies, rules and regulations, there are five main factors affecting technology development. These are physical infrastructure, skills, financing, technology and supply clusters. The experiences of the more economically dynamic developing countries, particularly East Asia’s newly industrializing economies, indicate that coherent and carefully crafted technology policies can accelerate competitiveness and promote entry into more complex and higher-level technology activities.
C. The industrial setting
The weaknesses of African manufacturing are well documented. Growth in the past two decades has been very low and, in some cases, negative. During the period 1990–1997, manufacturing value added in sub-Saharan Africa, excluding South Africa, grew only 0.1 per cent per year. Sub-Saharan Africa’s share of global manufacturing value added has remained constant since 1980, at under 0.4 per cent (UNIDO, 1999). Even this low level of activity is highly concentrated. In 1998, South Africa alone accounted for 55 per cent of sub-Saharan Africa’s total manufacturing value added, and seven countries for another 22 per cent. This poor performance has to be viewed in the context of dynamic industrial growth in many other developing regions, with many countries using manufacturing to drive a rapid structural transformation of production and comparative advantage.
Sub-Saharan Africa is lagging not just in terms of volume but also in terms of technological content in its manufacturing activity. In certain largely traditional activities, it is possible to remain competitive with unskilled cheap labour and by processing natural resources. However, this base is eroding steadily. In almost all industrial activities, competitiveness involves technological change, new organizational methods, flexible response, greater networking, and closely integrated production systems across firms and regions. The new competition requires better technological capability in every country, regardless of resource base and location – even in countries that are not at the frontiers of innovation.
African manufacturing does not show many signs of such upgrading. Its structure remains dominated by low-level processing of natural resources and the manufacture of simple consumer goods aimed at domestic markets. There are few supply linkages between large and small enterprises. Productivity growth is poor. Capacity utilization has fallen below its peak of many years ago; a significant part of recent growth comes from utilizing existing capacity, rather than building new capacity. Technological efficiency is relatively low, with little sign of technological dynamism or innovation (Lall and Wangwe, 1998). African firms are well below international “best-practice” technical levels, and below levels reached by other developing countries (Biggs, Shah and Srivasatava, 1995).
Consequently, manufacturing has slowed down the economic growth of the region. Manufactured exports have not grown significantly; indeed, growth of non-traditional exports has been rather anaemic: “despite an evidently increasing need for it, sub-Saharan Africa appears to have achieved remarkably little diversification of its traditional primary export base over recent years” (Helleiner, 1999). In a world of accelerating technical change, intensifying competition and globalizing production, Africa is not only failing to improve its international competitive position, it is quickly
AAnn OOvveerrvviieeww
3
falling behind. Moreover, manufacturing is the only sector of the economy that appears to be able to act as a catalyst of economic development and modernization. As many other countries have done, Africa must industrialize efficiently in order to achieve growth and competitiveness and reap the benefits of modern technology.
Some problems with African industrial development could be attributed to political and ethnic conflicts; natural disasters; external market shocks, in the form of declining terms of trade; debt or falling aid inflows; poor macroeconomic management; and inadequate infrastructure. Others are due to inappropriate industrial policy. Many Governments have fostered industry behind high and indiscriminate protection. Given the small and weak indigenous base of industrial entrepreneurship, many gave the lead to state-owned enterprises that had even more limited managerial and technological capabilities. This has resulted in rampant rent-seeking and political interference, thereby exacerbating inefficiency. Some Governments nationalized enterprises run by foreign firms or entrepreneurs of non-African origin. The business environment was often inhospitable even to local private entrepreneurs, and was riddled with high transaction costs. African enterprises have failed to build up comparable levels of technological capability, and few have reached a level where they could compete directly in international markets.
Poor economic conditions, disillusionment with past strategies and intense pressure from development partners have led most African governments to liberalize economic policies with a view to reviving growth in manufacturing output, exports and employment. The dominant model of policy reform – stabilization and structural adjustment, as proposed by the International Monetary Fund and the World Bank – was applied across countries regardless of their level of industrial development. Adjustment was intended to improve productive sectors by removing inefficient interventions and exposing activities to international competition, with a view to increasing efficiency and technological dynamism. Almost the entire burden of policy reform was laid on adjusting prices; liberalization was considered to be sufficient for better performance. In the early days of adjustment it was expected that liberalization would lead Africa to emulate the success of export-oriented countries of East and South-East Asia.
The impact has been very different from what was expected. Import liberalization is devastating most exposed industries, largely as a result of competition from more competitive developing countries. The African enterprises that are growing are those with a local cost advantage, or those with niche markets that do not face direct import competition. The share of machinery manufacturing dropped by nearly half, from 12.2 to 6.5 per cent, over 1980-96 (UNIDO, 1999). The industries that initially led export-oriented growth in Asia, labour-intensive activities with simple technologies, are the ones worst affected in Africa. Foreign direct investment is not responding as expected to the labour cost advantages of Africa; there is only a trickle going into resource extraction and the privatization of state-owned utilities.
The dynamic process of globalization that is driving manufacturing in many developing countries is conspicuously absent in sub-Saharan Africa. Indications are that the divergence between Africa and the leaders in the developing world is widening rather than narrowing. The main structural problem of African industry appears to be its weak base of technological and managerial capabilities. The revival of growth in a competitive setting has to be based on greater technology inflows into Africa and, more importantly, significant improvement in enterprises’ ability to absorb, adapt and improve on imported technologies.
AAffrriiccaa''ss TTeecchhnnoollooggyy GGaapp
4
One cannot assume that growth will improve as a natural result of adjustment. Simply opening up the economy to international market forces cannot ensure that enterprises will become technically efficient and dynamic when free markets are deficient. Numerous studies show that technology development in developing countries is complex and variable, and that the relevant markets are rife with failures. Government policies thus have a major role to play in remedying market failures in technological development. As the example of East Asia illustrates, strong government intervention can be a powerful engine of technological development if it takes place within an export-oriented strategy and is reinforced by policies to boost learning, acquire new skills and access information.
This chapter provides a general comparative evaluation of technological capabilities in the four study countries using five indicators:
• technological structure of manufactured exports • industrial performance • human capital base • technological activity • foreign technology inflows, particularly through foreign direct investment
(FDI)
D. The technological structure of the manufactured exports sector
1. Introduction
The manufactured exports provide useful indicators, particularly in country comparisons, of the technological strength and specialization of the industrial sector. While they do not capture trends for non-trade activities, they provide an overview of underlying technological activity. This section places in an international context the performance of Africa in general and the case study countries in particular. In general, technology-intensive structures are expected to be more beneficial because:
• Activities with rapid product or process innovation enjoy growing demand vis-à-vis technologically stagnant activities. They also grow faster because they substitute for other products (final or intermediate) and stimulate demands for other technology-based products; thereby quickening the pace of production, employment and exports.
• Technology-intensive activities are less vulnerable to entry by competitors compared to low-technology activities where scale, skill and technology requirements are more modest.
• Technology-intensive activities offer higher learning and productivity potential as well as greater spillover benefits for other activities. Thus, they lead to faster growth in capabilities, greater diffusion and higher quality capabilities. A technology-intensive structure is thus likely to offer greater systemic benefits in terms of learning and innovation.
• Capabilities developed in technology-intensive activities are more attuned to technological and market trends, giving the ability to respond more flexibly to changing conditions. In the emerging global environment, therefore, they provide more valuable competitive skills.
AAnn OOvveerrvviieeww
5
2. Global trends
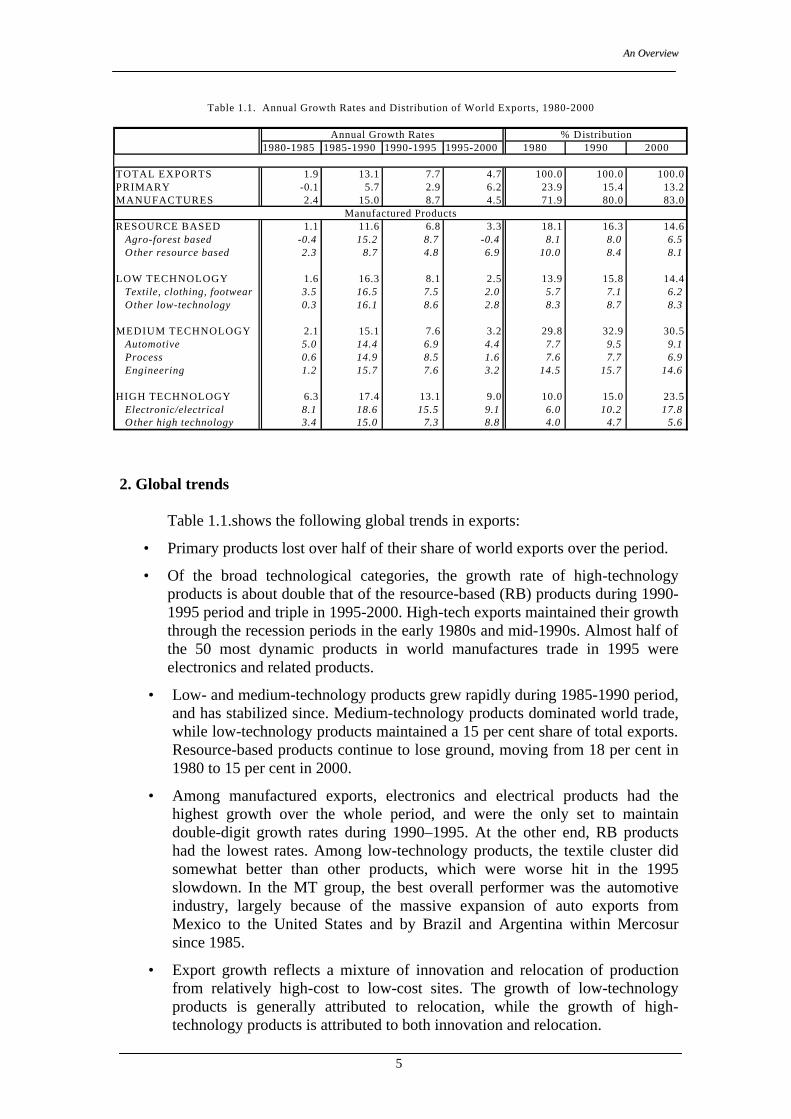
Table 1.1.shows the following global trends in exports:
• Primary products lost over half of their share of world exports over the period.
• Of the broad technological categories, the growth rate of high-technology products is about double that of the resource-based (RB) products during 1990-1995 period and triple in 1995-2000. High-tech exports maintained their growth through the recession periods in the early 1980s and mid-1990s. Almost half of the 50 most dynamic products in world manufactures trade in 1995 were electronics and related products.
• Low- and medium-technology products grew rapidly during 1985-1990 period, and has stabilized since. Medium-technology products dominated world trade, while low-technology products maintained a 15 per cent share of total exports. Resource-based products continue to lose ground, moving from 18 per cent in 1980 to 15 per cent in 2000.
• Among manufactured exports, electronics and electrical products had the highest growth over the whole period, and were the only set to maintain double-digit growth rates during 1990–1995. At the other end, RB products had the lowest rates. Among low-technology products, the textile cluster did somewhat better than other products, which were worse hit in the 1995 slowdown. In the MT group, the best overall performer was the automotive industry, largely because of the massive expansion of auto exports from Mexico to the United States and by Brazil and Argentina within Mercosur since 1985.
• Export growth reflects a mixture of innovation and relocation of production from relatively high-cost to low-cost sites. The growth of low-technology products is generally attributed to relocation, while the growth of high-technology products is attributed to both innovation and relocation.
1980-1985 1985-1990 1990-1995 1995-2000 1980 1990 2000
TOTAL EXPORTS 1.9 13.1 7.7 4.7 100.0 100.0 100.0PRIMARY -0.1 5.7 2.9 6.2 23.9 15.4 13.2MANUFACTURES 2.4 15.0 8.7 4.5 71.9 80.0 83.0
RESOURCE BASED 1.1 11.6 6.8 3.3 18.1 16.3 14.6 Agro-forest based -0.4 15.2 8.7 -0.4 8.1 8.0 6.5 Other resource based 2.3 8.7 4.8 6.9 10.0 8.4 8.1
LOW TECHNOLOGY 1.6 16.3 8.1 2.5 13.9 15.8 14.4 Textile, clothing, footwear 3.5 16.5 7.5 2.0 5.7 7.1 6.2 Other low-technology 0.3 16.1 8.6 2.8 8.3 8.7 8.3
MEDIUM TECHNOLOGY 2.1 15.1 7.6 3.2 29.8 32.9 30.5 Automotive 5.0 14.4 6.9 4.4 7.7 9.5 9.1 Process 0.6 14.9 8.5 1.6 7.6 7.7 6.9 Engineering 1.2 15.7 7.6 3.2 14.5 15.7 14.6
HIGH TECHNOLOGY 6.3 17.4 13.1 9.0 10.0 15.0 23.5 Electronic/electrical 8.1 18.6 15.5 9.1 6.0 10.2 17.8 Other high technology 3.4 15.0 7.3 8.8 4.0 4.7 5.6
Table 1.1. Annual Growth Rates and Distribution of World Exports, 1980-2000
Manufactured Products
Annual Growth Rates % Distribution
AAffrriiccaa''ss TTeecchhnnoollooggyy GGaapp
6
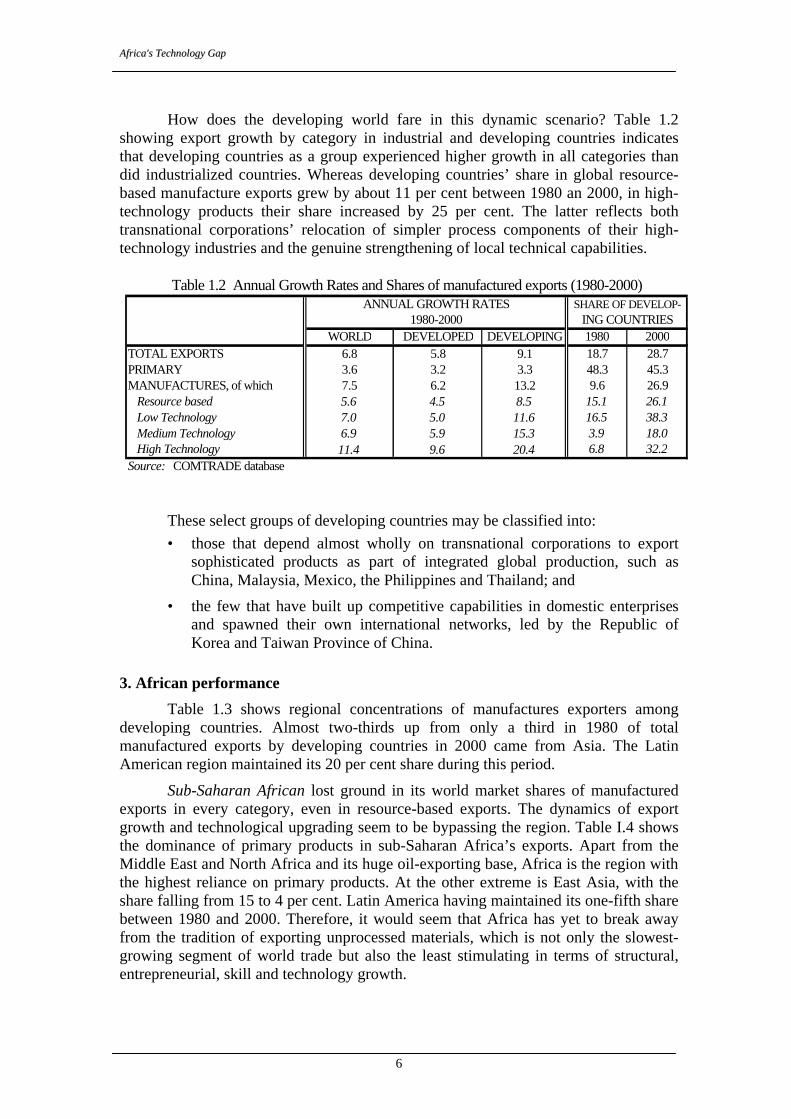
How does the developing world fare in this dynamic scenario? Table 1.2
showing export growth by category in industrial and developing countries indicates that developing countries as a group experienced higher growth in all categories than did industrialized countries. Whereas developing countries’ share in global resource-based manufacture exports grew by about 11 per cent between 1980 an 2000, in high-technology products their share increased by 25 per cent. The latter reflects both transnational corporations’ relocation of simpler process components of their high-technology industries and the genuine strengthening of local technical capabilities.
These select groups of developing countries may be classified into: • those that depend almost wholly on transnational corporations to export
sophisticated products as part of integrated global production, such as China, Malaysia, Mexico, the Philippines and Thailand; and
• the few that have built up competitive capabilities in domestic enterprises and spawned their own international networks, led by the Republic of Korea and Taiwan Province of China.
3. African performance
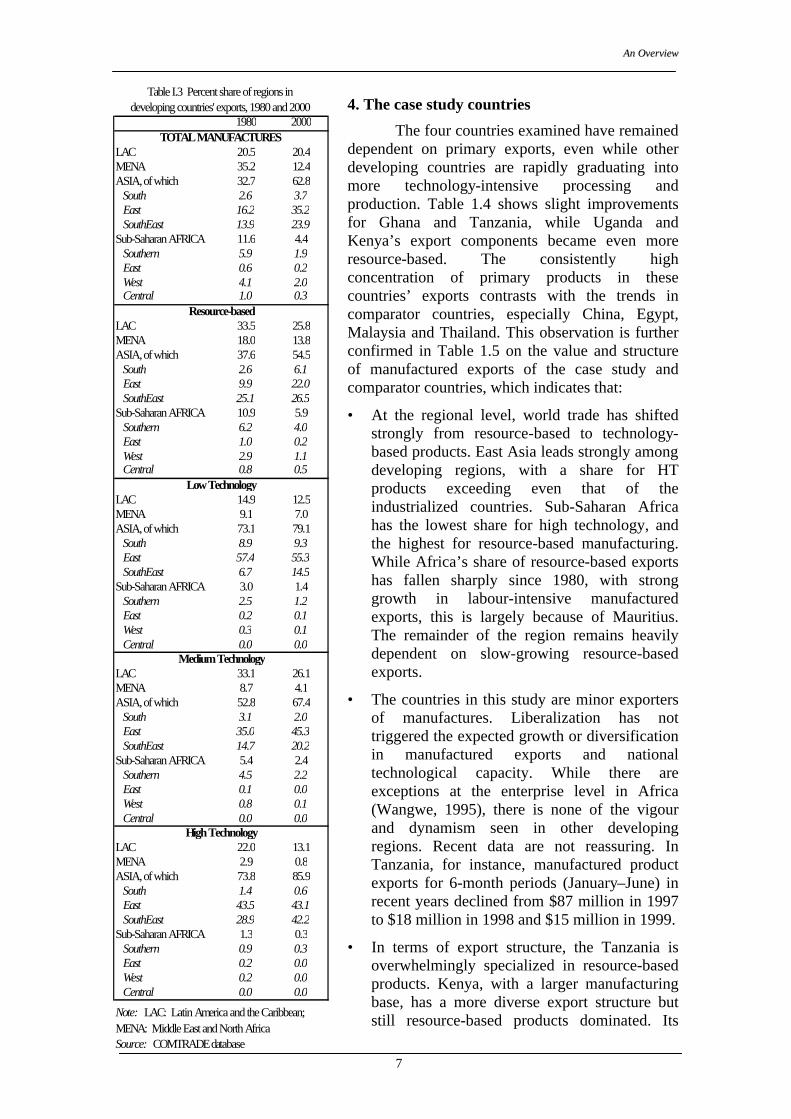
Table 1.3 shows regional concentrations of manufactures exporters among developing countries. Almost two-thirds up from only a third in 1980 of total manufactured exports by developing countries in 2000 came from Asia. The Latin American region maintained its 20 per cent share during this period.
Sub-Saharan African lost ground in its world market shares of manufactured exports in every category, even in resource-based exports. The dynamics of export growth and technological upgrading seem to be bypassing the region. Table I.4 shows the dominance of primary products in sub-Saharan Africa’s exports. Apart from the Middle East and North Africa and its huge oil-exporting base, Africa is the region with the highest reliance on primary products. At the other extreme is East Asia, with the share falling from 15 to 4 per cent. Latin America having maintained its one-fifth share between 1980 and 2000. Therefore, it would seem that Africa has yet to break away from the tradition of exporting unprocessed materials, which is not only the slowest-growing segment of world trade but also the least stimulating in terms of structural, entrepreneurial, skill and technology growth.
WORLD DEVELOPED DEVELOPING 1980 2000TOTAL EXPORTS 6.8 5.8 9.1 18.7 28.7PRIMARY 3.6 3.2 3.3 48.3 45.3MANUFACTURES, of which 7.5 6.2 13.2 9.6 26.9 Resource based 5.6 4.5 8.5 15.1 26.1 Low Technology 7.0 5.0 11.6 16.5 38.3 Medium Technology 6.9 5.9 15.3 3.9 18.0 High Technology 11.4 9.6 20.4 6.8 32.2Source: COMTRADE database
Table 1.2 Annual Growth Rates and Shares of manufactured exports (1980-2000)
1980-2000ANNUAL GROWTH RATES SHARE OF DEVELOP-
ING COUNTRIES
AAnn OOvveerrvviieeww
7
4. The case study countries
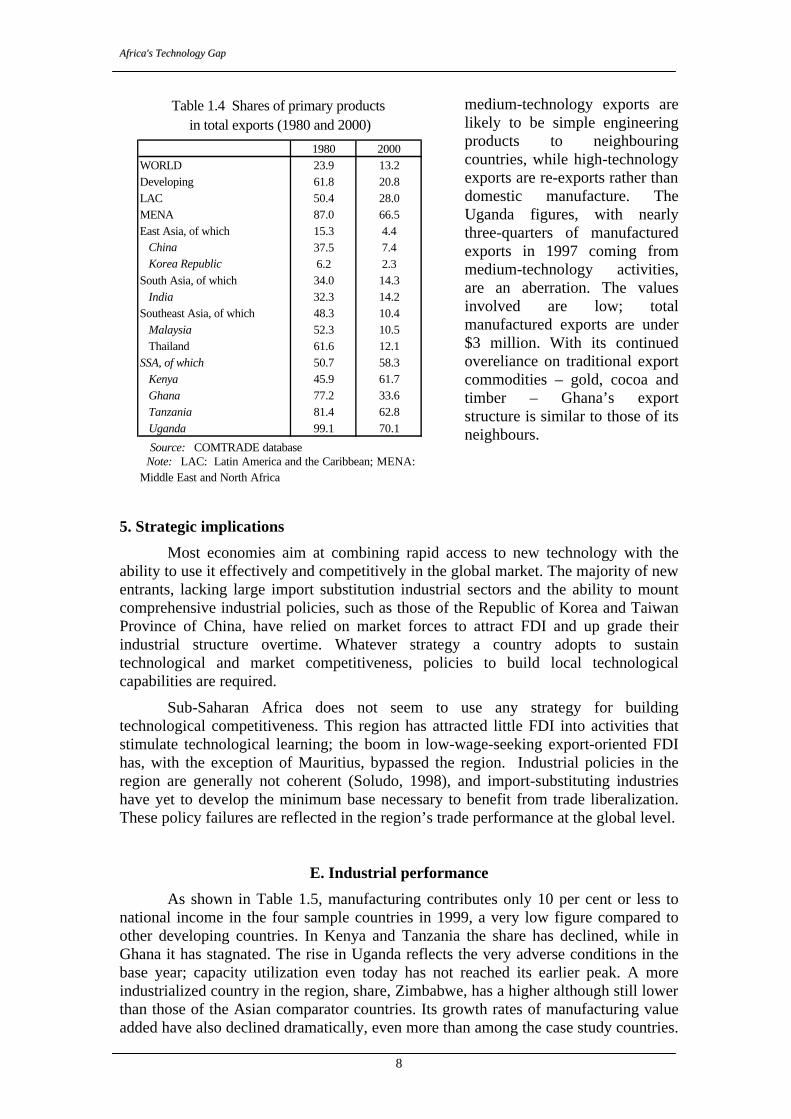
The four countries examined have remained dependent on primary exports, even while other developing countries are rapidly graduating into more technology-intensive processing and production. Table 1.4 shows slight improvements for Ghana and Tanzania, while Uganda and Kenya’s export components became even more resource-based. The consistently high concentration of primary products in these countries’ exports contrasts with the trends in comparator countries, especially China, Egypt, Malaysia and Thailand. This observation is further confirmed in Table 1.5 on the value and structure of manufactured exports of the case study and comparator countries, which indicates that:
• At the regional level, world trade has shifted strongly from resource-based to technology-based products. East Asia leads strongly among developing regions, with a share for HT products exceeding even that of the industrialized countries. Sub-Saharan Africa has the lowest share for high technology, and the highest for resource-based manufacturing. While Africa’s share of resource-based exports has fallen sharply since 1980, with strong growth in labour-intensive manufactured exports, this is largely because of Mauritius. The remainder of the region remains heavily dependent on slow-growing resource-based exports.
• The countries in this study are minor exporters of manufactures. Liberalization has not triggered the expected growth or diversification in manufactured exports and national technological capacity. While there are exceptions at the enterprise level in Africa (Wangwe, 1995), there is none of the vigour and dynamism seen in other developing regions. Recent data are not reassuring. In Tanzania, for instance, manufactured product exports for 6-month periods (January–June) in recent years declined from $87 million in 1997 to $18 million in 1998 and $15 million in 1999.
• In terms of export structure, the Tanzania is overwhelmingly specialized in resource-based products. Kenya, with a larger manufacturing base, has a more diverse export structure but still resource-based products dominated. Its
1980 2000
LAC 20.5 20.4MENA 35.2 12.4ASIA, of which 32.7 62.8 South 2.6 3.7 East 16.2 35.2 SouthEast 13.9 23.9Sub-Saharan AFRICA 11.6 4.4 Southern 5.9 1.9 East 0.6 0.2 West 4.1 2.0 Central 1.0 0.3
LAC 33.5 25.8MENA 18.0 13.8ASIA, of which 37.6 54.5 South 2.6 6.1 East 9.9 22.0 SouthEast 25.1 26.5Sub-Saharan AFRICA 10.9 5.9 Southern 6.2 4.0 East 1.0 0.2 West 2.9 1.1 Central 0.8 0.5
LAC 14.9 12.5MENA 9.1 7.0ASIA, of which 73.1 79.1 South 8.9 9.3 East 57.4 55.3 SouthEast 6.7 14.5Sub-Saharan AFRICA 3.0 1.4 Southern 2.5 1.2 East 0.2 0.1 West 0.3 0.1 Central 0.0 0.0
LAC 33.1 26.1MENA 8.7 4.1ASIA, of which 52.8 67.4 South 3.1 2.0 East 35.0 45.3 SouthEast 14.7 20.2Sub-Saharan AFRICA 5.4 2.4 Southern 4.5 2.2 East 0.1 0.0 West 0.8 0.1 Central 0.0 0.0
LAC 22.0 13.1MENA 2.9 0.8ASIA, of which 73.8 85.9 South 1.4 0.6 East 43.5 43.1 SouthEast 28.9 42.2Sub-Saharan AFRICA 1.3 0.3 Southern 0.9 0.3 East 0.2 0.0 West 0.2 0.0 Central 0.0 0.0
Note: LAC: Latin America and the Caribbean;MENA: Middle East and North AfricaSource: COMTRADE database
High Technology
TOTAL MANUFACTURES
Resource-based
Low Technology
Medium Technology
Table I.3 Percent share of regions in developing countries' exports, 1980 and 2000
AAffrriiccaa''ss TTeecchhnnoollooggyy GGaapp
8
medium-technology exports are likely to be simple engineering products to neighbouring countries, while high-technology exports are re-exports rather than domestic manufacture. The Uganda figures, with nearly three-quarters of manufactured exports in 1997 coming from medium-technology activities, are an aberration. The values involved are low; total manufactured exports are under $3 million. With its continued overeliance on traditional export commodities – gold, cocoa and timber – Ghana’s export structure is similar to those of its neighbours.
5. Strategic implications
Most economies aim at combining rapid access to new technology with the ability to use it effectively and competitively in the global market. The majority of new entrants, lacking large import substitution industrial sectors and the ability to mount comprehensive industrial policies, such as those of the Republic of Korea and Taiwan Province of China, have relied on market forces to attract FDI and up grade their industrial structure overtime. Whatever strategy a country adopts to sustain technological and market competitiveness, policies to build local technological capabilities are required.
Sub-Saharan Africa does not seem to use any strategy for building technological competitiveness. This region has attracted little FDI into activities that stimulate technological learning; the boom in low-wage-seeking export-oriented FDI has, with the exception of Mauritius, bypassed the region. Industrial policies in the region are generally not coherent (Soludo, 1998), and import-substituting industries have yet to develop the minimum base necessary to benefit from trade liberalization. These policy failures are reflected in the region’s trade performance at the global level.
E. Industrial performance
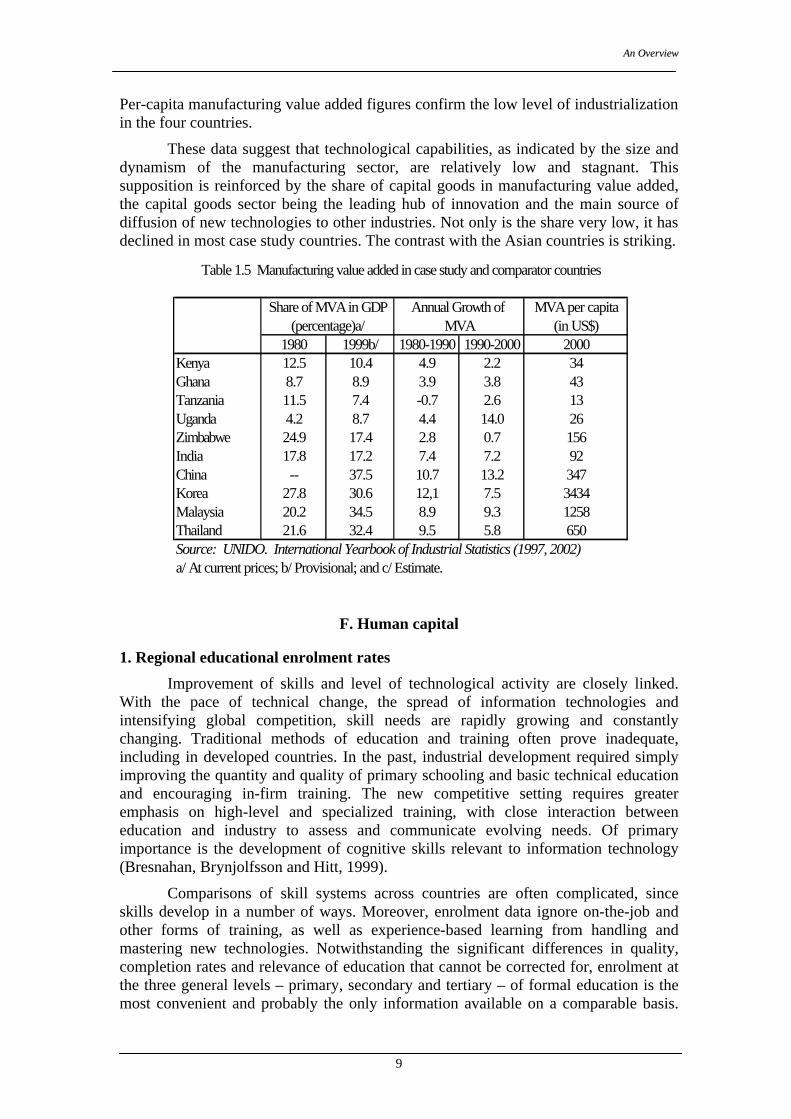
As shown in Table 1.5, manufacturing contributes only 10 per cent or less to national income in the four sample countries in 1999, a very low figure compared to other developing countries. In Kenya and Tanzania the share has declined, while in Ghana it has stagnated. The rise in Uganda reflects the very adverse conditions in the base year; capacity utilization even today has not reached its earlier peak. A more industrialized country in the region, share, Zimbabwe, has a higher although still lower than those of the Asian comparator countries. Its growth rates of manufacturing value added have also declined dramatically, even more than among the case study countries.
1980 2000WORLD 23.9 13.2Developing 61.8 20.8LAC 50.4 28.0MENA 87.0 66.5East Asia, of which 15.3 4.4 China 37.5 7.4 Korea Republic 6.2 2.3South Asia, of which 34.0 14.3 India 32.3 14.2Southeast Asia, of which 48.3 10.4 Malaysia 52.3 10.5 Thailand 61.6 12.1SSA, of which 50.7 58.3 Kenya 45.9 61.7 Ghana 77.2 33.6 Tanzania 81.4 62.8 Uganda 99.1 70.1
Source: COMTRADE database
Table 1.4 Shares of primary products in total exports (1980 and 2000)
Note: LAC: Latin America and the Caribbean; MENA: Middle East and North Africa
AAnn OOvveerrvviieeww
9
Per-capita manufacturing value added figures confirm the low level of industrialization in the four countries.
These data suggest that technological capabilities, as indicated by the size and dynamism of the manufacturing sector, are relatively low and stagnant. This supposition is reinforced by the share of capital goods in manufacturing value added, the capital goods sector being the leading hub of innovation and the main source of diffusion of new technologies to other industries. Not only is the share very low, it has declined in most case study countries. The contrast with the Asian countries is striking.
F. Human capital
1. Regional educational enrolment rates
Improvement of skills and level of technological activity are closely linked. With the pace of technical change, the spread of information technologies and intensifying global competition, skill needs are rapidly growing and constantly changing. Traditional methods of education and training often prove inadequate, including in developed countries. In the past, industrial development required simply improving the quantity and quality of primary schooling and basic technical education and encouraging in-firm training. The new competitive setting requires greater emphasis on high-level and specialized training, with close interaction between education and industry to assess and communicate evolving needs. Of primary importance is the development of cognitive skills relevant to information technology (Bresnahan, Brynjolfsson and Hitt, 1999).
Comparisons of skill systems across countries are often complicated, since skills develop in a number of ways. Moreover, enrolment data ignore on-the-job and other forms of training, as well as experience-based learning from handling and mastering new technologies. Notwithstanding the significant differences in quality, completion rates and relevance of education that cannot be corrected for, enrolment at the three general levels – primary, secondary and tertiary – of formal education is the most convenient and probably the only information available on a comparable basis.
MVA per capita(in US$)
1980 1999b/ 1980-1990 1990-2000 2000Kenya 12.5 10.4 4.9 2.2 34Ghana 8.7 8.9 3.9 3.8 43Tanzania 11.5 7.4 -0.7 2.6 13Uganda 4.2 8.7 4.4 14.0 26Zimbabwe 24.9 17.4 2.8 0.7 156India 17.8 17.2 7.4 7.2 92China -- 37.5 10.7 13.2 347Korea 27.8 30.6 12,1 7.5 3434Malaysia 20.2 34.5 8.9 9.3 1258Thailand 21.6 32.4 9.5 5.8 650Source: UNIDO. International Yearbook of Industrial Statistics (1997, 2002)
Table 1.5 Manufacturing value added in case study and comparator countries
a/ At current prices; b/ Provisional; and c/ Estimate.
Share of MVA in GDP(percentage)a/
Annual Growth of MVA
AAffrriiccaa''ss TTeecchhnnoollooggyy GGaapp
10
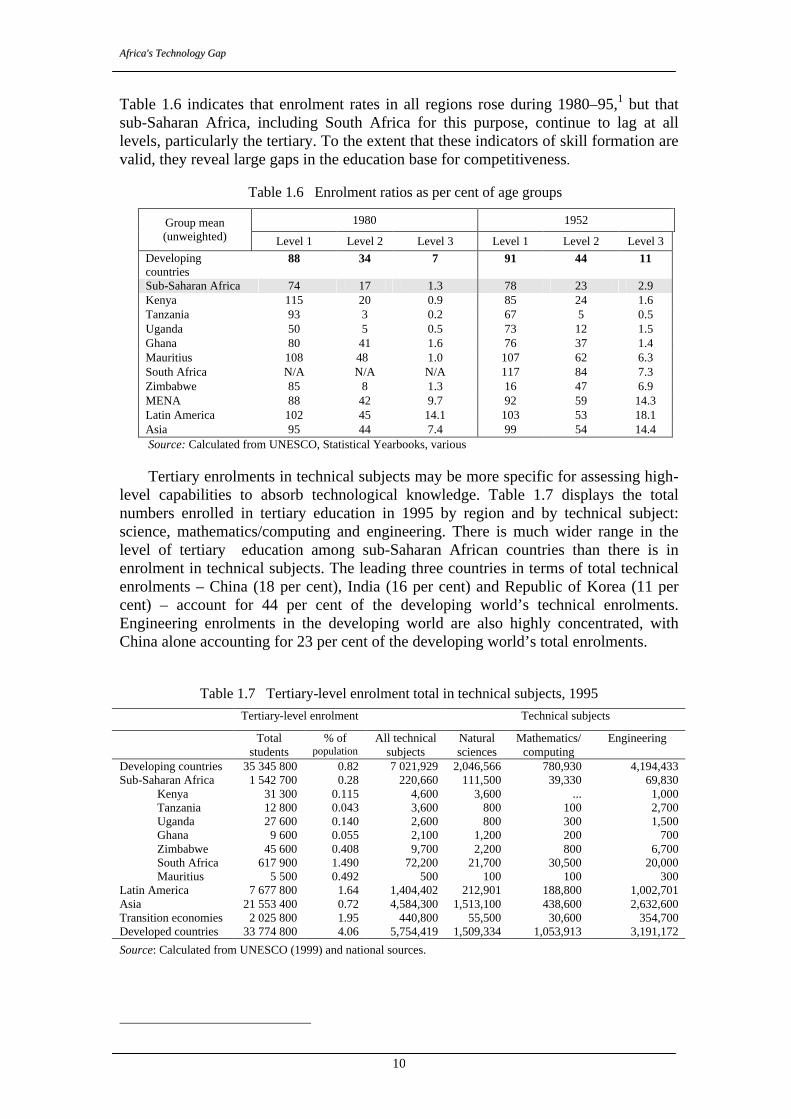
Table 1.6 indicates that enrolment rates in all regions rose during 1980–95,1 but that sub-Saharan Africa, including South Africa for this purpose, continue to lag at all levels, particularly the tertiary. To the extent that these indicators of skill formation are valid, they reveal large gaps in the education base for competitiveness.
Table 1.6 Enrolment ratios as per cent of age groups
1980 1952 Group mean (unweighted) Level 1 Level 2 Level 3 Level 1 Level 2 Level 3
Developing countries
88 34 7 91 44 11
Sub-Saharan Africa 74 17 1.3 78 23 2.9 Kenya 115 20 0.9 85 24 1.6 Tanzania 93 3 0.2 67 5 0.5 Uganda 50 5 0.5 73 12 1.5 Ghana 80 41 1.6 76 37 1.4 Mauritius 108 48 1.0 107 62 6.3 South Africa N/A N/A N/A 117 84 7.3 Zimbabwe 85 8 1.3 16 47 6.9 MENA 88 42 9.7 92 59 14.3 Latin America 102 45 14.1 103 53 18.1 Asia 95 44 7.4 99 54 14.4 Source: Calculated from UNESCO, Statistical Yearbooks, various
Tertiary enrolments in technical subjects may be more specific for assessing high-level capabilities to absorb technological knowledge. Table 1.7 displays the total numbers enrolled in tertiary education in 1995 by region and by technical subject: science, mathematics/computing and engineering. There is much wider range in the level of tertiary education among sub-Saharan African countries than there is in enrolment in technical subjects. The leading three countries in terms of total technical enrolments – China (18 per cent), India (16 per cent) and Republic of Korea (11 per cent) – account for 44 per cent of the developing world’s technical enrolments. Engineering enrolments in the developing world are also highly concentrated, with China alone accounting for 23 per cent of the developing world’s total enrolments.
Table 1.7 Tertiary-level enrolment total in technical subjects, 1995
Tertiary-level enrolment Technical subjects
Total students
% of population
All technical subjects
Natural sciences
Mathematics/ computing
Engineering
Developing countries 35 345 800 0.82 7 021,929 2,046,566 780,930 4,194,433 Sub-Saharan Africa 1 542 700 0.28 220,660 111,500 39,330 69,830
Kenya 31 300 0.115 4,600 3,600 ... 1,000 Tanzania 12 800 0.043 3,600 800 100 2,700 Uganda 27 600 0.140 2,600 800 300 1,500 Ghana 9 600 0.055 2,100 1,200 200 700 Zimbabwe 45 600 0.408 9,700 2,200 800 6,700 South Africa 617 900 1.490 72,200 21,700 30,500 20,000 Mauritius 5 500 0.492 500 100 100 300
Latin America 7 677 800 1.64 1,404,402 212,901 188,800 1,002,701 Asia 21 553 400 0.72 4,584,300 1,513,100 438,600 2,632,600 Transition economies 2 025 800 1.95 440,800 55,500 30,600 354,700 Developed countries 33 774 800 4.06 5,754,419 1,509,334 1,053,913 3,191,172
Source: Calculated from UNESCO (1999) and national sources.
AAnn OOvveerrvviieeww
11
Sub-Saharan Africa accounts for 4.4 per cent of the developing world’s total tertiary enrolments, 3.1 per cent of technical tertiary enrolments, and 1.7 per cent of engineering enrolments, while containing about 12 per cent of its population. The total number of engineers enrolled in the whole of Africa, about 70,000, is only about 12 per cent of the South Korea’s corresponding figure of 577,000. It should be noted that the South Korea has the world’s highest proportion of the population enrolled in engineering and other technical subjects; its exceptionally rapid industrial development is generally attributed to its enormous investments in creating technical manpower. 2. National enrolment rates
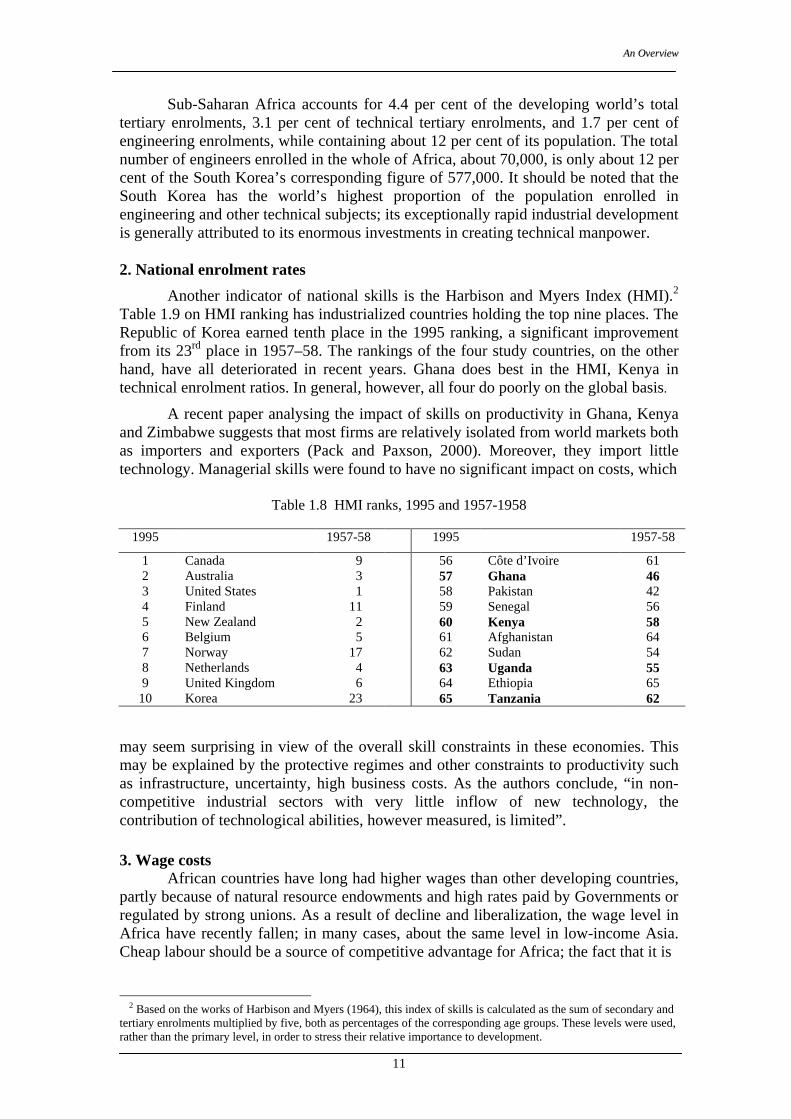
Another indicator of national skills is the Harbison and Myers Index (HMI).2 Table 1.9 on HMI ranking has industrialized countries holding the top nine places. The Republic of Korea earned tenth place in the 1995 ranking, a significant improvement from its 23rd place in 1957–58. The rankings of the four study countries, on the other hand, have all deteriorated in recent years. Ghana does best in the HMI, Kenya in technical enrolment ratios. In general, however, all four do poorly on the global basis.
A recent paper analysing the impact of skills on productivity in Ghana, Kenya and Zimbabwe suggests that most firms are relatively isolated from world markets both as importers and exporters (Pack and Paxson, 2000). Moreover, they import little technology. Managerial skills were found to have no significant impact on costs, which
Table 1.8 HMI ranks, 1995 and 1957-1958
1995 1957-58 1995 1957-58
1 Canada 9 56 Côte d’Ivoire 61 2 Australia 3 57 Ghana 46 3 United States 1 58 Pakistan 42 4 Finland 11 59 Senegal 56 5 New Zealand 2 60 Kenya 58 6 Belgium 5 61 Afghanistan 64 7 Norway 17 62 Sudan 54 8 Netherlands 4 63 Uganda 55 9 United Kingdom 6 64 Ethiopia 65
10 Korea 23 65 Tanzania 62
may seem surprising in view of the overall skill constraints in these economies. This may be explained by the protective regimes and other constraints to productivity such as infrastructure, uncertainty, high business costs. As the authors conclude, “in non-competitive industrial sectors with very little inflow of new technology, the contribution of technological abilities, however measured, is limited”. 3. Wage costs
African countries have long had higher wages than other developing countries, partly because of natural resource endowments and high rates paid by Governments or regulated by strong unions. As a result of decline and liberalization, the wage level in Africa have recently fallen; in many cases, about the same level in low-income Asia. Cheap labour should be a source of competitive advantage for Africa; the fact that it is
2 Based on the works of Harbison and Myers (1964), this index of skills is calculated as the sum of secondary and
tertiary enrolments multiplied by five, both as percentages of the corresponding age groups. These levels were used, rather than the primary level, in order to stress their relative importance to development.
AAffrriiccaa''ss TTeecchhnnoollooggyy GGaapp
12
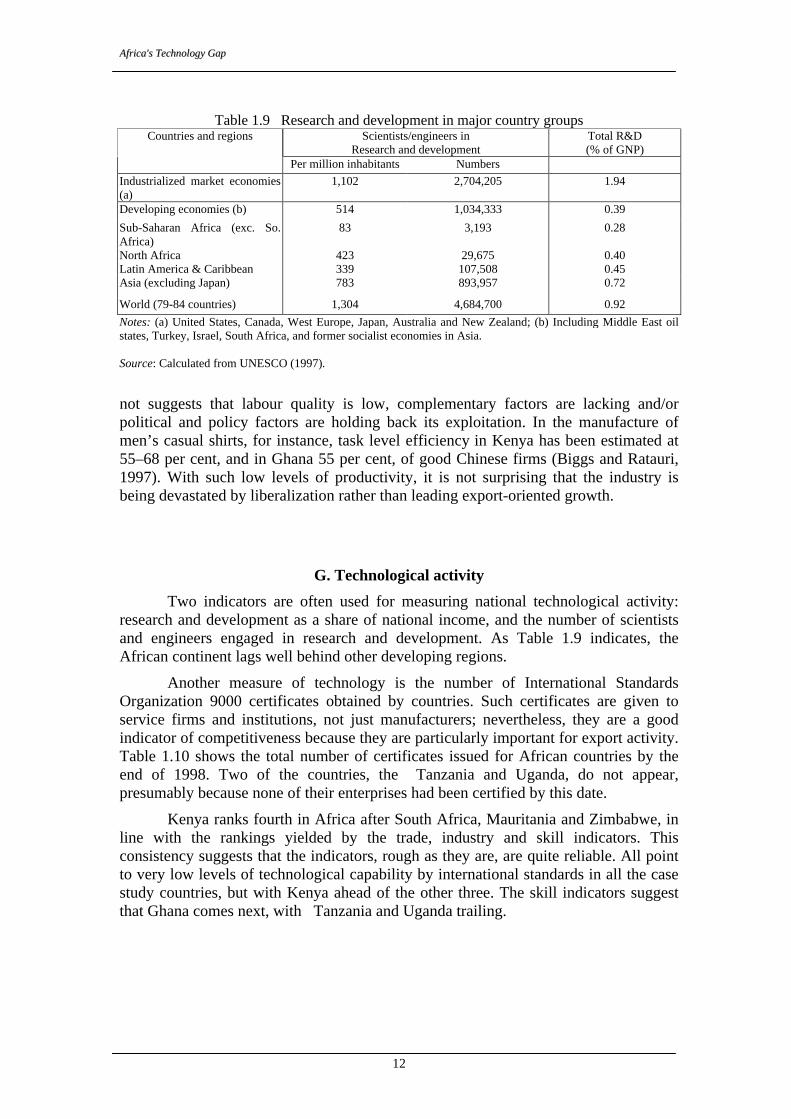
Table 1.9 Research and development in major country groups
Countries and regions Scientists/engineers in Research and development
Total R&D (% of GNP)
Per million inhabitants Numbers Industrialized market economies (a)
1,102 2,704,205 1.94
Developing economies (b) 514 1,034,333 0.39
Sub-Saharan Africa (exc. So. Africa)
83 3,193 0.28
North Africa 423 29,675 0.40 Latin America & Caribbean 339 107,508 0.45 Asia (excluding Japan) 783 893,957 0.72
World (79-84 countries) 1,304 4,684,700 0.92 Notes: (a) United States, Canada, West Europe, Japan, Australia and New Zealand; (b) Including Middle East oil states, Turkey, Israel, South Africa, and former socialist economies in Asia. Source: Calculated from UNESCO (1997).
not suggests that labour quality is low, complementary factors are lacking and/or political and policy factors are holding back its exploitation. In the manufacture of men’s casual shirts, for instance, task level efficiency in Kenya has been estimated at 55–68 per cent, and in Ghana 55 per cent, of good Chinese firms (Biggs and Ratauri, 1997). With such low levels of productivity, it is not surprising that the industry is being devastated by liberalization rather than leading export-oriented growth.
G. Technological activity
Two indicators are often used for measuring national technological activity: research and development as a share of national income, and the number of scientists and engineers engaged in research and development. As Table 1.9 indicates, the African continent lags well behind other developing regions.
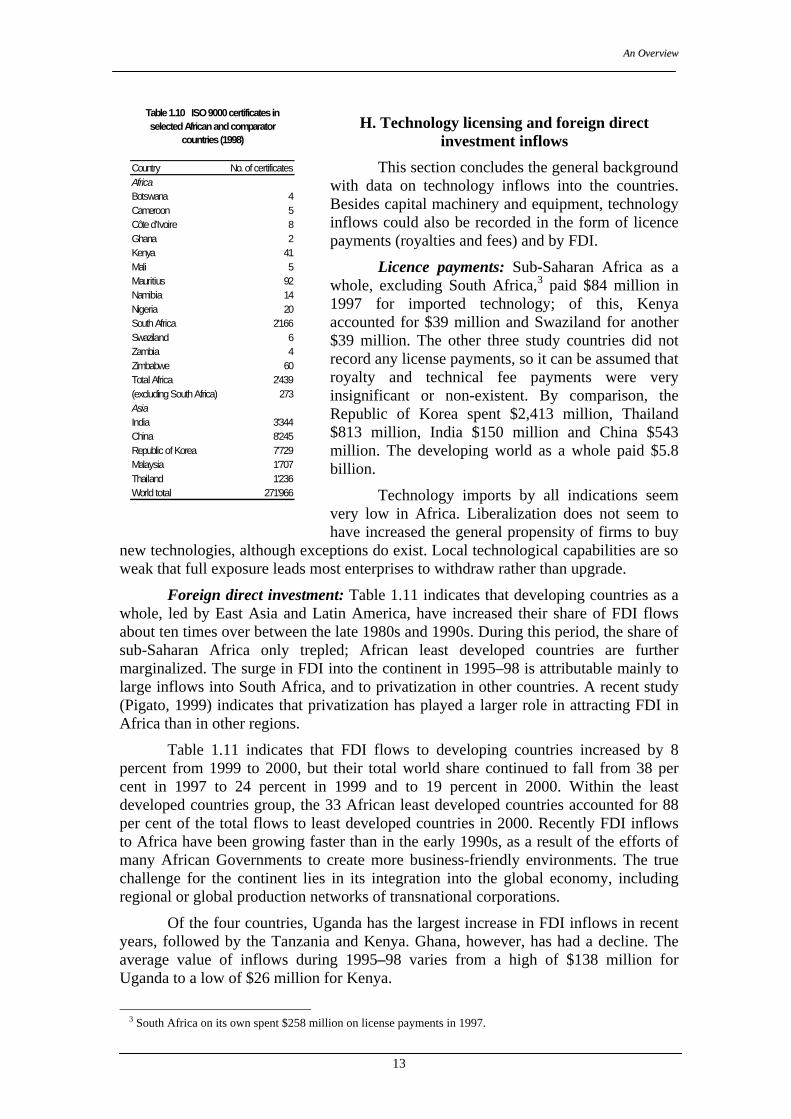
Another measure of technology is the number of International Standards Organization 9000 certificates obtained by countries. Such certificates are given to service firms and institutions, not just manufacturers; nevertheless, they are a good indicator of competitiveness because they are particularly important for export activity. Table 1.10 shows the total number of certificates issued for African countries by the end of 1998. Two of the countries, the Tanzania and Uganda, do not appear, presumably because none of their enterprises had been certified by this date.
Kenya ranks fourth in Africa after South Africa, Mauritania and Zimbabwe, in line with the rankings yielded by the trade, industry and skill indicators. This consistency suggests that the indicators, rough as they are, are quite reliable. All point to very low levels of technological capability by international standards in all the case study countries, but with Kenya ahead of the other three. The skill indicators suggest that Ghana comes next, with Tanzania and Uganda trailing.
AAnn OOvveerrvviieeww
13
H. Technology licensing and foreign direct
investment inflows
This section concludes the general background with data on technology inflows into the countries. Besides capital machinery and equipment, technology inflows could also be recorded in the form of licence payments (royalties and fees) and by FDI.
Licence payments: Sub-Saharan Africa as a whole, excluding South Africa,3 paid $84 million in 1997 for imported technology; of this, Kenya accounted for $39 million and Swaziland for another $39 million. The other three study countries did not record any license payments, so it can be assumed that royalty and technical fee payments were very insignificant or non-existent. By comparison, the Republic of Korea spent $2,413 million, Thailand $813 million, India $150 million and China $543 million. The developing world as a whole paid $5.8 billion.
Technology imports by all indications seem very low in Africa. Liberalization does not seem to have increased the general propensity of firms to buy
new technologies, although exceptions do exist. Local technological capabilities are so weak that full exposure leads most enterprises to withdraw rather than upgrade.
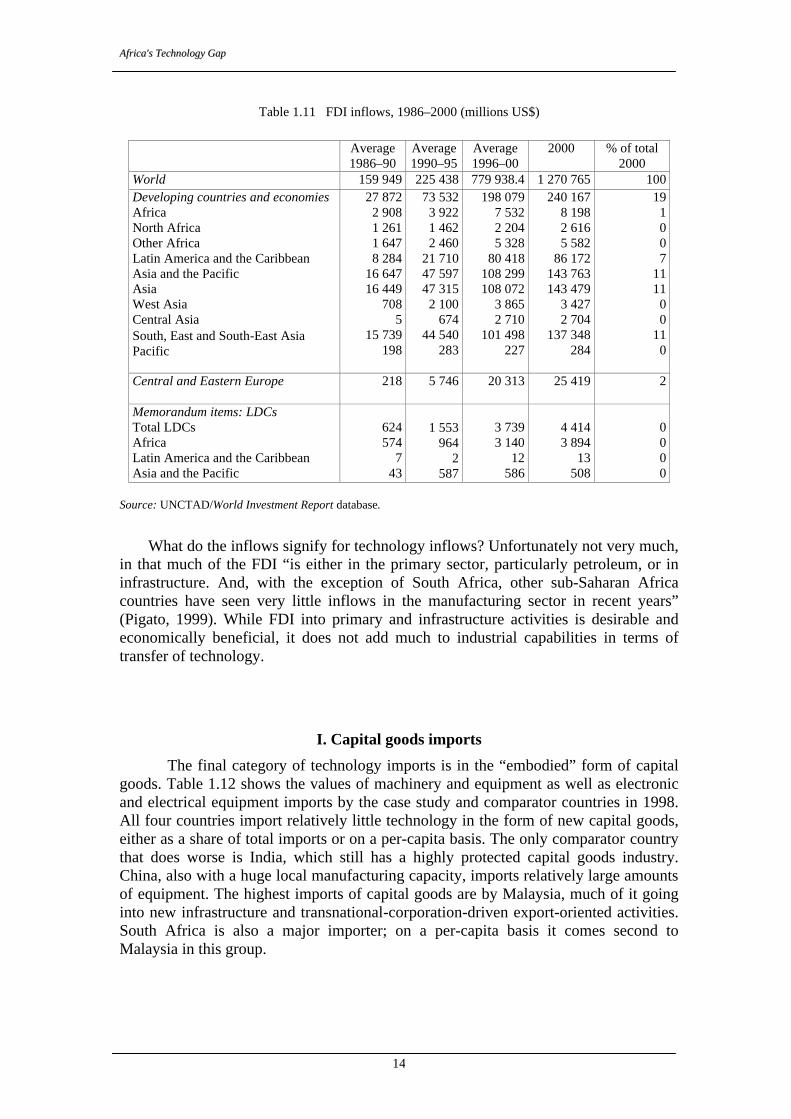
Foreign direct investment: Table 1.11 indicates that developing countries as a whole, led by East Asia and Latin America, have increased their share of FDI flows about ten times over between the late 1980s and 1990s. During this period, the share of sub-Saharan Africa only trepled; African least developed countries are further marginalized. The surge in FDI into the continent in 1995–98 is attributable mainly to large inflows into South Africa, and to privatization in other countries. A recent study (Pigato, 1999) indicates that privatization has played a larger role in attracting FDI in Africa than in other regions.
Table 1.11 indicates that FDI flows to developing countries increased by 8 percent from 1999 to 2000, but their total world share continued to fall from 38 per cent in 1997 to 24 percent in 1999 and to 19 percent in 2000. Within the least developed countries group, the 33 African least developed countries accounted for 88 per cent of the total flows to least developed countries in 2000. Recently FDI inflows to Africa have been growing faster than in the early 1990s, as a result of the efforts of many African Governments to create more business-friendly environments. The true challenge for the continent lies in its integration into the global economy, including regional or global production networks of transnational corporations.
Of the four countries, Uganda has the largest increase in FDI inflows in recent years, followed by the Tanzania and Kenya. Ghana, however, has had a decline. The average value of inflows during 1995–98 varies from a high of $138 million for Uganda to a low of $26 million for Kenya.
3 South Africa on its own spent $258 million on license payments in 1997.
Country No. of certificatesAfrica Botswana 4Cameroon 5Côte d'Ivoire 8Ghana 2Kenya 41Mali 5Mauritius 92Namibia 14Nigeria 20South Africa 2'166Swaziland 6Zambia 4Zimbabwe 60Total Africa 2'439(excluding South Africa) 273AsiaIndia 3'344China 8'245Republic of Korea 7'729Malaysia 1'707Thailand 1'236World total 271'966
Table 1.10 ISO 9000 certificates in selected African and comparator
countries (1998)
AAffrriiccaa''ss TTeecchhnnoollooggyy GGaapp
14
Source: UNCTAD/World Investment Report database.
What do the inflows signify for technology inflows? Unfortunately not very much, in that much of the FDI “is either in the primary sector, particularly petroleum, or in infrastructure. And, with the exception of South Africa, other sub-Saharan Africa countries have seen very little inflows in the manufacturing sector in recent years” (Pigato, 1999). While FDI into primary and infrastructure activities is desirable and economically beneficial, it does not add much to industrial capabilities in terms of transfer of technology.
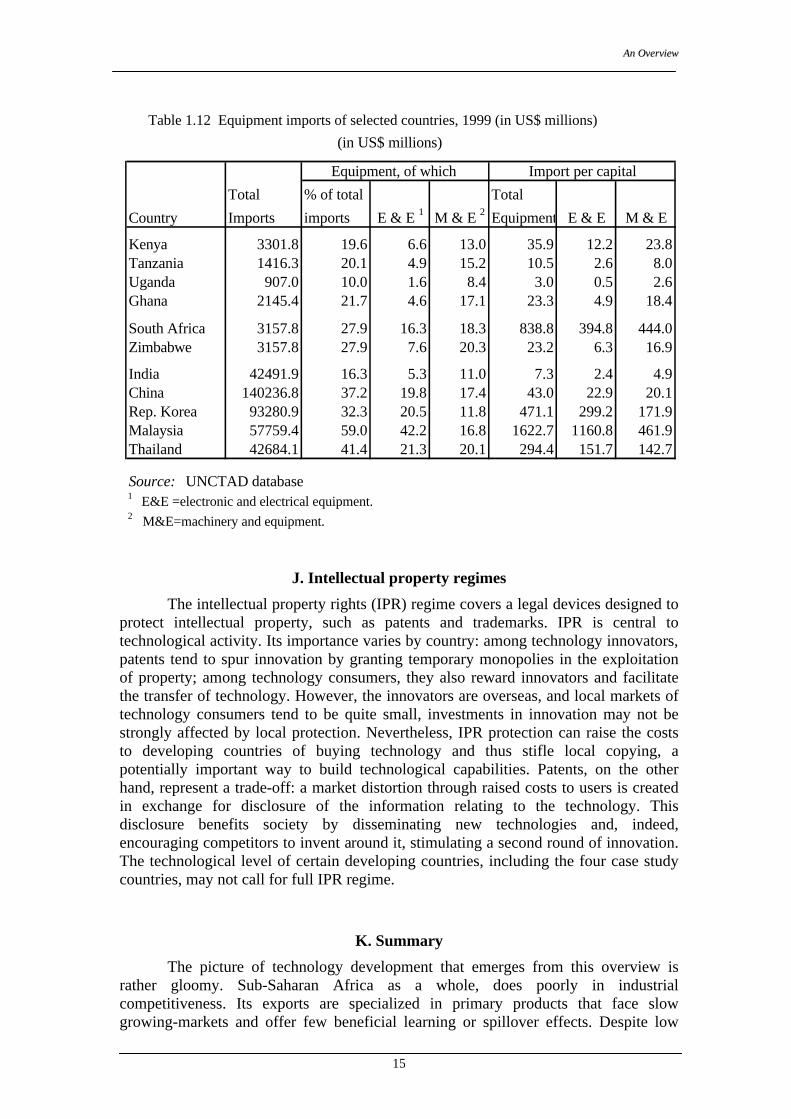
I. Capital goods imports
The final category of technology imports is in the “embodied” form of capital goods. Table 1.12 shows the values of machinery and equipment as well as electronic and electrical equipment imports by the case study and comparator countries in 1998. All four countries import relatively little technology in the form of new capital goods, either as a share of total imports or on a per-capita basis. The only comparator country that does worse is India, which still has a highly protected capital goods industry. China, also with a huge local manufacturing capacity, imports relatively large amounts of equipment. The highest imports of capital goods are by Malaysia, much of it going into new infrastructure and transnational-corporation-driven export-oriented activities. South Africa is also a major importer; on a per-capita basis it comes second to Malaysia in this group.
Table 1.11 FDI inflows, 1986–2000 (millions US$)
Average 1986–90
Average 1990–95
Average 1996–00
2000 % of total 2000
World 159 949 225 438 779 938.4 1 270 765 100 Developing countries and economies Africa North Africa Other Africa Latin America and the Caribbean Asia and the Pacific Asia West Asia Central Asia South, East and South-East Asia Pacific
27 872 2 908 1 261 1 647 8 284
16 647 16 449
708 5
15 739 198
73 532 3 922 1 462 2 460
21 710 47 597 47 315
2 100 674
44 540 283
198 079 7 532 2 204 5 328
80 418 108 299 108 072
3 865 2 710
101 498 227
240 167 8 198 2 616 5 582
86 172 143 763 143 479
3 427 2 704
137 348 284
19 1 0 0 7
11 11
0 0
11 0
Central and Eastern Europe 218 5 746 20 313 25 419 2
Memorandum items: LDCs
Total LDCs Africa Latin America and the Caribbean Asia and the Pacific
624 574
7 43
1 553 964
2 587
3 739 3 140
12 586
4 414 3 894
13 508
0 0 0 0
AAnn OOvveerrvviieeww
15
Table 1.12 Equipment imports of selected countries, 1999 (in US$ millions)
J. Intellectual property regimes
The intellectual property rights (IPR) regime covers a legal devices designed to protect intellectual property, such as patents and trademarks. IPR is central to technological activity. Its importance varies by country: among technology innovators, patents tend to spur innovation by granting temporary monopolies in the exploitation of property; among technology consumers, they also reward innovators and facilitate the transfer of technology. However, the innovators are overseas, and local markets of technology consumers tend to be quite small, investments in innovation may not be strongly affected by local protection. Nevertheless, IPR protection can raise the costs to developing countries of buying technology and thus stifle local copying, a potentially important way to build technological capabilities. Patents, on the other hand, represent a trade-off: a market distortion through raised costs to users is created in exchange for disclosure of the information relating to the technology. This disclosure benefits society by disseminating new technologies and, indeed, encouraging competitors to invent around it, stimulating a second round of innovation. The technological level of certain developing countries, including the four case study countries, may not call for full IPR regime.
K. Summary
The picture of technology development that emerges from this overview is rather gloomy. Sub-Saharan Africa as a whole, does poorly in industrial competitiveness. Its exports are specialized in primary products that face slow growing-markets and offer few beneficial learning or spillover effects. Despite low
Total % of total Total
Country Imports imports E & E 1 M & E 2 Equipment E & E M & E
Kenya 3301.8 19.6 6.6 13.0 35.9 12.2 23.8Tanzania 1416.3 20.1 4.9 15.2 10.5 2.6 8.0Uganda 907.0 10.0 1.6 8.4 3.0 0.5 2.6Ghana 2145.4 21.7 4.6 17.1 23.3 4.9 18.4
South Africa 3157.8 27.9 16.3 18.3 838.8 394.8 444.0Zimbabwe 3157.8 27.9 7.6 20.3 23.2 6.3 16.9
India 42491.9 16.3 5.3 11.0 7.3 2.4 4.9China 140236.8 37.2 19.8 17.4 43.0 22.9 20.1Rep. Korea 93280.9 32.3 20.5 11.8 471.1 299.2 171.9Malaysia 57759.4 59.0 42.2 16.8 1622.7 1160.8 461.9Thailand 42684.1 41.4 21.3 20.1 294.4 151.7 142.7
Source: UNCTAD database1 E&E =electronic and electrical equipment.2 M&E=machinery and equipment.
Equipment, of which Import per capital
(in US$ millions)
AAffrriiccaa''ss TTeecchhnnoollooggyy GGaapp
16
wages, it has not made a dent in the fast-growing global production system for low-technology consumer products. The region exports hardly any sophisticated products, where other developing countries have established themselves as dynamic competitors. Instead of functioning as the engine of growth and structural transformation, its industrial base is eroding in response to liberalization and adjustment.
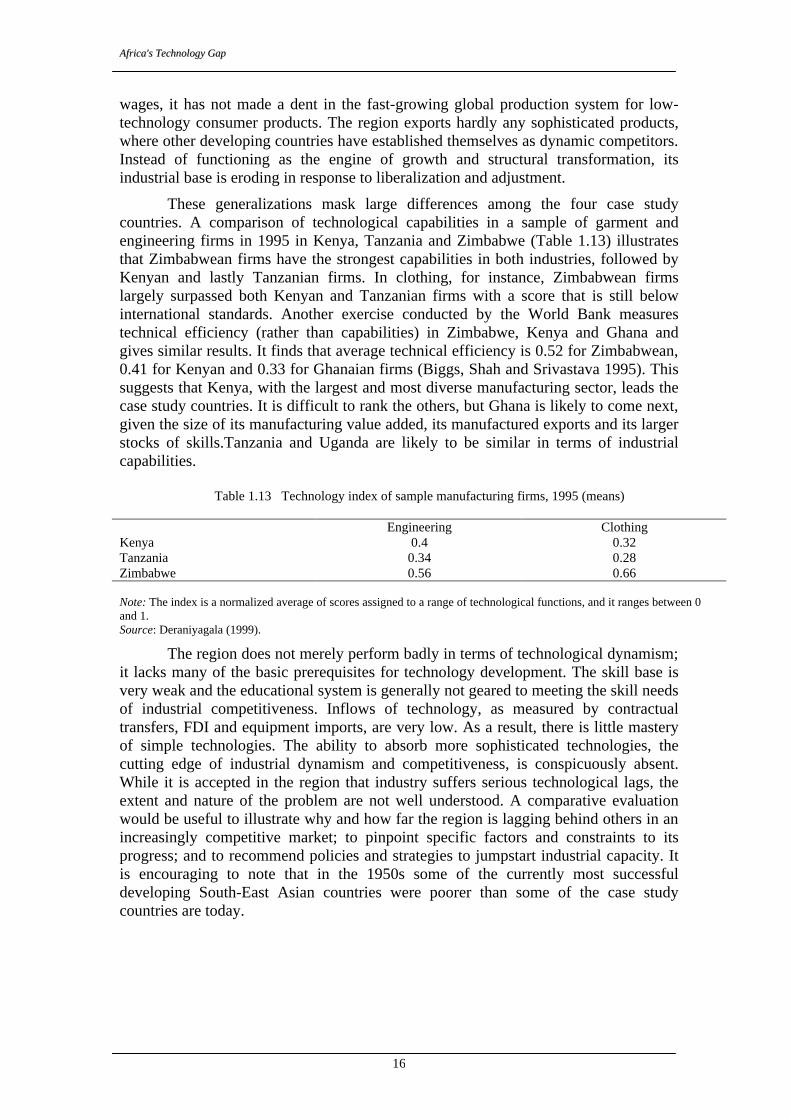
These generalizations mask large differences among the four case study countries. A comparison of technological capabilities in a sample of garment and engineering firms in 1995 in Kenya, Tanzania and Zimbabwe (Table 1.13) illustrates that Zimbabwean firms have the strongest capabilities in both industries, followed by Kenyan and lastly Tanzanian firms. In clothing, for instance, Zimbabwean firms largely surpassed both Kenyan and Tanzanian firms with a score that is still below international standards. Another exercise conducted by the World Bank measures technical efficiency (rather than capabilities) in Zimbabwe, Kenya and Ghana and gives similar results. It finds that average technical efficiency is 0.52 for Zimbabwean, 0.41 for Kenyan and 0.33 for Ghanaian firms (Biggs, Shah and Srivastava 1995). This suggests that Kenya, with the largest and most diverse manufacturing sector, leads the case study countries. It is difficult to rank the others, but Ghana is likely to come next, given the size of its manufacturing value added, its manufactured exports and its larger stocks of skills.Tanzania and Uganda are likely to be similar in terms of industrial capabilities.
Table 1.13 Technology index of sample manufacturing firms, 1995 (means)
Engineering Clothing Kenya 0.4 0.32 Tanzania 0.34 0.28 Zimbabwe 0.56 0.66 Note: The index is a normalized average of scores assigned to a range of technological functions, and it ranges between 0 and 1. Source: Deraniyagala (1999).
The region does not merely perform badly in terms of technological dynamism; it lacks many of the basic prerequisites for technology development. The skill base is very weak and the educational system is generally not geared to meeting the skill needs of industrial competitiveness. Inflows of technology, as measured by contractual transfers, FDI and equipment imports, are very low. As a result, there is little mastery of simple technologies. The ability to absorb more sophisticated technologies, the cutting edge of industrial dynamism and competitiveness, is conspicuously absent. While it is accepted in the region that industry suffers serious technological lags, the extent and nature of the problem are not well understood. A comparative evaluation would be useful to illustrate why and how far the region is lagging behind others in an increasingly competitive market; to pinpoint specific factors and constraints to its progress; and to recommend policies and strategies to jumpstart industrial capacity. It is encouraging to note that in the 1950s some of the currently most successful developing South-East Asian countries were poorer than some of the case study countries are today.
Chapter 2 The Case of Kenya
A. Introduction
The Government of Kenya regards industrial development as a cornerstone of development, with manufacturing as the engine for export growth, employment creation and income generation. Nevertheless, the Government is fully aware of current technological shortcomings. To quote a governmental planning and strategy document:
“Kenya’s industrialisation process will not be easily achieved in practice. Unlike the newly industrializing countries, which industrialised under protected domestic markets, Kenya is attempting to achieve the same result with a liberalised market. Markets are also rapidly being globalized and the new information technologies are creating new uncertainties and opportunities. In addition, whereas the current newly industrializing countries industrialised in high growth regions, Kenya is attempting to industrialise in a region with a tradition of low growth. To industrialise in such an environment, Kenyan manufacturers will have to produce goods and services that are internationally competitive in both quality and price… The process of industrialisation will include a ‘deepening’ of the industrial sector by creating core and linkage industries, as well as acquiring and adapting relevant technologies to enhance factor productivity” (Republic of Kenya, 1997).
By regional standards, Kenya already has a relatively strong industrial and technological base; the only countries that appear stronger are South Africa and Zimbabwe. However, these are not Kenyan industry’s only competitors. With liberalization and falling transport costs, the most significant competition comes from outside the region – from South and South-East Asia for low-technology goods, and from the Organisation for Economic Co-operation and Development (OECD) countries and East Asia for medium- and high-technology items. Kenya requires technological capabilities that match, and even surpass, those of its global competitors.
On the role of research and development in industrial development, the national view is that “…..Research and development plays a key role in industrialisation …..The vision to transform Kenya into a newly industrializing country by the year 2020 calls for a critical re-examination of the country’s research and development policies and strategies… Kenya’s industrial enterprises are characterized by obsolete technologies and inefficient machinery, often over 20 years old. Information on available sources of technology is poor; indeed, some firms have continued royalty payments long after patent protection has expired. Moreover, domestic engineers have had little success in adapting imported technologies to the domestic environment. There is little evidence of technology deepening or adapting foreign technologies to produce improved or new products. Kenya today lacks well-developed capacities to provide advice and information to technology users, has inadequate capacity to screen foreign technologies and is unable to formulate adequate technology-related policies or plans. There will be need for significantly increased skills at the enterprise level and in government institutions to address these shortcomings… Kenya’s industrial structure is characterized by an emphasis on low technology products, where technological knowledge is largely embodied in simple equipment, limited skill requirements and relatively self-contained operations. Despite its low technology emphasis, a large part
AAffrriiccaa''ss TTeecchhnnoollooggyy GGaapp
18
of Kenya’s industry is operating well within its available technological boundaries, although its technologies are largely outdated.” (Republic of Kenya, 1997)
Despite plans for reform and improvement, Kenya’s technology and capabilities lag behind those of many countries in Asia and Latin America. Technical dynamism is low: the private sector invests little in research and development and has few links with the official technology infrastructure. Government efforts in science and technology lack coherence and consequently do not have much relevance to industry. The institutions providing basic services and input into enterprise technological activity are weak. Because policies are focused mainly on the supply side of technology rather than on demand, productive enterprises are neither stimulated nor supported into upgrading their technological level and capacity.
The exceptions are a small number of firms that invest in upgrading technologies and training. However, they cannot pull along the whole industrial sector. The rest of the manufacturing sector continues to operate mainly by confining itself to activities where it does not directly compete with foreign producers i.e. resource-based products or small niche markets. These conditions do not provide a base for sustained growth, nor do they constitute an enabling environment for the diversification and upgrading of exports needed for long-term development.
B. Industrial background
In the mid-1960s Kenya adopted an import-substituting industrialization strategy. Fuelled by rising rural incomes and the trade agreement with neighboring Tanzania and Uganda, the strategy led to an above-average level of industrialization by regional standards,1 with food and beverages contributing 37 per cent of 1993 manufacturing value added and dominating the industrial structure. However, manufacturing growth and exports began to decline in the 1980s; the share of manufacturing in the gross domestic product stagnated at 13 per cent.
The manufacturing slowdown has been largely attributed to the inward-oriented strategy.2 Another contributing factor is the high level of protectionism, which distorted resource allocation, constricted foreign competition and restricted foreign technology inflows from abroad. Enterprises had few incentives to build technological capabilities and upgrade imported technologies. The large and inefficient parastatal sector in manufacturing obstructed growth. Recognizing the need for change, the Government was one of the first in sub-Saharan Africa to introduce import liberalization in 1980–84 as part of a World Bank structural adjustment programme. At first the liberalization was halting and intermittent; in the 1990s the Government began to show more commitment. The latest round has removed most quantitative restrictions to imports. Tariffs now range from 5 to 25 per cent, with lower rates (5–10 per cent) for most capital and intermediate goods, and higher rates for various agricultural and textile products and finished consumer electronics.3 Foreign exchange transactions are now largely left to the market.
1 The share of manufacturing in the gross domestic product averaged 12.3 per cent in 1975–80 compared to
about 10 per cent for sub-Saharan Africa as a whole. 2 For instance, a severe drought caused water and electricity shortages, prompting the introduction of energy
conservation measures in 1992. Access to imports was constricted because of a suspension of foreign aid in 1991. Coupled with weak export growth, this significantly reduced capacity utilization in manufacturing. See Wignaraja and Ikiara (1999).
3 However, effective duties on textile and clothing products are lower, because used (mitumba) products are smuggled. See Government of Kenya (1999).
TThhee CCaassee ooff KKeennyyaa
19
Economic performance has nevertheless continued to falter. Growth in the gross domestic product fell from 4.3 per cent in 1990 to 0.2 per cent in 1993, at which point the Government introduced further structural reforms, including the removal of price controls, import licensing and foreign exchange controls. Reforms were made, aimed at packaging more attractive investment incentives, streamlining public enterprises and strengthening financial institutions. These policies bore immediate fruit, with gross domestic product growing from 3 per cent in 1994 to 4.6 per cent in 1996. This level of growth, however, could not be sustained; in 1997, growth fell to 2.4 per cent (Central Bureau of Statistics, 1999). The industrial sector’s growth in 1998, only 1.4 per cent, was “a result of the sector’s inability to compete with low priced imports into the local market, depressed local market demand and a combination of infrastructural constraints” (Government of Kenya 1999).
The latest round of policy reforms has removed the anti-export bias; Sessional Paper No. 1 of 1994 calls for an “export bias” (UNIDO, 1999). Along with the promotion of the small-scale and jua kali (informal) sector, trade policy reform has become the centrepiece of industrial policy in Kenya. Trade liberalization has not only failed to stimulate manufactured exports, it has also led to retrenchment in activities directly exposed to import competition. Non-traditional exports based on agriculture are growing, as are manufacturing activities that serve sheltered or niche local and regional markets. The quantity index of manufactured exports in 1998 was actually 13.8 per cent below that of 1994 (Central Bureau of Statistics, 1999: 95). In the preceding period, weak export performance was attributed to the trade regime, lack of support for liberalization, macro-level instability and failure to develop competitive capabilities. Currently, it can be accounted for largely by weak domestic capabilities and the failure to attract inward foreign direct investment (FDI). The liberalization has led some larger Kenyan firms to increase their technological capabilities, but not enough to give dynamism to competitiveness and exports. The Asian model is not being replicated in Kenya, principally because of the weak base of technological capabilities.
C. Science and technology policies 1. Antecedents
Early science and technology programmes of the colonial Government focused on the agricultural sector, supporting cash crops like coffee, tea, sisal, wheat and livestock.4 In 1942 the colonial Government set up the East African Industrial Research Board and its affiliate, the East African Industrial Research Organization, the predecessor to the present Kenya Industrial Research and Development Institute. After World War II, however, technological efforts declined; the economy again became dependent on imported technologies and skills.
The National Research and Scientific Council was set up in 1977 as the umbrella organization of the semi-autonomous National Research Institutes and Advisory Research Committees. These included: the Kenya Agricultural Research Institute; the Kenya Trypanosomiasis Research Institute; the Kenya Forestry Research Institute; the Kenya Industrial Research and Development Institute, and the Kenya Marine and Fisheries Research Institute.
4 The following research institutions were set up: the Forest Department in 1902, Agricultural Laboratories in
1903, Coffee Research Services in 1910, the Njoro Plant Breeding Station in 1927 and the Tea Research Foundation in 1951.
AAffrriiccaa''ss TTeecchhnnoollooggyy GGaapp
20
The Ministry of Regional Development, Science and Technology was created in 1982, followed in 1987 by a Ministry of Research, Science and Technology to oversee all science and technology activities in Kenya.
2. Policy-making structure
Technology policy-making in Kenya is dispersed across three ministries and their various departments as following:
Ministry of Education, Science and Technology: Promotion of Research, Science and Technology; Technical Training Institutes; Commission for Higher Education; Technical Education; National Polytechnics; Research Authorisation, Co-ordination, Inventory and Dissemination; National Council for Science and Technology; and, Centre for Research and Technology
Ministry of Tourism, Trade and Industry: Export Processing Zone Authority; Kenya Industrial Training Institute; Kenya Industrial Estates; Kenya Investment Promotion Council; Kenya Bureau of Standards; Kenya Industrial Research and Development Research Institute; and, Kenya Industrial Property Office
Ministry of Labour and Human Resources Development: Youth Polythecnics; Institutes of Technology; Informal, Micro- and Small-Scale Enterprise Development; Directorate of Industrial Training; and, Directorate of Applied Technology
The overlapping jurisdictions lend to territorial conflicts. They tend to limit interdepartmental communication and stifle coherence and coordination in decision-making. While technology and higher education are under the same ministry, working relations are rather limited. There are technology bodies under both three different ministries, but the relations between and among the ministries are weak. Despite the fact that the Kenya Investment Promotion Council deals directly with FDI, it demonstrates little concern about technology issues. Moreover, there is no mechanism for analysing Kenya’s competitiveness relative to other countries, which would be useful for deriving practical technology policy needs.
On broader policy issues, reform of the trade regime clearly has direct effects on industrial restructuring and technological activity. However, the liberalization programme has not been directly linked with technology policies. There is minimal coordination between the pace of opening up in different activities and the mounting of technology support policies to boost competitiveness. Nor is liberalization related to strategies for creating competitive skills. Small and medium-sized enterprise programmes similarly lack preparatory strategies for exposure to world competition.
Such a lack of coherence and coordination in technology policies inhibits dynamic decision-making, especially in mounting timely strategic responses to changing market conditions, such as liberalization and globalization. A body capable of analysing technology needs at the broad economic level; designing strategies that cut across many ministerial and departmental lines; and, finally, implementing those strategies, is essential for improving the Government’s strategy-making capabilities. Much of the success of the Asian newly industrializing economies lies in their ability to mount a coordinated and timely strategic plan of action, often with input from the private sector and transactional investors.
3. Intellectual property regime
The industrial property regime in Kenya is embodied in a 1989 Act and is administered by the Kenyan Industrial Property Office, set up in 1990. The Kenyan
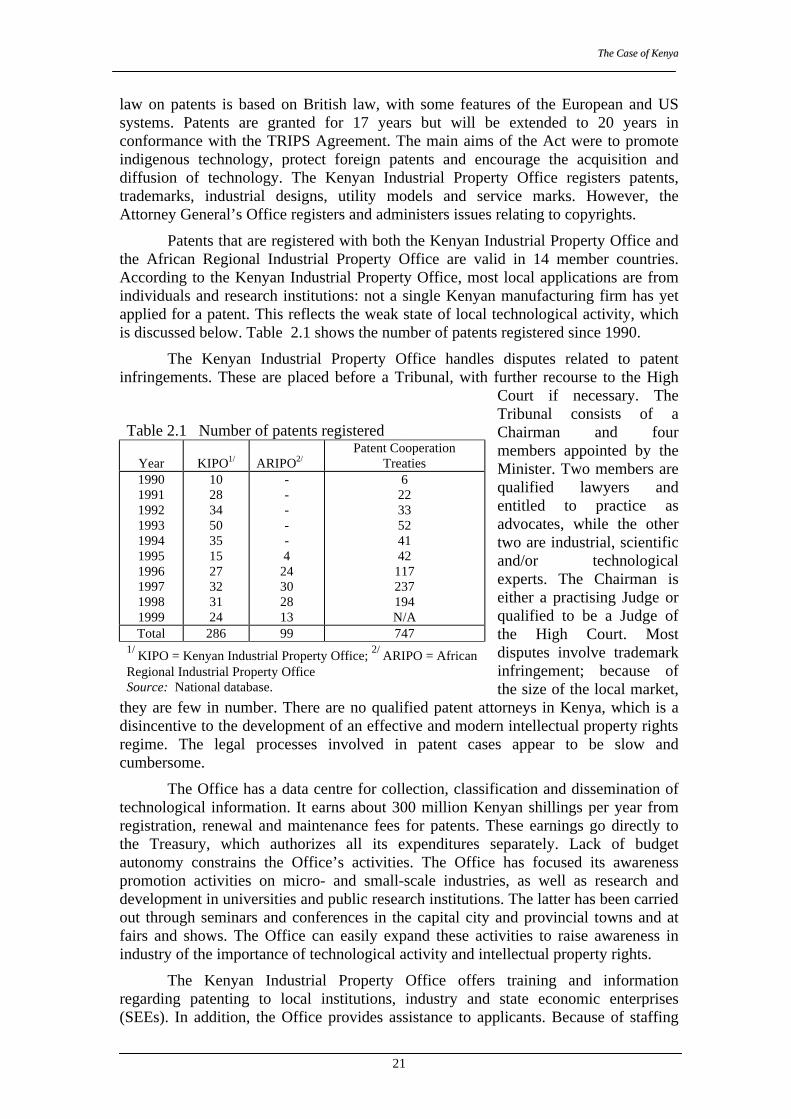
TThhee CCaassee ooff KKeennyyaa
21
law on patents is based on British law, with some features of the European and US systems. Patents are granted for 17 years but will be extended to 20 years in conformance with the TRIPS Agreement. The main aims of the Act were to promote indigenous technology, protect foreign patents and encourage the acquisition and diffusion of technology. The Kenyan Industrial Property Office registers patents, trademarks, industrial designs, utility models and service marks. However, the Attorney General’s Office registers and administers issues relating to copyrights.
Patents that are registered with both the Kenyan Industrial Property Office and the African Regional Industrial Property Office are valid in 14 member countries. According to the Kenyan Industrial Property Office, most local applications are from individuals and research institutions: not a single Kenyan manufacturing firm has yet applied for a patent. This reflects the weak state of local technological activity, which is discussed below. Table 2.1 shows the number of patents registered since 1990.
The Kenyan Industrial Property Office handles disputes related to patent infringements. These are placed before a Tribunal, with further recourse to the High
Court if necessary. The Tribunal consists of a Chairman and four members appointed by the Minister. Two members are qualified lawyers and entitled to practice as advocates, while the other two are industrial, scientific and/or technological experts. The Chairman is either a practising Judge or qualified to be a Judge of the High Court. Most disputes involve trademark infringement; because of the size of the local market,
they are few in number. There are no qualified patent attorneys in Kenya, which is a disincentive to the development of an effective and modern intellectual property rights regime. The legal processes involved in patent cases appear to be slow and cumbersome.
The Office has a data centre for collection, classification and dissemination of technological information. It earns about 300 million Kenyan shillings per year from registration, renewal and maintenance fees for patents. These earnings go directly to the Treasury, which authorizes all its expenditures separately. Lack of budget autonomy constrains the Office’s activities. The Office has focused its awareness promotion activities on micro- and small-scale industries, as well as research and development in universities and public research institutions. The latter has been carried out through seminars and conferences in the capital city and provincial towns and at fairs and shows. The Office can easily expand these activities to raise awareness in industry of the importance of technological activity and intellectual property rights.
The Kenyan Industrial Property Office offers training and information regarding patenting to local institutions, industry and state economic enterprises (SEEs). In addition, the Office provides assistance to applicants. Because of staffing
Table 2.1 Number of patents registered
Year
KIPO1/
ARIPO2/
Patent Cooperation Treaties
1990 1991 1992 1993 1994 1995 1996 1997 1998 1999
10 28 34 50 35 15 27 32 31 24
- - - - - 4
24 30 28 13
6 22 33 52 41 42
117 237 194 N/A
Total 286 99 747 1/ KIPO = Kenyan Industrial Property Office; 2/ ARIPO = African Regional Industrial Property Office Source: National database.
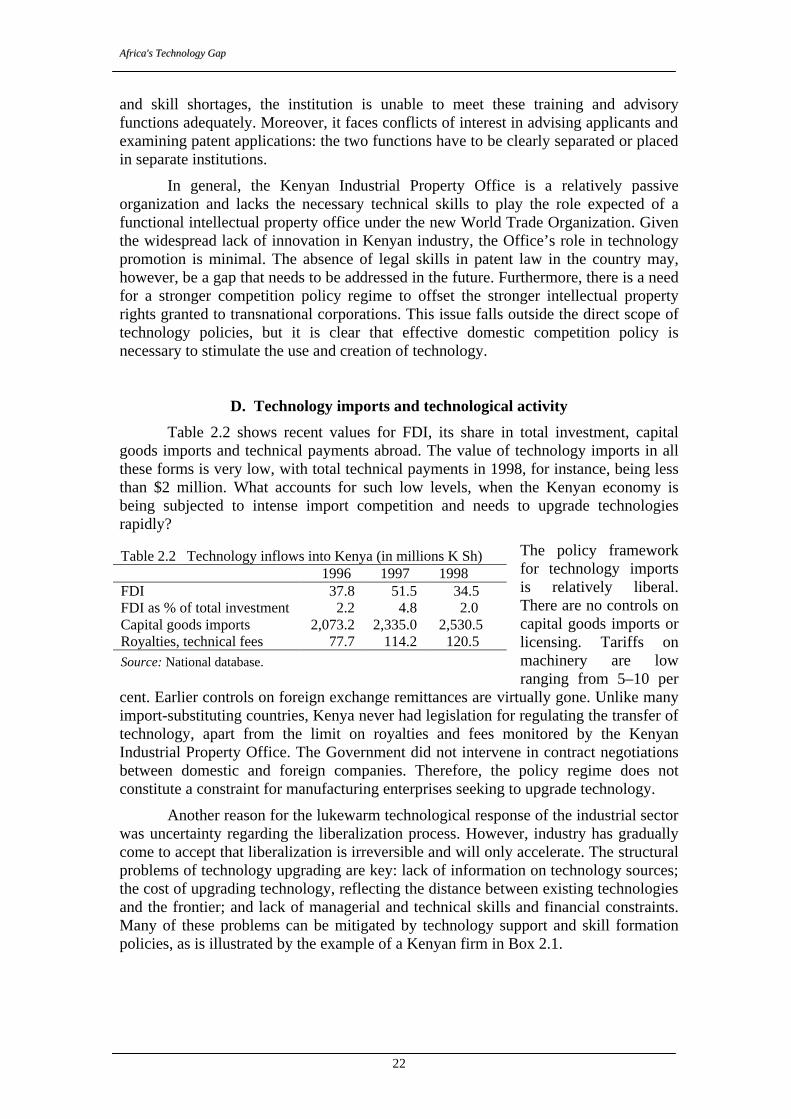
AAffrriiccaa''ss TTeecchhnnoollooggyy GGaapp
22
and skill shortages, the institution is unable to meet these training and advisory functions adequately. Moreover, it faces conflicts of interest in advising applicants and examining patent applications: the two functions have to be clearly separated or placed in separate institutions.
In general, the Kenyan Industrial Property Office is a relatively passive organization and lacks the necessary technical skills to play the role expected of a functional intellectual property office under the new World Trade Organization. Given the widespread lack of innovation in Kenyan industry, the Office’s role in technology promotion is minimal. The absence of legal skills in patent law in the country may, however, be a gap that needs to be addressed in the future. Furthermore, there is a need for a stronger competition policy regime to offset the stronger intellectual property rights granted to transnational corporations. This issue falls outside the direct scope of technology policies, but it is clear that effective domestic competition policy is necessary to stimulate the use and creation of technology.
D. Technology imports and technological activity
Table 2.2 shows recent values for FDI, its share in total investment, capital goods imports and technical payments abroad. The value of technology imports in all these forms is very low, with total technical payments in 1998, for instance, being less than $2 million. What accounts for such low levels, when the Kenyan economy is being subjected to intense import competition and needs to upgrade technologies rapidly?
The policy framework for technology imports is relatively liberal. There are no controls on capital goods imports or licensing. Tariffs on machinery are low ranging from 5–10 per
cent. Earlier controls on foreign exchange remittances are virtually gone. Unlike many import-substituting countries, Kenya never had legislation for regulating the transfer of technology, apart from the limit on royalties and fees monitored by the Kenyan Industrial Property Office. The Government did not intervene in contract negotiations between domestic and foreign companies. Therefore, the policy regime does not constitute a constraint for manufacturing enterprises seeking to upgrade technology.
Another reason for the lukewarm technological response of the industrial sector was uncertainty regarding the liberalization process. However, industry has gradually come to accept that liberalization is irreversible and will only accelerate. The structural problems of technology upgrading are key: lack of information on technology sources; the cost of upgrading technology, reflecting the distance between existing technologies and the frontier; and lack of managerial and technical skills and financial constraints. Many of these problems can be mitigated by technology support and skill formation policies, as is illustrated by the example of a Kenyan firm in Box 2.1.
Table 2.2 Technology inflows into Kenya (in millions K Sh) 1996 1997 1998 FDI 37.8 51.5 34.5 FDI as % of total investment 2.2 4.8 2.0 Capital goods imports 2,073.2 2,335.0 2,530.5 Royalties, technical fees 77.7 114.2 120.5 Source: National database.
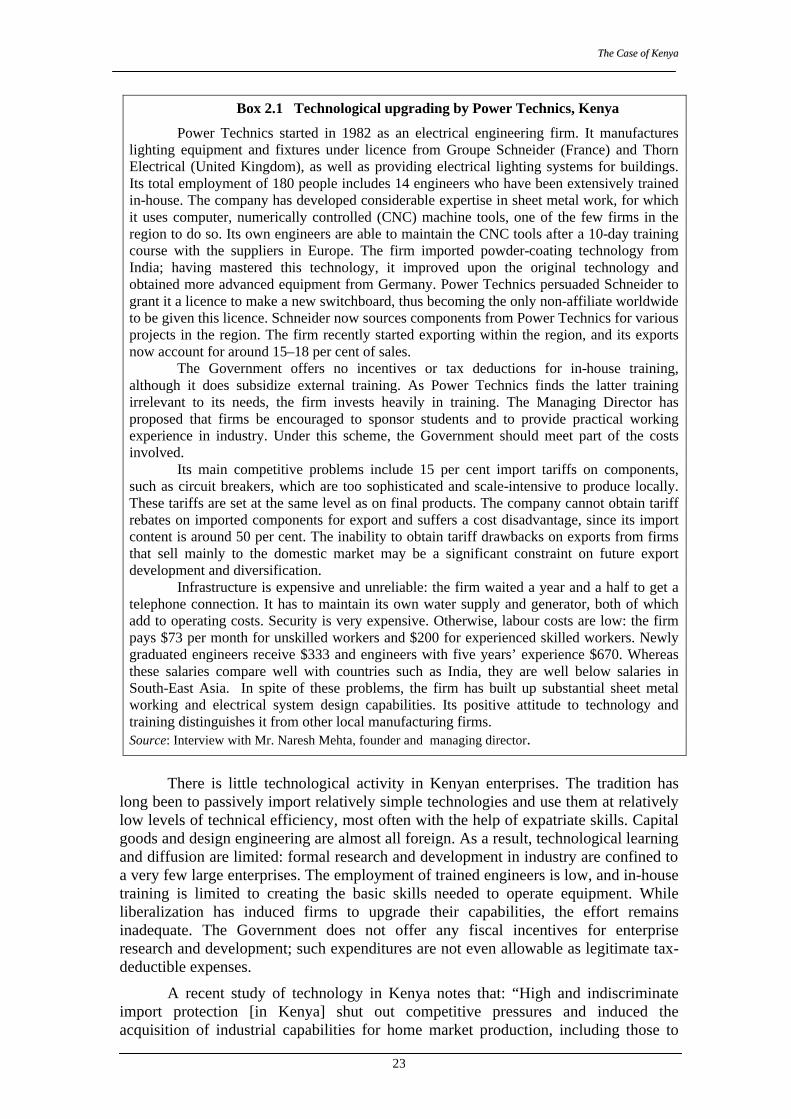
TThhee CCaassee ooff KKeennyyaa
23
Box 2.1 Technological upgrading by Power Technics, Kenya
Power Technics started in 1982 as an electrical engineering firm. It manufactures lighting equipment and fixtures under licence from Groupe Schneider (France) and Thorn Electrical (United Kingdom), as well as providing electrical lighting systems for buildings. Its total employment of 180 people includes 14 engineers who have been extensively trained in-house. The company has developed considerable expertise in sheet metal work, for which it uses computer, numerically controlled (CNC) machine tools, one of the few firms in the region to do so. Its own engineers are able to maintain the CNC tools after a 10-day training course with the suppliers in Europe. The firm imported powder-coating technology from India; having mastered this technology, it improved upon the original technology and obtained more advanced equipment from Germany. Power Technics persuaded Schneider to grant it a licence to make a new switchboard, thus becoming the only non-affiliate worldwide to be given this licence. Schneider now sources components from Power Technics for various projects in the region. The firm recently started exporting within the region, and its exports now account for around 15–18 per cent of sales.
The Government offers no incentives or tax deductions for in-house training, although it does subsidize external training. As Power Technics finds the latter training irrelevant to its needs, the firm invests heavily in training. The Managing Director has proposed that firms be encouraged to sponsor students and to provide practical working experience in industry. Under this scheme, the Government should meet part of the costs involved.
Its main competitive problems include 15 per cent import tariffs on components, such as circuit breakers, which are too sophisticated and scale-intensive to produce locally. These tariffs are set at the same level as on final products. The company cannot obtain tariff rebates on imported components for export and suffers a cost disadvantage, since its import content is around 50 per cent. The inability to obtain tariff drawbacks on exports from firms that sell mainly to the domestic market may be a significant constraint on future export development and diversification.
Infrastructure is expensive and unreliable: the firm waited a year and a half to get a telephone connection. It has to maintain its own water supply and generator, both of which add to operating costs. Security is very expensive. Otherwise, labour costs are low: the firm pays $73 per month for unskilled workers and $200 for experienced skilled workers. Newly graduated engineers receive $333 and engineers with five years’ experience $670. Whereas these salaries compare well with countries such as India, they are well below salaries in South-East Asia. In spite of these problems, the firm has built up substantial sheet metal working and electrical system design capabilities. Its positive attitude to technology and training distinguishes it from other local manufacturing firms. Source: Interview with Mr. Naresh Mehta, founder and managing director.
There is little technological activity in Kenyan enterprises. The tradition has
long been to passively import relatively simple technologies and use them at relatively low levels of technical efficiency, most often with the help of expatriate skills. Capital goods and design engineering are almost all foreign. As a result, technological learning and diffusion are limited: formal research and development in industry are confined to a very few large enterprises. The employment of trained engineers is low, and in-house training is limited to creating the basic skills needed to operate equipment. While liberalization has induced firms to upgrade their capabilities, the effort remains inadequate. The Government does not offer any fiscal incentives for enterprise research and development; such expenditures are not even allowable as legitimate tax-deductible expenses.
A recent study of technology in Kenya notes that: “High and indiscriminate import protection [in Kenya] shut out competitive pressures and induced the acquisition of industrial capabilities for home market production, including those to
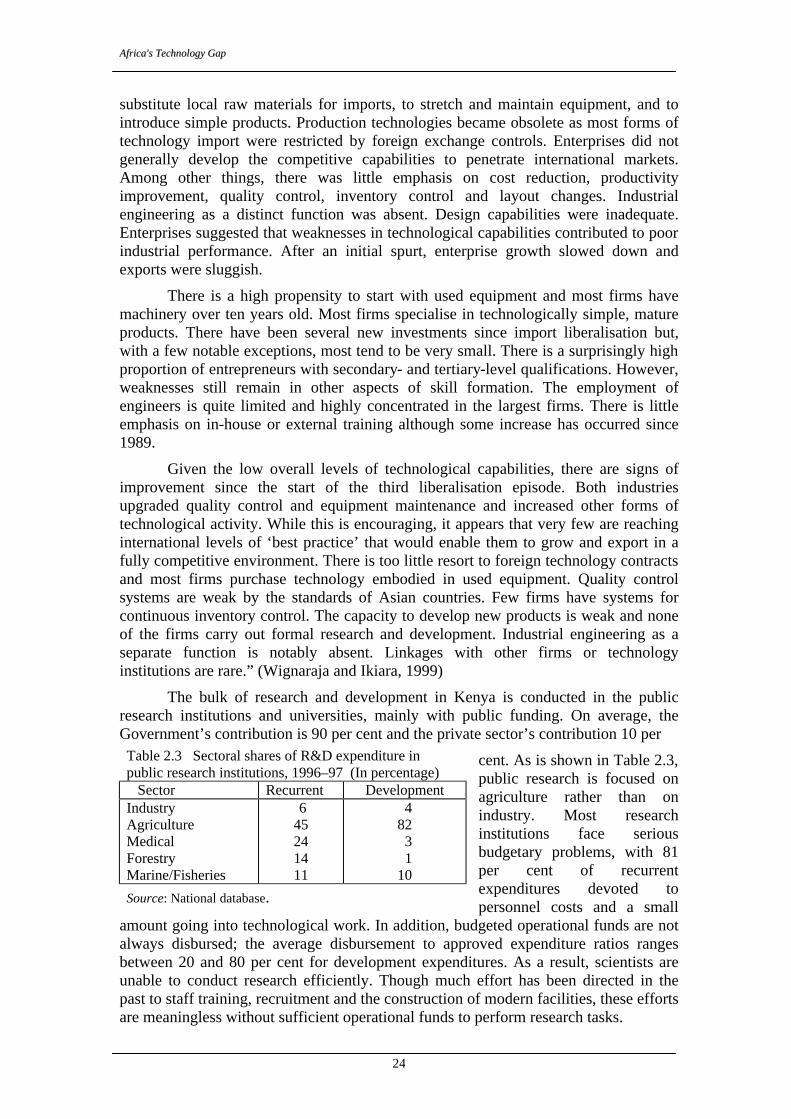
AAffrriiccaa''ss TTeecchhnnoollooggyy GGaapp
24
substitute local raw materials for imports, to stretch and maintain equipment, and to introduce simple products. Production technologies became obsolete as most forms of technology import were restricted by foreign exchange controls. Enterprises did not generally develop the competitive capabilities to penetrate international markets. Among other things, there was little emphasis on cost reduction, productivity improvement, quality control, inventory control and layout changes. Industrial engineering as a distinct function was absent. Design capabilities were inadequate. Enterprises suggested that weaknesses in technological capabilities contributed to poor industrial performance. After an initial spurt, enterprise growth slowed down and exports were sluggish.
There is a high propensity to start with used equipment and most firms have machinery over ten years old. Most firms specialise in technologically simple, mature products. There have been several new investments since import liberalisation but, with a few notable exceptions, most tend to be very small. There is a surprisingly high proportion of entrepreneurs with secondary- and tertiary-level qualifications. However, weaknesses still remain in other aspects of skill formation. The employment of engineers is quite limited and highly concentrated in the largest firms. There is little emphasis on in-house or external training although some increase has occurred since 1989.
Given the low overall levels of technological capabilities, there are signs of improvement since the start of the third liberalisation episode. Both industries upgraded quality control and equipment maintenance and increased other forms of technological activity. While this is encouraging, it appears that very few are reaching international levels of ‘best practice’ that would enable them to grow and export in a fully competitive environment. There is too little resort to foreign technology contracts and most firms purchase technology embodied in used equipment. Quality control systems are weak by the standards of Asian countries. Few firms have systems for continuous inventory control. The capacity to develop new products is weak and none of the firms carry out formal research and development. Industrial engineering as a separate function is notably absent. Linkages with other firms or technology institutions are rare.” (Wignaraja and Ikiara, 1999)
The bulk of research and development in Kenya is conducted in the public research institutions and universities, mainly with public funding. On average, the Government’s contribution is 90 per cent and the private sector’s contribution 10 per
cent. As is shown in Table 2.3, public research is focused on agriculture rather than on industry. Most research institutions face serious budgetary problems, with 81 per cent of recurrent expenditures devoted to personnel costs and a small
amount going into technological work. In addition, budgeted operational funds are not always disbursed; the average disbursement to approved expenditure ratios ranges between 20 and 80 per cent for development expenditures. As a result, scientists are unable to conduct research efficiently. Though much effort has been directed in the past to staff training, recruitment and the construction of modern facilities, these efforts are meaningless without sufficient operational funds to perform research tasks.
Table 2.3 Sectoral shares of R&D expenditure in public research institutions, 1996–97 (In percentage) Sector Recurrent Development Industry Agriculture Medical Forestry Marine/Fisheries
6 45 24 14 11
4 82 3 1 10
Source: National database.
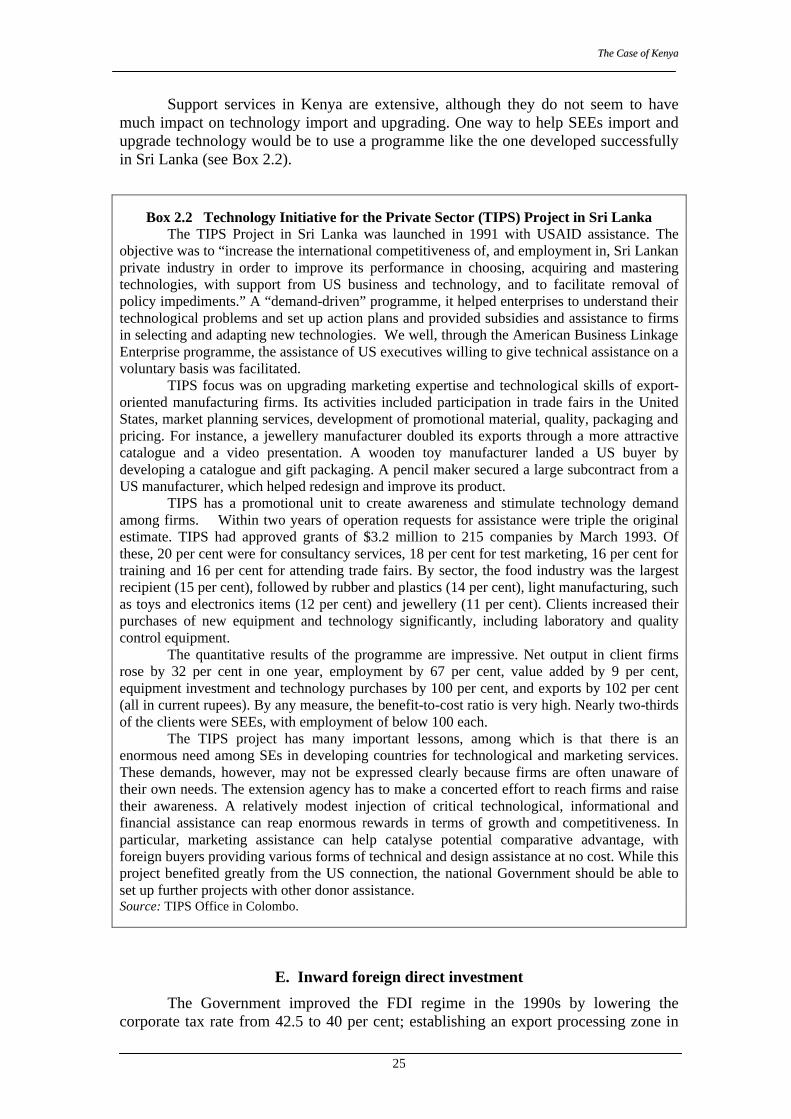
TThhee CCaassee ooff KKeennyyaa
25
Support services in Kenya are extensive, although they do not seem to have much impact on technology import and upgrading. One way to help SEEs import and upgrade technology would be to use a programme like the one developed successfully in Sri Lanka (see Box 2.2).
Box 2.2 Technology Initiative for the Private Sector (TIPS) Project in Sri Lanka The TIPS Project in Sri Lanka was launched in 1991 with USAID assistance. The
objective was to “increase the international competitiveness of, and employment in, Sri Lankan private industry in order to improve its performance in choosing, acquiring and mastering technologies, with support from US business and technology, and to facilitate removal of policy impediments.” A “demand-driven” programme, it helped enterprises to understand their technological problems and set up action plans and provided subsidies and assistance to firms in selecting and adapting new technologies. We well, through the American Business Linkage Enterprise programme, the assistance of US executives willing to give technical assistance on a voluntary basis was facilitated.
TIPS focus was on upgrading marketing expertise and technological skills of export-oriented manufacturing firms. Its activities included participation in trade fairs in the United States, market planning services, development of promotional material, quality, packaging and pricing. For instance, a jewellery manufacturer doubled its exports through a more attractive catalogue and a video presentation. A wooden toy manufacturer landed a US buyer by developing a catalogue and gift packaging. A pencil maker secured a large subcontract from a US manufacturer, which helped redesign and improve its product.
TIPS has a promotional unit to create awareness and stimulate technology demand among firms. Within two years of operation requests for assistance were triple the original estimate. TIPS had approved grants of $3.2 million to 215 companies by March 1993. Of these, 20 per cent were for consultancy services, 18 per cent for test marketing, 16 per cent for training and 16 per cent for attending trade fairs. By sector, the food industry was the largest recipient (15 per cent), followed by rubber and plastics (14 per cent), light manufacturing, such as toys and electronics items (12 per cent) and jewellery (11 per cent). Clients increased their purchases of new equipment and technology significantly, including laboratory and quality control equipment.
The quantitative results of the programme are impressive. Net output in client firms rose by 32 per cent in one year, employment by 67 per cent, value added by 9 per cent, equipment investment and technology purchases by 100 per cent, and exports by 102 per cent (all in current rupees). By any measure, the benefit-to-cost ratio is very high. Nearly two-thirds of the clients were SEEs, with employment of below 100 each.
The TIPS project has many important lessons, among which is that there is an enormous need among SEs in developing countries for technological and marketing services. These demands, however, may not be expressed clearly because firms are often unaware of their own needs. The extension agency has to make a concerted effort to reach firms and raise their awareness. A relatively modest injection of critical technological, informational and financial assistance can reap enormous rewards in terms of growth and competitiveness. In particular, marketing assistance can help catalyse potential comparative advantage, with foreign buyers providing various forms of technical and design assistance at no cost. While this project benefited greatly from the US connection, the national Government should be able to set up further projects with other donor assistance. Source: TIPS Office in Colombo.
E. Inward foreign direct investment
The Government improved the FDI regime in the 1990s by lowering the corporate tax rate from 42.5 to 40 per cent; establishing an export processing zone in
AAffrriiccaa''ss TTeecchhnnoollooggyy GGaapp
26
1990 to attract export-oriented investors, and offering incentives such as 10-year tax holidays on exports, exemption from withholding tax on dividends for 10 years, exemption from value-added tax, duty-free access to inputs, the right to establish foreign currency accounts, and work permits for expatriate employees. The Kenya Investment Promotion Centre was established in 1985 to provide a one-stop facility for foreign investors. Foreign investments were guaranteed against nationalization and all after-tax profits could be repatriated under the Foreign Investment Protection Act. There are now no legal restrictions in manufacturing on activity or ownership shares. A new Investment Code is under consideration to further improve the investment climate.
However, these improvements have not resulted in sustained increases in FDI inflows, due to several remaining bureaucratic impediments. A large number of specific licences are needed before a foreign investor can set up; land title transfer and registration, for instance, can take from six months to eight years (TSG, 1998). The granting of investment incentives is variable, with discretionary, case-by-case operations that give rise to delays and non-transparent procedures. It is still difficult and cumbersome to obtain expatriate permits, an increasingly important determinant of FDI location as technical change makes it imperative to move skilled personnel quickly. A survey of business executives by the World Economic Forum (1998) for its African Competitiveness Report identifies corruption, crime, political instability and weak infrastructure as the main constraints on Kenya’s competitiveness and FDI prospects.
Perhaps the most striking example of a developing country attracting and using FDI to upgrade its competitiveness and technological structure is that of Singapore. While Singapore is now a high-income country, it is worth remembering that just 40 years ago it was a poor economy with no natural resources and dim growth prospects. Much of its success has resulted from its ability to mount a concerted industrial policy based on FDI (see Box 2.3).
The Kenya Investment Promotion Council, which recently moved from the Ministry of Finance to the Ministry of Tourism, Trade and Industry, offers facilitation and registration services. Registration is neither compulsory nor necessary for obtaining incentives. Some investors use their own sources of information and assistance; others use Kenya Investment Promotion Council assistance for legal formalities, licences and permits. The Council has no direct influence over other ministries and so is relatively ineffective in speeding up the bureaucratic process. The new Investment Code, which compels every concerned ministry to respond to the Council’s requests within 14 days, may improve the situation.
The Kenya Investment Promotion Council does not practise investor targeting. It lacks the skills and capabilities to evaluate investors, and it does not have a strategy for assigning investment or investor priorities. Its budget, which was under $1 million in 2000, does not allow for investment on either promotion activities or travel abroad. By comparison, the Singapore Economic Development Board has an annual budget of $34.2 million, the Malaysian Industrial Development Authority one of $11 million and the Mauritius Export Development and Investment Authority one of $3.1 million
Of the Kenya Investment Promotion Council’s staff of 65, only 14 are officers, mostly economists and marketing specialists. Their skills profiles are not necessarily suited to the task of aggressive investment promotion. Salary scales are tied to that of the rest of the Government and may prevent the Kenya Investment Promotion Council from attracting appropriate employees from the private sector. The information base on potential investors at the country or company level is very weak.
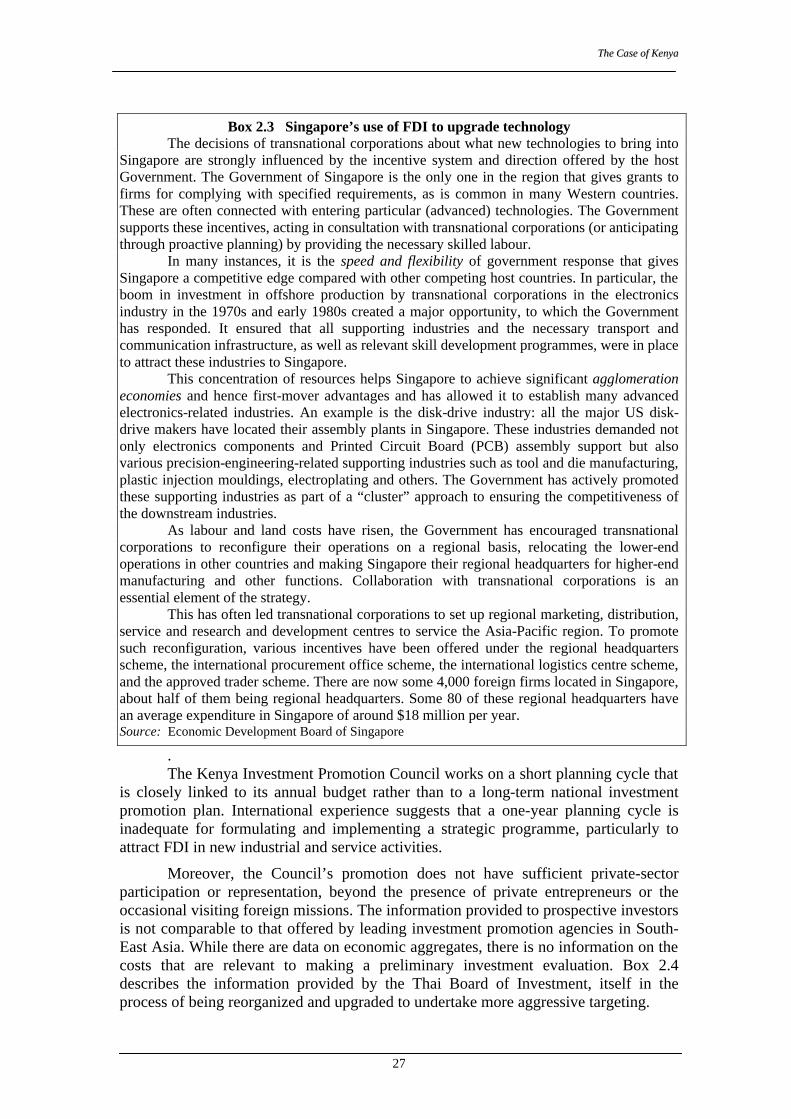
TThhee CCaassee ooff KKeennyyaa
27
Box 2.3 Singapore’s use of FDI to upgrade technology
The decisions of transnational corporations about what new technologies to bring into Singapore are strongly influenced by the incentive system and direction offered by the host Government. The Government of Singapore is the only one in the region that gives grants to firms for complying with specified requirements, as is common in many Western countries. These are often connected with entering particular (advanced) technologies. The Government supports these incentives, acting in consultation with transnational corporations (or anticipating through proactive planning) by providing the necessary skilled labour.
In many instances, it is the speed and flexibility of government response that gives Singapore a competitive edge compared with other competing host countries. In particular, the boom in investment in offshore production by transnational corporations in the electronics industry in the 1970s and early 1980s created a major opportunity, to which the Government has responded. It ensured that all supporting industries and the necessary transport and communication infrastructure, as well as relevant skill development programmes, were in place to attract these industries to Singapore.
This concentration of resources helps Singapore to achieve significant agglomeration economies and hence first-mover advantages and has allowed it to establish many advanced electronics-related industries. An example is the disk-drive industry: all the major US disk-drive makers have located their assembly plants in Singapore. These industries demanded not only electronics components and Printed Circuit Board (PCB) assembly support but also various precision-engineering-related supporting industries such as tool and die manufacturing, plastic injection mouldings, electroplating and others. The Government has actively promoted these supporting industries as part of a “cluster” approach to ensuring the competitiveness of the downstream industries.
As labour and land costs have risen, the Government has encouraged transnational corporations to reconfigure their operations on a regional basis, relocating the lower-end operations in other countries and making Singapore their regional headquarters for higher-end manufacturing and other functions. Collaboration with transnational corporations is an essential element of the strategy.
This has often led transnational corporations to set up regional marketing, distribution, service and research and development centres to service the Asia-Pacific region. To promote such reconfiguration, various incentives have been offered under the regional headquarters scheme, the international procurement office scheme, the international logistics centre scheme, and the approved trader scheme. There are now some 4,000 foreign firms located in Singapore, about half of them being regional headquarters. Some 80 of these regional headquarters have an average expenditure in Singapore of around $18 million per year. Source: Economic Development Board of Singapore
. The Kenya Investment Promotion Council works on a short planning cycle that
is closely linked to its annual budget rather than to a long-term national investment promotion plan. International experience suggests that a one-year planning cycle is inadequate for formulating and implementing a strategic programme, particularly to attract FDI in new industrial and service activities.
Moreover, the Council’s promotion does not have sufficient private-sector participation or representation, beyond the presence of private entrepreneurs or the occasional visiting foreign missions. The information provided to prospective investors is not comparable to that offered by leading investment promotion agencies in South-East Asia. While there are data on economic aggregates, there is no information on the costs that are relevant to making a preliminary investment evaluation. Box 2.4 describes the information provided by the Thai Board of Investment, itself in the process of being reorganized and upgraded to undertake more aggressive targeting.
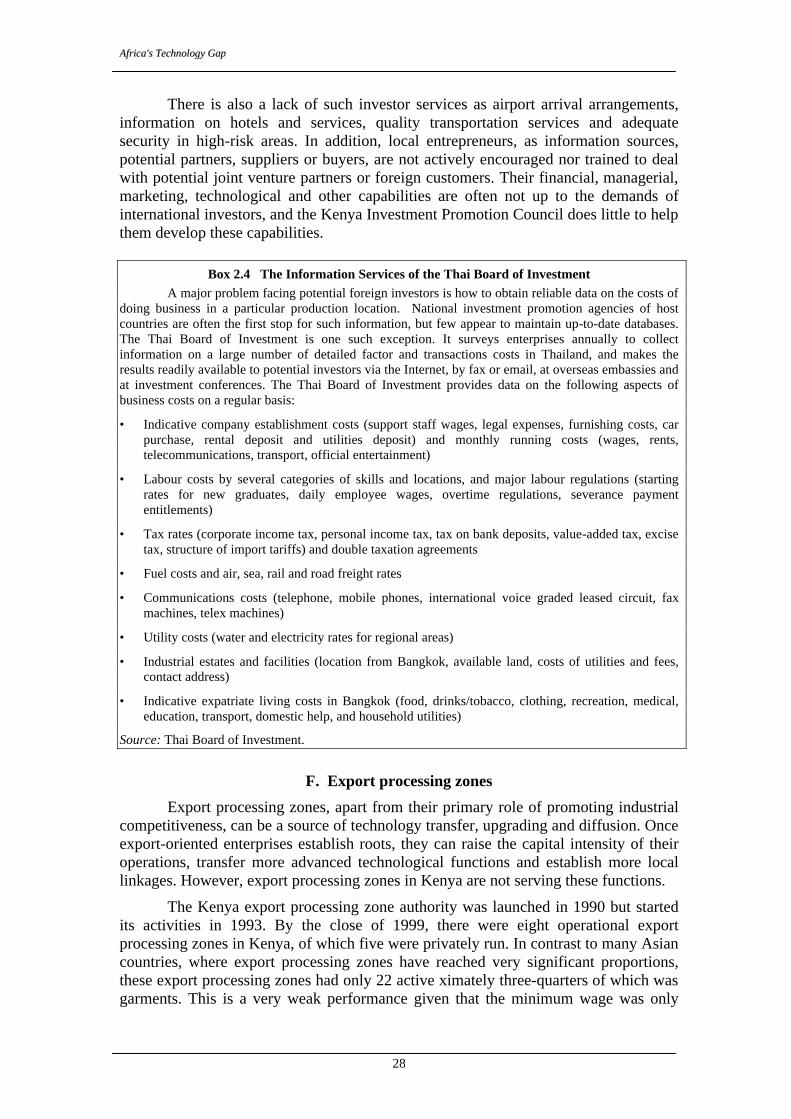
AAffrriiccaa''ss TTeecchhnnoollooggyy GGaapp
28
There is also a lack of such investor services as airport arrival arrangements, information on hotels and services, quality transportation services and adequate security in high-risk areas. In addition, local entrepreneurs, as information sources, potential partners, suppliers or buyers, are not actively encouraged nor trained to deal with potential joint venture partners or foreign customers. Their financial, managerial, marketing, technological and other capabilities are often not up to the demands of international investors, and the Kenya Investment Promotion Council does little to help them develop these capabilities.
Box 2.4 The Information Services of the Thai Board of Investment
A major problem facing potential foreign investors is how to obtain reliable data on the costs of doing business in a particular production location. National investment promotion agencies of host countries are often the first stop for such information, but few appear to maintain up-to-date databases. The Thai Board of Investment is one such exception. It surveys enterprises annually to collect information on a large number of detailed factor and transactions costs in Thailand, and makes the results readily available to potential investors via the Internet, by fax or email, at overseas embassies and at investment conferences. The Thai Board of Investment provides data on the following aspects of business costs on a regular basis:
• Indicative company establishment costs (support staff wages, legal expenses, furnishing costs, car purchase, rental deposit and utilities deposit) and monthly running costs (wages, rents, telecommunications, transport, official entertainment)
• Labour costs by several categories of skills and locations, and major labour regulations (starting rates for new graduates, daily employee wages, overtime regulations, severance payment entitlements)
• Tax rates (corporate income tax, personal income tax, tax on bank deposits, value-added tax, excise tax, structure of import tariffs) and double taxation agreements
• Fuel costs and air, sea, rail and road freight rates
• Communications costs (telephone, mobile phones, international voice graded leased circuit, fax machines, telex machines)
• Utility costs (water and electricity rates for regional areas)
• Industrial estates and facilities (location from Bangkok, available land, costs of utilities and fees, contact address)
• Indicative expatriate living costs in Bangkok (food, drinks/tobacco, clothing, recreation, medical, education, transport, domestic help, and household utilities)
Source: Thai Board of Investment.
F. Export processing zones
Export processing zones, apart from their primary role of promoting industrial competitiveness, can be a source of technology transfer, upgrading and diffusion. Once export-oriented enterprises establish roots, they can raise the capital intensity of their operations, transfer more advanced technological functions and establish more local linkages. However, export processing zones in Kenya are not serving these functions.
The Kenya export processing zone authority was launched in 1990 but started its activities in 1993. By the close of 1999, there were eight operational export processing zones in Kenya, of which five were privately run. In contrast to many Asian countries, where export processing zones have reached very significant proportions, these export processing zones had only 22 active ximately three-quarters of which was garments. This is a very weak performance given that the minimum wage was only
TThhee CCaassee ooff KKeennyyaa
29
$1.50 a day.5 The total number of employees was 3,860, 60 per cent of whom were female. Major obstacles included infrastructure and bureaucratic procedures.
G. Technology infrastructure
The two main institutions providing technology support to the manufacturing sector are the Kenya Bureau of Standards and the Kenya Industrial Research and Development Institute.
1. The Kenya Bureau of Standards6
The standards and metrology system provides essential infrastructure services for technology and industry in any country. Standards are the basic technical “language” that allows firms to communicate specifications to each other and achieve economies of scale. In a developing country, the spread of standardization can encourage technology diffusion and raise the use of local inputs that meet the relevant standards. Metrology services consist of calibrating, measuring and control instruments. These services are essential for maintaining quality, their international compatibility ensuring product credibility in export markets. Testing services are essential for quality control and certification in local and foreign markets. Quality management standards like the International Standards Organization 9000 and 14000 series are becoming important assets in international competitiveness. In the absence of strong local standards institutions, industry has to use imported services at high cost and can lag in quality control. The active promotion of standards to SEs can be an important tool of technology diffusion.
The Kenya Bureau of Standards was set up in 1974 to develop standards; provide testing and metrological services; and help the industrial sector with quality management and standardization. By the end of 1999, it had developed around 2,000 standards and was the repository of 150,000 international and foreign standards. It operates a product certification scheme and can provide a Diamond Mark of Quality, a Quality System Certification Mark, a Calibration Mark and a Safety Mark. Seven lead assessors are able to provide International Standards Organization 9000 certification, which has been granted to 10 companies. The Bureau’s quality control laboratories provide testing facilities that have capabilities in a range of areas relevant to Kenyan needs but are rather limited in terms of new technologies. The Metrology Division maintains national measurement standards, serving industries in Kenya, as well as other countries, with calibration services. Two Kenya Bureau of Standards laboratories (the Volume and Flow Laboratory and the Alternating Current/Direct Current Laboratory) have been accredited by German calibration services. The Bureau also repairs and maintains measuring instruments for industry and provides a range of training courses for industry.
The Kenya Bureau of Standards is funded by a standards levy on all manufacturers, which is calculated at 0.2 per cent of ex-factory sales up to a yearly ceiling of $4,000. Other sources of support are inspection fees, government grants and receipts for services sold to industry. While it is difficult to evaluate the institution’s technical capabilities, it appears that a relatively small proportion of Kenyan firms demand its services or interact with it in other ways. Awareness among enterprises of the importance of product quality is low. Moreover, there is a perceived inflexible
5 Mauritius had over $1.5 billion of clothing exports in that year, with much higher wages. 6 The Kenya Bureau of Standards site www.kebs.org provides background information on this institution.
AAffrriiccaa''ss TTeecchhnnoollooggyy GGaapp
30
bureaucratic approach to service provision. Firms that tried to use Kenya Bureau of Standards services some years ago complained of long delays (Wignaraja and Ikiara, 1999). There is no clear assessment of either the suitability of Kenya Bureau of Standards testing facilities for evolving industrial needs or the acceptability of all the tests performed. The paucity of testing centres in the regions has created difficulties for industries located outside major urban areas.
The implementation of standards faces problems of skill availability and weak quality culture in industry. The Kenya Bureau of Standards has started its own training scheme and has sent people to Japan and Sweden for further training. While trained employees often leave the Kenya Bureau of Standards for private industry because of salary differentials, some return because work at the Bureau is more satisfying.
2. The Kenya Industrial Research and Development Institute
The Kenya Industrial Research and Development Institute, the main such institute in Kenya, is one of eight such institutes established in 1979 after the break-up of the East African Community. Its mission was “to enhance the national industrial innovation process through the development of a sufficient national capacity in disembodied and embodied industrial technologies for the attainment of a self-sustaining industrialisation process” (Kenya Industrial Research and Development Institute, 1999). Until the mid-1990s, its main focus was food processing and chemicals. The Institute admits that this work had little impact on industrial technologies in use: large industrial companies relied on foreign sources of technology, while SEs had little to do with the Institute. A study (Bwisa and Gacuhi, 1997) confirms the lack of links between research institutes/universities and industry in Kenya.
In 1994, a team from the United Kingdom examined the research and development institutions in Kenya. Their findings led the Government to reorient the institutions to meet industrial needs. The Kenya Industrial Research and Development Institute was placed under a new director, who redefined its focus from research and development to industrial technology support and thoroughly revamped the organization. The Institute has subsequently become strongly market-oriented, with all work funded by projects. Approximately 50 per cent of its work is contracted by the Government; the remainder comes from aid donors and industry (in about equal shares). The Institute has also launched a joint project with the European Union on food research. The reorganization involved substantial retrenchment, from 700 to 289 employees, with almost all the losses involving support staff rather than technical personnel. Productivity indicators, based on impact on industry rather than research publications, were implemented. These indicators led to a 10-fold increase in demonstrated productivity.
There are six centres in the Kenya Industrial Research and Development Institute. The Engineering Development and Services Centre makes dies, tools, jigs, spares and prototypes for industry. The Leather Development Centre offers training services to industry and demonstrations of leather-processing techniques. The National Industrial Information Centre offers various types of search and library services. The Laboratory Services Centre provides analytical and quality control laboratory services. The Industrial Plant and Machinery Unit conducts economic feasibility and appraisal studies and has links with sources of financing for new projects. The Traditional Food Development Centre promotes traditional food-processing technologies.
TThhee CCaassee ooff KKeennyyaa
31
All divisions offer consultancy services and are allowed to retain all their earnings except for costs and a 15 per cent overhead fee. Each staff member is assigned work targets, with salary increases tied to achievement. The average achievement rate is around 60 per cent; staff members unable to meet 30 per cent of targets are dismissed. The use of part-time advisors from private industry has proven successful. With this reorganization, industrial demand for Institute services has increased significantly; there is currently a waiting list. Whereas the main demand has been from SEs, large firms have recently started to approach the Institute for help with energy and environmental audits and waste management.
The Institute’s main internal constraint is the lack of trained personnel, which results from low salaries (Kenya Industrial Research and Development Institute, 1999). It proposes to raise remuneration to market levels. In addition, it is intensifying its efforts in training and in obtaining ISO 9000 certification for its various divisions, as well as in packaging technologies for use by enterprises. Its broad strategy for technology development; as spelled out in its "National Industrial Research Programmes" is focused on local-resource-based activities such as food processing. Identifying the lack of information as the major barrier to technology development, it proposes to establish a database for industrial technologies and a stakeholder network of small and medium-sized enterprises to strengthen linkages.
In sum, the reorganization and reorientation of the Kenya Industrial Research and Development Institute under a dynamic new director have transformed the institution, making it much more useful to industry. However, the concentration on industrial support services has meant that there is no institution in the country conducting research and development. This absence will become significant when the industrial sector deepens and grows more competitive. The strong focus on SEEs and resource-based activities, too, may be desirable at this stage but neglects the more dynamic and technology-intensive areas of manufacturing, such as machinery and electronics, and potential export products in the clothing and footwear industries (many of which have been killed off by liberalization). The Institute does not offer much modern technical competence, particularly in modern electronics and information technologies.
The Kenya Industrial Research and Development Institute has been unable to arouse any technological interest, apart from testing, in transnational corporation affiliates in Kenya. These rely on internal and parent-company resources for all their technological needs. The lack of a strong local capital goods industry is a major constraint on sustained technology development, which needs the capability to manufacture and adapt equipment. In general, the lack of technological innovation in private industry is the main constraint on the provision of technology support by research and development institutions. Without a more dynamic technology culture in private industry, an institution such as the Kenya Industrial Research and Development Institute cannot provide much more than mundane technical services.
3. Universities and colleges
The Kenyan post-secondary educational institutions are largely oriented towards general arts and sciences, with technical and engineering enrolments constituting a small part of the total (Wignaraja and Ikiara, 1999). The three premier institutions for training technical manpower are Kenya Polytechnic and the Departments of Engineering of the University of Nairobi and the Jomo Kenyatta University of Agriculture and Technology. All three universities have a small number
AAffrriiccaa''ss TTeecchhnnoollooggyy GGaapp
32
of engineering graduates. Kenya Polytechnic is the leader for middle-level technical manpower, producing diploma holders in the mechanical, electrical, automotive, aeronautical, telecommunications, building and civil engineering fields.
Apart from training, most of these technical institutes provide little or no research or technical services to industry. A recent survey revealed that the proportion of research and development to total university budgets had declined from an average of 1 per cent in the 1980s to around 0.5 per cent in the 1990s. The institutions directly involved with technology development are poorly funded. Staff members have few incentives to work on industrial technological problems or interact with firms. Their administrative structures and facilities do not encourage them to do such work, and laboratory facilities are poor. Low salaries make it difficult to recruit or retain good staffers. Furthermore, there are no funds available for commercializing research findings.
Firms do not perceive academic institutions as technology sources. Moreover, because of the absence of a technology culture in industry, firms do not seek technical information and support. There are a number of deterrents to linkages between universities and firms. On the academic side, the following are lacking: multi-disciplinary departments that can address the complex problems of productive enterprises; an understanding by university staff members of business practices, time pressures, commercialization and confidentiality; flexibility within universities in appointing, promoting and remunerating employees so as to make links with industry more attractive; recognition of the value of such linkages; and, in the area of publications, a more enlightened perspective regarding academic freedom and the needs of industry. On the part of industry, there is need to cultivate technology awareness and appreciation, encourage collaborations or contracts with universities, and support the growth of domestic capability.
4. Technology infrastructure: a summary of the issues
Kenya’s technology infrastructure is small by Asian standards but relatively advanced by most African standards. As it is, it generates little for the Kenyan industry and fails to assist firms in accessing, adapting and improving foreign technologies. Apart from essential testing functions performed by the Kenya Bureau of Standards, it traditionally has had few direct relations with the productive sector.
The Kenya Bureau of Standards seems reasonably competent in the limited range of functions it undertakes, but it is difficult to evaluate whether it would be able to provide testing and calibration services to a more complex industrial sector. Nor is it possible to judge how well the Bureau is promoting quality awareness and the use of standards throughout industry. Ideally, its testing functions should be placed in a separate institution or handed over completely to private testing laboratories. The Kenya Bureau of Standards could then provide an accreditation and monitoring function, following the example of the Government of Thailand. It should strengthen its research function into standards development to the extent necessary for Kenya’s specific needs. The Government should also remedy the skill shortages that affect its recruitment and training. As the industrial sector develops, the Government should consider setting up a separate metrology institution with much broader capabilities.
The Kenya Industrial Research and Development Institute has done much to reorient itself to meet the technical needs of industry, in particular of SEEs. Its restructuring and downsizing seem to be working; demand for its services has been growing. These services, however, address relatively mundane problems unrelated to
TThhee CCaassee ooff KKeennyyaa
33
the Institute’s original research and development function. Today this focus may be appropriate, but in the longer term the Government must revive more substantive technological efforts. The industrial focus of the Institute is also fairly limited, and there appears to be a conspicuous gap in the area of electronics and information technologies.
Much of the difficulty in conducting research for industry lies in the weak technological capabilities of enterprises themselves. Firms should be able to identify their specific technological needs and absorb inputs if they conduct technological activity in-house. They should be willing to invest in contract research and to devote personnel time to external interactions. Where such capabilities are lacking, even good technology institutions can do little. Technology institutions in Kenya are products of the same culture and capabilities as the firms, and also need considerable strengthening. They are conscious of this need but are not guided by a coherent overall technological strategy.
H. Conclusions on technological capabilities
The general level of technological capabilities in Kenyan industry is low relative to that of industrializing countries in Asia or Latin America, although it is advanced by the standards of its close neighbours. The recent liberalization has stimulated some upgrading of capabilities (Wignaraja and Ikiara, 1999), but the positive response has been confined to a few larger firms. Many other firms, threatened by import competition, have died out or moved to other activities. Few have mounted technological strategies to raise the level of their capabilities and technologies. Even technologically adept firms do not reflect the efforts of successful firms in the newly industrializing economies: a sustained and systematic search for improved productivity and quality; efforts to raise the capacities of equipment or substitute materials and processes; and initiatives to improve workers’ skills. As a result, manufacturing growth is taking place mainly in activities that do not face direct world competition; apart from resource-based products, manufactured export growth is confined to niche markets. All indicators of technological activity and institutional support point to a low-level equilibrium, rather than a shift to dynamic growth.
Thus, the post-liberalization period shows little noticeable rise in technology imports or technological effort. Formal research and development remains minuscule. The positive technological response, where present, is narrow, based on a few firms’ use of new equipment and improved management and more efficient process engineering. It seems insufficient to stimulate the industrial sector or to develop new areas of competitiveness. The employment of technically qualified personnel remains low by international standards. While many firms offer on-the-job training, this tends to consist of the minimum needed to transmit basic operational skills from existing to new operatives. Relatively few enterprises carry out more formal in-house training. This is not compensated for by external technical training, which tends to be modest,7 exacerbated by a lack of local institutions able to provide training relevant to industrial needs.
It is imperative to tackle the whole range of problems methodologically; liberalization, for instance, need to be supported by a coherent strategy to develop the
7 The World Bank study (Biggs, Shah and Srivastava, 1995) also notes the low levels, limited scope and sporadic
nature of internal and external training efforts among African manufacturing firms. In Kenya, only one garment-exporting firm has been able to draw on its relationship with foreign buyers to improve training.
AAffrriiccaa''ss TTeecchhnnoollooggyy GGaapp
34
capabilities needed to cope with import competition. Lessons could be taken from the experience of advanced industrial and newly industrializing countries, where technology development strategies use enterprise skill and technology audits; benchmarking of technical performance against international levels; and concerted efforts to inform firms of challenges. These steps are backed up by policies to provide the necessary training, technology upgrading, quality certification, financing and reduction of transaction costs.
Links with technology institutions are confined to necessary, basic activities, such as mandatory certification of products or material testing. There is very little research contracting or use of institutions to search for and adapt new foreign technologies. Firms seem unaware of the technological services or capabilities available in governmental institutions, or regard them as irrelevant or inefficient. The adjustment process has reduced institutional funding and may have further isolated the institutions from the productive sector. The lack of institutional support for technology development is unfortunate, since firms face market failures in identifying their technological problems, obtaining relevant technical information and mounting the necessary technological effort.
Kenya's better performing firms, while having reasonable degrees of competence in the technologies they operate, are still at the lower end of the global technological spectrum. They need to considerably enhance their physical and human capital and technological effort in order to grow and diversify under liberalized trade. FDI could play a major role in introducing new technologies and skills and raising capabilities to conduct local technological activity. However, FDI has been low and unresponsive to policy reform; in technology-intensive manufacturing activities it is practically absent. Low FDI is itself a reflection of local capabilities, although political, rent-seeking and security factors, combined with bureaucratic impediments, are probably larger deterrents to international investors.
I. Policy recommendations
If Kenya is to industrialize in an open trading environment, there must be a massive upgrading of technological capabilities in manufacturing firms. This section deals with specific policy recommendations on technology upgrading in Kenya.
1. Technology strategy formulation
There is no institutional mechanism in Kenya for comprehensively evaluating and setting science and technology priorities for the country. There is no well-developed science and technology plan, and responsibility for relevant policies is spread over a large number of uncoordinated ministries and institutions. This setting is not conducive to supporting technology upgrading in Kenya.
In contrast, most market- and export-oriented newly industrializing economies have had mechanisms to identify and acquire strategic technologies. It is not only the newly industrializing economies that undertake technology targeting; the latter is, in some form or another, an integral part of technology resource allocation in every country. In most developed countries, the process of technology targeting has been largely implicit, largely driven by defence interests. Countries such as Japan and France have established technology targets to promote national capabilities, focusing on key industries.
TThhee CCaassee ooff KKeennyyaa
35
The first recommendation of this report is, therefore, that the Government of Kenya review and improve its strategy-making capabilities, and entrust one body with analysing technology needs at the broad economic level and designing and implementing strategies that cut across many ministerial and departmental lines. This body should include high-level representatives from all the ministries concerned, as well as the important institutions and the private sector. It should report to top levels of the Government to ensure that cross-cutting policies can be undertaken effectively. More importantly, there must be a sense of urgency and commitment to policies for technology upgrading.
In recent years, national technological priorities have been set in most industrialized countries, such as France, Germany, Japan, the United Kingdom and the United States, by Technology Foresight Programmes. These programmes call for all parties concerned with science and technology – industrial leaders and researchers, academia, services, financial institutions and the Government – to determine, over a period, the technological course and needs for their country. A number of developing countries, including India, Korea, Thailand and several Latin American countries, are conducting similar exercises. The main advantage of such a programme over previous forms of technology priority-setting is that it creates strong awareness among all stakeholders of the country’s technological needs, emerging worldwide trends, and the implications for national competitiveness and priorities. The programme evaluates the strengths and weaknesses of national innovation systems and builds consensus on what may be done, facilitating the mobilization of resources. Science and technology resources in many countries, including the United Kingdom, are being allocated in accordance with Foresight results.
The second general recommendation of this report is for the Government of Kenya to undertake a technology foresight exercise involving industry, government, technology institutions and universities. By involving all concerned parties in assessing local technological competence by global standards and working out strategies to overcome weaknesses, such an exercise would serve a valuable function: raising awareness and building consensus. There is enough expertise available in the developing world for Kenya to adapt the exercise to its own needs.
2. Improving human capital and skills
Kenyan industry needs a larger stock of qualified technical and managerial personnel to cope with the competitive demands of the current technological revolution. A quality workforce will contribute to a country’s ability to respond flexibly to rapid economic and technological change; to produce higher-quality products; to adopt and improve upon new production processes and technologies; and to develop new skills as the structure of jobs evolves. Over the past decade, concerns regarding the supply of skilled workers have become acute in both developing and developed countries. International comparisons suggest that the base of technical skills in Kenya is weak and its relevance to emerging technological needs limited. In comparison to the East Asian newly industrializing economies, Kenya suffers from under-investment in high-level technical manpower.
This may not constitute an immediate constraint to upgrading technology, but in the longer term it will certainly hold back a move into more advanced technologies. The newly industrializing economies of South-East Asia, with much higher levels of tertiary technical enrolment, are suffering severe shortages of high-level engineers and technicians. The shortages are likely to be more marked in new disciplines in high-
AAffrriiccaa''ss TTeecchhnnoollooggyy GGaapp
36
growth industries, such as chemicals, biotechnology, electrical and electronics engineering. For a long-term competitiveness strategy, it is indispensable to continuously monitor skill gaps, with industry working closely with the educational establishment in formulating priorities and curricula.
The apparent decline in the quality of education in Kenya has affected the system at all levels. Dropout and failure rates are high. Vocational training does not seem to meet industrial needs. Although technical colleges exist, they tend to be poorly equipped and staffed. Industry generally recruits people with basic formal education and upgrades their skills with in-house training. However, such training is generally concentrated in larger enterprises, and is aimed mainly at providing basic operational skills for specific jobs, rather than developing technological capabilities generally. Yet it is the latter that will be needed for the more advanced technologies that will enhance competitiveness. Coupled with the anti-education bias, this can be a severe constraint on future upgrading. It may be useful to make some general policy recommendations on this issue:
§ A periodical comprehensive survey of skill needs using international benchmarking. This can serve as the basis for prioritizing training needs at all levels; the Government should target new skills that are likely to be critical for future competitiveness, in particular in food processing, capital-intensive process industries, and electrical and electronics engineering. In addition, the skill needs of supporting service activities (e.g. information technology, finance and marketing) should be evaluated.
§ Linkages between industry and training institutions. It may be useful to set up a coordination unit to sponsor and implement such interaction on a continuous basis, with sufficient private sector representation to ensure not only that current industry needs are being addressed, but also that the future labour force will be better matched with future industry needs.
§ New types of training institutions more directly linked with and, in some cases, managed by industry. This requires training of middle management, production management and design skills.
§ Firm-level training by information and persuasion and, where desirable, by incentives and the setting up of institutions and programmes. A scheme worth considering is giving generous tax allowances to smaller firms for investing in training. There must be better information on and monitoring of private-sector training. Currently little information is available on this, and there are no systematic measures to promote or improve it.
§ SMEs targeting for special information and incentive programmes to recruit better-trained labour and to invest in formal training.
3. Stimulating and improving technology imports
Kenya imports little new technology, an indication that the economy is not responding to liberalization. There are no longer any obvious policy impediments to technology import. The intellectual property rights (IPR) regime is improving, and, though its implementation appears to be slow and cumbersome, this does not seem to be significantly constraining the transfer of technology. The market is too small and local competition too underdeveloped for weak IPR implementation to prevent transnational corporations from transferring technology.
TThhee CCaassee ooff KKeennyyaa
37
The main focus of technology transfer policy has to be on information provision to enterprises, particularly export-oriented SMEs, regarding the sources, costs and appropriateness of foreign technologies, backed by the provision of technical extension services to help them absorb new technologies. It is impossible to separate technology support measures from assistance with technology imports.
The importance of providing information on sources of foreign technology cannot be overstated. Firms in developing countries, especially those not geared to export activity, find it difficult and costly to obtain necessary information on sources of technology. The East Asian economies made strong efforts to inform its enterprises on sources of technology import, through online databases in all major industrial centres. Information provision was backed by extensive support in terms of advice, financing, consultancy and marketing support. Even Hong Kong (China), with its traditionally hands-off policy regarding industry, has made strenuous efforts to support its export-oriented SMEs. Much of its assistance is still subsidized, attesting to the reluctance of SMEs to pay full cost for necessary support services.
Productivity centres are a tested and effective means of raising the quality and impact of technology transfer to industry. The Government of Kenya might consider setting up such centres, starting with major industries like food processing and metalworking. These centres should have the capacity not only to undertake detailed productivity analysis but also to help finance remedial measures and conduct effective marketing. They should adopt a proactive approach, with qualified teams visiting enterprises, offering free diagnoses and putting together packages of technology and training. Financing could initially be at low cost to enterprises, but over time moving towards full cost. The Taiwan Productivity Centre, Taiwan’s Industrial Technology Research Institute, and the Hong Kong Productivity Centre offer models that can be adapted.
Technology upgrading requires a clear understanding of the technological status and needs of existing enterprises. Developed countries gain such understanding by conducting or promoting benchmarking exercises at the enterprise level. In the United Kingdom, for instance, large firms use PROBE software with data on thousands of leading European firms; this is provided by the Confederation of British Industry and does not involve government assistance. SEEs, on the other hand, are provided benchmarking help by the Department of Trade and Industry, which has developed a simple questionnaire to collect basic data and provide a quick assessment. A central database of information on over 60 indicators of financial, operational and managerial performance has been collected nationally. The object of the exercise is to benchmark around 10,000 SEEs yearly, comparing company performance with national, regional or sectoral standards. The comparison is used to offer subsidized consultancy services to help firms improve their performance. In addition, the Government conducts productivity comparisons of major industries to assess whether there are gaps vis-à-vis major competitors and the reason for such gaps.
The Government of Kenya might consider establishing a Benchmarking Unit in the Ministry of Industry, Trade and Tourism. It would initially consist of a small team trained to develop, implement and analyse benchmarking in industry, involving the private sector and associations as much as possible in the effort. Benchmarking could be supported with policy for technology imports, upgrading, training and so on.
AAffrriiccaa''ss TTeecchhnnoollooggyy GGaapp
38
4. Improving the research and development climate
There is little awareness in industry of the importance of in-firm technological effort. Imported technology is used passively, often at well below international best practice levels. When new technology emerges, they again import it without making much effort to master it. The Asian newly industrializing economies, on the other hand, encourage their firms to absorb, adapt and improve upon imported technologies. Only thus could the firms reach international competitiveness without undertaking innovation on their own. Such a technology culture does not exist in Kenya and many other developing countries, and governments do not make any efforts to stimulate it. For instance, in Kenya there are no fiscal incentives for enterprise research and development, which is not even allowable as a tax-deductible expense. In “latecomer” newly industrializing economies such as Malaysia and Thailand, Governments are making a strong effort to develop a technology culture, and are giving research and development tax subsidies of 150 to 200 per cent.
The Government of Kenya might consider classifying enterprise research and development as a tax-deductible expense and offering a subsidy scheme of such activities. However, fiscal incentives by themselves are unlikely to stimulate much technology upgrading. In the absence of demand for research and development from enterprises, a few large firms or foreign affiliates would take up most of the subsidy. These firms would conduct research and development in any case and do not need the incentive. To encourage a net addition to ongoing efforts, it is vital to persuade firms to launch new technological activity. This requires concerted information and persuasion campaigns including awards and official recognition programmes to ensure that technology consciousness diffuses from the leaders to others. Leading technology performers might be selected as technology models, demonstrating how technology can be improved or developed locally. Industry associations can play a major role here, as they did in Asia.
The Government of Kenya might also consider setting up a Technology Fund to co-finance research and development by industry. The Technology Fund should give resources to companies as a conditional loan, to be repaid if a venture succeeds and otherwise written off. While this raises the risk of losses if a large proportion of the projects fail, experience suggests that the risk is quite small. Similar funds have been used with considerable success in Turkey and India, both in the context of World Bank–financed Industrial Technology Projects. Each technology proposal was carefully vetted and monitored by experienced industry representatives and researchers, and the majority turned out to be commercially viable. In India, the project made collaboration with research institutes a condition of the loan, whereas in Turkey the project could be entirely internal to the firm. A surprisingly large latent demand emerged from private enterprises for research and development support. Winning research projects became very prestigious in both countries and helped spread awareness that research and development are worthwhile even in less industrialized economies. 5. Strengthening the technology infrastructure and institutions
The Kenya Bureau of Standards. The Kenya Bureau of Standards seems to be a well-run and competent institution within its sphere of activity. However, this sphere is relatively limited; the Bureau’s testing and metrology facilities are obsolete. The limited range of calibration services means that export-oriented firms have to seek calibration services abroad. Awareness among enterprises, particularly among export-
TThhee CCaassee ooff KKeennyyaa
39
oriented SMEs, of the importance of product quality is generally low, and it is not clear how vigorous the Kenya Bureau of Standards is in promoting quality consciousness and standardization. Firms using the Bureau’s services in the past have complained of delays (Wignaraja and Ikiara, 1999); however, the mission could not evaluate the current situation independently. It is important for Kenya’s technical development to encourage internationally accredited private testing and calibration laboratories. Presently, 15 private laboratories, all in Nairobi, are accredited by the Kenya Bureau of Standards. There is a need for a much larger network of laboratories spread through the country.
The Kenya Bureau of Standards can develop into a stronger national and regional centre for metrology, standards, testing and quality services if it broadens its range of services and upgrades its level of skills. Its salary levels are lower compared to those in private industry. The experience of other countries suggests that as quality awareness increases in the private sector, the brain drain from the Kenya Bureau of Standards will accelerate – unless salaries are raised. New laboratories are costly, and the Government might seriously consider conducting a study of the institution’s long-term needs and priorities. Courses on Metrology, testing and quality management skills might be offered at universities, thus creating a regional hub for technical skills formation. It is recommended, therefore, that the Government conduct a strategic review of the Bureau’s capabilities, investment needs and salaries, and undertake appropriate measures to establish Kenya as a regional hub for metrology, standards, testing and quality activities.
The Kenya Industrial Research and Development Institute. The Kenya Industrial Research and Development Institute has made great efforts to reform its operations and link itself to its industrial clients. Its technological aims have been relatively modest, probably rightly in the initial period of reform and reorientation. The main focus of this institution is export-oriented SMEs, to which it offers troubleshooting, technology improvement and testing services. Large firms also use the Institute for relatively low-level consultancy services.
The main constraint it faces is a lack of trained personnel, which stems directly mainly from lower-level salaries it offers. The Government might consider strengthening the Institute by offering competitive remuneration. In the longer term, the Institute must conduct more research and development work for industry rather than simply providing technical services. As industry develops, private markets for consultancy and technical services tend to grow, so that government institutions no longer need to provide these services. Government institutions can then focus on technological activities not provided elsewhere, such as introducing and adapting new technologies; packaging technology with finance and marketing; and developing technologies that enhance local competitiveness. The Institute should therefore have a strategic plan to assist in developing the private provision of routine technical services and should itself move into more difficult and complex areas of technology work.
Export-oriented SMEs extension. The Government should consider a more general strategy of promoting SMEs in more high-value-added industrial activities. Small and medium-sized enterprise extension centres can improve their basic services (e.g. providing information on sources and prices for standard technologies), as well as business services (e.g. offering business plan design or project management skills). The more advanced centres may offer technology test-beds and diffusion centres where firms can try out new technologies. While the example of Singapore may be too advanced for Kenya to follow in the near future, the Singaporean strategy of promoting
AAffrriiccaa''ss TTeecchhnnoollooggyy GGaapp
40
high-tech export-oriented SMEs provides useful lessons. In particular, coordination between incubators, physical infrastructure, information, skill formation and financing is essential for such a strategy to succeed (see Box 2.5).
Survival rates for small and medium-sized enterprises are generally poor in Kenya. Therefore, assisting firms at the start-up stage is a valuable support service, particularly in technology-intensive areas. Incubators are one way of providing such support: small start-ups are provided with basic services, such as reasonably priced real estate and established business services. Firms occupy an incubator for three to five years, mingling with other “tenants” while engaging in joint problem solving, marketing and business development. Technology incubators help tenant firms gain access to, apply, and market technical knowledge. The Government of Kenya might consider promoting the use of technology incubators linked to university and technical colleges.
6. Attracting foreign direct investment
It is vital for the Kenya Investment Promotion Council to bring its investor services to modern and competitive levels. It has to become a real “one-stop shop” able to obtain all the necessary permits and agreements that investors need. The speed of services has to be improved, bearing in mind that best practice in FDI approval is less than one day in countries such as Singapore. This requires considerable improvements in skills in the Kenya Investment Promotion Council and a more substantial budget for undertaking effective promotion. Such promotion has to be guided by investor tracking and targeting strategies. It is recommended that the institutional and skill structure of the Kenya Investment Promotion Council be carefully examined by suitable experts, and an action plan drawn up to bring it to best-practice levels of competence.
FDI is likely to be the main avenue for technology transfer and upgrading in Kenya. Foreign affiliates are also likely to be the major local performers of technological activity. Therefore, the Government must do everything in its power to increase its attractiveness to transnational corporations.
7. Strengthening intellectual property rights
The Government of Kenya has to improve its capabilities for formulating competition policy, price regulation, targeted subsidies or other transfer mechanisms that would help mitigate the potential negative effects of stronger ownership rights on intellectual property. As far as intellectual property rights are directly concerned, the lack of patent lawyers in Kenya is a handicap and has to be remedied. The Kenyan Industrial Property Office lacks autonomy regarding its budget, which is a constraint. This Office should expand its awareness campaign in provincial towns, fairs and shows to raise consciousness of the importance of intellectual property rights. Technology imports have to conform fully to requirements, scrupulously observing legal rights. If the measures noted above are applied, this will not constitute a barrier to technology transfer and upgrading. There is a clear risk, however, that stronger intellectual property rights will raise the costs of technology transfer. It is not possible to reverse the trend towards strengthening intellectual property rights. The only way to benefit from them is to raise domestic capabilities to absorb new technology, and to attract technology transfer by legal means, primarily by FDI. Doing this effectively could result in enormous technological benefits to Kenya, as the experience of East Asia shows.
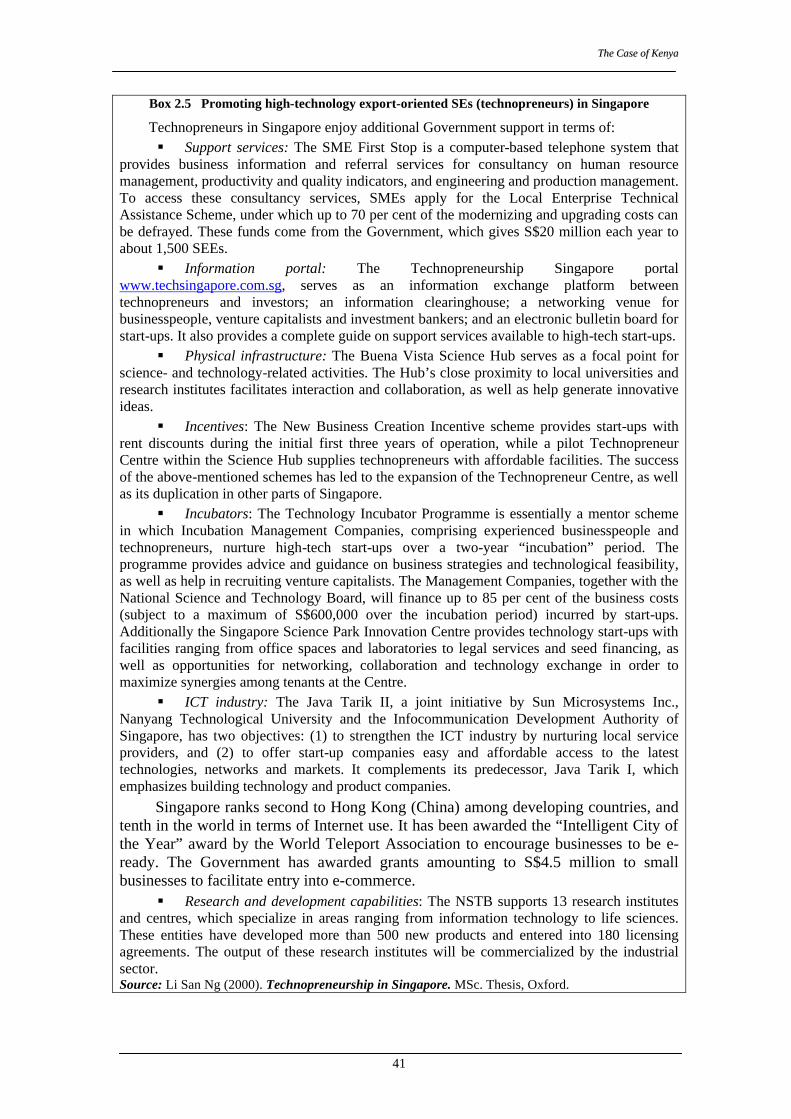
TThhee CCaassee ooff KKeennyyaa
41
Box 2.5 Promoting high-technology export-oriented SEs (technopreneurs) in Singapore
Technopreneurs in Singapore enjoy additional Government support in terms of: § Support services: The SME First Stop is a computer-based telephone system that
provides business information and referral services for consultancy on human resource management, productivity and quality indicators, and engineering and production management. To access these consultancy services, SMEs apply for the Local Enterprise Technical Assistance Scheme, under which up to 70 per cent of the modernizing and upgrading costs can be defrayed. These funds come from the Government, which gives S$20 million each year to about 1,500 SEEs.
§ Information portal: The Technopreneurship Singapore portal www.techsingapore.com.sg, serves as an information exchange platform between technopreneurs and investors; an information clearinghouse; a networking venue for businesspeople, venture capitalists and investment bankers; and an electronic bulletin board for start-ups. It also provides a complete guide on support services available to high-tech start-ups.
§ Physical infrastructure: The Buena Vista Science Hub serves as a focal point for science- and technology-related activities. The Hub’s close proximity to local universities and research institutes facilitates interaction and collaboration, as well as help generate innovative ideas.
§ Incentives: The New Business Creation Incentive scheme provides start-ups with rent discounts during the initial first three years of operation, while a pilot Technopreneur Centre within the Science Hub supplies technopreneurs with affordable facilities. The success of the above-mentioned schemes has led to the expansion of the Technopreneur Centre, as well as its duplication in other parts of Singapore.
§ Incubators: The Technology Incubator Programme is essentially a mentor scheme in which Incubation Management Companies, comprising experienced businesspeople and technopreneurs, nurture high-tech start-ups over a two-year “incubation” period. The programme provides advice and guidance on business strategies and technological feasibility, as well as help in recruiting venture capitalists. The Management Companies, together with the National Science and Technology Board, will finance up to 85 per cent of the business costs (subject to a maximum of S$600,000 over the incubation period) incurred by start-ups. Additionally the Singapore Science Park Innovation Centre provides technology start-ups with facilities ranging from office spaces and laboratories to legal services and seed financing, as well as opportunities for networking, collaboration and technology exchange in order to maximize synergies among tenants at the Centre.
§ ICT industry: The Java Tarik II, a joint initiative by Sun Microsystems Inc., Nanyang Technological University and the Infocommunication Development Authority of Singapore, has two objectives: (1) to strengthen the ICT industry by nurturing local service providers, and (2) to offer start-up companies easy and affordable access to the latest technologies, networks and markets. It complements its predecessor, Java Tarik I, which emphasizes building technology and product companies. Singapore ranks second to Hong Kong (China) among developing countries, and tenth in the world in terms of Internet use. It has been awarded the “Intelligent City of the Year” award by the World Teleport Association to encourage businesses to be e-ready. The Government has awarded grants amounting to S$4.5 million to small businesses to facilitate entry into e-commerce.
§ Research and development capabilities: The NSTB supports 13 research institutes and centres, which specialize in areas ranging from information technology to life sciences. These entities have developed more than 500 new products and entered into 180 licensing agreements. The output of these research institutes will be commercialized by the industrial sector. Source: Li San Ng (2000). Technopreneurship in Singapore. MSc. Thesis, Oxford.
AAffrriiccaa''ss TTeecchhnnoollooggyy GGaapp
42
Having a strong legal regime is useless if implementation is slow, cumbersome and non-transparent. Kenya needs not just qualified patent lawyers and judges but an efficient and fair system. As was noted earlier, however, the potentially anti-competitive effects of strong intellectual property rights have to be offset by effective competition policy. This is itself a very demanding and skill-intensive task that no developing country today can afford to neglect. A consideration of competition policy, however, is not directly relevant to this study.
To conclude: it is vital for Kenyan development to raise technological levels in industry if it is to prosper in the new international environment. The country’s record to date is not impressive, and it is falling behind fast-moving competitors. Nevertheless, there are signs that awareness of the issues is growing. This awareness must now be transformed into a coherent strategy, with a strong commitment to implementation.
Chapter 3 The Case of Ghana
A. Introduction
Ghana’s post-independence industrial policy consisted of a ‘fast-track’ strategy of industrialization, founded on the notion that rapid economic development was feasible provided that entrepreneurial functions were assumed by the State. Towards this end, a large number of State-owned import substitution industries producing a wide range of previously- imported consumer goods for the domestic market were established. By 1970, Ghana had one of the most diverse and dynamic manufacturing sector in sub-Saharan Africa.
The country’s record of industrial growth has been mixed. After an initial period of expansion in investment and output, manufacturing output by 1984 had declined to only about 40 per cent of the 1977 level. Manufacturing performance improved sharply after the application of the external reference price. This was driven mostly by the availability of imported inputs after import liberalization and by increased domestic demand, which was fuelled by export earning from rising cocoa prices and by higher level aid inflows. However, this growth proved unsustainable. By 1992 manufacturing had not yet regained the peak of 11.3 per cent of the gross domestic product (GDP) that it had attained in 1971. Manufacturing value added in 1996 was only 9 per cent of the GDP, a level comparable to the sub-Saharan African average, but clearly behind the more industrialized Zimbabwe and South Africa and most developing countries. On a comparative basis, Ghana’s 2000 manufacturing value added was at around 70 per cent of Kenya's, 47 per cent of Zimbabwe’s, and 2 per cent of Malaysia’s. Per-capita figures confirm this overall pattern, with per-capita manufacturing value added growing only 0.3 per cent during the period 1980–96. Table 3.1 indicates that only in 1994 did the country’s manufacturing growth rate recover to its 1977 level.
B. Industrial background
Ghana’s industry structure consists mainly of a large refining industry and aluminium smelting facility, with very limited manufacturing capacity. The modern sector, largely owned by foreign companies, is concentrated on food processing and on industrial intermediaries manufactures (Pietrobelli, 1994). Most of the semi-modern enterprises are relatively small-scale African-owned operations running on simple machinery and on low-level technical and managerial skills. They generally produce lower-quality goods geared to the domestic market. The informal sector is entirely African and operates on even simpler technologies.
Growth in manufacturing activity requires investments in refurbishing and modernizing facilities, upgrading and expanding productive capacity, and improving operational efficiency. However, in Ghana, as in most of sub-Saharan Africa, capital goods investment and technical efficiency have been low, and capacity utilization has risen only marginally.
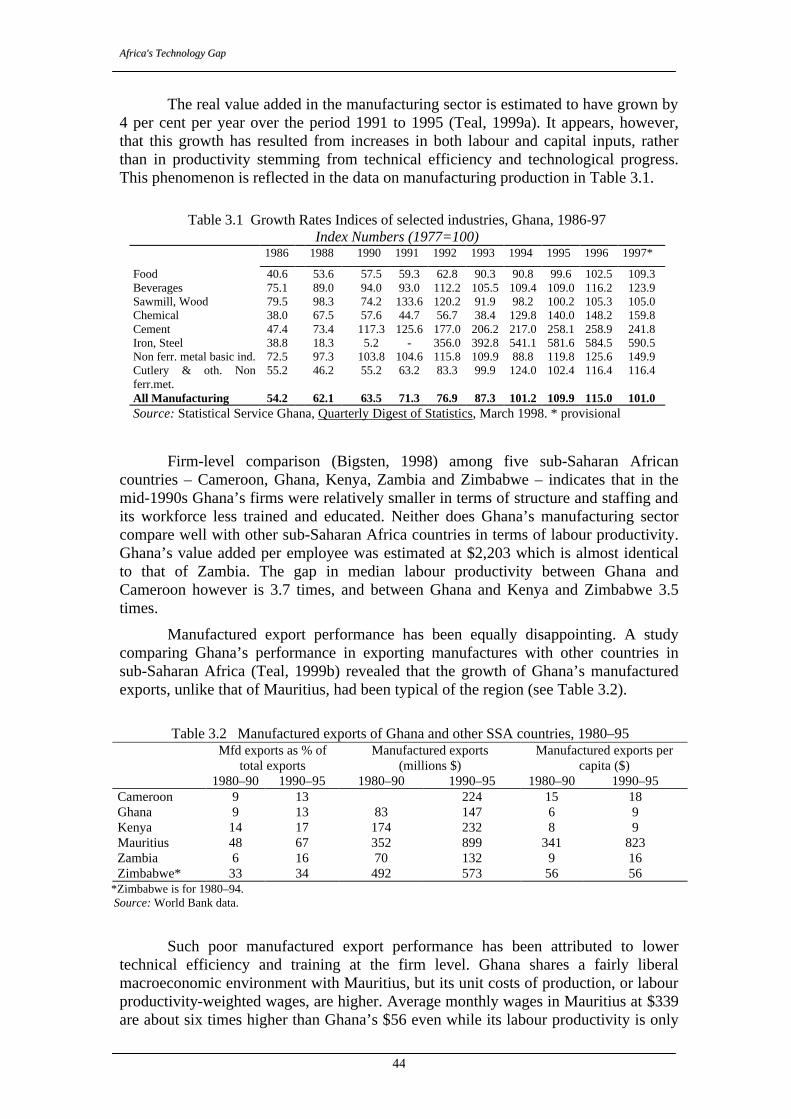
AAffrriiccaa''ss TTeecchhnnoollooggyy GGaapp
44
Table 3.2 Manufactured exports of Ghana and other SSA countries, 1980–95 Mfd exports as % of
total exports Manufactured exports
(millions $) Manufactured exports per
capita ($) 1980–90 1990–95 1980–90 1990–95 1980–90 1990–95 Cameroon 9 13 224 15 18 Ghana 9 13 83 147 6 9 Kenya 14 17 174 232 8 9 Mauritius 48 67 352 899 341 823 Zambia 6 16 70 132 9 16 Zimbabwe* 33 34 492 573 56 56
*Zimbabwe is for 1980–94. Source: World Bank data.
The real value added in the manufacturing sector is estimated to have grown by 4 per cent per year over the period 1991 to 1995 (Teal, 1999a). It appears, however, that this growth has resulted from increases in both labour and capital inputs, rather than in productivity stemming from technical efficiency and technological progress. This phenomenon is reflected in the data on manufacturing production in Table 3.1.
Firm-level comparison (Bigsten, 1998) among five sub-Saharan African countries – Cameroon, Ghana, Kenya, Zambia and Zimbabwe – indicates that in the mid-1990s Ghana’s firms were relatively smaller in terms of structure and staffing and its workforce less trained and educated. Neither does Ghana’s manufacturing sector compare well with other sub-Saharan Africa countries in terms of labour productivity. Ghana’s value added per employee was estimated at $2,203 which is almost identical to that of Zambia. The gap in median labour productivity between Ghana and Cameroon however is 3.7 times, and between Ghana and Kenya and Zimbabwe 3.5 times.
Manufactured export performance has been equally disappointing. A study comparing Ghana’s performance in exporting manufactures with other countries in sub-Saharan Africa (Teal, 1999b) revealed that the growth of Ghana’s manufactured exports, unlike that of Mauritius, had been typical of the region (see Table 3.2).
Such poor manufactured export performance has been attributed to lower technical efficiency and training at the firm level. Ghana shares a fairly liberal macroeconomic environment with Mauritius, but its unit costs of production, or labour productivity-weighted wages, are higher. Average monthly wages in Mauritius at $339 are about six times higher than Ghana’s $56 even while its labour productivity is only
Table 3.1 Growth Rates Indices of selected industries, Ghana, 1986-97 Index Numbers (1977=100)
1986 1988 1990 1991 1992 1993 1994 1995 1996 1997*
Food 40.6 53.6 57.5 59.3 62.8 90.3 90.8 99.6 102.5 109.3 Beverages 75.1 89.0 94.0 93.0 112.2 105.5 109.4 109.0 116.2 123.9 Sawmill, Wood 79.5 98.3 74.2 133.6 120.2 91.9 98.2 100.2 105.3 105.0 Chemical 38.0 67.5 57.6 44.7 56.7 38.4 129.8 140.0 148.2 159.8 Cement 47.4 73.4 117.3 125.6 177.0 206.2 217.0 258.1 258.9 241.8 Iron, Steel 38.8 18.3 5.2 - 356.0 392.8 541.1 581.6 584.5 590.5 Non ferr. metal basic ind. 72.5 97.3 103.8 104.6 115.8 109.9 88.8 119.8 125.6 149.9 Cutlery & oth. Non ferr.met.
55.2 46.2 55.2 63.2 83.3 99.9 124.0 102.4 116.4 116.4
All Manufacturing 54.2 62.1 63.5 71.3 76.9 87.3 101.2 109.9 115.0 101.0 Source: Statistical Service Ghana, Quarterly Digest of Statistics, March 1998. * provisional
TThhee CCaassee ooff GGhhaannaa
45
3.8 times higher. However, the wage level among the larger Mauritian firms able to enter the export market (i.e. with at least 100 employees) is only three times higher than that in Ghana. Thus, given their lower technical efficiency, wage levels in Ghanaian firms are relatively higher. This problem could be traced to the science and technology system and its capability to transfer, use and adapt imported technology effectively to meet local industry’s needs.
C. The policy framework for industry
Beginning with the Pioneer Industries and Companies Act (1959) up to the Ghana Investment Centre Act (1994), which established the present Ghana Investment Promotion Centre, Ghana has been actively creating a more attractive and conducive environment for foreign direct investment (FDI). By the late 1990s, Ghana was identified as one of the leading African countries in attracting FDI.
The Ghana Export Promotion Council has been very active in trade fairs and trade promotion. It has established incentive schemes for exporters that include export proceeds retention schemes (100 per cent of foreign exchange export proceeds may be retained), corporate tax rebates (between 40 and 75 per cent of tax liabilities), customs duty drawbacks, and bonded warehouses.1 Its 1999 revenue of 2 billion Cedis ($570,000) was slightly higher than that of the Ghana Investment Promotion Centre.2
The Ghana Free Zones Board is an integrated programme to promote processing and manufacturing of goods through export processing zones and to strengthen seaport and airport services. It is managed by the private sector. In line with the 1995 Free Zone Act (Act 504), the Board offers an attractive set of incentives to firms exporting at least 70 per cent of annual production, including exemption from import duties and tax on profits for 10 years, after which tax rates shall not exceed 8 per cent.
Among the business associations in the country, the most prominent are the Association of Ghana Industries (AGI), the Association of Small-Scale Industries (ASSI), and the Private Enterprise Foundation (PEF). These associations aim at strengthening the private sector and have addressed issues such as access to credit, trade policies and management training. They have thus far not addressed the science and technology needs of business and industrial development. Overall, their role and effectiveness seem rather limited.
D. Science and technology policies 1. Antecedents
While there has been long-standing national recognition of the importance of science and technology in national development, science and technology policy has been pursued implicitly through the mandates of technical government departments. Inter-territorial research institutions set up by colonial administrators to serve the West Africa region undertook research. The establishment of the National Research Council 1 The Export Development and Investment Fund Bill was approved and published in the Gazette on 10 December 1999 to address the problems associated with the supply-side constraints of exports by creating a financial facility. 2 Other export-specific programmes have been established with the help of foreign donors, such as the Trade and Investment Promotion Programme, a five-year $80 million programme started in 1993 and sponsored by USAID. Also noteworthy is Private Enterprise and Export Development, a $51 million credit facility sponsored by the World Bank (Baah-Nuakoh et al., 1996: 20).
AAffrriiccaa''ss TTeecchhnnoollooggyy GGaapp
46
in 1958 provided a national focal point for generating innovation in pursuit of a science and technology policy. The country’s subsequent Seven-Year Development Plan of 1963/64 to 1969/70 had science and technology as the instrument for radically restructuring agriculture and industry, the thrust being applied research and the use of research results and findings for socioeconomic benefit. However, because of political instability, these policies remained largely unimplemented. The National Research Council was subsequently replaced by the Ghana Academy of Sciences, which in turn was replaced in 1968 by the Council for Scientific and Industrial Research. Even the creation of a new Ministry of Industry, Science and Technology did not achieve the Government’s objective of linking science and technology to socio-economic development.
Consequently, the Science and Technology Policy Institute, which is charged with formulating and proposing science and technology policies in the country, identified six focal areas in developing and utilizing science and technology for national development. These are (1) research and development (R&D) and innovation management; (2) R&D – industry linkages; (3) strategic use of information and communication technology; (4) human resource development; (5) a science and technology awareness drive; and (6) a stable and high-level political commitment. The last item was deemed the most crucial element. Additionally, the Institute proposed establishing a dialogue among all the stakeholders to enable effective implementation of the policy.
A 1998 science and technology policy, formulated to give direction to and galvanize action for a science- and technology-led development, is aimed at supporting "socio-economic development goals with a view to lifting Ghana to a middle-income status by the year 2020 through the perpetuation of a science and technology culture at all levels of society, which is driven by the promotion of innovation and mastery of known and proven technologies, and their application in industry and other sectors of the economy.” The main directive principles for governmental action include the creation of an enabling environment and advocacy for the promotion of science and technology as a key factor in Ghana’s development process, including the development of science and technology capabilities and capacity-building, and of entrepreneurial skills. It is aimed at competitiveness enhancement, job generation and industrial development through improved the access of small, medium-sized and micro-enterprises to technology from national and international sources. To date, however, these objectives have remained unfulfilled.
In addition to these policy measures, the appointment of a Presidential Adviser on Science and Technology was proposed. The Advisor's function would be to raise the political profile of science and technology, and to ensure cross-sectoral coordination. The successful implementation of any science and technology policy in Ghana will necessarily require that the science and technology needs of industry be well understood and be given a very high political priority by the Government.
2. The policy-making structure
The policy-making structure in Ghana’s science and technology system is illustrated in Figure 3.1. It consists of the Ministry of Environment, Science and Technology and the Council for Scientific and Industrial Research.
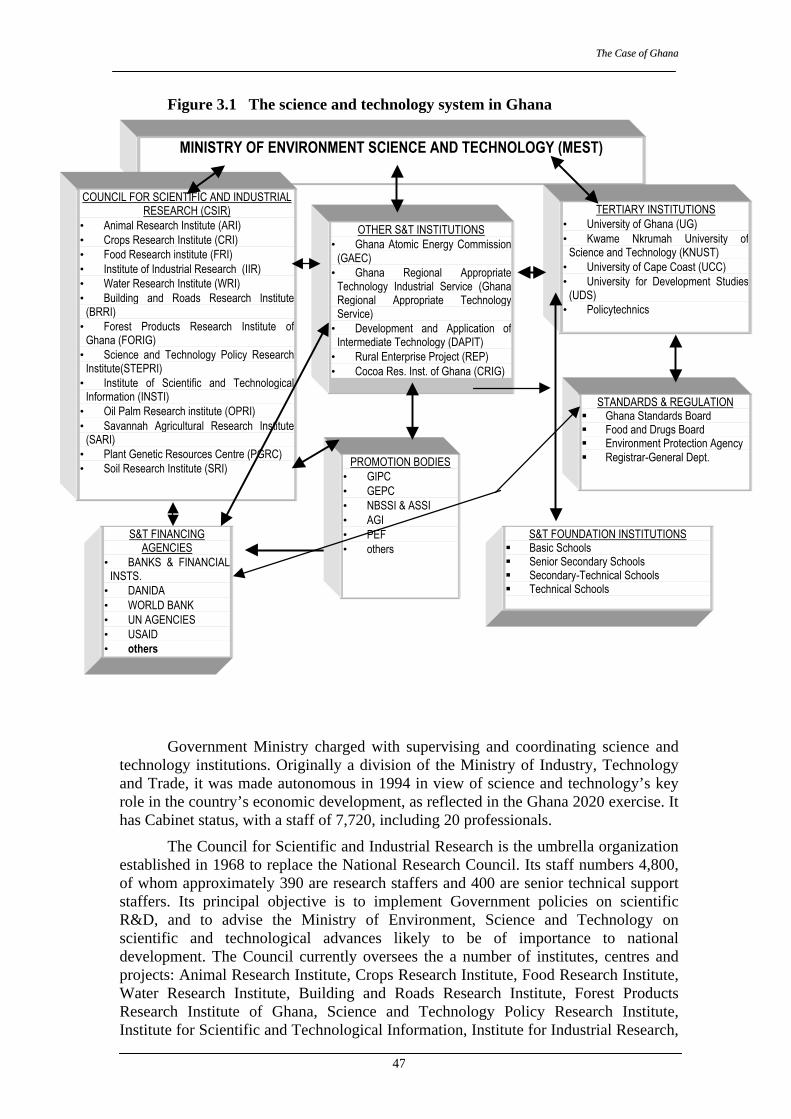
TThhee CCaassee ooff GGhhaannaa
47
Figure 3.1 The science and technology system in Ghana Government Ministry charged with supervising and coordinating science and
technology institutions. Originally a division of the Ministry of Industry, Technology and Trade, it was made autonomous in 1994 in view of science and technology’s key role in the country’s economic development, as reflected in the Ghana 2020 exercise. It has Cabinet status, with a staff of 7,720, including 20 professionals.
The Council for Scientific and Industrial Research is the umbrella organization established in 1968 to replace the National Research Council. Its staff numbers 4,800, of whom approximately 390 are research staffers and 400 are senior technical support staffers. Its principal objective is to implement Government policies on scientific R&D, and to advise the Ministry of Environment, Science and Technology on scientific and technological advances likely to be of importance to national development. The Council currently oversees the a number of institutes, centres and projects: Animal Research Institute, Crops Research Institute, Food Research Institute, Water Research Institute, Building and Roads Research Institute, Forest Products Research Institute of Ghana, Science and Technology Policy Research Institute, Institute for Scientific and Technological Information, Institute for Industrial Research,
MINISTRY OF ENVIRONMENT SCIENCE AND TECHNOLOGY (MEST)
COUNCIL FOR SCIENTIFIC AND INDUSTRIAL RESEARCH (CSIR)
• Animal Research Institute (ARI) • Crops Research Institute (CRI) • Food Research institute (FRI) • Institute of Industrial Research (IIR) • Water Research Institute (WRI) • Building and Roads Research Institute
(BRRI) • Forest Products Research Institute of
Ghana (FORIG) • Science and Technology Policy Research
Institute(STEPRI) • Institute of Scientific and Technological
Information (INSTI) • Oil Palm Research institute (OPRI) • Savannah Agricultural Research Institute
(SARI) • Plant Genetic Resources Centre (PGRC) • Soil Research Institute (SRI)
OTHER S&T INSTITUTIONS • Ghana Atomic Energy Commission
(GAEC) • Ghana Regional Appropriate
Technology Industrial Service (Ghana Regional Appropriate Technology Service)
• Development and Application of Intermediate Technology (DAPIT)
• Rural Enterprise Project (REP) • Cocoa Res. Inst. of Ghana (CRIG)
TERTIARY INSTITUTIONS • University of Ghana (UG) • Kwame Nkrumah University of
Science and Technology (KNUST) • University of Cape Coast (UCC) • University for Development Studies
(UDS) • Policytechnics
S&T FOUNDATION INSTITUTIONS § Basic Schools § Senior Secondary Schools § Secondary-Technical Schools § Technical Schools
S&T FINANCING AGENCIES
• BANKS & FINANCIAL INSTS.
• DANIDA • WORLD BANK • UN AGENCIES • USAID • others
STANDARDS & REGULATION § Ghana Standards Board § Food and Drugs Board § Environment Protection Agency § Registrar-General Dept. PROMOTION BODIES
• GIPC • GEPC • NBSSI & ASSI • AGI • PEF • others
AAffrriiccaa''ss TTeecchhnnoollooggyy GGaapp
48
Oil Palm Research Institute, Savannah Agricultural Research Institute, Plant Genetic Resources Centre and the Soil Research Institute.
Act 521 (1996) reoriented the Council’s objectives towards private-sector concerns and the commercialization of research. Additionally, the Council would have to generate at least 30 per cent of its budget from the sale of its products and services and from contract research fees. Although there are concerns that such budgetary policy might, in the long run, discriminate against basic research, there is overall support for making public research activities more demand-driven and industry-related.
The drive to commercialize public research activities has been substantially supported by the World Bank’s Private Sector Development Project. Three Council for Scientific and Industrial Research Institutes – the Institute of Industrial Research, the Building and Roads Research Institute, and the Food Research Institute – are charged with providing technical support to industry and the private sector. Non-Council institutions also participating in the Private Sector Development Project include the Ghana Standards Board, the Ghana Trade Fair Authority, and the Attorney General’s office. Additionally, there is a UN Development Programme (UNDP) project aimed at matching science and technology demand and supply, and at ensuring science and technology marketing.
Thus far only the Oil Palm Research Institute has reached the 30 per cent self-financing target. Revenue earnings among other Institutes have been below expectations (see Table 3.4), averaging 4.4 per cent and ranging from 1 to 25 per cent of their total budgets. Numerous clients have been lost because of the increase in service fees. 3. Coordinating science and technology in Ghana
Science and technology coordination in Ghana has faced enormous difficulties owing to excessive fragmentation amid pursuit of sectoral policies and objectives. The educational and training institutions, for instance, do not produce graduates in enough quantity or quality to meet the human capital requirements of industrial development. In view of the complexity of the issue, the coordinating role of the Ministry of Environment, Science and Technology must be supported by concerted action on the part of all shareholders. Some segments of the proposed plans of action are discussed below.
4. Financing science and technology in Ghana
One of the main constraints affecting the development of science and technology in Ghana has been inadequate funding. Sources of funding have thus far included Government budgetary allocations,3 donor grants and funds generated from commercialization activities.
As Table 3.3 shows, the Ministry of Environment, Science and Technology is wholly financed from central government. Allocations to the Ministry of Environment, Science and Technology constitute only about 0.25 per cent of the GDP, a reflection of the importance accorded to science and technology and the environment. Moreover, only about two-fifths of the Ministry’s budget is used for research. The Council for Scientific and Industrial Research also relies on Government funds to support its
3 Financing of public research institutions involves the following categories: personnel expenditures; recurrent expenditures; development expenditures for project execution; and groups’ investment and capacity-building expenses. The only category directly relevant for financing research activities is the third, and most Council for Scientific and Industrial Research Institutes have not recently made expenditures under this item.
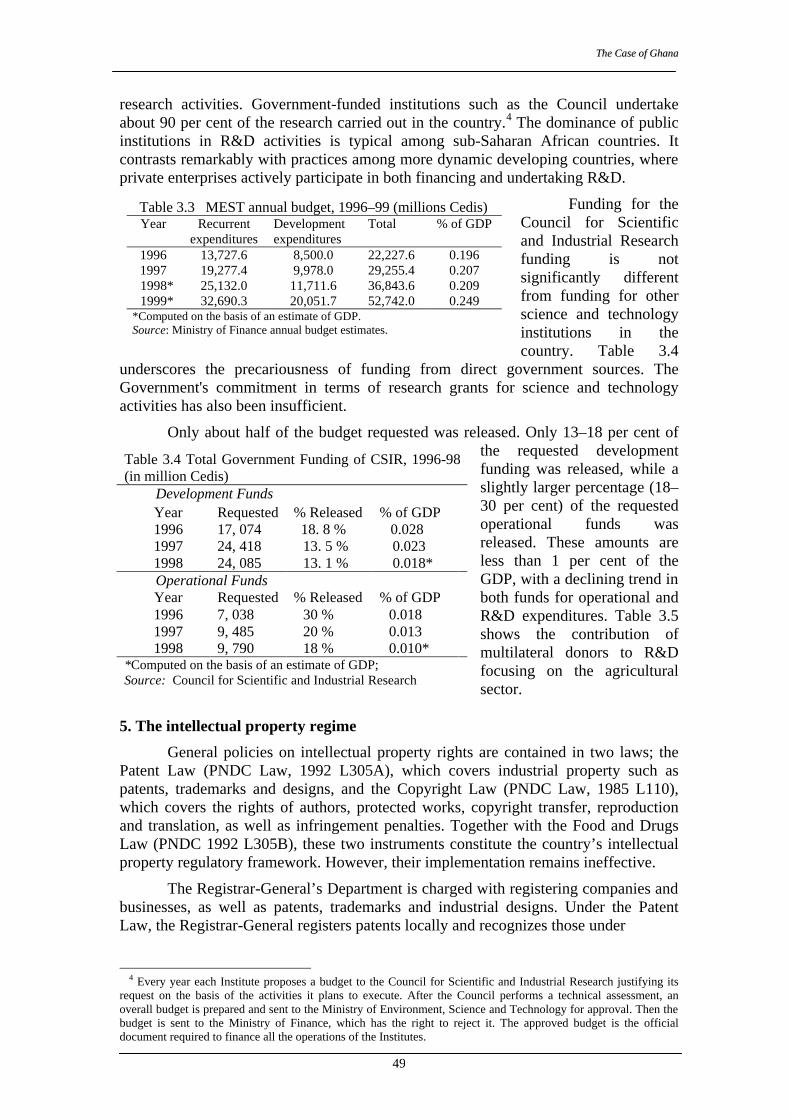
TThhee CCaassee ooff GGhhaannaa
49
Table 3.3 MEST annual budget, 1996–99 (millions Cedis) Year Recurrent
expenditures Development expenditures
Total % of GDP
1996 1997
1998* 1999*
13,727.6 19,277.4 25,132.0 32,690.3
8,500.0 9,978.0
11,711.6 20,051.7
22,227.6 29,255.4 36,843.6 52,742.0
0.196 0.207 0.209 0.249
*Computed on the basis of an estimate of GDP. Source: Ministry of Finance annual budget estimates.
research activities. Government-funded institutions such as the Council undertake about 90 per cent of the research carried out in the country.4 The dominance of public institutions in R&D activities is typical among sub-Saharan African countries. It contrasts remarkably with practices among more dynamic developing countries, where private enterprises actively participate in both financing and undertaking R&D.
Funding for the Council for Scientific and Industrial Research funding is not significantly different from funding for other science and technology institutions in the country. Table 3.4
underscores the precariousness of funding from direct government sources. The Government's commitment in terms of research grants for science and technology activities has also been insufficient.
Only about half of the budget requested was released. Only 13–18 per cent of the requested development funding was released, while a slightly larger percentage (18–30 per cent) of the requested operational funds was released. These amounts are less than 1 per cent of the GDP, with a declining trend in both funds for operational and R&D expenditures. Table 3.5 shows the contribution of multilateral donors to R&D focusing on the agricultural sector.
5. The intellectual property regime
General policies on intellectual property rights are contained in two laws; the Patent Law (PNDC Law, 1992 L305A), which covers industrial property such as patents, trademarks and designs, and the Copyright Law (PNDC Law, 1985 L110), which covers the rights of authors, protected works, copyright transfer, reproduction and translation, as well as infringement penalties. Together with the Food and Drugs Law (PNDC 1992 L305B), these two instruments constitute the country’s intellectual property regulatory framework. However, their implementation remains ineffective.
The Registrar-General’s Department is charged with registering companies and businesses, as well as patents, trademarks and industrial designs. Under the Patent Law, the Registrar-General registers patents locally and recognizes those under
4 Every year each Institute proposes a budget to the Council for Scientific and Industrial Research justifying its
request on the basis of the activities it plans to execute. After the Council performs a technical assessment, an overall budget is prepared and sent to the Ministry of Environment, Science and Technology for approval. Then the budget is sent to the Ministry of Finance, which has the right to reject it. The approved budget is the official document required to finance all the operations of the Institutes.
Table 3.4 Total Government Funding of CSIR, 1996-98 (in million Cedis)
Development Funds Year Requested % Released % of GDP 1996 17, 074 18. 8 % 0.028 1997 24, 418 13. 5 % 0.023 1998 24, 085 13. 1 % 0.018*
Operational Funds Year Requested % Released % of GDP 1996 7, 038 30 % 0.018 1997 9, 485 20 % 0.013 1998 9, 790 18 % 0.010*
*Computed on the basis of an estimate of GDP; Source: Council for Scientific and Industrial Research
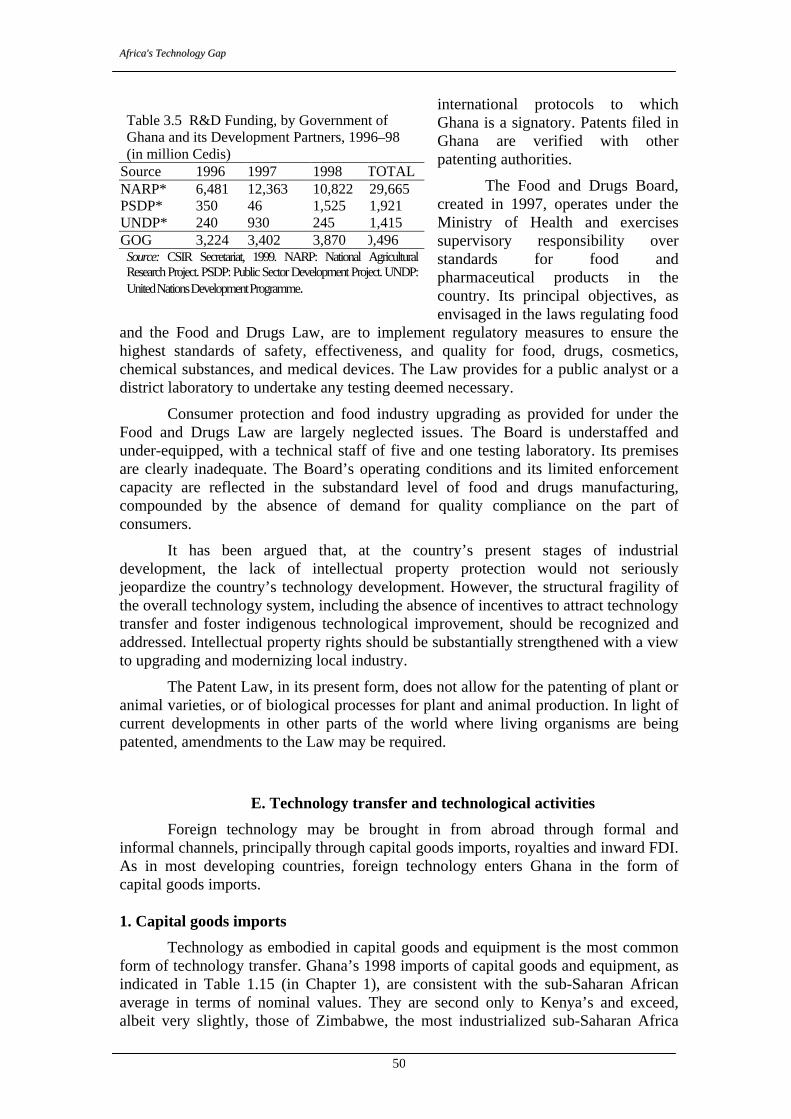
AAffrriiccaa''ss TTeecchhnnoollooggyy GGaapp
50
international protocols to which Ghana is a signatory. Patents filed in Ghana are verified with other patenting authorities.
The Food and Drugs Board, created in 1997, operates under the Ministry of Health and exercises supervisory responsibility over standards for food and pharmaceutical products in the country. Its principal objectives, as envisaged in the laws regulating food
and the Food and Drugs Law, are to implement regulatory measures to ensure the highest standards of safety, effectiveness, and quality for food, drugs, cosmetics, chemical substances, and medical devices. The Law provides for a public analyst or a district laboratory to undertake any testing deemed necessary.
Consumer protection and food industry upgrading as provided for under the Food and Drugs Law are largely neglected issues. The Board is understaffed and under-equipped, with a technical staff of five and one testing laboratory. Its premises are clearly inadequate. The Board’s operating conditions and its limited enforcement capacity are reflected in the substandard level of food and drugs manufacturing, compounded by the absence of demand for quality compliance on the part of consumers.
It has been argued that, at the country’s present stages of industrial development, the lack of intellectual property protection would not seriously jeopardize the country’s technology development. However, the structural fragility of the overall technology system, including the absence of incentives to attract technology transfer and foster indigenous technological improvement, should be recognized and addressed. Intellectual property rights should be substantially strengthened with a view to upgrading and modernizing local industry.
The Patent Law, in its present form, does not allow for the patenting of plant or animal varieties, or of biological processes for plant and animal production. In light of current developments in other parts of the world where living organisms are being patented, amendments to the Law may be required.
E. Technology transfer and technological activities
Foreign technology may be brought in from abroad through formal and informal channels, principally through capital goods imports, royalties and inward FDI. As in most developing countries, foreign technology enters Ghana in the form of capital goods imports. 1. Capital goods imports
Technology as embodied in capital goods and equipment is the most common form of technology transfer. Ghana’s 1998 imports of capital goods and equipment, as indicated in Table 1.15 (in Chapter 1), are consistent with the sub-Saharan African average in terms of nominal values. They are second only to Kenya’s and exceed, albeit very slightly, those of Zimbabwe, the most industrialized sub-Saharan Africa
Table 3.5 R&D Funding, by Government of Ghana and its Development Partners, 1996–98 (in million Cedis)
Source 1996 1997 1998 TTOTAL NARP* 6,481 12,363 10,822 29,665 PSDP* 350 46 1,525 1,921 UNDP* 240 930 245 1,415 GOG 3,224 3,402 3,870 10,496 Source: CSIR Secretariat, 1999. NARP: National Agricultural Research Project. PSDP: Public Sector Development Project. UNDP: United Nations Development Programme.
TThhee CCaassee ooff GGhhaannaa
51
country after South Africa. However, Ghana’s figures do not compare well with those of other developing countries except for India, which still has a highly protected capital goods industry. Malaysia, on the other hand, as the leading capital goods importer among developing countries, allocates much of its new machinery and equipment to upgrading of telecommunication and information infrastructure, as well as to export-oriented activities linked to transnational corporations. 2. Royalties
A second avenue of formal technology import is through royalty and technical fee payments. UNCTAD data indicate that sub-Saharan Africa as a whole, excluding South Africa, paid $84 million in 1997, of which $78 million was from Kenya and Swaziland. South Africa spent $258 million. Ghana’s payments for royalties and license fees indicate that only a trickle of new technology in the form of royalties and licenses is entering the country. It appears insignificant in comparison to those of newly industrializing countries: for example, Korea spent $2,413 million, Thailand $813 million, India $150 million and China $543 million. 3. Foreign direct investment
The cumbersome legal and administrative framework was replaced in 1994 with a liberal and competitive investment code embodying “best country” practices, including a set of tax incentives. Dependence on income-based taxes, which characterized much of the 1980s, has been greatly reduced. Corporate tax rates have been reduced significantly to encourage FDI, although they remain high compared to the average rates in Asia.
During the period 1987–98, Ghana ranked tenth in Africa in terms of FDI inflows. The presence of foreign affiliates, however, does not seem to have much impact on domestic technology development; the bulk of these affiliates are operating in the primary sector and in services. Manufacturing accounted for only 25 per cent of total inflows during the period 1995–98.
F. Human capital
Skills and technological activity are closely interlinked. The present pace of technical progress, the spread of information technologies and intensifying global competition result in quickly evolving skill needs. The traditional formula of industrial development through primary schooling, basic technical education and ad-hoc on-the-job training is no longer adequate. In the current competitive setting, high-level and specialized training, with close interaction between education and industry for assessing and communicating evolving needs, has become a basic feature of human capital development.
At its independence, Ghana had a better education system than other sub-Saharan African countries. It still has a higher rate of secondary-level enrolment than Kenya, Tanzania and Uganda. However, in terms of technical education, as measured by the engineering enrolment index, Ghana has performed worse. Moreover, Ghana, like the other case study countries, does poorly on the global scene. The gap between education and human capital, however measured, is wide in most developing countries.
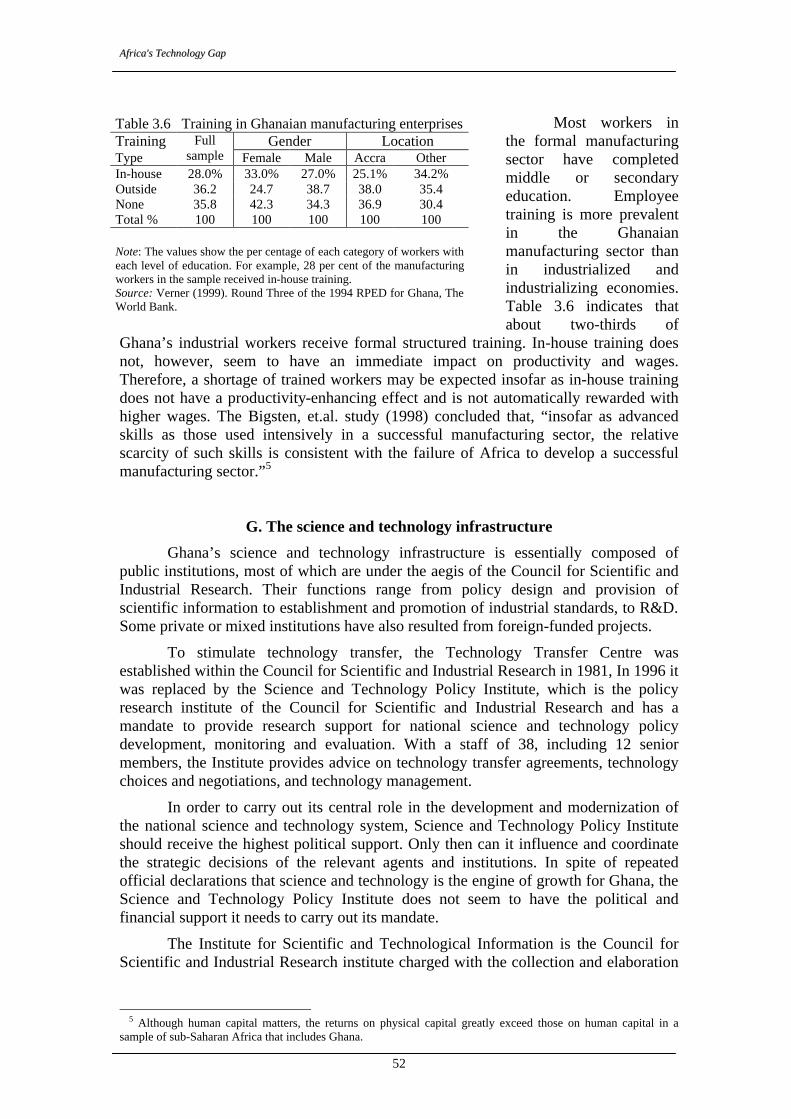
AAffrriiccaa''ss TTeecchhnnoollooggyy GGaapp
52
Table 3.6 Training in Ghanaian manufacturing enterprises Training Gender Location Type
Full sample Female Male Accra Other
In-house 28.0% 33.0% 27.0% 25.1% 34.2% Outside 36.2 24.7 38.7 38.0 35.4 None 35.8 42.3 34.3 36.9 30.4 Total % 100 100 100 100 100 Note: The values show the per centage of each category of workers with each level of education. For example, 28 per cent of the manufacturing workers in the sample received in-house training. Source: Verner (1999). Round Three of the 1994 RPED for Ghana, The World Bank.
Most workers in
the formal manufacturing sector have completed middle or secondary education. Employee training is more prevalent in the Ghanaian manufacturing sector than in industrialized and industrializing economies. Table 3.6 indicates that about two-thirds of
Ghana’s industrial workers receive formal structured training. In-house training does not, however, seem to have an immediate impact on productivity and wages. Therefore, a shortage of trained workers may be expected insofar as in-house training does not have a productivity-enhancing effect and is not automatically rewarded with higher wages. The Bigsten, et.al. study (1998) concluded that, “insofar as advanced skills as those used intensively in a successful manufacturing sector, the relative scarcity of such skills is consistent with the failure of Africa to develop a successful manufacturing sector.”5
G. The science and technology infrastructure
Ghana’s science and technology infrastructure is essentially composed of public institutions, most of which are under the aegis of the Council for Scientific and Industrial Research. Their functions range from policy design and provision of scientific information to establishment and promotion of industrial standards, to R&D. Some private or mixed institutions have also resulted from foreign-funded projects.
To stimulate technology transfer, the Technology Transfer Centre was established within the Council for Scientific and Industrial Research in 1981, In 1996 it was replaced by the Science and Technology Policy Institute, which is the policy research institute of the Council for Scientific and Industrial Research and has a mandate to provide research support for national science and technology policy development, monitoring and evaluation. With a staff of 38, including 12 senior members, the Institute provides advice on technology transfer agreements, technology choices and negotiations, and technology management.
In order to carry out its central role in the development and modernization of the national science and technology system, Science and Technology Policy Institute should receive the highest political support. Only then can it influence and coordinate the strategic decisions of the relevant agents and institutions. In spite of repeated official declarations that science and technology is the engine of growth for Ghana, the Science and Technology Policy Institute does not seem to have the political and financial support it needs to carry out its mandate.
The Institute for Scientific and Technological Information is the Council for Scientific and Industrial Research institute charged with the collection and elaboration
5 Although human capital matters, the returns on physical capital greatly exceed those on human capital in a
sample of sub-Saharan Africa that includes Ghana.
TThhee CCaassee ooff GGhhaannaa
53
of scientific information. Its clientele consists mostly of researchers and students. It does not have any linkages with private firms.
1. Standards and quality
The Ghana Standards Board is the national statutory body for ensuring industrial quality through standards, metrology, and testing and quality assurance. It was established in 1967 with the following objectives: to establish and promulgate standards; to promote standardization in industry and commerce; and to promote standards in public and industrial welfare, health and safety. The Board has five technical divisions: Standards and Specifications, Chemical Laboratories, Physical Laboratories, Quality Assurance, and Metrology.
Of its 403 staff members, 250 are in financial and administrative functions. Of the remaining technical staff, 49 hold master’s degrees. The disproportionately large number of non-technical staff members imposes a further burden on an institute already constrained by budgetary limitations. Moreover, salaries, which are pegged to the government scale, do not enable the Board to attract and retain the best technicians and scholars. Nevertheless, the level of the technical and scientific expertise available in-house is deemed adequate by the business community.
Industrial standards6 are a relatively new feature in industrial development. Their importance has increased along with the pace of technical progress, the growing complexity of new products, and increasing multiple uses of the same technologies. Standards contribute to the diffusion of technology within and across industries. In developing countries, a standards institution may disseminate best practice in an industry by encouraging and helping firms to assimilate and apply new standards. Redundant experimentation with new technologies is thus avoided, and enterprises learn a language common not only in domestic but also in international markets. Standards thus promote efficiency, reduce expenses, and facilitate inter-firm technical linkages and collaboration. In view of these considerations, the Ghana Standards Board should play a central role in enhancing the perspectives for industrial development.
The Board, however, is beset by several weaknesses, particularly inadequate budgetary resources for improving technical competence and capacity to assist local industry. Salaries presently account for an increasingly disproportionate share of the budget (having gone from 60 per cent in 1994–95 to 77 per cent in 1998–99), while only 2 per cent is spent on staff training. Table 3.7 shows that no funding is available for R&D. Total revenues amounted to about $2.2 million, twice as much as in the analogous institution in Uganda, but much less than in other sub-Saharan Africa countries. Although the share of service and consultancy fees received from local firms is in line with the targets set by the Ministry of Environment, Science and Technology, the Government still contributes 82 per cent of total revenues. As there is no allocation for the purchase of new equipment, the Board’s equipment is old, obsolete and probably malfunctioning. The Ghana Standards Board is believed to have the best equipment for industrial standardization in the country, but this may be a sign of the overall low technological level of Ghana’s industry, rather than of the Board’s technical excellence.
6 Standards are a set of technical specifications used as rules or guidelines to describe the characteristics of a
product, a service, a process, or a material. In the global market, traded products and services are increasingly required to conform to standards and regulations.
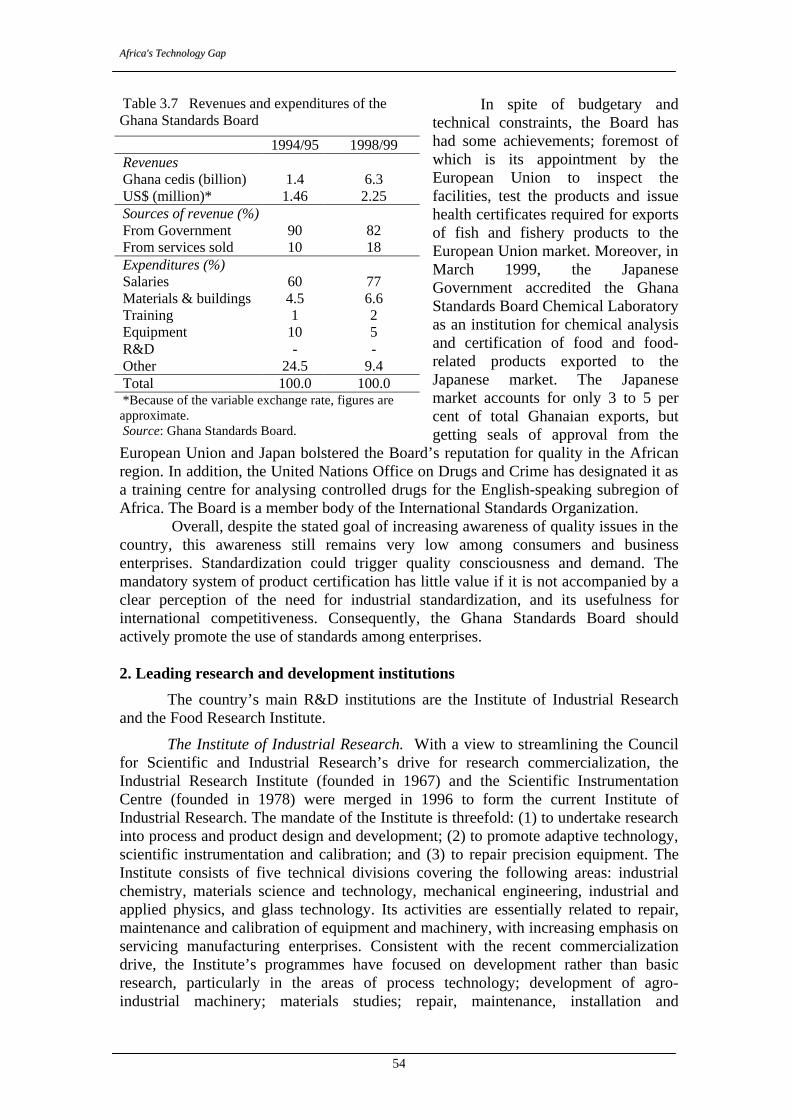
AAffrriiccaa''ss TTeecchhnnoollooggyy GGaapp
54
In spite of budgetary and technical constraints, the Board has had some achievements; foremost of which is its appointment by the European Union to inspect the facilities, test the products and issue health certificates required for exports of fish and fishery products to the European Union market. Moreover, in March 1999, the Japanese Government accredited the Ghana Standards Board Chemical Laboratory as an institution for chemical analysis and certification of food and food-related products exported to the Japanese market. The Japanese market accounts for only 3 to 5 per cent of total Ghanaian exports, but getting seals of approval from the
European Union and Japan bolstered the Board’s reputation for quality in the African region. In addition, the United Nations Office on Drugs and Crime has designated it as a training centre for analysing controlled drugs for the English-speaking subregion of Africa. The Board is a member body of the International Standards Organization.
Overall, despite the stated goal of increasing awareness of quality issues in the country, this awareness still remains very low among consumers and business enterprises. Standardization could trigger quality consciousness and demand. The mandatory system of product certification has little value if it is not accompanied by a clear perception of the need for industrial standardization, and its usefulness for international competitiveness. Consequently, the Ghana Standards Board should actively promote the use of standards among enterprises.
2. Leading research and development institutions
The country’s main R&D institutions are the Institute of Industrial Research and the Food Research Institute.
The Institute of Industrial Research. With a view to streamlining the Council for Scientific and Industrial Research’s drive for research commercialization, the Industrial Research Institute (founded in 1967) and the Scientific Instrumentation Centre (founded in 1978) were merged in 1996 to form the current Institute of Industrial Research. The mandate of the Institute is threefold: (1) to undertake research into process and product design and development; (2) to promote adaptive technology, scientific instrumentation and calibration; and (3) to repair precision equipment. The Institute consists of five technical divisions covering the following areas: industrial chemistry, materials science and technology, mechanical engineering, industrial and applied physics, and glass technology. Its activities are essentially related to repair, maintenance and calibration of equipment and machinery, with increasing emphasis on servicing manufacturing enterprises. Consistent with the recent commercialization drive, the Institute’s programmes have focused on development rather than basic research, particularly in the areas of process technology; development of agro-industrial machinery; materials studies; repair, maintenance, installation and
Table 3.7 Revenues and expenditures of the Ghana Standards Board
1994/95 1998/99 Revenues Ghana cedis (billion) 1.4 6.3 US$ (million)* 1.46 2.25 Sources of revenue (%) From Government 90 82 From services sold 10 18 Expenditures (%) Salaries 60 77 Materials & buildings 4.5 6.6 Training Equipment
1 10
2 5
R&D - - Other 24.5 9.4 Total 100.0 100.0 *Because of the variable exchange rate, figures are approximate. Source: Ghana Standards Board.
TThhee CCaassee ooff GGhhaannaa
55
calibration of sophisticated industrial equipment; and development of science and technology equipment.
The Institute’s staff of 135 includes 38 research-grade staffers, 44 technical and administrative staffers and 53 junior staffers. The Director and his deputy are Ph.D. holders, and the heads of the five technical divisions have master’s degrees. The staff is paid according to the Government scale, which does not compare well with jobs elsewhere. Moreover, the salaries of the scientific personnel are relatively lower than those of the administrative and support staff. Government salary levels and policies are serious disincentives to scientific and academic achievements and development. The 1996 merger further reduced the government financing of the Institute of Industrial Research. Of the 1,300,000 Cedis (about $370,000) allocated to it in 1999, only 6 per cent was allocated to R&D activities.
As the principal industrial research institute serving the industrial sector, the Institute has had a rather limited reach, although the number of users rose from 30 in 1997 to 114 in 1999 and includes public institutions such as the Ghana Civil Aviation Authority, the Ghana Highway Authority and the Ghana Standards Board. About 50 per cent of the clients are in the food industry, 10 per cent in mining, and another 10 per cent in hospitals, medical laboratories, secondary schools and universities. Much more needs to be done to reach the private industrial sector, especially the small and medium-sized enterprises.
The Institute has developed a number of technologies, processes and products.7 It also offers consulting services ranging from providing industrial and technological information to writing equipment specifications for prospective technology buyers. In addition, it installs precision and industrial equipment and undertakes instrument surveys, chemical and biochemical analyses, room acoustics design, noise and vibration measurement and noise pollution control, as well as the preparation of environmental impact assessments and environmental management plans.
The Institute’s mandate responds to the national need for technological support in adapting foreign technologies to local industrial needs, and in ensuring industrial application of research findings. However, it lacks the resources to ensure the skills level of its staff and the effectiveness of its equipment. Furthermore, it does not have a strategy for reaching out to a broader range of businesses and entrepreneurs, or for linking its programme activities to the needs and demands of the industrial production sector. Its activities are essentially supply-driven and dictated by the limited range of in-house expertise.
The Food Research Institute. The second most important R&D institute of the Council for Scientific and Industrial Research is the Food Research Institute. Its mandate is “to undertake applied research through laboratory and pilot scale investigations into the processing, preservation and storage, transportation and distribution of staple and non-staple plant and animal foods in the country, with a view to producing new foods and improving upon traditional ones”. This Institute has three scientific divisions covering food microbiology, food chemistry, and food processing and engineering. Its research programmes include the processing and storage of cereal, grain legumes, root and tuber crops, fruits and vegetables, and the handling, processing and preservation of fish and meat. Other areas of work are fats and oils studies, food packing, solar energy application and mushroom cultivation.
7 These include a groundnut dehuller/grinder; a process for making liquid soap from cocoa hulks and used palm branches; a crude soy oil refining process; fitted glazes and alumino-silicate refractors with kiln furniture; biogas technology; various LPG cook stoves; and technology for extracting essential oils from local plants.
AAffrriiccaa''ss TTeecchhnnoollooggyy GGaapp
56
The Food Research Institute is better staffed than the Institute of Industrial Research; its staff of 172 consists of 36 research-grade employees, 37 senior technical and administrative staffers and 99 junior staffers. The research staff members, five of whom hold Ph.D. degrees, include engineers, food scientists and technologists, biochemists, microbiologists, economists, nutritionists and myco-toxicologists. The Institute actively solicits scholarships and training workshops for its research and junior staff while offering incentives, including paid study leave, to encourage the pursuit of higher education. It also hosts doctoral candidates from universities to participate in projects. Probably because of its active learning policies, the Institute has gained a good reputation in the country for its research staff. However, the low pay levels and service conditions remain a serious deterrent to attracting and retaining trained employees. Unless these are supplemented by extrabudgetary financing, possibly from a donor-sponsored project, the Institute will continue to be weakened by high staff turnover and loss of experienced scientists.
The Institute has received funding from multilateral and bilateral development assistance sources, reflecting the priority attached by the donor community to the development of the agricultural sector, especially staple food production and storage. While this policy addresses current food problems, it could sideline research on nontraditional agro-industrial processes and project development.
The Institute has been transferring its technologies and R&D findings to industry and to the general public.8 Besides these technology transfer activities, the Institute offers technical services such as food analysis; product quality improvement; identification and selection of food-processing equipment, and training of quality control officers and food-processing technicians. These services offer the best prospects for self-financing, which in 1999 accounted for only 7 per cent of the institute’s budget. More than 100 clients have been served through its Business Development Division. However, the Institute’s capability to disseminate scientific information with commercial potential, and to generate commissioned research projects, still appears limited. As in most scientific institutions, dissemination of research findings, undertaking of pilot-scale projects and consulting services are often viewed as secondary functions. Moreover, the scholar mentality is prevalent among Food Research Institute staff members, particularly scientists, who generally see their principal and only function as undertaking research programme and meeting the national development objectives. 3. Other research and development institutions
The Ghana Regional Appropriate Technology Service is one of the leading institutions promoting the transfer and use of technology in industry. It was created in 1987 with funding from the Canadian Agency for International Development and the European Commission in order "to promote grass-root industrialisation in Ghana" through consulting services and training of micro- and small-scale industrialists. As a channel for transferring intermediate technology to the 10 regions of the country, the Ghana Regional Appropriate Technology Service also aimed at halting and reversing rural-urban migration.
The Service employs a total of 287 people at its head office and nine Intermediate Technology Transfer Units. Its relatively low salary scale has been an
8 This includes improved fish-smoking equipment locally known as the Chorkor smoker; instant plantain,
cocoyam, yam, and cowpea products; prepared cassava meal; and improved kokonte powder. The Food Research Institute has also developed technology for refining vegetable oils.
TThhee CCaassee ooff GGhhaannaa
57
important cause of high labour turnover. The Service is in transition from being a Ministry of Environment, Science and Technology project to being a non-profit limited liability foundation, with the active agreement and participation of the Government and donors like the Canadian International Development Agency, the European Union, Japan International Cooperation Agency and others.
The Intermediate Technology Transfer Units provide technical advice and training and manufacture equipment for rural as well as small-scale engineering and manufacturing industries.9 They also hold demonstration workshops for interested clients to introduce new industrial processes. The Ghana Regional Appropriate Technology Service helps clients purchase machinery through a hire-purchase scheme and subsidized loans. Its achievements include a network of nearly 16,000 beneficiaries including micro- and small entrepreneurs as well as technical apprentices and trainees. A majority of the clients come from domestic small and medium-sized enterprises, although the Service has also provided support to other sub-Saharan African countries.10
The Service’s strengths include its close contact with enterprises, which includes monthly client associations meetings; its national coverage with Intermediate Technology Transfer Units in all 10 regions; its practical and problem-solving orientation; and its International Standards Organization 9000 awareness training. In 1997 the percentage of total costs covered by earnings through sales of goods and services was only 46 per cent; in the following year this figure rose to 53 per cent. The Service’s major weaknesses include heavy dependence on government subsidies and donor support and a loan recovery ratio of only around 50 per cent. The concentration of activities on development and training programmes may also hinder self-sufficiency.
In addition to the public technology transfer institutions mentioned above, there is Technoserve, established in 1971 as an international non-governmental organization. Its main aim is to increase rural productivity, incomes and job access through agricultural business development and farmer training programmes. It provides services at cost.
Created as a joint project of the UNDP, Barclays Bank Ghana and the National Board for Small-Scale Industries, EMPRETEC had by 1994 become a foundation providing entrepreneurship and business management training, as well as consultancy and extension support services. Through its five offices around the country and its 65-strong staff, including 35 professionals, EMPRETEC offers technology advice, and provide information on sources of attractive credit packages, and foreign technology.11 It focuses mainly on business services, rather than technology. It is not linked to the national technology system nor with the Council for Scientific and Industrial Research and its institutes.
The Technology Consultancy Centre was originally established in 1972 as a production unit of the University of Science and Technology in Kumasi. It currently serves as a conduit through which University research is made available to industry. Most of its clients are small and medium-sized enterprises in the informal sector, and technologies transferred are mainly on food processing, fabrication of small-scale machinery and parts, and ceramics manufacture and foundry works. The Centre is
9 Training is offered in textiles processing; design of industrial parts and equipment; manufacturing of industrial
spare parts; repair of industrial machinery; and automobiles. 10 Ghana Regional Appropriate Technology Service has exported shea butter machinery to Burkina Faso, cotton-
spinning wheels to Uganda and fish-smoking equipment to Mauritania. 11 The foundation appears to be very successful and enjoys good access to international donors.
AAffrriiccaa''ss TTeecchhnnoollooggyy GGaapp
58
generally considered useful in facilitating the transfer and adaptation of technology. Its effectiveness is, however, limited by the Centre’s size and coverage. The Centre benefits from substantial financial assistance from international organizations.
Development and Application of Intermediate Technology is a US Agency for International Development (USAID) project; its main focus is technology transfer to rural industries. Among the simple agricultural machinery it has transferred are solar dryers, rice planters, maize cribs, wooden grain storage silos, snail-farming equipment and industrial food slicers. It has transferred production processes such as the manufacture of liquid soap from agricultural waste, and the extraction of oil from plants. The project does not develop technologies but works in close collaboration with the Council for Scientific and Industrial Research Institutes, especially the Institute of Industrial Research and the Food Research Institute, as well as the Technology Transfer Centre.
The Rural Enterprise Project is another technology transfer project focused on the rural development economy. It specializes in upgrading agro-based small-scale industries, replacing inefficient, obsolete technologies with more efficient ones.
H. Major science and technology training and educational institutions in Ghana
The major institutions include the four main universities in Ghana: the University of Ghana in Legon, Accra, the Kwame Nkrumah University of Science and Technology in Kumasi, the University of Cape Coast and the University for Development Studies. All these universities have faculties of science, medicine and agriculture. Kwame Nkrumah University of Science and Technology, the principal professional training institution in science and technology, also has faculties of engineering, pharmacy and architecture, as well as a programme in industrial management. Business management training is run by the University of Ghana. However, as was noted earlier, the country’s educational system is not able to meet the local industrial and service sectors.
Another important training institution is the Ghana Institute of Management and Public Administration, established in 1961 as a joint government and United Nations Special Fund Project. With a staff of 25 lecturers, it provides management training in commerce, industry and public administration. It is also setting up a distance learning centre with the assistance of the World Bank.
The Management Development and Productivity Institute also provides short-term training aimed at improving management practices and maximizing efficiency and productivity in industry, commerce and related fields. It originated as a joint UNDP, International Labour Organization and Government of Ghana project, and then reverted fully to Government ownership and control in 1977. It operates an Entrepreneurship Development Programme for private-sector enterprises.
The regional Polytechnics around the country mainly produce middle-level science and technology manpower. These institutes provide hands-on technical training up to the Higher National Diploma level in most fields of science, engineering, commerce and management.
TThhee CCaassee ooff GGhhaannaa
59
I. Conclusions
Ghana's 30-year effort to develop science and technology capability has achieved little, as is illustrated by the serious skill and technical deficiencies at all levels of industry. The lack of specialized training institutes hampers firms’ efforts to upgrade manpower skills. Moreover, long-standing protectionist policies have prevented the development of competitiveness in the industrial sector. This could have led to demand for better and more efficient technology, which in turn could have stimulated science and technology organizations to create more advanced, useful and affordable products.
Incentives introduced in the 1980s as part of the external reference price have had little impact, overwhelmed by the poor supply-side firm-level technological capabilities and the weak and fragmented institutional framework. In 1996 the manufacturing value added per capita remained at its 1980 level of $33 (see Table 2.1 in Chapter 2). Several industries suffered during these years, and there is little sign of the emergence of competitive and dynamic manufacturing activities.
Primary production and processing activities constitute Ghana’s comparative advantage in an increasingly competitive global market. Upgrading industrial capabilities therefore needs to be the starting point in achieving international competitiveness. This will require a comprehensive strategy centred on improvement of local skills and capabilities, assimilation of new technology and skills, and strengthening of institutional support for the transfer and adaptation of new technologies. Demand for precision and measurement needs to be stimulated if the country wants to pursue a strategy of industrial and technological development.
Moreover, awareness of the cause-and-effect relationship between science and technology and the industrial competitiveness level needs to be increased. A strategy is needed to stimulate technology demand within the industrial sector, to monitor industrial needs, and to link R&D to industrial and manufacturing requirements. Science and technology policy enjoys a central role on paper, whereas the management of macroeconomic balances enjoys a much higher political status. These two development issues should not be considered as competing priorities, but rather as mutually complementing elements of a comprehensive strategy for national economic development.
J. Policy recommendations 1. Improving technology strategy formulation
The importance of science and technology for the country’s development is highlighted in its Vision 2020, which explicitly states that
“The enormity of the advantages and benefits from science and technology development in our socio-economic venture seems to have been lightly appreciated, even at the highest level of decision making. Recognition by decision-makers at the highest level of the importance of science and technology as a tool for the rapid development of the country, and by the public in general, is crucial to any effort to adopt a science and technology culture.”
AAffrriiccaa''ss TTeecchhnnoollooggyy GGaapp
60
The Science and Technology Policy Research Institute of the Council for Scientific and Industrial Research has been mandated to design science and technology transfer policy to provide research support for national science and technology policy development. However, it does not have the political clout to perform this role effectively, especially in terms of influencing and coordinating strategic decisions among relevant agencies and institutions. Therefore, it is recommended that the Government of Ghana empower and entrust one body with analysing technology needs and designing and implementing strategies. 2. Coordinating and planning the science and technology system in Ghana
Coordination and planning of the science and technology system in Ghana has faced enormous difficulties stemming from excessive fragmentation among different science- and technology-related agencies. Moreover, private productive and financial actors are not sufficiently involved in strategy design and implementation. To address this problem, an Office of Science Adviser to the President has been proposed in the new science and technology policy to raise public awareness of science and technology issues and to coordinate inter-ministerial and inter-institutional collaboration. An alternative proposal has been to establish a National Science and Technology Commission, to be headed by the President himself and composed of key ministers and business leaders. The sheer number and variety of institutions involved, however, could seriously compromise the effectiveness of such a commission. A third option, the appointment of a Science Adviser to the President, may have the advantage of streamlined efficiency, but it should be backed with top political support and credibility of all the actors involved. This official should have not only the necessary technical competence but also the confidence of political leaders and all other stakeholders whichever option is taken. The importance of technology policy for long-term industrial growth and economic competitiveness needs to be recognized at all levels of the Government. Technology plans of many industrialized and newly industrialized countries are being set out on the basis of Technology Foresight programmes developed with all parties concerned with science and technology – industrial leaders and researchers, academia, services, financial institutions and the Government. The strength of such programmes lies in their consultative component, which in itself creates awareness of the importance of technological competitiveness. It also allows for an overall evaluation of the strengths and weaknesses of national innovation systems, builds consensus for carrying out a common plan of action, and facilitates the mobilization of resources and commitment.
The second general recommendation of this report is that the Ghanaian Government undertake a Technology Foresight exercise to assess local technological competence as measured by global standards. The exercise can be modelled on the experience of other developing countries and adapted to Ghana’s needs and technological conditions. Such an exercise should lead to more effective science and technology policies and actions, including upgrading of technical skills and capabilities, strengthening of science- and technology-related institutions, and promotion of entrepreneurial skills.
3. Improving human capital and skills
Ghana’s human resources are symptomatic of a deteriorating education system and the widening gap between education and industrial skill needs. This gap cannot be adequately filled by ad-hoc enterprise training activities. Moreover, its constantly changing nature makes it difficult to define and address. Concurrent improvements in
TThhee CCaassee ooff GGhhaannaa
61
Box 3.1 Cooperation between Governments and transnational corporations on training: The case of Singapore
Public policies play an important role in facilitating cooperation and coordination
between Government and transnational corporations, and among transnational corporations and local firms. Singapore's collaborative schemes for long-term manpower development with transnational corporations are an interesting case in point. The management of industrial policy and foreign direct investment targeting in Singapore was centralized in the Economic Development Board of the Ministry of Trade and Industry. The Economic Development Board was endowed with the authority to co-ordinate all activities relating to industrial competitiveness and foreign direct investment. The agency has become the global benchmark for foreign direct investment promotion and approval procedures. Its ability to raise local skills and capabilities in order to match the needs of foreign investors has been vital.
In return for Government assistance in securing industrial land at reasonable rents, tax-free remittances of technical fees, and a tax holiday,1 Tata (India) in 1972 assisted in the establishment of a training centre in collaboration with the Economic Development Board*. The Government provided the premises and equipment, and 70 per cent of its operating costs. Tata supplied the instructors. The agreement required for Tata to train twice the number of skilled workers required for its own precision engineering complex. The excess workers trained could be released to industry through a Government institution.
For establishing a joint training centre in collaboration with the Government, Rollei
(Germany) was given the right of first refusal for a 10-year period from January 1972 for the manufacture of optical lenses and photographic equipment in Singapore. Rollei argued that this concession was necessary to prevent its Japanese competitors from acquiring the know-how transferred by Rollei to Singapore. There are several other training programmes that are jointly implemented by the Economic Development Board and transnational corporations present in the country. Sources: Economic Development Board of Singapore
the education system and in industry, a standard policy feature in an increasing continuous number of countries, would be an effective way of bridging the country’s technology gap.
A related measure would be to provide incentives for firms to undertake training programmes that go beyond their immediate job needs. Incentives should be based on both demand and supply – on the one hand, strengthening fiscal incentives for training expenditures and advocating the use of specialized training institutes or private consultants, and, on the other hand, strengthening existing training institutions, particularly by adapting their focus and programmes to the needs and conditions of the industrial sector. The participation of transnational corporations should be actively sought by the Ghana Investment Promotion Centre on behalf of the Government, as has been done in Singapore (see Box 3.1).
4. Accessing foreign technology and attracting foreign direct investment
Ghana does not import enough foreign technology. Capital equipment imports are in line with the regional average but are much smaller than in most developing countries. Payments for royalties and license fees are insignificant. Moreover, FDI
AAffrriiccaa''ss TTeecchhnnoollooggyy GGaapp
62
flows declined in the late 1990s. Although the FDI policy regime has been improved recently, serious obstacles remain. These include land shortages, inadequate utility installations and services, and cumbersome import procedures. These obstacles should be overcome, and coordination among the various government bodies involved with foreign investors, particularly with the Ghana Investment Promotion Centre, should be improved. Nonetheless, Ghana’s Free Zones Board scheme appears successful and well supported by foreign investors (see Box 3.2 ). The main focus of technology transfer policy has to be on market information on sources, costs and adaptability of foreign technologies and on technical extension services to help adapt and absorb new technologies.
The newly industrialized East Asian economies have ensured that local enterprises receive up-to-date information on sources of technology import, with online databases in all major industrial centres. Market intelligence is backed by an extensive support system providing advice, financing, consultancy and marketing support. The importance of providing information on sources of foreign technology cannot be overstated. Firms in developing countries, especially small-scale ones geared to the domestic market, often cannot afford costly mistakes in terms of equipment purchase and faulty production. Incidentally, foreign aid has been shown to increase the risk of selecting inappropriate technologies.
Technology upgrading has to be based on current technological level and the needs of the manufacturing and industrial sectors. Technology benchmarking exercises, which have been successfully used by newly industrialized countries to assess their levels and needs, would be very useful. A Benchmarking Unit might be established in the Ministry of Trade and Industry. A small team could be trained to develop, implement and analyse benchmarking methods for leading industrial activities, involving the private sector and associations as much as possible in the effort.
5. Research and development in the industrial sector
In Ghana, as in other sub-Saharan countries, 90 per cent of research is undertaken by public institutions. This contrasts with the practices in most newly industrializing developing countries, where private enterprises finance and undertake R&D. Moreover, there is little awareness in the industrial sector itself of the importance of in-firm technological effort. Most enterprises operate on a small scale, using simple machinery to produce low-quality goods. Technical and managerial skills are relatively low, and there are few signs of product or process innovation. Compared to other countries in the region,12 Ghana has smaller firms with a less educated workforce.
Imported technology is often not used at optimal levels because of low technological capability. Few resources are invested in absorbing, adapting and improving new technology. Newly industrializing countries in East Asia are said to have reached and maintained international competitiveness through optimal use of imported technology, although they are not at the frontier of innovation. In Ghana, capital expenditures for R&D by a manufacturing company that is approved by the Ministry of Trade and Industry are fully deductible, but this incentive is smaller than in other countries.
12 Bigsten et al. (1998) compared firms from Cameroon, Ghana, Kenya, Zambia and Zimbabwe.
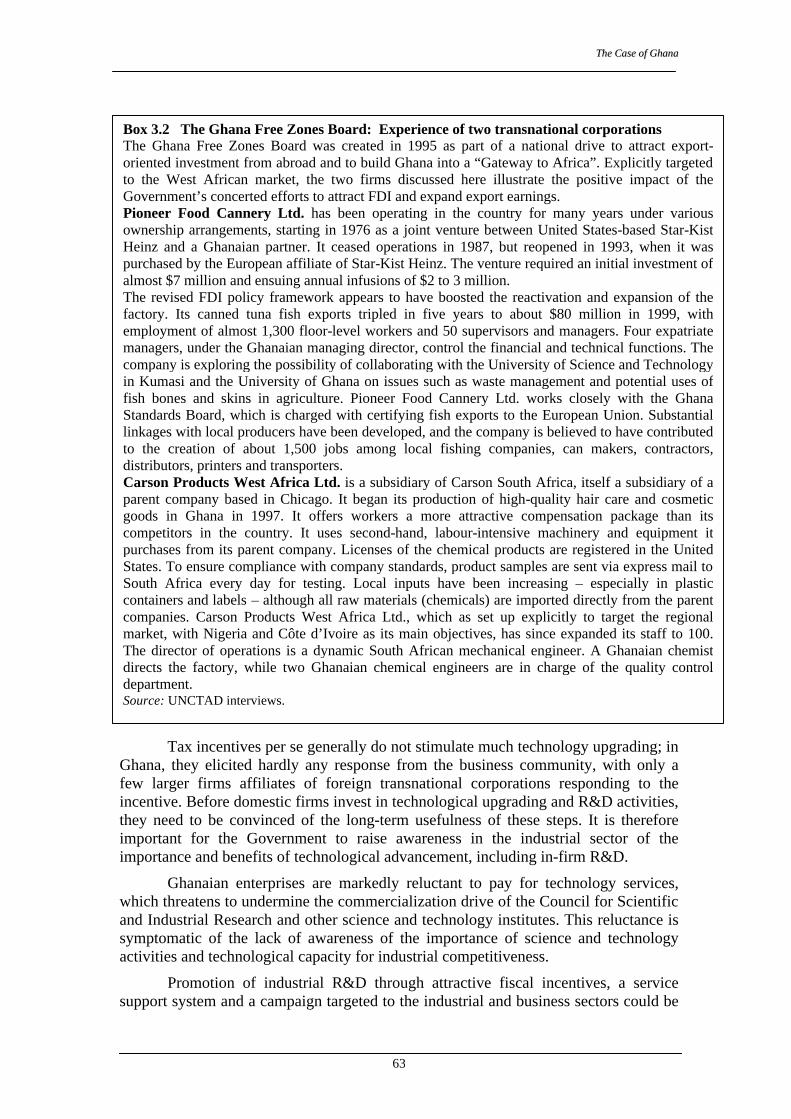
TThhee CCaassee ooff GGhhaannaa
63
Box 3.2 The Ghana Free Zones Board: Experience of two transnational corporations The Ghana Free Zones Board was created in 1995 as part of a national drive to attract export-oriented investment from abroad and to build Ghana into a “Gateway to Africa”. Explicitly targeted to the West African market, the two firms discussed here illustrate the positive impact of the Government’s concerted efforts to attract FDI and expand export earnings. Pioneer Food Cannery Ltd. has been operating in the country for many years under various ownership arrangements, starting in 1976 as a joint venture between United States-based Star-Kist Heinz and a Ghanaian partner. It ceased operations in 1987, but reopened in 1993, when it was purchased by the European affiliate of Star-Kist Heinz. The venture required an initial investment of almost $7 million and ensuing annual infusions of $2 to 3 million. The revised FDI policy framework appears to have boosted the reactivation and expansion of the factory. Its canned tuna fish exports tripled in five years to about $80 million in 1999, with employment of almost 1,300 floor-level workers and 50 supervisors and managers. Four expatriate managers, under the Ghanaian managing director, control the financial and technical functions. The company is exploring the possibility of collaborating with the University of Science and Technology in Kumasi and the University of Ghana on issues such as waste management and potential uses of fish bones and skins in agriculture. Pioneer Food Cannery Ltd. works closely with the Ghana Standards Board, which is charged with certifying fish exports to the European Union. Substantial linkages with local producers have been developed, and the company is believed to have contributed to the creation of about 1,500 jobs among local fishing companies, can makers, contractors, distributors, printers and transporters. Carson Products West Africa Ltd. is a subsidiary of Carson South Africa, itself a subsidiary of a parent company based in Chicago. It began its production of high-quality hair care and cosmetic goods in Ghana in 1997. It offers workers a more attractive compensation package than its competitors in the country. It uses second-hand, labour-intensive machinery and equipment it purchases from its parent company. Licenses of the chemical products are registered in the United States. To ensure compliance with company standards, product samples are sent via express mail to South Africa every day for testing. Local inputs have been increasing – especially in plastic containers and labels – although all raw materials (chemicals) are imported directly from the parent companies. Carson Products West Africa Ltd., which as set up explicitly to target the regional market, with Nigeria and Côte d’Ivoire as its main objectives, has since expanded its staff to 100. The director of operations is a dynamic South African mechanical engineer. A Ghanaian chemist directs the factory, while two Ghanaian chemical engineers are in charge of the quality control department. Source: UNCTAD interviews.
Tax incentives per se generally do not stimulate much technology upgrading; in Ghana, they elicited hardly any response from the business community, with only a few larger firms affiliates of foreign transnational corporations responding to the incentive. Before domestic firms invest in technological upgrading and R&D activities, they need to be convinced of the long-term usefulness of these steps. It is therefore important for the Government to raise awareness in the industrial sector of the importance and benefits of technological advancement, including in-firm R&D.
Ghanaian enterprises are markedly reluctant to pay for technology services, which threatens to undermine the commercialization drive of the Council for Scientific and Industrial Research and other science and technology institutes. This reluctance is symptomatic of the lack of awareness of the importance of science and technology activities and technological capacity for industrial competitiveness.
Promotion of industrial R&D through attractive fiscal incentives, a service support system and a campaign targeted to the industrial and business sectors could be
AAffrriiccaa''ss TTeecchhnnoollooggyy GGaapp
64
a key to success. Industry associations could play a major role in this campaign, as has happened in newly industrializing countries in Asia. 6. Strengthening the technology infrastructure and institutions
The national technology infrastructure as well as the working programmes and functions need to be assessed and reprogrammed in light of the country’s current technology needs and economic development goals. Such reform should be solidly grounded in an economic accounting for the costs and benefits of every programme. The concept of costing activities, including their opportunity costs, and of assessing the economic and social impact of specific programmes should be considered. Act 521 (1996) highlighted private-sector concerns and introduced market principles into the operations of the Council for Scientific and Industrial Research, specifically through commercialization of research findings and technical assistance service. Receipts were to cover 30 per cent of the institutes’ respective budget within five years. It should be noted that in South Africa it took eight years for the national science and technology institute to achieve 25 per cent self-financing. To facilitate the process, the Institutes of the Council for Scientific and Industrial Research could redefine their activities and determine their respective market specializations.
Instead of basic research, the Council’s Institute for Industrial Research focuses on technology adaptation and improvement. This focus mirrors the industrial realities and needs of the country but seems to conflict with the economic and infrastructural realities of the country. The Institute is beset with problems, including underfunding, inadequate technical training, and insufficient equipment infrastructure. Most of its budget is used for salaries, with no allocations left for R&D. Its services are supply-driven and reach only a limited segment of industry. To fulfil its crucial role in the technological development of the country, the Institute needs a clear strategy for widening its customer base, assessing industrial needs and building a responsive, service-oriented, demand-driven programme.
The Food Research Institute, which benefits from foreign aid, is better funded and better equipped than the Institute of Industrial Research. Consequently, its level of technical activities is higher and its staff members better qualified and experienced. Since foreign aid donors have made national food sufficiency a priority, the work of the Institute has focused on the country’s short-term food needs rather than nontraditional items with export potential. While this work programme meets the immediate goal of poverty alleviation, it makes a limited contribution to broader technological progress.
Like most scientific institutions, the Institute does not prioritize dissemination of research findings or pilot projects. Applications of its research findings are very limited. The Institute has the most potential for taking a lead in stimulating technological development because of its access to funding and technical staff; it could show that research–industry linkages do not deter but actually support national development objectives.
Other research institutions in the country include the Ghana Regional Appropriate Technology Industrial Service, which was set up to promote and facilitate technology transfer to micro-enterprises. It is, however, severely handicapped by a 52 per cent loan recovery ratio. Steps have been taken to transform the Service into a foundation focusing on micro- and small enterprises and on the development and dissemination of intermediate technology.
TThhee CCaassee ooff GGhhaannaa
65
The Ghana Standards Board, which is relatively well equipped and staffed, has been gaining international recognition as an accreditation agency for export products such as food stuff, including fish and fish products. Additional funding to upgrade its administrative and operational levels, especially by strengthening its technical capacity and helping it service a wider clientele, could greatly improve the country’s export potentials industry in particular and could stimulate its technological development in general. More than other science and technology institutes, the Board is well placed to promote the concept of standardization and quality in the industrial sector. This in turn would stimulate quality consciousness and, consequently, consumer demand for better products. Industrial innovation responding to this demand would continue the cycle of demand for and supply of a wider variety of better-quality products. The industrial sector would then demand improved technical support in the purchase, adaptation and use of new technologies. The national science and technology infrastructure should be set up to produce and support this outcome. 7. Strengthening the regime of intellectual property protection
At this stage of industrial development, the weaknesses of the institutional system are irrelevant to the country’s technology development. Rather, they reflect the structural fragility of the overall technology system and the insufficiency of incentives to attract multiple forms of technology transfer and foster indigenous technological efforts. The protection of intellectual property rights (IPR) should be substantially strengthened and given a more prominent role when a higher level of industrial and technological development has been reached. Advantages of a strong IPR regime include the following:
§ Investment flows are seeking global destinations; the ability of transnational corporations to protect their knowledge assets is an increasingly important determinant of the destination of FDI. The importance of a potential destination’s IPR framework and the level of protection it provides increases with the level of technology a transnational corporation is bringing in. Countries seeking to attract technology-equipped FDI should therefore strengthen their IPR regime.
§ All World Trade Organization members have now agreed to reform their IPR regimes by 2004, in accordance with the TRIPS Agreement. These new “rules of the game” will provides the playing field – level or not – for all countries participating in globalization. Countries that do not subscribe to these rules risk economic isolation.
§ Many developing countries have become innovators in their own right, while others host R&D activities for transnational corporations. The Asian newly industrializing economies are now important holders of patents in the United States. For these countries, stronger IPR have been instrumental in promoting innovation and R&D-based inward FDI. For countries further down the technological scale, like Ghana, stronger IPR could help promote the development of a technology culture.

AAffrriiccaa''ss TTeecchhnnoollooggyy GGaapp
66
Chapter 4 The Case of Tanzania
A. Introduction
Since gaining independence in 1961, the United Republic of Tanzania has been slowly expanding its industrial base. When industrial output and capacity utilization declined in the early 1980s, the Government took measures to reverse the trend. Earlier strategies of inward-looking import substitution were dropped, and manufacturing was exposed to fairly rapid trade and domestic liberalization. By international standards, however, the industrial sector is basically rudimentary, dominated by simple activities. Competitive responses to market forces have been weak and do not show any sign of sustained technological or export dynamism. The economy remains heavily dependent on agriculture and other natural resources, without the structural transformation that long-term development requires. One of the critical challenges facing Tanzanian policy makers, now that they have opened the economy to global market forces, is to jumpstart technological upgrading in industry.
A Science and Technology Plan launched in 1996 had ambitious targets, including making research and development in Tanzania account for 1 per cent of gross domestic product (GDP) by 2000. The Plan also proposed monitoring of foreign technology inflows and upgrading of research and technical expertise. For the manufacturing sector specifically, the Plan proposed developing export-oriented activities based on local resources, improving productivity and technology, increasing capacity utilization and strengthening small and medium-sized enterprises (SMEs). Strategies for achieving these goals included enhancing design and engineering capacity and encouraging regional and international cooperation in research and development (R&D) activities. They encompassed improving access to technology imports, strengthening R&D links with enterprises to increase production of modern capital goods, and setting up engineering workshops for the maintenance, manufacture and repair of machinery. The Plan also envisaged a greater use of intellectual property rights to encourage innovation.
A later government publication (COSTECH, 1998) amplified on industrial research and development objectives. Areas mentioned include chemical engineering, clean production, information technology, biotechnology, new materials, metal resources, and high-quality spares.
None of the objectives mentioned above seems to have been realized. The Plan remains largely on paper, while technological activity languishes. There is very little dynamism in private industry, and technology support institutions are passive and largely de-linked from productive activity. Total research and development is 0.35 per cent of GDP, down from around 0.5 per cent in 1984. More importantly, R&D is conducted almost entirely in the public sector. It is spread over a number of ministries and largely devoted to non-industrial activities. Research institutions for industry are poorly funded, staffed and motivated; they have weak links with industry and contribute little to operational technologies. In the meantime, liberalization has affected manufacturing severely, more so than in neighbouring Kenya (Lall, ed., 1999). This underscores the need for technological strengthening to restart and fuel industrial development and expansion.
AAffrriiccaa''ss TTeecchhnnoollooggyy GGaapp
68
B. Industrial background
Like many other developing countries, Tanzania adopted import substitution as its guiding industrial strategy. In 1961, its initial industrial base numbered fewer than 400 manufacturing establishments, largely in primary processing and simple consumer products. To expand this base on the principle of self-reliance, the Government in the 1970s adopted a Basic Industrial Strategy involving the promotion of consumer goods as well as intermediate and capital goods (Wangwe, 2000). The latter part of the strategy largely failed; simple consumer products continued to dominate manufacturing activity. After an initial spurt in output, growth rates declined, inefficiency grew and capacity utilization fell to very low levels.
During 1966–75 Tanzania’s GDP grew at 3.9 per cent annually in real terms, with manufacturing growing at 4.8 per cent. The export orientation of manufacturing has declined steadily since the 1960s, with the share of exports in output falling from 12.4 per cent in 1970–75 to 9 per cent in 1976–80 (Deraniyagala and Semboja, 1999). In 1981–85, severe trade restrictions were imposed. Yearly GDP growth fell to 0.7 per cent, and manufacturing output declined at an annual rate of 5 per cent. The share of manufacturing in the GDP fell from 12.9 per cent in 1976 to 7.9 per cent in 1985, and the share of exports in manufacturing output fell to 4.6 per cent in 1981–85.
During 1985–88 he Government started to liberalize trade with currency devaluation and the opening up of selected imports. An intense phase of liberalization began in 1988: import restrictions were dismantled, tariffs reduced and the tariff structure rationalized. Thus, the 18 tariff categories of 1980, with dispersions rating from 0 to 200 per cent, were reduced by 1992 to 5 categories with rates of 0 to 40 per cent (Deraniyagala and Semboja, 1999). Effective rates of protection declined and quantitative restrictions on imports were virtually scrapped. Between the fiscal years 1993/94 and 1997/98, the trade-weighted average tariff rate fell from 25 per cent to 20 per cent. By the early 1990s, Tanzania was one of the leading countries in Africa in consistency and spread of liberalization (World Bank, 1994).
While the post-liberalization period showed improved performance, yearly GDP growth rates remained modest at 3 per cent, lower than the population growth rate. The decline in manufacturing growth was reversed, with annual growth rates averaging around 3.5 per cent in 1986–94. However, the sector’s performance lagged behind that of the agricultural and service sectors, which had growth rates of 5 and 4.2 per cent respectively. Investment increased sharply, with the ratio of fixed capital formation to GDP rising to 32 per cent in 1986–92, largely because of increased external financing resulting from structural adjustment rather than higher domestic savings. This increased investment was mainly directed at agriculture, with the share of manufacturing falling from 24 per cent in 1981–85 to 13 per cent in 1986–92.
Export earning between 1985 and 2000 has been relatively high, averaging 4.5 per cent per annum. (COMTRADE database). Export composition has also improved, with shares of manufactures increasing from 19 per cent in 1985 to 37 per cent in 2000, and further to 48 per cent in 2001. This is a reflection of the 9.4 per cent annual growth rate of Tanzania's manufactured exports, which is double that of all exports. It should be noted, however, that the resource-based manufactures registered the highest growth during the period. In order to move into the higher level of manufacturing and further improve its export competitiveness, technological upgrading would have to be undertaken.
As indicated in Table 4.1, manufacturing performance has been very erratic, and average capacity utilization still has not recovered to its peak levels 1978 (Szirmai,
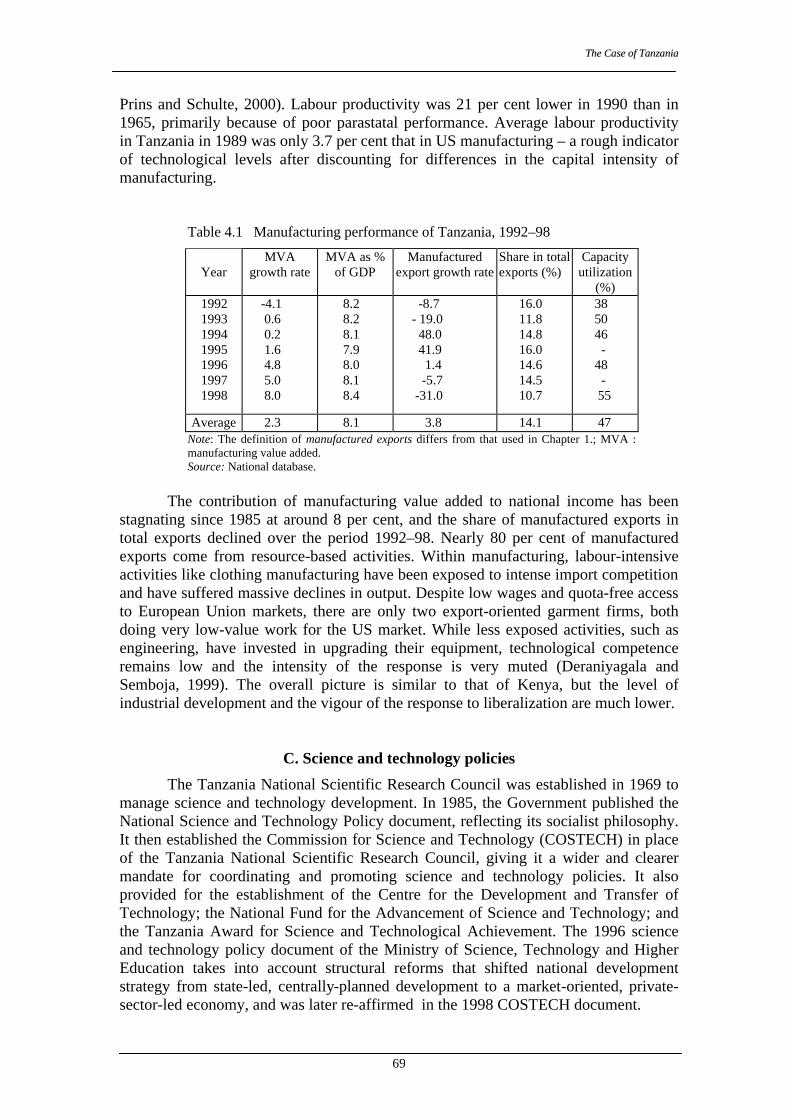
TThhee CCaassee ooff TTaannzzaanniiaa
69
Prins and Schulte, 2000). Labour productivity was 21 per cent lower in 1990 than in 1965, primarily because of poor parastatal performance. Average labour productivity in Tanzania in 1989 was only 3.7 per cent that in US manufacturing – a rough indicator of technological levels after discounting for differences in the capital intensity of manufacturing.
Table 4.1 Manufacturing performance of Tanzania, 1992–98
Year
MVA growth rate
MVA as % of GDP
Manufactured export growth rate
Share in total exports (%)
Capacity utilization
(%) 1992 1993 1994 1995 1996 1997 1998
-4.1 0.6 0.2 1.6 4.8 5.0 8.0
8.2 8.2 8.1 7.9 8.0 8.1 8.4
-8.7 - 19.0 48.0 41.9 1.4 -5.7 -31.0
16.0 11.8 14.8 16.0 14.6 14.5 10.7
38 50 46 - 48 - 55
Average 2.3 8.1 3.8 14.1 47 Note: The definition of manufactured exports differs from that used in Chapter 1.; MVA : manufacturing value added. Source: National database.
The contribution of manufacturing value added to national income has been
stagnating since 1985 at around 8 per cent, and the share of manufactured exports in total exports declined over the period 1992–98. Nearly 80 per cent of manufactured exports come from resource-based activities. Within manufacturing, labour-intensive activities like clothing manufacturing have been exposed to intense import competition and have suffered massive declines in output. Despite low wages and quota-free access to European Union markets, there are only two export-oriented garment firms, both doing very low-value work for the US market. While less exposed activities, such as engineering, have invested in upgrading their equipment, technological competence remains low and the intensity of the response is very muted (Deraniyagala and Semboja, 1999). The overall picture is similar to that of Kenya, but the level of industrial development and the vigour of the response to liberalization are much lower.
C. Science and technology policies
The Tanzania National Scientific Research Council was established in 1969 to manage science and technology development. In 1985, the Government published the National Science and Technology Policy document, reflecting its socialist philosophy. It then established the Commission for Science and Technology (COSTECH) in place of the Tanzania National Scientific Research Council, giving it a wider and clearer mandate for coordinating and promoting science and technology policies. It also provided for the establishment of the Centre for the Development and Transfer of Technology; the National Fund for the Advancement of Science and Technology; and the Tanzania Award for Science and Technological Achievement. The 1996 science and technology policy document of the Ministry of Science, Technology and Higher Education takes into account structural reforms that shifted national development strategy from state-led, centrally-planned development to a market-oriented, private-sector-led economy, and was later re-affirmed in the 1998 COSTECH document.
AAffrriiccaa''ss TTeecchhnnoollooggyy GGaapp
70
These documents are, however, optimistic “wish lists” rather than realistic strategies. They are not based on serious analyses of the technology status or problems of Tanzanian industry (Mlawa, 1999), nor are they a coordinated amalgam of the views of different Government ministries. Furthermore, they fail to take into account institutional structures and weaknesses or resource constraints affecting research and development activities. They ignore the skill constraints that bedevil capability development in Tanzania, and industry’s negative response to liberalization.
After the dissolution of the East African Community in 1977, which led to the loss of regional research and development institutions, the Tanzanian government set up national institutions to fill the gap (Wangwe, 2000). The Tanzanian Industrial Research and Development Organization was established in 1979 as the main body to promote technology development for manufacturing. The Tanzanian Engineering and Manufacturing Design Organisation was established in 1980 to promote engineering services and provide technical training to enterprises. The Institute of Production Innovation was founded in 1981 at the University of Dar Es Salaam to carry out product innovation and transfer it to industry, and to provide technical consultancy for enterprises. In addition to these R&D-related institutions, the Small Industries Development Organization was set up in 1973 to provide extension services and marketing support to SMEs.
Many of these institutions suffered during the adjustment and liberalization process, and their financial resources declined. The majority were heavily dependent on donor financing and were affected as funding was cut or switched to other uses. In the 1990s there was increased fragmentation of R&D institutions as costs mounted, staff morale declined, and fixed assets had to be sold – in some instances, to finance current expenses (Wangwe, 2000). Industry demonstrated less interest in local technologies after liberalization, despite increased efforts by the institutions to market their wares to the private sector. Specific cases are discussed later in this chapter.
D. Intellectual property rights
The Patent Act (1987) provides the legal framework for IPR in the Tanzania. Based on the British patent system, it was initially geared more to the needs of foreign companies that wanted protection in Tanzania than to those of domestic innovators and inventors. Since the patent system started operating, only six patents have been issued to Tanzanian companies or individuals. This may reflect more the paucity of domestic technological activity than problems with the patent system. The technological value of the locally filed patents is not known, but it is likely that they were filed by individuals and not exploited commercially.
The Patent Office also has inherent weaknesses. Lacking facilities for online searches of patent information, it serves only as a re-registration office for patents registered abroad. It also lacks the resources to employ skilled legal and technical personnel. In any case, many of these skills do not exist in the country. Little is done to promote awareness of IPR in industry.1 A strong and well-administered IPR system would be desirable in the long term to promote both the transfer of new technologies to Tanzania and the stimulation of local technological activity. Currently, the weaknesses of the institutional system do not affect technology development in Tanzania. Rather,
1 Since the preparation of this report, the Business Registration and Licensing Agency has been inaugurated as part of the Government's effort to promote investment in Tanzania. It is responsible for advising the Ministry of Industries on the procedures and practices for company registration and business licensing, and its members include Government and business community representatives.
TThhee CCaassee ooff TTaannzzaanniiaa
71
they reflect underlying structural deficiencies that deter technology imports, foreign direct investment (FDI) and indigenous technological effort. Only if these were remedied would the IPR system become a constraint on technology development. As a member of the Southern African Development Community (SADC) protocol, Tanzania is to adopt and implement measures in accordance with the TRIPS Agreement.
E. Technological imports and activities
The paucity of both technology import and technology generation by Tanzanian industry has been noted in Chapter 1. This is confirmed by Central Bank data, which indicate that in 1996, no royalties and technical fees were paid abroad. In 1997 payments were $0.3 million, in 1998 they were $4.7 million and in 1999 they were $3.8 million. While these figures suggest an encouraging trend, it is not clear whether the payments were for manufacturing technology or for management and technical fees in recently privatized utilities.2
Tanzanian industry does minimal formal research and development. Though some firms claim to conduct research and development (Semboja and Kweka, 2000), it is likely that they are including other technical functions (e.g. quality testing, simple design adaptation, etc.) under this heading. Comparisons of technological capability indicators find that Tanzania ranks below Zimbabwe, Kenya and Ghana; these countries themselves lag well behind world levels. The low level of capabilities in Tanzanian industry is a serious constraint on its ability to respond positively to liberalization.
In the garment industry, this lack of capabilities has been devastating. Many manufacturers have closed down, and few have emerged to take advantage of low wages and concessional trade regimes. There are, for example, only two export-oriented garment firms in the country. It is useful to take another look at this industry because of its simple technology and its export potential, garment making being the basic entry-level activity for export-oriented manufacturing. In response to liberalization, Tanzanian garment firms suffered an average 70 per cent decline in employment, with capacity utilization falling from 60 per cent to 30–50 per cent in the 1990s. A survey showed that only 5 per cent of garment firms were even aware of International Standards Organization 9000 standards. Liberalization led firms to reduce costs further, down-sizing personnel and cutting down on maintenance expenses and product design activities. Labour productivity in the upstream textile industry is low. For instance, the number of man-hours needed for weaving a given length of cloth was 4.5 times higher than in Kenya, 5.2 times higher than India and 11.4 times higher than Turkey (Wangwe, 2000). This suggests that even in the simple activities where Tanzania should be building new competitive advantages, the base of capabilities remains too low to provide a positive response. As Wangwe (2000) puts it, “although changes in the macroeconomic environment have introduced competitive pressures among manufacturers (for example, injecting a sense of quality consideration), many of the earlier weaknesses in technological development have not been resolved. Changes in macroeconomic policy and enterprise level rehabilitation programmes are not enough for industrial restructuring to be realised.”
There are some signs of technological improvement, especially among resource-based privatized industries. When RJ Reynolds took over the Tanzania
2 Comparable payments by Kenya have been lower (in 1998 they were below $2 million), suggesting that the
Tanzanian data reflect sporadic activity rather than sustained technology upgrading in manufacturing.
AAffrriiccaa''ss TTeecchhnnoollooggyy GGaapp
72
Cigarette Company, for instance, it introduced modern technology and work practices, significantly raising productivity (see Box 4.1). Another example is Tanzania Breweries, which was purchased from the Government by a South African firm (Wangwe, Musonda and Kweka, 1997).
F. Foreign direct investment
Tanzania has undertaken several measures to improve its FDI regime, and inflows have increased recently as a result. However, the amounts are still low even by developing-country standards, with most inflows have gone into privatized public utilities or resource-based manufacturing enterprises aimed at domestic markets. There is relatively little inflow into export-oriented or non-resource-based manufacturing.
The agency in charge of promoting and facilitating FDI is the Tanzania Investment Center, formerly the Investment Promotion Centre, established in 1991 under the National Investment Promotion and Protection Act of 1990. In 1997 reforms were undertaken to make the Centre a single point for efficient promotion of private investment.
Additionally, tax rates were brought down, with corporate taxes now at 30 per cent, down from 35 per cent. Import duties have been lowered and rationalized. A new Bonded Warehouse Scheme for exporters grants five-year tax holidays and duty-free access to imported inputs. Two units (for cosmetics and medicines, aimed at regional markets) have been attracted into this scheme and are in the process of being set up. There is no export processing zone in operation, but one is under consideration. Labour costs are attractive. The minimum wage in Tanzania is $45 per month; a fresh graduate is paid $110–120 per month and an engineer $200–220. However, infrastructure is expensive by international standards.
By early 1999, the Tanzania Investment Center had approved 1,250 projects worth T Sh 2,800 billion. Of these, 598 projects (47.8 per cent) were put forward by local investors, 249 projects (19.9 per cent) by foreign investors, and 403 projects (32.3 per cent) by joint ventures. In terms of sectors, 627 projects (50 per cent) were in industry and 182 projects (14.6 per cent) in tourism. However, many projects are not implemented. (The implementation rate is under 50 per cent.) As far as manufacturing is concerned, most investments are in simple consumer items aimed at local markets, with many joint ventures.
Despite these improvements, the investment climate still faces problems. While the new Tanzania Investment Centre’s one-stop shop set-up has vastly streamlined the administrative proceduress for establishing a business, it has no effective influence over other agencies. The Center’s own approval process takes only 3–14 days, but subsequent approvals can take much longer. Its promotion programme could be strengthened, especially with regard to investor targeting. Investment promotion should be supported with an attractive investment climate consisting not only of an enabling investment framework but also a dynamic business environment.
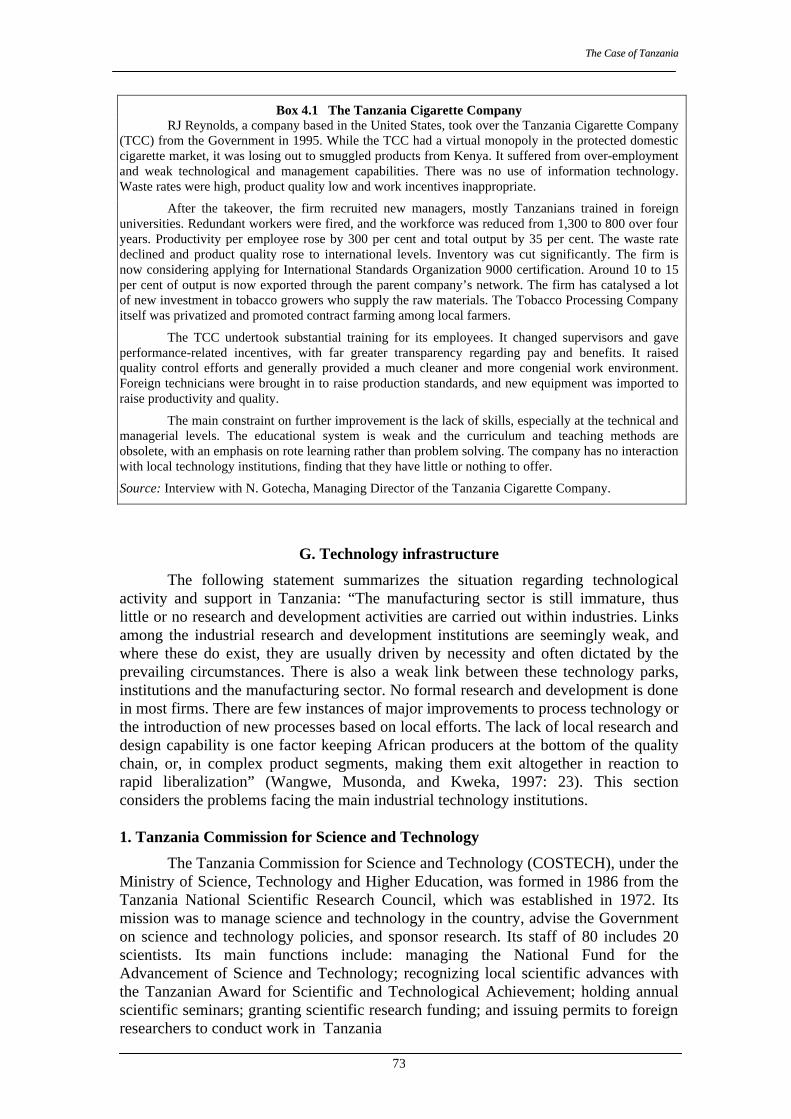
TThhee CCaassee ooff TTaannzzaanniiaa
73
Box 4.1 The Tanzania Cigarette Company RJ Reynolds, a company based in the United States, took over the Tanzania Cigarette Company
(TCC) from the Government in 1995. While the TCC had a virtual monopoly in the protected domestic cigarette market, it was losing out to smuggled products from Kenya. It suffered from over-employment and weak technological and management capabilities. There was no use of information technology. Waste rates were high, product quality low and work incentives inappropriate.
After the takeover, the firm recruited new managers, mostly Tanzanians trained in foreign universities. Redundant workers were fired, and the workforce was reduced from 1,300 to 800 over four years. Productivity per employee rose by 300 per cent and total output by 35 per cent. The waste rate declined and product quality rose to international levels. Inventory was cut significantly. The firm is now considering applying for International Standards Organization 9000 certification. Around 10 to 15 per cent of output is now exported through the parent company’s network. The firm has catalysed a lot of new investment in tobacco growers who supply the raw materials. The Tobacco Processing Company itself was privatized and promoted contract farming among local farmers.
The TCC undertook substantial training for its employees. It changed supervisors and gave performance-related incentives, with far greater transparency regarding pay and benefits. It raised quality control efforts and generally provided a much cleaner and more congenial work environment. Foreign technicians were brought in to raise production standards, and new equipment was imported to raise productivity and quality.
The main constraint on further improvement is the lack of skills, especially at the technical and managerial levels. The educational system is weak and the curriculum and teaching methods are obsolete, with an emphasis on rote learning rather than problem solving. The company has no interaction with local technology institutions, finding that they have little or nothing to offer.
Source: Interview with N. Gotecha, Managing Director of the Tanzania Cigarette Company.
G. Technology infrastructure
The following statement summarizes the situation regarding technological activity and support in Tanzania: “The manufacturing sector is still immature, thus little or no research and development activities are carried out within industries. Links among the industrial research and development institutions are seemingly weak, and where these do exist, they are usually driven by necessity and often dictated by the prevailing circumstances. There is also a weak link between these technology parks, institutions and the manufacturing sector. No formal research and development is done in most firms. There are few instances of major improvements to process technology or the introduction of new processes based on local efforts. The lack of local research and design capability is one factor keeping African producers at the bottom of the quality chain, or, in complex product segments, making them exit altogether in reaction to rapid liberalization” (Wangwe, Musonda, and Kweka, 1997: 23). This section considers the problems facing the main industrial technology institutions.
1. Tanzania Commission for Science and Technology
The Tanzania Commission for Science and Technology (COSTECH), under the Ministry of Science, Technology and Higher Education, was formed in 1986 from the Tanzania National Scientific Research Council, which was established in 1972. Its mission was to manage science and technology in the country, advise the Government on science and technology policies, and sponsor research. Its staff of 80 includes 20 scientists. Its main functions include: managing the National Fund for the Advancement of Science and Technology; recognizing local scientific advances with the Tanzanian Award for Scientific and Technological Achievement; holding annual scientific seminars; granting scientific research funding; and issuing permits to foreign researchers to conduct work in Tanzania
AAffrriiccaa''ss TTeecchhnnoollooggyy GGaapp
74
COSTECH conducted an internal study of industrial research and development and found that there was almost none in the country. It found enterprises unwilling to start. The study also claimed that almost none of the academic research in the country had any productive applications.
COSTECH is entirely funded by the Government and foreign donors and does not raise funding independently. As unding gets scarcer,the Commission is finding it increasingly difficult to continue its research funding operations. One problem in promoting research and development in Tanzania is that different research institutes are under various ministries and are not answerable to COSTECH, making it difficult to form a coherent strategy and coordinate research efforts. It tried in vain to convince the Government to centralize the research function. COSTECH also finds few opportunities to interact with research and development in higher education institutions. There is no strategy for the creation of technical and research human resources in these institutions. At the moment there is a skill mismatch, with many graduates unemployed.
In sum, COSTECH could be a pivotal institution for technology development in Tanzania, but it is not fulfilling this role. It has not been able to coordinate research in various institutions. In any case, little of the research done in government institutions and higher education institutions is useful for the industrial sector. With better funding, management, motivation and remuneration, COSTECH could fulfil its mandate much better. 2. The Tanzania Bureau of Standards
The Tanzania Bureau of Standards was established in 1976 under the Ministry of Industry and Commerce to manage metrology standards, testing, and quality standards in Tanzania. It currently has a staff of 135, which includes 80 scientists and engineers. It operates a Certification Scheme with a Tanzania Bureau of Standards mark and provides testing facilities for this purpose and for use by industry. Its metrology section is the custodian of primary calibration for temperature, mass, energy, volume, pressure and weight; its measures are internationally traceable. The Bureau provides training facilities in standards and quality assurance and runs an awareness campaign for quality. As of 1999, it had written around 700 standards.
Quality consciousness is low in Tanzania. Only two firms, a soft drinks firm and a battery manufacturer, have been awarded International Standards Organization 9000 certification. Most SMEs are not even aware that such certification exists. However, liberalization and privatization have helped raise awareness; there are now 270 products certified with the Tanzania Bureau of Standards mark as compared to 80 in 1996.
The Bureau’s laboratories are not internationally accredited, and it lacks the capability to accredit independent testing laboratories. The lack of international accreditation means that exporters cannot use the Bureau’s tests for export purposes. This can add significantly to their costs in activities where such tests are required and so can constitute a barrier to manufactured export growth. The Bureau claims to be upgrading its food and chemical laboratories to reach the levels needed for accreditation, but it needs funding for international team tests, new equipment, facilities and staff training. The Bureau estimates its need for new laboratory equipment at around $750,000 for seven laboratories. The lack of capability to accredit other laboratories is also a drawback, restricting private-sector participation in this essential activity and its spread from the capital to other centres.
TThhee CCaassee ooff TTaannzzaanniiaa
75
The Bureau earns about 70 per cent of its budget from testing services, with the remainder coming from the Government. Its testing facilities are not adequate for the needs of industry, and many tests have to be performed in other countries like Kenya and South Africa. In the long term, testing should become a private service activity, and ideally the Government should fund standard-setting activities. The Bureau should also be given the resources and incentives to undertake a more proactive quality campaign, particularly to reach SMEs that lag far behind in quality management and standardization. There are no private consultants on quality management in Tanzania, a major need to be addressed if industrial technology is to evolve. There are also no university courses on standardization and quality management, and expertise in metrology, particularly in the field of energy, is very limited.
In general, therefore, the Tanzania Bureau of Standards is underfunded and obsolete. While it has a large stock of trained and motivated technical personnel, its equipment and specialized capabilities are not able to serve existing needs in Tanzania. They are even less adequate for meeting future needs. The Bureau is passive in its approach to promoting quality awareness and in reaching out to SMEs. It does not provide many consultancy services to industry, though there is currently no private-sector alternative available. There would appear to be a strong case for strengthening the Bureau’s capabilities and facilities. 3. The Tanzania Industrial Research and Development Organization
The Tanzania Industrial Research and Development Organization was established in 1979 to conduct industrial research and offer consultancy services to industry. By the end of 1999, it had around 75 staff, of whom 35 were scientists and engineers. It offers the following services: maintenance and repair services for instruments; a chemical laboratory; advice on the efficient use of energy; a materials laboratory for conducting tests; a mechanical workshop for fabrication, welding and regrinding services; and a furniture workshop. In addition, it provides troubleshooting and advisory services on technology selection, product diversification, and process control and optimization. The National Cleaner Production Centre – part of a joint project by the United Nations Industrial Development Organization (UNIDO) and the United Nations Environmental Programme (UNEP) provides policy advice on environmental management, clean technologies, and training industry personnel. Finally, the Industrial Information Centre responds to technical enquiries and collects technical information from around the world using print and Web publications.
The original objectives of the Organization were fairly modest: using local raw materials, developing simple and appropriate technologies, and providing support and information services to local industry (mainly SMEs). How well have these objectives been met?
There is little interaction between the Organization and the private sector; when such interaction does take place, it is mainly with large firms using specific technical services. Some 58 per cent of the Organization’s budget came from services sold to industry in the last financial year, with the remainder coming from the government budget. Owing to financial pressures, such as an unfinished administration building on the site, there is almost no money left for R&D.
Most of the Organization’s activities are thus industrial services, for which it charges full cost at rates based personnel time and use of equipment. Testing services for the public-sector petrochemical industry represents the largest source of income, followed by fuel analysis for state-owned power stations.
AAffrriiccaa''ss TTeecchhnnoollooggyy GGaapp
76
SMEs rarely use the Organization’s technical services. It has had hardly any commissions of technology development projects by industry; one example was the development of particleboard based on rice husk. This work was undertaken by a graduate student at the University of Dar Es Salaam using the Organization’s facilities and did not involve research staff.
The Organization does not own any patents. It has developed process know-how for such products as caustic soda, chalk and chipboard manufacturing, largely using mature technologies from other developing countries. Simpler components can be manufactured locally, but all complex parts have to be imported because of the shortcomings of local engineering. There is no electronics engineer, which greatly restricts the Organization’s ability to work in modern technologies.
Salaries are pegged to civil service scales, thus reducing the Organization’s attractiveness to qualified candidates. While employees are allowed to keep 30 per cent of the value of services rendered to industry, this does not provide sufficient incentive to seek work or to help SMEs solve technical problems. Hardly any of the technologies developed by the Organization has been used by industry, and liberalization has not stimulated any new demand for its services. Most of the laboratory equipment was given by donors and, with their loss of interest, has become obsolete. Some of the equipment can no longer be used because spare parts are no longer available. Larger firms and foreign affiliates that have upgraded their technology have used overseas expertise, presumably because the Organization is unable to deliver useful service.
Most projects are undertaken at the initiative of Organization personnel, rather than at the request of industry. This lack of involvement of productive enterprises is characteristic of all activities of the Tanzania Industrial Research and Development Organization in the development of new technologies. (Bongenaar and Szirmai, 1999). Project evaluation is entirely in-house and does not look in depth at projects’ technical or economic desirability or their environmental aspects. Success is defined by the technical objectives of the staff rather than by commercial success or the degree of application by industry; there is no attempt to relate technological efforts to industrial competitiveness. Once technologies are developed, they are not marketed to potential users. Few projects reach the stage where the Organization searches for entrepreneurs to implement them, and, in the period studied, not one reached the stage of technology transfer from the Tanzania Industrial Research and Development Organization to private industry.
It could therefore be concluded that the Organization is not fulfilling its role of supporting, stimulating and producing industrial technology efforts. It has not been able to link itself to industry, identify real industrial needs or provide new technologies. Nor has it met even its modest ambition of promoting the use of simple technologies by industry. The Organization is surviving by providing low-level services that would normally be sold by small firms. Staff members are poorly paid and seem demoralized. There is little sign of managerial initiative to improve the Organization’s functioning; this contrasts with its Kenyan counterpart.
The Organization’s situation is not unusual for a public technology institution. Its lack of dynamism could be a reflection local industry’s general indifference towards new technology. If enterprises are not technologically conscious and innovative, it is difficult for support institutions to help them (Rush et al., 1996). To put it another way, the lack of industrial technological capabilities limits the innovativeness of support institutions. It is not surprising, therefore, that since liberalization the main response to technological challenges has been withdrawal.
TThhee CCaassee ooff TTaannzzaanniiaa
77
4. The Small Industries Development Organization
The Small Industries Development Organization was created in 1973 to provide SMEs and handicraft producers with industrial facilities consultancy, credit, training and marketing services. The Organization has 25 regional offices throughout Tanzania mainland. It has set up 14 industrial estates with an average of 10 rentable premises each, as well as three training-cum-production centres.
Box 4.2 Support for SMEs in Taiwan Province of China
Taiwan Province of China has around 700,000 SMEs, accounting for 70 per cent of employment, 55 per cent of gross national product and 62 per cent of manufactured exports. They are supported by an impressive set of programmes. In 1981, the Medium and Small Business Administration was set up to foster SME development and coordinate several agencies providing assistance. The Taiwan Medium Business Bank, the Bank of Taiwan, the Small and Medium Business Credit Guarantee Fund, and the Small Business Integrated Assistance Centre provided financial assistance. Management and technology assistance was provided by the China Productivity Centre, the Industrial Technology Research Institute and a number of industrial technology centres (for metal industry, textiles, biotechnology, food and information).
The Joint Services Centre of the Ministry of Economic Affairs acts as a source of
information on SME assistance. Public funds cover 50 to 70 per cent of consultation fees for consultancy services for SMEs. The Medium and Small Business Administration has a fund for SME enterprise promotion of NT$10 billion. The Centre-Satellite Factory Promotion Programme of the Ministry of Economic Affairs integrates smaller factories around a principal one. This programme involves vendor assistance and productivity-raising efforts and a rational sharing of tasks between participating enterprises. By 1989 there were 60 networks with 1,186 satellite factories in operation, mainly in electronics.
In the area of R&D support, the Industrial Technology Research Institute handles
contract research work considered too risky for the private sector; the contracts have public financial support. The Institute for the Information Industry complements the Industrial Technology Research Institute’s work on hardware by developing and introducing software technology. The Taiwan Handicraft Promotion Centre supports handicraft producers, particularly small ones with export potential. The Programme for the Promotion of Technology Transfer maintains close contact with foreign corporations that have developed leading-edge technologies in order to facilitate the transfer of those technologies to Taiwan.
The China Productivity Centre is known for its efforts to promote automation to
improve precision and quality; it sends out teams of engineers to visit plants throughout the country and demonstrate the best approaches to automation and to solving relevant technical problems. Over two years the Centre visited more than 1,000 plants and made more than 4,000 suggestions for improvement. It also carried out more than 500 research projects on improving production efficiency and linked enterprises to research centres to solve more complex technical problems.
Source: Lall (1996).
The Organization has managed the Sister Industrial Programme, which facilitates the transfer of equipment and technology from Sweden. This programme was later transformed to triangular cooperation, with Swedish funds used to source
AAffrriiccaa''ss TTeecchhnnoollooggyy GGaapp
78
technology and equipment from other developing countries like India and the Philippines. Like many aid-dependent activities in Tanzania, the Organization has undergone downsizing in recent years, and the triangular cooperation ceased when the funding was exhausted. The Organization’s personnel shrank from a peak of 800 in the late 1980s to 240 by late 1999, of which some 70 were at the headquarters in Dar. Furthermore, the Government has reduced its budget, even while the Organization’s earnings from industry remain minimal.
To some extent, the inability to recoup full costs is inherent to SME support agencies. SMEs operate under financial constraints; in developing countries they are often unable to define their problems or spare the time and effort to seek institutional assistance. The problems of the Organization reflect the weak state of SMEs in Tanzania, as well as deficiencies in the institution. These weaknesses, in terms of staff, salaries, equipment or morale, seem to be even greater than that of Tanzania Industrial Research and Development Organization.
The Small Industries Development Organization appears to be doing little to upgrade technology and productivity in SMEs. It is rather passive in reaching out to enterprises and does not have the ability to meet firms’ needs for packages combining financing, technology, skills and marketing. Personnel are poorly paid and even more poorly motivated. Facilities and equipment are obviously not adequate to meet the task of upgrading and modernizing SMEs. While the Organization aims at improving SME export performance, its effectiveness has been generally low. Exports by SMEs from Tanzania are limited to products such as home décor, simple sports items and plastic toys.
There have been efforts to revitalize the institution. A new board has been appointed and further foreign assistance sought, mainly from Sweden. The Government is developing a strategy for helping SMEs, but there is no indication that the Organization is planning to re-orient its approach, train its staff or upgrade its facilities to better serve SMEs. Industrial estates can be easily managed and operated by private entrepreneurs. The emphasis of the Organization should be on reaching out to SMEs, especially to promote use of their services and programmes. SMEs are likely to be a vital element in industrial development strategy, and the Government has to provide the necessary support structure and enabling environment for them to flourish. Box 4.2 describes the SME support system in Taiwan Province of China, which relies high on SMEs.
Aid dependency coupled with lack of domestic capabilities makes development difficult to sustain. Perhaps the least desirable outcome is to channel foreign support in an erratic and unpredictable manner through institutions that lack the capabilities, incentives and structures to be effective. This seems to have been the case in Tanzania.
However, many cases of effective donor-driven technology support exist. One example comes from Sri Lanka, where USAID set up a programme to use retired volunteers to help firms (mainly SMEs) willing to put up matching resources. The programme was useful in boosting enterprise productivity, employment and export competitiveness (see Box 2.2). 5. The Institute of Production Innovation
The Institute of Production Innovation was initially founded in 1981 as a department within the Faculty of Engineering of the University of Dar Es Salaam. It later became autonomous institution within the University. Its objective was to develop product prototypes and transfer technology to industry, as well as to provide
TThhee CCaassee ooff TTaannzzaanniiaa
79
consultancy services and provide curriculum advice to the engineering department. Germany financed the physical facilities and trained the staff, while the Government provided minor financial support. Personnel were all on university salary scales and payrolls.
The idea of linking university to industry was a promising one, and the initiative was something of an innovation in the African setting. However, the link failed to materialize and the engineering faculty established another link to industry: the Bureau for Industrial Cooperation. Both institutions compete for the same clients, with comparable degrees of success.
The Institute of Production Innovation specializes in making simple machines (e.g. for sugar milling, oil processing, grain milling and solar heating) and structures (telecommunication towers) for the market. The technology is copied from designs abroad. There is no long-term R&D activity at the Institute, whose main contributions seem to be use of local materials and minor adaptation of outside designs to local conditions. The Institute has not applied for any patents.
In essence, the Institute functions more as a small manufacturing unit rather than as a technology development centre. Its approach until 1994 was essentially supply-driven, in which engineers conceived of research problems and developed prototypes for sale to industry (Wangwe and Diyamett, 1998). The feasibility and competitiveness of the technology was not evaluated, and there was little effort to market technologies to industry. Not surprisingly, there was no demand from industry for the technology, and not a single prototype was sold for commercial use. Furthermore, the Institute’s manufacturing activities made firms regard it as a competitor rather than a source of technology.
In 1994 the Institute shifted to a more market-driven strategy. It restructured its work programme around the technology needs and demands of industry, and began undertaking market analysis and dialogue with potential users and other agencies. With the exception of one instance of technology transfer to an SME in 1996, the main activity of the Institute continues to be small-scale manufacturing.
6. Summing up the technology infrastructure
The overall picture of the technology institutions in Tanzania is that of a small and largely ineffective infrastructure. It is poorly funded and motivated, and is hardly linked with industry. Its ability to develop, adapt and disseminate industrial technologies is weak and its awareness of the technological needs of the industrial sector low. In the absence of government support, the culture of dependence on external aid and the lack of involvement by the private sector are serious handicaps.
Technology policy formulation is uncoordinated. The main institution in charge of science and technology policy-making, COSTECH, is weak and unable to influence the government agencies that conduct R&D. Much of the R&D is, in any case, irrelevant to industrial needs. The Standards Bureau seems well staffed and motivated, but is severely underfunded and lags in technological competence. None of its laboratories is internationally accredited. The Tanzania Industrial Research and Development Organization does not produce any significant technological benefits for industry, although it performs some useful technical functions. It does not have have programme for reaching out to private firms. The Small Industries Development Organization is even weaker. The Institute of Production Innovation has turned into a manufacturing rather than technology development institution. This infrastructure as it is does not and obviously cannot provide support to a technologically-challenged
AAffrriiccaa''ss TTeecchhnnoollooggyy GGaapp
80
industrial sector that is faced with growing international competition. The gap between local institutions and world best practice is wide and growing. Moreover, Tanzania’s private sector is still in its infancy. Active government support should be provided through, for example, industrial associations such as the Tanzania Chamber of Commerce, Industry and Agriculture (TCCIA), in order to enable this segment to play a more significant role in the acquisition and adaptation of sound technologies.3
One problem faced by any technology infrastructure institution in a country such as Tanzania is precisely the technological backwardness of private industry. With little technological dynamism in industry, it is very difficult for government institutions to “pump out” technology to firms. The same lack of technical skills and information that afflicts industry also afflicts the institutions, despite their access to international sources. Public ownership, low salaries, inefficient management and lack of incentives make a bad situation worse. At the same time, in the absence of private technological activity, there is a greater burden of responsibility on the public institutions to undertake more technological efforts and ensure their effective delivery.
H. Conclusions
Technological weaknesses in Tanzanian industry is an important constraint not only on manufacturing growth and competitiveness, but also on the structural transformation of the whole economy. Without such transformation, and in a setting of liberal trade and investment flows, Tanzania cannot hope to enjoy sustained growth in incomes, employment and exports. The few pockets of good practice in technology are mainly concentrated in recently privatized enterprises taken over by foreign companies. Their ability to raise productivity shows how the injection of new capabilities and work practices can significantly raise technological levels. Technology imports, which should be rising rapidly, remain as low as to upgrate. There are few other signs that adjustment or liberalization is leading to dynamism and competitiveness in industry. The skill base, small to start with, has improved little in recent years. Under these circumstances, it is difficult for industrial enterprises to realize the value of new technology and skills, or to try to achieve the necessary upgrading. A few are doing this and are benefiting through improved market performance (Deraniyagala and Semboja, 1999), but they are tiny islands in a vast sea of technological backwardness.
The window of opportunity for Tanzanian industry to upgrade is narrow. The competitive environment for Tanzania is changing very rapidly, affecting even the primary producing and processing activities that constitute its current comparative advantage. However, there is a need to pay special attention to industrial capabilities; sustained growth and structural transformation will depend largely on the country’s ability to move from traditional resource-based activities to modern manufacturing. This will require the development of local skills and capabilities related to industrial technologies. It will also entail much larger inflows of foreign technology and skills in the form of FDI and licensing. The SMEs that form the core of the indigenous manufacturing sector will have to be assisted in using modern technology and management more effectively.
3 COSTECH comments, August 2000.
TThhee CCaassee ooff TTaannzzaanniiaa
81
Currently the institutional technology infrastructure and strategy making are completely inadequate to the task. While their deficiencies reflect the larger problems of capability building in Tanzania, there is a particularly acute need for strong institutions to provide the necessary public goods of technology development. The current strategy of industrial and technological development consists largely of statements of good intent and ambitious plans largely not implemented because of a very weak institutional base. There is a need to re-examine the basic strategy of technology development and all the institutional structures that support it.
I. Policy recommendations
The Government of Tanzania is aware of the need for rapid technology upgrading and for a systematic and coherent technology strategy, and has made a commitment to full liberalization. However, sustained growth and development benefits cannot be attained without improving competitive abilities. Insofar as manufacturing is expected to play an important role in structural transformation, it is vital to invest in upgrading industrial technology. Only then can the country compete in the activities in which Tanzania currently has a comparative advantage, and over time move into the more advanced activities that hold the best prospects for growth and learning spillovers.
Technological upgrading is needed not so much to help Tanzania to innovate or pick winners in high-technology activities, but to help the country use its existing resources more efficiently and exploit its competitive advantages in line with changing technologies and possibly rising wages. Technology development should thus first focus on strengthening existing activities, such as processing local resources and making simple consumer goods and metal products. These products should be made as internationally competitive as possible, using FDI where appropriate to overcome technology, skill and marketing gaps. An immediate priority must be to raise skill levels. As a competitive base is established in simple activities, the Government should re-orient institutions to meet more advanced technology needs. This will require a coherent and coordinated policy approach.
1. Technology strategy formulation
COSTECH has the vital task of masterminding science and technology policies within the Ministry of Science, Technology and Higher Education. However, it lacks the resources and authority to do so effectively. The first recommendation is that its capabilities be enhanced and its ability to implement strategy greatly strengthened. The role of technology as distinct from science should be elevated in national policy making.
Enhancing the capabilities of COSTECH needs actions on many fronts. The basic science and technology strategy of the Ministry needs rethinking. For example, the 1996 technology plan was over-ambitious and vague. It was a “supply” strategy, and was not oriented towards the technology demand of the industrial sector. The main task of technology policy in Tanzania should be to stimulate and improve private-sector technological effort.
In addition to changing the basic approach to science and technology policies, it is important for the Government to raise the skills of and resources of COSTECH. Low salary levels, which sap morale and work motivation, must be addressed. The information and analysis available on best-practice technology policy is inadequate.
AAffrriiccaa''ss TTeecchhnnoollooggyy GGaapp
82
Finally, if technology policy is to be effective, it must be coordinated across all agencies concerned, such as education, finance, FDI, industry, agriculture, education and infrastructure. It must also give a prominent role to the private industrial sector. Private industry must be made aware of the need for technology upgrading and must participate fully in policies that affect this. To achieve coordination, the political status of technology policy has to be raised and its importance to long-term growth and competitiveness recognized at all levels of the Government. 2. Improving human capital and skills
The human capital base in Tanzania is small: almost all indices of skill formation place it at or near the bottom of the world ranking (Lall, 1999b). It is also lagging relative to regional industrial powers such as Kenya, and, further afield, Zimbabwe. The low output of skills, as indicated by formal school enrolment, is exacerbated by the poor quality and low relevance to industrial needs of the training imparted. Enterprises invest little in employee training; many are not even aware of their skill deficiencies or needs. In a world increasingly driven by skills, particularly new technical skills, the handicaps created by this weak and stagnant skill base for growth can hardly be overestimated. The second recommendation is that the Government, as a matter of priority, launch a new skills strategy aimed at creating competitive skills for industry.
The importance of raising formal skill levels is recognized worldwide; moreover, it is evident that the skill composition of new employment generation is shifting rapidly in response to technical change and liberalization. The response of South African manufacturing employment might hold important lessons for less industrialized countries such as Tanzania.
Prior to the liberalization of South African manufacturing in the late 1980s, employment was growing fastest in the unskilled categories and slowest in the highly skilled ones. The first impact of liberalization was to reduce overall employment, the hardest hit being low-skilled workers. This pattern persisted during the recent economic recovery and is increasingly seen as representative of changes in employment patterns across the world. In newly industrializing developing countries, most employment growth has been in skilled categories, owing to the higher levels of technical and managerial competence needed even in relatively low-technology activities.
Broad issues of education and training in Tanzania are beyond the scope of this report. Some general remarks, however, are in order. Several kinds of skill development are relevant to technology upgrading in industry and need to be improved. Of these, the ones that need most immediate attention are training in specific industrial skills for the most important industrial activities that can form the dynamic edge of industrial growth, in terms of competing with imports or entering export markets. While this study cannot analyse these areas in detail, casual observation suggests that activities such as garment making, textiles, woodworking, food processing, metalworking and the manufacture of other light consumer goods should be assigned top priority in terms of providing specialized training to raise productivity. Needless to say, investments in education and vocational training are also necessary, but these can be undertaken only in the longer term.
TThhee CCaassee ooff TTaannzzaanniiaa
83
Stimulation of in-firm training is another policy intervention that needs to be undertaken in the short to medium term.4 This requires the launching of concerted campaigns to inform firms, especially smaller ones, of the benefits of and need for employee training to meet the rigours of import competition. But information and propaganda cannot be enough. Firms have to be shown how to train, how much and in what areas; they need teachers with industry experience; and they need financial support to undertake appropriate training. Often training has to go together with the provision of new equipment, better layout, improved process know-how and more modern product technology. All these improvements may require specific policies addressing their informational, financial and other needs. The example of Singapore, which has one of the best-trained workforces in the world, may be instructive (see Box 4.3). 3. Stimulating and improving technology imports
Tanzania imports little new technology, an indication of poor adjustment to a new liberal environment where there are no policy impediments to technology import. Although implementation of the intellectual property rights (IPR) regime appears to be slow and cumbersome, the market is too small and local competition too underdeveloped for IPR to adversely affect the transfer of technology. The main focus of technology transfer policy has to be on information provision to enterprises, particularly SMEs, regarding sources, costs and appropriateness of foreign technologies, backed by the provision of technical extension and financial support to help enterprises absorb new technologies.
The importance of providing information on sources of foreign technology cannot be overstated. Firms in developing countries, especially those not geared to export activity, often do not have access to information on technology sources. East Asian economies made it a point to provide up-to-date such information to local enterprises, including online databases in all major industrial centres. Information access was backed by an extensive support system covering advice, finance, consultancy and marketing support.
Productivity centres are a well-tried and effective means of raising the quality and impact of technology transfer to industry. It is recommended that Tanzania set up such centres, starting with major industries like food processing and metalworking. These centres should have the capacity not only to undertake detailed productivity analysis but also to help finance remedial measures and undertake effective marketing. They should adopt a proactive approach, with qualified teams visiting enterprises, offering free diagnoses and putting together packages of technology, training and financing. Initially, these services should be offered at low cost to enterprises, with movement over time towards full cost.
Technology upgrading needs a clear understanding of the technological status and needs of existing enterprises. Developed countries gain such understanding by conducting or promoting benchmarking exercises at the enterprise level. In the United Kingdom, for instance, large firms use PROBE software with data on thousands of leading European firms; this is provided by the Confederation of British Industry and does not involve government assistance. SMEs, on the other hand, are provided benchmarking help by the Department of Trade and Industry, which has developed a simple questionnaire to collect basic data and provide a quick assessment. A central
4 The Tanzania Association of Consultants (TACO) notes the importance of on-the-job training and the
involvement of all stakeholders in improving the industrial sector (TACO, August 2000).
AAffrriiccaa''ss TTeecchhnnoollooggyy GGaapp
84
database of information on more than 60 indicators of financial, operational and managerial performance has been collected nationally. The object of the exercise is to benchmark around 10,000 SMEs yearly, comparing company performance with national, regional or sectoral standards. The comparison is used to offer subsidized consultancy services to firms. In addition, the Government conducts productivity comparisons of major industries to assess if and why there are gaps vis-à-vis major competitors. Tanzania might consider undertaking an enterprise benchmarking exercise to establish a baseline for its assistance to technology development in industrial firms.
Box 4.3 Skills development for technology-based industrialization in Singapore
In conjunction with its drive to build a technology-intensive industrial sector, the Government of Singapore has been investing heavily in its workforce. The university system was expanded and its focus shifted from social studies to technology and science. Singapore, an island state with a population of less than 3 million, has two national universities, four polytechnics and numerous public or nonprofit specialized training institutes. As of 1996, almost half of its university graduates were in technical fields. The polytechnics offer courses that have been designed in cooperation with the business sector, especially in the areas of mid-level technical and managerial skills with emphasis on engineering. Technical institutes throughout the country provide blue-collar workers with skills improvement courses.
Singapore’s programme for industrial training started in 1979, when the Skills Development Fund was set up. The Fund is financed by a 1 per cent levy on company payrolls and has been successfully used to subsidize the training of lower-skilled workers. Twenty years later, national investment in training in Singapore has risen to 4 per cent of annual payroll, almost twice the United Kingdom’s estimated 1.8 per cent in 1998. It should be noted that larger firms spend close to 6.3 per cent of payroll on training, while smaller firms spend only 2.3 per cent. Thus, to ensure equal training opportunities, the Skills Development Fund established a Development Consultancy Scheme, which provides grants to SMEs for short-term consultancy on management, technical know-how, business development and staff training; a Training Voucher Scheme, which subsidizes employers in paying training fees; and a Training Leave Scheme, which encourages companies to send their employees for training during office hours. More than 3,000 new companies, most with fewer than 50 employees, used these schemes in 1990.
The success of the Skills Development Fund results partly from a strategy of incremental implementation. Initially, efforts focused on creating awareness among employers, with ad hoc reimbursement of course fees. The policy was then refined to target in-plant training, and reimbursement increased to 90 per cent of costs as an additional incentive. Further modifications were made to encourage the development of corporate training programmes by paying grants in advance of expenses, thus reducing interest costs to firms.
The Vocational and Industrial Training Board is an integrated training structure that has, since its establishment in 1979, trained and certified about 9 per cent of the country’s workforce. It administers several programmes, including the Full-Time Institutional Training Programme, the Continuing Skills Training Programme, custom-made courses, continuing education, the Training and Industry Programme, and the Industry-Based Training Programme. The Board also provides testing and certification of its trainees and apprentices in retailing, health care and travel services. The Government has collaborated with foreign enterprises in designing training centres for the Board, as well as in programme design and technical expertise.
Consequently, there has been a significant shift within the workforce to higher-skilled jobs. The proportion of professional and technical workers rose from 15.7 per cent in 1990 to 23.1 per cent in 1995. Despite these efforts, there is a chronic shortage of skills of all sorts in Singapore. To help address this issue, the Economic Development Board monitors emerging skill needs and redesigns training programmes accordingly. It also established the International Manpower Programme to help companies attract and recruit skilled personnel from abroad. By 1997, more than 12,000 expatriates had been recruited under this programme. More recently, Manpower 21 was set up to develop Singapore into a “talent capital” that would support the country’s transition into a knowledge economy.
Source: Economic Development Board website.http://www.sedb.com
TThhee CCaassee ooff TTaannzzaanniiaa
85
4. Stimulating technological activity by enterprises
Within the industrial sector, there seems to be little interest in technological adaptation and innovation. Most firms use imported technology rather passively, often well below international best-practice levels. This differs from the strategy adopted by successful Asian economies, which encouraged their firms to import new technologies and to invest resources in absorbing, adapting and improving on them. These efforts enabled the firms to reach international competitiveness even though they were not yet at the frontier of innovation. Such a technology culture does not exist in Tanzania, and the Government does not make efforts to stimulate it. For instance, there are no fiscal incentives for enterprise R&D, which is not even tax-deductible. Among second-tier newly industrializing economies, R&D is given tax subsidies of 150 to 200 per cent.5
It is recommended that the Government of Tanzania accept enterprise R&D as a tax-deductible expense and consider granting a subsidy of 125 per cent. However, tax incentives are unlikely by themselves to stimulate much technology upgrading. In the absence of demand for R&D from enterprises, the firms likely to take advantage of the subsidy are a few large local or foreign firms that would conduct technological activity in any case. To encourage additional R&D efforts, it is vital to persuade smaller firms to launch new technological activity.
Among other things, success requires concerted information and persuasion campaigns, backed by public recognition, awards, or other targeted measures to promote technology consciousness. The Government could select leading technology performers as technology models. Industry associations can play a major role, as they do Asia, but they themselves have to be convinced of the need to boost technological capabilities.
Another recommendation is that the Government of Tanzania consider setting up a Technology Fund to co-finance enterprise R&D. The Technology Fund should provide resources as a conditional loan, to be repaid by successful ventures and otherwise written off.6 Similar funds have been used with considerable success in Turkey and India, within the context of World Bank–financed Industrial Technology Development Projects. In both countries, each proposal was carefully vetted and monitored by representatives from industry and research. There was an unexpectedly large demand among private enterprises for R&D support, and the majority of projects turned out to be commercially viable. In India, the project made R&D collaboration with research institutes a condition of the loan, while in Turkey the collaboration could be within the firm. Winning research projects became very prestigious in both countries and helped launch a more general awareness that “research and development can pay.”
It is recommended that Tanzania consider a fund of this sort, possibly with World Bank assistance, to include both internal R&D efforts and collaboration with research institutes and universities. The project should be backed by extensive publicity to raise awareness in industry and stimulate higher-level, better-quality technology transfer. It should be managed jointly by the Government and industry
5 TACO suggests importation of needed technology from industrialized Asian and Nordic countries. Modern
industrial management techniques, both in theory and in practice through the use of consultants, managers and even a few skilled workers, could also be imported to establish and update industrial centres. SMEs would benefit greatly from such direct importation (TACO, August 2000).
6 While this raises the risk of losses if a large proportion of the projects fail, experience suggests that the risk in quite small. Moreover, enterprises will not deliberately take advantage of the Government if they are required to put up half the money.
AAffrriiccaa''ss TTeecchhnnoollooggyy GGaapp
86
associations and be equipped with mechanisms for constant monitoring, evaluation and feedback.
Technology stimulation requires Government action on several fronts: infrastructure, supply chains, human resource development, finance, technological support among others. As a first step, Government might prioritize certain key areas for immediate action. An essential element in formulating an effective technology strategy is basic information on the technological status and needs of the main industrial sectors. This requires a technology audit exercise to benchmark the performance of leading firms and to identify the most pressing technological needs of enterprises. Benchmarking is a tool commonly used in developed and industrializing economies in formulating strategies.
It is recommended that the Government of Tanzania set up a permanent unit, using private consultants as needed, to conduct benchmarking and technology audits on a continuous basis. This unit should provide the information needed to evaluate and monitor technical competitiveness and make recommendations regarding appropriate policy support. Alternatively, the Centre for Development and Transfer of Technology could be strengthened to undertake these functions. 5. Strengthening the technology infrastructure and institutions
The laboratories of the Tanzania Bureau of Standards need to be upgraded to attain international accreditation. The Bureau has been trying to upgrade its food and chemical laboratories for accreditation, but this has required considerable new investment and training.7 It also needs to extend the range and coverage of its facilities to serve potential or emerging industrial activities. The Government should seriously consider making this investment, since efficient, modern and internationally accepted standards are essential for technology development. Further investment would be needed in order for the Bureau to develop its own accreditation capabilities; the Bureau’s capacity to accredit independent testing laboratories would facilitate the growth of a private technology services market.
The Bureau should consider turning its testing activities over to the private sector, and should focus on its core standard-setting activities. It should also be provided with the necessary resources and incentives to undertake a more proactive quality campaign, particularly to reach SMEs. Quality management consultants need to be encouraged, and university courses on standardization and quality management established. Expertise in metrology, particularly in the field of energy, should also be developed. As at all public-sector technology institutions, salary levels are inadequate for attracting and retaining high-quality technical personnel. The Tanzania Bureau of Standards needs a more aggressive approach to reaching out to enterprises, and perhaps a change in the management culture of the organization is called for.
The Tanzania Industrial Research and Development Organization is in a pivotal position to help industry with technology import, upgrading and capability building. It is therefore vital to revive, strengthen and broaden the Organization’s capabilities and make it useful to industry. The Organization’s revival, which would require a complete overhaul of its organization, management, staff and skills, should be based on a comprehensive strategic plan developed in consultation with the private sector. The focus of the Organization should shift to providing services needed by firms. The
7 New equipment for seven laboratories is estimated to cost around $750,000.
TThhee CCaassee ooff TTaannzzaanniiaa
87
reform of its Kenyan counterpart, described in Chapter 2, as well as India’s Spread Programme (see Box 2.6), may offer useful lessons.
The Small Industries Development Organization, in an effort to regenerate itself, has appointed a new board and is seeking further foreign assistance. However, as with the Tanzania Industrial Research and Development Organization, what is needed is not just to provide additional resources but to thoroughly restructure and reorient the institution to the needs of SMEs. It could, for example, offer SMEs an array of services covering technology, marketing, training and marketing assistance. The Government should commit itself to providing the Organization with adequate funding on a long-term basis, thus reducing its dependence on variable foreign resources. As with the other institutions, the salary and incentive structure for staff members should be improved. Staff training and work equipment have to be upgraded and modernized.
There are two general approaches that the Organization should use in addition to reaching out to SMEs: promotion of subcontracting between large firms and SME suppliers, and strengthening of SME clusters. While the importance of subcontracting is recognized, there is in fact relatively little interaction between large and small enterprises in Tanzania, perhaps reflecting weaknesses on both sides. The Organization should focus on improving the supply and linkage capabilities of SMEs, providing them information and assistance specifically to meet the needs of large firms. In this effort it should actively enlist the collaboration of larger firms, perhaps having their procurement managers provide part-time assistance. Singapore has used this approach succesfully to introduce potential suppliers to high-technology transnational corporations. SME clusters could also be strengthened by promoting cooperation among them. Geographical location of a service centre to an industry cluster is key to its effectiveness, as illustrated by Spain's toy production industry. Other important elements to success of the service centre Instituto Tecnológico de Juguetes are affordable membership and service fees, demand-driven approach, close working relationship between the service centre technicians and SME owner-managers, representation of business sector in the service centre's governing board, as well as an explicit policy to promote inter-firm cooperation (Albaladejo, 2002) 6. Attracting foreign direct investment
While Tanzania has greatly improved its FDI regime and the Tanzania Investment Center has become a dynamic institution, several remaining bureaucratic impediments drive investors elsewhere. There are still regulations and procedures which significantly increase the cost of conducting business, and problems with corruption and conflicting and confusing regulations negatively affect investors’ assessment of the country as an investment destination. Data collected by the World Bank's Business Environment Division in 1998 on the amount of time senior executives spent in negotiating with government officials indicated that it took 3.25 hours on average with Tanzanian officials. On the other hand, business executives only needed about 1 hour 10 minutes with Swiss officials. Added to these procedural handicaps are poor infrastructure, weak institutional support, skill deficits, low supplier capabilities and corruption. FDI promotion could not be effective without government action to address these problems.
7. The intellectual property regime
The Government of Tanzania has to improve its capabilities for enforcing modern and effective IPR to encourage the transfer of technology. While IPR are not
AAffrriiccaa''ss TTeecchhnnoollooggyy GGaapp
88
likely to affect technological activity at this stage of Tanzania’s industrial development, a strong IPR regime is recommended because 1) protection of knowledge assets is an important determinant in the choice of FDI destination; 2) all WTO members are signatories to the TRIPS Agreement; and 3) many developing countries are becoming, or will soon become, innovators in their own right. For these countries, stronger IPR are necessary for promoting innovation and R&D-based inward FDI. Countries further down the technological scale may also find that a stronger IPR regime helps promote the development of a technology culture. Tanzania has therefore established a structure that will meet its long-term needs.
It is not possible to reverse the trend towards strengthening IPR; the only way to benefit from it is to improve domestic capabilities to absorb new technology and to attract technology transfer, primarily by FDI. In so doing, Tanzania could reap enormous technological benefits, as the experience of East Asia demonstrates. A strong legal regime is of no use if implementation is slow, cumbersome and non-transparent. Tanzania needs qualified patent lawyers and judges and a system that acts quickly and fairly, and is perceived as doing so. The potentially anti-competitive effects of strong IPR have to be offset by effective competition policy. This is itself a very demanding and skills-intensive task that no developing country today can afford to neglect. Competition policy is not considered in detail in this study.
J. Final words
The Government of Tanzania has recognized the importance of technology and of policies to support technology development. Its slow pace of technological progress could leave the country marginalized and stranded on a stagnant base of low-skill, low-value activities. Liberalization has not elicited a technology response from the industrial sector, nor stimulated the country’s skill and institutional base. The current policy and institutional structures are clearly inadequate to the task Tanzania in terms of transferring, mastering and using technology.
Tanzania’s trade and macroeconomic environment has generally improved, except for the cost of doing business, which is still unacceptably high and can be addressed by short-term measures. Harder to tackle are issues such as the low skills base. Moreover, the Government’s lack of interest in technology is a major handicap for institutional improvement. A strong Government commitment to technology development – a commitment that amounts to an obsession in the dynamic East Asian countries – is conspicuously absent in Tanzania.
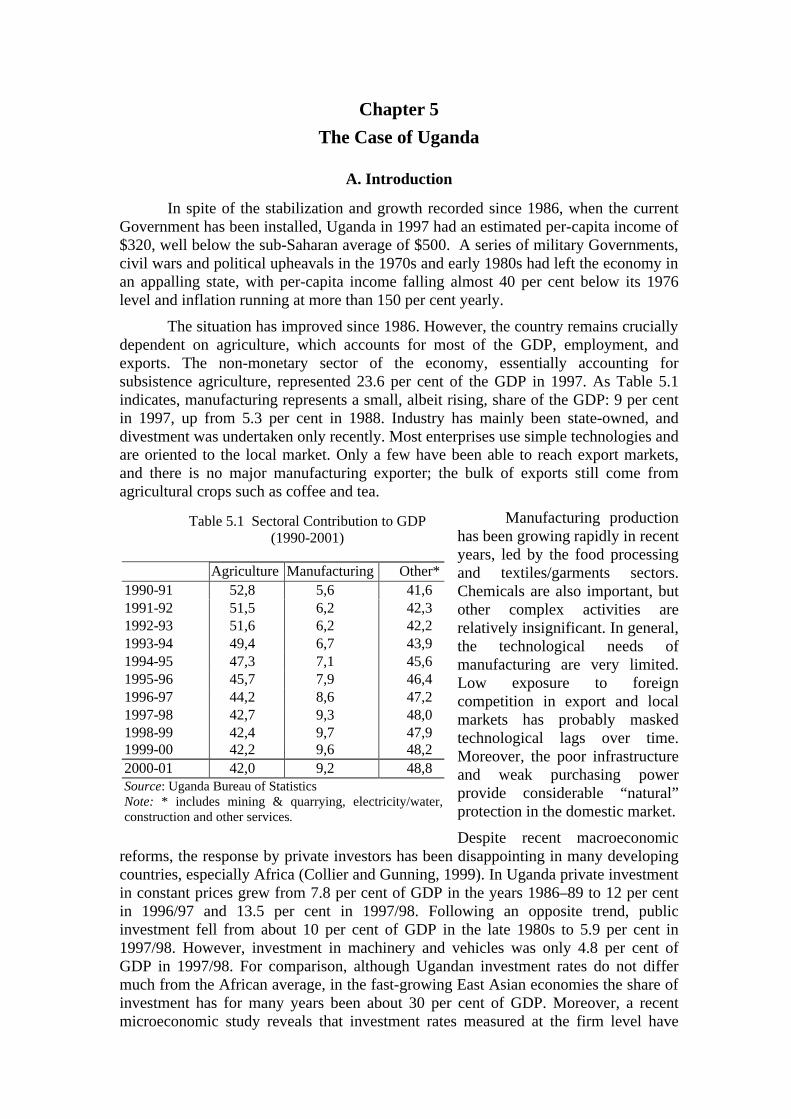
Chapter 5 The Case of Uganda
A. Introduction
In spite of the stabilization and growth recorded since 1986, when the current Government has been installed, Uganda in 1997 had an estimated per-capita income of $320, well below the sub-Saharan average of $500. A series of military Governments, civil wars and political upheavals in the 1970s and early 1980s had left the economy in an appalling state, with per-capita income falling almost 40 per cent below its 1976 level and inflation running at more than 150 per cent yearly.
The situation has improved since 1986. However, the country remains crucially dependent on agriculture, which accounts for most of the GDP, employment, and exports. The non-monetary sector of the economy, essentially accounting for subsistence agriculture, represented 23.6 per cent of the GDP in 1997. As Table 5.1 indicates, manufacturing represents a small, albeit rising, share of the GDP: 9 per cent in 1997, up from 5.3 per cent in 1988. Industry has mainly been state-owned, and divestment was undertaken only recently. Most enterprises use simple technologies and are oriented to the local market. Only a few have been able to reach export markets, and there is no major manufacturing exporter; the bulk of exports still come from agricultural crops such as coffee and tea.
Manufacturing production has been growing rapidly in recent years, led by the food processing and textiles/garments sectors. Chemicals are also important, but other complex activities are relatively insignificant. In general, the technological needs of manufacturing are very limited. Low exposure to foreign competition in export and local markets has probably masked technological lags over time. Moreover, the poor infrastructure and weak purchasing power provide considerable “natural” protection in the domestic market.
Despite recent macroeconomic reforms, the response by private investors has been disappointing in many developing countries, especially Africa (Collier and Gunning, 1999). In Uganda private investment in constant prices grew from 7.8 per cent of GDP in the years 1986–89 to 12 per cent in 1996/97 and 13.5 per cent in 1997/98. Following an opposite trend, public investment fell from about 10 per cent of GDP in the late 1980s to 5.9 per cent in 1997/98. However, investment in machinery and vehicles was only 4.8 per cent of GDP in 1997/98. For comparison, although Ugandan investment rates do not differ much from the African average, in the fast-growing East Asian economies the share of investment has for many years been about 30 per cent of GDP. Moreover, a recent microeconomic study reveals that investment rates measured at the firm level have
Table 5.1 Sectoral Contribution to GDP (1990-2001)
Agriculture Manufacturing Other*
1990-91 52,8 5,6 41,6 1991-92 51,5 6,2 42,3 1992-93 51,6 6,2 42,2 1993-94 49,4 6,7 43,9 1994-95 47,3 7,1 45,6 1995-96 45,7 7,9 46,4 1996-97 44,2 8,6 47,2 1997-98 42,7 9,3 48,0 1998-99 42,4 9,7 47,9 1999-00 42,2 9,6 48,2 2000-01 42,0 9,2 48,8 Source: Uganda Bureau of Statistics Note: * includes mining & quarrying, electricity/water, construction and other services.
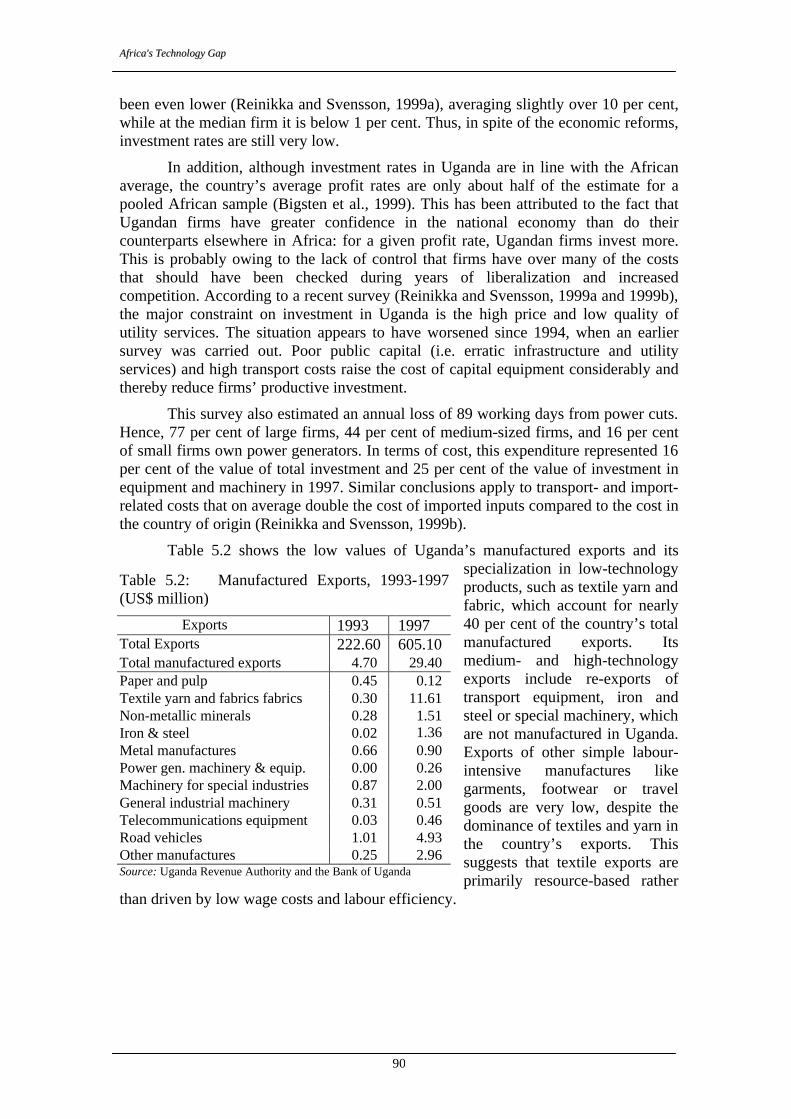
AAffrriiccaa''ss TTeecchhnnoollooggyy GGaapp
90
been even lower (Reinikka and Svensson, 1999a), averaging slightly over 10 per cent, while at the median firm it is below 1 per cent. Thus, in spite of the economic reforms, investment rates are still very low.
In addition, although investment rates in Uganda are in line with the African average, the country’s average profit rates are only about half of the estimate for a pooled African sample (Bigsten et al., 1999). This has been attributed to the fact that Ugandan firms have greater confidence in the national economy than do their counterparts elsewhere in Africa: for a given profit rate, Ugandan firms invest more. This is probably owing to the lack of control that firms have over many of the costs that should have been checked during years of liberalization and increased competition. According to a recent survey (Reinikka and Svensson, 1999a and 1999b), the major constraint on investment in Uganda is the high price and low quality of utility services. The situation appears to have worsened since 1994, when an earlier survey was carried out. Poor public capital (i.e. erratic infrastructure and utility services) and high transport costs raise the cost of capital equipment considerably and thereby reduce firms’ productive investment.
This survey also estimated an annual loss of 89 working days from power cuts. Hence, 77 per cent of large firms, 44 per cent of medium-sized firms, and 16 per cent of small firms own power generators. In terms of cost, this expenditure represented 16 per cent of the value of total investment and 25 per cent of the value of investment in equipment and machinery in 1997. Similar conclusions apply to transport- and import-related costs that on average double the cost of imported inputs compared to the cost in the country of origin (Reinikka and Svensson, 1999b).
Table 5.2 shows the low values of Uganda’s manufactured exports and its specialization in low-technology products, such as textile yarn and fabric, which account for nearly 40 per cent of the country’s total manufactured exports. Its medium- and high-technology exports include re-exports of transport equipment, iron and steel or special machinery, which are not manufactured in Uganda. Exports of other simple labour-intensive manufactures like garments, footwear or travel goods are very low, despite the dominance of textiles and yarn in the country’s exports. This suggests that textile exports are primarily resource-based rather
than driven by low wage costs and labour efficiency.
Table 5.2: Manufactured Exports, 1993-1997 (US$ million)
Exports 1993 1997 Total Exports 222.60 605.10 Total manufactured exports 4.70 29.40 Paper and pulp 0.45 0.12 Textile yarn and fabrics fabrics 0.30 11.61 Non-metallic minerals 0.28 Iron & steel 0.02
1.51 1.36
Metal manufactures 0.66 0.90 Power gen. machinery & equip. 0.00 0.26 Machinery for special industries 0.87 2.00 General industrial machinery 0.31 0.51 Telecommunications equipment 0.03 0.46 Road vehicles 1.01 4.93 Other manufactures 0.25 2.96 Source: Uganda Revenue Authority and the Bank of Uganda
TThhee CCaassee ooff UUggaannddaa
91
B. The policy framework for technology development 1. Strategic policy statements and objectives
In spite of official statements on the importance of science and of technology, and advanced industrial development Uganda's technology policy and technological efforts has yet to take into account the specific needs of the productive sector. The institutional infrastructure for providing basic services and inputs into enterprise technological activity is weak. Most of the expressed intentions to promote science and technology for the country’s industrial development have not been translated into concrete policy measures, and implementation, too, has generally lagged. The presence of the state in industry is still prevalent, although in the Ministry of Trade and Industry's "Industrialization Policy and Framework 1994-1997", the private sector's central role in industrialization was evoked. The paper further seven constraints to industrialization. Two of these are in the science and technology area: the shortage of skilled personnel, especially in technical and management skills; and the lack of standards and quality consciousness. To address these problems, the Government formulated a following plan of action which involved: establishing a National Industrial Research Organization; encouraging enterprises to undertake research and development (R&D) by tax exemptions; strengthening the National Council for Science and Technology, the Department of Technology and the Industrial and Technological Information Unit of the Ministry of Trade and Industry, and other training institutions; introducing an industrial training levy; and providing adequate financing for R&D
Unfortunately, few of these laudable objectives have been translated into policies. They have not been based on the concrete needs of Ugandan industry, and have essentially remained a wish list. The approach to science and technology lacks a clear diagnosis and an awareness of the role of innovation and technological capabilities in industrial development. As is discussed below, technological activity remains minimal and the support institutions remain largely dormant. 2. The policy framework and the private sector
Uganda managed its macroeconomic policies relatively well in the 1990s. The policy framework was liberalized, exchange rates are now determined by the market, and inflation rates are low. Extensive trade liberalization included a complete removal of quantitative restrictions and a gradual reduction of import duties. As a result, Uganda’s import tariffs are now among the lowest in Africa, the highest official rate being 15 per cent on consumer goods. The rates for raw materials and capital goods are 7 per cent and 0 per cent respectively. Regional tariffs are even lower. Accordingly, Uganda was the first country to benefit from the new Highly Indebted Poor Country initiative in 1998. Within this context, institutional reforms have been undertaken to encourage the private sector. Investment laws and procedures have been streamlined to attract domestic and foreign investors. A new Investment Code (1991) has replaced the 1977 Foreign Investment Act and the 1969 Industrial Licensing Act. The new Code is, however, a restrictive and control-oriented regime for FDI (UNCTAD, 2000b). If implemented to the letter, it could seriously deter FDI. However, in practice Uganda has taken a much more welcoming stance towards foreign investors; since 1991 the general legislative and policy climate for investment has improved substantially. Modernization of the Investment Code is being debated; at present, the 1991 Code remains valid.
AAffrriiccaa''ss TTeecchhnnoollooggyy GGaapp
92
The Income Tax Act of 1997 streamlined the system of tax incentives and broadened the tax base, thus reducing the unpredictability of tax incentive policies observed during the 1980s and early 1990s. The reform was preceded by the introduction of duty-free treatment of imported capital goods for all firms. Among the major changes introduced were the deductibility from company’s income of 50 per cent of plant and machinery investments (75 per cent out of Kampala, Jinja and Entebbe, Uganda’s major cities), and of 100 per cent of research and training expenditures. In principle, these measures should have encouraged enterprises to invest in technology and skills upgrading.
However, such tax incentives are not likely to be effective when there is no culture of technological activity in industry. Enterprises are largely unaware of their technological and skill needs and their training options. There is no source of financing for innovative activities or even for long-term industrial investments.1 The main sources of technology lie abroad and, as in Kenya and Tanzania, there is little effort to master, adapt or improve imported technology. R&D is totally absent.
A few institutions, the most prominent of which is the Uganda Manufacturers Association (UMA), represent private-sector interests. Over the years the UMA has developed a strong partnership with the Government, and it regularly presents studies and recommendations on policy issues. However, it is not clear how influential UMA would be if major differences with the Government emerged. The Uganda Manufacturers Association Consultancy and Information Services (UMACIS), a registered company providing consultancy and other services to UMA members, is largely funded by donor agencies including USAID, the United Nations Development Programme (UNDP) and the Government of Germany. It is beginning to earn an increasing share of income from services rendered. It is demand driven and close to the interests of the private sector. UMACIS has also worked to raise quality awareness in the country through a project co-financing the consultancy costs incurred by local enterprises to achieve International Standards Organization 9000 certification. Some interesting, though small, contributions to technology transfer have come from a scheme to attract nationals under the Transfer of Knowledge through Expert Nationals (TOKTEN) scheme and the TIPS programme to foster South-South enterprise cooperation. UNDP is funding both programmes.
Representing the small-scale sector, the Uganda Small-Scale Industry Association is a non-governmental organization created in 1979. It has become a national forum for discussion on issues related to small and medium-sized enterprises (SMEs); promoting and encouraging their development and efficiency; and providing policy advocacy to present SMEs’ requests to the Government. The organization, however, does not have regular source of funding and lacks clarity of direction. It is almost completely donor-funded, with only 1 per cent of the yearly budget coming from membership fees. Its staff of about seven is charged with providing training to some of its 1,000 members. The Austrian Development Cooperation has recently provided it with a new complex to house an exhibition hall, but few activities are being carried out. In principle, SMEs deserve support and advice, especially in their start-up phase, but the Uganda Small-Scale Industry Association appears uninfluential and passive in this respect.
1 To remedy this, the Private Sector Foundation launched a Uganda Equity Financing project in 1997. However,
this project never started operation. The risk evaluation capacity in the country was very poor and one of the important causes of the failure (interviews during field mission, Sept. 1999).
TThhee CCaassee ooff UUggaannddaa
93
Other private-sector actors are the Uganda Exporters’ Association, the Uganda National Chamber of Commerce and Industry, and the Private Sector Foundation. The latter was created in 1996, largely with funding from USAID and the World Bank/IDA, to provide policy advice and management training services. The most interesting project undertaken by Private Sector Foundation is the Business Uganda Development Scheme, a cost-sharing scheme to subsidize 50 per cent of enterprises’ consulting service expenditures, up to a maximum of $50,000 per firm. Among the services co-financed are the training received by nine firms to certify for International Standards Organization 9002, under the guidance of the consulting firm Total Quality Management Ltd., an offshoot of a Norwegian company.2 However, during the period October 1996 through March 1999 the Scheme reimbursed only a total of $915,000 ($30,000 per month). The slow implementation of the scheme has been attributed to the difficulties of convincing firms to pay for a service and to slow financing by the funding agency. Despite these setbacks, the scheme is well conceived and designed. It reflects the right kind of approach to fostering industrial development, especially of SMEs, in an emerging economy such as Uganda’s. 3. The intellectual property regime
The Uganda Patent Law (1991) is administered by the Uganda Registration Services Bureau, a department of the Ministry of Justice. Uganda is signatory to both the Africa Regional Intellectual Property Organization (ARIPO) and the World Intellectual Property Organization. The Bureau is in charge of copyrights, for which no legal provision exists to date, as well as patents, industrial designs and trademarks, for which relevant laws exist. Under the TRIPS Agreement, all pending activities related to intellectual property will be enforceable retroactively.
There are proposals to restructure the Uganda Registration Services Bureau as an autonomous unit with a larger range of services, thereby giving its functions a higher profile. Although a relevant law was passed in 1997, it is not yet operational and lacks funding. At the moment the Bureau has only eight lawyers and three clerks, and all technical examinations continue to be undertaken by the ARIPO in Zimbabwe. The Bureau is presently too weak to protect innovation and ensure effective enforcement of its decisions. Its enforcement function should be strengthened and its funding increased so it can play an important role in intellectual property protection in Uganda. However, patenting remains a marginal activity, with practically all patents used in the country being registered by foreigners. The bulk of the Bureau’s operations concern trademarks, of which there were nearly 23,000 as at end 2001.3 At this stage the weaknesses of the institutional system for intellectual property protection does not affect the country’s technological development. Once Uganda reaches a higher level of industrial and technological development, with growing local innovation, intellectual property rights will become more relevant. In anticipation of future developments, the Bureau should be substantially strengthened and given a strategic role. At present, it may suffice to have a system protecting foreign firms in the local market and relying the regional institutions, such as the ARIPO, for the more complex and technical cases.
A system of intellectual property rights protection consistent with TRIPS was due to be in place by the end of 1999. Least developed countries have until 2005 to modify their legislation. Incorporating the laws, reforming institutions and establishing
2 In 1998 Uganda Batteries Ltd. became the first company in the country to receive ISO 9000 certification.
3 Trademark application fees stand at U Sh 2,000 and $150, and, on approval, U Sh 4,000 and $250 for local and foreign applications respectively, although the disparity is contentious under the TRIPS Agreement and may need to be eliminated.
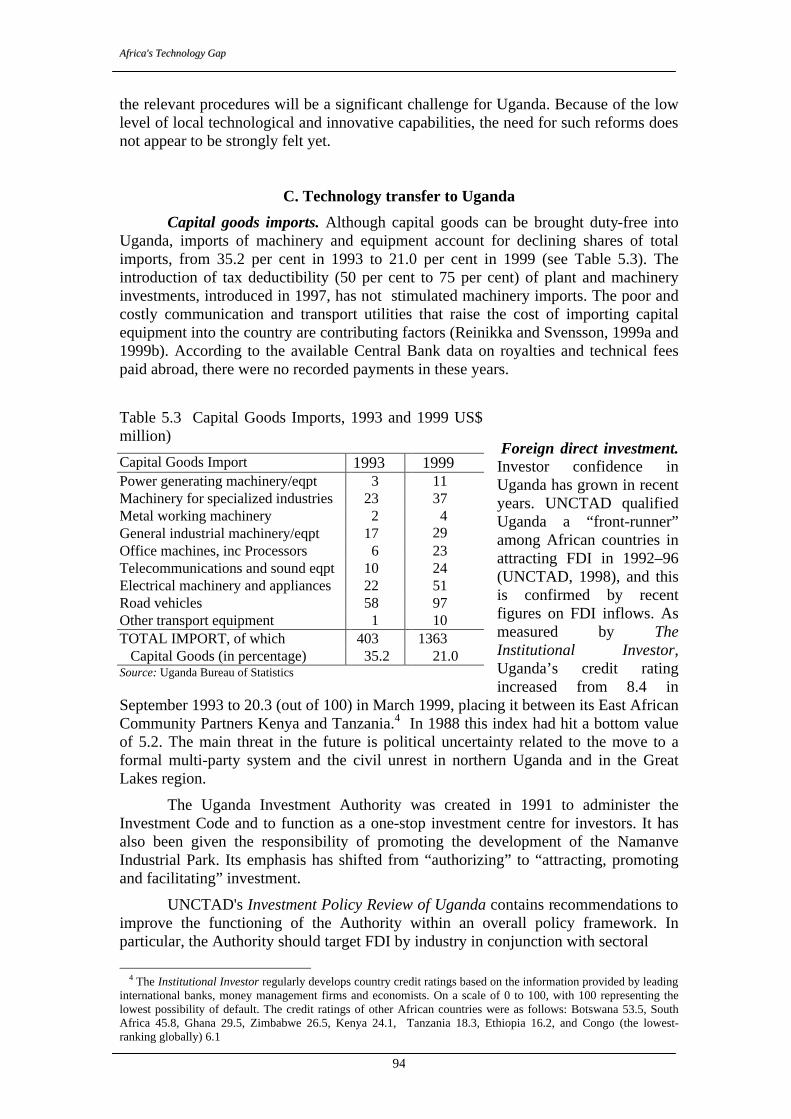
AAffrriiccaa''ss TTeecchhnnoollooggyy GGaapp
94
the relevant procedures will be a significant challenge for Uganda. Because of the low level of local technological and innovative capabilities, the need for such reforms does not appear to be strongly felt yet.
C. Technology transfer to Uganda
Capital goods imports. Although capital goods can be brought duty-free into Uganda, imports of machinery and equipment account for declining shares of total imports, from 35.2 per cent in 1993 to 21.0 per cent in 1999 (see Table 5.3). The introduction of tax deductibility (50 per cent to 75 per cent) of plant and machinery investments, introduced in 1997, has not stimulated machinery imports. The poor and costly communication and transport utilities that raise the cost of importing capital equipment into the country are contributing factors (Reinikka and Svensson, 1999a and 1999b). According to the available Central Bank data on royalties and technical fees paid abroad, there were no recorded payments in these years.
Foreign direct investment. Investor confidence in Uganda has grown in recent years. UNCTAD qualified Uganda a “front-runner” among African countries in attracting FDI in 1992–96 (UNCTAD, 1998), and this is confirmed by recent figures on FDI inflows. As measured by The Institutional Investor, Uganda’s credit rating increased from 8.4 in
September 1993 to 20.3 (out of 100) in March 1999, placing it between its East African Community Partners Kenya and Tanzania.4 In 1988 this index had hit a bottom value of 5.2. The main threat in the future is political uncertainty related to the move to a formal multi-party system and the civil unrest in northern Uganda and in the Great Lakes region.
The Uganda Investment Authority was created in 1991 to administer the Investment Code and to function as a one-stop investment centre for investors. It has also been given the responsibility of promoting the development of the Namanve Industrial Park. Its emphasis has shifted from “authorizing” to “attracting, promoting and facilitating” investment.
UNCTAD's Investment Policy Review of Uganda contains recommendations to improve the functioning of the Authority within an overall policy framework. In particular, the Authority should target FDI by industry in conjunction with sectoral
4 The Institutional Investor regularly develops country credit ratings based on the information provided by leading
international banks, money management firms and economists. On a scale of 0 to 100, with 100 representing the lowest possibility of default. The credit ratings of other African countries were as follows: Botswana 53.5, South Africa 45.8, Ghana 29.5, Zimbabwe 26.5, Kenya 24.1, Tanzania 18.3, Ethiopia 16.2, and Congo (the lowest-ranking globally) 6.1
Table 5.3 Capital Goods Imports, 1993 and 1999 US$ million)
Capital Goods Import 1993 1999 Power generating machinery/eqpt 3 11 Machinery for specialized industries 23 37 Metal working machinery 2 General industrial machinery/eqpt 17
4 29
Office machines, inc Processors 6 23 Telecommunications and sound eqpt 10 24 Electrical machinery and appliances 22 51 Road vehicles 58 97 Other transport equipment 1 10 TOTAL IMPORT, of which 403 1363 Capital Goods (in percentage) 35.2 21.0 Source: Uganda Bureau of Statistics
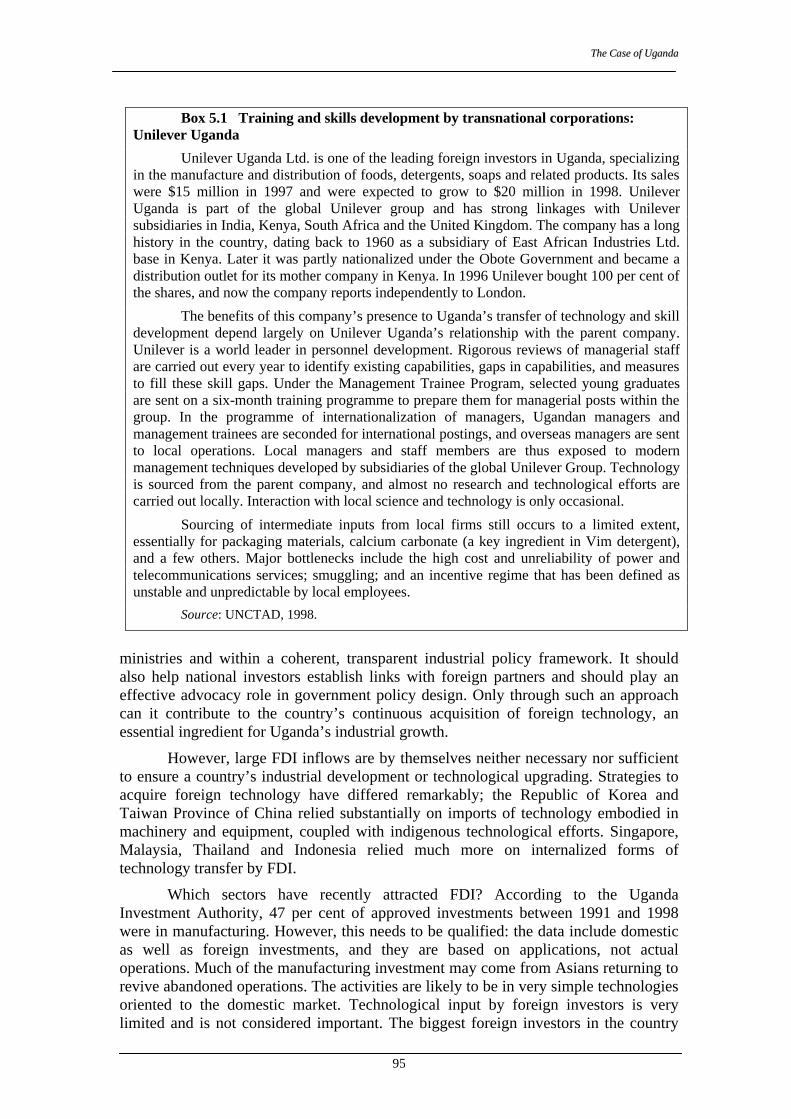
TThhee CCaassee ooff UUggaannddaa
95
ministries and within a coherent, transparent industrial policy framework. It should also help national investors establish links with foreign partners and should play an effective advocacy role in government policy design. Only through such an approach can it contribute to the country’s continuous acquisition of foreign technology, an essential ingredient for Uganda’s industrial growth.
However, large FDI inflows are by themselves neither necessary nor sufficient to ensure a country’s industrial development or technological upgrading. Strategies to acquire foreign technology have differed remarkably; the Republic of Korea and Taiwan Province of China relied substantially on imports of technology embodied in machinery and equipment, coupled with indigenous technological efforts. Singapore, Malaysia, Thailand and Indonesia relied much more on internalized forms of technology transfer by FDI.
Which sectors have recently attracted FDI? According to the Uganda Investment Authority, 47 per cent of approved investments between 1991 and 1998 were in manufacturing. However, this needs to be qualified: the data include domestic as well as foreign investments, and they are based on applications, not actual operations. Much of the manufacturing investment may come from Asians returning to revive abandoned operations. The activities are likely to be in very simple technologies oriented to the domestic market. Technological input by foreign investors is very limited and is not considered important. The biggest foreign investors in the country
Box 5.1 Training and skills development by transnational corporations: Unilever Uganda
Unilever Uganda Ltd. is one of the leading foreign investors in Uganda, specializing in the manufacture and distribution of foods, detergents, soaps and related products. Its sales were $15 million in 1997 and were expected to grow to $20 million in 1998. Unilever Uganda is part of the global Unilever group and has strong linkages with Unilever subsidiaries in India, Kenya, South Africa and the United Kingdom. The company has a long history in the country, dating back to 1960 as a subsidiary of East African Industries Ltd. base in Kenya. Later it was partly nationalized under the Obote Government and became a distribution outlet for its mother company in Kenya. In 1996 Unilever bought 100 per cent of the shares, and now the company reports independently to London.
The benefits of this company’s presence to Uganda’s transfer of technology and skill development depend largely on Unilever Uganda’s relationship with the parent company. Unilever is a world leader in personnel development. Rigorous reviews of managerial staff are carried out every year to identify existing capabilities, gaps in capabilities, and measures to fill these skill gaps. Under the Management Trainee Program, selected young graduates are sent on a six-month training programme to prepare them for managerial posts within the group. In the programme of internationalization of managers, Ugandan managers and management trainees are seconded for international postings, and overseas managers are sent to local operations. Local managers and staff members are thus exposed to modern management techniques developed by subsidiaries of the global Unilever Group. Technology is sourced from the parent company, and almost no research and technological efforts are carried out locally. Interaction with local science and technology is only occasional.
Sourcing of intermediate inputs from local firms still occurs to a limited extent, essentially for packaging materials, calcium carbonate (a key ingredient in Vim detergent), and a few others. Major bottlenecks include the high cost and unreliability of power and telecommunications services; smuggling; and an incentive regime that has been defined as unstable and unpredictable by local employees.
Source: UNCTAD, 1998.
AAffrriiccaa''ss TTeecchhnnoollooggyy GGaapp
96
source their technology from their headquarters abroad and have few links with the local science and technology system (see Box 5.1).
FDI has formed some local linkages. However, the percentage of inputs sourced locally is still low: in 1997 only 40 per cent of the firms obtained more than 50 per cent of their inputs locally. The foreign firms interviewed suggested that many local suppliers were high-cost producers and were unable to assure a regular and consistent supply of quality goods. Most local inputs consisted of primary resources for further processing. According to UNCTAD, foreign investors undertake substantial training, often by seconding an expatriate senior manager to work in Uganda during the initial years of the project. In larger affiliates, Ugandans are expected to replace foreign experts in due course. In smaller companies, expatriates tend to remain.
D. Human capital
A recent government report5 on skills and technologies suggests that Ugandan enterprises employ few technically skilled personnel. The findings of the survey of 121 enterprises are shown in Table 5.4. Part of the skills shortage has been met by employing foreigners. Mechanical engineers topped the list of foreign technical experts, possibly because local engineering schools do not offer training in the sugar, cement and machinery subsectors. By contrast, local engineers were used in light electrical industries.
The report suggests that there is no shortage of local engineers where are about 1,300 engineers in the country with about 550, 400, and 350 in the civil, electrical and mechanical engineering fields respectively. This statement is contradicted by the evidence presented in Chapter 1 on Uganda’s standing in terms of skills and human capital.
In-firm training is very low in Ugandan industry. The Vocational Training Centres that should provide technical training for shop floor workers lack financial resources, and enterprises do not attach importance to the diplomas issued by the centres. Similarly, the body in charge of developing curricula and instruction material for primary and secondary schools, the National Curriculum Development Centre, appears to be under-funded and isolated from the industrial sector. Since 1986, it has been reviewing both primary and secondary programmes in English, mathematics, science and social studies, and it is now addressing other subjects, including technology. There are plans to introduce business and entrepreneurial skills in primary schools. Similar changes are envisaged at the secondary level, with greater emphasis on business and technical education. The main stumbling blocks to any radical modification appear to be the financing of the necessary infrastructure and teacher re-training, and the Centre’s lack of conctact with the private sector.
There are three vocational training schools in Uganda. The one in Lugogo is specialized in building and metal machining and those in Nakawa and Jinja, in mechanical fabrication, electrical and automotive. The Nakawa campus has been reopened in 1997 with Chinese aid and offers short- and long-term training courses. The course offerings has been expanded to include electronics; electrical installation and fitting; automotive repair and maintenance; carpentry and joinery; sheet metal and
5 Uganda Investment Authority TECO, 1998.
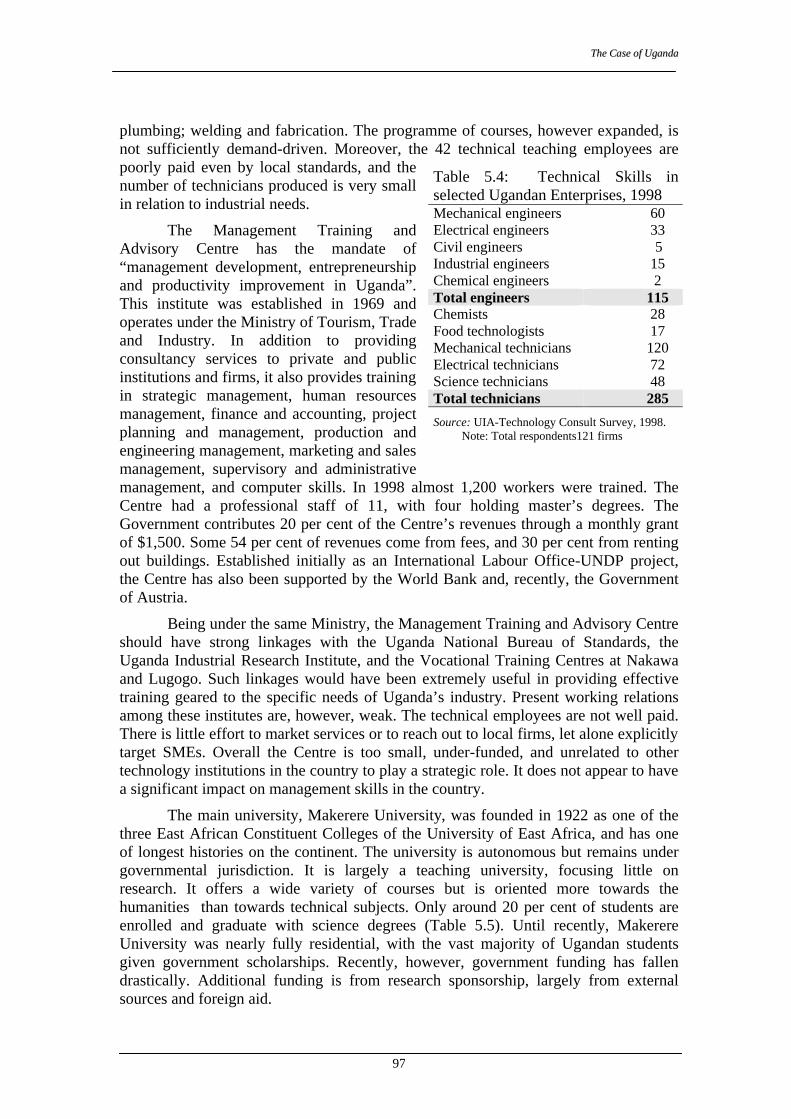
TThhee CCaassee ooff UUggaannddaa
97
plumbing; welding and fabrication. The programme of courses, however expanded, is not sufficiently demand-driven. Moreover, the 42 technical teaching employees are poorly paid even by local standards, and the number of technicians produced is very small in relation to industrial needs.
The Management Training and Advisory Centre has the mandate of “management development, entrepreneurship and productivity improvement in Uganda”. This institute was established in 1969 and operates under the Ministry of Tourism, Trade and Industry. In addition to providing consultancy services to private and public institutions and firms, it also provides training in strategic management, human resources management, finance and accounting, project planning and management, production and engineering management, marketing and sales management, supervisory and administrative management, and computer skills. In 1998 almost 1,200 workers were trained. The Centre had a professional staff of 11, with four holding master’s degrees. The Government contributes 20 per cent of the Centre’s revenues through a monthly grant of $1,500. Some 54 per cent of revenues come from fees, and 30 per cent from renting out buildings. Established initially as an International Labour Office-UNDP project, the Centre has also been supported by the World Bank and, recently, the Government of Austria.
Being under the same Ministry, the Management Training and Advisory Centre should have strong linkages with the Uganda National Bureau of Standards, the Uganda Industrial Research Institute, and the Vocational Training Centres at Nakawa and Lugogo. Such linkages would have been extremely useful in providing effective training geared to the specific needs of Uganda’s industry. Present working relations among these institutes are, however, weak. The technical employees are not well paid. There is little effort to market services or to reach out to local firms, let alone explicitly target SMEs. Overall the Centre is too small, under-funded, and unrelated to other technology institutions in the country to play a strategic role. It does not appear to have a significant impact on management skills in the country.
The main university, Makerere University, was founded in 1922 as one of the three East African Constituent Colleges of the University of East Africa, and has one of longest histories on the continent. The university is autonomous but remains under governmental jurisdiction. It is largely a teaching university, focusing little on research. It offers a wide variety of courses but is oriented more towards the humanities than towards technical subjects. Only around 20 per cent of students are enrolled and graduate with science degrees (Table 5.5). Until recently, Makerere University was nearly fully residential, with the vast majority of Ugandan students given government scholarships. Recently, however, government funding has fallen drastically. Additional funding is from research sponsorship, largely from external sources and foreign aid.
Table 5.4: Technical Skills in selected Ugandan Enterprises, 1998 Mechanical engineers 60 Electrical engineers 33 Civil engineers 5 Industrial engineers 15 Chemical engineers 2 Total engineers 115 Chemists 28 Food technologists 17 Mechanical technicians 120 Electrical technicians 72 Science technicians 48 Total technicians 285
Source: UIA-Technology Consult Survey, 1998. Note: Total respondents121 firms
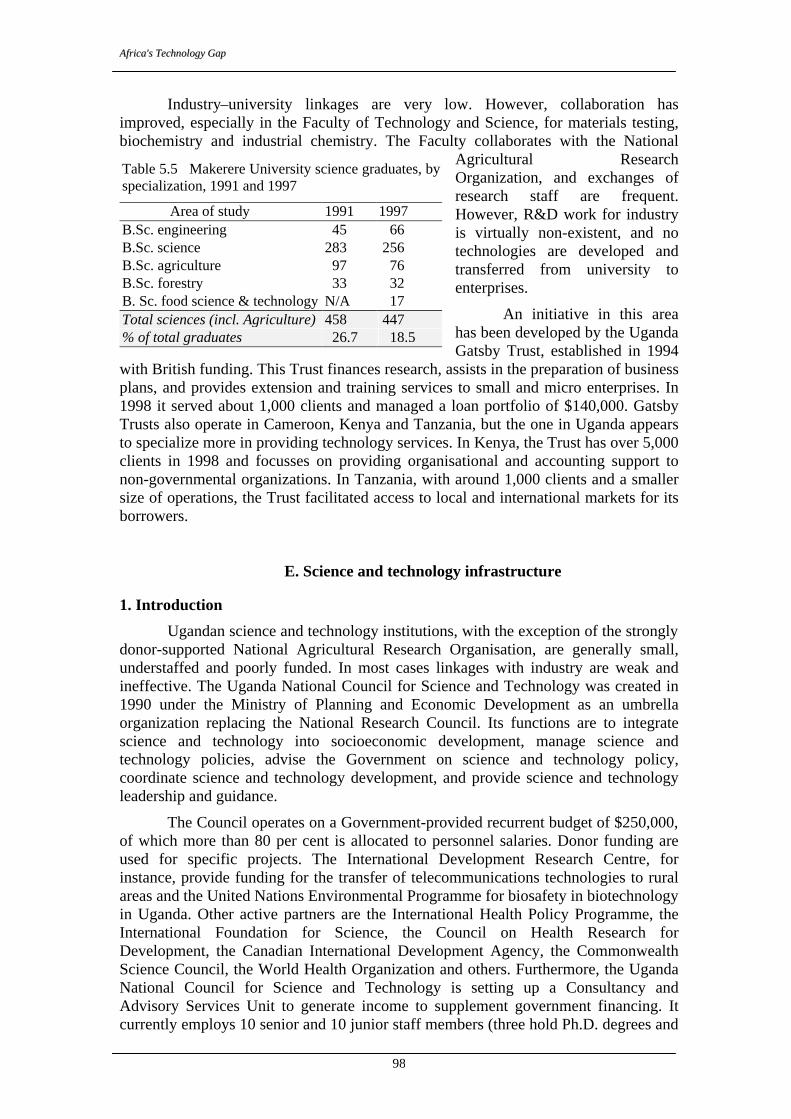
AAffrriiccaa''ss TTeecchhnnoollooggyy GGaapp
98
Industry–university linkages are very low. However, collaboration has improved, especially in the Faculty of Technology and Science, for materials testing, biochemistry and industrial chemistry. The Faculty collaborates with the National
Agricultural Research Organization, and exchanges of research staff are frequent. However, R&D work for industry is virtually non-existent, and no technologies are developed and transferred from university to enterprises.
An initiative in this area has been developed by the Uganda Gatsby Trust, established in 1994
with British funding. This Trust finances research, assists in the preparation of business plans, and provides extension and training services to small and micro enterprises. In 1998 it served about 1,000 clients and managed a loan portfolio of $140,000. Gatsby Trusts also operate in Cameroon, Kenya and Tanzania, but the one in Uganda appears to specialize more in providing technology services. In Kenya, the Trust has over 5,000 clients in 1998 and focusses on providing organisational and accounting support to non-governmental organizations. In Tanzania, with around 1,000 clients and a smaller size of operations, the Trust facilitated access to local and international markets for its borrowers.
E. Science and technology infrastructure 1. Introduction
Ugandan science and technology institutions, with the exception of the strongly donor-supported National Agricultural Research Organisation, are generally small, understaffed and poorly funded. In most cases linkages with industry are weak and ineffective. The Uganda National Council for Science and Technology was created in 1990 under the Ministry of Planning and Economic Development as an umbrella organization replacing the National Research Council. Its functions are to integrate science and technology into socioeconomic development, manage science and technology policies, advise the Government on science and technology policy, coordinate science and technology development, and provide science and technology leadership and guidance.
The Council operates on a Government-provided recurrent budget of $250,000, of which more than 80 per cent is allocated to personnel salaries. Donor funding are used for specific projects. The International Development Research Centre, for instance, provide funding for the transfer of telecommunications technologies to rural areas and the United Nations Environmental Programme for biosafety in biotechnology in Uganda. Other active partners are the International Health Policy Programme, the International Foundation for Science, the Council on Health Research for Development, the Canadian International Development Agency, the Commonwealth Science Council, the World Health Organization and others. Furthermore, the Uganda National Council for Science and Technology is setting up a Consultancy and Advisory Services Unit to generate income to supplement government financing. It currently employs 10 senior and 10 junior staff members (three hold Ph.D. degrees and
Table 5.5 Makerere University science graduates, by specialization, 1991 and 1997
Area of study 1991 1997 B.Sc. engineering 45 66 B.Sc. science 283 256 B.Sc. agriculture 97 76 B.Sc. forestry 33 32 B. Sc. food science & technology N/A 17 Total sciences (incl. Agriculture) 458 447 % of total graduates 26.7 18.5
TThhee CCaassee ooff UUggaannddaa
99
one a M.Sc. degree) and has several research associates working in other bodies and institutions. The organ responsible for the Council’s policies is composed of eminent individuals, and activities are executed by Specialized Committees on Agriculture and Allied Sciences, Medical and Veterinary Sciences, Industrial and Engineering Sciences, Natural Sciences, Physical Sciences, and Social Sciences and Humanities.
While the institution is strategically important to technology development, the Uganda National Council for Science and Technology as it stands lacks the financial and human resources to meet its broad mandate. In order to “co-ordinate all scientific and technological activities geared to national needs, and promote, develop and integrate science and technology in the national development process,”6 a very ambitious but essential objective, it should have considerable political influence and power over all the agencies involved with science and technology and industrial development. At present, the Uganda National Council for Science and Technology totally lacks such influence, and its mandate remains on paper. Also as a result, there is little coherence or coordination across the national technology system in Uganda at the moment. As was noted in the other case studies, its technological output is of very little use to the industrial sector. Among the science and technology institutions in Uganda, this study focuses on two groups: those concerned with the setting, updating and enforcement of standards and quality, and those active in R&D.
2. Standards and quality
The Uganda National Bureau of Standards is charged with developing standards and providing metrology, laboratory testing and quality assurance services to Ugandan industry. It is a statutory organisation under the Ministry of Tourism, Trade and Industry, established in 1983 and operational since 1989. It is a member of the International Standards Organization and also of the Africa Regional Organisation for Standardization. The Uganda National Bureau of Standards is the national contact point for the Codex Alimentarius Commission of the Food and Agricultural Organization (FAO) and the World Health Organization, which is responsible for the World-Wide Food Standards Programme. It is also the enquiry point for the World Trade Organization on the Agreements on Technical Barriers to Trade and on Application of Sanitary and Phytosanitary measures. In conjunction with the Kenya’s and Tanzania’s standards bureaus, the Uganda National Bureau of Standards is involved in formulating harmonized standards within the framework of East African Cooperation.
The official mandate of the Uganda National Bureau of Standards covers the formulation and promotion of national standards and the development of quality control and quality assurance systems to enhance consumer protection, public health and safety, industrial and commercial development, and international trade. Its functions include standards development and promulgation, industrial and legal metrology and calibration services, product testing and certification, shipment inspection for exporters and provision of technical information and documentation.
There is generally little awareness of quality among Ugandan entrepreneurs, and there does not seem to be any programme to promote quality consciousness. At the same time, relatively few Ugandan firms demand its services, except for occasional compulsory testing on imported items. By the end of 1998 the Bureau had granted the Uganda Standard Certification Mark to only seven companies.7 The Bureau is beginning to try to raise International Standards Organization 9000 awareness among
6 Uganda National Council for Science and Technology brochure, 1999. 7 Uganda National Bureau of Standards (1998). Catalogue of Uganda Standards and Services.
AAffrriiccaa''ss TTeecchhnnoollooggyy GGaapp
100
firms through seminars and the provision of documentation. As of late 1999, one Ugandan firm had been awarded ISO 9000 certification and a dozen others were undertaking the training required to qualify. The private sector, under the Uganda Manufacturers’ Association with German cooperation, and under the Private Sector Foundation with US and World Bank funding (see above), is subsidizing the consulting costs of local companies being helped by foreign experts to achieve ISO 9000 certification.
Ninety per cent of the Bureau’s resources come from the Government, which has committed about $1 million per year, but only about 70 per cent of this amount is actually paid out. The Bureau is beginning to generate resources by selling services at market prices, essentially metrology and calibration. Other fees are set by the Government. The Bureau’s operations have been helped by the International Trade Centre and by UNDP with a 2.5-year capacity-building and technical assistance project that expired at the end of 1999.
The Bureau has a staff of almost 80, with 30 technicians and 20 scientists with university degrees (including two with Ph.D. degrees and five with M.Sc. degrees). Its laboratories are not internationally accredited, nor does it have the capability to accredit independent private laboratories. This is a serious drawback for Ugandan industry; particularly for exporters, who must have their goods tested abroad, further increasing their actual as well as transaction costs. One strategic target expressed by the management of the institution is to qualify for ISO 9000 certification within two years. This objective appears far-fetched given the Bureau’s current work level, the absence of concrete signs of such a move, and the lack of necessary resources to effect the transformation. In short, the institution suffers from mutually reinforcing difficulties such as low quality awareness in the country, poor funding and insufficient personnel, and lack of international accreditation of measuring and testing facilities.
In the emerging world trade environment, traded products and services are increasingly required to conform to standards and regulations. The use of standards reduces transaction costs, information asymmetries and uncertainties with respect to quality and technical characteristics. Metrology provides the measurement accuracy and compatibility without which standards cannot be applied. Hence, standards contribute significantly to the diffusion of technology within and across industries. Most importantly, in a developing country a standards institution can disseminate best practice in an industry by encouraging and helping firms to understand and apply new standards. Redundant experimentation with new technologies is reduced, and enterprises are forced to use a common language that is also shared by the international market.
Therefore, the weaknesses of the Uganda National Bureau of Standards represent a serious competitive disadvantage for local industry. In general, the Bureau appears under-funded, lacking the necessary physical facilities and human technical skills. UNDP activities may help relieve the latter constraint. Its technical staff is smaller than that of the equivalent institution in Tanzania, and sufficient monetary incentives are not available to attract young graduates. The Bureau is too passive in promoting quality awareness among firms and especially SMEs; the private sector (e.g. UMA and the Private Sector Foundation) appears much more active in this respect. In the short term, the Bureau’s financing should be increased, subject to stringent requirements in terms of productivity and quality achievements. This should be carried out in conjunction with an intense national campaign to raise the private sector’s quality concerns, and to induce the Bureau to make new efforts geared to quality
TThhee CCaassee ooff UUggaannddaa
101
improvements. In the longer term, the Bureau’s role should be reassessed, especially its relations with the private sector and other institutions in the country’s science and technology system. In the future the Bureau could be in charge of certifying private laboratories, rather than performing all testing in-house. Moreover, it should become part of a comprehensive and consistent strategy to improve Uganda’s competitiveness, involving the private sector in its design and implementation on a continuous, interactive basis. Undoubtedly, the scarcity of quality awareness in Ugandan industry compounds the Bureau’s limitations. 3. Research and development institutions
The largest and most active research institution in Uganda is the National Agricultural Research Organization, established in 1991 as a semi-autonomous institution under the Ministry of Agriculture, Animal Industry and Fisheries. Its prominence reflects the essentially agricultural nature of the Ugandan economy. The main aim of the Organization is to coordinate and undertake adaptive research in crop, livestock, fisheries, forestry and related production systems, ranging from agricultural engineering and food science to natural resources management. In addition, it plays an important role in the transfer and dissemination of technology to small-scale farmers.
The World Bank has largely funded the National Agricultural Research Organization, initially for five years (beginning in 1992) for over $20 million, then for a six-year second phase with $26 million. Additional funding has come from Danida, FAO and the Rockefeller Foundation and others. In recent years, the Organization’s annual budget has been around $10 million, with the Government contributing 30 per cent. The Organization employs 210 scientists and over 600 support employees, and financing from the private sector has increased. Strong links exist with the Faculties of Agriculture, Science and Veterinary Medicine of Makerere University. Research collaboration also extends to other institutions in Kenya and East Africa. Innovativeness and academic achievements contribute to the promotion of employees. Given its resources, the number of projects implemented, the range of technical skills available, and linkages with the Ministry of Agriculture and other R&D institutions, the National Agricultural Research Organization performs a useful function in promoting adaptive research and technology diffusion. The importance of a technology support system to the country’s fledging industries is illustrated in the case of its cut flower industry, discussed in Box 5.2.
The situation in the manufacturing sector is the opposite. The industrial sector is supposed to be served by the Uganda Industrial Research Institute, which has the wide-ranging mandate “to undertake applied industrial research and to develop and acquire appropriate technology in order to create a strong, effective and competitive industrial sector for the rapid industrialisation of Uganda”. The defunct East African Community established the Institute in the 1970s as one of the regional projects to promote research in industry. During the days of the East African Community the East African Industrial Research Organization was conducting research, based in Nairobi. However, in 1974–75 the Research Council of the East African Community decided to decentralize industrial research programmes in the three partner states of Uganda, Kenya and Tanzania, on the basis of availability of local raw materials and resources. Kenya set up the Kenya Industrial Research and Development Institute, while the Tanzania established the Tanzania Industrial Research and Development Organization (see chapters 2 and 4). The Research Council of the East African Community recommended and approved the setting up of a Food Technology and Industrial Ceramics Research Institute in Kampala. In 1977, the East African Community broke
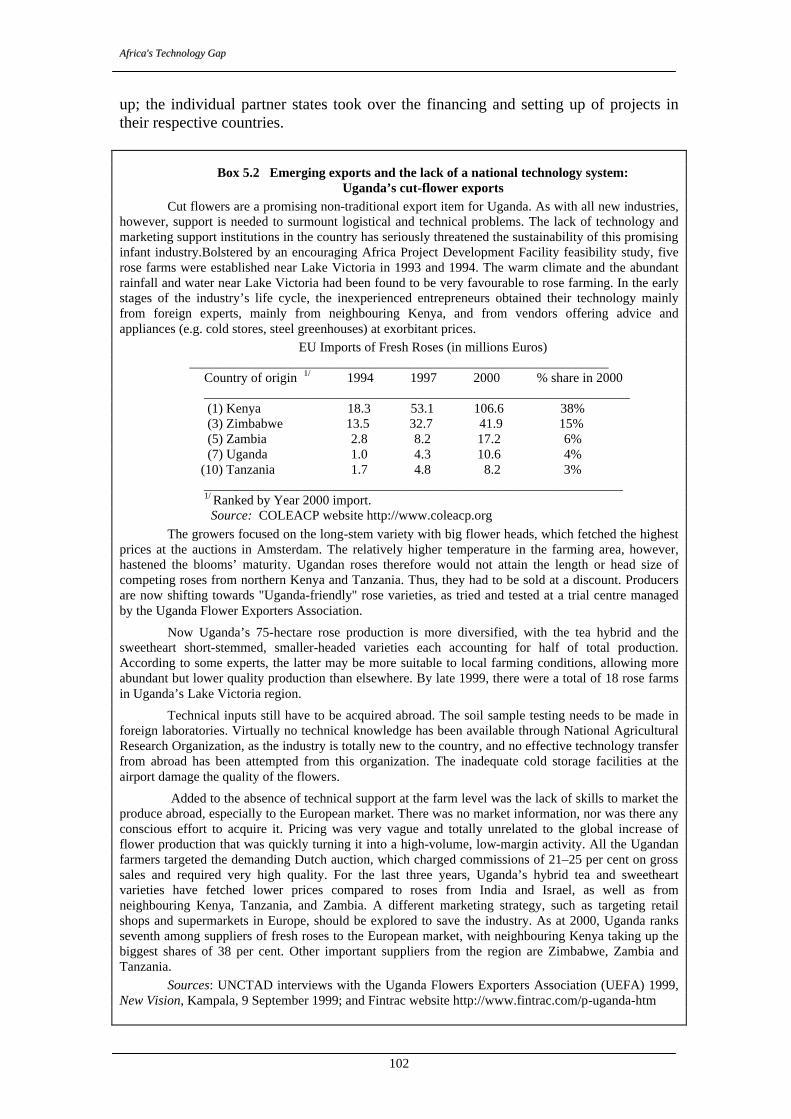
AAffrriiccaa''ss TTeecchhnnoollooggyy GGaapp
102
up; the individual partner states took over the financing and setting up of projects in their respective countries.
Box 5.2 Emerging exports and the lack of a national technology system: Uganda’s cut-flower exports
Cut flowers are a promising non-traditional export item for Uganda. As with all new industries, however, support is needed to surmount logistical and technical problems. The lack of technology and marketing support institutions in the country has seriously threatened the sustainability of this promising infant industry.Bolstered by an encouraging Africa Project Development Facility feasibility study, five rose farms were established near Lake Victoria in 1993 and 1994. The warm climate and the abundant rainfall and water near Lake Victoria had been found to be very favourable to rose farming. In the early stages of the industry’s life cycle, the inexperienced entrepreneurs obtained their technology mainly from foreign experts, mainly from neighbouring Kenya, and from vendors offering advice and appliances (e.g. cold stores, steel greenhouses) at exorbitant prices.
EU Imports of Fresh Roses (in millions Euros) _______________________________________________________________
Country of origin 1/ 1994 1997 2000 % share in 2000 ________________________________________________________________ (1) Kenya 18.3 53.1 106.6 38% (3) Zimbabwe 13.5 32.7 41.9 15% (5) Zambia 2.8 8.2 17.2 6% (7) Uganda 1.0 4.3 10.6 4% (10) Tanzania 1.7 4.8 8.2 3% _______________________________________________________________ 1/ Ranked by Year 2000 import. Source: COLEACP website http://www.coleacp.org The growers focused on the long-stem variety with big flower heads, which fetched the highest
prices at the auctions in Amsterdam. The relatively higher temperature in the farming area, however, hastened the blooms’ maturity. Ugandan roses therefore would not attain the length or head size of competing roses from northern Kenya and Tanzania. Thus, they had to be sold at a discount. Producers are now shifting towards "Uganda-friendly" rose varieties, as tried and tested at a trial centre managed by the Uganda Flower Exporters Association.
Now Uganda’s 75-hectare rose production is more diversified, with the tea hybrid and the sweetheart short-stemmed, smaller-headed varieties each accounting for half of total production. According to some experts, the latter may be more suitable to local farming conditions, allowing more abundant but lower quality production than elsewhere. By late 1999, there were a total of 18 rose farms in Uganda’s Lake Victoria region.
Technical inputs still have to be acquired abroad. The soil sample testing needs to be made in foreign laboratories. Virtually no technical knowledge has been available through National Agricultural Research Organization, as the industry is totally new to the country, and no effective technology transfer from abroad has been attempted from this organization. The inadequate cold storage facilities at the airport damage the quality of the flowers.
Added to the absence of technical support at the farm level was the lack of skills to market the produce abroad, especially to the European market. There was no market information, nor was there any conscious effort to acquire it. Pricing was very vague and totally unrelated to the global increase of flower production that was quickly turning it into a high-volume, low-margin activity. All the Ugandan farmers targeted the demanding Dutch auction, which charged commissions of 21–25 per cent on gross sales and required very high quality. For the last three years, Uganda’s hybrid tea and sweetheart varieties have fetched lower prices compared to roses from India and Israel, as well as from neighbouring Kenya, Tanzania, and Zambia. A different marketing strategy, such as targeting retail shops and supermarkets in Europe, should be explored to save the industry. As at 2000, Uganda ranks seventh among suppliers of fresh roses to the European market, with neighbouring Kenya taking up the biggest shares of 38 per cent. Other important suppliers from the region are Zimbabwe, Zambia and Tanzania.
Sources: UNCTAD interviews with the Uganda Flowers Exporters Association (UEFA) 1999, New Vision, Kampala, 9 September 1999; and Fintrac website http://www.fintrac.com/p-uganda-htm
TThhee CCaassee ooff UUggaannddaa
103
Owing to the difficult political and economic conditions that prevailed in Uganda for many years, the establishment of such an institute in Uganda was not until 1994. The Government then obtained an interest-free loan of $6 million from China, which also granted an additional $3.6 million for laboratory and office equipment, workshops, generators, and technical assistance. This allowed for facilities to be built at the Nakawa industrial area, where the Uganda Industrial Research Institute is presently located. In 1999 the Institute was later turned into an autonomous body under the Uganda National Council for Science and Technology umbrella. The Government of Uganda funds recurrent activities, which amounted to $250,000 in 1998–99.
Until recently the Uganda Industrial Research Institute mainly provided training and product development services in the food and ceramics sectors, in conformity with its original mandate. Its focus has now turned towards the repair and maintenance of equipment for other industries and in the provision of training and business services. The main operational projects include: FAO-GTZ, the Value Added Meat Products to improve the meat-processing capabilities of Ugandan firms, and the DANIDA-World Association of Industrial and Technological Research Organisations training project on Fermented African Dairy Products. The Institute currently employs 35 people, with two holding master’s degrees and 16 undergraduate degrees. The institution has trouble recruiting good scientists at the low salaries offered. 35 per cent of the Institute’s budget is used to pay salaries, while over half is used for materials, utilities, buildings and equipment.
Only 10 per cent of the Institute’s resources have been devoted to R&D. The number of SME clients is small but has doubled in 1999 from 50 the year before. Much of the services provided by the Institute constitute relatively simple testing and trouble-shooting rather than R&D work. The Institute’s activities appear totally supply-driven, and their output does not exactly match the needs of the industrial sector. Since virtually no original research is carried out, any capability to market research results is also absent. A marked inability to identify the problems of clients, especially the smaller ones, representing the absolute majority, was acknowledged by the staff itself. Nor does the Institute provide assistance to enterprises in identifying and importing foreign technologies.
The Institute is still a largely dormant institution. It has not overcome its heritage as a food and ceramics support institution, and its activities have spread to other sectors and firms only to a very limited extent. Ugandan industry does not perceive the disadvantages caused by the absence of a dynamic and efficient industrial research institution, as it has never had one. The poor capital base of Ugandan industry and its deficient technological capabilities compound the difficulties. Currently no institution in Uganda supplies the public goods that an infant industry needs to operate efficiently in a market economy.
While perhaps not as resource-constrained as its Tanzanian counterpart, the Ugandan R&D institution is apparently no more effective in terms of stimulating local technological effort. Again, this is not surprising in view of the low technological level and lack of dynamism of local industry.
F. Conclusions
In spite of its relatively recent entry into manufacturing, Uganda’s industrial sector has been growing well since 1986, largely because of rehabilitation and use of existing capacity. However, it is unlikely that these growth rates can be sustained
AAffrriiccaa''ss TTeecchhnnoollooggyy GGaapp
104
without more investment and technical change. A challenge for future growth is to stimulate technological upgrading and dynamism. A major constraint is Uganda’s relatively poor endowment of human capital. Moreover, imports of foreign technology into the country are low. Capital goods imports have been minimal for some time; they fluctuated widely during the 1990s, and their share in total imports declined. The introduction of tax deductibility for plant and machinery investments in 1997 did not reverse this trend, possibly because of poor and costly communication and transport. Local firms pay virtually no royalties or technical fees abroad. FDI has recently increased to a level above the average for sub-Saharan Africa; however, much of it is accounted for privatization of state-owned enterprises and by the return of investors expelled in the 1970s and 1980s. While a sign of confidence in the new business environment, these inflows go largely into services rather than industry. Prospects for increasing manufacturing FDI, particularly in export activities, do not appear very promising.
Technological efforts to adopt, improve and adapt foreign technology are very limited at the firm level. Awareness of the need for technological upgrading is lacking. Skills development still occurs in the form of on-the-job training, with the notable exceptions of some transnational corporations that invest in formal skill upgrading for employees. A culture of quality and efficiency in manufacturing is beginning to emerge, but it is still confined to a few enterprises. Policies and institutions do not help in this regard.
The overall macroeconomic framework is now favourable to business. Trade has been liberalized and many state-owned enterprises privatized. However, the science and technology system is weak. Institutions are under-funded, without a clear idea of their mandate, and they have insufficient links with each other and, more importantly, the business sector. The Government of Uganda needs a strategy for technology development and a coherent set of policies to remedy market failures and encourage the business sector to take the necessary initiatives.
The policy recommendations in this report can be divided into long-term strategic measures and short-term actions. The dividing line cannot always be clear; some proposals clearly overlap and, most importantly, the two sets of policies must be consistent to ensure a smooth transition from the short to the longer run. 1. Long-term strategic policies
§ The Government of Uganda needs to review and improve its technology strategy, and develop a mechanism for monitoring technology needs. At present, many institutions in the country deal with science, technology, education, technical and management training, curriculum design and assessment, intellectual property protection, and standards design and implementation, but little coordination exists among them. Their mandates are not specific, often overlap and remain on paper. Moreover, linkages with the private business sector are too occasional and not the result of comprehensive and cooperative interaction. The ability to mount a coordinated strategic effort, often with inputs from the private sector and in some cases transnational investors, is the basis of success in all emerging countries. At present, Uganda lacks a Government body with the mandate, the competence, and the political strength to perform this role. This should be remedied in the context of a comprehensive restructuring of the science and technology system.
§ Like most countries in Africa and in the developing world, Uganda lacks a culture of technology and innovation. There is little understanding and appreciation of
TThhee CCaassee ooff UUggaannddaa
105
why innovation is important for industry. Reversing these entrenched attitudes is a time-taking enterprise that will involve a gradual but continuous shift in primary and secondary education focus and priorities, national campaigns and promotion.
§ The human capital and skills need to be improved. A major weakness of Uganda’s business system is the insufficient availability of skilled labour, technical personnel, and qualified managers. This requires a long-term commitment to basic and advanced technical education and the Government has rightly prioritized primary education. It is also vital to provide support to training institutions and activities that can promote skill formation at the firm level.
§ Regarding the protection of intellectual property, weaknesses in the institutional intellectual property rights system are not a priority at this time. However, the Uganda Registration Services Bureau must be strengthened, both to provide a suitable environment for technology transfer and to encourage incipient local innovation. At present, it may suffice to have a system protecting foreign firms on the local market and relying on regional institutions, such as ARIPO, for the more complex and technical cases. 2. Short-term actions
§ The macroeconomic framework for business activities has improved, but certain issues still need to be addressed. The Uganda Investment Authority has substantially gained in efficiency, but it is not empowered to grant all licences needed for operation. Its role should be re-analysed within the framework of a renewed set-up to improve the Government’s strategy-making capability. A true “one-stop shop” for foreign investors to promote and facilitate FDI could be considered.
§ The National Council for Science and Technology has a mandate to “integrate science and technology into socio-economic development, manage science and technology policies, advise the government on science and technology policy, coordinate science and technology development efforts and provide science and technology leadership and guidance”. The Council should be provided with adequate funding and its mandate coordinated with those of other institutions. It could be more demand-driven, with closer linkages to industry.
§ Both public and private R&D could be encouraged more actively. Only donors finance R&D in the university setting and often also in other public bodies. Tax deductibility of R&D and training expenditures has been introduced, but such incentives are inadequate for stimulating a technology culture in a simple, inward-oriented and low-skills industrial environment.
§ Industry-university linkages could be strengthened, especially in industrial R&D. The universities should be helped by the Government and by donors in carrying out basic research activities, but, most importantly, they should focus on technology work for and in collaboration with the productive sector.
§ Management training should be substantially increased and improved. The Management Training and Advisory Centre should have strong linkages with all the other research, technology and training institutions (e.g. the Uganda National Bureau of Standards, the Uganda Industrial Research Institute, and the Vocational Training Centres). The diffusion of a culture of quality and efficiency should be promoted by all possible means, including national campaigns, revision of training modules in all public training institutions, and subsidies for expenditures on management consulting.
AAffrriiccaa''ss TTeecchhnnoollooggyy GGaapp
106
§ The Uganda National Bureau of Standards should be strengthened to fulfil its role of, inter alia, promoting quality awareness among firms, especially SMEs. In the longer run, the Bureau’s role should be reassessed, especially its relations with the private sector and with the other institutions in the country’s science and technology system. Thus, in the future the Bureau could become a body in charge of certifying private laboratories, rather than carrying out all the testing in-house. Moreover, it should be part of a comprehensive and consistent strategy to improve Uganda’s competitiveness, involving the private sector in its design and implementation on a interactive basis; and
§ The Uganda Industrial Research Institute’s role in national technology development should be redefined and a clear-cut strategy formulated. The Institute should be more demand driven, even as a concerted effort to raise demand within the private sector should be launched. Its research capability could be strengthened, and ways to cooperate with the private sector on a continuous basis should be envisaged, but preliminary strengthening of its technical staff and equipment is essential.
References Albaladejo, M. (2002) “Enhancing Innovation Capabilities in SME Clusters: Evidence
from a Service Centre in Spain,” in Innovation and Small Enterprises in the Third World, van Dick, M. P., and H. Sandee (edits), Edward Elgar, Cheltenham, UK, pp. 209-222 (2002).
Biggs, T., and Ratauri, M. (1997). Productivity and Competitiveness in African Manufacturing, RPED Discussion Paper no. 80. World Bank, Washington, DC.
Biggs, T., Shah, M. and Srivastava, P. (1995) Technological Capabilities and Learning in African Enterprises, World Bank Technical Paper No. 288, Africa Technical Department Series. World Bank, Washington, DC.
Bigsten, A., et.al., (1999) “Investment in Africa’s Manufacturing Sector: A Four-Country Panel Data Analysis” in Oxford Bulletin of Economics and Statistics. Oxford.
Bigsten, A, et al (1998) “Rates of return on physical and human capital in Africa’s manufacturing sector,” prepared for the Centre for the Study of African Economies, WPS/98/12. University of Oxford.
Bongenaar, B. and Szirmai, A. (1999) ‘The role of a research and development institute in the development and diffusion of technology’, Eindhoven Centre for Innovation Studies (The Netherlands), Working Paper 99.9. Forthcoming as “Development and diffusion of technology, the case of TIRDO” in Szirmai and Lapperre (eds.) 2000.
Bresnahan, T. F., Brynjolfsson, E. and Hitt, L. M. (1999) ‘Information technology, workplace organisation and the demand for skilled labour: firm-level evidence’, New York: National Bureau of Economic Research, NBER Working Paper No. W7136.
Bwisa, H. M. and Gacuhi, A. R. (1997) ‘Diffusion and adaptation of technology from research institutes and universities in Kenya: an empirical investigation’, Nairobi: African Technology Policy Studies, Kenya Chapter, ATPS Policy Brief, July.
Central Bureau of Statistics (1999) Economic Survey 1999, Nairobi: Central Bureau of Statistics, Government of Kenya.
Collier, P. and J.W. Gunning. (1999) “Explaining African Economic Performance,” in Journal of Economic Literature XXXVII, 64-111.
COSTECH (1998) Priority Areas of Research and Development in Tanzania, Dar-es-Salaam: Tanzania Commission for Science and Technology.
Deraniyagala, S. and Semboja, H. H. H. (1999) ‘Trade liberalization, firm performance and technology upgrading in Tanzania’, in Lall (ed.), pp. 112-147.
Harbison, F. H. and Myers, C. S. (1964) Education, Manpower and Economic Growth, New York: McGraw-Hill.
Helleiner, G. K. (ed.)(1999) Non-Traditional Exports and Development in Sub-Saharan Africa: Issues and Experience, Study for UN University World Institute for Development Economics Research (WIDER), in press. Chapter 1.
Kenya Gazette Supplement No. 33: Bills, 1999. Nairobi, Government Printer, 1999. Kenya Industrial Research and Development Institute (1999) ‘National industrial
research programmes’ Nairobi: KIRDI. Lall, S. (1996) Learning from the Asian Tigers, London: Macmillan. Lall, S. (1999.b) Competing with Labour: Skills and Competitiveness in Developing
Countries, Geneva: International Labour Office, Discussion Paper 31. Lall, S. (ed.)(1999.c) The Technological Response to Import Liberalization in Sub-
Saharan Africa, London: Macmillan.
108
Mlawa, H.M. (1999) Technology Policies for Sustainable Development in Eastern Africa: Kenya, Tanzania, Zambia and Zimbabwe, Dar-es-Salaarm. DUP Press.
Pack H. and Paxson, C. (2000) Is African manufacturing skill constrained? In A. Szirmai and P.Lapperre (eds.), The Industrial Experience of Tanzania, London, Macmillan, (in press).
Pietrobelli, C. (1994) ‘Ghana: Private sector development and employment generation under the Structural Adjustment Program,” a report prepared for the Development Researchers Network and the European Union, July 1994.
Pigato, M. (1999) ‘Foreign direct investment in Africa: old tales and new evidence’, World Bank, Africa Region, draft.
Reinikka, R. and J. Svensson. (1999.a) “Confronting Competition: Investment Response and Constraints in Uganda,” Policy Research Working Paper No. 2245. Washington, DC: The World Bank.
Reinikka, R. and J. Svensson. (1999.b) “How Inadequate Provision of Public Infrastructure and Services Affects Private Investment,” Policy Research Working Paper No. 2262, Washington DC: The World Bank.
Republic of Kenya (1996) Industrial Transformation to the Year 2020, Nairobi: Government Printer, Sessional Paper No. 2 of 1996.
Republic of Kenya (1997) National Development Plan 1997-2001, Nairobi: Government Printer.
Rush, H. et al. Technology Institutes: Strategies for best practice. London: International Thomson Business Press, 1996.
Sachs, J. (1998) ‘Foreign direct investment in Africa’, in The Africa Competitiveness Report, Geneva: World Economic Forum.
Semboja, H.H. and Kweka, J.P., “The Form and Role of Innovativeness in Enhancing Firms’ Productivity: The case of selected manufacturing firms in Tanzania” in Szirmai and Lapperre (eds), in press. 2000
Soludo, C. (1998) ‘Trade policy reforms and supply responses in Africa,’ Geneva: UNCTAD, African Development in a Comparative Perspective, Study number 6.
Szirmai A., Prins, M. and Schulte, W. (2000) “Measuring manufacturing performance in Tanzania,” in Szirmai, A. and Lapperre P. (eds.) The Industrial Experience of Tanzania: a case study of industrialization in Sub-Saharan Africa. London: Macmillan.
Teal, F (1999) “The Ghanian Manufacturing Sector 1991-1995: Firm Growth, Productivity and Convergence,” in Journal of Development Studies 36(1), October 1999, pp. 109-127.
Teal, F. (1999.b) “Why can Mauritius export manufactures and Ghana not?” in The World Economy 22 (7), September 1999, pp. 981-993.
UNCTAD (1998) World Investment Report: Trends and Determinants, Geneva: United Nations.
UNCTAD (1999.a) World Investment Report: Foreign Direct Investment and Development, Geneva: United Nations.
UNCTAD (1999.b) Foreign Direct Investment in Africa: Performance and Potential, Geneva: United Nations.
UNCTAD (2000) World Investment Report: Cross-border Mergers and Acquisitions and Development, United Nations: New York and Geneva.
UNCTAD (2000.b), Investment Policy Review of Uganda, Geneva: United Nations. UNESCO (various) Statistical Yearbook, Paris: United Nations Education, Social and
Cultural Organisation. UNIDO (1999) African Industry 2000: The Challenge of Going Global, Vienna,
UNIDO.
109
Wangwe, S. (1995) Exporting Africa: Technology, Trade and Industrialisation in Sub-Saharan Africa, London: Routledge.
Wangwe, S.M., Musonda, F.M. and Kweka, J.P. (1997) Policies for manufacturing competitiveness: the case of Tanzania, Dar es Salaam: Economic and Social Research Foundation, 1997.
Wangwe, S.M. and Diyamett, B. (1998) “Cooperation between R&D institutions and enterprises: the case of the United Republic of Tanzania,” in UNCTAD New Approaches to Science and Technology Cooperation and Capacity-Building, Geneva 1998, pp. 193-210.
Wangwe, S. (2000) “Economic reforms, industrialisation and technological capabilities in Tanzanian industry” in Szirmai and Lappere (eds). In press, 2000.
Wignaraja, G. and Ikiara, G. (1999) ‘Adjustment, technological capabilities and enterprise dynamics in Kenya’, in Lall (ed.), pp. 79, 92, 57-111.
World Bank (2000) Ghana 2000 and Beyond: Setting the stage for accelerated growth and poverty reduction. Western Africa Department. Washington, DC.
World Bank (1988) Education in Sub-Saharan Africa: Policies for Adjustment, Revitalisation, and Expansion, Washington DC: World Bank.
World Bank (1994) Adjustment in Africa: Reforms, results and the road ahead,” Oxford: Oxford University Press, 1994.

110
111
SELECTED UNCTAD PUBLICATIONS ON SCIENCE AND TECHNOLOGY
(For more information, please visit www.unctad.org/stdev on the web)
A. Individual Studies Information and Communication Technology Development Indices. 96 p. Sales No. E.03.II.D.14 Science and Technology Diplomacy: Concepts and Elements of a Work Programme. 33 p. UNCTAD/ITE/TEB/Misc.5. Free-of-charge. Transfer of Technology for Successful Integration into the Global Economy: A case Study of Embraer in Brazil. 61 p. UNCTAD/ITE/IPC/Misc.20. Free-of-charge. Transfer of Technology for Successful Integration into the Global Economy: A Case Study of the South African Automotive Industry. 34 p. UNCTAD/ITE/IPC/Misc.21. Free-of-charge. Transfer of Technology for the Successful Integration into the Global Economy: A Case Study of the Pharmaceutical Industry in India. 52 p. UNCTAD/ITE/IPC/Misc.22. Free-of-charge. Coalition of Resources for Information and Communication Technologies. 92 p. UNCTAD/ITE/TEB/13. Free-of-charge.
Key Issues in Biotechnology. 20 p. UNCTAD/ITE/TEB/10. Free-of-charge. An Assault on Poverty: Basic Human Needs, Science and Technology. 327 p. ISBN 0-88936-800-7. (Joint publication with IDRC). Compendium of International Arrangements on Transfer of Technology: Selected Instruments. Sales No. E.01.II.D.28. $45. Foreign Direct Investment and Transfer of Technology in India. 150 p. Sales No. E.92.II.A.3. $20. Information Technology and International Competitiveness: The Case of the Construction Services Industry. Sales No. E.93.II.D.6. $25. Investment and Innovation Policy Review of Ethiopia. 115 p. Sales No. E.01.II.D.35. $25. Knowledge Societies: Information Technology for Sustainable Development. 323 p. Sales No. GV.E.98.0.11. $19. Making North-South Research Networks Work. 48 p. UNCTAD/ITE/EDS/7.
112
Missing Links: Gender Equity in Science and Technology for Development. 371 p. ISBN 0-88936-765-5. (Joint publication with IDRC). On Solid Ground: Science, Technology and Integrated Land Management. 66 p. ISBN 0-88936-820-1. (Joint publication with IDRC). Technological Capacity-Building and Technology Partnership: Field Findings, Country Experiences and Programmes. Sales No. 95.II.D.6. $22. The Science, Technology and Innovation Policy Review: Colombia. 161 p. Sales No. E.99.II.D.13. $42. The Science, Technology and Innovation Policy Review: Jamaica. 156 p. Sales No. E.98.II.D.7. $23. Transfer and Development of Technology in Developing Countries: A Compendium of Policy Issues. Sales No. E.89.1l.D.17. $19.
Report of the Workshop on the Transfer and Development of Environmentally Sound Technologies (ESTs). Sales No. E.94.1l.D. 1. $10. (Joint publication with the Government of Norway. Oslo, Norway.)
B. ATAS Issue Paper Series
ATAS Issue 12: The Role of Publicly Funded Research and Publicly Owned Technologies in the Transfer and Diffusion of Environmentally Sound Technologies. 405 p. Sales No. E.00.II.D.37. $45. ATAS Issue 11: New Approaches to Science and Technology Cooperation and Capacity Building. 417 p. Sales No. E.99.II.D.4. $40. ATAS Issue 10: Information Technology for Development. 558 p. Sales No. E.95.1l.D.20. $75.
C. Technology for Development Series
Electronic Commerce and Music Business Development in Jamaica: A Portal to the New Economy? 45p. Sales No. E.02.II.D.17. Changing Dynamics of Global Computer Software and Services Industry: Implications for Developing Countries. 51 p. Sales No. E.02.II.D.3. $15. Partnerships and Networking in Science and Technology for Development. 46 p. Sales No. E.02.II.D.5. $15. Do Environmental Imperatives Present Novel Problems and Opportunities for the International Transfer of Technology? 21 p. Sales No. E.95.II.D.11. $10.
113
Emerging Forms of Technological Cooperation: The Case for Technology Partnership. Sales No. E.96.II.D.1. $19. New Technologies and Technological Capability-Building at the Enterprise Level: Some Policy Implications. 39 p. Sales No.E.95.II.D.24. $10. Promoting the Transfer and Use of Environmentally Sound Technology: A review of Policies. 53 p. UNCTAD/DST/12. $19. Science and Technology in the New Global Environment: Implications for Developing Countries. 56 p. Sales No. E. 95.II.D.14. $19. Investment and Technology Policies for Competitiveness: Review of successful country experiences. 81p. UNCTAD/ITE/IPC/2003/2
114
United Nations publications may be obtained from bookstores and distributors throughout the world. Please consult your bookstore or write to:
United Nations Publications
Sales Section
United Nations Office at Geneva Palais des Nations
CH-1211 Geneva 10 Switzerland
Tel: (41-22) 917-2614 Fax: (41-22) 917-0027
E-mail: [email protected]
OR
Sales Section Room DC2-0853
United Nations Secretariat New York, NY 10017
U.S.A. Tel: (1-212) 963-8302 or (800) 253-9646
Fax: (1-212) 963-3489 E-mail: [email protected]
All prices are quoted in United States dollars.
For further information on the work of the Division on Investment, Technology and Enterprise Development, UNCTAD, please address inquiries to:
United Nations Conference on Trade and Development
Division on Investment, Technology and Enterprise Development Palais des Nations, Room E-10054 CH-1211 Geneva 10, Switzerland
Telephone: (41-22) 907-5651 Telefax: (41-22) 907-0194
E-mail: [email protected]
QUESTIONNAIRE
Africa’s Technology Gap Case Studies on Kenya, Ghana, Uganda and Tanzania
In order to improve the quality and relevance of the work of the UNCTAD Division on Investment, Technology and Enterprise Development, it would be useful to receive the views of readers on this and similar publications. It would therefore be greatly appreciated if you could complete the following questionnaire and return it to:
Readership Survey UNCTAD Division on Investment, Technology and Enterprise Development
United Nations Office at Geneva Palais des Nations
Room E-10054 CH-1211, Geneva 10
Switzerland
1. Name and address of respondent (optional): _____________________________________________________________________________________________________________________________________________________________________________________________________________________________________________________________________________________________________________________________________
2. Which of the following best describes your area of work?
Government q Public enterprise q
Private enterprise institution q Academic or research q
International organization q Media q
Not-for-profit organization q Other (specify) ____________________ 3. In which country do you work? ________________________________________ 4. What is your assessment of the contents of this publication?
Excellent q Adequate q
Good q Poor q 5. How useful is this publication to your work?
Very useful q Of some use q Irrelevant q
6. Please indicate the three things you liked best about this publication: ____________________________________________________________________________________________________________________________________________________________________________________________________________________________________________________________________
7. Please indicate the three things you liked least about this publication:
____________________________________________________________________________________________________________________________________________________________________________________________________________________________________________________________________
8. If you have read more than the present publication of the UNCTAD Division on
Investment, Enterprise Development and Technology, what is your overall assessment of them?
Consistently good q Usually good, but with some exceptions q Generally mediocre q Poor q
9. On average, how useful are these publications to you in your work?
Very useful q Of some use q Irrelevant q