case study of a heavy snowstorm associated with an
TRANSCRIPT

atmosphere
Article
Case Study of a Heavy Snowstorm Associated withan Extratropical Cyclone Featuring a Back-Bent WarmFront Structure
Yu Zhao 1,2,3,*, Liang Fu 4, Cheng-Fang Yang 5 and Xiang-Fu Chen 1,2,3
1 Key Laboratory of Meteorological Disaster, Ministry of Education (KLME),Nanjing University of Information Science & Technology, Nanjing 210044, China;[email protected]
2 Joint International Research Laboratory of Climate and Environment Change (ILCEC),Nanjing University of Information Science & Technology, Nanjing 210044, China
3 Collaborative Innovation Center on Forecast and Evaluation of Meteorological Disasters (CIC-FEMD),Nanjing University of Information Science & Technology, Nanjing 210044, China
4 Weifang Meteorological Bureau, Weifang 261011, China; [email protected] Shandong Meteorological Observatory, Jinan 250031, China; [email protected]* Correspondence: [email protected]
Received: 29 October 2020; Accepted: 21 November 2020; Published: 25 November 2020 �����������������
Abstract: An extreme snowstorm event that occurred over Heilongjiang and Jilin Provinces on24–26 November 2013 was related to a cyclone characterized by a back-bent occluded front structure.This study investigates the structure of the back-bent occluded front and snowfall mechanism usingmultiple observations and NCEP/NCAR 1◦ × 1◦ reanalysis data in concert with the HYSPLIT model.The main results show that the extreme event was more synoptically governed by the outbreak of thepolar vortex and moisture anomaly of the East Sea. The cyclone occurred just ahead of the 500-hPamerged deep trough, and then developed under the effect of the positive vorticity advection aheadof the 500-hPa trough and intense divergence of the upper-level jet. The south-southwest windstrengthened obviously after the merger of the southern and northern branch troughs, which wasthe main reason behind the cyclone moving northward. The moisture mainly originated from theSea of Japan, insofar as that dry and cold air in the lower troposphere over the western mainlandmoistened obviously as it turned southward and passed over the Bohai Sea and the Sea of Japan,supplying abundant moisture for the snowstorm event. The intensity of moisture transport dependedon the location and intensity of the cyclone. When the cyclone developed, the dry air continuouslyintruded into the cyclone’s center, and made a conveyor belt of warm air wrap around it. The dry airgradually changed from descending to ascending motion as it moved ahead of the westerly trough,while the moist air in the northern part of the cyclone moved to the west and south and incorporatedinto the south of the cyclone center. Warm and moist air was lifted and arrived in the northwesternpart of the cyclone after the occluded front’s formation. Frontogenesis within the comma head wasenhanced evidently owing to the rotation and deformation. The convergence between the southeastand northeast winds resulted in intense frontogenesis, leading to the enhancement of the front-scaleascent. Strong ascent formed in the comma head of the cyclone, which resulted in intense snowfall.
Keywords: snowstorm; extratropical cyclone; back-bent warm front; occluded front; frontogenesis
1. Introduction
An occluded front is often formed during the development of a stronger cyclone. Operationalforecasts show that some extratropical cyclones producing snowstorms over northeastern China in
Atmosphere 2020, 11, 1272; doi:10.3390/atmos11121272 www.mdpi.com/journal/atmosphere
Atmosphere 2020, 11, 1272 2 of 21
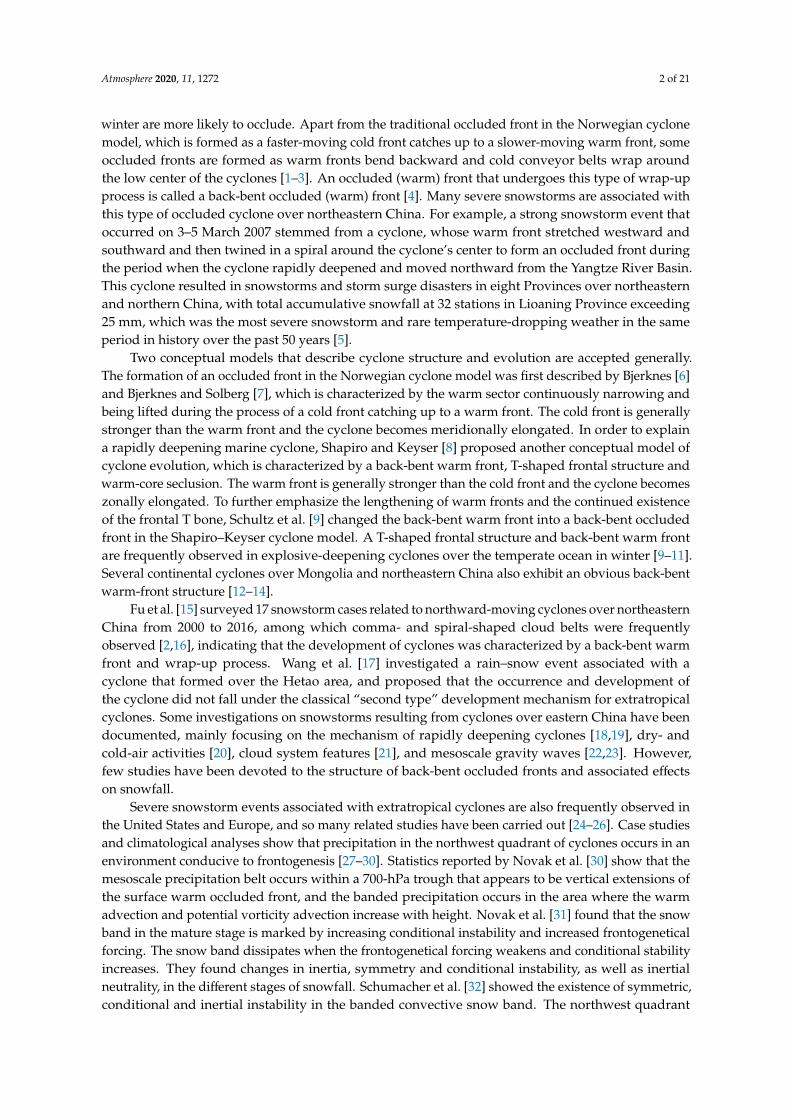
winter are more likely to occlude. Apart from the traditional occluded front in the Norwegian cyclonemodel, which is formed as a faster-moving cold front catches up to a slower-moving warm front, someoccluded fronts are formed as warm fronts bend backward and cold conveyor belts wrap aroundthe low center of the cyclones [1–3]. An occluded (warm) front that undergoes this type of wrap-upprocess is called a back-bent occluded (warm) front [4]. Many severe snowstorms are associated withthis type of occluded cyclone over northeastern China. For example, a strong snowstorm event thatoccurred on 3–5 March 2007 stemmed from a cyclone, whose warm front stretched westward andsouthward and then twined in a spiral around the cyclone’s center to form an occluded front duringthe period when the cyclone rapidly deepened and moved northward from the Yangtze River Basin.This cyclone resulted in snowstorms and storm surge disasters in eight Provinces over northeasternand northern China, with total accumulative snowfall at 32 stations in Lioaning Province exceeding25 mm, which was the most severe snowstorm and rare temperature-dropping weather in the sameperiod in history over the past 50 years [5].
Two conceptual models that describe cyclone structure and evolution are accepted generally.The formation of an occluded front in the Norwegian cyclone model was first described by Bjerknes [6]and Bjerknes and Solberg [7], which is characterized by the warm sector continuously narrowing andbeing lifted during the process of a cold front catching up to a warm front. The cold front is generallystronger than the warm front and the cyclone becomes meridionally elongated. In order to explaina rapidly deepening marine cyclone, Shapiro and Keyser [8] proposed another conceptual model ofcyclone evolution, which is characterized by a back-bent warm front, T-shaped frontal structure andwarm-core seclusion. The warm front is generally stronger than the cold front and the cyclone becomeszonally elongated. To further emphasize the lengthening of warm fronts and the continued existenceof the frontal T bone, Schultz et al. [9] changed the back-bent warm front into a back-bent occludedfront in the Shapiro–Keyser cyclone model. A T-shaped frontal structure and back-bent warm frontare frequently observed in explosive-deepening cyclones over the temperate ocean in winter [9–11].Several continental cyclones over Mongolia and northeastern China also exhibit an obvious back-bentwarm-front structure [12–14].
Fu et al. [15] surveyed 17 snowstorm cases related to northward-moving cyclones over northeasternChina from 2000 to 2016, among which comma- and spiral-shaped cloud belts were frequentlyobserved [2,16], indicating that the development of cyclones was characterized by a back-bent warmfront and wrap-up process. Wang et al. [17] investigated a rain–snow event associated with acyclone that formed over the Hetao area, and proposed that the occurrence and development ofthe cyclone did not fall under the classical “second type” development mechanism for extratropicalcyclones. Some investigations on snowstorms resulting from cyclones over eastern China have beendocumented, mainly focusing on the mechanism of rapidly deepening cyclones [18,19], dry- andcold-air activities [20], cloud system features [21], and mesoscale gravity waves [22,23]. However,few studies have been devoted to the structure of back-bent occluded fronts and associated effectson snowfall.
Severe snowstorm events associated with extratropical cyclones are also frequently observed inthe United States and Europe, and so many related studies have been carried out [24–26]. Case studiesand climatological analyses show that precipitation in the northwest quadrant of cyclones occurs in anenvironment conducive to frontogenesis [27–30]. Statistics reported by Novak et al. [30] show that themesoscale precipitation belt occurs within a 700-hPa trough that appears to be vertical extensions ofthe surface warm occluded front, and the banded precipitation occurs in the area where the warmadvection and potential vorticity advection increase with height. Novak et al. [31] found that the snowband in the mature stage is marked by increasing conditional instability and increased frontogeneticalforcing. The snow band dissipates when the frontogenetical forcing weakens and conditional stabilityincreases. They found changes in inertia, symmetry and conditional instability, as well as inertialneutrality, in the different stages of snowfall. Schumacher et al. [32] showed the existence of symmetric,conditional and inertial instability in the banded convective snow band. The northwest quadrant

Atmosphere 2020, 11, 1272 3 of 21
of surface cyclones is a juxtaposition of frontogenesis and instability, where it is conducive to theoccurrence of intense snowfall [29].
However, understanding is limited with respect to the evolution, frontal structure and associatedsnowfall mechanism in a cyclone characterized by a back-bent warm front and wrap-up process, whichleads to inaccurate fine-scale forecasting of snow. In operational forecasts, the prediction of snowfallamount is often underestimated, and the locations of intense snowfall are inaccurate, especially inquantitative snow intensity with a big bias.
An intense snowstorm event hit Heilongjiang and Jilin Provinces on 24–26 November 2013,with accumulated snowfall exceeding 20 mm in the east of these provinces and a maximum snowfallof 60 mm in Shuangyashan. The daily snowfall in nine counties over Heilongjiang Province brokethe historic record for November since 1961. This extreme event, induced by a rapidly deepeningcyclone that formed in northern Jiangsu Province and moved northeastward, brought strong windsand low visibility and disrupted roads and air traffic, seriously affecting people’s lives [33,34]. Notably,the development of the cyclone featured a back-bent warm front and warm-core seclusion [2],thus raising the following questions: How did the fronts evolve? What was the structure of theback-bent occluded front? And what effect did it have on snowfall? This paper seeks to answer thesequestions and provide a reference for forecasting this type of snowstorm.
The rest of this paper is organized as follows: Section 2 describes the data and methods. An overviewof the cyclone, snowfall and cloud systems is provided in Section 3. The synoptic-scale background,front evolution and mesoscale characteristics of the event are presented in Section 4. Section 5 exploresthe snowfall mechanism. And finally, a summary and discussion are presented in Section 6.
2. Data and Methods
The data used in this paper include conventional surface, upper-air, Jiansanjiang Dopplerradar (indicated by the black open circle in Figure 1a), and FY-2E satellite observations; and theFinal Analysis (FNL) gridded data of the National Centers for Environmental Prediction (NCEP)with a 6 h interval and 1◦ × 1◦ horizontal resolution. The FNL data were obtained from the archive(https://rda.ucar.edu/datasets/ds083.2/). FY-2E is Chinese third operational geostationary meteorologicalsatellite, whose Stretched Visible and Infrared Spin Scan Radiometer (S-VISSR) include four Infraredchannels (IR1, IR2, IR3, and IR4) and one Visible channel, with a 5 km and 1.25 km resolution at nadir,respectively. The infrared brightness temperature in spectral range between 6.3 and 7.6 µm (IR3) witha 1 h interval was used in this study. The Jiansanjiang radar is a C-band radar, operating in volumecoverage pattern 21 (VCP21), scanning nine elevation angles of 0.5◦, 1.5◦, 2.4◦, 3.4◦, 4.3◦, 6.0◦, 9.9◦,14.6◦, and 19.5◦ with a volumetric update time of 6 min during this event. The elevation of the radarantenna is 165 m above mean sea level (MSL) and 90 m above ground level (AGL). The maximumunambiguous ranges for radar reflectivity and radar radial velocity are 300 and 150 km, respectively.The Nyquist velocities are from −24.86 to 24.86 m·s−1. The Jiansanjing radar’s observation time is from0100 UTC to 0700 UTC during this event.
We used the Air Resources Laboratory Hybrid Single-Particle Lagrangian Integrated Trajectory(HYSPLIT) model, version 4.9 [35,36], developed by the National Oceanic and AtmosphericAdministration, to track the moisture transport trajectory and moisture change of the snowstorm event.In this model, the Lagrangian method is applied to calculate the advection and diffusion, and it iscommonly used to track the trajectories of air particles, with good results having been achieved [37–40].Thus, the moisture transport features and relationship with the cyclone were examined using thismodel. The central snowfall area (46.5◦–47◦ N, 130◦–131.5◦ E, indicated by red rectangle in Figure 1a)was selected as the simulation area, and 500 m, 1500 m, and 3000 m were selected as the initial heightsin the vertical direction. There are 24 initial points in the simulated track, with 8 initial points at eachlevel. NCEP/GDAS (Global Data Assimilation System) data with a horizontal resolution of 0.5◦ × 0.5◦
and an interval of 6 h were used as the initial fields and 60 h air parcel back trajectories were calculated

Atmosphere 2020, 11, 1272 4 of 21
at the time of initial snowfall (0000 UTC 25 November) and intense snowfall (0600 UTC 25 November),respectively. All air parcel trajectories were recorded every 6 h from the model forecast.
Atmosphere 2020, 11, x FOR PEER REVIEW 4 of 21
Figure 1. (a) The central sea level pressure of the cyclone with positions plotted every 6 h. Also plotted are the names of related provinces, the city of Shuangyashan, and the location of Jiansanjiang radar (open circles, labeled as letters “S” and “J”, respectively). The red rectangle area denotes the simulated region of the HYSPLIT model. (b) Intensity evolution of the minimum central sea level pressure of the cyclone (unit: hPa).
3. Overview of the Cyclone, Cloud Systems and Snowfall
3.1. Overview of the Cyclone
The cyclone initially formed over northern Jiangsu Province at 0000 UTC 24 November, with a central pressure of 1012 hPa (Figure 1a). After that, the cyclone moved northeastward and developed intensively, passed over the Yellow Sea and northern Korean Peninsula, moved on over the Sea of Japan and Stanovoy Range, and entered the Sea of Okhotsk by 0000 UTC 27 November. The cyclone developed at a linear deepening rate in the initial 30 h after formation (Figure 1b). Its central pressure was 986 hPa by 0000 UTC 25 November, and it reached its minimum central pressure of 981 hPa at 0600 UTC 25 November. During the subsequent 36 h, the central pressure rose slightly and maintained at lower values. The central pressure of the cyclone decreased by 26 hPa from 0000 UTC 24 to 0000 UTC 25 November at a cyclone-deepening rate of 1.08 Bergeron, meeting the criteria of an explosive cyclone.
3.2. Cloud Systems of the Cyclone
The water vapor cloud images (Figure 2) show the evolution of the cyclone’s cloud systems in its development process. At 0600 UTC 24 November, cloud systems had been transformed into comma cloud from the baroclinic leaf as the cyclone initially formed (not shown), and the core of the cyclone was in the area of cold and moist air with cloud top temperatures <−52 °C and 500-hPa relative humidity >90% (Figure 2a). The dark area was located to the southwest of the cyclone, corresponding to the adiabatic descending dry and cold air with 500-hPa relative humidity <70% and cloud top temperatures >−22 °C. By 1800 UTC 24 November, the cyclone had deepened obviously, with more dry air intruding into the cyclone and the core of the cyclone being occupied by the dark area. Common cyclogenesis features were evident in the cloud patterns, including a comma head over Jilin and Heilongjiang Provinces and a dry slot near northern Korean Peninsula (Figure 2b). Compared with Figure 2a, the warm front cloud belts stretched westward and southward around the cyclone center, with the cold front cloud belts moving eastward. As a result, the northern portion of the cold front weakened and the cold and warm fronts in the center of the cyclone did not connect with each other, showing a frontal fracture. The coverage of cloud top temperatures <−52 °C and 500-hPa relative humidity >70% within the warm front cloud belts was expanded to the north and northeast, and the warm and moist air on the northwest side was wrapped around the cyclone center, showing that a back-bent occluded front was formed at this time (Figure 2b).
Figure 1. (a) The central sea level pressure of the cyclone with positions plotted every 6 h. Also plottedare the names of related provinces, the city of Shuangyashan and the location of Jiansanjiang radar(open circles, labeled as letters “S” and “J”, respectively). The red rectangle area denotes the simulatedregion of the HYSPLIT model. (b) Intensity evolution of the minimum central sea level pressure of thecyclone (unit: hPa).
3. Overview of the Cyclone, Cloud Systems and Snowfall
3.1. Overview of the Cyclone
The cyclone initially formed over northern Jiangsu Province at 0000 UTC 24 November, with acentral pressure of 1012 hPa (Figure 1a). After that, the cyclone moved northeastward and developedintensively, passed over the Yellow Sea and northern Korean Peninsula, moved on over the Sea ofJapan and Stanovoy Range, and entered the Sea of Okhotsk by 0000 UTC 27 November. The cyclonedeveloped at a linear deepening rate in the initial 30 h after formation (Figure 1b). Its central pressurewas 986 hPa by 0000 UTC 25 November, and it reached its minimum central pressure of 981 hPa at 0600UTC 25 November. During the subsequent 36 h, the central pressure rose slightly and maintained atlower values. The central pressure of the cyclone decreased by 26 hPa from 0000 UTC 24 to 0000 UTC25 November at a cyclone-deepening rate of 1.08 Bergeron, meeting the criteria of an explosive cyclone.
3.2. Cloud Systems of the Cyclone
The water vapor cloud images (Figure 2) show the evolution of the cyclone’s cloud systems in itsdevelopment process. At 0600 UTC 24 November, cloud systems had been transformed into commacloud from the baroclinic leaf as the cyclone initially formed (not shown), and the core of the cyclonewas in the area of cold and moist air with cloud top temperatures <−52 ◦C and 500-hPa relativehumidity >90% (Figure 2a). The dark area was located to the southwest of the cyclone, correspondingto the adiabatic descending dry and cold air with 500-hPa relative humidity <70% and cloud toptemperatures >−22 ◦C. By 1800 UTC 24 November, the cyclone had deepened obviously, with more dryair intruding into the cyclone and the core of the cyclone being occupied by the dark area. Commoncyclogenesis features were evident in the cloud patterns, including a comma head over Jilin andHeilongjiang Provinces and a dry slot near northern Korean Peninsula (Figure 2b). Compared withFigure 2a, the warm front cloud belts stretched westward and southward around the cyclone center,with the cold front cloud belts moving eastward. As a result, the northern portion of the cold frontweakened and the cold and warm fronts in the center of the cyclone did not connect with each other,showing a frontal fracture. The coverage of cloud top temperatures <−52 ◦C and 500-hPa relativehumidity >70% within the warm front cloud belts was expanded to the north and northeast, and the

Atmosphere 2020, 11, 1272 5 of 21
warm and moist air on the northwest side was wrapped around the cyclone center, showing that aback-bent occluded front was formed at this time (Figure 2b).
1
Figure 2. Water vapor satellite images from the cloud top temperature (unit: ◦C) of FY-2E at (a) 0600UTC 24 November, (b) 1800 UTC 24 November, (c) 0000 UTC 25 November, and (d) 0600 UTC 25November 2013. Overlaid on the images are the surface low pressure center (L) and the front, the sealevel pressure field (black lines; unit: hPa), and the 500-hPa 70% and 90% relative humidity (greenlines; unit: %), calculated from NCEP/NCAR reanalysis data with a resolution of 1◦ × 1◦. The letter“J” represents the radar station position at Jiansanjiang; the yellow lines AB and CD in (d) denote thelocation of the cross sections used in Figure 9.
By 0000 UTC 25 November, the dry air had intruded into the core and southwest quadrant ofthe cyclone, with the cyclone’s dry slot evident in coastal areas of eastern Jilin Province and the cloudsystems to the north of the occluded front starting to intensify (Figure 2c). The warm front cloudbelts stretched southwestward and southward evidently, and wrapped around the cyclone’s center(Figure 2c). At 0600 UTC 25 November, the cloud systems to the north of the back-bent occluded frontintensified significantly, and the comma head elongated with an east–west orientation and narrowedwith a more obvious warp-up feature (Figure 2d). Six hours later, with the movement of the cyclone,the intense cloud systems to the north of the occluded front moved into Russia (not shown), so thesnowfall over Heilongjiang Province weakened. In short, the cyclone development was characterizedby zonally elongated warm front cloud belts and underwent a wrapping-up process [4,8,9], whichis similar to the Shapiro–Keyser cyclone model. That is, the warm front stretched westward andsouthward as the cyclone developed, and then wrapped around the center of the cyclone.

Atmosphere 2020, 11, 1272 6 of 21
3.3. Overview of Snowfall
Affected by the cyclone, rain first emerged in Liaoning Province at around 0600 UTC 24 November(Figure 3), and snow fell in Heilongjiang, Jilin and northern Liaoning Provinces at 1200 UTC24 November, with the snowfall event persisting until 0000 UTC 26 November. The distribution of 24 hsnowfall shows that the snowstorm occurred mainly in eastern Jilin and southeastern HeilongjiangProvinces, with a maximum snowfall of 26 mm in Antu from 0000 UTC 24 to 0000 UTC 25 November(Figure 3a). The heavy snowfall moved to central and eastern Heilongjiang Province (maximumsnowfall amount reaching 57.4 mm in Shuangyashan) from 0000 UTC 25 to 0000 UTC 26 November(Figure 3b), with much of the snow occurring during the period 0000–1200 UTC 25 November and themaximum 6 h snowfall being larger than 20 mm (Figure 3e,f). The observed snowfall in Shuangyashanshows that the strongest snowfall occurred during 0600–0900 UTC 25 November, with a maximum 3 hsnowfall of 12.7 mm.
Atmosphere 2020, 11, x FOR PEER REVIEW 6 of 21
3.3. Overview of Snowfall
Affected by the cyclone, rain first emerged in Liaoning Province at around 0600 UTC 24 November (Figure 3), and snow fell in Heilongjiang, Jilin and northern Liaoning Provinces at 1200 UTC 24 November, with the snowfall event persisting until 0000 UTC 26 November. The distribution of 24 h snowfall shows that the snowstorm occurred mainly in eastern Jilin and southeastern Heilongjiang Provinces, with a maximum snowfall of 26 mm in Antu from 0000 UTC 24 to 0000 UTC 25 November (Figure 3a). The heavy snowfall moved to central and eastern Heilongjiang Province (maximum snowfall amount reaching 57.4 mm in Shuangyashan) from 0000 UTC 25 to 0000 UTC 26 November (Figure 3b), with much of the snow occurring during the period 0000–1200 UTC 25 November and the maximum 6 h snowfall being larger than 20 mm (Figure 3e–f). The observed snowfall in Shuangyashan shows that the strongest snowfall occurred during 0600–0900 UTC 25 November, with a maximum 3 h snowfall of 12.7 mm.
Figure 3. Rain gauge observed precipitation (a) from 0000 UTC 24 to 0000 UTC 25,(b) from 0000 UTC 25 to 0000 UTC 26 Nov 2013, (c) from 1200 UTC to 1800 UTC 24, (d) from 1800 UTC 24 to 0000 UTC 25, (e) from 0000 UTC to 0600 UTC 25, (f) from 0600 UTC to 1200 UTC 25 Nov 2013 and (g) snowfall (bars)
Figure 3. Rain gauge observed precipitation (a) from 0000 UTC 24 to 0000 UTC 25, (b) from 0000 UTC25 to 0000 UTC 26 November 2013, (c) from 1200 UTC to 1800 UTC 24, (d) from 1800 UTC 24 to 0000UTC 25, (e) from 0000 UTC to 0600 UTC 25, (f) from 0600 UTC to 1200 UTC 25 November 2013 and(g) snowfall (bars) evolution at Shuangyashan station from 1200 UTC 24 to 0300 UTC 26 November2013 (unit: mm; the interval is 3 h in the daytime and 10 h in the night (indicated by red stars abovethe bar). The letters “S”, “A” and “J’ denote the cities of Shuangyashan, Antu and the location ofJiansanjiang radar, respectively.
Atmosphere 2020, 11, 1272 7 of 21
4. Synoptic-Scale Background and Mesoscle Features
4.1. Atmospheric Circulation Patterns
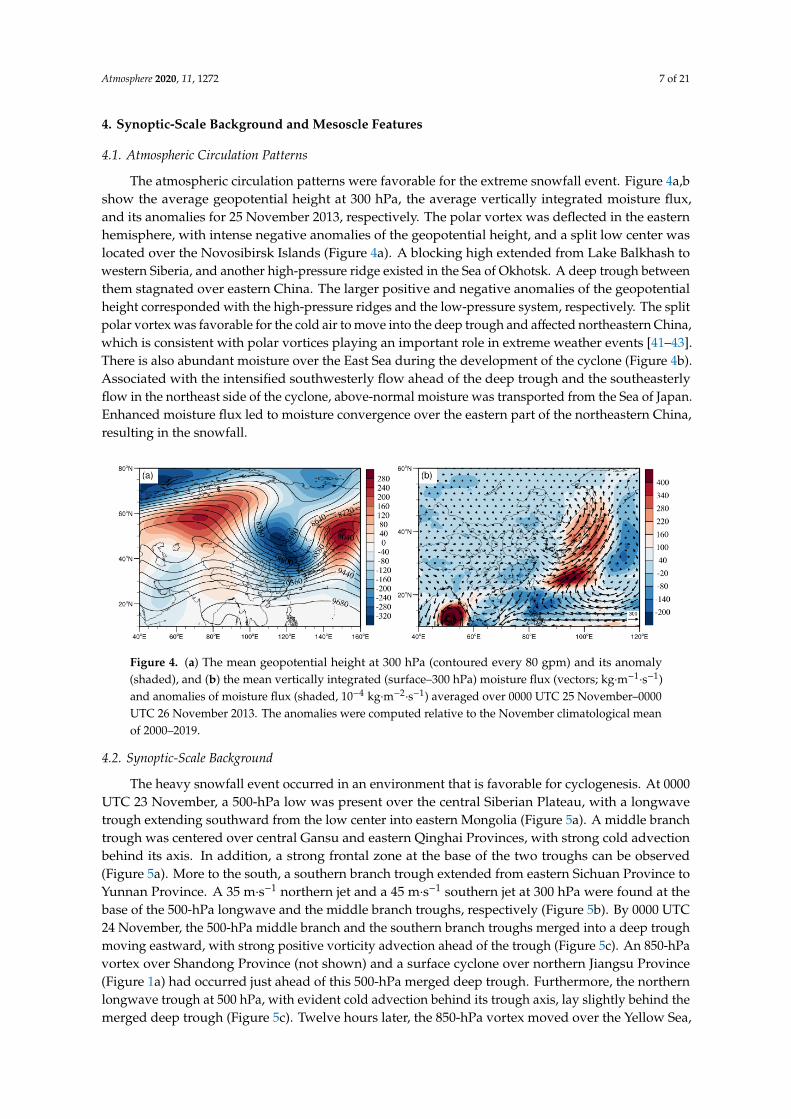
The atmospheric circulation patterns were favorable for the extreme snowfall event. Figure 4a,bshow the average geopotential height at 300 hPa, the average vertically integrated moisture flux,and its anomalies for 25 November 2013, respectively. The polar vortex was deflected in the easternhemisphere, with intense negative anomalies of the geopotential height, and a split low center waslocated over the Novosibirsk Islands (Figure 4a). A blocking high extended from Lake Balkhash towestern Siberia, and another high-pressure ridge existed in the Sea of Okhotsk. A deep trough betweenthem stagnated over eastern China. The larger positive and negative anomalies of the geopotentialheight corresponded with the high-pressure ridges and the low-pressure system, respectively. The splitpolar vortex was favorable for the cold air to move into the deep trough and affected northeastern China,which is consistent with polar vortices playing an important role in extreme weather events [41–43].There is also abundant moisture over the East Sea during the development of the cyclone (Figure 4b).Associated with the intensified southwesterly flow ahead of the deep trough and the southeasterlyflow in the northeast side of the cyclone, above-normal moisture was transported from the Sea of Japan.Enhanced moisture flux led to moisture convergence over the eastern part of the northeastern China,resulting in the snowfall.
Atmosphere 2020, 11, x FOR PEER REVIEW 7 of 21
evolution at Shuangyashan station from 1200 UTC 24 to 0300 UTC 26 Nov 2013 (unit: mm; the interval is 3 h in the daytime and 10 h in the night (indicated by red stars above the bar). The letters “S”, “A” and “J’ denote the cities of Shuangyashan, Antu and the location of Jiansanjiang radar, respectively.
4. Synoptic-Scale Background and Mesoscle Features
4.1. Atmospheric Circulation Patterns
The atmospheric circulation patterns were favorable for the extreme snowfall event. Figure 4a,b show the average geopotential height at 300 hPa, the average vertically integrated moisture flux, and its anomalies for 25 November 2013, respectively. The polar vortex was deflected in the eastern hemisphere, with intense negative anomalies of the geopotential height, and a split low center was located over the Novosibirsk Islands (Figure 4a). A blocking high extended from Lake Balkhash to western Siberia, and another high-pressure ridge existed in the Sea of Okhotsk. A deep trough between them stagnated over eastern China. The larger positive and negative anomalies of the geopotential height corresponded with the high-pressure ridges and the low-pressure system, respectively. The split polar vortex was favorable for the cold air to move into the deep trough and affected northeastern China, which is consistent with polar vortices playing an important role in extreme weather events [41–43]. There is also abundant moisture over the East Sea during the development of the cyclone (Figure 4b). Associated with the intensified southwesterly flow ahead of the deep trough and the southeasterly flow in the northeast side of the cyclone, above-normal moisture was transported from the Sea of Japan. Enhanced moisture flux led to moisture convergence over the eastern part of the northeastern China, resulting in the snowfall.
Figure 4. (a) The mean geopotential height at 300 hPa (contoured every 80 gpm) and its anomaly (shaded), and (b) the mean vertically integrated (surface–300 hPa) moisture flux (vectors; kgm−1 s−1) and anomalies of moisture flux (shaded, 10−4 kg m−2 s−1) averaged over 0000 UTC 25 Nov–0000 UTC 26 November 2013. The anomalies were computed relative to the November climatological mean of 2000–2019.
4.2. Synoptic-Scale Background
The heavy snowfall event occurred in an environment that is favorable for cyclogenesis. At 0000 UTC 23 November, a 500-hPa low was present over the central Siberian Plateau, with a longwave trough extending southward from the low center into eastern Mongolia (Figure 5a). A middle branch trough was centered over central Gansu and eastern Qinghai Provinces, with strong cold advection behind its axis. In addition, a strong frontal zone at the base of the two troughs can be observed (Figure 5a). More to the south, a southern branch trough extended from eastern Sichuan Province to Yunnan Province. A 35 m·s−1 northern jet and a 45 m·s−1 southern jet at 300 hPa were found at the base of the 500-hPa longwave and the middle branch troughs, respectively (Figure 5b). By 0000 UTC 24 November, the 500-hPa middle branch and the southern branch troughs merged into a deep trough moving eastward, with strong positive vorticity advection ahead of the trough (Figure 5c). An 850-hPa vortex over Shandong Province (not shown) and a surface cyclone over northern Jiangsu Province (Figure 1a) had occurred just ahead of this 500-hPa merged deep trough. Furthermore, the
Figure 4. (a) The mean geopotential height at 300 hPa (contoured every 80 gpm) and its anomaly(shaded), and (b) the mean vertically integrated (surface–300 hPa) moisture flux (vectors; kg·m−1
·s−1)and anomalies of moisture flux (shaded, 10−4 kg·m−2
·s−1) averaged over 0000 UTC 25 November–0000UTC 26 November 2013. The anomalies were computed relative to the November climatological meanof 2000–2019.
4.2. Synoptic-Scale Background
The heavy snowfall event occurred in an environment that is favorable for cyclogenesis. At 0000UTC 23 November, a 500-hPa low was present over the central Siberian Plateau, with a longwavetrough extending southward from the low center into eastern Mongolia (Figure 5a). A middle branchtrough was centered over central Gansu and eastern Qinghai Provinces, with strong cold advectionbehind its axis. In addition, a strong frontal zone at the base of the two troughs can be observed(Figure 5a). More to the south, a southern branch trough extended from eastern Sichuan Province toYunnan Province. A 35 m·s−1 northern jet and a 45 m·s−1 southern jet at 300 hPa were found at thebase of the 500-hPa longwave and the middle branch troughs, respectively (Figure 5b). By 0000 UTC24 November, the 500-hPa middle branch and the southern branch troughs merged into a deep troughmoving eastward, with strong positive vorticity advection ahead of the trough (Figure 5c). An 850-hPavortex over Shandong Province (not shown) and a surface cyclone over northern Jiangsu Province(Figure 1a) had occurred just ahead of this 500-hPa merged deep trough. Furthermore, the northernlongwave trough at 500 hPa, with evident cold advection behind its trough axis, lay slightly behind themerged deep trough (Figure 5c). Twelve hours later, the 850-hPa vortex moved over the Yellow Sea,

Atmosphere 2020, 11, 1272 8 of 21
with a west–east oriented shear line extending from the low center and strong southwesterly airflowreaching 33 m·s−1 on the south side of the shear line (Figure 6a), transporting moisture from the YellowSea to northeastern China. Accompanying the cold air sweeping to the south and the transport ofwarm and moist air, the baroclinicity of the atmosphere was intensified, leading to explosive deepeningof the surface cyclone (Figure 2).
Atmosphere 2020, 11, x FOR PEER REVIEW 8 of 21
northern longwave trough at 500 hPa, with evident cold advection behind its trough axis, lay slightly behind the merged deep trough (Figure 5c). Twelve hours later, the 850-hPa vortex moved over the Yellow Sea, with a west–east oriented shear line extending from the low center and strong southwesterly airflow reaching 33 m·s−1 on the south side of the shear line (Figure 6a), transporting moisture from the Yellow Sea to northeastern China. Accompanying the cold air sweeping to the south and the transport of warm and moist air, the baroclinicity of the atmosphere was intensified, leading to explosive deepening of the surface cyclone (Figure 2).
Figure 5. The geopotential height (black solid lines; 10 geopotential meters (unit: gpm), temperature (red dashed lines; unit: °C), wind (full barb = 4 m s−1, pennant = 20 m s−1) and positive vorticity advection (shaded; unit: 10−9 s−2 ) at 500 hPa, at (a) 1200 UTC 23 Nov, (c) 0000 UTC 24 Nov and (e) 0000 UTC 25 Nov 2013 (thick black solid line denotes the trough line). The 300-hPa wind speeds ≥ 30 ms−1 (black contours every 5 m s−1) and divergence >0 (shading; unit : 10−5 s−1) are plotted at (b) 1200 UTC 23 Nov, (d)1200 UTC 24 Nov and (f) 0600 UTC 25 Nov 2013. The red dashed lines with an arrow
Figure 5. The geopotential height (black solid lines; 10 geopotential meters (unit: gpm), temperature(red dashed lines; unit: ◦C), wind (full barb = 4 m·s−1, pennant = 20 m·s−1) and positive vorticityadvection (shaded; unit: 10−9 s−2 ) at 500 hPa, at (a) 1200 UTC 23 November, (c) 0000 UTC 24 Novemberand (e) 0000 UTC 25 November 2013 (thick black solid line denotes the trough line). The 300-hPawind speeds ≥ 30 m·s−1 (black contours every 5 m·s−1) and divergence >0 (shading; unit: 10−5 s−1) areplotted at (b) 1200 UTC 23 November, (d) 1200 UTC 24 November and (f) 0600 UTC 25 November 2013.The red dashed lines with an arrow denotes the upper-level jet axis. The locations of Qinghai (QH),Gansu (GS), Sicuan (SC), Yunnan (YN), Shandong (SD), Anhui (AH), Jiangsu (JS), Heilongjiang (HLJ),Jilin (JL), and Liaoning (LN) Provinces are labeled in Figure 5b.

Atmosphere 2020, 11, 1272 9 of 21
Atmosphere 2020, 11, x FOR PEER REVIEW 9 of 21
denotes the upper-level jet axis. The locations of Qinghai (QH), Gansu (GS), Sicuan (SC), Yunnan (YN), Shandong (SD), Anhui (AH), Jiangsu (JS), Heilongjiang (HLJ), Jilin (JL), and Liaoning (LN) Provinces are labeled in Figure 5b.
Figure 6. Geopotential height (black solid lines; unit: gpm), potential temperature (red dashed lines; unit: °K), and wind (units: m·s−1) at 850-hPa and the divergence of integrated moisture flux of 1000–300-hPa (color shaded; units: 10−4 kg·m−2 s−1) at (a) 1200 UTC 24 November, (b) 0000 UTC 25 November, (c) 0600 UTC 25 November, and (d) 1200 UTC 25 November 2013. Overlaid on the images are the low center (D) and warm core (W). Thick solid lines are the trough lines.
By 0000 UTC 25 November, the northern longwave trough at 500-hPa and the merged deep trough to the south had merged to form a deep trough with a span of more than 30° of latitude (Figure 5e), which enlarged the southerly component ahead of the trough and steered the cyclone to move northward. At 300-hPa, the northern and southern jets had merged to form a core over eastern Heilongjiang Province with a wind speed of 50 m·s−1, with Jilin and Heilongjiang Provinces on the right side of the entrance of the northern jet where strong divergence existed (not shown). The merger of the northern and southern jets occurred at 1200 UTC 24 November (Figure 5d), and the northern jet core intensified obviously after the merger, with eastern Liaoning Province being on the right side of the entrance of the northern upper-level jet. At 850-hPa, the vortex deepened obviously owing to the substantial intensification of the positive vorticity advection ahead of the 500-hPa trough and the enhancing warm advection (Figure 6b). The southeast winds to the north of the shear line increased evidently, with an enlarged strong-wind-speed region, transporting the moisture from the Sea of Japan to Heilongjiang Province (Figure 6b), which supplied abundant water vapor for the snowstorm. The merger of the upper-level jet streaks made the cyclone move northward obviously, which was similar to the approaching of two upper-level jet streaks in the snowstorm event examined by Tian et al. [43] and Gao et al. [18]. The cyclone deepened rapidly under the joint effect of the right
Figure 6. Geopotential height (black solid lines; unit: gpm), potential temperature (red dashed lines;unit: ◦K), and wind (units: m·s−1) at 850-hPa and the divergence of integrated moisture flux of1000–300-hPa (color shaded; units: 10−4 kg·m−2
·s−1) at (a) 1200 UTC 24 November, (b) 0000 UTC25 November, (c) 0600 UTC 25 November and (d) 1200 UTC 25 November 2013. Overlaid on the imagesare the low center (D) and warm core (W). Thick solid lines are the trough lines.
By 0000 UTC 25 November, the northern longwave trough at 500-hPa and the merged deeptrough to the south had merged to form a deep trough with a span of more than 30◦ of latitude(Figure 5e), which enlarged the southerly component ahead of the trough and steered the cycloneto move northward. At 300-hPa, the northern and southern jets had merged to form a core overeastern Heilongjiang Province with a wind speed of 50 m·s−1, with Jilin and Heilongjiang Provinceson the right side of the entrance of the northern jet where strong divergence existed (not shown).The merger of the northern and southern jets occurred at 1200 UTC 24 November (Figure 5d), and thenorthern jet core intensified obviously after the merger, with eastern Liaoning Province being on theright side of the entrance of the northern upper-level jet. At 850-hPa, the vortex deepened obviouslyowing to the substantial intensification of the positive vorticity advection ahead of the 500-hPa troughand the enhancing warm advection (Figure 6b). The southeast winds to the north of the shear lineincreased evidently, with an enlarged strong-wind-speed region, transporting the moisture from theSea of Japan to Heilongjiang Province (Figure 6b), which supplied abundant water vapor for thesnowstorm. The merger of the upper-level jet streaks made the cyclone move northward obviously,which was similar to the approaching of two upper-level jet streaks in the snowstorm event examinedby Tian et al. [43] and Gao et al. [18]. The cyclone deepened rapidly under the joint effect of the rightside of the entrance of the 300-hPa jet and ahead of the 500-hPa merged deep trough. By 0600 UTC 25
Atmosphere 2020, 11, 1272 10 of 21
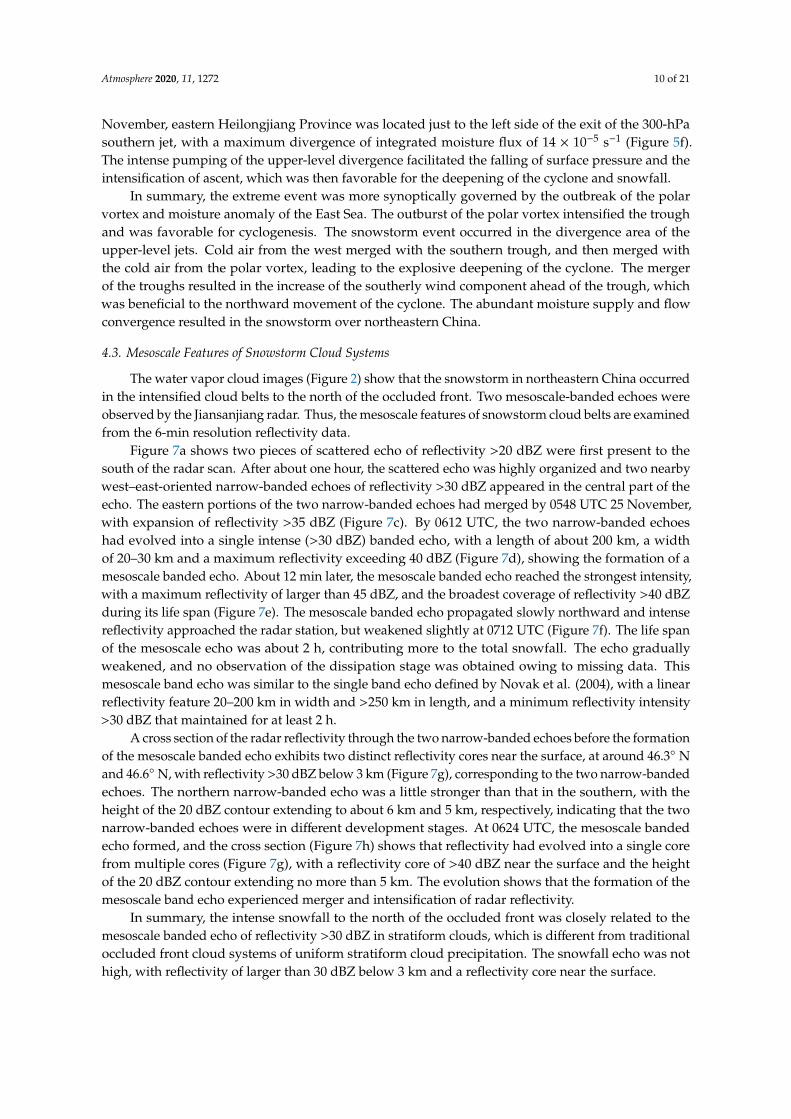
November, eastern Heilongjiang Province was located just to the left side of the exit of the 300-hPasouthern jet, with a maximum divergence of integrated moisture flux of 14 × 10−5 s−1 (Figure 5f).The intense pumping of the upper-level divergence facilitated the falling of surface pressure and theintensification of ascent, which was then favorable for the deepening of the cyclone and snowfall.
In summary, the extreme event was more synoptically governed by the outbreak of the polarvortex and moisture anomaly of the East Sea. The outburst of the polar vortex intensified the troughand was favorable for cyclogenesis. The snowstorm event occurred in the divergence area of theupper-level jets. Cold air from the west merged with the southern trough, and then merged withthe cold air from the polar vortex, leading to the explosive deepening of the cyclone. The mergerof the troughs resulted in the increase of the southerly wind component ahead of the trough, whichwas beneficial to the northward movement of the cyclone. The abundant moisture supply and flowconvergence resulted in the snowstorm over northeastern China.
4.3. Mesoscale Features of Snowstorm Cloud Systems
The water vapor cloud images (Figure 2) show that the snowstorm in northeastern China occurredin the intensified cloud belts to the north of the occluded front. Two mesoscale-banded echoes wereobserved by the Jiansanjiang radar. Thus, the mesoscale features of snowstorm cloud belts are examinedfrom the 6-min resolution reflectivity data.
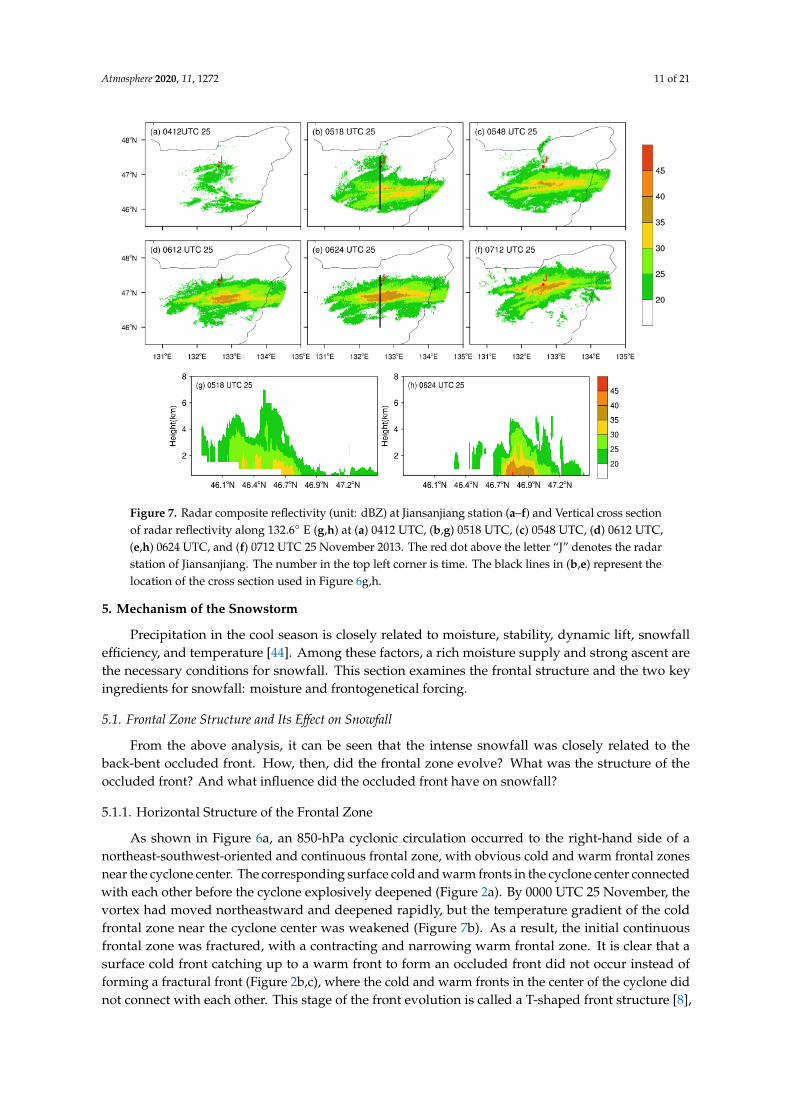
Figure 7a shows two pieces of scattered echo of reflectivity >20 dBZ were first present to thesouth of the radar scan. After about one hour, the scattered echo was highly organized and two nearbywest–east-oriented narrow-banded echoes of reflectivity >30 dBZ appeared in the central part of theecho. The eastern portions of the two narrow-banded echoes had merged by 0548 UTC 25 November,with expansion of reflectivity >35 dBZ (Figure 7c). By 0612 UTC, the two narrow-banded echoeshad evolved into a single intense (>30 dBZ) banded echo, with a length of about 200 km, a widthof 20–30 km and a maximum reflectivity exceeding 40 dBZ (Figure 7d), showing the formation of amesoscale banded echo. About 12 min later, the mesoscale banded echo reached the strongest intensity,with a maximum reflectivity of larger than 45 dBZ, and the broadest coverage of reflectivity >40 dBZduring its life span (Figure 7e). The mesoscale banded echo propagated slowly northward and intensereflectivity approached the radar station, but weakened slightly at 0712 UTC (Figure 7f). The life spanof the mesoscale echo was about 2 h, contributing more to the total snowfall. The echo graduallyweakened, and no observation of the dissipation stage was obtained owing to missing data. Thismesoscale band echo was similar to the single band echo defined by Novak et al. (2004), with a linearreflectivity feature 20–200 km in width and >250 km in length, and a minimum reflectivity intensity>30 dBZ that maintained for at least 2 h.
A cross section of the radar reflectivity through the two narrow-banded echoes before the formationof the mesoscale banded echo exhibits two distinct reflectivity cores near the surface, at around 46.3◦ Nand 46.6◦ N, with reflectivity >30 dBZ below 3 km (Figure 7g), corresponding to the two narrow-bandedechoes. The northern narrow-banded echo was a little stronger than that in the southern, with theheight of the 20 dBZ contour extending to about 6 km and 5 km, respectively, indicating that the twonarrow-banded echoes were in different development stages. At 0624 UTC, the mesoscale bandedecho formed, and the cross section (Figure 7h) shows that reflectivity had evolved into a single corefrom multiple cores (Figure 7g), with a reflectivity core of >40 dBZ near the surface and the heightof the 20 dBZ contour extending no more than 5 km. The evolution shows that the formation of themesoscale band echo experienced merger and intensification of radar reflectivity.
In summary, the intense snowfall to the north of the occluded front was closely related to themesoscale banded echo of reflectivity >30 dBZ in stratiform clouds, which is different from traditionaloccluded front cloud systems of uniform stratiform cloud precipitation. The snowfall echo was nothigh, with reflectivity of larger than 30 dBZ below 3 km and a reflectivity core near the surface.
Atmosphere 2020, 11, 1272 11 of 21
Atmosphere 2020, 11, x FOR PEER REVIEW 11 of 21
Figure 7. Radar composite reflectivity (unit: dBZ) at Jiansanjiang station (a–f) and Vertical cross section of radar reflectivity along 132.6° E (g-h) at (a) 0412UTC, (b) and (g) 0518UTC, (c) 0548UTC, (d) 0612UTC, (e) and (h) 0624UTC, and (f) 0712UTC 25 Nov 2013. The red dot above the letter “J” denotes the radar station of Jiansanjiang. The number in the top left corner is time. The black lines in (b) and (e) represent the location of the cross section used in Figure 6g,h.
5. Mechanism of the Snowstorm
Precipitation in the cool season is closely related to moisture, stability, dynamic lift, snowfall efficiency, and temperature [44]. Among these factors, a rich moisture supply and strong ascent are the necessary conditions for snowfall. This section examines the frontal structure and the two key ingredients for snowfall: moisture and frontogenetical forcing.
5.1. Frontal Zone Structure and Its Effect on Snowfall
From the above analysis, it can be seen that the intense snowfall was closely related to the back-bent occluded front. How, then, did the frontal zone evolve? What was the structure of the occluded front? And what influence did the occluded front have on snowfall?
5.1.1. Horizontal Structure of the Frontal Zone
As shown in Figure 6a, an 850-hPa cyclonic circulation occurred to the right-hand side of a northeast-southwest-oriented and continuous frontal zone, with obvious cold and warm frontal zones near the cyclone center. The corresponding surface cold and warm fronts in the cyclone center connected with each other before the cyclone explosively deepened (Figure 2a). By 0000 UTC 25 November, the vortex had moved northeastward and deepened rapidly, but the temperature gradient of the cold frontal zone near the cyclone center was weakened (Figure 7b). As a result, the initial continuous frontal zone was fractured, with a contracting and narrowing warm frontal zone. It is clear that a surface cold front catching up to a warm front to form an occluded front did not occur instead of forming a fractural front (Figure 2b–c), where the cold and warm fronts in the center of the cyclone did not connect with each other. This stage of the front evolution is called a T-shaped front structure [8], in that the east-moving cold front was nearly perpendicular to the back-bent warm front. The westward (backward) bent warm front twined around the cyclone center to form an occluded front (Figure 2c).
Figure 7. Radar composite reflectivity (unit: dBZ) at Jiansanjiang station (a–f) and Vertical cross sectionof radar reflectivity along 132.6◦ E (g,h) at (a) 0412 UTC, (b,g) 0518 UTC, (c) 0548 UTC, (d) 0612 UTC,(e,h) 0624 UTC, and (f) 0712 UTC 25 November 2013. The red dot above the letter “J” denotes the radarstation of Jiansanjiang. The number in the top left corner is time. The black lines in (b,e) represent thelocation of the cross section used in Figure 6g,h.
5. Mechanism of the Snowstorm
Precipitation in the cool season is closely related to moisture, stability, dynamic lift, snowfallefficiency, and temperature [44]. Among these factors, a rich moisture supply and strong ascent arethe necessary conditions for snowfall. This section examines the frontal structure and the two keyingredients for snowfall: moisture and frontogenetical forcing.
5.1. Frontal Zone Structure and Its Effect on Snowfall
From the above analysis, it can be seen that the intense snowfall was closely related to theback-bent occluded front. How, then, did the frontal zone evolve? What was the structure of theoccluded front? And what influence did the occluded front have on snowfall?
5.1.1. Horizontal Structure of the Frontal Zone
As shown in Figure 6a, an 850-hPa cyclonic circulation occurred to the right-hand side of anortheast-southwest-oriented and continuous frontal zone, with obvious cold and warm frontal zonesnear the cyclone center. The corresponding surface cold and warm fronts in the cyclone center connectedwith each other before the cyclone explosively deepened (Figure 2a). By 0000 UTC 25 November, thevortex had moved northeastward and deepened rapidly, but the temperature gradient of the coldfrontal zone near the cyclone center was weakened (Figure 7b). As a result, the initial continuousfrontal zone was fractured, with a contracting and narrowing warm frontal zone. It is clear that asurface cold front catching up to a warm front to form an occluded front did not occur instead offorming a fractural front (Figure 2b,c), where the cold and warm fronts in the center of the cyclone didnot connect with each other. This stage of the front evolution is called a T-shaped front structure [8],
Atmosphere 2020, 11, 1272 12 of 21
in that the east-moving cold front was nearly perpendicular to the back-bent warm front. The westward(backward) bent warm front twined around the cyclone center to form an occluded front (Figure 2c).
At 0600 UTC 25 November, the cold frontal zone continued to move eastward and the warmfrontal zone further stretched westward, with the increased frontogenesis appearing in the west (back)portion of the cyclone where the northerly airflows, accompanied by the polar cold air, prevailed(Figure 5c). The warm frontal zone contracted and narrowed in the northeast part of the cyclone,whereas the cold front weakened with its northern end extending to about 38◦ N (Figure 6c). At 1200UTC 25 November, the back-bent warm front and polar cold air turned cyclonically and surroundedthe low center. A relatively warm center formed around the low center, with a potential temperatureof 286 K (Figure 6d), and the coverage of the warm center had enlarged by 1800 UTC 25 November(not shown). Although the potential temperature was higher than that outside of the warm center,it was lower than that in the warm sector, indicating a separation between the warm sector air and thelow center. The separation of the warm core occurred in the baroclinic polar air, where the relativelycold and moist air originated from the northeast side of the cyclone rather than the warm sector air inthe initial location of the cyclone. Accompanying the warm-core formation, the surface cyclone centerwas surrounded by the warm front, and the cold front further weakened and moved eastward (notshown). The central pressure increased to 982-hPa, indicating that the cyclone had begun to weaken.
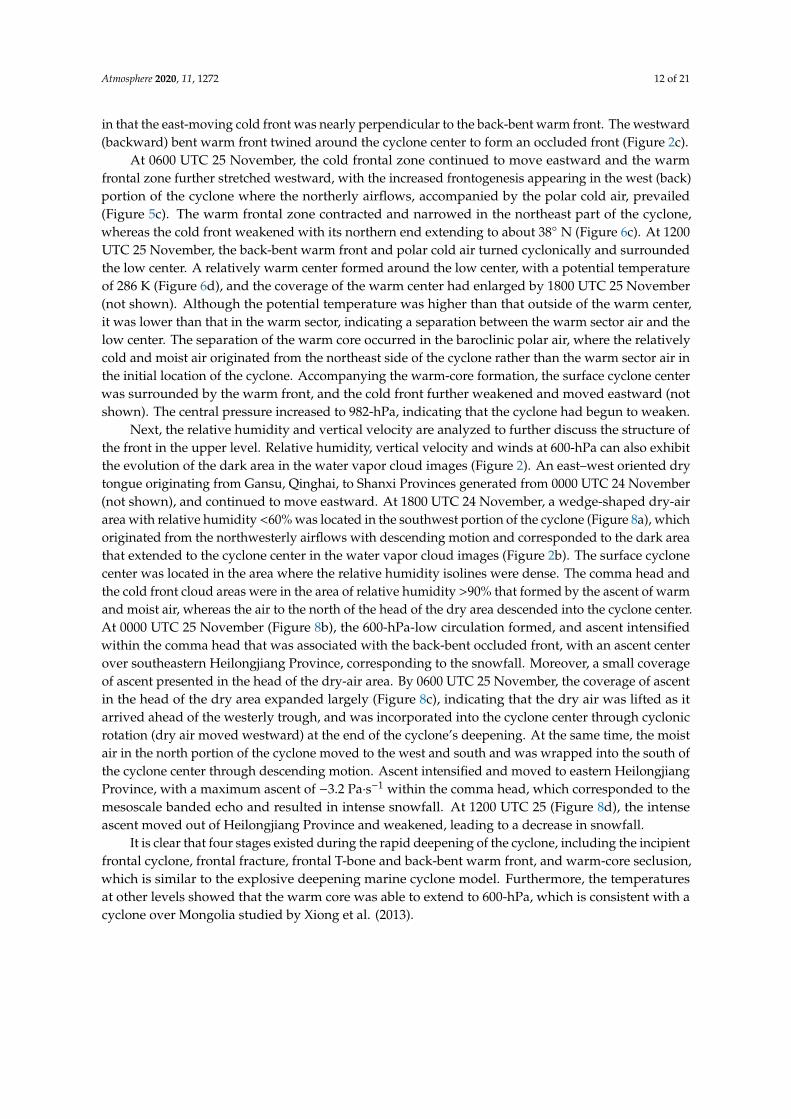
Next, the relative humidity and vertical velocity are analyzed to further discuss the structure ofthe front in the upper level. Relative humidity, vertical velocity and winds at 600-hPa can also exhibitthe evolution of the dark area in the water vapor cloud images (Figure 2). An east–west oriented drytongue originating from Gansu, Qinghai, to Shanxi Provinces generated from 0000 UTC 24 November(not shown), and continued to move eastward. At 1800 UTC 24 November, a wedge-shaped dry-airarea with relative humidity <60% was located in the southwest portion of the cyclone (Figure 8a), whichoriginated from the northwesterly airflows with descending motion and corresponded to the dark areathat extended to the cyclone center in the water vapor cloud images (Figure 2b). The surface cyclonecenter was located in the area where the relative humidity isolines were dense. The comma head andthe cold front cloud areas were in the area of relative humidity >90% that formed by the ascent of warmand moist air, whereas the air to the north of the head of the dry area descended into the cyclone center.At 0000 UTC 25 November (Figure 8b), the 600-hPa-low circulation formed, and ascent intensifiedwithin the comma head that was associated with the back-bent occluded front, with an ascent centerover southeastern Heilongjiang Province, corresponding to the snowfall. Moreover, a small coverageof ascent presented in the head of the dry-air area. By 0600 UTC 25 November, the coverage of ascentin the head of the dry area expanded largely (Figure 8c), indicating that the dry air was lifted as itarrived ahead of the westerly trough, and was incorporated into the cyclone center through cyclonicrotation (dry air moved westward) at the end of the cyclone’s deepening. At the same time, the moistair in the north portion of the cyclone moved to the west and south and was wrapped into the south ofthe cyclone center through descending motion. Ascent intensified and moved to eastern HeilongjiangProvince, with a maximum ascent of −3.2 Pa·s−1 within the comma head, which corresponded to themesoscale banded echo and resulted in intense snowfall. At 1200 UTC 25 (Figure 8d), the intenseascent moved out of Heilongjiang Province and weakened, leading to a decrease in snowfall.
It is clear that four stages existed during the rapid deepening of the cyclone, including the incipientfrontal cyclone, frontal fracture, frontal T-bone and back-bent warm front, and warm-core seclusion,which is similar to the explosive deepening marine cyclone model. Furthermore, the temperaturesat other levels showed that the warm core was able to extend to 600-hPa, which is consistent with acyclone over Mongolia studied by Xiong et al. (2013).
Atmosphere 2020, 11, 1272 13 of 21
Atmosphere 2020, 11, x FOR PEER REVIEW 13 of 21
Figure 8. Distributions of 600-hPa relative humidity (black line; interval: 10%), upward vertical velocity (shaded; unit: 10−1 Pa·s−1) and winds (unit: m·s−1) and low circulation (D), at (a) 1800 UTC 24 November, (b) 0000 UTC 25 November, (c) 0600 UTC 25 November and (d) 1200 UTC 25 November 2013. The “L” in (a) denotes surface low center and the “D” in (b–d) represent the 600-hPa circulation center.
5.1.2. Vertical Structure of the Frontal Zone
To further understand the structure of the back-bent occluded front and its effect on snowfall, zonal (along 46.6° N) and meridional (along 131.5° E) cross sections passing through the snowfall center and the occluded frontal zone are analyzed.
The zonal section along 46.6° N at 0600 UTC 25 November (Figure 9a) shows that deep moist air extended to 300-hPa around the back-bent occluded front and intensive ascent between 700 and 450-hPa, which resulted in the intense cloud area with lower cloud-top temperature within the comma head and the heavy snowfall over eastern Heilongjiang Province. Relative humidity <60% above 600-hPa between 132° E and 136° E corresponded to the descending dry and cold air that rotated cyclonically. A small area of descending motion can be seen below 700-hPa around 135° E, where the distribution of equivalent potential temperature shows that the air was relatively warm, which in turn shows that the head of the dry air had changed from descending to ascending motion. Another deep and moist air layer with ascent was situated to the east of the dry air layer, corresponding to the warm frontal zone in the eastern part of the occluded front.
Figure 8. Distributions of 600-hPa relative humidity (black line; interval: 10%), upward verticalvelocity (shaded; unit: 10−1 Pa·s−1) and winds (unit: m·s−1) and low circulation (D), at (a) 1800 UTC 24November, (b) 0000 UTC 25 November, (c) 0600 UTC 25 November and (d) 1200 UTC 25 November 2013.The “L” in (a) denotes surface low center and the “D” in (b–d) represent the 600-hPa circulation center.
5.1.2. Vertical Structure of the Frontal Zone
To further understand the structure of the back-bent occluded front and its effect on snowfall,zonal (along 46.6◦ N) and meridional (along 131.5◦ E) cross sections passing through the snowfallcenter and the occluded frontal zone are analyzed.
The zonal section along 46.6◦ N at 0600 UTC 25 November (Figure 9a) shows that deep moistair extended to 300-hPa around the back-bent occluded front and intensive ascent between 700 and450-hPa, which resulted in the intense cloud area with lower cloud-top temperature within the commahead and the heavy snowfall over eastern Heilongjiang Province. Relative humidity <60% above600-hPa between 132◦ E and 136◦ E corresponded to the descending dry and cold air that rotatedcyclonically. A small area of descending motion can be seen below 700-hPa around 135◦ E, where thedistribution of equivalent potential temperature shows that the air was relatively warm, which in turnshows that the head of the dry air had changed from descending to ascending motion. Another deepand moist air layer with ascent was situated to the east of the dry air layer, corresponding to the warmfrontal zone in the eastern part of the occluded front.
The longitudinal section along 131.5◦ E at 0600 UTC 25 November (Figure 9b) shows that deepand moist air with ascent was situated to the south of 30◦ N, corresponding to cold-front cloud systems.The lines of equivalent potential temperature are downward concave between 43◦ N and 45◦ N below500-hPa, indicating that warm air was isolated and corresponded to the occluded front. A deep

Atmosphere 2020, 11, 1272 14 of 21
and moist layer between 44◦ N and 54◦ N with intensive ascending motion occurred around 45◦ N,corresponding to the occluded front, resulting in heavy snowfall over Heilongjiang Province.Atmosphere 2020, 11, x FOR PEER REVIEW 14 of 21
Figure 9. Cross sections of potential temperature (black line; unit: K), temperature (red dashed line; unit: °C), relative humidity (green dashed line; unit: %), and vertical velocity (shaded, unit: Pa·s−1), along line AB (a) and CE (b) in Figure 2d, respectively. Front boundary (gray yellow thick line) (a) and (b) at 0600 UTC 25 November 2013.
The longitudinal section along 131.5° E at 0600 UTC 25 November (Figure 9b) shows that deep and moist air with ascent was situated to the south of 30° N, corresponding to cold-front cloud systems. The lines of equivalent potential temperature are downward concave between 43° N and 45° N below 500-hPa, indicating that warm air was isolated and corresponded to the occluded front. A deep and moist layer between 44° N and 54° N with intensive ascending motion occurred around 45° N, corresponding to the occluded front, resulting in heavy snowfall over Heilongjiang Province.
Although intense ascent and a deep moist layer still existed near the occluded front at 1200UTC 25 November, the occluded front frontal zone moved northeastward, with the maximum ascent also moving northward (not shown), resulting in the location of precipitation being further north and the intensity decreasing at the end of the cyclone’s development.
In summary, the strong ascent within the comma head was closely related to the snowfall. With the intensification of the 600-hPa-low circulation, the dry air was constantly wrapped into the cyclone center, while the moist air in the north of the cyclone moved to the west and south. The dry and moist air converged within the comma head on the northwest side of the cyclone center and resulted in the enhancement of the frontal zone, which was conducive to the lifting of the moist air to the north of the cyclone, and then the snowfall over eastern Heilongjiang Province.
5.2. Moisture Condition
The occurrence of a snowstorm needs an abundant moisture supply. So, what were the features of the moisture transport and relationship with the cyclone for this snowstorm event?
Figure 6 illustrates the geopotential height, temperature, and wind at 850-hPa, as well as the divergence of integrated moisture flux from 1000 to 300-hPa. A moisture channel extending from eastern coastal China to eastern Liaoning Province can be clearly seen as the low was just forming, with weak southerly airflows over northeastern China (Figure 6a). A large amount of moisture was transported northward and converged ahead of cold and warm frontal zones, and the moisture flux convergence areas corresponding to cold and warm fronts were connected to each other. Moisture was transported to Liaoning Province from the Yellow Sea and the East China Sea at this time (Figure 6a). At 0000UTC 25 November, the southeasterly airflow to the north of the shear line strengthened and reached jet intensity owing to the deepening of the vortex (Figure 6b). Northeastern China was located in the northeast quadrant of the vortex and the southeast airflow transported moisture toward northeastern China from the Sea of Japan. Because the northern portion of the cold front was weakened, the moisture flux convergence areas corresponding to cold and warm fronts were disconnected. The northwest–southeast-oriented moisture flux convergence within the warm frontal zone stretched to the west, with two relatively intense moisture flux convergence areas over eastern
Figure 9. Cross sections of potential temperature (black line; unit: K), temperature (red dashed line;unit: ◦C), relative humidity (green dashed line; unit: %), and vertical velocity (shaded, unit: Pa·s−1),along line AB (a) and CE (b) in Figure 2d, respectively. Front boundary (gray yellow thick line) (a) and(b) at 0600 UTC 25 November 2013.
Although intense ascent and a deep moist layer still existed near the occluded front at 1200 UTC25 November, the occluded front frontal zone moved northeastward, with the maximum ascent alsomoving northward (not shown), resulting in the location of precipitation being further north and theintensity decreasing at the end of the cyclone’s development.
In summary, the strong ascent within the comma head was closely related to the snowfall. With theintensification of the 600-hPa-low circulation, the dry air was constantly wrapped into the cyclonecenter, while the moist air in the north of the cyclone moved to the west and south. The dry and moistair converged within the comma head on the northwest side of the cyclone center and resulted in theenhancement of the frontal zone, which was conducive to the lifting of the moist air to the north of thecyclone, and then the snowfall over eastern Heilongjiang Province.
5.2. Moisture Condition
The occurrence of a snowstorm needs an abundant moisture supply. So, what were the features ofthe moisture transport and relationship with the cyclone for this snowstorm event?
Figure 6 illustrates the geopotential height, temperature and wind at 850-hPa, as well as thedivergence of integrated moisture flux from 1000 to 300-hPa. A moisture channel extending fromeastern coastal China to eastern Liaoning Province can be clearly seen as the low was just forming,with weak southerly airflows over northeastern China (Figure 6a). A large amount of moisture wastransported northward and converged ahead of cold and warm frontal zones, and the moisture fluxconvergence areas corresponding to cold and warm fronts were connected to each other. Moisture wastransported to Liaoning Province from the Yellow Sea and the East China Sea at this time (Figure 6a).At 0000 UTC 25 November, the southeasterly airflow to the north of the shear line strengthenedand reached jet intensity owing to the deepening of the vortex (Figure 6b). Northeastern Chinawas located in the northeast quadrant of the vortex and the southeast airflow transported moisturetoward northeastern China from the Sea of Japan. Because the northern portion of the cold frontwas weakened, the moisture flux convergence areas corresponding to cold and warm fronts weredisconnected. The northwest–southeast-oriented moisture flux convergence within the warm frontalzone stretched to the west, with two relatively intense moisture flux convergence areas over eastern

Atmosphere 2020, 11, 1272 15 of 21
Heilongjiang Province and the Sea of Japan (Figure 6b). These two intense moisture flux convergencesresulted from confluences between southeast and northeast winds and southwest and southeastwinds, respectively.
The backward trajectories show that air parcels originated over western China with slightlydifferent moving tracks at different heights (Figure 10). The air parcels at 1500 m and 3000 m firstmoved east or southeast and turned north as they reached the eastern coastal area of the KoreanPeninsula, and then rose to arrive in the snowfall area. The air parcels at this two altitudes wereinitially descending dry air (Figure 10c,e), with specific humidity <2 g·kg−1, and they moistened asthey passing over the Bohai Sea and the Sea of Japan, with specific humidity increasing (Figure 10e). Itwas shown that the moisture at 1500 m and 3000 m mainly originated from the Bohai Sea and the Sea ofJapan, with the southerly flows transporting moisture. The moisture transport of the event is consistentwith the work carried out by Sun et al. [19]. They pointed out that the moisture originated primarilyfrom the Yellow Sea and the Sea of Japan. Unlike air parcels at 1500 and 3000 m, the air parcels at analtitude of 500 m first moved northeast to an area further north, and then turned cyclonically as theyreached Russia on the east of Heilongjiang Province. Initially, they were moist air with relatively highspecific humidity owing to passing over the Bohai Sea (Figure 10a,e).
Atmosphere 2020, 11, x FOR PEER REVIEW 15 of 21
Heilongjiang Province and the Sea of Japan (Figure 6b). These two intense moisture flux convergences resulted from confluences between southeast and northeast winds and southwest and southeast winds, respectively.
The backward trajectories show that air parcels originated over western China with slightly different moving tracks at different heights (Figure 10). The air parcels at 1500 m and 3000 m first moved east or southeast and turned north as they reached the eastern coastal area of the Korean Peninsula, and then rose to arrive in the snowfall area. The air parcels at this two altitudes were initially descending dry air (Figure 10c,e), with specific humidity <2g·kg−1, and they moistened as they passing over the Bohai Sea and the Sea of Japan, with specific humidity increasing (Figure 10e). It was shown that the moisture at 1500 m and 3000 m mainly originated from the Bohai Sea and the Sea of Japan, with the southerly flows transporting moisture. The moisture transport of the event is consistent with the work carried out by Sun et al. [19]. They pointed out that the moisture originated primarily from the Yellow Sea and the Sea of Japan. Unlike air parcels at 1500 and 3000 m, the air parcels at an altitude of 500 m first moved northeast to an area further north, and then turned cyclonically as they reached Russia on the east of Heilongjiang Province. Initially, they were moist air with relatively high specific humidity owing to passing over the Bohai Sea (Figure 10a,e).
Figure 10. The 60-h backward trajectories of air parcels, based on the HYSPLIT model, at (a,c,e) 0000 UTC and (b,d,f) 0600 UTC 25 November 2013: (a,b) horizontal distribution; (c,d) vertical distribution; (e,f) specific humidity (g·kg−1).
Figure 10. The 60-h backward trajectories of air parcels, based on the HYSPLIT model, at (a,c,e) 0000UTC and (b,d,f) 0600 UTC 25 November 2013: (a,b) horizontal distribution; (c,d) vertical distribution;(e,f) specific humidity (g·kg−1).
Atmosphere 2020, 11, 1272 16 of 21
The vertical distribution of the trajectories (Figure 10c) shows that the air parcels at differentheights ascended between 0 h and −12 h, and descended before −12 h. Thus, the air parcels between 0h and −12 h contributed the most to the snowfall, and those before −12 h contributed little. The airparcels at 3000 m before −12 h comprised dry air originating from the mainland. They were obviouslymoistened, therefore bringing moisture for snowfall when they turned north and passed over theSea. The air parcels at 500 m and 1500 m were moist during longer period, providing moisture tothe snowfall.
At 0600 UTC 25 November, the southeast winds to the north of the shear line intensified, and theintense moisture flux convergence maintained over eastern Heilongjiang Province, disconnecting withthat over the Sea of Japan (Figure 6c). Different from 6 h before, the air parcels at 1500 and 3000 mfirst moved southeast and then turned northwest as they reached the western coast of Japan, travelinglonger distances over the Sea of Japan before they rose to arrive in the snowfall area (Figure 10b).As a result, the moisture transport channel became wider and the moisture transport was significantlyenhanced, with the specific humidity increased by about 2 g·kg−1 (Figure 10f). Notably, the cyclonicrotation of the air parcels at 500 m was more obvious and some air parcels passed over the Sea ofJapan instead of the mainland. The moisture transport and moisture flux convergence intensifiedsignificantly over the snowfall area (Figure 6c). The back trajectories clearly show that the moisturetransport was influenced by the cyclone. The air parcels at 1500 m and 3000 m were on the northeastportion of the cyclone, influencing by southeasterly winds, while those at 500 m were on the northwestportion of the cyclone, dominating by northeasterly winds, showing the tilting of the cyclone withheight. This can explain why the air parcels at different heights have different moving tracks. The deepcyclone and its baroclinic structure intensified the snowfall.
In summary, the main moisture source over northeastern China originated from the Bohai Seaand the Sea of Japan, and the southeasterly low-level jet continuously transported abundant moistureto the snowstorm area. The moisture transport intensity varied significantly at different times, whichmainly depended on the location and intensity of the cyclone.
5.3. Analysis of Frontogenesis
The above analysis shows that a back-bent occluded front formed during the rapid deepening ofa cyclone, with strong moisture flux convergence and ascent in the northern quadrant of the cyclone.So, what was the main mechanism of ascent? Temperatures and winds at 850-hPa (Figure 6) show thatobvious warm advection was present over northeastern China, which played an important role ingenerating synoptic-scale ascent. The frontogenetical forcing was also important, so, the frontogenesisfunction is analyzed below.
Petterssen [45] defined the atmospheric frontogenesis function as the Lagrangian rate of changeof the horizontal potential temperature gradient. Frontogenesis can induce an ageostrophic verticalcirculation. So, the frontogenesis function is often used to diagnose the vertical motion and it is regardedas a good predictor for snowfall [46,47]. In this paper, the two-dimensional surface frontogenesisfunction defined by Miller [48] is applied to analyze frontogenesis qualitatively:
F =ddt
∣∣∣∣∣∣∇hθ
∣∣∣∣∣∣= −1|∇hθ|
[(∂u∂x∂θ∂x
+∂v∂x∂θ∂y
)∂θ∂x
+
(∂u∂y∂θ∂x
+∂v∂y∂θ∂y
)∂θ∂y
](1)
where u and v denote the horizontal wind component, and θ represents potential temperature.The frontogenesis function is calculated using formula (1).
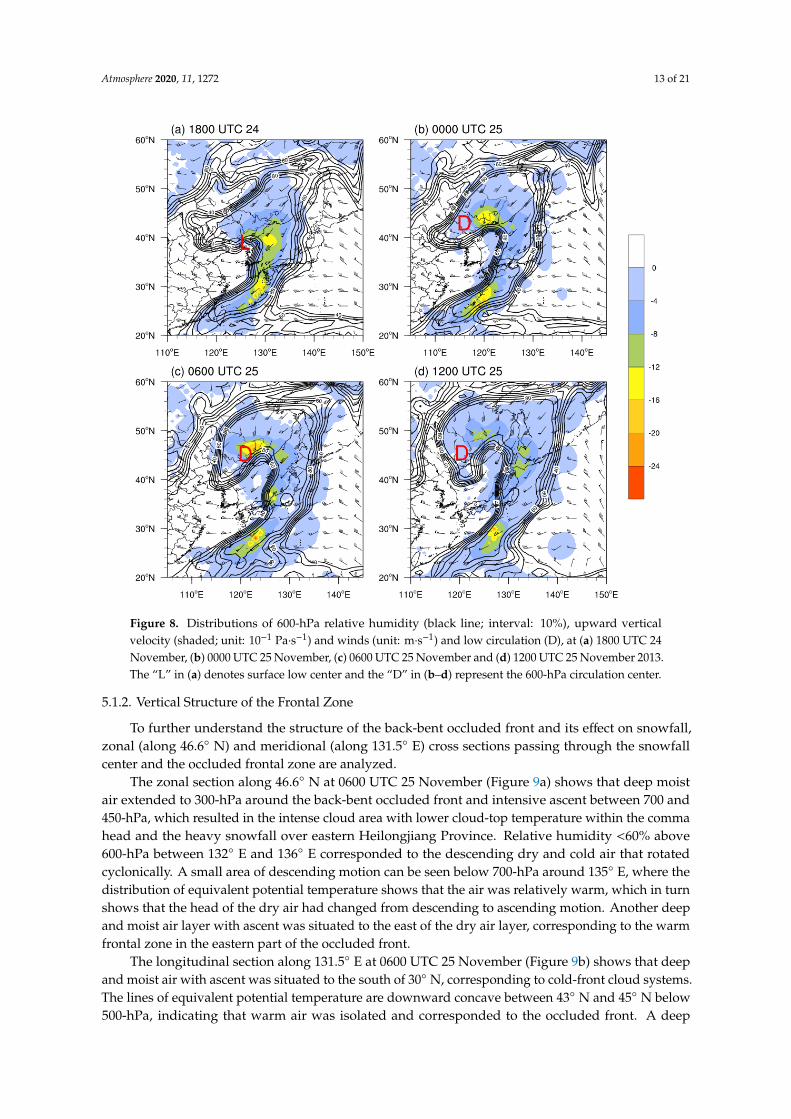
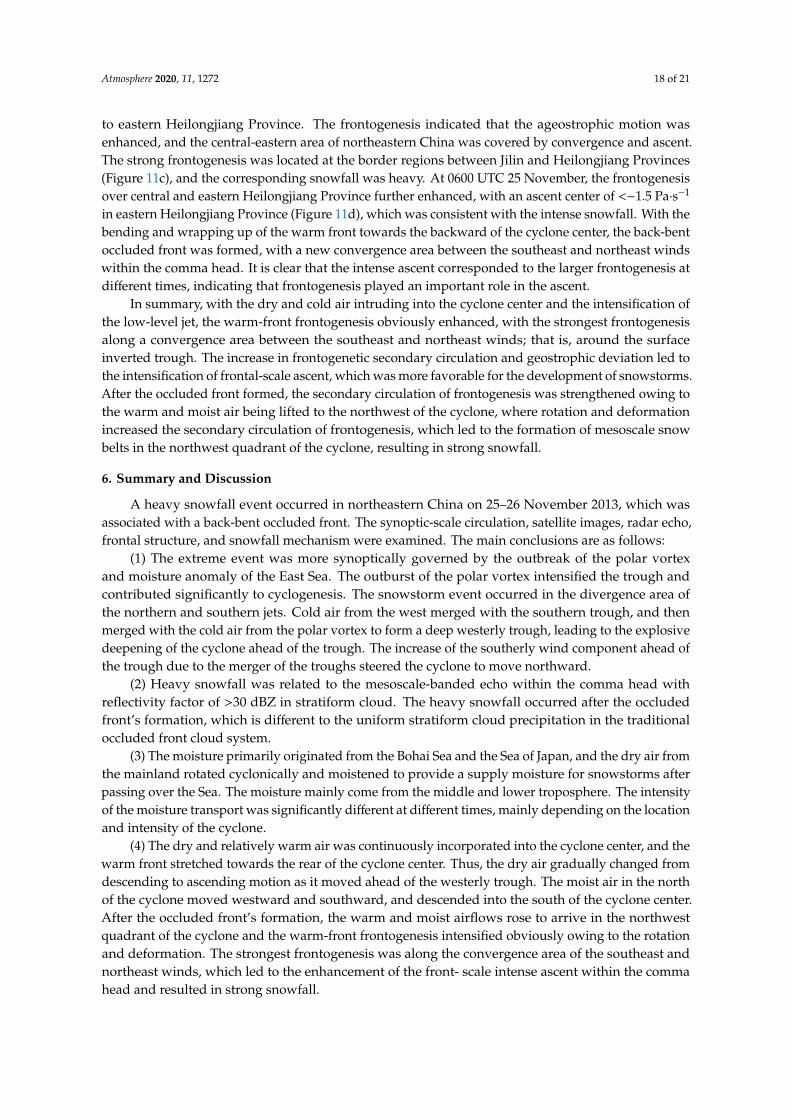
As shown in Figure 11, divergence and descending motion were present to the south of thelow center, and obvious frontogenesis was present to the north of the low center, at 1200 UTC 24November (Figure 11a). An intense frontogenesis associated with the warm shear line was locatedover the Korean Peninsula. Another weaker southwest–northeast oriented band of frontogenesispassed through Liaoning, Jilin and Heilongjiang Provinces, with maximum frontogenesis in LiaoningProvince, where strong ascent existed. This frontogenesis resulted from airflow convergence between
Atmosphere 2020, 11, 1272 17 of 21
southeast and northeast winds in the north portion of the cyclone, which was the vertical extension ofthe surface warm front (not shown). At 1800 UTC 24 November, the dry air intruded into the cyclonecenter and a frontal fracture formed, with the low center in the convergence and frontogenesis region.The convergence between southeast and northeast winds was over central Jilin and HeilongjiangProvinces, which resulted in frontogenesis, with a maximum frontogenesis of >3 × 10⁻² K·km−1
·h−1
and ascent smaller than −0.2 Pa·s−1 in Jilin Province, consistent with the northward-moving snowfallregion (Figure 11b).
Atmosphere 2020, 11, x FOR PEER REVIEW 17 of 21
cyclone center and a frontal fracture formed, with the low center in the convergence and frontogenesis region. The convergence between southeast and northeast winds was over central Jilin and Heilongjiang Provinces, which resulted in frontogenesis, with a maximum frontogenesis of >3 × 10⁻² K·km−1·h−1 and ascent smaller than −0.2 Pa·s−1 in Jilin Province, consistent with the northward-moving snowfall region (Figure 11b).
Figure 11. The Petterssen frontogenesis (black solid line; unit: 10−2 K·km−1·h−1), convergence (shaded; unit: 10−5 s−1), and wind vector at 850-hPa and vertical velocities (red contours; units: 10−1 Pa·s−1) at 700-hPa, at (a) 1200 UTC 24 November, (b) 1800 UTC 24 November, (c) 0000 UTC 25 November and (d) 0600 UTC 25 November 2013. The pink dashed line denotes the convergence line, and the black dashed line represents warm shear line. The “D” denotes the 850-hPa low center.
At 0000UTC 25 November, the dry air occupied the cyclone center, with the frontogenesis of the low center increasing to 5 × 10⁻² K·km−1·h−1. Accompanying the warm shear line moving northward to 42°–43° N, the southwest and southeast winds on both sides of the warm shear line intensified, resulting in the enhancement of the transport and convergence of the warm and moist air. A large range of frontogenesis formed over the central–eastern area of northeastern China. The convergence between southeast and northeast winds and the wind speed convergence of the southeast winds resulted in another band of frontogenesis extending northward from the low center to eastern Heilongjiang Province. The frontogenesis indicated that the ageostrophic motion was enhanced, and the central-eastern area of northeastern China was covered by convergence and ascent. The strong
Figure 11. The Petterssen frontogenesis (black solid line; unit: 10−2 K·km−1·h−1), convergence (shaded;
unit: 10−5 s−1), and wind vector at 850-hPa and vertical velocities (red contours; units: 10−1 Pa·s−1) at700-hPa, at (a) 1200 UTC 24 November, (b) 1800 UTC 24 November, (c) 0000 UTC 25 November and(d) 0600 UTC 25 November 2013. The pink dashed line denotes the convergence line and the blackdashed line represents warm shear line. The “D” denotes the 850-hPa low center.
At 0000 UTC 25 November, the dry air occupied the cyclone center, with the frontogenesisof the low center increasing to 5 × 10⁻² K·km−1
·h−1. Accompanying the warm shear line movingnorthward to 42◦–43◦ N, the southwest and southeast winds on both sides of the warm shear lineintensified, resulting in the enhancement of the transport and convergence of the warm and moistair. A large range of frontogenesis formed over the central–eastern area of northeastern China.The convergence between southeast and northeast winds and the wind speed convergence of thesoutheast winds resulted in another band of frontogenesis extending northward from the low center
Atmosphere 2020, 11, 1272 18 of 21
to eastern Heilongjiang Province. The frontogenesis indicated that the ageostrophic motion wasenhanced, and the central-eastern area of northeastern China was covered by convergence and ascent.The strong frontogenesis was located at the border regions between Jilin and Heilongjiang Provinces(Figure 11c), and the corresponding snowfall was heavy. At 0600 UTC 25 November, the frontogenesisover central and eastern Heilongjiang Province further enhanced, with an ascent center of <−1.5 Pa·s−1
in eastern Heilongjiang Province (Figure 11d), which was consistent with the intense snowfall. With thebending and wrapping up of the warm front towards the backward of the cyclone center, the back-bentoccluded front was formed, with a new convergence area between the southeast and northeast windswithin the comma head. It is clear that the intense ascent corresponded to the larger frontogenesis atdifferent times, indicating that frontogenesis played an important role in the ascent.
In summary, with the dry and cold air intruding into the cyclone center and the intensification ofthe low-level jet, the warm-front frontogenesis obviously enhanced, with the strongest frontogenesisalong a convergence area between the southeast and northeast winds; that is, around the surfaceinverted trough. The increase in frontogenetic secondary circulation and geostrophic deviation led tothe intensification of frontal-scale ascent, which was more favorable for the development of snowstorms.After the occluded front formed, the secondary circulation of frontogenesis was strengthened owing tothe warm and moist air being lifted to the northwest of the cyclone, where rotation and deformationincreased the secondary circulation of frontogenesis, which led to the formation of mesoscale snowbelts in the northwest quadrant of the cyclone, resulting in strong snowfall.
6. Summary and Discussion
A heavy snowfall event occurred in northeastern China on 25–26 November 2013, which wasassociated with a back-bent occluded front. The synoptic-scale circulation, satellite images, radar echo,frontal structure, and snowfall mechanism were examined. The main conclusions are as follows:
(1) The extreme event was more synoptically governed by the outbreak of the polar vortexand moisture anomaly of the East Sea. The outburst of the polar vortex intensified the trough andcontributed significantly to cyclogenesis. The snowstorm event occurred in the divergence area ofthe northern and southern jets. Cold air from the west merged with the southern trough, and thenmerged with the cold air from the polar vortex to form a deep westerly trough, leading to the explosivedeepening of the cyclone ahead of the trough. The increase of the southerly wind component ahead ofthe trough due to the merger of the troughs steered the cyclone to move northward.
(2) Heavy snowfall was related to the mesoscale-banded echo within the comma head withreflectivity factor of >30 dBZ in stratiform cloud. The heavy snowfall occurred after the occludedfront’s formation, which is different to the uniform stratiform cloud precipitation in the traditionaloccluded front cloud system.
(3) The moisture primarily originated from the Bohai Sea and the Sea of Japan, and the dry air fromthe mainland rotated cyclonically and moistened to provide a supply moisture for snowstorms afterpassing over the Sea. The moisture mainly come from the middle and lower troposphere. The intensityof the moisture transport was significantly different at different times, mainly depending on the locationand intensity of the cyclone.
(4) The dry and relatively warm air was continuously incorporated into the cyclone center, and thewarm front stretched towards the rear of the cyclone center. Thus, the dry air gradually changed fromdescending to ascending motion as it moved ahead of the westerly trough. The moist air in the northof the cyclone moved westward and southward, and descended into the south of the cyclone center.After the occluded front’s formation, the warm and moist airflows rose to arrive in the northwestquadrant of the cyclone and the warm-front frontogenesis intensified obviously owing to the rotationand deformation. The strongest frontogenesis was along the convergence area of the southeast andnortheast winds, which led to the enhancement of the front- scale intense ascent within the commahead and resulted in strong snowfall.

Atmosphere 2020, 11, 1272 19 of 21
(5) Due to the shortage of high spatial and temporal resolution observation data, the analysisof the snowfall mechanism was limited. The snowfall event occurred in the warm frontal zonewith convective stability (∂θ/∂p < 0). The preliminary study showed that it probably existed moistsymmetric and inertial instability, which can explain the observed banded snowfall echoes. However,the resolution of the FNL data is too coarse to resolve the instability. So, the stability mechanism of theevent needs to be further revealed based on numerical simulation, which will be discussed in anotherpaper. In addition, we have found many snowstorm cases were associated with the S-K conceptualconfiguration’s cyclones over northeast China, but we can’t get a general result through a case study.We will survey many such type cases and hope to obtain a good result in the future. If the result ispositive, it may be helpful in pattern recognition in the operational forecast.
Author Contributions: Conceptualization, Y.Z. and C.-F.Y. Investigation and methodology, Y.Z. and L.F. Software,L.F. and X.-F.C. Formal analysis, Y.Z. and L.F. Writing—Review and editing, Y.Z. All authors have read and agreedto the published version of the manuscript.
Funding: This research was funded by National Natural Science Foundation of China (41975055) and the NationalKey Research and Development Program of China (2017YFC1502002).
Acknowledgments: We thank two anonymous reviewers for their constructive comments that have helped us toimprove the manuscript.
Conflicts of Interest: The authors declare no conflict of interest.
References
1. Tao, Z.Y.; Xiong, Q.F.; Zheng, Y.G.; Wang, H. Overview of advances in synoptic meteorology: Four stages ofdevelopment in conceptual models of frontal cyclones. J. Meteorol. Res. 2014, 72, 940–947. [CrossRef]
2. Zhao, Y.; Zhu, H.Q.; Lan, X.; Yang, C.Y. Structure of the snowstorm cloud associated with northwardJiang-huai cyclone based on Cloud satsatellite data. Chin. J. Geophys. 2018, 61, 4789–4804. [CrossRef]
3. Wu, X.J.; Fei, J.F.; Huang, X.G.; Xiong, Q.F.; Cheng, X.P. Ideal numerical simulations for influence of the landsurface and ambient airflow on the frontal cyclone development. Chin. J. Geophys. 2018, 61, 3149–3159.
4. Schultz, D.M.; Vaughan, G. Occluded Fronts and the Occlusion Process: A Fresh Look at ConventionalWisdom. Bull. Am. Meteorol. Soc. 2011, 92, 443–466. [CrossRef]
5. Sun, J.Q.; Wang, H.J.; Yuan, W. A preliminary investigation on causes of the catastrophic snowstorm inMarch, 2007 in the northeastern parts of China. Acta Meteorol. Sin. 2009, 67, 469–477.
6. Bjerknes, J. On The Structure Of Moving Cyclones. Mon. Weather Rev. 1919, 47, 95–99. [CrossRef]7. Bjerknes, J.; Solberg, H. Life cycle of cyclones and the polar front theory of atmospheric circulation. Geofys. Publ.
1922, 3, 3–18.8. Shapiro, M.A.; Keyser, D. Fronts—Jet Streams and the Tropopause. In Extratropical Cyclones: The Erik Palmén
Memorial Volume; Newton, C., Holopainen, E.O., Eds.; American Meteorological Society: Boston, MA, USA,1990; pp. 167–191.
9. Schultz, D.M.; Keyser, D.; Bosart, L.F. The Effect of Large-Scale Flow on Low-Level Frontal Structure andEvolution in Midlatitude Cyclones. Mon. Weather Rev. 1998, 126, 1767–1791. [CrossRef]
10. Wang, H.Q.; Zhang, Y.; Tao, Z.Y. Visualization of the numerical simulation of a yellow sea cyclone. Q. J. Appl.Meteorol. 2000, 11, 282–286.
11. Zhang, W.; Tao, Z.Y.; Hu, Y.Y. A study on the dry intrusion of air flows from the lower stratosphere in acyclone development. Acta Sci. Nat. Univ. Pekin. 2006, 42, 61–67.
12. Xiong, Q.F.; Niu, N.; Zhang, L.N. Analysis of the back-bent warm front structure associated with an explosiveextratropical cyclone over land. Acta Meteorol. Sin. 2013, 71, 239–249.
13. Xiong, Q.F.; Guo, D.F.; Niu, N. Cloud characteristics and analysis of structure and mechanism on back-bentwarm front in extratropical cyclone over East Asian land. Torrential Rain Disaster 2016, 35, 297–305.
14. Guo, D.F.; Xiong, Q.F.; Zhang, X. Structure and mechanism analysis of one Jiangnan cyclone with Northerntrack. Meteor. Mon. 2017, 43, 413–424.
15. Fu, L.; Zhao, Y.; Yang, C.F.; Ling, Z. Statistical characteristics of the northward extratropical cyclone snowstormaffecting Northeast China. Plateau Meteorol. 2018, 37, 1705–1715.

Atmosphere 2020, 11, 1272 20 of 21
16. Zhou, X.W.; Zhao, Y.; Zhu, Y.M.; Lou, D.; Qiqihar, M.B. Comparative analysis of two extra-tropical cyclonesnowstorm processes in Heilongjiang Province. J. Glaciol. Geocryol. 2018, 40, 1195–1206.
17. Wang, D.H.; Duan, Y.H.; Liu, Y.; Liang, Z.M.; Liu, C.J.; Zhao, Y.F.; Zhang, Y.W.; Yin, J.F.; Wang, H. A casestudy of the mixed rainfall-snowfall event associated with an extratropical cyclone in autumn. Meteor. Sin.2013, 71, 606–627.
18. Gao, S.Y.; Sun, L.Q.; Liu, T.W.; Baocai, H. Diagnostic analysis of an extraordinarily severe snowstorm eventin Liaoning province. Meteor. Sci. Technol. 2009, 37, 175–180.
19. Sun, X.; Cai, X.N.; Chen, C.L.; Jia, X.X.; Qiao, X.S. Analysis of the 4 March 2007 heavy snowstorm in northeastChina. Meteor. Mon. 2011, 37, 863–870.
20. Yi, X.Y.; Li, Z.C.; Chen, T.; Li, Y. Activities of cold-dry air and its impact on heavy rain-snow processes inNorth China during March 3-5, 2007. J. Nanjing Inst. Meteorol. 2009, 32, 306–313.
21. Liu, N.W.; Qi, L.L.; Han, J.W. The analyses of an unusual snowstorm caused by the northbound vortex overLiaoning province in China. Chin. J. Atmos. Sci. 2009, 33, 275–284.
22. Sun, Y.H.; Li, Z.C.; Shou, S.W. A mesoscale analysis of the snowstorm event of 3-5 March 2007 in Liaoningprovince. Acta Meteor. Sin. 2012, 70, 936–948.
23. Sun, Y.H.; Li, Z.C.; Shou, S.W. An investigation into the features and effects of the mesoscale gravity wavesas in a snowstorm event. Acta Meteor. Sin. 2015, 73, 697–710.
24. Marwitz, J.D.; Toth, J. A Case study of heavy snowfall in Oklahoma. Mon. Weather Rev. 1993, 121, 648–660.[CrossRef]
25. Uccellini, L.W.; Keyser, D. The Presidents’ day cyclone of 18-19 February 1979: Influence of upstream troughamplication and associated tropopause folding on rapid cyclogenesis. Mon. Weather Rev. 1985, 113, 962–988.[CrossRef]
26. Weisman, R.A. The Fargo snowstorm of 6–8 January 1989. Weather Forecast. 1996, 11, 198–215. [CrossRef]27. Sanders, F. Frontogenesis and Symmetric Stability in a Major New England Snowstorm. Mon. Weather Rev.
1986, 114, 1847–1862. [CrossRef]28. Martin, J.E. The structure and evolution of a continental winter cyclone. Part I: Frontal structure and the
occlusion process. Mon. Weather Rev. 1998, 126, 303–328. [CrossRef]29. Novak, D.R.; Bosart, L.F.; Keyser, D.; Waldstreicher, J.S. An observational study of cold season–banded
precipitation in northeast U.S. cyclones. Weather Forecast. 2004, 19, 993–1010. [CrossRef]30. Novak, D.R.; Colle, B.A.; Aiyyer, A.R. Evolution of mesoscale precipitation band environments within the
comma head of northeast U.S. cyclones. Mon. Weather Rev. 2010, 138, 2354–2374. [CrossRef]31. Novak, D.R.; Colle, B.A.; Yuter, S.E. High-resolution observations and model simulations of the life cycle of
an intense mesoscale snowband over the northeastern United States. Mon. Weather Rev. 2008, 136, 1433–1456.[CrossRef]
32. Schumacher, R.S.; Schultz, D.M.; Knox, J.A. Convective snowbands downstream of the Rocky mountains inan environment with conditional, dry symmetric, and inertial instabilities. Mon. Weather Rev. 2010, 138,4416–4438. [CrossRef]
33. Ren, L.; Yang, W.W.; Tang, Y.; Zhang, H.-J.; Wu, Y. Diagnostic analysis of a snow-storm caused by explosivecyclone. J. Meteorol. Environ. 2015, 31, 45–52.
34. Ren, L.; Zhang, G.H.; Zhou, Y.H.; Zhao, N.; Wang, C.H. Study on dynamic system of explosive cyclonecausing a snow storm in Heilongjiang province. J. Meteorol. Environ. 2016, 32, 28–36.
35. Draxler, R.R.; Hess, G.D. An overview of the HYSPLIT-4 modelling system for trajectories, dispersion, anddeposition. Aust. Meteor. Mag. 1998, 47, 295–308.
36. Stein, A.F.; Draxler, R.R.; Rolph, G.D.; Stunder, B.J.B.; Cohen, M.D.; Ngan, F. NOAA’s HYSPLIT atmospherictransport and dispersion modeling system. Bull. Am. Meteorol. Soc. 2015, 96, 2059–2077. [CrossRef]
37. Zhao, Y.; Lan, X.; Yang, C.F. Radar echo and airmass structure of the comma head within a Jiang-Huai cyclonein winter. Acta Meteorol. Sin. 2018, 76, 726–741.
38. Zhao, Y.; Lan, X.; Yang, C.F. Analysis of the cloud characteristic and the mechanism of an extremerainfall-snowfall event associated with cyclones over Changjiang-Huaihe River basin. Plateau Meteorol. 2018,37, 1325–1340.
39. Sun, J.H.; Wang, H.J.; Wei, J. The sources and transportation of water vapor in persistent heavy rainfallevents in the Yangtze-Huaihe river valley. Acta Meteor. Sin. 2016, 74, 542–555.

Atmosphere 2020, 11, 1272 21 of 21
40. Fuhrmann, C.M.; Konrad, C.E. A trajectory approach to analyzing the ingredients associated with heavywinter storms in central North Carolina. Weather Forecast. 2013, 28, 647–667. [CrossRef]
41. Waugh, D.W.; Sobel, A.H.; Polvani, L.M. What Is the Polar Vortex and How Does It Influence Weather?Bull. Am. Meteorol. Soc. 2017, 98, 37–44. [CrossRef]
42. Barnes, E.A. Revisiting the evidence linking Arctic amplification to extreme weather in midlatitudes. Geophys.Res. Lett. 2013, 40, 4734–4739. [CrossRef]
43. Tian, S.C.; Liu, S.H. Daignostic study of a rapidly developing cyclone in spring. Acta Meteor. Sin. 1988, 46,285–293.
44. Wetzel, S.W.; Martin, J.E. An operational ingredients-based methodology for forecasting midlatitude winterseason precipitation. Weather Forecast. 2001, 16, 156–167. [CrossRef]
45. Petterssen, S. Contribution to the theory of frontogenesis. Geofys. Publ. 1936, 11, 27.46. Novak, D.R.; Waldstreicher, J.S.; Keyser, D.; Bosart, L.F. A forecast strategy for anticipating cold season
mesoscale band formation within fastern U. S. cyclones. Weather Forecast. 2006, 21, 3–23. [CrossRef]47. Novak, D.R.; Colle, B.A.; McTaggart-Cowan, R. The role of moist processes in the formation and evolution
of mesoscale snowbands within the comma head of northeast U. S. cyclones. Mon. Weather Rev. 2009, 137,2662–2686. [CrossRef]
48. Miller, J.E. On the concept of frontogenesis. J. Meteorol. 1948, 5, 169–171. [CrossRef]
Publisher’s Note: MDPI stays neutral with regard to jurisdictional claims in published maps and institutionalaffiliations.
© 2020 by the authors. Licensee MDPI, Basel, Switzerland. This article is an open accessarticle distributed under the terms and conditions of the Creative Commons Attribution(CC BY) license (http://creativecommons.org/licenses/by/4.0/).