case study of an improved online coal … · 2016-09-26 · case study of an improved online coal...
TRANSCRIPT
CASE STUDY OF AN IMPROVED ONLINE COAL ANALYSIS SYSTEM
Anthony Garaventa, NRG, Conemaugh Power Station, USA Mike Santucci, ECG Engineering Consulting Group, Akron, OH, USA
Albert Klein, IPCI Indutech Process Controls Inc., Akron, OH, USA Abstract
To improve the coal handling facility at a power-station, an online analysis of the coal along with a stockpile management program is needed to generate optimal blends. After installing the first XRF online coal analyzer in 1998 at DTE Monroe power-plant, Indutech® continuously improved the patented technology. This resulted in the OXEA® Online X-ray Elemental Analyzer. The newest generation is now installed at Conemaugh Generation Station which is operated by NRG Energy. This XRF-analyzer in combination with the PMD Microwave moisture meter is able to determine Ash, Sulphur, BTU and Moisture content as well as ash viscosity and fusion temperatures. The improvements of OXEA allow the power-plant to control and meet environmental tolerances to a higher precision than had been previously possible. The installation of the analyser along a bypass belt allows for periodic calibration based on the results of secondary samples, which are taken by an automated sampling system and analysed in the laboratory. This semi-automatic system allows batch verification of the analyzer and recalibration, if necessary. The assortment of coal qualities and costs makes enhanced fuel management apparent if the economic opportunities are to be realized. The integration of state of the art, computer capabilities, real-time fuel analysis, fuel flow modeling, understanding of coal combustion characteristics and operational experience has prompted ECG to develop a fuel management tool; AccuTrack. With this tool adaptation to the Conemaugh Station, fuel quality and quantity are tracked through receiving, storage, reclaim, blending (if required) and loading to the boiler to optimize time-dependent dispatch economics, demand capability and reliability. AccuTrack also provides detailed operator information regarding controllable real-time and projected fuel/combustion parameters. Keywords
Online measurement, moisture, ash content, calorific value, elemental analysis, Sulphur, heavy elements, Mercury, XRF, microwaves, stockpile management.
Introduction
In a coal fired power station it has been sufficient to measure the relevant parameters of coal, as the moisture and ash content along the calorific value, and to display the readings in the control room. Today more challenging environmental regulations and the need for additional fuel flexibility, requires additional coal parameters. In this context, accurate online coal analysis becomes more important. It must measure BTU, Sulphur content and moisture as well as ash viscosity and fusion temperatures. Additionally specific key elements become paramount for power generating stations, including Sodium, Chlorine, Arsenic, and heavy elements such as Mercury.
Online analyzers generally do not comply with ISO
standards. This is mostly due to the slow testing methods. Online analyzers are designed to measure indirectly. The measured variables are mainly influenced by the quantity of interest (measuring parameter), but in some extent by other quantities, which disturb the measurement. Because of the influence of the disturbing parameters, a product-specific calibration and a check of the analyser from time to time is necessary. This is accomplished by comparing the online -analyzer data with accurate data obtained in another way. Usually the comparison is done with verified laboratory
values of samples taken from the measured material stream at the specified time. Both requirements can be met utilizing an automatic sampling system. The Measuring set-up
An Online X-ray Elemental Analyzer, which measures
elements with the atomic number 10 (Na) and above is used in conjunction with a Precision Microwave Device (InduTech PMD 2450) for moisture.
The sampling system Conemaugh Generating Station bypasses a portion of
the main coal flow via a sample system. The start-up and maintenance of the analyzer on the bypass-belt is safe, easy and fast. Should the analyzer be installed on a main belt, maintenance requires having to shut the belt down to facilitate analyzer access and potentially risking plant operations. The optimal XRF analyzer installation includes a bypass system with associated sample system. The material is taken from the main belt with the automatic sampling system, material is passed through a crusher to get a particle size < 3/8”. The crushed material is conditioned on the measuring belt to deliver the ideal measuring geometry. At the end of the measuring belt is the secondary

sampler to cut samples, which are sent to a certified laboratory for analysis.
The measuring-belt has two side guides with a height of
about 8”. The Sensor unit of the OXEA is sitting between these guides. Maintenance is therefore difficult and requires the analyzer to be lifted. To make this easier, a pneumatic lift is installed. In the lifted position the service door of the sensor unit can be opened. Fig .1 shows the OXEA analyzer with the pneumatic lift.
Online elemental analysis The Indutech OXEA® 3000 Online X-ray Elemental
Analyzer was completely redesigned based on the patented prototype of the X-ray Coal Analyzer. In 1997, Indutech first demonstrated the use energy-dispersive XRF for online applications measuring low elements such as sulphur. The prototype was installed at DTE’s Monroe Power Plant in 1998 and successfully tested.
Fig. 1: OXEA on a bypass with an pneumatic lift. (Conemaugh installation)
Fig. 2: Spectrum of table salt measured with OXEA 3000 with an improved sensitivity for the low elements.
The OXEA line has been continuously improved to
meet to todays specifications, including the excellent detection limit of the low elements and is protected by several patents. A spectrum of table salt obtained with the newest OXEA 3000 is shown in Fig. 2. to demonstrate that sodium can be measured with the OXEA 3000 analyzer.
The peak left of Na is the ESC-Peak of chlorine and was erroneously interpreted as Na in some publications. This created the rumour that Na can directly be detected with a standard online EDXRF device without these modifications. However, even with these modifications it is difficult to measure Na at lower concentrations under online conditions. Mg, Al, Si und S peaks are prevalent in the coal spectrum of Fig. 3, obtained with the newest model of the OXEA 3000.
Fig.3: Coal spectrum obtained with an OXEA 3000 optimized for low elements.
The OXEA 3000, including the type recognition software is described in detail (Klein, Ma, Rullang, 2010).
The elements Mg-Fe are needed to determine the ash
and sulphur content. Together with a moisture measurement the calorific value can be determined.
Online Microwave moisture measurement At Conemaugh we have installed the Indutech PMD
2450 moisture meter, which is based on the measurement of the attenuation and phase-shift of a microwave beam transmitted through a material layer (Klein, 1981). This technique has been proven over the years and today is widely accepted as the best method to determine the moisture content of coal. On a main belt, the material layers are typically 100 to 200 mm. These material layer thicknesses are ideal for the microwave transmission method; however, the obtained accuracy is often diminished due to large particle size.
To insure the highest accuracy, the microwave moisture meter should be installed on a bypass system. Here the material can be crushed and the maximum particle size is small. Also the particle size distribution is rather constant. Therefore, the installation at a bypass-belt provides ideal conditions for a microwave moisture measurement.. However, the layer thickness of about 30 mm is rather low and the long-term stability of the existing moisture analyzer, based on microwave transmission technique, is not sufficient to measure such thin layers. The long-term accuracy of any transmission-type microwave moisture meter is reduced by time and temperature effects. Both effects are remarkably reduced with Indutech’s novel microwave moisture meter PMD 2500 (patented), which is

under development. Comparisons of the technical data are given in Table 1. This shows that the accuracy of the PMD 2500 is improved by a factor of 3-4. The improved temperature and long-term stability of the novel microwave moisture meter enables the measurement to be taken at coal layers with a thickness of about 3 cm. The PMD 2500 will be available within the third quarter of 2014. The PMD 2500 will be installed in Conemaugh as soon as possible to replace the PMD 2450.
PMD 2500 PMD 2450 Improvement Frequency range 1.4 – 4.4 2.4-4.4 GHz Factor 5 Accuracy Phase 0.5°/GHz 2°/GHz Factor 4 Acc. attenuation 0.1 dB 0.3 dB Factor 3 Noise level -120 dBm -90 dBm Factor 1000
Table 1: Specifications of PMD 2500 and PMD 2450 The installation of the PMD 2500 will directly improve
the accuracy of the Btu/lb. Furthermore we also expect an improvement of the Sulfur accuracy, because the moisture content has an influence on the spectra especially for the low elements Al to Cl.
The experience with the Conemaugh installation.
Over 20 OXEA are installed worldwide. The
Conemaugh installation is the first OXEA installation in North America. Therefore, the plant was very cautious and a sophisticated performance test procedure was defined.
Performance test procedure The specifications were limited to the 2 most important
parameters: Sulfur: 0.2% over the range 1.7 % to 3.2 % Btu/lb: 180 over the range 11,000 to 13,000 Btu/lb
The installation was accompanied with intensive tests
and milestones: • The setup was erected off-site and inspected. • Analyzed samples were delivered and a first
calibration was completed. Blind samples were measured to check, if the analyzer meets the arranged accuracy. When the first test was successful we could begin installation and commissioning of the analyzer at the bypass-belt.
• Initial analyzer acceptance test: 30 samples were taken with the secondary sampler with an interval of 1 minute over a period of 50 minutes, (i.e. for each sample 50 cuts with the secondary sampler) were taken. The samples were collected as fast as a full range of coal quality could be presented to the analyzer. The collected samples were sent to a certified lab for analysis. Once this test was successfully passed, the second online test (continuing performance) period started.
• The continuing performance test is a long-term test and will run over a 24 month period. Approximately once a week, plant personnel will take a 50 minute secondary sample. During the 24 month period, a rolling 30 sample average will be maintained. Performance test milestones are after 8, 16 and 24 months. BTU and sulfur must be maintained within the parameters above in-order to pass the test. During the continuing performance test the crusher will be checked monthly, to guarantee the performance of the sampling system.
Results
The analyzer was installed in August / September 2013.
We have successfully passed the initial performance test and the 8 month milestone. The 16 month and 24 month milestones will be in early 2015 and late autumn of 2015.
Semi-automatic bypass installation The Conemaugh bypass installation allows for semi-
automatic control of the analyzer. Semiautomatic means, that the samples are mechanically taken with the secondary sampler, but the container to collect the sample must be changed manually and the sampler must manually started and the samples must be brought in the laboratory for standard analysis. Such a system is self-sufficient, (i.e. we don´t need additional information about the process). The advantage of such a self-sufficient analyzer system is that it can be installed everywhere, power stations, preparation plants, mines, steel and coking plants etc.
Continuous verification using process data In the special case of a power station, ECG introduced a
method to check the analyzer in real time by building a database collecting all available coal transfer and process data. For this comparison the delay between the different measuring points must be taken in account which requires the modelling of delay times between conveyors and the material flow in a silo or bunker. In this context, the analyzer readings can be compared with the results of the plants heat balance and CEMS (Heat Input and SO2) in the flue gas entering the FGD equipment. Finally the OXEA will be trim calibrated between regular semi-automatic calibration intervals (typically 6 months to one year). This is a precondition to control the process to meet ever-changing fuel strategies which include more flexibility to burn a wider variety of coals while mitigating the impacts of the mineral matter. Figure 4 below shows an overview of the Conemaugh yard.

Figure 4 Coal Yard Overview
The data summary above includes both graphical and tabular displays providing a real-time status of the current Plant fueling status.
Coal Flow Modeling
Coal flow modeling is by far the greatest challenge in the verification method. There are several different models available for predicting coal flow in a bunker. The four main types considered for implementation in AccuTrack software were: Plug flow, Discrete Element Modeling (DEM), Void Model and the Stochastic Model. The plug flow model is the simplest case and uses the classic FIFO – first in, first out –a flow without mixing and the standard for accounting convenience. The plug flow model might be justified under some conditions; when the fuel loaded to the bunker is uniform , the bunker capacity is small or the height-to-planer area is high (as in a tall, slender silo). The DEM method is the most accurate method of modeling granular flow. A DEM model will generally consist of volume of spheres subject to the following forces; friction, collision, cohesion, damping and gravity. However, the DEM modeling is complex and processor intensive, a single computation might take several hours or days. The void model is based on void creation as the material is discharged from the bottom of the bin or bunker but it does not consider the interactive physical forces between the particles. Although fast enough for real-time simulation of granular flow, the model does not accurately capture the flow pattern with excessive mixing that increases with time. Stochastic model is an event-driven, probability-based model that closely captures the flow pattern without being computation intensive. The AccuTrack software implements a simplified version of the stochastic model and has been validated in both scale model and field tests. The AccuTrack model very closely predicts the flow patterns in a bunker, is stable over time and has the following attributes:
• The results closely match the DEM results but require only a fraction of the run time,
• It does not produce the excessive particle mixing as in the void model and
• The model produces highly accurate results verified by field tests.
Figure 5. To the left, the loading of the bunker at time T=0 hrs. The graph on the right illustrates the proportional contribution of the two different fuels at the bunker outlet. The following sequence “A” is based on the FIFO and “B” sequence is the AccuTrack stochastic model.
Figure 6-A, B. On the left, FIFO flow with distribution and constituents at the outlet at T=2.5 hrs. On the right, AccuTrack stochastic flow with distribution and constituents at the outlet at T=2.5 hrs

Figure 7-A, B. . On the left, FIFO flow with constituent contribution at the bunker outlet at T=7.5 hrs. On the right, AccuTrack stochastic flow with distribution and constituents at the outlet at T=7.5 hrs
Figure 8. Illustration showing field test validation and
results of bunker fuel flow model. Validation of Bunker Modeling Development of a bunker flow model from the multi-dimensional scale model apparatus must be calibrated with real-world data. The illustration of figure 12 shows the validation test setup and results using RFID transponder chips in a field test of the model. The RFID chips were placed in the bunker at a specific time, at predetermined locations and atop the coal with known elevations and surface profile (inventory). These consumable RFID chips were of such size and character as to be identical with a comparable coal particle at the same location and with every expectation that they would follow a similar flow path.
The individually identified RFID chips were recorded with a time stamp as they passed through the belt of the respective feeders. Of the chips projected to arrive within eight hours, over 95% were recorded by the feeder scanners, a recording rate that was thought to be very good. Those chips whose projection of arrival over eight hours might have been in “dead zones” in close proximity to the bunker walls. The test results of figure 12 comparing the expected arrival with the actual time stamp and are shown in both tabular and graphical format. The calculated chip arrivals as calculated by the AccuTrack program take into account the subsequent fuel loading and the flow rate to the feeders. The very close agreement of the site specific computer output with the actual time stamp can be noted and the small differences might be attributed to the randomness of the particle flow path within the bunker. Bunker Model Upgrade The Stochastic model is planned to be replaced by a new and improved model based on continuum mechanics. This new model addresses the drawbacks of the stochastic model, namely the free surface behavior, complex geometries and more accurate flow pattern allowing accurate prediction of mixing of different types of coal. Additionally the model will not require RFID testing to be performed since it encompasses the physical properties of the material. This work is being planned out in collaboration with the MIT group of Prof. Ken Kamrin.
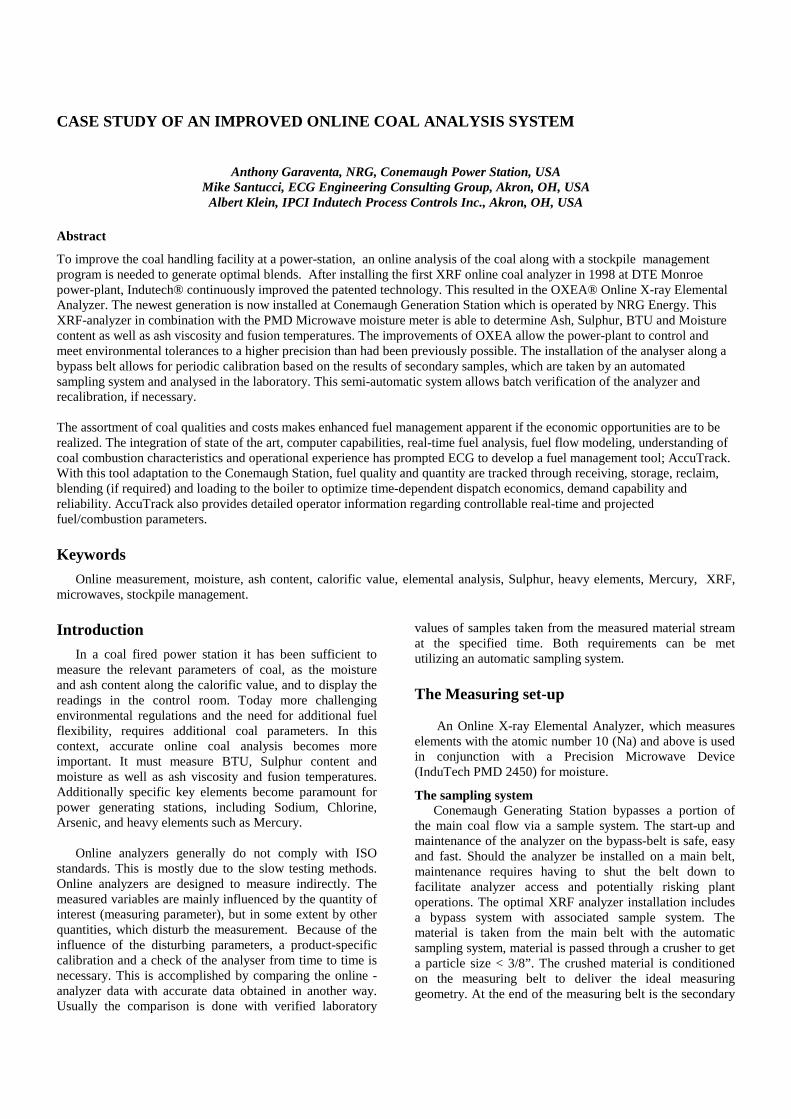
Figure 9. Typical flow pattern inside a silo. (Samadani and Kudrolli 2002) Ref: http://physics.clarku.edu/~akudrolli/silo.html
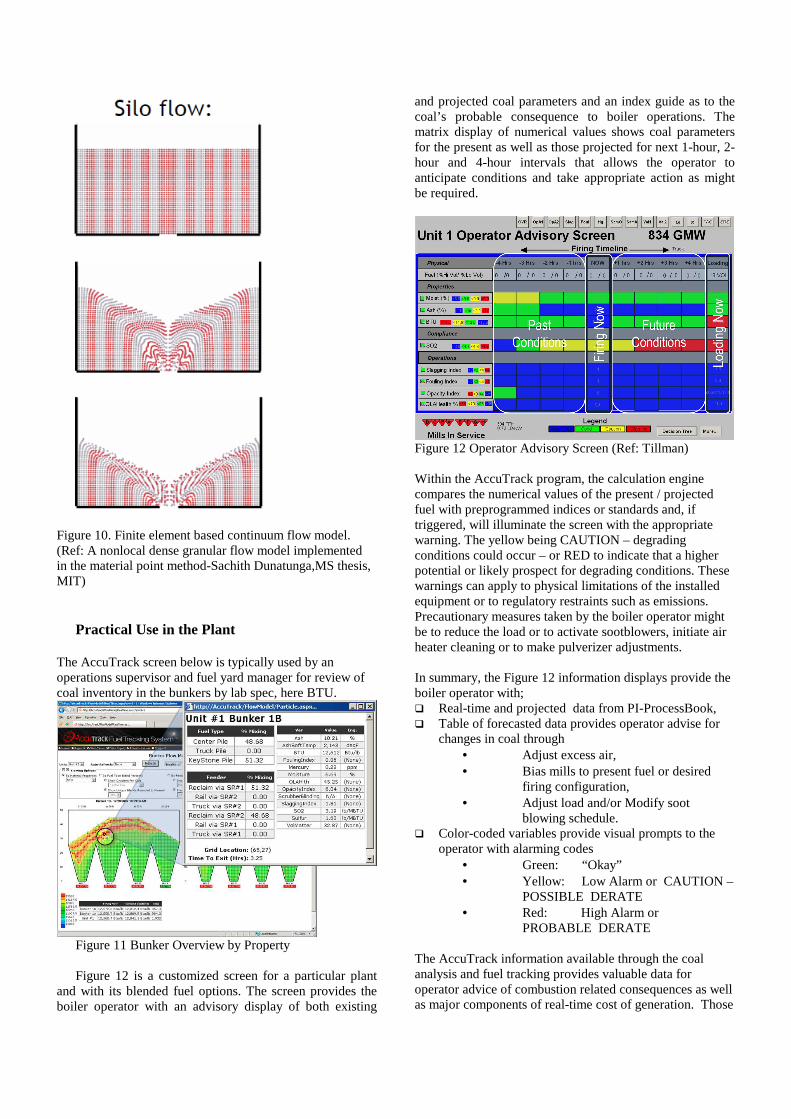
Figure 10. Finite element based continuum flow model. (Ref: A nonlocal dense granular flow model implemented in the material point method-Sachith Dunatunga,MS thesis, MIT)
Practical Use in the Plant
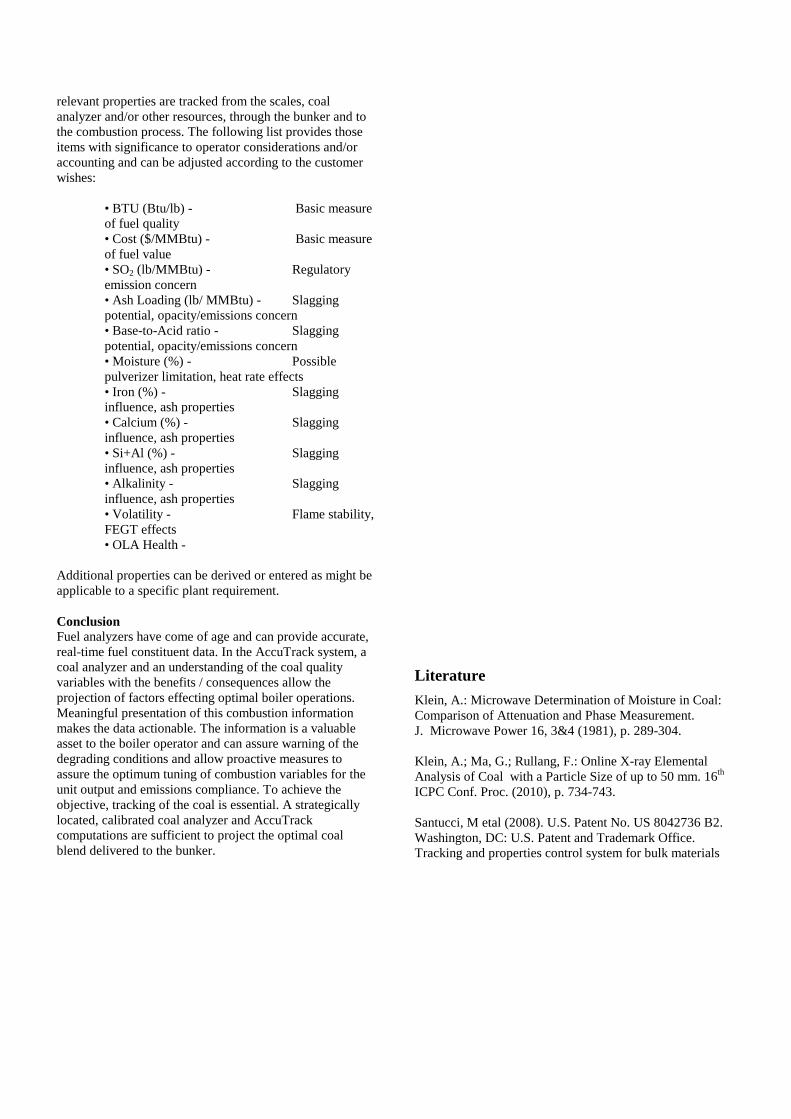
The AccuTrack screen below is typically used by an operations supervisor and fuel yard manager for review of coal inventory in the bunkers by lab spec, here BTU.
Figure 11 Bunker Overview by Property Figure 12 is a customized screen for a particular plant
and with its blended fuel options. The screen provides the boiler operator with an advisory display of both existing
and projected coal parameters and an index guide as to the coal’s probable consequence to boiler operations. The matrix display of numerical values shows coal parameters for the present as well as those projected for next 1-hour, 2-hour and 4-hour intervals that allows the operator to anticipate conditions and take appropriate action as might be required.
Figure 12 Operator Advisory Screen (Ref: Tillman) Within the AccuTrack program, the calculation engine compares the numerical values of the present / projected fuel with preprogrammed indices or standards and, if triggered, will illuminate the screen with the appropriate warning. The yellow being CAUTION – degrading conditions could occur – or RED to indicate that a higher potential or likely prospect for degrading conditions. These warnings can apply to physical limitations of the installed equipment or to regulatory restraints such as emissions. Precautionary measures taken by the boiler operator might be to reduce the load or to activate sootblowers, initiate air heater cleaning or to make pulverizer adjustments.
In summary, the Figure 12 information displays provide the boiler operator with; � Real-time and projected data from PI-ProcessBook, � Table of forecasted data provides operator advise for
changes in coal through • Adjust excess air, • Bias mills to present fuel or desired
firing configuration, • Adjust load and/or Modify soot
blowing schedule. � Color-coded variables provide visual prompts to the
operator with alarming codes • Green: “Okay” • Yellow: Low Alarm or CAUTION –
POSSIBLE DERATE • Red: High Alarm or
PROBABLE DERATE The AccuTrack information available through the coal analysis and fuel tracking provides valuable data for operator advice of combustion related consequences as well as major components of real-time cost of generation. Those
relevant properties are tracked from the scales, coal analyzer and/or other resources, through the bunker and to the combustion process. The following list provides those items with significance to operator considerations and/or accounting and can be adjusted according to the customer wishes:
• BTU (Btu/lb) - Basic measure of fuel quality • Cost ($/MMBtu) - Basic measure of fuel value • SO2 (lb/MMBtu) - Regulatory emission concern • Ash Loading (lb/ MMBtu) - Slagging potential, opacity/emissions concern • Base-to-Acid ratio - Slagging potential, opacity/emissions concern • Moisture (%) - Possible pulverizer limitation, heat rate effects • Iron (%) - Slagging influence, ash properties • Calcium (%) - Slagging influence, ash properties • Si+Al (%) - Slagging influence, ash properties • Alkalinity - Slagging influence, ash properties • Volatility - Flame stability, FEGT effects • OLA Health -
Additional properties can be derived or entered as might be applicable to a specific plant requirement. Conclusion Fuel analyzers have come of age and can provide accurate, real-time fuel constituent data. In the AccuTrack system, a coal analyzer and an understanding of the coal quality variables with the benefits / consequences allow the projection of factors effecting optimal boiler operations. Meaningful presentation of this combustion information makes the data actionable. The information is a valuable asset to the boiler operator and can assure warning of the degrading conditions and allow proactive measures to assure the optimum tuning of combustion variables for the unit output and emissions compliance. To achieve the objective, tracking of the coal is essential. A strategically located, calibrated coal analyzer and AccuTrack computations are sufficient to project the optimal coal blend delivered to the bunker.
Literature
Klein, A.: Microwave Determination of Moisture in Coal: Comparison of Attenuation and Phase Measurement. J. Microwave Power 16, 3&4 (1981), p. 289-304. Klein, A.; Ma, G.; Rullang, F.: Online X-ray Elemental Analysis of Coal with a Particle Size of up to 50 mm. 16th ICPC Conf. Proc. (2010), p. 734-743. Santucci, M etal (2008). U.S. Patent No. US 8042736 B2. Washington, DC: U.S. Patent and Trademark Office. Tracking and properties control system for bulk materials