case study of developing a hydrogen vehicle … · * once fuel cell cars were introduced, hydrogen...
TRANSCRIPT
-~-
DRAFT
PLEASE DO NOT QUOTE OR CITE WITHOUT PERMISSION OF AUTHOR
CASE STUDY OF DEVELOPING A HYDROGEN VEHICLEREFUELING INFRASTRUCTURE
IN SOUTHERN CALIFORNIA
Joan M. Ogden,Adam B. Cox, Jason W. White
Center for Energy and Environmental StudiesPrinceton UniversityPrinceton, NJ 08544
October 14, 1996
--~="'-"--=
TABLE OF CONTENTS
SUMMARY
1.0. CASE STUDY OF DEVELOPING A HYDROGEN VEHICLE REFUELINGINFRASTRUCTURE IN SOUTHERN CALIFORNIA
APPENDIX I.A. CAPITAL COST AND PERFORMANCE ASSUMPTIONSFOR CENTRALIZED HYDROGEN PRODUCTION SYSTEMS, DISTRIBUTIONSYSTEMS AND REFUELING STATIONS
ABSTRACT
TABLE OF CONTENTS
SUMMARY
1.0. CASE STUDY OF DEVELOPING A HYDROGEN VEHICLE REFUELINGINFRASTRUCTURE IN SOUTHERN CALIFORNIA
APPENDIX I.A. CAPITAL COST AND PERFORMANCE ASSUMPTIONSFOR CENTRALIZED HYDROGEN PRODUCTION SYSTEMS, DISTRIBUTIONSYSTEMS AND REFUELING STATIONS
ABSTRACT
~
'-
LIST OF FIGURES
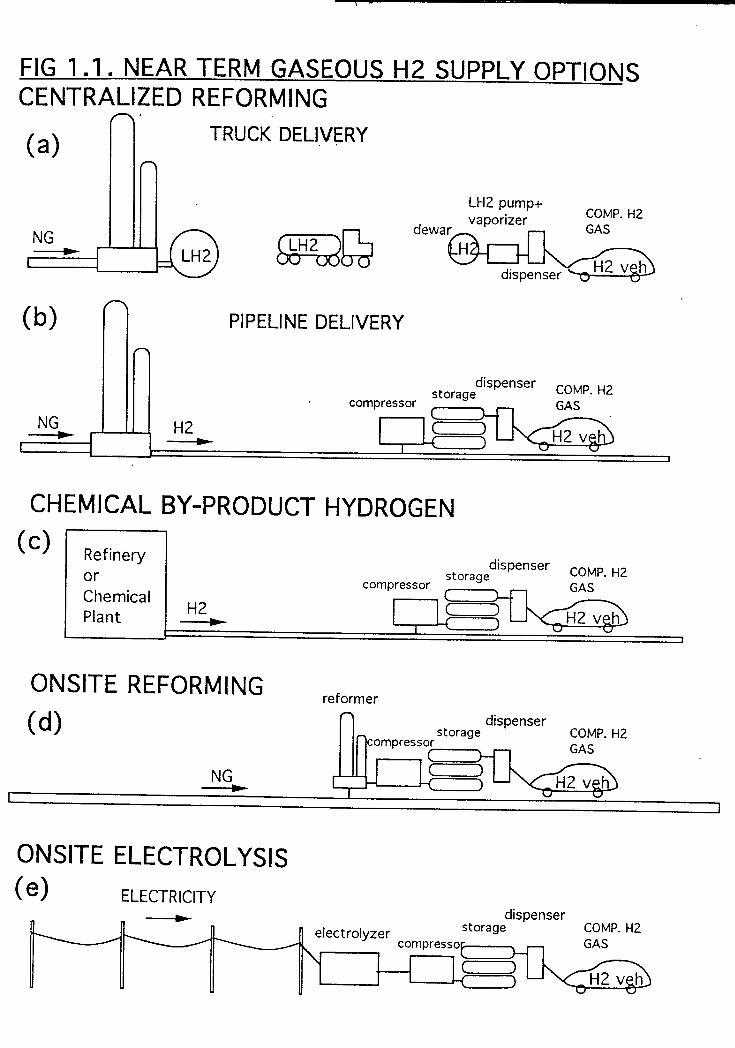
Figure 1.1. Near term options for Producing and Delivering HydrogenTransportation Fuel
Figure 1.2. Cumulative number of ZEV automobiles mandated for theLA Basin under the original and revised ZEV mandates.
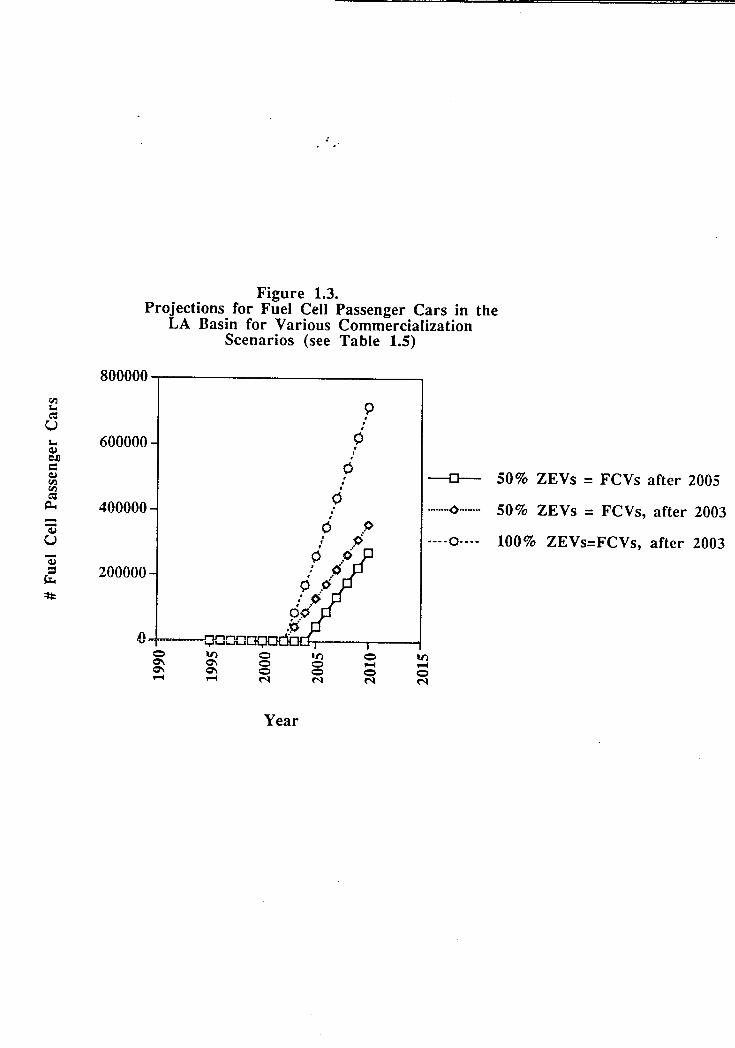
Figure 1.3. Projected number of fuel cell vehicles for three possiblecommercialization scenarios (see Table 1.4).
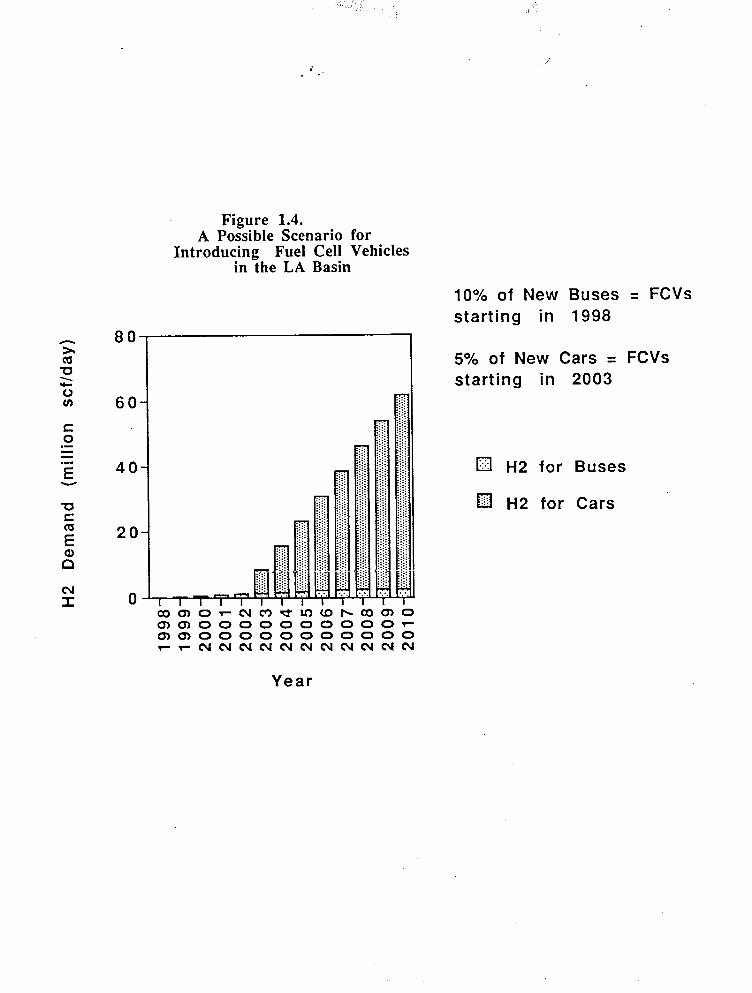
Figure 1.4. Projected hydrogen demand for fuel cell vehicles in theLos Angeles Basin 1998-2010 for Scenario I (see Table 1.4).
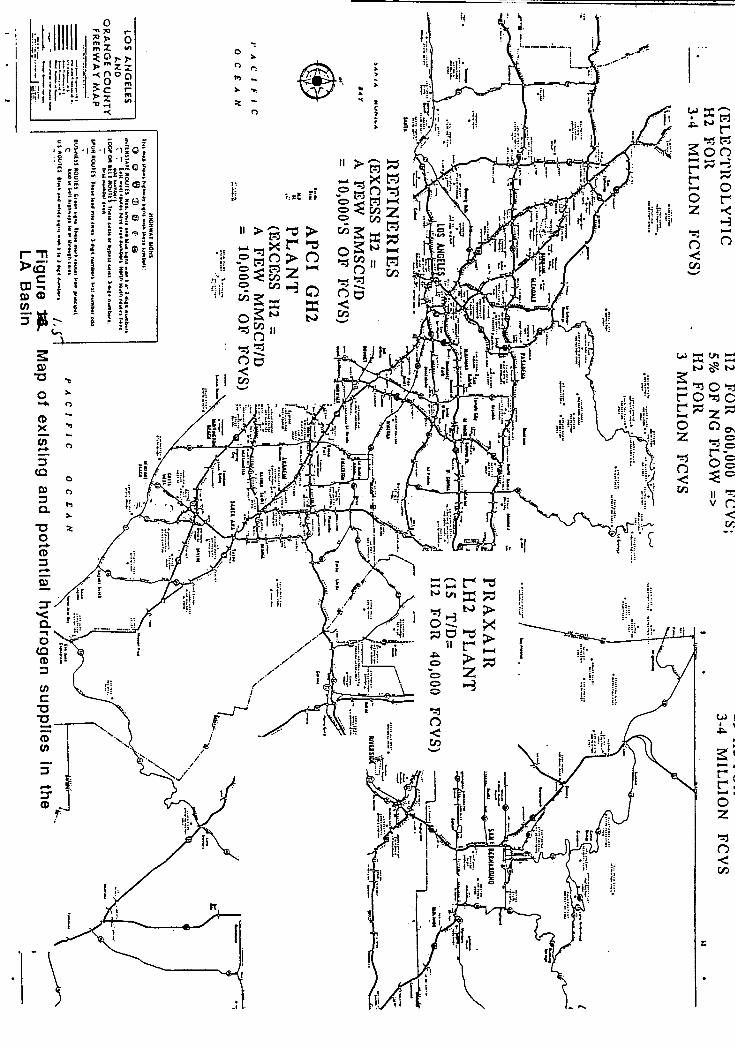
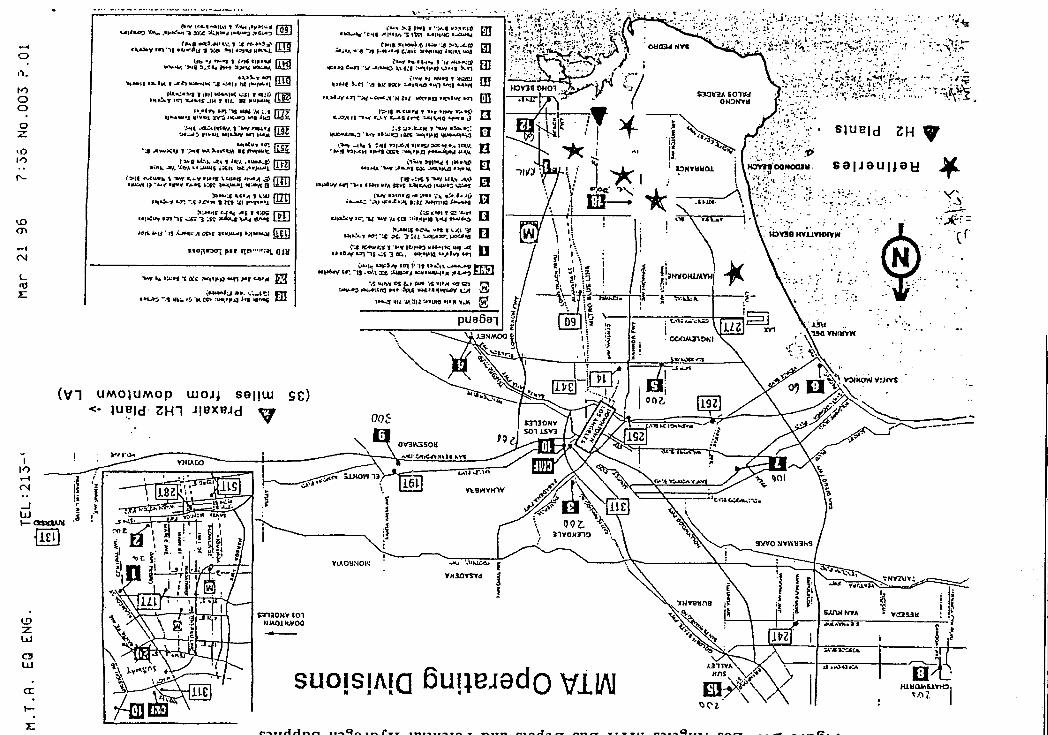
Figure 1.5. Map of existing and potential hydrogen supplies in t4eLos Angeles Basin
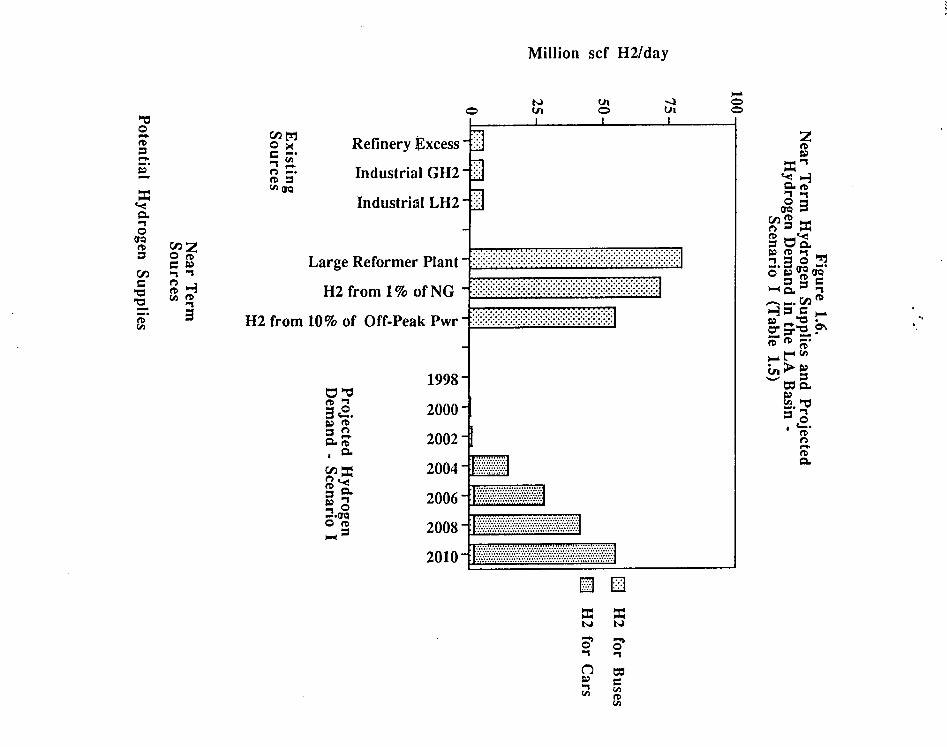
Figure 1.6. Near term hydrogen supplies and projected hydrogendemand for ZEVs in the Los Angeles Basin
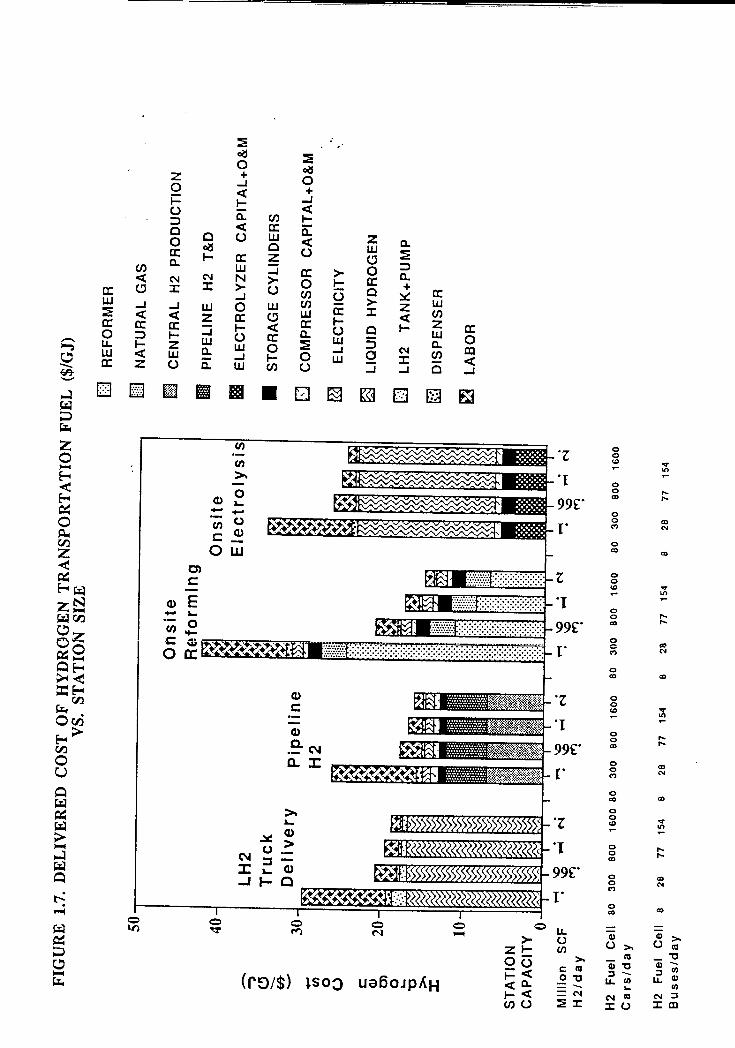
Figure 1.7. Delivered cost of hydrogen transportation fuel inSouthern California.
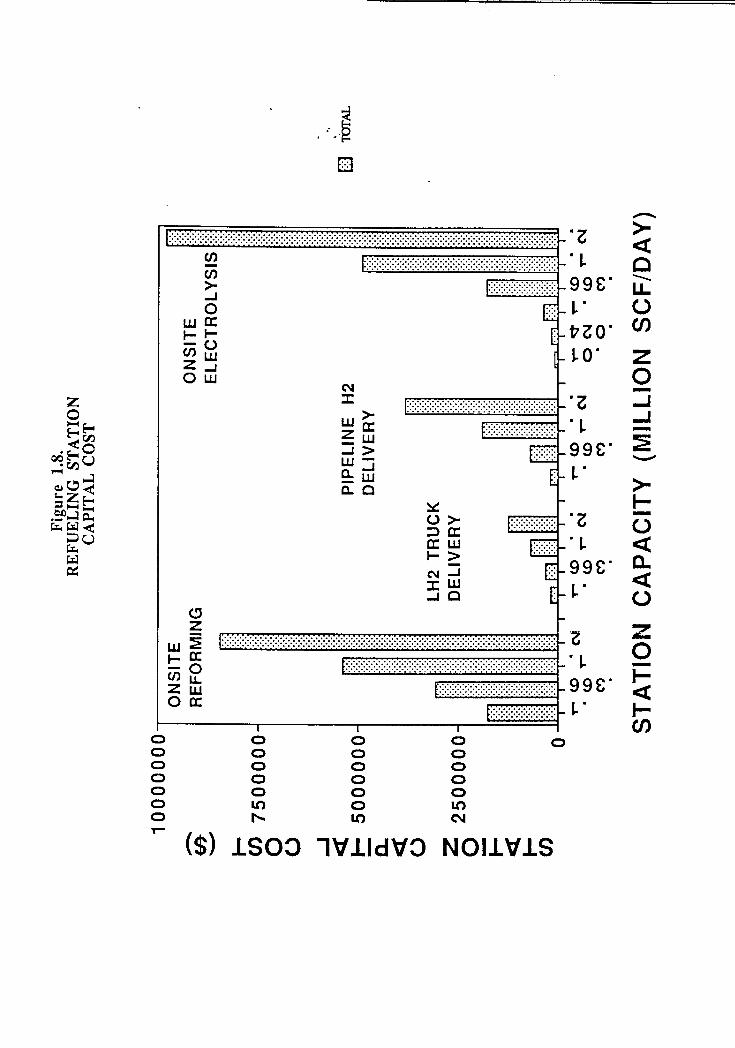
Figure 1.8. Capital cost of hydrogen alternative designs for hydrogenrefueling stations.
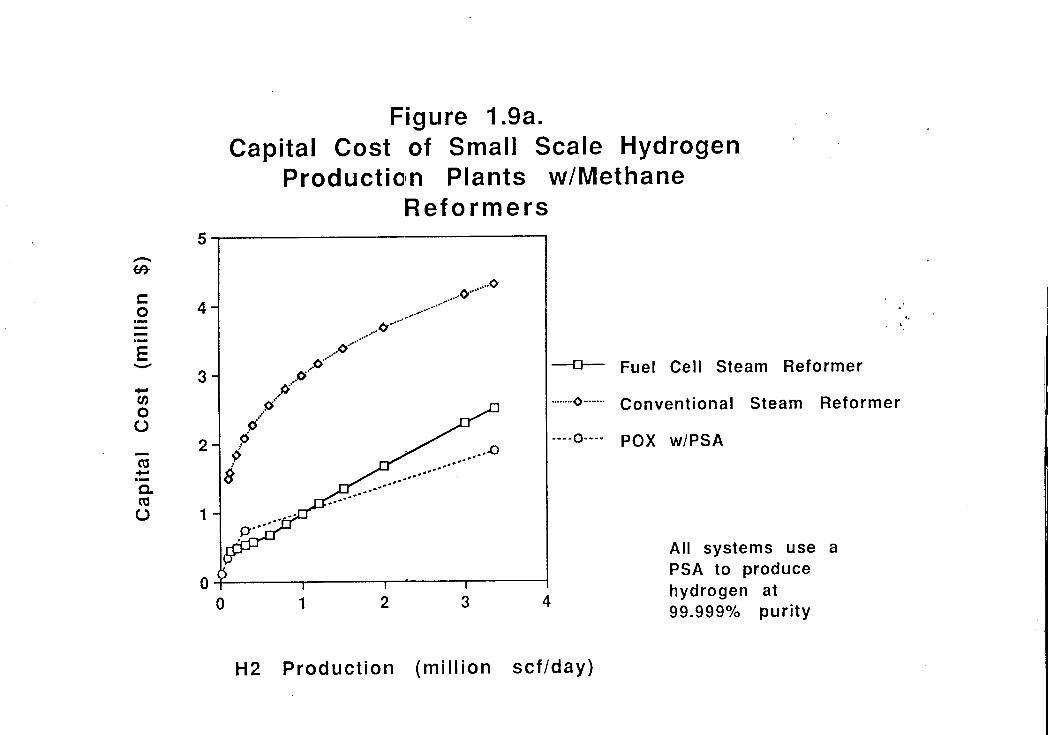
Figure 1.9a. Capital cost of small scale hydrogen plants using"conventional" and "fuel cell type" steam methane reformers.
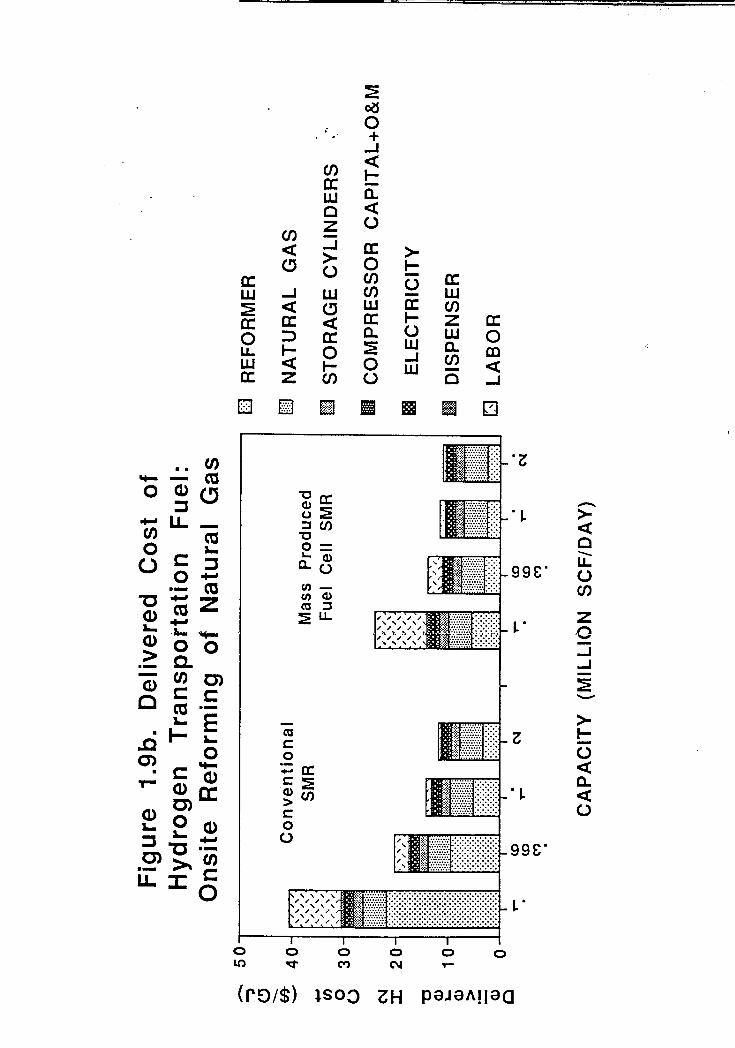
Figure 1.9b. Delivered Hydrogen cost from onsite reforming usingsmall scale "conventional" and "fuel cell type" steam methanereformers.
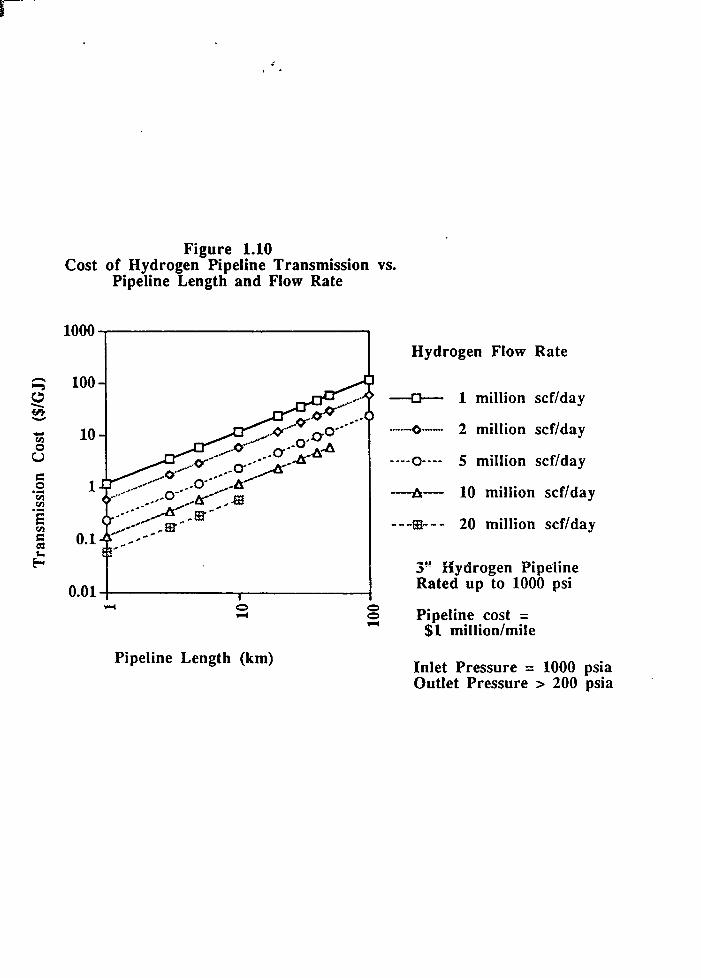
Figure 1.10 Cost of hydrogen pipeline transmission vs. pipelinelength and flow rate.
Figure 1.11. Lifecycle cost of transportation for PEM fuel cell andDiesel buses.
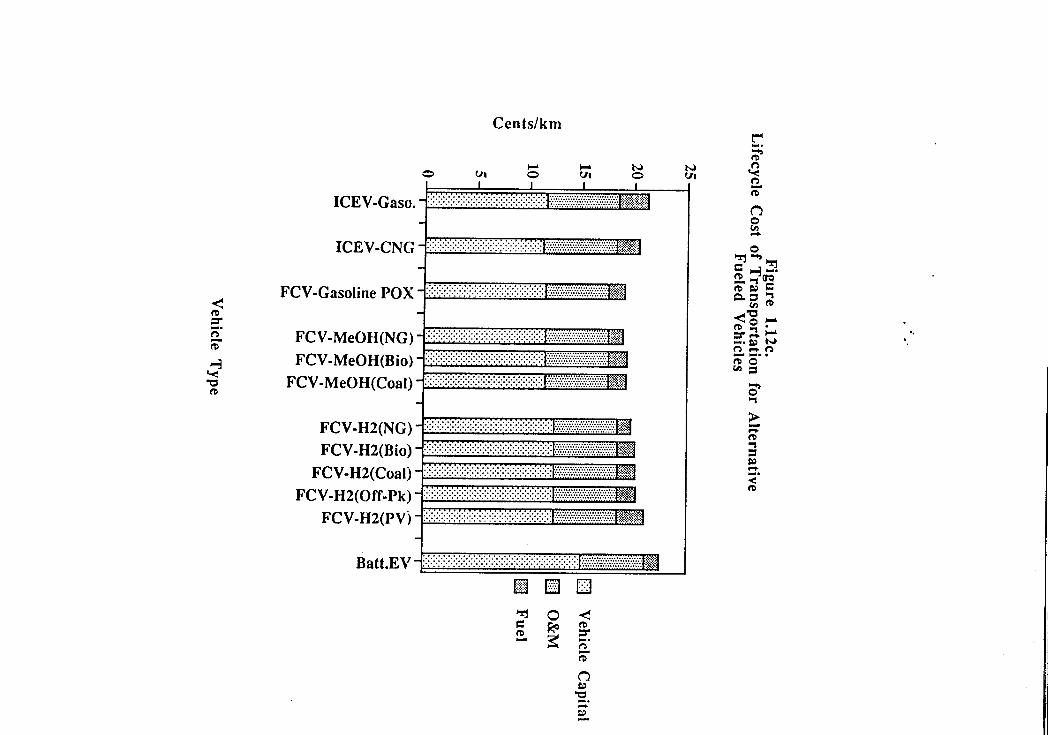
Figure 1.12. Lifecycle cost of transportation for PEM fuel cellautomobiles compared to other alternative vehicles.
'---
-~---
Figure 1.13. Bus stations in the LA area and potential hydrogen
supplies.
--'
"
LIST OF TABLES
Table 1.0. Conversion Factors and Economic Assumptions
Table 1.1. Data And Projections For Vehicle Populations, FuelEconomy, Annual Mileage And Energy Use For Passenger Cars, LightTrucks And Urban Buses In The South Coast Air Basin
Table 1.2. Original (1990) And Revised (1996) ImplementationRates For ZEV s In California.
Table 1.3. Projected Numbers Of ZEV Passenger Cars In The SouthCoast Air Basin 1995-2010
Table 1.4. Assumed Characteristics Of Fuel Cell Vehicles
Table 1.5. Possible Scenarios For Introduction Of Fuel Cell Vehicles InThe Los Angeles Basin
Table 1.6. Numbers Of ZEVs And Projected Hydrogen Demand (InMillion scf H2/Day) In The Los Angeles Basin For Three DemandScenarios
Table 1.7. Fuel Cell Vehicles And Hydrogen Use
Table 1.8. Assumed Energy Prices in Southern California Case Study
Table 1.9a. Capital Cost for Developing New Hydrogen Delivery andRefueling Station Infrastructure Serving a Total Fleet of 13,000 FCVCars, Delivering 2 million scf H2/day (assuming that existinghydrogen production capacity is used)
Table 1.9b. Capital Cost for Developing New Hydrogen Production,Delivery and Refueling Station Infrastructure Serving a Total Fleet of1 million Fuel Cell Cars, Delivering 153 million scf H2/day
Table 1.10. Comparison of Projected Vehicle Performance andLifecycle Cost
r
HYDROGEN ENERGY SYSTEMS STUDIES
Joan M. Ogden, Thomas Kreutz, Margaret Steinbugler,Adam B. Cox, Jason W. White
Center for Energy and Environmental StudiesPrinceton UniversityPrinceton, NJ 08544
SUMMARY
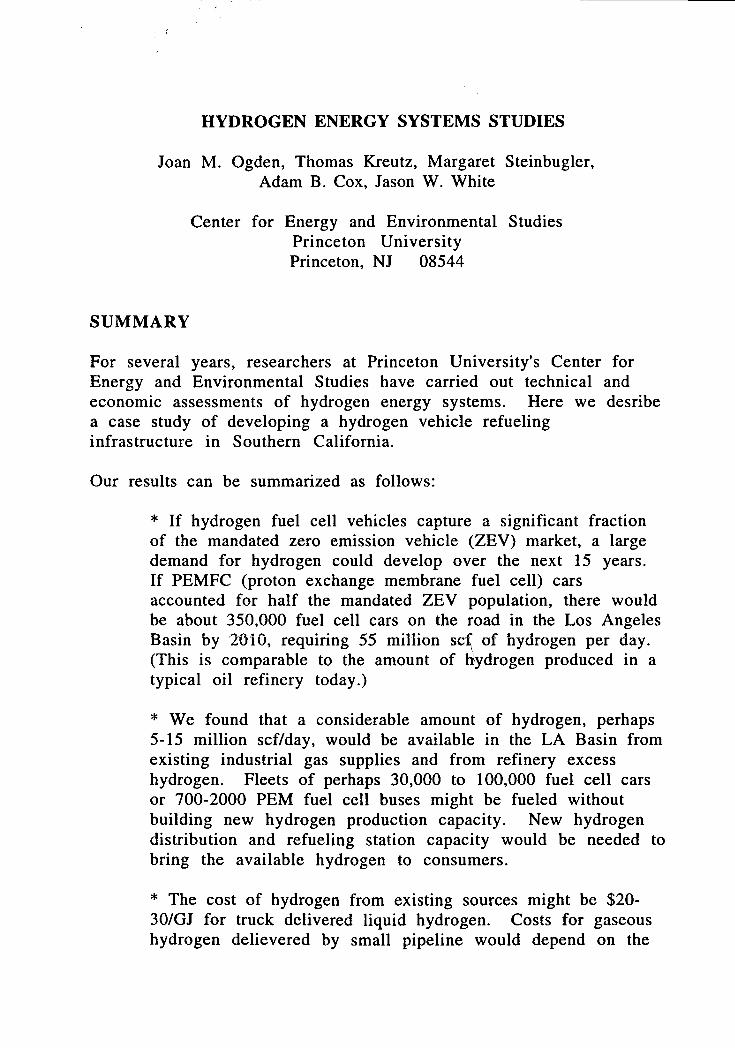
For several years, researchers at Princeton University's Center forEnergy and Environmental Studies have carried out technical andeconomic assessments of hydrogen energy systems. Here we desribea case study of developing a hydrogen vehicle refuelinginfrastructure in Southern California.
Our results can be summarized as follows:
* If hydrogen fuel cell vehicles capture a significant fraction
of the mandated zero emission vehicle (ZEV) market, a largedemand for hydrogen could develop over the next 15 years.If PEMFC (proton exchange membrane fuel cell) carsaccounted for half the mandated ZEV population, there wouldbe about 350,000 fuel cell cars on the road in the Los AngelesBasin by 2010, requiring 55 million sc~ of hydrogen per day.(This is comparable to the amount of Uydrogen produced in atypical oil refinery today.)
* We found that a considerable amount of hydrogen, perhaps
5-15 million scflday, would be available in the LA Basin fromexisting industrial gas supplies and from refinery excesshydrogen. Fleets of perhaps 30,000 to 100,000 fuel cell carsor 700-2000 PEM fuel cell buses might be fueled withoutbuilding new hydrogen production capacity. New hydrogendistribution and refueling station capacity would be needed tobring the available hydrogen to consumers.
* The cost of hydrogen from existing sources might be $20-
30/0J for truck delivered liquid hydrogen. Costs for gaseoushydrogen delievered by small pipeline would depend on the
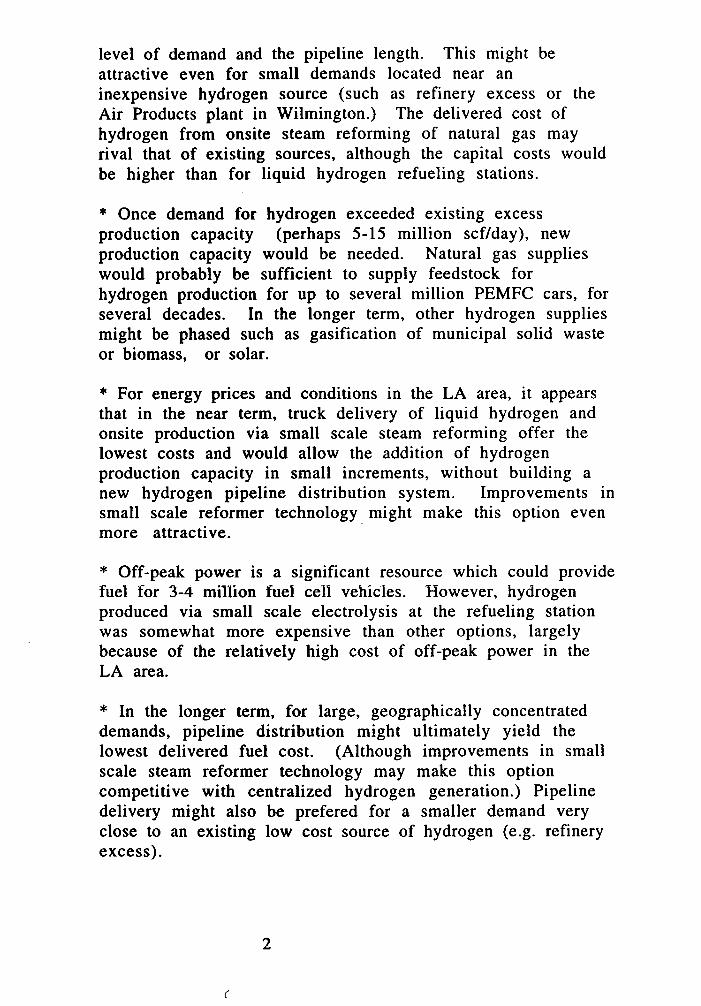
level of demand and the pipeline length. This might beattractive even for small demands located near aninexpensive hydrogen source (such as refinery excess or theAir Products plant in Wilmington.) The delivered cost ofhydrogen from onsite steam reforming of natural gas mayrival that of existing sources, although the capital costs wouldbe higher than for liquid hydrogen refueling stations.
* Once demand for hydrogen exceeded existing excess
production capacity (perhaps 5-15 million scf/day), newproduction capacity would be needed. Natural gas supplieswould probably be sufficient to supply feedstock forhydrogen production for up to several million PEMFC cars, forseveral decades. In the longer term, other hydrogen suppliesmight be phased such as gasification of municipal solid wasteor biomass, or solar.
* For energy prices and conditions in the LA area, it appears
that in the near term, truck delivery of liquid hydrogen andonsite production via small scale steam reforming offer thelowest costs and would allow the addition of hydrogenproduction capacity in small increments, without building anew hydrogen pipeline distribution system. Improvements insmall scale reformer technology might make this option evenmore attractive.
* Off-peak power is a significant resource which could provide
fuel for 3-4 million fuel cell vehic1es. However, hydrogenproduced via small scale electrolysis at the refueling stationwas somewhat more expensive than other options, largelybecause of the relatively high cost of off-peak power in theLA area.
* In the longer term, for large, geographically concentrated
demands, pipeline distribution might ultimately yield thelowest delivered fuel cost. (Although improvements in smallscale steam reformer technology may make this optioncompetitive with centralized hydrogen generation.) Pipelinedelivery might also be prefered for a smaller demand veryclose to an existing low cost source of hydrogen (e.g. refineryexcess).
2
(
* The first hydrogen vehicles in the LA Basin are likely to be
PEM fuel cell buses, which could be commercialized as earlyas 1998. Early bus demos might be fueled from existingsources (trucked in liquid hydrogen, or piped in hydrogen fordepots near the LA refinery area). Or they might use smallscale fuel cell type reformer systems now beingcommercialized for stand-alone hydrogen production.
* Once fuel cell cars were introduced, hydrogen production
from natural gas would offer the lowest costs for the nearterm. In the longer term, other local supplies might be phasedin such as hydrogen from wastes, biomass or solar. Or distantlow cost sources of hydrogen might be brought in via longdistance pipeline.
3
1.0. CASE STUDY OF DEVELOPING A HYDROGEN VEHICLEREFUELING INFRASTRUCTURE IN SOUTHERN CALIFORNIA
Joan M. Ogden, Adam B. Cox, Jason W. White
Center for Energy and Environmental StudiesPrinceton UniversityPrinceton, NJ 08544
1.1. INTRODUCTION
Many analysts suggest that the first widespread use of hydrogenenergy is likely to be in zero emission vehicles in Southern California.California's zero emission vehicle mandate requires that starting in2003, 10% of all new light duty vehicles must be zero emissionvehicles (ZEVs.) Over seven hundred thousand zero emissionautomobiles are projected for the Los Angeles Basin alone by 2010, ifmandated levels are implemented.
The only zero emission vehicle technologies likely to be ready in thistime frame are electric battery vehicles and fuel cell vehicles.Because of their longer range, faster refueling time and potential forlow cost in mass production, fuel cell vehicles are among the leadingcontenders in the emerging market for zero emission vehicles.
All fuel cells currently considered for road vehicles use hydrogen as-fuel. While hydrogen can. be produ-ced -onboard the vehicle byreforming methanol or gasoline, direct storage of compressed gaseoushydrogen has many attractions. The design of the vehicle is muchsimpler, the vehicle is more energy efficient, refueling can beaccomplished rapidly, and hydrogen can be produced from manysources. Several experimental fuel cell vehicles such as the Ballardbus and the Daimler-Benz mini-van employ compressed hydrogengas storage. Although the energy density of compressed hydrogengas is lower than liquid fuels, it is higher than that of electricbatteries (Arthur D. Little 1994). With high efficiency fuel cellvehicles, a travelling range of 400 km should be possible for a fuelcell automobile (Delucchi 1992).
The relative simplicity of the hydrogen fuel cell vehicle design mustbe weighed against the added complexity of a gaseous hydrogenrefueling infrastructure. Unlike gasoline, natural gas or electricity,
.
---~ hydrogen is not widely distributed to consumers today. Assuming
that hydrogen vehicles capture a significant fraction of the ZEVmarket, a large demand for hydrogen fuel could evolve over the nextfew decades.
Refueling a large number of hydrogen vehicles poses significantchallenges. The question is often asked "Where is the hydrogengoing to come from?" In this report, we attempt to answer thatquestion for a specific region, where fuel cell vehicles might beintroduced, the Los Angeles Basin.
There' are many ways of making and delivering hydrogentranpsortation fuel. In this study, we assess several near termoptions (see Figure 1.1) for producing and delivering gaseoushydrogen transportation fuel to users in Southern Californiaincluding:
* hydrogen produced from natural gas in a large, centralized
steam reforming plant, and truck delivered as a liquid torefueling stations,
* hydrogen produced in a large, centralized steam reforming
plant, and delivered via small scale hydrogen gas pipeline torefueling stations,
* hydrogen produced at the refueling station via small scale
steam reforming of natural gas,
* hydrogen produced via small scale electrolysis at the
refueling station,
* hydrogen from low cost chemical industry sources (e.g.
excess capacity in refineries which have recently upgradedtheir hydrogen production capacity, etc.).
To compare these alternatives, we address the following questions:
* What are projected hydrogen demands for ZEVs and
potential hydrogen supplies in the LA Basin?
* What is the refueling system capital cost and delivered cost
of hydrogen transportation fuel for various supply optionsand levels of demand?
2
'1' What is the lifecycle cost of transportation for hydrogenvehicles fueled with hydrogen from these sources?
* How might a hydrogen infrastructure evolve to meet
projected demands for hydrogen for ZEVs in SouthernCalifornia?
* What are the synergisms between near term options and
phasing in longer term supplies such as hydrogen fromrenewables?
Our conceptual designs for hydrogen infrastructure utilizecommercial or near commercial technologies for hydrogenproduction, storage and distribution. Our goal is to examine thehydrogen infrastructure question, with a focus on a potentiallyimportant near term market: Southern California ZEV s.
1.2. ESTIMATED HYDROGEN DEMAND FOR REFUELINGHYDROGEN VEHICLES IN SOUTHERN CALIFORNIA
1.2.1. ESTIMATED NUMBER OF ZERO EMISSION VEHICLES INTHE LOS ANGELES BASIN
Data were obtained from the South Coast Air Quality ManagementDistrict for current and projected numbers of automobiles, vehiclemiles traveled, and gasoline consumed in each county (Los Angeles,San Bernadino, Orange and Riverside) in the South Coast Air Basin(Ranji George, private communications 1995, 1996). These areshown in Table 1.1. We see that by 2010, over 9 million passengercars will be operating in the Los Angeles Basin. (If light trucks areconsidered, a category which includes the increasingly popular"sport-utility" vehicles, the total projected number of light dutyvehicles is close to 11 million.)
From Table 1.1, the ZEV population can be estimated, assuming thatmandated levels of ZEV passenger cars are introduced on the timescale shown in Table 1.2. We further assume that 1) the projectedvehicle population grows linearly, 2) ZEVs have a lifetime of 10 yearsand 3) the number of ZEV s/year is held fixed at 10% of new vehiclessold each year between 2003 and 2010. Table 1.3 estimates theZEVs sold per year and the cumulative number of ZEVs as a function
3
of year from 1995-2010 under the original and revised ZEVmandates. Under the original 1990 ZEV mandate, by 2010 over800,000 zero emission vehicles would be on the road in the LA Basin.Even though the mandate has been altered to delay introduction ofZEV cars until 2003, the cumulative number of ZEVs is still projectedto be over 700,000 in 2010 (see Figure 1.2)
1.2.2. PROJECTED HYDROGEN DEMANDS
1.2.2.1. Hydrogen Demand for a Single Fuel Cell Car or Bus
The hydrogen demand for a PEM fuel cell mid-size passenger car isgiven in Table 1.4. The performance of the PEMFC car is based onestimates by Delucchi (Ogden, Larson and Delucchi 1994, Delucchi1992). The annual mileage and projected annual energy use is basedon average driving patterns in the Los Angeles Basin (see Table 1.1).
The hydrogen demand for a PEMFC bus is estimated in Table 1.4,based on Ballard performance estimates for a PEMFC bus (Larsonet.al. 1996), and Los Angeles bus annual mileage (Chaiboonma 1996).
1.2.2.2. Scenarios for Commercialization of Fuel CellVehicles
It is possible that hydrogen fuel cell vehicles could capture asignificant fraction of the ZEV automobile market. Many analystsbelieve that fuel cell cars could be commercialized sometimebetween '2003 and 2010.
Three possible scenarios for introducing hydrogen fuel cell vehiclesare shown in Table 1.5. In the "base case" half the ZEV market iscaptured by hydrogen fuel cell cars starting in 2003, and 10% of allnew buses are fuel cell buses starting in 1998 (the year Ballard hasplanned to commercialize PEMFC buses). For comparison, earlier andlater commercialization scenarios are given (see Table 1.5 and Figure1.3).
1.2.2.3. Total Hydrogen Demand for ZEVs in the LA Basin
The total hydrogen demand for the three scenarios above can beestimated using the information in Tables 1.3-1.5. The totalhydrogen demand for fuel cell cars and buses is shown for each
4
scenario in Table 1.6. The hydrogen demand for the base case isplotted in Figure 1.4.
For the assumptions in our base case, a hydrogen demand of about55 million scf/day would develop by 2010. This is about as muchhydrogen as would be produced at a good sized oil refinery today.Almost all the hydrogen would be for passenger cars. If 10% of thenew bus market goes to PEMFCs starting in 1998, this would amountto about 300 buses by 2010 (about as many buses as would beserved by a large bus depot). Fueling this many buses would requireabout 2 million scf/day. If all the buses in the LA Basin were fuel cellbuses, this would require about 20 million scf/day.
For reference, based on Los Angeles driving patterns, one millionscf/day of hydrogen would be enough to fuel 800 PEM fuel cellpassenger cars per day (or a total fleet of 6500 FCV cars) or 80PEMFC buses per day (or a total fleet of 140 PEMFC buses) (Table1.7).
We now consider how the projected hydrogen demand might be metin the near term (1996-2010) from existing hydrogen supplies andpotential future supplies in the LA Basin.
1.3. EXISTING AND POTENTIAL HYDROGEN SUPPLIES IN THELOS ANGELES BASIN
1.3.1. EXISTING SUPPLIES OF HYDROGEN
1.3.1.1. Industrial gas companies
At present, the primary suppliers of hydrogen in Southern Californiaare the industrial gas companies Praxair, Inc. and Air Products andChemicals, Inc.
Praxair has a hydrogen plant in Ontario, CA (see Figure 1.5) whichcurrently produces 15 ton/day of liquid hydrogen (15 ton/day isequivalent in energy to about 5.3 million scf/day of gaseoushydrogen.) This plant supplies liquid hydrogen to the aerospaceindustry and to chemical industry users. Although most of thecurrent output of this plant is already committed, there may be amillion scf/day or so available today for transportation fuel (Kerr1995).
5
The Praxair plant was originally designed to produce 28 ton/day,using two reformers. With lowered demand from aerospacecompanies, one reformer was shut down several years ago. Theoutput could be returned fairly easily to 28 ton/day by restartingthe second reformer. There is also room for further expansionbeyond 28 ton/day if the market warranted (Kerr 1995). If thesecond reformer were reactivated producing an additional 13ton/day of liquid hydrogen, this could fuel a fleet of about 30,000fuel cell cars or about 600 Ballard type PEMFC urban transit buses.The price of liquid hydrogen in the LA area at demand levels of 0.1-2.0 million scf/day is currently about $1.1-1.5/lb or $17-23/GJ(Lenci 1995). A liquid hydrogen refueling station might add several$/GJ to this cost (Ogden et.al. 1995).
Air Products and Chemicals recently completed a new 80 millionscf/day hydrogen plant (based on steam reforming of natural gas) inWilmington, CA to provide gaseous hydrogen to nearby oil refineries(Moore 1995). The plant may still have some uncommitted capacity,which could be used for vehicle fuel. If 5 million scf/day wereavailable, this could fuel a fleet of about 33,000 fuel cell cars or 700fuel cell buses. The cost of hydrogen at a large reformer plant mightbe $7 -9/GJ. Wi th gaseous hydrogen, a pipeline distribution systemwould have to be built (or refueling might be done at the hydrogenplant). The delivered cost of transportation fuel would depend on thetype of pipeline distribution system needed.
1.3.1.2. Excess hydrogen from refineries
In addition, a number of oil refineries are located in theTorrance/Wilmington area (see Figure 1.5). Typically oil refineriesproduce large amounts of gaseous hydrogen (25-100 million scf/day)using most or all of it onsite. Historically some excess hydrogen hasbeen available, and some refineries have sold a few million scf/dayof hydrogen "over the fence" to other refineries or chemical users,delivering the hydrogen by small scale pipeline. To meet 1996requirements for Phase II reformulated gasoline, significantly morehydrogen will be required by refineries. Thus, the refiners expect tobe "hydrogen short" in the near future. To meet increased demandsfor hydrogen, several refineries are now building extra reformercapacity or planning to buy hydrogen from the new Air Products
plant.
6
-
It may be possible to purchase a few million scf/day from refineries,especially those with newly expanded reformer capacity. This couldbe economically attractive, as the cost (at the plant site) would bequite low. If the reformer capital cost is considered to be a "sunk"cost, gaseous hydrogen might be sold for as little as $1/1000 scf($2.8/0J). If the reformer capital costs are counted, the price forgaseous hydrogen would be $2.5-3.0/1000 scf ($6.9-8.3/0J)(Youngman 1995). The delivered cost to the user would depend onhow long a pipeline was required, as well as the cost of the refuelingstation.
1.3.1.3. Summary: total hydrogen available from existingsources
Hydrogen from existing sources could be significant in gettinghydrogen fuel cell vehicles started. Even without building any newhydrogen production capacity, the total available from all existingsources might be 5-15 million scf/day or enough for 30,000-100,000fuel cell cars or 700-2000 fuel cell buses. (Of course, there would becosts to build new distribution systems and refueling stations tobring the "excess hydrogen" available in the LA Basin today toconsumers' vehicles. This is discussed in Section 1.4.2. below.)
1.3.2. OTHER POTENTIAL NEAR TERM SOURCES OF HYDROGENIN SOUTHERN CALIFORNIA
If fuel cell vehicles capture a significant fraction of the ZEVpassenger car market, demand would soon outstrip these existingsources of hydrogen. (Recall that by 2010, fueling all 50% of ZEVswith hydrogen would require 55 million.) In this case, other nearterm supplies would have to be developed.
1.3.2.1. Expansion of industrial gas supplies
If a large market for hydrogen transportation fuel were to develop,industrial gas suppliers indicated that they could build anew, largehydrogen plant based on steam reforming in 2-3 years. A plantproducing 80 million scf/H2 per day could serve a fleet of 500,000fuel cell passenger cars. Hydrogen from such a plant could beliquified for truck delivery or delivered via a small scale pipelinesystem.
7
1.3.2.2. Hydrogen from onsite steam reforming of natural
gas
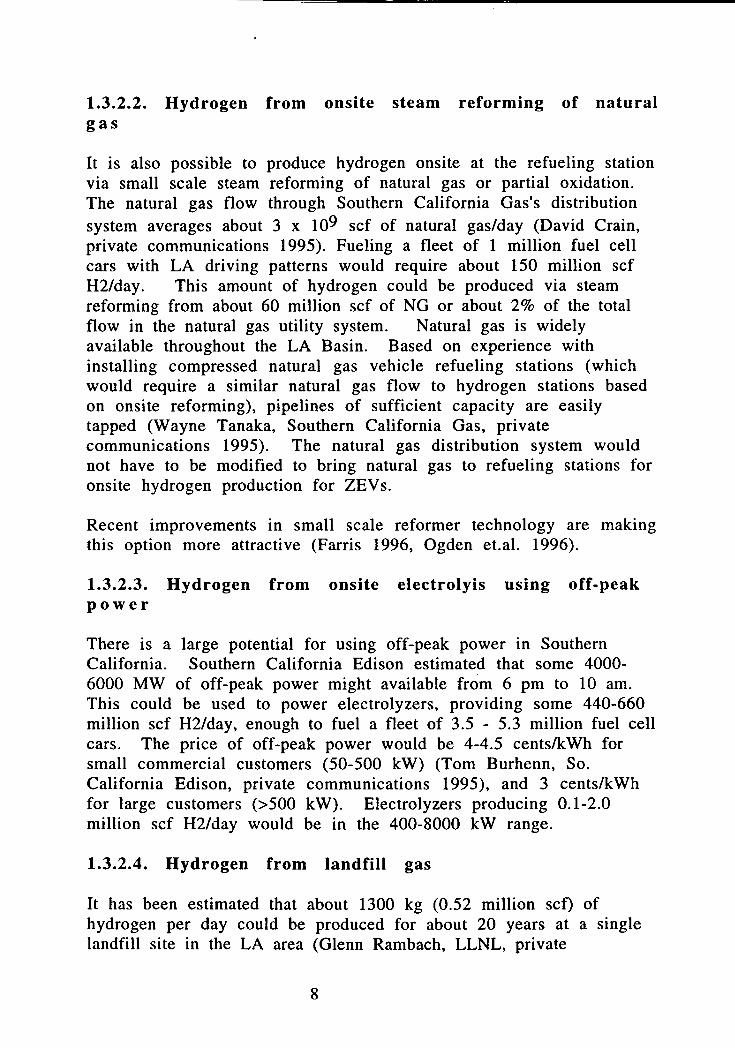
It is also possible to produce hydrogen onsite at the refueling stationvia small scale steam reforming of natural gas or partial oxidation.The natural gas flow through Southern California Gas's distributionsystem averages about 3 x 10⁹ scf of natural gas/day (David Crain,private communications 1995). Fueling a fleet of 1 million fuel cellcars with LA driving patterns would require about 150 million scfH2/day. This amount of hydrogen could be produced via steamreforming from about 60 million scf of NG or about 2% of the totalflow in the natural gas utility system. Natural gas is widelyavailable throughout the LA Basin. Based on experience withinstalling compressed natural gas vehicle refueling stations (whichwould require a similar natural gas flow to hydrogen stations basedon onsite reforming), pipelines of sufficient capacity are easilytapped (Wayne Tanaka, Southern California Gas, privatecommunications 1995). The natural gas distribution system wouldnot have to be modified to bring natural gas to refueling stations foronsite hydrogen production for ZEV s.
Recent improvements in small scale reformer technology are makingthis option more attractive (Farris 1996, Ogden et.al. 1996).
1.3.2.3. Hydrogen from onsite electrolyis using off-peak
power
There is a large potential for using off-peak power in SouthernCalifornia. Southern California Edison estimated that some 4000-6000 MW of off-peak power might available from 6 pm to 10 am.This could be used to power electrolyzers, providing some 440-660million scf H2/day, enough to fuel a fleet of 3.5 -5.3 million fuel cellcars. The price of off-peak power would be 4-4.5 cents/kWh forsmall commercial customers (50-500 kW) (Tom Burhenn, So.California Edison, private communications 1995), and 3 cents/kWhfor large customers (>500 kW). Electrolyzers producing 0.1-2.0million scf H2/day would be in the 400-8000 kW range.
1.3.2.4. Hydrogen from landfill gas
It has been estimated that about 1300 kg (0.52 million scf) ofhydrogen per day could be produced for about 20 years at a singlelandfill site in the LA area (Glenn Rambach, LLNL, private
8
communication 1995). This would be enough to refuel about 40PEMFC buses/day. The economics would be competitive with othersources of hydrogen (Glenn Rambach, LLNL, 1995). The total resourcehas not been quantified, but this suggests the possibility of fuelsproduction at landfills.
1.3.2.5. Summary: total hydrogen available from near termsources
Hydrogen could be produced either in a centralized plant or at therefueling station from natural gas. To produce hydrogen to fuel onemillion FCVs would require less than 2% of the current natural gasflow in the utility system.
Onsite electrolysis is another potentially large resource. If all theavailable off-peak power in the LA area were devoted to electrolytichydrogen production, a fleet of 3-5 million FCV s could be fueled.
Hydrogen from landfill gas is another possibility which might beexploited in the near term.
In Figure 1.6, we compare the projected hydrogen demand forvehicles in the LA Basin from 1998-2010 to the amount of hydrogenwhich could be supplied from various existing and near termsupplies. Hydrogen from existing industrial and refinery sources inthe LA area could fuel a fleet of perhaps 30,000-100,000 fuel cellcars or 700-2000 Ballard buses/day. Beyond this level, there issufficient natural gas to fuel a fleet of 3-6 million FCVs (assumingthat 5-10% of the current natural gas flow is used for hydrogenproduction), and sufficient off-peak power to produce electrolytichydrogen for 3-4 million FCVs.
1.3.3. BEYOND 2010: A TRANSITION TO RENEWABLEHYDROGEN SUPPLIES
Natural gas supplies would probably be sufficient to supplyfeedstock for hydrogen production for up to several million PEMFCcars, for several decades. If the entire fleet in the LA area iseventually converted to ZEVs, hydrogen for some 12-14 millionpassenger cars might be required. Renewable and other long termoptions might be phased in at this time.
9
These include gasification of municipal solid waste (a potentialresource capable of serving several million FCV cars in the LA area)or biomass, or solar (a potentially huge resource, which could meetforeseeable demands, even for a 100% ZEV transportation system).
1.3.3.1. Hydrogen From Municipal Solid Waste
Municipal solid waste (MSW) can be gasified to produce methanol orhydrogen. Chen (Chen 1995) has estimated that 375-500 million scfH2/day could be produced in the LA area via gasfication of MSW.This would be enough to fuel a fleet of 3-4 million fuel cell cars. Thecost of hydrogen production was estimated to be about $10.2-13.3/GJfor a plant producing 26.5 million scf H2/day, assuming tipping feesof $22/tonne of raw MSW, the figure used in Los Angeles. Hydrogenplants using MSW as a feedstock would benefit from economies ofscale.
The delivered cost of hydrogen to the consumer would depend on thecost of distribution via pipeline. For a 10 km, 3" diameter hydrogenpipeline costing about $1,OOO,OOO/mile, the cost of transmitting 11million scf/day would be about $1/GJ. Assuming that the refuelingstation added another $6/GJ, the total delivered cost of compressedhydrogen gas transportation fuel from MSW would be about $17-20/GJ.
Hydrogen could also be produced via gasification of biomass,probably at similar costs to hydrogen from MSW. We have notspecifically estimated potentiai biomass resources in the LA area.
1.3.3.2. Hydrogen From Solar, Wind And Geothermal
In areas with good direct insolation, solar thermal power could beused in thermochemical cycles for producing hydrogen via solar-assisted steam reforming of natural gas or via water decomposition.(Williams 1996).
Solar photovoltaic (PV) electrolytic hydrogen could be producedalmost anywhere. The Los Angeles area has a good solar resource.The amount of land required to produce) 13 million scf H2/day(enough to fuel a fleet of 0.8 million fuel cell cars) would be about 37km2 or 15 sq.mi. (assuming annual average insolation of 220 W/m2,PV efficiency of 15% and electrolyzer efficiency of 80%). PVhydrogen systems could be centralized or stand-alone (at the
10
refueling site). With projected improvements in the cost of mass-produced thin film PV, the delivered cost of transportation fuelmight be $22-30/GJ. Ultimately, to meet the demand for 14 millionfuel cell cars (levels projected for cars in the LA Basin in the early tomiddle part of the next century) about 250 sq.mi. of PV plants wouldbe needed.
There are several excellent wind sites in Southern California,including sites at Tehachapi Pass and San Gorgonio Pass (on Route J-10 an hour or so east of LA). Costs for wind electrolytic hydrogenwould probably be similar to those projected for PV, if long termgoals are met. (Wind power is likely to offer lower costs than PV forthe next 10-20 years.)
Geothermal power is another possible option in the SouthernCalifornia area.
Local wind and geothermal resources have not been quantified inthis study, but could be looked at in more detail.
1.3.3.3. Hydrogen From Fossil Fuels Or Biomass WithSequestering Of CO2
Hydrogen might also be produced from fossil fuels (natural gas orcoal) or biomass with sequestering of the byproduct CO2 in gas fieldsor aquifers, and piped via large scale, long distance hydrogenpipelines to users (Williams 1996). This might occur after asufficiently large demand had built up to justify building a longdistance, large scale hydrogen pipeline.
1.3.3.4. Summary of Long Term Options for HydrogenProduction
Local renewable options in the LA area would be sufficient to meetforeseeable needs for hydrogen fuel cell cars. Once a sufficientlylarge demand for hydrogen had developed, long distance hydrogenpipelines might be built to bring in lower cost sources of hydrogen tothe user.
1.4. ECONOMICS OF HYDROGEN PRODUCTION AND DELIVERY
11r.!
~-
1.4.1. DELIVERED COST OF HYDROGEN TRANSPORTATIONFUEL
We now estimate the delivered cost of hydrogen transportation fuelin Southern California for various options.
Energy prices for Southern California are summarized in Table 1.8,based on data obtained from Southern California Gas Company(Thomas 1996) and Southern California Edison (Burhenn 1996). Thedelivered cost of hydrogen transportation fuel is then estimated,using data developed in our earlier studies of hydrogentransportation fuel supply options (Ogden et.al 1995).
We consider a variety of near term refueling infrastructure options
including (Figure 1.1):
* hydrogen produced from natural gas in a large, centralizedsteam reforming plant, and truck delivered as a liquid to
refueling stations,
* hydrogen produced in a large, centralized steam reformingplant, and delivered via small scale hydrogen gas pipeline to
refueling stations,
* hydrogen produced at the refueling station via small scalesteam reforming of natural gas, both conventional and fuelcell type steam reformers are considered (Ogden et.al. 1996)
* hydrogen produced via small scale electrolysis at the
refueling station,
* hydrogen from low cost chemical industry sources (e.g.
excess capacity in refineries which have recently upgradedtheir hydrogen production capacity, etc.).
A range of refueling station sizes from 0.1 to 2.0 million scf/day isconsidered (e.g.about 80-1600 fuel cell cars/day or 8-160 fuel cellbuses/day). The details of the refueling system design and economicsare discussed in earlier reports (Ogden et.al. 1995, Ogden, Dennis andMontemayor 1995, Dennis 1994). We have included a summary ofequipment costs for developing a hydrogen refueling infrastructure(e.g. costs for hydrogen production, distribution and refueling stationtechnologies for each option above in Appendix 1.A.)
1 2
1.4.1.1. Economic Comparison of Hydrogen Supply Options inSouthern California
The delivered cost of hydrogen transportation fuel for SouthernCalifornia conditions is shown in Figure 1.7 for a variety of stationsizes and supply options. The cost contributions of various factorsare shown for each technology over a range of station sizes. Thecapital cost of refueling stations is shown in Figure 1.8.
Although all the supply options are roughly competitive, severalpoints are readily apparent.
* For our assumptions, it appears that onsite electrolysis
would be somewhat more expensive in than other options,largely because of the relatively high cost of off-peak powerin the LA area. (If the cost of off-peak power were reducedfrom 3 cents/kWh to 1-1.5 cents/kWh, hydrogen costs wouldbecome much more competitive. See Chapter 2 of this reportfor further discussion of the conditions where electrolysiswould be more competitive.)
* Truck delivered liquid hydrogen gives a delivered hydrogen
cost of $20-30/0J, depending on the station size. Thisalternative would be attractive for the first demo projects, asthe capital requirements for the refueling station would berelatively small (Ogden et.al. 1995, Ogden et.al. 1996), and nopipeline infrastructure would be required.
* In Figure 1.9b, delivered hydrogen costs are shown for
onsite reforming of natural gas based on: 1) conventionalsmall steam reformer systems and 2) advanced low costreformers, which have just been introduced for stationaryhydrogen production (Farris 1996). With conventionalreformer technology, hydrogen is expensive at small stationsizes, but is economically attractive at larger station sizes. Asdiscussed in a recent report (Ogden et.al. 1996), adoptinglower cost, advanced steam methane reformer designs basedon fuel cell reformers could substantially reduce thedelivered cost of hydrogen especially at small station size. InFigure 1.9a, we compare the capital cost of small scalehydrogen plants based on conventional and fuel cell steammethane reformers. We see that if fuel cell type reformers
13
are used, the reformer capital cost might be reduced by about25- 70% for station capacities of 0.1-2.0 million scf/day. Asshown in Figures 1.7 and 1.9b, this reduction in reformercapital cost makes onsite reforming competitive with liquidtruck delivery and pipeline delivery over the whole range ofstation sizes considered. The delivered cost of hydrogen isreduced by about 40% for a station serving 80 cars/day and20% for a station serving 800 cars/day. Onsite production hasthe advantage that no hydrogen distribution system is
required.
* Under certain conditions, pipeline hydrogen could offer low
delivered costs. The capital cost of building a small (3"diameter) hydrogen pipeline would be about $1 million permile in the heavily populated Los Angeles area (Lenci 1995).Figure 1.10 shows the cost of hydrogen pipeline delivery in a3" diameter pipeline as a function of the pipeline flow rateand the distance. The levelized cost of pipeline delivery inLos Angeles is about
Ppipeline($/GJ)= $1.2/GJ x distance (in km)/flow rate (in million scf H2/day).
The levelized cost of pipeline delivery depends on the flowrate and the length of the pipeline (see Ogden et.al. 1995).The higher the flow rate, the lower the cost.
* Centrally produced hydrogen ranges in cost from $3/GJ (for
refinery excess) to $5-9/GJ for large scale steam reforming to$8-10/GJ for hydrogen from biomass, coal or MSW). If the
\' cost of hydrogen production is low, higher pipeline costs could
be tolerated. Still, for pipeline hydrogen to be competitivewth truck delivery or onsite reforming, pipeline costs can beno more than a few $/GJ. For a small scale hydrogen pipelinesystem to be economically competitive a large, fairly localizeddemand would be required. Alternatively, a small demandmight be served by a nearby, low cost supply of hydrogen.For example, from Figure 1.10, if we want a transmission costof $1/GJ, we could have a flow rate of 10 million scf/day (anamount which could serve a total fleet of 65,000 cars (seeTable 1.7» over a pipeline distance of about 10 km (e.g. anentire small city converts to hydrogen fuel cell cars, suppliedby a hydrogen plant within 10 miles). Another scenario giving
14
a levelized pipeline cost of $1/0J is a single refueling stationserving a fleet of 6500 cars located 1 km from a largehydrogen plant (e.g. 10% of the cars in a small city convert tohydrogen fuel cells, and the refueling station is located near a
hydrogen plant).
1.4.2. CAPITAL COST OF BUILDING A HYDROGEN REFUELINGINFRASTRUCTURE
The capital cost of building a hydrogen refueling infrastructure isoften cited as a serious impediment to use of hydrogen in vehicles.In this section, we estimate the capital cost of building a hydrogenrefueling infrastructure for the various options discussed in theprevious section.
We consider two levels of infrastructure development.
I) Early development of distribution system and refuelingstations to bring excess hydrogen from existing hydrogencapacity to users. We assume that no new hydrogenproduction capacity is needed. Stations are assumed to serve80-1600 cars or 8-160 buses per day: hydrogen demands arein the range 0.1-2.0 million scf/day.
2) Development of new hydrogen production capacity to meetgrowing demands for hydrogen transportation fuel. Expansionof hydrogen delivery system and increased number ofhydrogen refueling stations. Introduction of onsite steamreformers or electrolyzers.
These two cases are shown in Tables 1.9a and 1.9b. (See AppendixI.A for a discussion of capital costs for equipment used in buildinghydrogen infrastructure: hydrogen production, delivery andrefueling station systems.)
In Table 1.9a, we assume that a total fleet of 13,000 fuel cell cars areoperating in the Los Angeles area. Two refueling stations serve thesecars, each station dispensing I million scf H2/day to 800 cars/day.The options for providing hydrogen to these cars include:
I) Liquid hydrogen deli very via truck from existing capacity.There is no capital cost for developing new capacity or for
15
new delivery trucks. The only cost is for two new refuelingstations. The infrastructure capital cost per car is about $105.
2) Pipeline hydrogen delivery. This would not beeconomically feasible unless the demand was located near alarge hydrogen plant or refinery with excess hydrogen. Thereis no charge for developing new capacity. However, thepipeline is expensive. The cost is for two new compressed gashydrogen refueling stations is higher than for stations withLH2 delivery. The total infrastructure cost per car is about$740.
3) Onsite production from steam reforming of natural gasinvolves only refueling station costs. The station cost is high,because hydrogen is produced onsite. Capital costs per car foronsite production from conventional small scale reformers isabout $830/car. This is reduced to about $530/car for fuelcell type reformers.
4) Capital costs for onsite production from advancedelectrolysis using off-peak power, would be about $880/car.
In Table 1.9b, we estimate the capital cost of infrastructure to refuel1 million fuel cell cars. Here we assume that new centralizedproduction capacity is built. Infrastructure capital costs per carrange from $440 for liquid hydrogen truck delivery, to $810 forpipeline delivery, to $500-800 for onsite reforming to $870 foronsite electrolysis using off-peak power.
We see that centralized steam reforming with liquid hydrogendelivery gives the lowest overall infrastructure capital cost. [It isimportant to recall the the delivered cost of hydrogen for this optionis still higher than some others (Figure 1.7), since liquifactionrequires substantial electrical energy input.]
Infrastructure costs for pipeline hydrogen are more costly because ofthe higher cost of the refueling stations, and because of the high costsof building hydrogen pipelines in LA.
Onsite production via electrolysis is fairly expensive.
Conventional small scale steam methane reforming is also capitalintensive. However, if low cost, compact, fuel cell type steam
16
reformers are used, it appears that onsite steam reforming could be arelatively low cost alternative.
It is important to keep in mind the results of Figure 1.7 for the totaldelivered cost of hydrogen transportation fuel, as well as the capitalcost of infrastructure. Some of the lower capital cost options such asLH2 delivery, can give a higher delivered fuel cost than pipelinedelivery or onsite reforming.
The range of infrastructure capital costs for a system serving 13,000fuel cell cars, is about $1.4-11.4 million or $1 00-900/car. The rangeof infrastructure capital costs for a system serving 1 million fuel cellcars, is about $400-900 million or $400-900/car.
It is often stated that use of methanol or gasoline with onboardreformers would greatly reduce (for methanol) or eliminate (forgasoline) the problem of developing a new fuel infrastructure.
How 'does the capital cost of building a hydrogen refuelinginfrastructure compare to the capital cost of infrastructuredevelopment for methanol or gasoline fuel cell vehicles?
Redefining "infrastructure" to mean all the equipment (both on andoff the vehicle) required to bring hydrogen to the fuel cell, it is clearthat gasoline and methanol fuel cell vehicles also entail extra costs --largely for onboard fuel processing. In the case of hydrogen, theinfrastructure development cost is paid by the fuel producer. In thecase of methanol or gasoline fuel cell vehicles, the cost 'is paid by theconsumer buying the car.
A recent study by Directed Technologies, Inc. supports the view thatwhen the total infrastructure cost (on and off the vehicle) isconsidered, hydrogen infrastructure capital costs are comparable tothose for methanol and gasoline (Thomas 1996). In future work, weplan to make more detailed estimates of methanol and gasolineinfrastructure costs.
1.4.3. LIFECYCLE COST OF OWNING AND OPERATING AHYDROGEN FUEL CELL CAR OR BUS COMPARED TOALTERNATIVES
As we have shown in earlier work, the cost of owning and operatinga hydrogen fuel cell automobile would be comparable to that of a
17

-
gasoline internal combustion engine vehicle and other alternatives,assuming mass production cost goals for PEM fuel cells are reached(Ogden, Larson and Delucchi 1994). Performance and costassumptions for alternative fueled vehicles are outlined in Table1.10, comparing fuel cell automobiles to gasoline automobiles andfuel cell buses to Diesel buses (see also Larson, Worrell and Chen1996). Using the data in Figure 1.7 for the delivered cost ofhydrogen transportation, fuel, the lifecycle cost of transportation canbe estimated. This is shown for a PEMFC bus in Figure 1.10. Thecapital cost of the vehicles is higher, but the efficiency is higher, sothat the overall cost of transportation could be similar to that oftoday's vehicles.
For a PEMFC car, lifecycle costs are shown in Figures 1.12a-c. Figure1.12a shows the delivered cost of hydrogen from various sources ascompared to gasoline, natural gas and methanol. Figure 1.12b showsthe fuel cost per km for alternative vehicles run on gasoline,methanol and hydrogen. The total lifecycle cost of transportation isgiven in Figure 1.12c. For details the reader is refered to (DeLuchi1992 and Ogden, Larson and Delucchi 1994)
1.5. DISCUSSION: IS HYDROGEN REFUELING INFRASTRUCTUREA "SHOW-STOPPER" FOR HYDROGEN VEHICLES IN SOUTHERNCALIFORNIA?
Our study suggests several reasons why hydrogen infrastructuredevelopment may not be an insurmountable ob&tacle t<J .introo,uc,inghydrogen vehicles in Southern California.
* The technologies to produce, deliver and dispense hydrogen
are well known. There appear to be no major technicalhurdles to dispensing hydrogen transportation fuel.
* Ample supplies of hydrogen exist in the LA area. It would
be possible to introduce significant numbers of fuel cellvehicles, even without building any new hydrogen productioncapacity. The excess hydrogen capacity available fromindustrial suppliers and refineries today might fuel 700-2000PEM fuel cell buses or 30,000-100,000 PEM fuel cell cars.
I 8
~--~- ---="= -
* Once demand exceeded these levels, hydrogen from steam
reforming of natural gas, gasification of MSW, or off-peakpower could supply hydrogen for millions of FCVs.
What about the cost of building a hydrogen infrastructure? Wouldn'tother fuel cell vehicle options such as onboard reforming of methanolor gasoline entail smaller capital costs? According to recentestimates by Directed Technologies, Inc. (Thomas 1996), the capitalcost of building a hydrogen refueling infrastructure off the vehicleappears to be comparable to the added cost of putting individualsmall hydrogen production systems (fuel processors) onboard eachvehicle. Further work is needed to clarify the relative costs andother advantages of alternative fuels for fuel cell vehicles.
1.6. POSSIBLE SCENARIOS FOR DEVELOPING A HYDROGENREFUELING INFRASTRUCTURE IN THE LOS ANGELES BASIN
1.6.1. INTRODUCTION OF PEMFC BUSES
There are a number of reasons why PEM fuel cell buses might be thefirst users of hydrogen as a transportation fuel.
* Ballard will be demonstrating hydrogen fueled PEMFC buses
in several cities starting this year, with commercializationplanned for 1998.
* Refueling with hydrogen or any alternative fuel is easier at
centralized fleet locations such as bus garages.
* The daily demand for hydrogen for a bus depot would be
large enough to bring the delivered cost of hydrogen downsomewhat because of economies of scale, especially forstations based on small scale reformers.
* Fuel cells might be economically competitive first in bus
markets, where cost goals are not as stringent as forautomobiles.
To understand the potential for fuel cell buses in the Los Angelesarea, we gathered data on the bus system (Chaiboonma 1996). Atotal of about 3000 Diesel buses operate in the LA area. Typically,buses are driven 50,000 miles/year, and have a fuel economy of
19
about 3.5 miles per gallon of Diesel, and a range of 350 miles. Thelifetime of a typical Diesel bus is about 10 years (500,000 miles).Buses are refueled overnight where they are garaged (at depots).Typical sizes for bus depots in LA are about 60-200 buses.
Major bus depots are shown in Figure 1.13. It is interesting to notethat all the urban transit bus depots in the LA area are within anhour or so of the Praxair liquid hydrogen plant. Several depots arelocated in the Long Beach area, possibly within pipeline distance ofrefineries or the Air Products plant.
Assuming a replacement rate for Diesel buses of 10% per year, about300 new buses would be needed in LA every year. If fuel cell busesmade up 10% of the new buses about 30 new fuel cell buses peryear would be required. Existing industrial hydrogen sources wouldbe sufficient to supply several hundred buses.Hydrogen could betrucked in as a liquid or piped short distances to bus depots near theLong Beach refinery area. Alternatively, onsite production ofhydrogen from natural gas might be used. A fleet of about 8 PEMFCbuses could be refueled daily using a small scale reformer producing100,000 scf H2/day. Rapid developments in small scale reformertechnology are making this an increasingly attractive supply option.
1.6.2. INTRODUCTION OF PEMFC AUTOMOBILES INSOUTHERN CALIFORNIA
Several major automobile manufacturers are conducting R&D on PEMfuel cell cars (including OM, Ford, Chry~er, Daintier-Benz, Mazda,Toyota, and Honda). A PEMFC mini-van using compressed hydrogengas storage was demonstrated in May 1996 by Daimler-Benz, and itis likely that the first mid-size PEMFC automobiles may bedemonstrated before the year 2000. The first mass-producedcommercial models might be available a few years later in the 2004-2010 time frame.
If PEMFC cars capture a significant fraction of the mandated ZEVmarket, the demand for hydrogen could grow rapidly (Figure 1.4),and new hydrogen production capacity and delivery infrastructurewould be needed. In near term (1998-2010) liquid hydrogen truckdelivery or onsite production of hydrogen from natural gas wouldprobably give the lowest delivered transportation fuel costs to theconsumer. Because of the high cost of building small scale gaseouspipelines, development of new, large scale, centralized production
20
.
capacity with pipeline distribution would require a fairly large,localized hydrogen demand. This might not develop until a largerfraction of the automotive population were hydrogen-fueled.(Exceptions might be found, where gaseous distribution was moreattractive, e.g.a cluster of fleet cars in an industrial area.) Onsiteelectrolysis appears less economically attractive than steamreforming in the LA area, because of the relatively high cost of off-peak power (3 cents/kWh). (If lower cost electricity supplies wereavailable this alternative would be more competitive.)
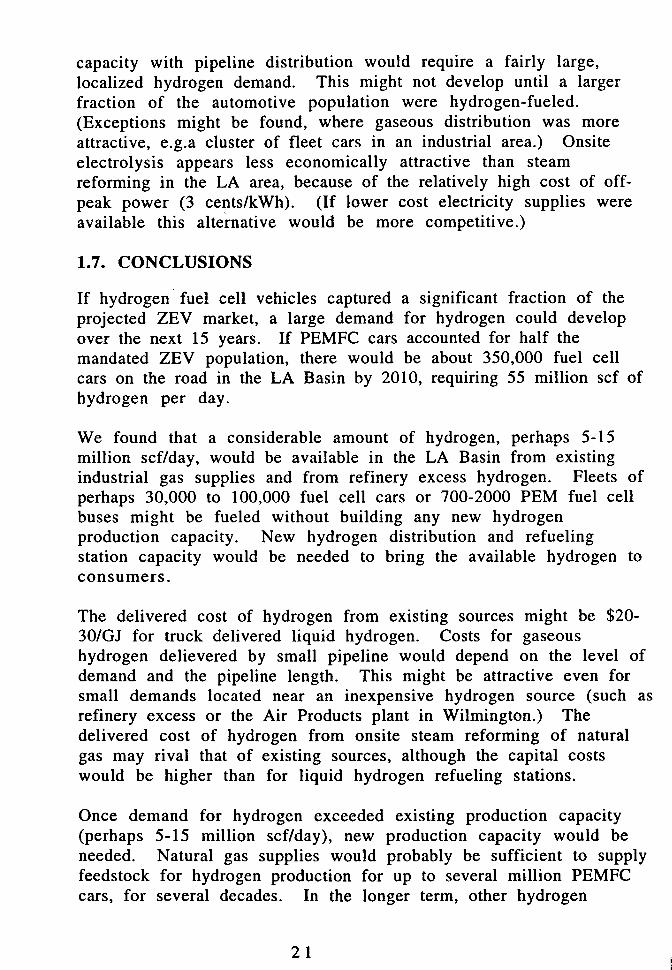
1.7. CONCLUSIONS
If hydrogen' fuel cell vehicles captured a significant fraction of theprojected ZEV market, a large demand for hydrogen could developover the next 15 years. If PEMFC cars accounted for half themandated ZEV population, there would be about 350,000 fuel cellcars on the road in the LA Basin by 2010, requiring 55 million scf of
hydrogen per day.
We found that a considerable amount of hydrogen, perhaps 5-15million scf/day, would be available in the LA Basin from existingindustrial gas supplies and from refinery excess hydrogen. Fleets ofperhaps 30,000 to 100,000 fuel cell cars or 700-2000 PEM fuel cellbuses might be fueled without building any new hydrogenproduction capacity. New hydrogen distribution and refuelingstation capacity would be needed to bring the available hydrogen toconsumers.
The delivered cost of hydrogen from existing sources might be $20-30/GJ for truck delivered liquid hydrogen. Costs for gaseoushydrogen delievered by small pipeline would depend on the level ofdemand and the pipeline length. This might be attractive even forsmall demands located near an inexpensive hydrogen source (such asrefinery excess or the Air Products plant in Wilmington.) Thedelivered cost of hydrogen from onsite steam reforming of naturalgas may rival that of existing sources, although the capital costswould be higher than for liquid hydrogen refueling stations.
Once demand for hydrogen exceeded existing production capacity(perhaps 5-15 million scf/day), new production capacity would beneeded. Natural gas supplies would probably be sufficient to supplyfeedstock for hydrogen production for up to several million PEMFCcars, for several decades. In the longer term, other hydrogen
21
supplies might be phased such as gasification of municipal solidwaste or biomass, or solar.
For energy prices and conditions in the LA area, it appears that inthe near term, truck delivery of liquid hydrogen and onsiteproduction via small scale steam reforming offer the lowestdelivered hydrogen costs and would allow the addition of hydrogenproduction capacity in small increments, without building a newhydrogen pipeline distribution system. Improvements in small scalereformer technology might make this option even more attractive.
Off-peak power is a significant resource, capable of producing H2 for3-4 million fuel cell cars. However, hydrogen produced via smallscale electrolysis was somewhat more expensive than other options,largely because of the relatively high cost of off-peak power in theLA area.
In the longer term, for large, geographically concentrated demands,pipeline distribution might ultimately yield the lowest delivered fuelcost. Pipeline delivery might also be prefered for a smaller demandvery close to an existing low cost source of hydrogen (e.g. refineryexcess).
The first hydrogen vehicles in the LA Basin are likely to be PEM fuelcell buses, which could' be commercialized as early as 1998. Earlybus demos might be fueled from existing sources (trucked in liquidhydrogen, or piped in hydrogen for depots near the LA refineryarea). Or they might use small sca1e reformer systems now "be'ingcommercialized for stand-alone hydrogen production.
Once fuel cell cars were introduced, hydrogen production fromnatural gas would offer the lowest costs for the near term. In thelonger term, other local supplies might be phased in such ashydrogen from wastes, biomass or solar. Or distant low cost sourcesof hydrogen might be brought in via long distance pipeline.
An estimate of infrastructure capital costs suggests that the cost pervehicle to develop a hydrogen refueling infrastructure would beperhaps $400-900/vehicle.
1.8 RECOMMENDATIONS
22
-
Our study suggests a number of interesting possibilities fordeveloping hydrogen refueling infrastructure to serve hydrogenvehicles in Southern California. Demonstrations of hydrogenrefueling systems should be undertaken in parallel with fuel cellvehicle demonstrations. RD&D on small scale steam reformers maybe of particular interest.
It appears that hydrogen infrastructure development may not be assevere a technical and economic problem as is often stated. Furthercomparisons of hydrogen as a fuel for fuel cell vehicles (as comparedto methanol and gasoline) should be conducted.
1.9. ACKNOWLEDGMENTS
For useful conversations, the authors would like to thank ArchanaAgrawal (California Air Resources Board), Richard Bellows (Exxon),Jeff Bentley (AD Little), Tom Burhenn (Southern California Edison),Eck Chaiboonma (Los Angeles Metropolitan Transit Authority), DavidCrain (David Crain Associates), Michael Furgeson (Southern CaliforniaGas Company), Ranji George (South Coast Air Quality ManagementDistrict), Shimson Gottesfeld (Los Alamos National Laboratory), Mr.Green (Southern California Edison), Michael Kerr (Praxair), NathanielKong (California Air Resources Board), Paul Kydd (BOC), ChristianLenci (Praxair), Eric Larson (Princeton University), Jon Leonard(SCAQMD), Frank Lomax (Directed Technologies, Inc.), Robert Miller(Air Products and Chemicals, Inc.), Robert Moore (Air Products and'Chemicals, Inc.), David Nahmias (National Hydrogen Asso-ci~tion),Michael Payne (ARCO), James Provenzano (Xerox), Venki Raman (AirProducts and Chemicals, Inc.), Glenn Rambach (LLNL), Mr. Soriano(Los Angeles Department of Water and Power), Margaret Steinbugler(Princeton University), Wayne Tanaka (Southern California GasCompany), Sandy Thomas (Directed Technologies, Inc.), Mr. Thomas(Southern California Gas Company), Robert Williams (PrincetonUniversity), Gary Youngman (ARCO), Ed Yotter (California AirResources Board), and Robert Zweig (Clean Air Now).
r
23
References
Arthur D. Little. 1994. "Multi-Fuel Reformers for Fuel Cells Used inTransportation, Assessment of Hydrogen Storage Technologies, PhaseI Final Report," US DOE Office of Transportation Technologies, ContractNo. DE-ACO2-92-CE50343.
Burhenn, Tom, Southern California Edison, private communications1995.
Chaiboonma, Eck, Los Angeles Metropolitan Transit Authority,private communications 1996.
Chen, Jeffrey, "The Production of Methanol and Hydrogen Fuels fromMunicipal Solid Waste," Princeton University Center for Energy andEnvironmental Studies Report No. 289, March 1995.
Crain, David, David Crain Associates, private communications, 1995.
Delucchi, M.A.. 1992. "Hydrogen Fuel Cell Vehicles," UCD-ITS-RR-92-14, Institute of Transportation Studies, University of California, Davis.
Dennis, E.B. May 1994. "Design and Feasibility of a Gaseous HydrogenRefueling Station Based on Small Scale Steam Reforming of NaturalGas," Princeton University senior thesis, Department of ChemicalEngineering.
Farris, P. International Fuel Cells, private communications 1996.
General Motors-Allison Gas Turbine Division, "Research andDevelopment of Proton Exchange Membrane (PEM) Fuel Cell Systemfor Transportation Applications," for the US Department of EnergyEDR 16194, Nov. 1993.
George, Ranji, South Coast Air Quality Management District, privatecommuncations, 1995, 1996.
Gottesfeld, S., Los Alamos National Laboratory, privatecommunications 1996.
Katofsky, R.E., "The Production of Fluid Fuels from Biomass,"Princeton University Center for Energy and Environmental StudiesReport No. 279, June 1993.
24
Kerr, Michael, Praxair Inc., private communications 1995, 1996.
Kydd, Paul, BOC, private communications, 1995, 1996.
Larson, E.D., R.H. Williams, R.E. Katofsky and J. Chen. July 1995."Methanol and Hydrogen from Biomass for Transportation withComparisons to Methanol and Hydrogen from Natural Gas and Coal,"Princeton University Center for Energy and Environmental StudiesReport No. 292.
Larson, E.D., E. Worrell and J. Chen. January 1996. PrincetonUniversity Center for Energy and Environmental Studies Report No.293.
Lenci, Christian, Praxair Inc., private communications 1995.
Leonard, Jon, South Coast Air Quality Management District, privatecommuncations, 1995, 1996.
Moore, Robert, Air Products and Chemicals, Inc., Allentown, P A,private communications, 1995, 1996.
Ogden, J .M. and J. Nitsch. 1993. "Solar Hydrogen," Chapter 22 in T.Johansson, H. Kelly, A.K.N. Reddy and R.H. Williams, RenewableEnergy: Fuels and Electricity from Renewable Sources. Island Press,Washington, DC.
Ogden, J.M. June 24, 1993. "Renewable Hydrogen Energy SystemsStudies," final report for NREL Contract No. XR-2-11265-1.
Ogden, J.M., E.D. Larson and M.A. Delucchi. May 27, 1994. "AnAssessment of Renewable Transportation Fuels and Technologies,"report to the US Congress Office of Technology Assessment.
Ogden, J.M., E. Dennis, M. Steinbugler and J. Strohbehn. Jan. 18, 1995."Hydrogen Energy Systems Studies," final report to USDOE forContract No. XR-11265-2.
Ogden, J.M., E. Dennis and K. Montemayor. March 1995. "Developmentof Refueling Infrastructure for Hydrogen Vehicles," Proceedings ofthe 6th National Hydrogen Association Meeting, p. 237.
25
~ -
Ogden, J.M., T. Kreutz, S. Kartha and L. Iwan, August 13, 1996."Hydrogen Energy Systems Studies," final report to US DOE forContract No. DE-FGO4-94AL85803.
Prater, Keith, Ballard Power Systems, private communications 1995,1996.
Rambach, Glenn, Lawrence Livermore National Laboratory, privatecommunications 1995.
Sims, Ronald, Ford Motor Company, "Fueling Aspects of HydrogenFuel Cell Powered Vehicles," Society of Automotive Engineers,Proceedings, Fuel Cells for Transportation TOPTEC, April 1-2, 1996,Arlington, VA.
Tanaka, Wayne, Southern California Gas Company, privatecommunications, 1995.
Taylor, J.B., et.al., "Technical and Economic Assessment of Methods ofStoring Large Quantities of Hydrogen," International Journal ofHydrogen Energy, v. 11, pp. 5-22, 1986.
Thomas, C.E., "Overview of Onboard Liquid Fuel Storage andReforming Systems," "Fueling Aspects of Hydrogen Fuel Cell PoweredVehicles," Society of Automotive Engineers, Proceedings, Fuel Cellsfor Transportation TOPTEC, April 1-2, 1996, Arlington, Y A.
'Williams, R.B. January 1996. "Fuel Decarbonization for Fuel CellApplications and Srquestering of the Separated CO2," PrincetonUniversity Center for Energy and Environmental Studies Report No.296.
Williams, R.H., private communications, 1996.
Youngman, Gary, ARCO, private communications, 1995.
26
, "
FIG 1.1. NEAR TERM GASEOUS H2 SUPPLY OPTIONS~
CENTRALIZED REFORMING
(a) TRUCK DELI.V~RY
LH2 pump+vaporizer COMP. H2
r--t, dew a (;:;'.) r---, n GAS
[fJIQ b-d ~~..7'1-_-1i._~dispenser <~H~~~~)
(b) PIPELINE DELIVERY
dispenser CaMP H2storage .compressor c;:::~-n_.~:--- ~-
N G.!!! 8 U"~.!::!..?_y ~
CHEMICAL BY-PRODUCT HYDROGEN
( c ) R f .e Inery dispenser
or storage COMPo H2compressor § -O,<;~~GAS Chemical HZ l )
Plant ..HZ v h
ONSITE REFORMING reformer
( d) dispenserstorage COMP. H2compressor GAS
-~.§ §U'<:;;H~
ONSITE ELECTROLYSIS
(e) ELECTRICITY..dispenserr t ~~ 1,[~S~{s~~~1 e c t r 0 I y z e r s tor age COM P. H 2
compresso~::~--f1 G~<:=:J U"'<:~:E!f~~ JJ
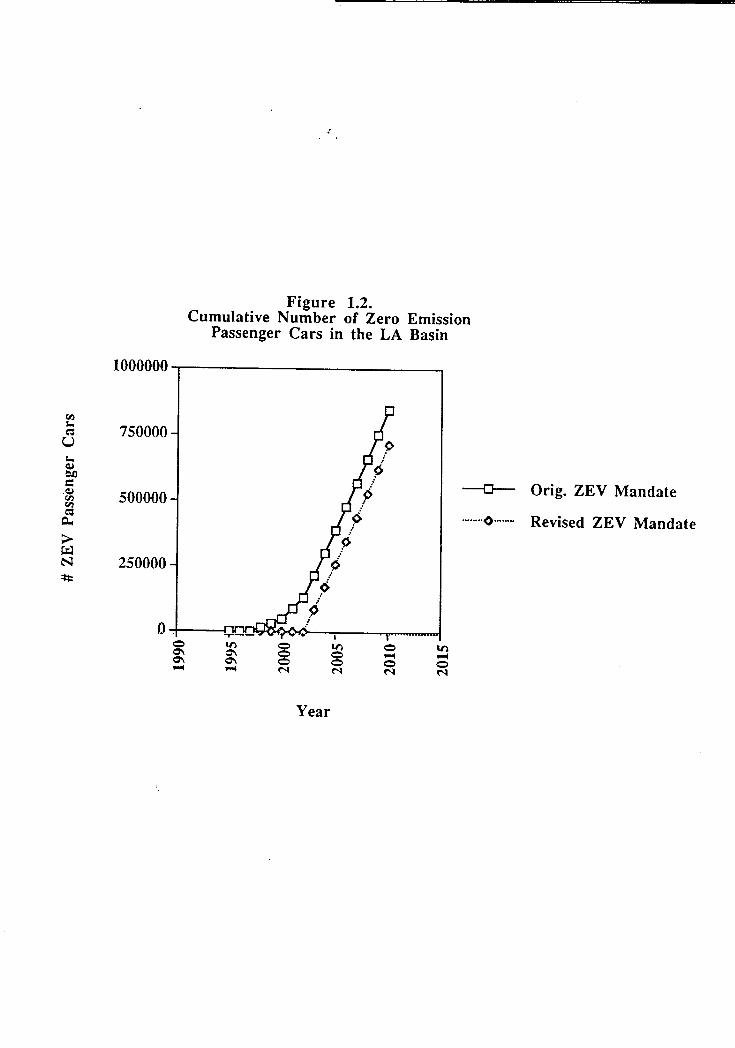
Figure 1.2.Cumulative Number of Zero Emission
Passenger Cars in the LA Basin
1000000
rI)
a 750000uI..OJOJ)= -a-- Orig. ZEV Mandate~ 500000rI)
c: "'0".."., Revised ZEV Mandate
~
;>~N 250000~
0 I I-= II") -= II") -= II")0\ 0\ -= -= ~ ~0\ 0\ -= -= -= -=~ ~ ("1 ("1 ("1 ("1
Year
..
Figure 1.3.Projections for Fuel Cell Passenger Cars in the
LA Basin for Various CommercializationScenarios (see Table 1.5)
800000
~ 9~ .
U "s.. 600000 .0~ .OJ) ,
~ ? --D- 50% ZEVs = FCVs after 2005rI) .~ 0~ 400000 : <) 50% ZEVs = FCVs, after 2003= 0' .0U~ : o' c 100% ZEVs=FCVs after 2003
, ..,-<;) .0
r? 200000 :' ..0;--<;::I .~~ :d
9.4.p.0 ~ .
0 Ir) 0 Ir) 0 Ir)0\ 0\ 0 0 ~ ~0\ 0'\ 0 0 0 0~ ~ N N N N
Year
7tf\"
;':c.":J;('
.."
Figure 1.4.A Possible Scenario for
Introducing Fuel Cell Vehiclesin the LA Basin
10% of New Buses = FCVs
starting in 1998
-80>-~ 5% of New Cars = FCVs;;:: starting in 2003Co)(/) 60
c0
.E: 40 0 H2 for Buses-"'0 D H2 for Carscca 20EQ)
c
~ 0comO~NMqo1t)<.D, comommoooooooooo~mmooooooooooo~~NNNNNNNNNNN
Year
-i ~:;~tlllllll: ~~ '0 -'jI 1'1 ' Im:Z: '" .I .Q 0
.;l,r!!:/;~m)-)- ). -.
:l j r! I'I'\!! I!~n~~ (") ~
If!) ~ I. .,. II ' 0 .."..'. l a..' .~ m -. I ;>- .-
;ii! 11.:-.: ~C r- ). ... r .~ ,.w '11', ,: -,.-:z: m .' ,.
I ~-t '" :t -..t-< (") c? ~:J:-
~ .t:jC D ~ -i ~ ~N-~ c C -.. ,.ni.I~'I~'1~Q- -
;g :: ~ i 'I~ ! "7 ":j .-J-~ ~ .~ "' 0 "":: r~ ~ &~.:,;;;CI i II > ---\.JD ~c ~ ~~x:~ ~ ~ --.,.. ~
;.~ ~
1~~i~~7 , ; r~ l g.= ~ " ,.,. l-.J .-i;" .~r::: : i; ~ 0 -J ,... -r"" "'"
": ~ ;::;t~8~ I; ;,z; ii w ~ \.J -) -0!~, ~:;' =~ i 0 ~ t:j - 0; li ~",.J e ~ l 0 <: cn Z I, .r""~~: t ~:: ! ~ ~ cn Ii 1; .j; Z -<..= -i;& ~ 5 ~ II > ~ ~ ~ cn~ t:j f ,.( Iii -.:1.c' w .~ "~ .-J""'-"" .I ~7 .! a ~ li : r ~ ...I:j -
r"T1 'i ~ r ~ t li;l i ~ .,! I:j X l ~ 0 -;; N ;.. n~ -, w.; I :;~ ( "On > ~ M -\.JCO :.~ = z, " :, w- ~ .,.. - ":j cn II ~ --""
'!" ..'-' ~ ..-J Z ,... l-) c: 1 ~ .:..: ,;'.. 0 <: cn \ .I ~ cn[D ~ It! ~ s ~ ',.: 0 :! -I:j -
~ CD ! i I i ii !; i; cn ~ ~ """j 8 ~ a-~ -.r"' -;;- .-4,. :J ",:--- .I "~f 0 M N N ~
~"; I:jcn (I('")
~ I:j~Q) no ~:J:v.-"'C ~ £1 -< N ~Ncn . ~ 0
0 ~ ., r -I; Ii I" -(") ,; "j; -":j 0 I:j-!:. " r"" 0 ":j 0
~ .., t:~z~(;;" ~ 0 00\= Z _0:J -J 0
t""¥co ":j 0 00 n 0
Q) (") -< ~o:J c.'" cn 11':1
~ VI;"'C :t -<0 CI:
-¥.CD:J- :: .r L. '" .
I,~ N V1 --,! ~,II: .-4,.- Ii i:
I:j --3 N > :j 1:0- X /...' ~~~~ -~~-
,,' 11 ~ r -"' ,/,," or:.. ~ -1 In." 0 ~ "p.,
" ¥ Z ,0 ...' ,I
C/) , 0 t: ."
I' 0 -:! .", I'c: I 0 """j :,' "-i Ii Ii
..., ; ., ","'C --J I:j ., !,
---, I: ,...;;:" I 'I .' Y \ .I t,.) I'" .I --"" ' ,C/) I "'. ~ ~
I '" /'; ~ '
5" J "", ",; ~ i; '../ -,
-.r"":J" t""(CD :r 0
z":jn
.' -<~~ cn
t\
w
. .
.
Figure
1.6.N
ear T
erm
Hydrogen
Supplies
and P
rojectedH
ydrogen D
emand
in the LA
B
asin -
Scenario
I (T
able 1.5)
100
7 >
. ~
:::::::
~
~~
~~
~~
:c ~
~~
~~
~
Q
H2
for B
uses-
50.'.'.'
u ::::::.
rJ2 ::::::
0 H
2 for
Cars
=
::::::
~
25 c
0 .:':.:
~
M
M=
r.. s..
~
0 M
~
\0
~
0~
==
'-'
~
0'100000.-1U
r..'
oS
Z
Coo
0'1 0
0 0
0 0
0~
-- coo-
.-IMM
MM
MM
r~'
---~-~
~
~
ow
~.
~'-
s.. -!;)
~
~b~
5~
~=
~
=
s
1 ~
~
'0 '0
..E
5 c...
~
=
=
~
00~
-- ~
s..c...
~
~
0 P
rojected H
ydrogenf.J! =
=
~
Dem
and -S
cenario I
=
0...J
.-I
Existing
§S
ources ~M=
=
Near
Term
Sources
Potential
Hydrogen
Supplies
--~- ~-- -
~ c,~ ~0 ~
2 + 00 -J +-« -JI- I- «U a: U) I-;:) [I: -C c..0 C U LU « 2 a.
~ 0" W[I: I- a: 2"" ,,~U) a. W:J 0 ;:)« N N > a: > a: c..N 0 I- +
[I: ~ :I: :I: ~ U U) U C ~ [I:
~ -J -J W 0 LU ~ CC ~ 2 ~~ « « Z [I: ~ I- « 2[I: [I: [I: -I- « [I: u C I- a:0 ;:) I- -J U a: c.. LU -W 0
~ u. I- 2 ~ W 0 ~ ..J 0;:) N ~ CDc" LU « W -..J I- 0 W -:I: -«-a: z u c.. W U) U -J -J C -J~
:; DEJEJ...G~~D~~~;J~Z (I) '.,. g0 ,- '" <D .,.
(I) -I()
->- 'I 0 -E-- -0 ...
~ Q) ~ 99£. = ...,...; --0-.-0 =C (I) U I. CO) '"~ c ~ 0
~ Ow = =
< 0') Z 0~ c ~ .,.E-- ~ .-.1 -~Z N Q)E g ...
--a.. ...~ ~ .-0 99£. =c" (1)- 0oZ C '0) r. ~ ~~O 0 ~
-0OE-- = ~~-<== E-- Q) 'z g
~ C CD ~~ 1 -..o~ -0 ...E-- ~ 99£. ~ ...
~ 00 I .0 ~U CO)
00 = =~ 0,...; >- ..,. 0 .,.-a.. &.. <D I()~ Q) --~ ~ > "I 0 ,..:3 N~= ~ ,..~ :I: a.. Q) 99£. 0 =0 -Jt-C ~ '"
.I.t--- 0 =
.=~I::) I::) I::) I::) I::) I::) = =
~ If) ~ ~ N ~ >- ~ Q) Q»-~ 21- (I) U>- U~~ ->- ~_"O,... 2 U c ~ ""4i ~ ~ '";I;'-.I 1-« 0"0 :J u.Q)
~ (r~/$) ISO~ Ua60JpAH « a. := -.u. ~ U)1-« -N N~ N:JU)U ~:I: :I:U :I:aI
:.~[]
8'l >
8~ ~~ """"""" 99£" LL
(5 ~" U~ ~ tI'lO" U>Ci) ~ ~O" ZZ-J 0Ow N -
Z :I: '.'.'.'.'.' 8 'l -J0 >- :.:.:.:.:.: "-J-E- w a: ~ -~oo ~ w 99 C'" ~°E-° -J > c. -
oo.OOU W :i '"~...J c..w .. >~C-'-< a: c
I-~ZE-~-- ~" -J ~ (..) >- 'l U~ ~ -< :J a: " , ..-of'~ U a: W ""-'"~ t- ~ 99£" a.~ N-J..-of'
:I: W ," -JC ..U
"
~ I :1-9£" ~Zw <t0 a: ~" I-
U>0 0 0 0 00 0 0 00 0 0 00 0 0 00 0 0 00 L() 0 L()0 L() C\I~
($) ISO~ 1 "V' Ild"V'~ NOll "V' IS
..I...Q
)
EI...
I...Q
) 0-
E
Q)
~I...
a:0
Q)
~E
(/)Q)
>u
-a:
~
:J:J .~
Q)
"C-:J
E
-(/)o~c..
~
(/) E
I...
Q)
Q)c..c
C
---Q)~
a>
(/) ~
~
~
P.
g>~
0') -0
(/) (/)_I...~
0-.-a-
-"C
v,a>
Q
) c
-=(/»0>
~
-(..) Q
) 3:
~a-..co>
-C
~
>>
~
""Q)
c x
:I: ..t:
:J 0
0...,
u. (..)
a-
a>
a>?
j :
m ~
~
6
~"
~
j :
~-;>
;
: "'C
.W
cn q-
-~
~
u
0)- cn
a>
U)
,~
~C
E
~
QE
~"
' c
~
-', ...0
a>w
C:o
~
'..., M
=
~
~"
' -
~
~
a>'\
"" ",e
.~
0 ~
a:'\
"" -
LL 0
'. "
..., .-\.
" .-
", ...,
"'-: "
N
~V
I .,
0"
' ,
0-".
' "-,
" ~
"0
'" ()
"-' -c
'\ "
:]\
'O
."'C-°,
0~
c..~
'0.
~
~
~
'.~
D-
c. ".:0..
~
-'.-0.' 0N
, , ~
'O:I:
"-' ."'0)
0
it) q-
M
N
~
0
($ U
OIIIIW
) IS
O~
lellde~
-,-
~~
.0". +
-J(/) <a: t:w a.c <z u(/) -
< -J a: >G > 0 J-
a: U (/) U a:W -J W (/) -W~ < G W a: (/)a: a: < a: ~ z a:0 :> a: a. "" W 0 ,LL J- 0 ~ W a. co ,W < J- 0 @ ~ octa: z (/) U C-J
D E] f11l ..1m ~
.~--(/)~-co0 Q)(.? "Ca:
~ ~~ .~ >''(;;u--:3(/) <0 CO -g- Ca- 1..."0) -U c ~ a.. U 99£. LL
O~ U.-CO C/) -(/)
~~ Z C/)Q) "" CO CU:3Q) ~ ~ LL. ~. Za- ! ~ ,0
~ 0 0 ~.-c. -J-(/)0) ~Q) C C -C CO .-
a-E ->-I- a- CU ~ t:
.Q 0 g U0> ~ .- a: oct-C '" -'" c~ a.T- Q) a: Q)':: .~ <
>(/)Q)O) C UI".OQ) 0~ -C ~ (..) 99£.O) (/)' cU-J:
O ~.
0 0 0 0 0 0LC) ~ M N ~
(r~/$) ISO:) "lH p8J8AI18a
,',t
..
Figure 1.10Cost of Hydrogen Pipeline Transmission vs.
Pipeline Length and Flow Rate
1000
Hydrogen Flow Rate
;:::; 100~ -a-- 1 million scf/dayfh
-::; 10 0 2 million scf/day0
U c 5 million scf/dayc.~ 1 6, 10 million scf/ day.~
~ ---8- --20 million scf/dayc 0 1 ~~~CQ .~
l-E- I I 3!~ Hydrogen Pipeline
0.01 I I I Rated up to 1000 psi
-<:> <:> P' I ' t-<:> Ipe Ine cos =-$1 million/mile
Pipeline Length (km) I I t P 1000 'n e ressure = pslaOutlet Pressure> 200 psi a
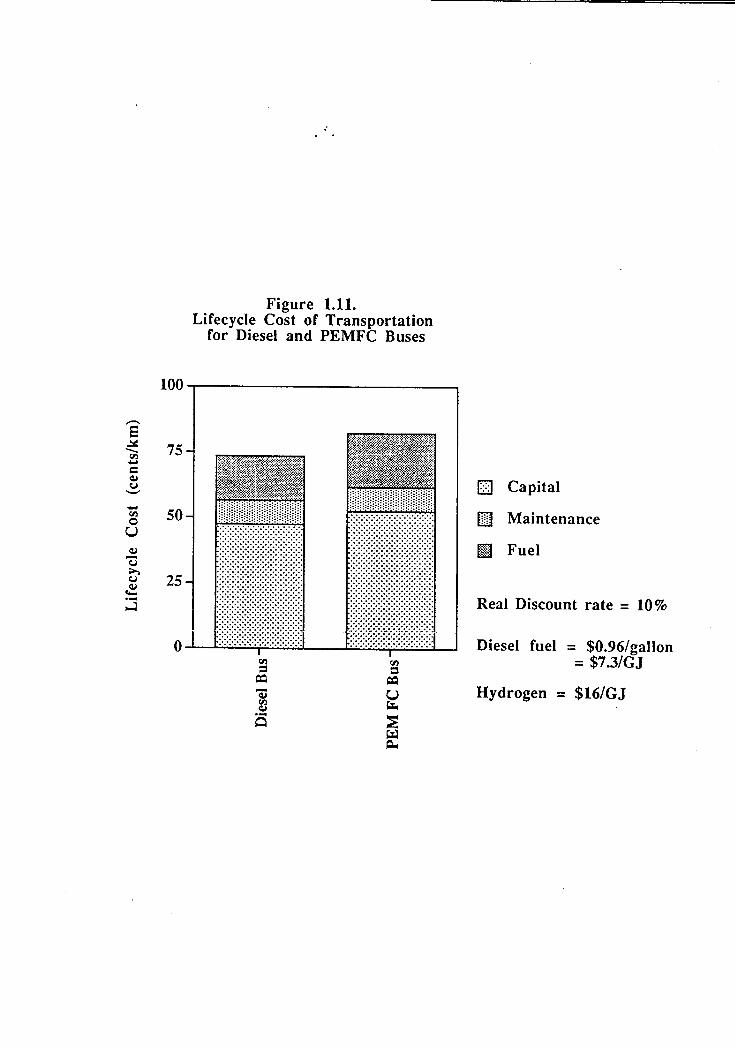
Figure 1.11.Lifecycle Cost of Transportation
for Diesel and PEMFC Buses
100
5 """'~';';"""',,;"<;',;:m";'~ mx'~"""""im"";" I";' .)3", ."=.;<::'.' .""', _<'C;,,w~,,;,., "-"" "",'X"~ 75 -~lt*I~@ifuIJii
~ :~~,if&;,~~,j.*~;-;&t~;gt .,~,I~*;,~M»'~w;~~~; [] Capital
-: ::::j:jjj:j:U:ujjj::j1j1~~~::j: "." .fI) 50- "."."""""""."".'...'.' .'..'.'...'...". rn Maintenance8 :':::';:;';;;:::i:::';;;':;:':::':::';~':::':::':~::::'::;':::': ~~~~~~~~~~~~~~~~~~~~~~~~~~~~~~~~~ E.iliJ
.2!. .~~~~~~~~~~~~~~~~~~~~~~~~~~~~~~~~~ ~~~~~~~~~~~~~~~~~~~~~~~~~~~~~~~~~ ral F u e I
k 25 -""'co' !.,,!.!c!.. Real Discount rate = 10%
0 .::::::::::::::::::::::::::::::::: ::::::::::::::::::::::::::::::::: DI.esel fuel - $0 96/gallon 'rn 'rn = $7.3/GJ
0 0~ ~'qj: U Hydrogen = $16/GJ'!: ~a ~
~~
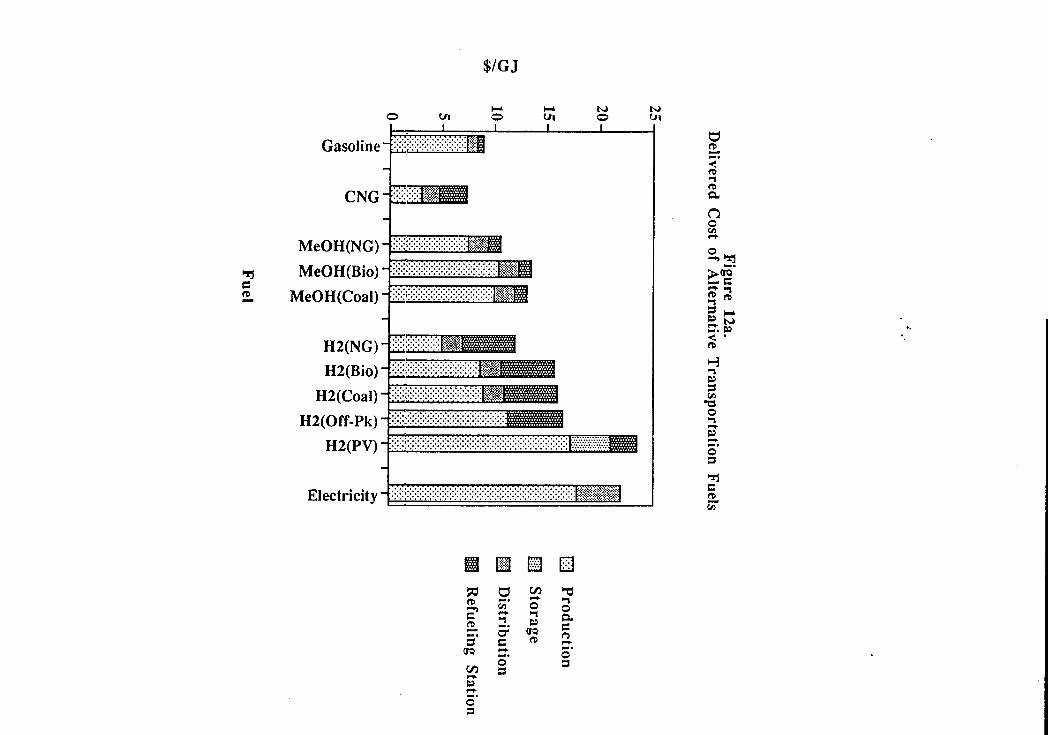
Figure 12a.
Delivered
Cost
of Alternative
Transportation
Fuels
2520
::::: D
P
roduction15
:::::~
~~
~~
D
S
torage~
~
10:~
:~:
mJ
Distribution
"f;}. :::;:~
:~:~
D
B
Refueling
Station
: ,;
~~
ii~ ~,,~
'"
.,-; :~~
:; j
~
roo C
...,.,
r~
0 -r..
0 -~
""-
....-Z
...,.,.- ~
...,.,.- ~
~
.-~
U
~
6
8 ~
6
8 ~
~
.~
~
==
- N
N_,-N
...
~
00=
==
~e=
~
~
~o
~N
r;;
~
~
~
=-
~
Fuel
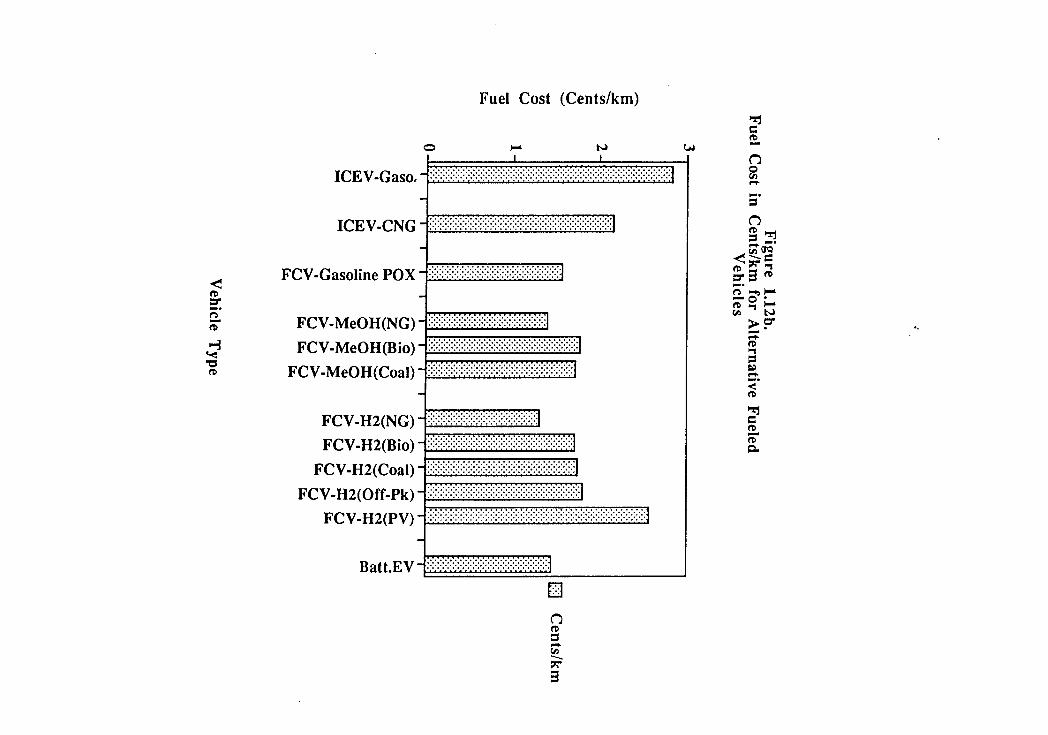
Figure 1.12b.
Fuel Cost in C
ents/km
for Alternative
Fueled
Vehicles
3
i: 7
,,-.. .'.'
...'.
~
2 -~~
~~
: ?~
~
~ll~
~
1- I
11 J
t ill f
[] C
ents/km
-."." "'.'"
'."." ".'.
.".'" ."."
'.0." '0"'
"""'. .'.".
.""". ".".
~
0 ,
I I
I ,
I I
I I
I I
I I
, I
I I
0.rOl
'""""' '""""'
'""""' '""""'
'""""' '""""'
'""""' '""""'
-""" rO
l 0
-r~
0 -~
~
Z
0
-.-~
-.-~
Q...""-
~~
U"
z~o
z~o
,Q...
.C
-' ---u
--u ~
, .Q
,) :=
:=-
NN
_'-N
~~
f;j
.5 0
0:=
:1;::1;: £ e
~
~~
U
'0
Q,)Q
,)O
~~
.N
~~
~
~
~
~
~
u
uU~
:I;: UC
-' ~
~.
~~
~~
~>
u
u ~
u
u ~
~
u
~~
~
Vehicle T
ype
~
-
Figure
1.12c.Lifecycle
Cost
of T
ransportation for
Alternative
Fueled
Vehicles
252015 ~
~~
~~
~
V
ehicle C
apital
~
10 :;:::
:~:~
: :~
:~. ~:~
: :~:~
~
j~~
~~~
~ ~j~
j ~~
j~ ~~
~~
~ i~
ij~ ~
0&
M
mil
Fuel
~
: ...C
c" "c
" ...::::::
ci C
~
-o=
' -o=
'~'-
>cn
Z
0 ~
.- ~
~
.- ~
c... ~
~
C
u c...
~68
~88~
o ...:
..~
=:=
:- M
M_c...M
~
~
~
~
OO
=:
=:=
:MO
=:~
~
~
:a ~
~O
»=
7N>
--~
~~
~
UU
~=
7U~
».
~~
U~
~.U
U
~
~
u
G
~~
U
~~
~
Vehicle T
ype
11
.,I"'~'
.11'-' ..'
,\
"' t,.,
' '\
t", ,
I'--,'c,;"'",,;..
,"j,,"'" ,"
,':'~
:'j": ,,""!i;
~
y,. ~
'
\ ~
~...,~
~-
, ,
.-, ~
,I
,,---, L--:-
2-,
," ,..
' C
o_"!'" ..
., '!.
JJ .;~
.' .'
:
~
CD
_/:Z
\~~
' ,,:';
~
'~,~
,~
:.':.C
D
.,,' .
...-..'
~
~, '.
;:,'::, ~
~
~
.; (jII1
, I(t
: .,,
Cf
.I, it,
", .
, .
': =
::s ;
~
t,
'~
~.~
t
.' ,;,
t,
0I't(
, -C
i
: C
'D
~r-
-'~
C
II ~
'
~
8 B
8
ffi ~
C
C
S
~
Q
C
C
=
~
[~
1~J
~
~
~
ro'
:; J~
i i'~
~
f i
'i'; j,'7 ~
$ ~t
~; '~J
~!J ~
, ~
f~
~ 5~
~
::I .0: ~
~
.,~
!\_~,
t .'t
J!
-~
x~
"., .~
,.~
~
~
;I, so
..c. J
~
--("
Ai'
t -t.
.' -'-'.
li,.!'- '
:' 1
~
.
~
-y ~
~ ,~
; rf '"
~o ~
t.l l
.'3 ~
i ~
2 ~~
-.' ~
:- ,,~
~~
..~:J
I~
..' 2
Or- --",
" yJo~
: A
" &
.. r"
J- -;r
-" 0
,'i~
:.~~
" a:O
J 2"
~f..-:-i-~
"'a~
-:J":-s ;~
'
': I
: -!
ir r~
~
:.:i";~
~":;;::~
i
~
!9~
t;J ~ i" ;;
:; ;
~
:,
II: -'c"
.~,'"
~
'" ,~
"..
,,~,,~
.".
'- 1
.~.
a.3 ,.
.;.
-,,~.
t'
,![ Z
Or"
;~,~
,;x
!.', !.~
c-~
'"
,,-; .
-j; I~
~
'-~
::
.~
.:~
pf ,r.,
e" e-
.'..;;; ~
~
.. ';~
0;
0.
1\ ,,~
., ~
~
M"a.j'
.~~
.( ~
~
~"""-~
.S
.~
J~~~
%
t, ~
.; -fi
" "5
'j" ~
;.,A,~
;~
r. ;
.
l'.,~
.II"". ~
. ..,.,
"'1
,.,,-, Q
0:
~
." to,c.
' ..'"ft'
P
~
-~
.,t!
! ~
!.
~~
,:;r
~
!!~
~
,If ~
') ~
~
~p
~
-" ..
-, v.
..~
S
~
~~
L'
!~
.,.."
,~
~
,"" ~
"~.l'"
~~
r.!!~'.~
-.
.J ;1
,"K
...: 3
~
,J .,.
"f .
;r~'.,
rn~v
",I... ["'!1
cnC
)',;.lI:=l'*
rJ;'."'~~
"i
3?;U-~
~~
". ""...~
~~
--If
.,~~
,~
~.":
~
.,0
t
'.."
~
a ..~
:
t -
v ~
." 1
.:
! I
-re
.,., C
-t~
§g C
/) 't
~ ~
~ ~
~ ~
l;!j ~ I:;] ~ §] § ~ ~
ro fa
~~
I 1
!~ ,:01
' fif
'~!' ":2 :~
".. ~
~ "~
m ~.. "(
~
~
..iW
3 ~
1;,. f
!oil
ct ;
." et
.,~
;t! -J
.oJ, ~
~
J~
~
t. ~
~
l -f;""
10 ~
~"
:z. A
i~'
I!s-~..
:.. ~
. !~
""
~
"; ~
)9 -
.f'1~
~.-_&
! .."~
t.':"'~.c~
~~
~
M
-~
f' (1)
: ~
~
.. ,~.. :':! ~
" .~
~
t ~:
,,~ ~
~ ~
:;~)
-~
'-.- <
II ."
~-
.~"i
~~
.~
~.,
~~
~
~
i.~
...!
;; ~
i;i ~
i;1 .,; ~
i ~
-;.~ ~
1 ~E
" :':'
~
'J~
=-.~
~.
;~
-'. w
'" w
'. -
I f!1
~~
I" :t -.,"E
-q"
A 'f~
l'" A
k ~I:
~
I; ~
I,
...)(!r'~
~:",y
:1~i~
~,~
,~~
~
.'fo0
11),
.~.
~"
fz
,:,~.
~
t" .'"
l -
~"'~
~-
~.-.'."...;.~'t
1".",0,.. I
...'
..0 --."
..w
."""',. '
:~"~
~A
.~
:,,{:I:~~
<"~
"~J."
aI", 3
J~.~
"."t;~r;
J'~"-~
~..L'~
,.
Ir
I .-.~
.. "
.i- :I
r '
:' ~
! l?
~
..~;.
~
~
~;.~
.!
I: ~
,'I::
a. :I:
,', s~
JJA
~..'
",'i
J ~
A
" ~
"
~~
,
! i
.t2'
0 N
: ~
.. ..~
."=
.~
1!
~
c:'t'~
-.l~
O
'A"
<
.~..
i !"i.
..:J ~
I 1...
t. -11).-
~
J O
:J
i ~
-:
:J V
' ", !'-
-~-,
r -~
, 'O
» -,--,
.
.-I@
.'l
'W10'c
£OO
.ON
9£:L
96 1Z
J~
W
,-£1Z:l31
'9N3
03 ~
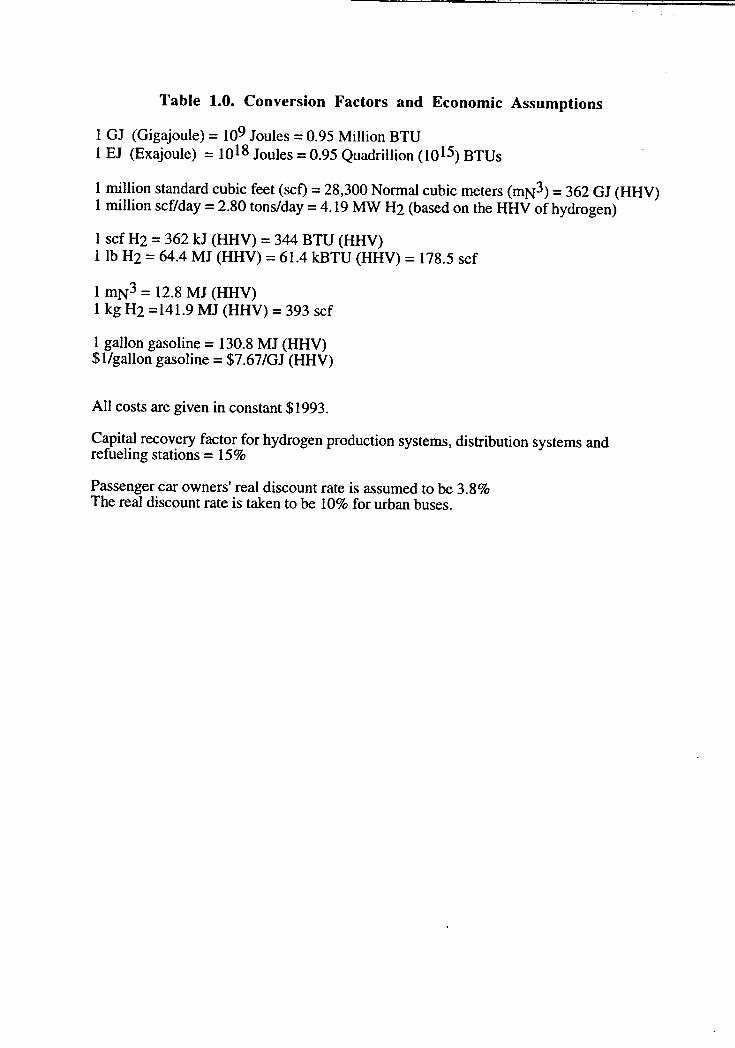
Table 1.0. Conversion Factors and Economic Assumptions
1 GJ (Gigajoule) = 109 Joules = 0.95 Million BTU1 EJ (Exajoule) = 1018 Joules = 0.95 Quadrillion (1015) BTUs
1 million standard cubic feet (sct) = 28,300 Normal cubic meters (mN3) = 362 GJ (HHV)1 million scf/day = 2.80 tons/day = 4.19 MW H2 (based on the HHV of hydrogen)
1 scf H2 = 362 kJ (HHV) = 344 BTU (HHV)lIb H2 = 64.4 MJ (HHV) = 61.4 kBTU (HHV) = 178.5 scf
1 mN3 = 12.8 MJ (HHV)1 kg H2 =141.9 MJ (HHV) = 393 scf
1 gallon gasoline = 130.8 MJ (HHV)$1/gallon gasoline = $7.67 /GJ (HHV)
All costs are given in constant $1993.
Capital recovery factor for hydrogen production systems, distribution systems andrefueling stations = 15%
Passenger car owners' real discount rate is assumed to be 3.8%The real discount rate is taken to be 10% for urban buses.

TABLE 1.1.DATA AND PROJECTIONS FOR VEHICLE POPULATIONS, FUEL
ECONOMY, ANNUAL MILEAGE AND ENERGY USE FORPASSENGER CARS, LIGHT TRUCKS AND URBAN BUSES IN THE
SOUTH COAST AIR BASIN
Passen~er CarsYear # Vehicles Average Average Average Energy
Fuel Miles/Yr/ Energy Use AllEconomy Vehcle Use/Yr/ Passenger(mpg) Vehicle Cars
(GJ/yr) (EJ/yr)1995 7,419,502 23.6 11,311 62.7 0.462000 8,141,691 25.8 11,379 57.7 0.472005 8,753,995 27.6 11,035 52.3 0.462010 9,365,800 29.0 10,724 48.4 0.45
Lifl,ht TrucksYear # Vehicles Average Average Average Energy
Fuel Miles/Yr/ Energy UseEconomy Vehicle Use/Yr/ (EJ/yr)
.(mpg) Vehicle(GJ/yr)
1995 1,368,212 17.1 11,854 90.7 0.122000 1,513,177 18.0 11,960 86.9 0.132005 1,639,484 18.3 11,633 83.1 0.142-010 1,765,701 18.4 11,213 79.7 ,0.14 '
Urban BusesYear # Vehicles Average Average Average Energy
Fuel Miles/Yr/ Energy UseEconomy Vehcle Use/Yr/ (EJ/yr)(mpg) Vehicle
(GJ/yr)1995 2926 3.5 50,646 1892 0.00342000 3076 3.5 50,668 1894 0.00342005 3188 3.5 50,720 1895 0.00332010 3300 3.5 50,658 1893 0.0033
Source: Ranji George, SCAQMD, private communications 1995.Passenger cars and light trucks under 3750 lb. are subject to the ZEV
mandate.
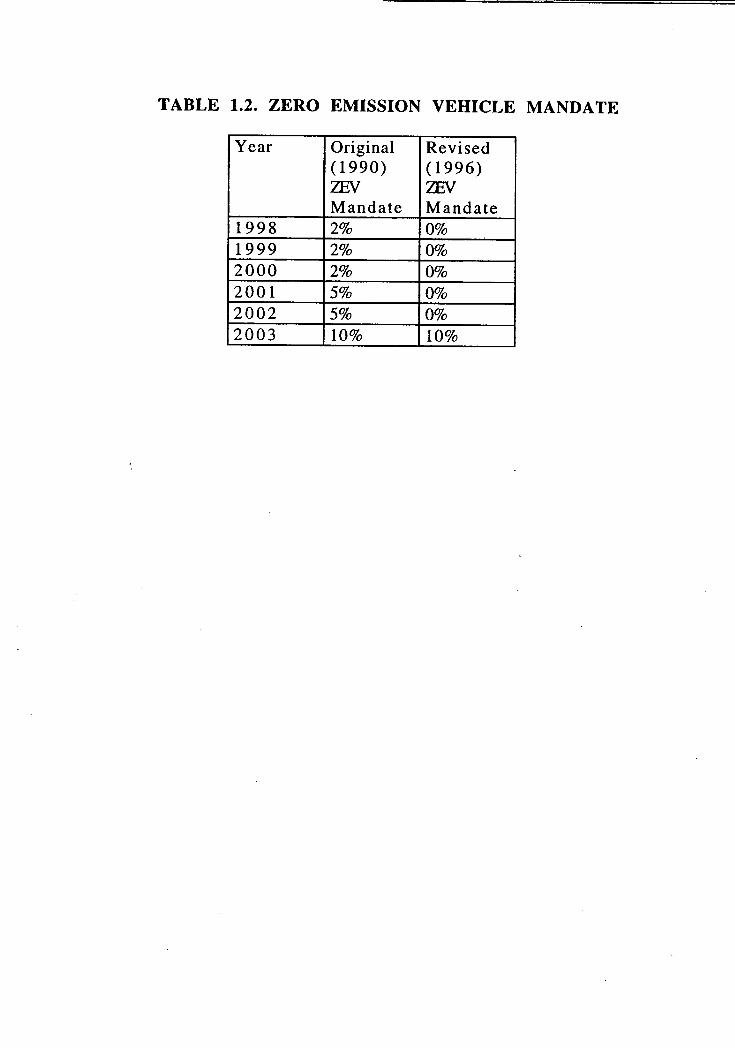
TABLE 1.2. ZERO EMISSION VEHICLE MANDATE
Year Original Revised
(1990) (1996)ZEV ZEVMandate Mandate
1998 2% 0%
1999 2% 0%
2000 2% 0%
2001 5% 0%2002 5% 0%
2003 10% 10%
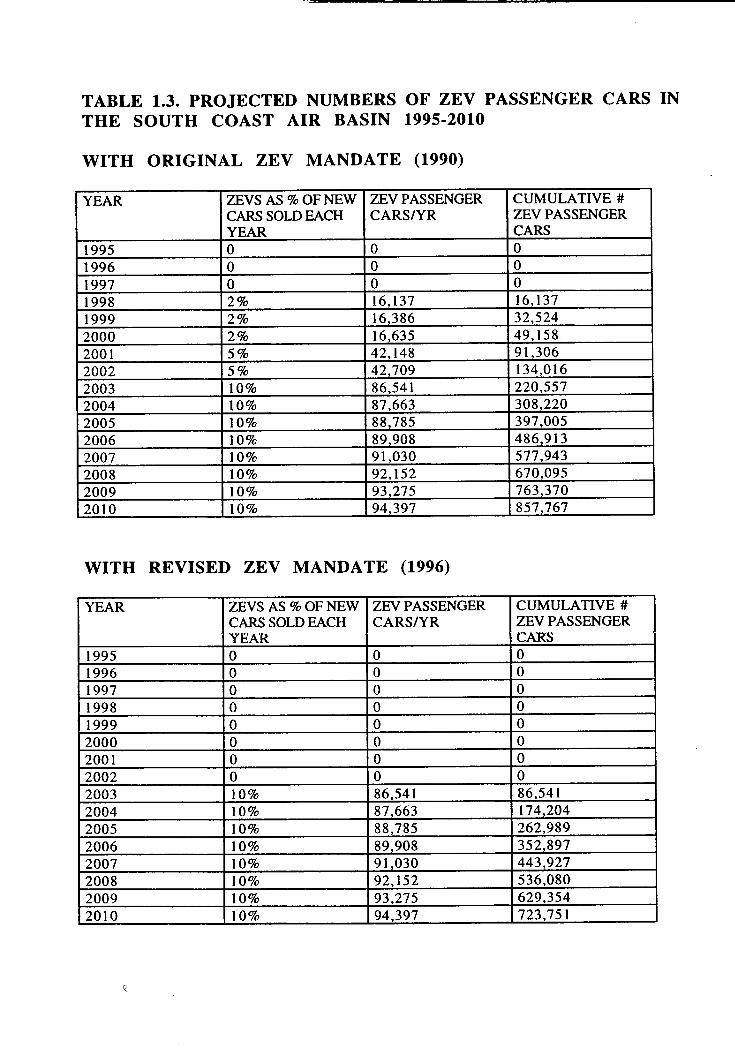
TABLE 1.3. PROJECTED NUMBERS OF ZEV PASSENGER CARS INTHE SOUTH COAST AIR BASIN 1995-2010
WITH ORIGINAL ZEV MANDATE (1990)
YEAR ZEVS AS % OF NEW ZEV PASSENGER CUMULATIVE #CARS SOLD EACH CARS/YR ZEV PASSENGERYEAR CARS
1995 0 0 01996 0 0 0
1997 0 0 0
1998 2% 16,137 16,1371999 2 % 16,386 32,5242000 2% 16635 49,158
2001 5% 42,148 91,3062002 5% 42,709 134,0162003 10% 86,541 220,557
2004 10% 87,663 308,2202005 10% 88,785 397,0052006 10% 89,908 486,9132007 10% 91,030 577,9432008 10% 92,152 670,0952009 10% 93,275 763,3702010 10% 94,397 857,767
WITH REVISED ZEV MANDATE (1996)
YEAR ZEVS AS % OF NEW ZEV PASSENGER CUMULATIVE #CARS SOLD EACH CARS/YR ZEV PASSENGER'YEAR CARS
1995 0 0 01996 0 0 01997 0 0 01998 0 0 0
1999 0 0 02000 0 0 0
2001 0 0 02002 0 0 0
2003 10% 86,541 86,5412004 10% 87,663 174,2042005 10% 88,785 262,989
2006 10% 89,908 352,8972007 10% 91,030 443,9272008 10% 92,152 536,080
2009 10% 93,275 629,3542010 10% 94,397 723,751
Q
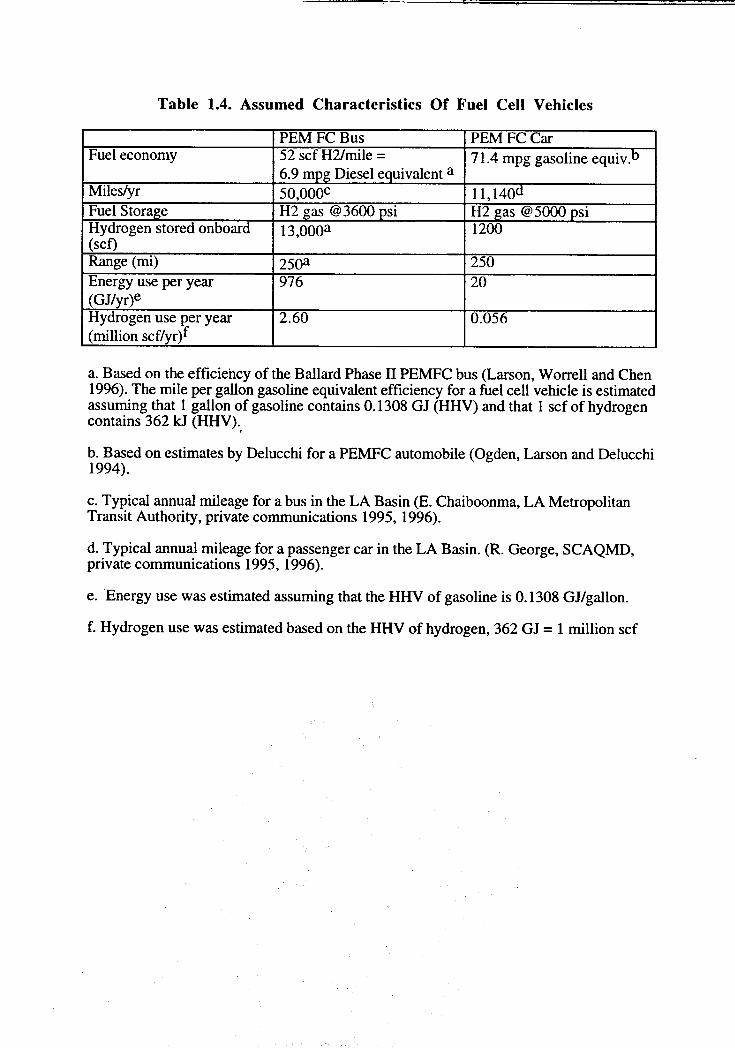
--~
Table 1.4. Assumed Characteristics Of Fuel Cell Vehicles
PEM FC Bus PEM FC CarFuel economy 52 scf H2/mile = 71.4 mpg gasoline equiv.b
6.9 mpg Diesel equivalent a
Miles/yr 50,000C 11,140dFuel Storage H2 gas @3600 psi H2 ,gas @ 5000 psiHydrogen stored onboard 13,000a 1200(scf)Range(mi) 250a 250Energy use per year 976 20
(GJ/yr)eHydrogen use per year 2.60 0.056(million scf/yr)f
a. Based on the efficiency of the Ballard Phase II PEMFC bus (Larson, Worrell and Chen1996). The mile per gallon gasoline equivalent efficiency for a fuel cell vehicle is estimatedassuming that 1 gallon of gasoline contains 0.1308 GJ (HHV) and that 1 scf of hydrogencontains 362 kJ (HHV\
b. Based on estimates by Delucchi for a PEMFC automobile (Ogden, Larson and Delucchi1994) .
c. Typical annual mileage for a bus in the LA Basin (E. Chaiboonma, LA MetropolitanTransit Authority, private communications 1995, 1996).
d. Typical annual mileage for a passenger car in the LA Basin. (R. George, SCAQMD,private communications 1995, 1996).
e. Energy use was estimated assuming that the HHV of gasoline is 0.1308 GJ/gallon.
f. Hydrogen use was estimated based on the HHV of hydrogen, 362 GJ = 1 million scf
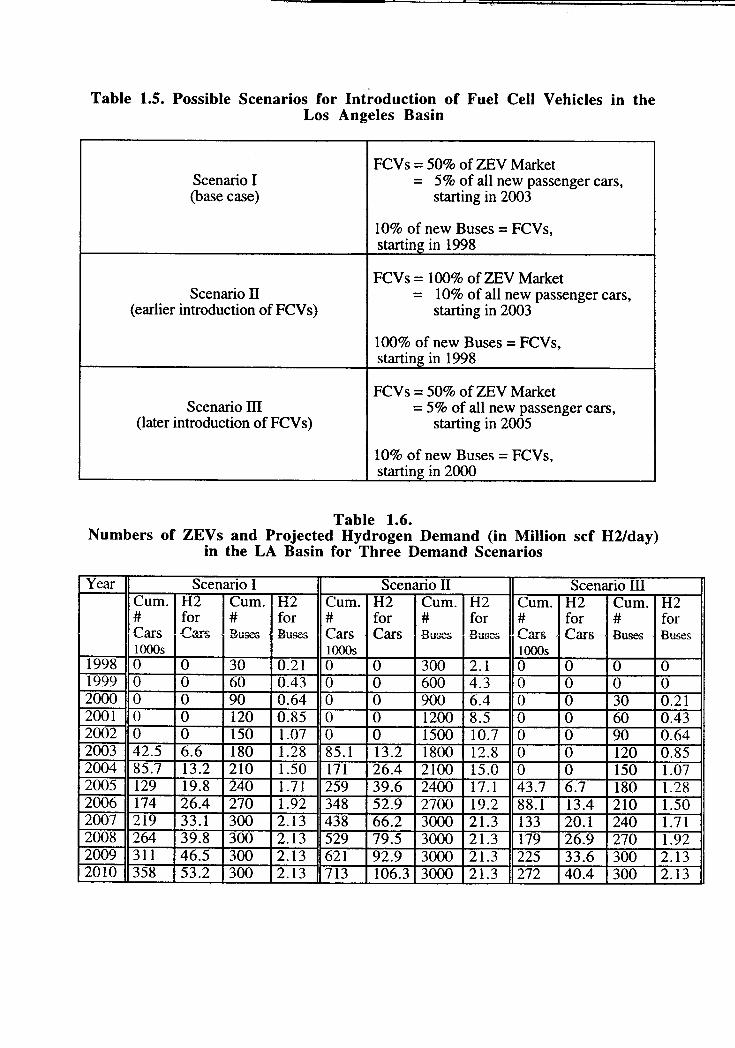
--
Table 1.5. Possible Scenarios for Introduction of Fuel Cell Vehicles in theLos Angeles Basin
FCV s = 50% of ZEV MarketScenario I = 5% of all new passenger cars,(base case) starting in 2003
10% of new Buses = FCVs,starting in 1998
FCV s = 100% of ZEV MarketScenario n = 10% of all new passenger cars,
(earlier introduction of FCV s) starting in 2003
100% of new Buses = FCVs,starting in 1998
FCV s = 50% of ZEV MarketScenario ill = 5% of all new passenger cars,
(later introduction of FCV s) starting in 2005
10% of new Buses = FCVs,starting in 2000
Table 1.6.Numbers of ZEVs and Projected Hydrogen Demand (in Million scf H2/day)
in the LA Basin for Three Demand Scenarios
Year Scenario I Scenario n Scenario IIICum. H2 Cum. H2 Cum. H2 Cum. H2 Cum. H2 Cum. H2# for # for # for # for # for # forCars Cars Ruse-:; Buses Cars Cars Buses Bllses Cars, Cars Bu9 S Busesl000s l000s l000s
1998 0 0 30 0.21 0 0 300 2.1 0 0 0 01999 0 0 60 0.43 0 0 600 4.3 0 0 0 02000 0 0 90 0.64 0 0 900 6.4 0 0 30 0.212001 0 0 120 0.85 0 0 1200 8.5 0 0 60 0.432002 0 0 150 1.07 0 0 1500 10.7 0 0 90 0.642003 42.5 6.6 180 1.28 85.1 13.2 1800 12.8 0 0 120 0.852004 85.7 13.2 210 1.50 171 26.4 2100 15.0 0 0 150 1.072005 129 19.8 240 1.71 259 39.6 2400 17.1 43.7 6.7 180 1.282006 174 26.4 270 1.92 348 52.9 2700 19.2 88.1 13.4 210 1.502007 219 33.1 300 2.13 438 66.2 3000 21.3 133 20.1 240 1.712008 264 39.8 300 2.13 529 79.5 3000 21.3 179 26.9 270 1.922009 311 46.5 300 2.13 621 92.9 3000 21.3 225 33.6 300 2.132010 358 53.2 300 2.13 713 106.3 3000 21.3 272 40.4 300 2.13
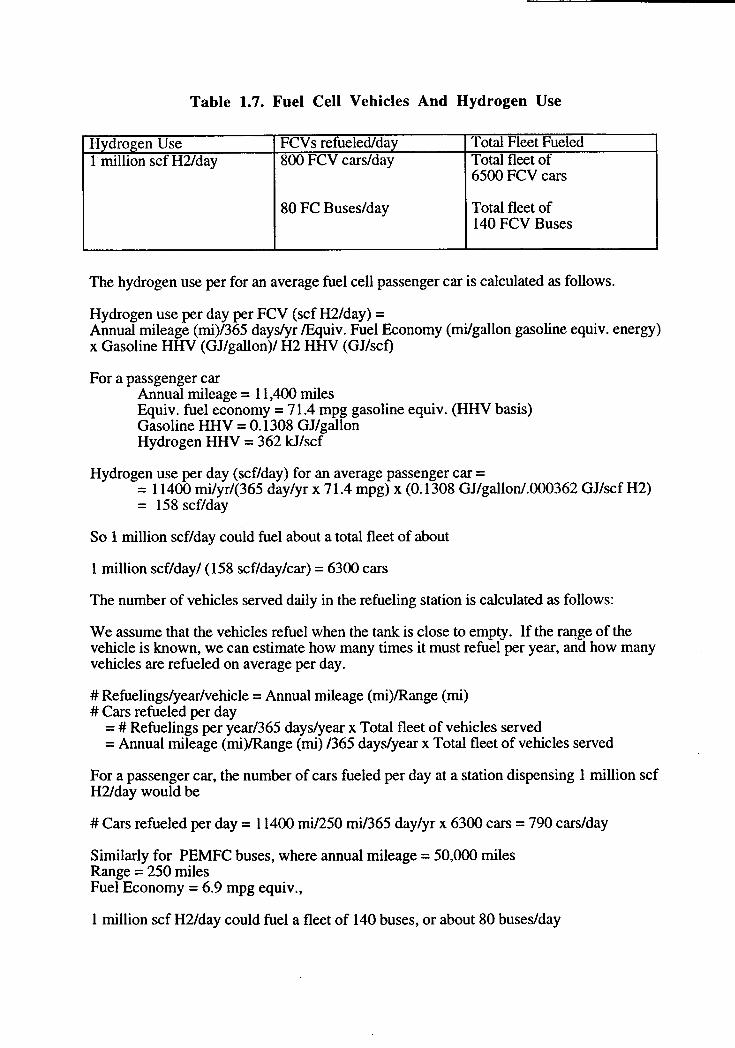
Table 1.7. Fuel Cell Vehicles And Hydrogen Use
Hydrogen Use FCVs refueled/day Total Fleet Fueled1 million scf H2/day 800 FCV cars/day Total fleet of
6500 FCV cars
80 FC Buses/day Total fleet of140 FCV Buses
The hydrogen use per for an average fuel cell passenger car is calculated as follows.
Hydrogen use per day per FCV (scf H2/day) =Annual mileage (mi)/365 days/yr /Equiv. Fuel Economy (mi/gallon gasoline equiv. energy)x Gasoline HHV (GJ/gallon)/ H2 HHV (GJ/scf)
For a passgenger carAnnual mileage = 11,400 milesEquiv. fuel economy = 71.4 mpg gasoline equiv. (HHV basis)Gasoline HHV = 0.1308 GJ/gallonHydrogen HHV = 362 kJ/scf
Hydrogen use per day (scf/day) for an average passenger car == 11400 mi/yr/(365 day/yr x 71.4 mpg) x (0.1308 GJ/gallon/.OOO362 GJ/scf H2)= 158 scf/day
So 1 million scf/day could fuel about a total fleet of about
1 million scf/day/ (158 scf/day/car) = 6300 cars
The number of vehicles served daily in the refueling station is calculated as follows:
We assume that the vehicles refuel when the tank is close to empty. If the range of thevehicle is known, we can estimate how many times it must refuel per year, and how manyvehicles are refueled on average per day.
# Refuelings/year/vehicle = Annual mileage (mi)/Range (mi)# Cars refueled per day
= # Refuelings per year/365 days/year x Total fleet of vehicles served= Annual mileage (mi)/Range (mi) /365 days/year x Total fleet of vehicles served
For a passenger car, the number of cars fueled per day at a station dispensing 1 million scfH2/day would be
# Cars refueled per day = 11400 mi/250 mi/365 day/yr x 6300 cars = 790 cars/day
Similarly for PEMFC buses, where annual mileage = 50,000 milesRange = 250 milesFuel Economy = 6.9 mpg equiv.,
1 million scfH2/day could fuel a fleet of 140 buses, or about 80 buses/day
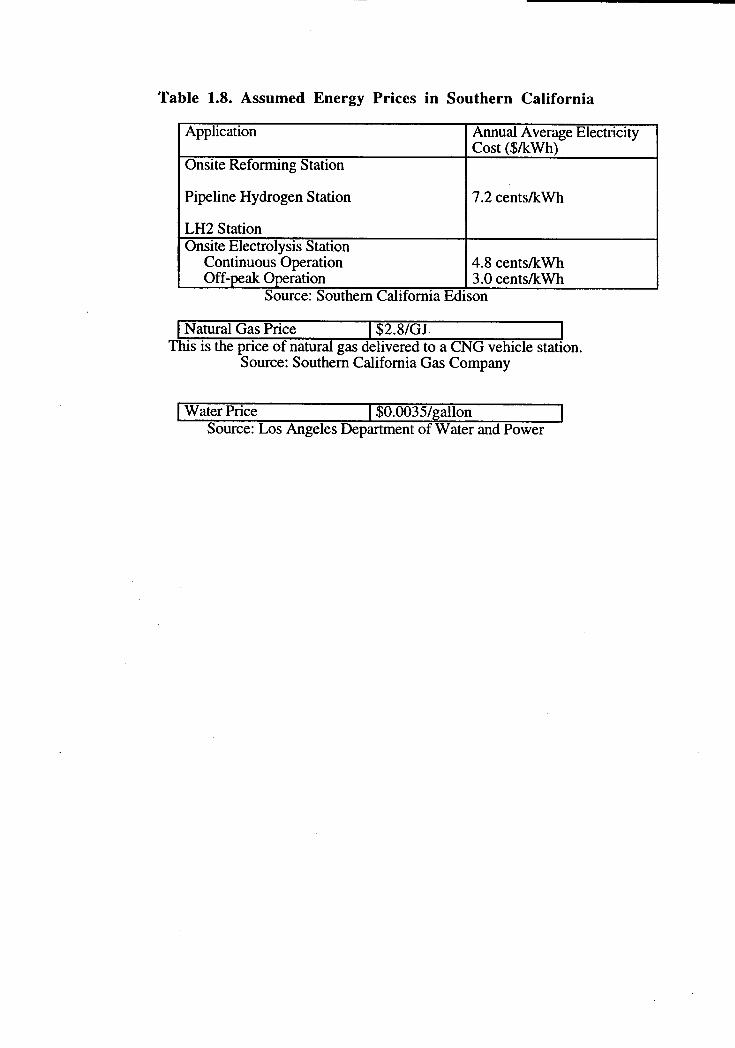
Table 1.8. Assumed Energy Prices in Southern California
Application Annual Average ElectricityCost ($/kWh)
Onsite Refonning Station
Pipeline Hydrogen Station 7.2 cents/kWh
LH2 StationOnsite Electrolysis Station
Continuous Operation 4.8 cents/kWhOff-peak Operation 3.0 cents/kWh
Source: Southern California Edison
I ~~tural Gas Price I $2.8/GJ IThis is the price of natural gas delivered to a CNG vehicle station.
Source: Southern California Gas Company
I Wat~r Price I $0.OO35/gallon ISource: Los Angeles Department of Water and Power
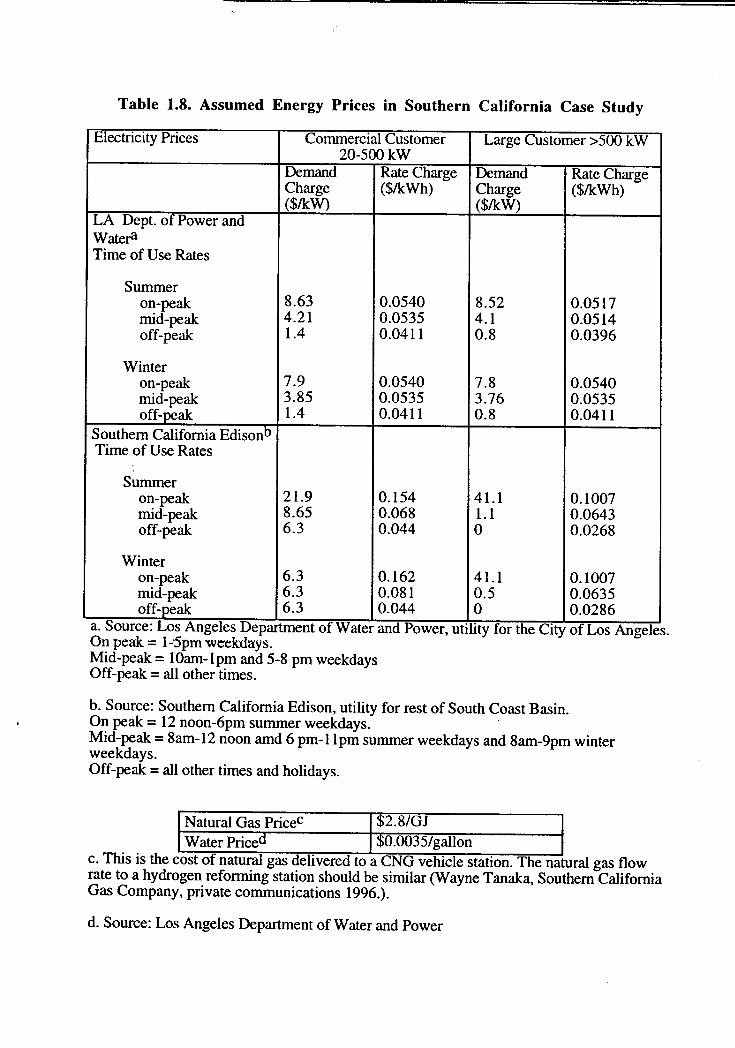
Table 1.8. Assumed Energy Prices in Southern California Case Study
Electricity Prices Commercial Customer Large Customer >500 kW20-500 kW
Demand Rate Charge Demand Rate ChargeCharge ($/kWh) Charge ($/kWh)($/kW) ($/kW)
LA Dept. of Power andWateraTime of Use Rates
Summeron-peak 8.63 0.0540 8.52 0.0517mid-peak 4.21 0.0535 4.1 0.0514off-peak 1.4 0.0411 0.8 0.0396
Winteron-peak 7.9 0.0540 7.8 0.0540mid-peak 3.85 0.0535 3.76 0.0535off-peak 1.4 0.0411 0.8 0.0411
Southern California EdisonDTime of Use Rates
Summeron-peak 21.9 0.154 41.1 0.1007mid-peak 8.65 0.068 1.1 0.0643off-peak 6.3 0.044 0 0.0268
Winteron-peak 6.3 0.162 41.1 0.1007mid-peak 6.3 0.081 0.5 0.0635off-peak 6.3 0.044 0 0.0286
a. Source: Los Angeles Department of Water and Power, utility for the City of Los Angeles.On peak = 1--5pm weekd.rY$.Mid-peak = 10am-lpm and 5-8 pm weekdaysOff-peak = all other times.
b. Source: Southern California Edison, utility for rest of South Coast Basin..On peak = 12 noon-6pm summer weekdays. .
Mid-peak = 8am-12 noon amd 6 pm-II pm summer weekdays and 8am-9pm winter
weekdays.Off-peak = all other times and holidays.
Natural Gas Pricec 2.8/0J
Water Price 0.0035/gallonc. This is the cost of natural gas delivered to a CNO vehicle station. The natural gas flowrate to a hydrogen reforming station should be similar (Wayne Tanaka, Southern CaliforniaGas Company, private communications 1996.).
d. Source: Los Angeles Department of Water and Power
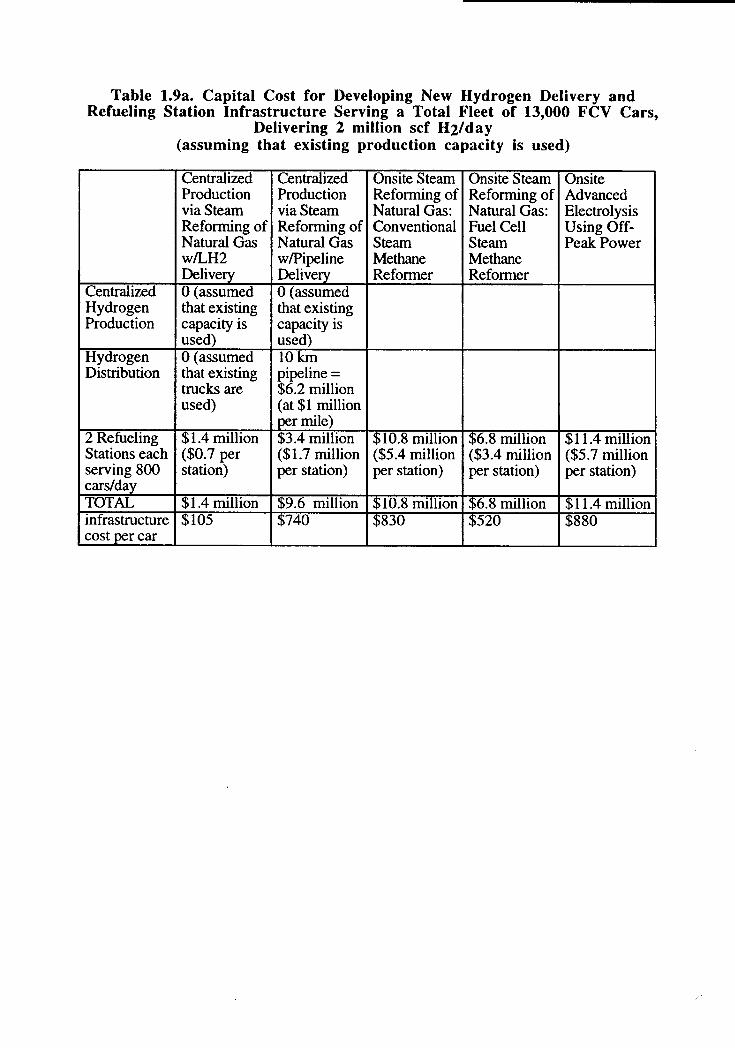
Table 1.9a. Capital Cost for Developing New Hydrogen Delivery andRefueling Station Infrastructure Serving a Total Fleet of 13,000 FCV Cars,
Delivering 2 million scf Hvday(assuming that existing production capacity is used)
Centralized Centralized Onsite Steam Onsite Steam OnsiteProduction Production Reforming of Reforming of Advancedvia Steam via Steam Natural Gas: Natural Gas: ElectrolysisReforming of Reforming of Conventional Fuel Cell Using Off-Natural Gas Natural Gas Steam Steam Peak Powerw/LH2 w/Pipeline Methane MethaneDelivery Delivery Reformer Reformer
Centralized 0 (assumed 0 (assumedHydrogen that existing that existingProduction capacity is capacity is
used) used)Hydrogen 0 (assumed 10 kInDistribution that existing pipeline =
trucks are $6.2 millionused) (at $1 million
per mile)2 Refueling $1.4 million $3.4 million $10.8 million $6.8 million $11.4 millionStations each ($0.7 per ($1.7 million ($5.4 million ($3.4 million ($5.7 millionserving 800 station) per station) per station) per station) per station)cars/dayTOTAL $1.4 million $9.6 million $10.8 million $6.8 million $11.4 millioninfrastructure $105 $740 $830 $520 $880cost per car
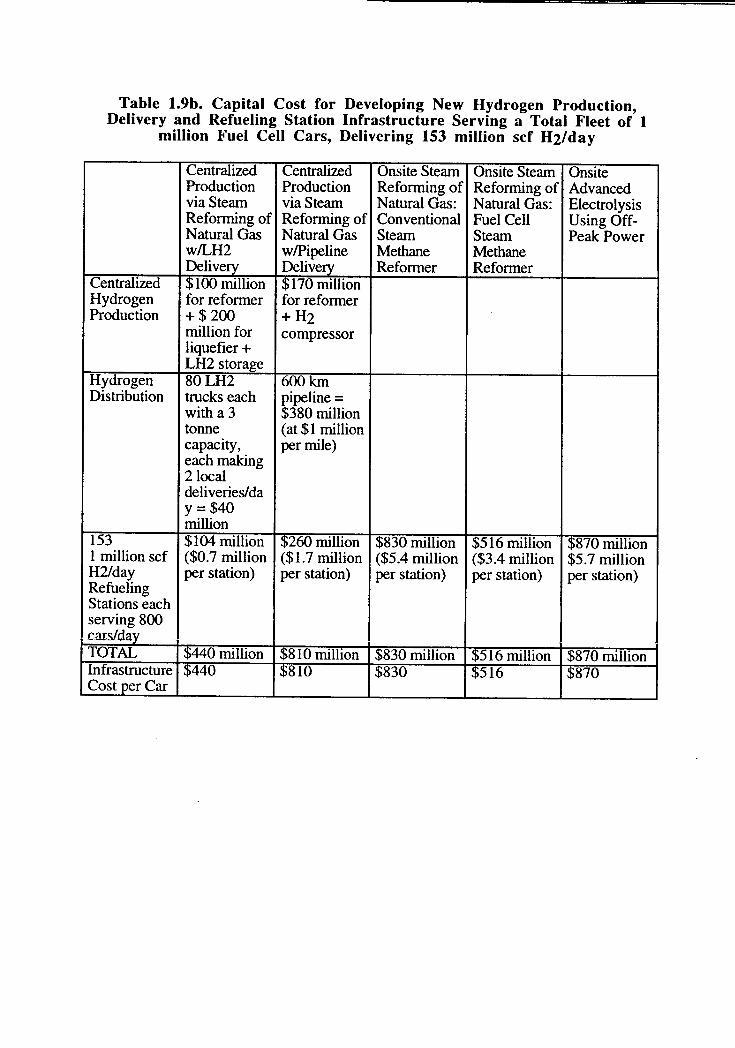
Table 1.9b. Capital Cost for Developing New Hydrogen Production,Delivery and Refueling Station Infrastructure Serving a Total Fleet of 1
million Fuel Cell Cars, Delivering 153 million scf Hvday
Centralized Centralized Onsite Steam Onsite Steam OnsiteProduction Production Reforming of Reforming of Advancedvia Steam via Steam Natural Gas: Natural Gas: ElectrolysisReforming of Reforming of Conventional Fuel Cell Using Off-Natural Gas Natural Gas Steam Steam Peak Powerw/LH2 w/Pipeline Methane MethaneDelivery Delivery Reformer Reformer
Centralized $100 million :I) 170 millionHydrogen for reformer for reformerProduction + $ 200 + H2
million for compressorliquefier +LH2 storage
Hydrogen 80 LH2 600 kmDistribution trucks each pipeline =
with a 3 $380 milliontonne (at $1 millioncapacity, per mile)each making2 localdeliverieslday=$40million
153 $104 million $260 million $830 million $516 million $870 million1 million scf ($0.7 million ($1.7 million ($5.4 million ($3.4 million $5.7 millionH2/day per station) per station) per station) per station) per station)RefuelingStations eachserving 800cars/dayTOTAL $440 million _:1)810 million $830 million ~516 million $870 millionInfrastructure $440 $810 $830 :1)516 $870Cost 2!?r Car

Table 1.10. Comparison of Projected Vehicle Performance and LifecycleCost
Urban Buses Mid-size automobilesPEM FC Bus Diesel Bus PEM FC Car Gasoline
ICEVEfficiency 6.? mpg 3.5 mpg 71.4 !11pg 26 mpgb
DIesel Dieselc gasolIne
equiv.a equiv.b
= 52 scf/mile
Miles/yr 50,000c 50,OOOc 11,140d 11,140dFuel Storage H2 gas Diesel Fuel H2 gas Gasoline
@3600 psi @5000 psiRange(mi) 250 250 250 400Vehicle lifetime (years) 15 10 13.40 10.70Purchase price ($) 325,000 237,000 24,550b 17,976bAnnual Maintenance Costs 7438e 7438e 3720 3960($/year)
a. Based on the efficiency of the Ballard Phase II PEMFC bus (Ballard Power Systems,private communications 1995, 1996). The mile per gallon equivalent efficiency for a fuelcell vehicle is estimated assuming that 1 gallon of gasoline or Diesel contains 0.1308 GJ(HHV) and that 1 scf of hydrogen contains 362 kJ (HHV).
b. Based on estimates by Delucchi for mid-size (Ford Taurus) PEM fuel cell and gasolineautomobiles (Ogden, Larson and Delucchi 1994).
c. Based on typical annual mileage and fuel use for a bus in the LA Basin (E. Chaiboonma,Los Angeles Metropolitan Transit Authority, private communications 1995).
d. Typical annual mileage for a passe~ger car in the LA Basin. (R. George, SCAQMD,private communications 1995, 1996).
e. For the Diesel bus, this includes annual maintenance plus upgrades at 3 and 8 years, anda major overhaul at 5 years. The maintenance for the PEM fuel cell bus is assumed to bethe same (E. Larson et.al 1995).
S
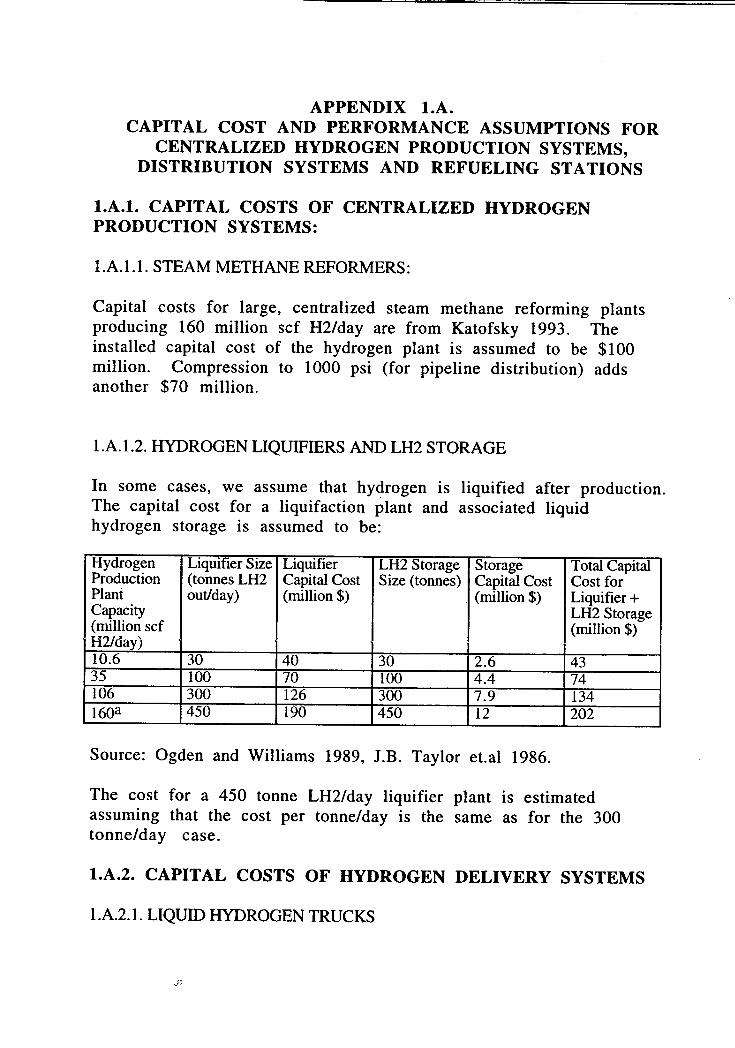
APPENDIX I.A.CAPITAL COST AND PERFORMANCE ASSUMPTIONS FOR
CENTRALIZED HYDROGEN PRODUCTION SYSTEMS,DISTRIBUTION SYSTEMS AND REFUELING STATIONS
I.A.I. CAPITAL COSTS OF CENTRALIZED HYDROGENPRODUCTION SYSTEMS:
1.A.1.1. STEAM METHANE REFORMERS:
Capital costs for large, centralized steam methane reforming plantsproducing 160 million scf H2/day are from Katofsky 1993. Theinstalled capital cost of the hydrogen plant is assumed to be $100million. Compression to 1000 psi (for pipeline distribution) addsanother $70 million.
1.A.1.2. HYDROGEN LIQUIFIERS AND LH2 STORAGE
In some cases, we assume that hydrogen is liquified after production.The capital cost for a liquifaction plant and associated liquidhydrogen storage is assumed to be:
Hydrogen Liquifier Size Liquifier LH2 Storage Storage Total CapitalProduction (tonnes LH2 Capital Cost Size (tonnes) Capital Cost Cost forPlant out/day) (million $) (million $) Liquifier +Capacity LH2 Storage(million scf (million $)H2/day)10.6 30 40 30 2.6 4335 100 70 100 4.4 74106 300 126 300 7.9 134160a 450 190 450 12 202
Source: Ogden and Williams 1989, J.B. Taylor et.al 1986.
The cost for a 450 tonne LH2/day liquifier plant is estimatedassuming that the cost per tonne/day is the same as for the 300tonne/day case.
I.A.2. CAPITAL COSTS OF HYDROGEN DELIVERY SYSTEMS
1.A.2.1. LIQUID HYDROGEN TRUCKS
J)
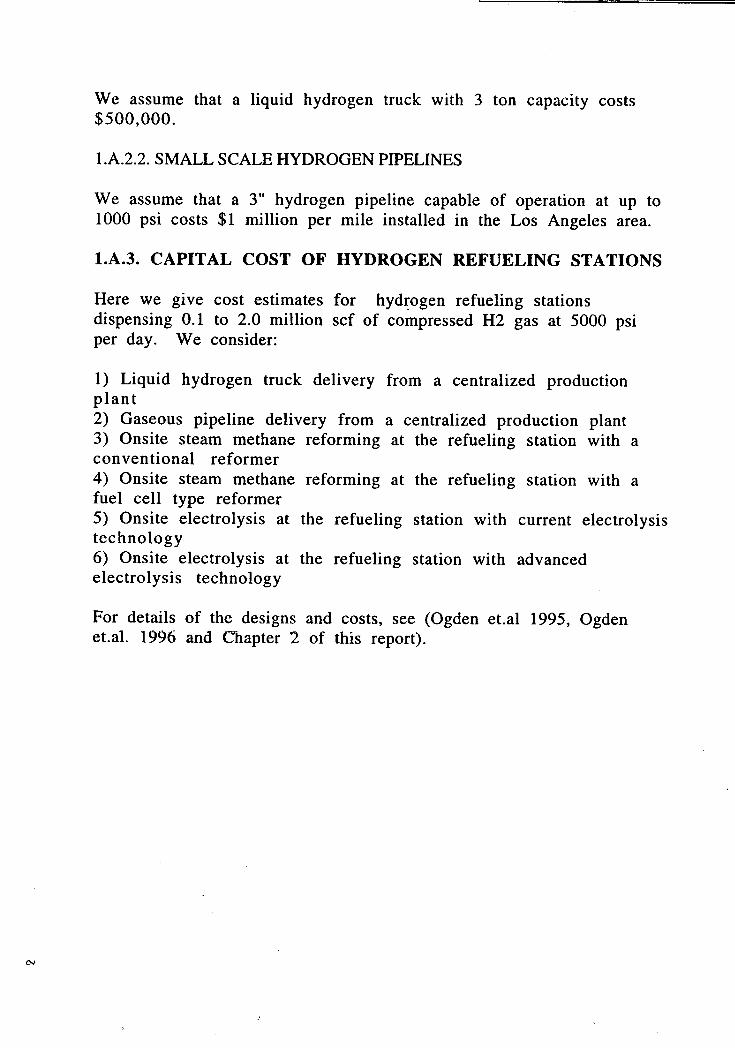
We assume that a liquid hydrogen truck with 3 ton capacity costs$500,000.
I.A.2.2. SMALL SCALE HYDROGEN PIPELINES
We assume that a 3" hydrogen pipeline capable of operation at up to1000 psi costs $1 million per mile installed in the Los Angeles area.
1.A.3. CAPITAL COST OF HYDROGEN REFUELING STATIONS
Here we give cost estimates for hyd~ogen refueling stationsdispensing 0.1 to 2.0 million scf of compressed H2 gas at 5000 psiper day. We consider:
1) Liquid hydrogen truck delivery from a centralized productionplant2) Gaseous pipeline delivery from a centralized production plant3) Onsite steam methane reforming at the refueling station with aconventional reformer4) Onsite steam methane reforming at the refueling station with afuel cell type reformer5) Onsite electrolysis at the refueling station with current electrolysis
technology6) Onsite electrolysis at the refueling station with advanced
electrolysis technology
For details of the designs and costs, see (Ogden et.al 1995, Ogdenet.al. 1996 and Chapter 2 of this report).
~
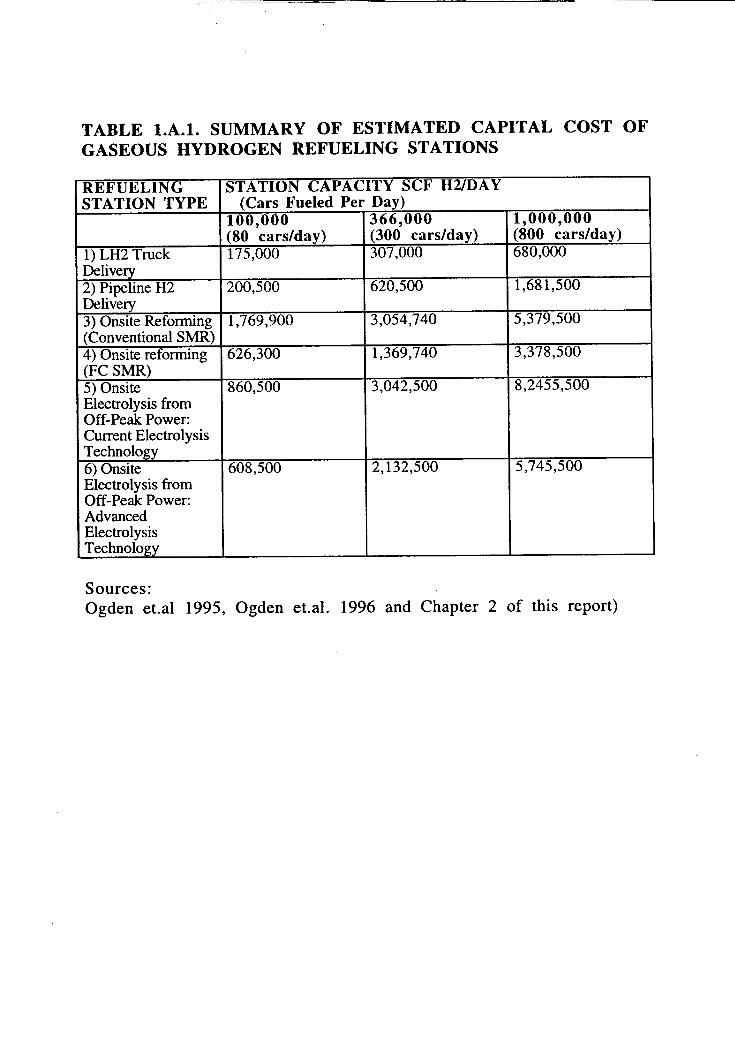
c~~---~ ~ -
TABLE I.A.I. SUMMARY OF ESTIMATED CAPITAL COST OFGASEOUS HYDROGEN REFUELING STATIONS
REFUELING STATION CAPACITY SCF H2/DAYSTATION TYPE (Cars Fueled Per Day)
100,000 366,000 1,000,000(80 cars/day) (300 cars/day) (800 cars/day)
I)LH2Truck 175,000 307,000 680,000Delivery2) Pipeline H2 200,500 620,500 1,681,500Delivery3)OnsiteRefonning 1,769,900 3,054,740 5,379,500(Conventional SMR)4) Onsite refonning 626,300 1,369,740 3,378,500(FC SMR)5) Onsite 860,500 3,042,500 8,2455,500Electrolysis fromOff-Peak Power:Current ElectrolysisTechnolo~y6) Onsite 608,500 2,132,500 5,745,500Electrolysis fromOff-Peak Power:AdvancedElectrolysisTechnolo~y
Sources:Ogden et.al 1995, Ogden et.al. 1996 and Chapter 2 of this report)
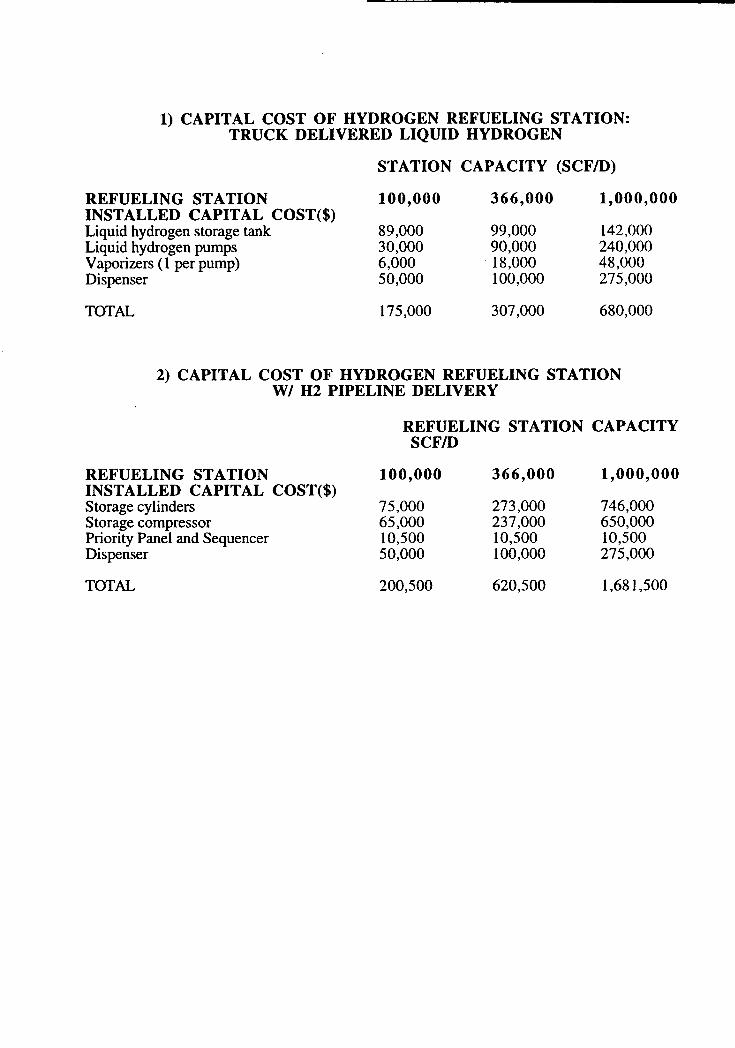
1) CAPITAL COST OF HYDROGEN REFUELING STATION:TRUCK DELIVERED LIQUID HYDROGEN
STATION CAPACITY (SCF/D)
REFUELING STATION 100,000 366,000 1,000,000INSTALLED CAPITAL COST($)Liquid hydrogen storage tank 89,000 99,000 142,000Liquid hydrogen pumps 30,000 90,000 240,000Vaporizers (1 per pump) 6,000 18,000 48,000Dispenser 50,000 100,000 275,000
TOTAL 175,000 307,000 680,000
2) CAPITAL COST OF HYDROGEN REFUELING STATIONWI H2 PIPELINE DELIVERY
REFUELING STATION CAPACITYSCF/D
REFUELING STATION 100,000 366,000 1,000,000INSTALLED CAPITAL COST($)Storage cylinders 75,000 273,000 746,000Storage compressor 65,000 237,000 650,000Priority Panel and Sequencer 10,500 10,500 10,500Dispenser 50,000 100,000 275,000
TOTAL 200,500 620,500 1,681,500
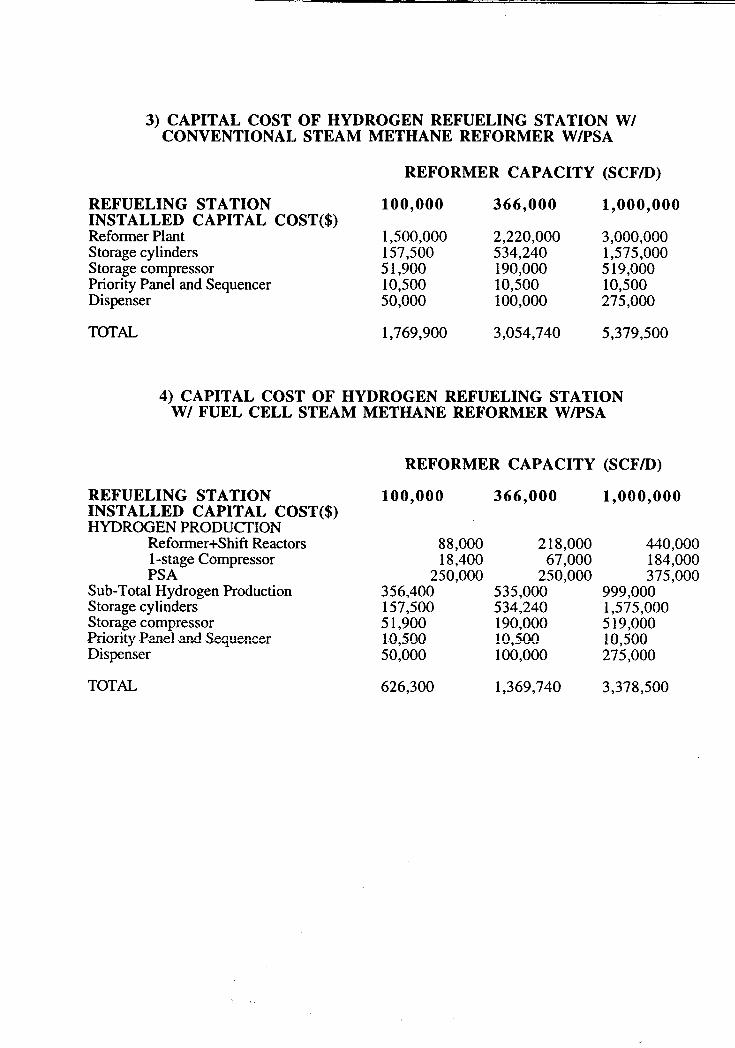
--
3) CAPITAL COST OF HYDROGEN REFUELING STATION WICONVENTIONAL STEAM METHANE REFORMER W/PSA
REFORMER CAPACITY (SCF/D)
REFUELING STATION 100,000 366,000 1,000,000INSTALLED CAPITAL COST($)Refonner Plant 1,500,000 2,220,000 3,000,000Storage cylinders 157,500 534,240 1,575,000Storage compressor 51,900 190,000 519,000Priority Panel and Sequencer 10,500 10,500 10,500Dispenser 50,000 100,000 275,000
TOTAL 1,769,900 3,054,740 5,379,500
4) CAPITAL COST OF HYDROGEN REFUELING STATIONWI FUEL CELL STEAM METHANE REFORMER W/PSA
REFORMER CAPACITY (SCF/D)
REFUELING STATION 100,000 366,000 1,000,000INSTALLED CAPITAL COST($)HYDROGEN PRODUCfION
Reformer+Shift Reactors 88,000 218,000 440,000I-stage Compressor 18,400 67,000 184,000PSA 250,000 250,000 375,000
Sub-Total Hydrogen Production 356,400 535,000 999,000Storage cylinders 157,500 534,240 1,575,000Storage compressor 51,900 190,000 519,000Priority P.anel.and Sequencer 1.0,500 10,500 10,500Dispenser 50,000 100,000 275,000
TOTAL 626,300 1,369,740 3,378,500
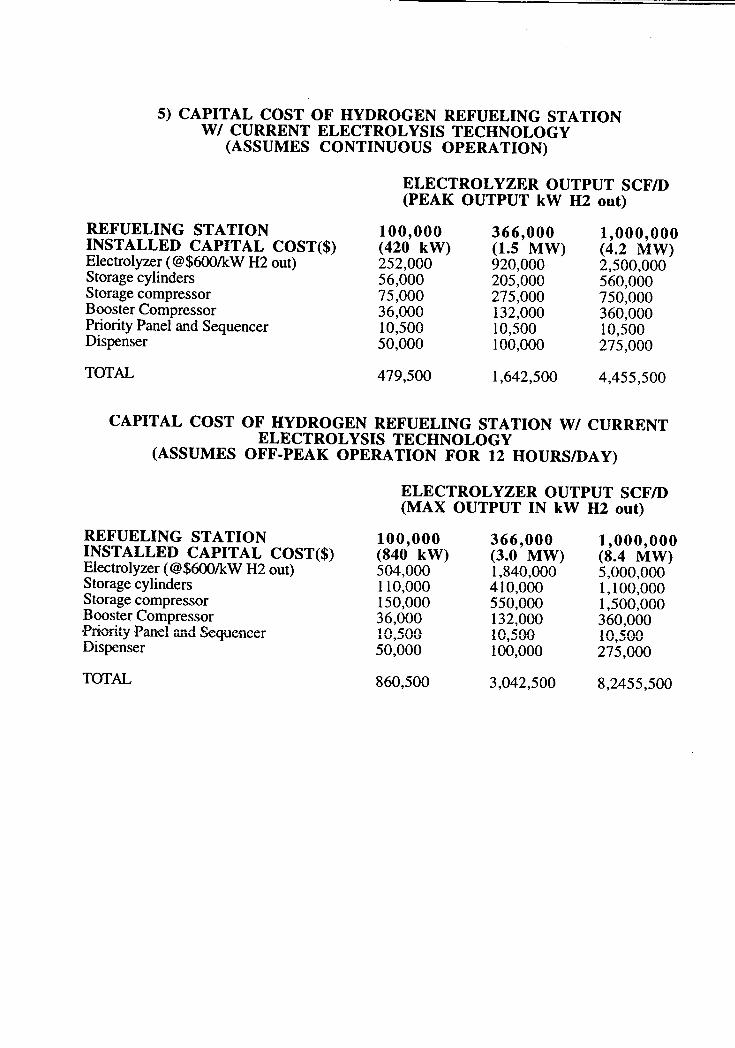
-
5) CAPITAL COST OF HYDROGEN REFUELING STATIONWI CURRENT ELECTROLYSIS TECHNOLOGY
(ASSUMES CONTINUOUS OPERATION)
ELECTROL YZER OUTPUT SCFID(PEAK OUTPUT kW H2 out)
REFUELING STATION 100,000 366,000 1,000,000INSTALLED CAPITAL COST($) (420 kW) (1.5 MW) (4.2 MW)Electrolyzer (@$600/kW H2 out) 252,000 920,000 2,500,000Storage cylinders 56,000 205,000 560,000Storage compressor 75,000 275,000 750,000Booster Compressor 36,000 132,000 360,000Priority Panel and Sequencer 10,500 10,500 10,500Dispenser 50,000 100,000 275,000
TOTAL 479,500 1,642,500 4,455,500
CAPITAL COST OF HYDROGEN REFUELING STATION WI CURRENTELECTROLYSIS TECHNOLOGY
(ASSUMES OFF-PEAK OPERATION FOR 12 HOURSillAY)
ELECTROL YZER OUTPUT SCFill(MAX OUTPUT IN kW H2 out)
REFUELING STATION 100,000 366,000 1,000,000INSTALLED CAPITAL COST($) (840 k W) (3.0 MW) (8.4 MW)Electrolyzer (@$600/kW H2 out) 504,000 1,840,000 5,000,000Storage cylinders 110,000 410,000 1,100,000Storage compressor 150,000 550,000 1,500,000Booster Compressor 36,000 132,000 360,000'Pri'Ority.Panel and Sequencer 10,500 10,500 10,500Dispenser 50,000 100,000 275,000
TOTAL 860,500 3,042,500 8,2455,500
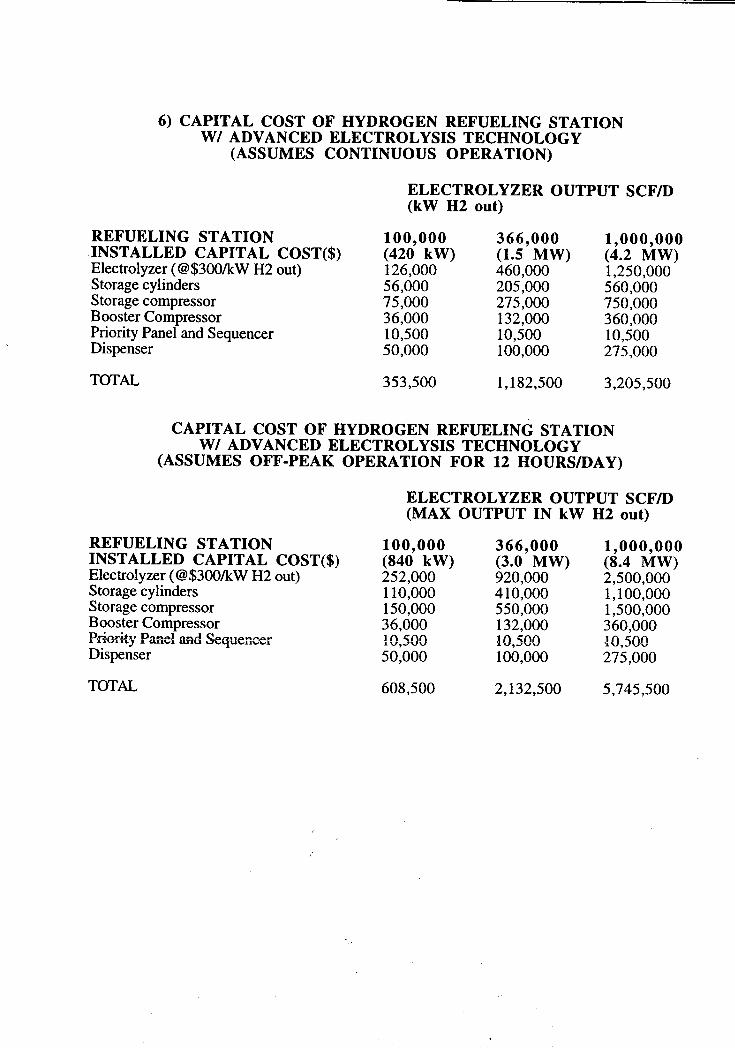
~--
6) CAPITAL COST OF HYDROGEN REFUELING STATIONWI ADVANCED ELECTROLYSIS TECHNOLOGY
(ASSUMES CONTINUOUS OPERATION)
ELECTROLYZER OUTPUT SCFill(kW H2 out)
REFUELING STATION 100,000 366,000 1,000,000INSTALLED CAPITAL COST($) (420 kW) (1.5 MW) (4.2 MW)Electrolyzer (@$300/kW H2 out) 126,000 460,000 1,250,000Storage cylinders 56,000 205,000 560,000Storage compressor 75,000 275,000 750,000Booster Compressor 36,000 132,000 360,000Priority Panel and Sequencer 10,500 10,500 10,500Dispenser 50,000 100,000 275,000
TOTAL 353,500 1,182,500 3,205,500
CAPITAL COST OF HYDROGEN REFUELING STATIONWI ADVANCED ELECTROLYSIS TECHNOLOGY
(ASSUMES OFF-PEAK OPERATION FOR 12 HOURSillAY)
ELECTROL YZER OUTPUT SCFill(MAX OUTPUT IN kW H2 out)
REFUELING STATION 100,000 366,000 1,000,000INSTALLED CAPITAL COST($) (840 kW) (3.0 MW) (8.4 MW)Electrolyzer (@$300/kW H2 out) 252,000 920,000 2,500,000Storage cylinders 110,000 410,000 1,100,000Storage compressor 150,000 550,000 1,500,000Booster Compressor 36,000 132,000 360,000p.rtoctty PaGel a."'1d Sequencer 10,500 10,500 10,500Dispenser 50,000 100,000 275,000
TOTAL 608,500 2,132,500 5,745,500
'J
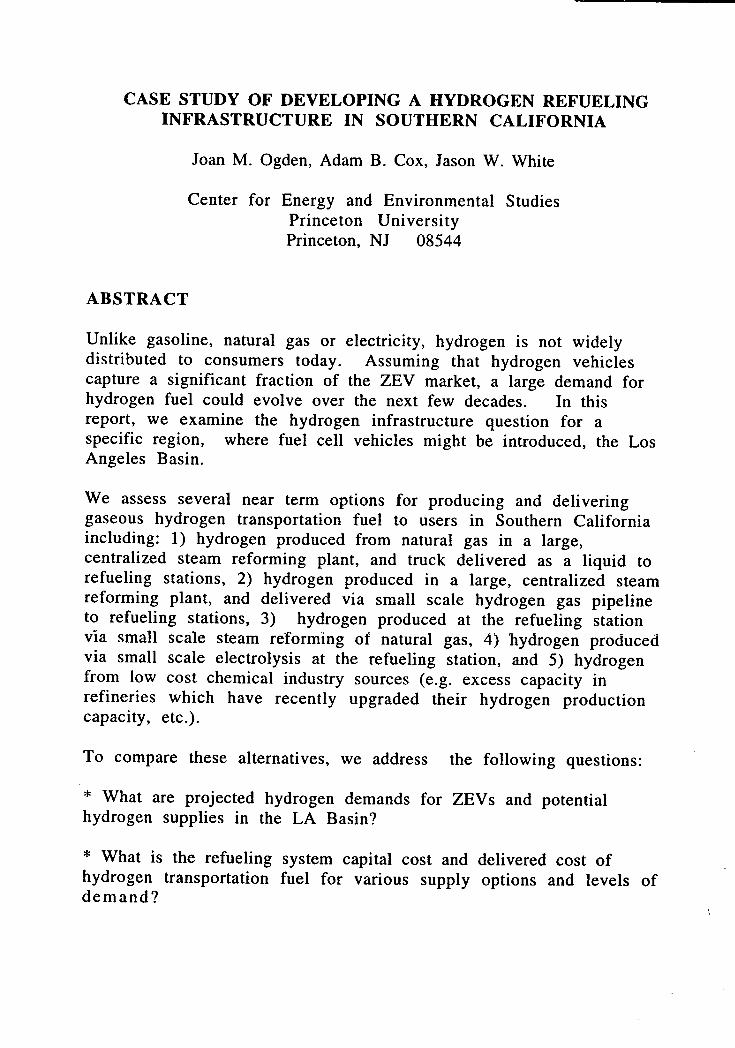
CASE STUDY OF DEVELOPING A HYDROGEN REFUELINGINFRASTRUCTURE IN SOUTHERN CALIFORNIA
Joan M. Ogden, Adam B. Cox, Jason W. White
Center for Energy and Environmental StudiesPrinceton UniversityPrinceton, NJ 08544
ABSTRACT
Unlike gasoline, natural gas or electricity, hydrogen is not widelydistributed to consumers today. Assuming that hydrogen vehiclescapture a significant fraction of the ZEV market, a large demand forhydrogen fuel could evolve over the next few decades. In thisreport, we examine the hydrogen infrastructure question for aspecific region, where fuel cell vehicles might be introduced, the LosAngeles Basin.
We assess several near term options for producing and deliveringgaseous hydrogen transportation fuel to users in Southern Californiaincluding: 1) hydrogen produced from natural gas in a large,centralized steam reforming plant, and truck delivered as a liquid torefueling stations, 2) hydrogen produced in a large, centralized steamreforming plant, and delivered via small scale hydrogen gas pipelineto refueling stations, 3) hydrogen produced at the refueling stationvia small scale steam reforming of natural gas, 4) hydrogen producedvia small scale electrolysis at the refueling station, and 5) hydrogenfrom low cost chemical industry sources (e.g. excess capacity inrefineries which have recently upgraded their hydrogen production
capacity, etc.).
To compare these alternatives, we address the following questions:
* What are projected hydrogen demands for ZEV s and potential
hydrogen supplies in the LA Basin?
* What is the refueling system capital cost and delivered cost of
hydrogen transportation fuel for various supply options and levels ofdemand?
---
* What is the lifecycle cost of transportation for hydrogen vehiclesfueled with hydrogen from these sources?
* How might a hydrogen infrastructure evolve to meet projecteddemands for hydrogen for ZEVs in Southern California?