case study on policy reforms to promote renewable energy
TRANSCRIPT

Economic and Social Commission for Western Asia
United Nations Development Account project on promoting renewable energy investments for climate change mitigation and sustainable development
Case Study on Policy Reforms to Promote Renewable Energy in the United Arab Emirates

United Nations Development Account project on promoting renewable energy investments for climate change mitigation and sustainable development
Case Study on Policy Reforms to Promote Renewable Energy in the United Arab Emirates
Economic and Social Commission for Western Asia
E/ESCWA/SDPD/2017/CP.8

© 2018 United NationsAll rights reserved worldwide
Photocopies and reproductions of excerpts are allowed with proper credits.
All queries on rights and licenses, including subsidiary rights, should be addressed to the United Nations Economic and Social Commission for Western Asia (ESCWA), e-mail: [email protected].
The findings, interpretations and conclusions expressed in this publication are those of the authors and do not necessarily reflect the views of the United Nations or its officials or Member States.
The designations employed and the presentation of material in this publication do not imply the expression of any opinion whatsoever on the part of the United Nations concerning the legal status of any country, territory, city or area or of its authorities, or concerning the delimitation of its frontiers or boundaries.
Links contained in this publication are provided for the convenience of the reader and are correct at the time of issue. The United Nations takes no responsibility for the continued accuracy of that information or for the content of any external website.
References have, wherever possible, been verified.
Mention of commercial names and products does not imply the endorsement of the United Nations.
References to dollars ($) are to United States dollars, unless otherwise stated.
Symbols of United Nations documents are composed of capital letters combined with figures.
Mention of such a symbol indicates a reference to a United Nations document.
United Nations publication issued by ESCWA, United Nations House, Riad El Solh Square, P.O. Box: 11-8575, Beirut, Lebanon.
Website: www.unescwa.org.
Cover photo credits:
Solar panel, by stevanovicigorStone Tower in Snow, by Andrew OrlemannSkyline of Dubai, by Patrik Dietrich

3
This case study report was prepared for the Energy Section of the Economic and Social Commission for Western Asia (UN ESCWA) Sustainable Development Policies Division within the framework of the United Nations Development Account (UNDA) project on Promoting Renewable Energy (RE) Investments for Climate Change Mitigation and Sustainable Development. The project focused on capacity building for policymakers and project developers in order to promote investments in RE projects. The project was led by the UN Social Commission for Western Asia (UN ESCWA) and implemented in partnership with the United Nations Economic Commission for Europe (UNECE).
The UNDA project included case studies on the experience of RE policy reforms in selected countries from each of the two Regional Commissions (RCs). A total of eight countries were targeted (four from each RC): Jordan, Lebanon, Morocco and UAE from the UN ESCWA Member states, and Serbia, Ukraine, Kazakhstan and Georgia from UN-ECE Member States.
The present report covers the case study for the United Arab Emirates (UAE) and was prepared by Mr. Toufic Mezher (PhD), a professor at the Masdar Institute, Abu Dhabi, United Arab Emirates (UAE), taught courses in Sustainable Development, Technology Strategy, Microeconomics, and Management Science, and published several papers related to the development of RE in the GCC. The following experts helped review and finalize the document: Gurbuz Gonul, Senior Programme Officer - Regions at the International Renewable Energy Agency (IRENA) and member of the UNDA advisory board; Radia Sedaoui, Chief, Energy Section and Mongi Bida, First Economic Affairs Officer (SDPD/UN ESCWA in Beirut).
Preface
5
Introduction
The journey to renewable energy in the United Arab Emirates (UAE) started in 2006 in Abu Dhabi when the Government announced the creation of the Masdar Initiative, the first renewable energy firm of its kind in the region. In addition, land near Abu Dhabi airport was allocated to build Masdar City, the first sustainable city in the world, powered by renewable energy. The Masdar Initiative was part of the Abu Dhabi 2030 Vision to diversify the economy. This report details renewable energy policy reforms that are taking place.
Country brief
The UAE has a total area of 83,600 km2 and is composed of seven emirates. Abu Dhabi is the largest with an area of 67,340 km2 and contains all the oil and gas reserves. Dubai is next and is considered to be the economic centre.
The other remaining emirates are Fujairah, Ajman, Ras Al Khaimah, Sharjah and Umm al-Quwain. The population in 2013 totalled 9.35 million and had tripled since 2000 – when it had only been 3.03 million – due
Executive summary
Figure 2: UAE economic profile in 2010
Crude oil production
Utilities
Finance & Insurance
Other services
Government
Real estate & business services
Construction
Trade
Transport, storage & communication
Agriculture
Manufacturing
30%
11%2%
9%
1%
4%3%10%
7%
14%
9%
Figure 4: Total final energy consumption by sector and fuel inputs
Oil ProductsIndustry
CoalOthers
Natural GasTransport
ElectricityBuildings
59%
28%
4%
3%
15%
22%
16%
53%
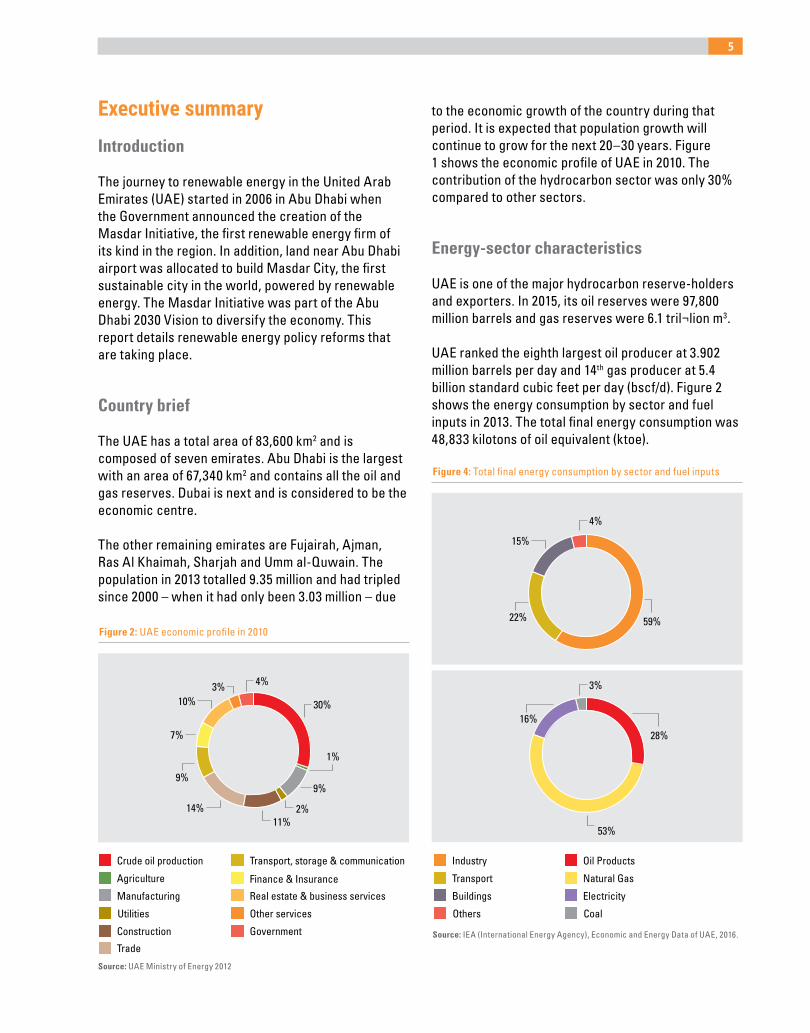
to the economic growth of the country during that period. It is expected that population growth will continue to grow for the next 20–30 years. Figure 1 shows the economic profile of UAE in 2010. The contribution of the hydrocarbon sector was only 30% compared to other sectors.
Energy-sector characteristics
UAE is one of the major hydrocarbon reserve-holders and exporters. In 2015, its oil reserves were 97,800 million barrels and gas reserves were 6.1 tril¬lion m3.
UAE ranked the eighth largest oil producer at 3.902 million barrels per day and 14th gas producer at 5.4 billion standard cubic feet per day (bscf/d). Figure 2 shows the energy consumption by sector and fuel inputs in 2013. The total final energy consumption was 48,833 kilotons of oil equivalent (ktoe).
Source: UAE Ministry of Energy 2012
Source: IEA (International Energy Agency), Economic and Energy Data of UAE, 2016.

6 CASE STUDY ON POLICY REFORMS TO PROMOTE RENEWABLE ENERGY IN THE UNITED ARAB EMIRATES
Figure 9: Share of total energy generated by each utility in 2014
Note: Abu Dhabi Water and Electricity Authority (ADWEA); Dubai Water and Electricity Authority (DEWA); Federal Electricity and Water Authority (FEWA); Sharjah Water and Electricity Authority (SEWA)
34%
5%1%
60%
DEWA
SEWAADWEA
FEWA
Total electricity consumption in UAE was 111,528 GWh in 2014. Figure 3 shows the share of electricity generation in each utility in 2014.
UAE is moving vigorously towards incorporating clean power generation technologies in its energy mix. This includes both renewables and non-renewables. UAE is adding nuclear power and clean coal to its mix. In addition, UAE is considering several carbon capture and sequestration (CCS) projects to mitigate the impact of CO2 emissions from fossil-fuel power generation plants. Figure 4 shows the share of electricity consumption by sector in 2014.
Renewable energy potential
UAE has high solar potentials and receives over 10 hours of sunlight every day. The country also has some 350 sunny days a year. Total solar energy received is about 6.5 kWh/m2/day and direct normal solar radiation is 4-6 kWh/m2/day, depending on location and time of the year.
Table 5 shows the total solar power capacity for the years 2016, 2020 and 2030. The values for the years 2020 and 2030 are projected ones. Table 6 summarizes all the waste-to-energy projects in UAE.
Figure 11: Share of electricity consumption by sector in 2014
Residential
OthersIndustrial
Commercial
31%
13%
22%
34%
Table 5: Total installed capacity of solar projects
Table 11: Total waste-to-energy projects
Total installed capacity
2016 2020 2030
Solar PV power plants and rooftops
23 MW 2,500 MW 6,500 MW
Solar CSP power plant 100 MW 100 MW 100 MW
Total 123 MW 2,600 MW 6,600 MW
Total installed capacity
2016Total electricity
generated (kWh)
Abu Dhabi, the Abu National Energy Company
100 MW 700,800,000
Dubai, Al Warsan 60 MW 420,480,000
Sharjah, bee'ah 35 MW 245,280,000`
Total 195 MW 1,366,560,000Source: UAE Ministry of Energy Statistical Data for Electricity and Water 2013–2014.
Source: Ministry of Energy, Statistical Data For Electricity and Water 2013- 2014
Source: Sunset of powerhouse, by penguiiin, fotolia.

7
Current and previous policy status
The UAE 2021 vision is clear and signals to different emirates the seriousness of the Government by setting clean energy strategies and policies. Table 7 shows clean power-generation targets set by Abu Dhabi and Dubai. Renewable energy plans and targets
Table 1: Power generation: announced targets
Table 2: Institutions and regulatory bodies involved in policymaking and planning in UAE energy sector
2020 2021 2030 2050
UAE24% of clean energy of
the total energy mix
Abu Dhabi7% renewables (solar),
19% nuclear420,480,000
Dubai 7% Renewables25% renewables (solar),
7% nuclear75% of energy needs will be clean sources.
Institutions Regulatory bodies
UAE Ministry of Energy
Electricity is regulated by emirate-level institutions in Abu Dhabi, Dubai and Sharjah. The remaining are covered by the Federal Electricity and Water
Authority (FEWA)
Abu DhabiAbu Dhabi Water and Electricity Authority
(ADWEA), Abu Dhabi Energy Authority (2016)Abu Dhabi Regulation and Supervision Bureau,
Abu Dhabi Water and Electricity Authority
DubaiDubai Water and Electricity Authority (DEWA) and
Dubai Supreme Council of Energy Dubai Regulation and Supervision Bureau, Dubai
Electricity and Water Authority (DEWA)
Environmental impacts
Figure 5 shows the CO2 emission trends in UAE before and after adopting mitigation strategies based on declared existing and future clean-energy capacities (baseline). The majority of the reduction comes from nuclear power rather than from renewable energies.
After 2020, the CO2 trend started increasing due to an increase in energy demand. If we assume another scenario whereby Abu Dhabi installs an additional 4,000 MW of PV by 2030 similar to Dubai, a slight – but not significant – additional decline in CO2 emissions will occur.
must be backed by clear policies, as well as national institutions and regulatory bodies.
The institutions and regulatory bodies in UAE that are relevant to renewable policies are shown in Table 1.
Source: Abu Zahra, 2015.
180,000,000,000
160,000,000,000
140,000,000,000
120,000,000,000
100,000,000,000
80,000,000,000
60,000,000,000
40,000,000,000
20,000,000,000
0
Figure 22: CO2 emission trends in UAE before and after adopting mitigation strategies
2010
2013
2016
2019
2022
2025
2028
With mitigations strategies-baseline
With mitigations strategies
With mitigations strategies-Scenario one

8 CASE STUDY ON POLICY REFORMS TO PROMOTE RENEWABLE ENERGY IN THE UNITED ARAB EMIRATES
Barriers/challenges facing implementation of renewable energy projects and lessons learned
Since the announcement of Abu Dhabi Government in 2009 of its 7% renewable energy target for 2020, only few projects were implemented. The economic crisis in 2009 and the drop in oil prices slowed the momentum for investments. But World Expo 2020 that will be held in Dubai has restored the momentum. Many challenges still remain that the UAE needs to address in order to build a successful renewable energy sector. Some of these are:
Economic and financial challenges; Market challenges; Political, institutional/governance, regulatory and
administrative challenges; Cultural, behavioural and educational challenges: Technical/technological challenges.
Ways forward
It is evident that UAE has rebuilt its momentum in renewable energy, especially in the power sector. UAE can meet its targets because of the new business model adopted by the utilities: power purchase agreements (PPA) and independent power projects (IPP), which will lighten the financial burden of the Government. The levelized cost of energy (LCOE) for solar PV is as low as US cents 2.42/kWh, making it a viable technology. Renewable energy readiness in UAE is measured by the readiness of its infrastructure, institutions and human capacity; the challenges mentioned previously could have serious impacts on the readiness of the country in renewable energy deployment. The current power infrastructure in UAE is well-built and up to date but is based on fossil-fuel technologies. More attention should be given to building smart grid systems to be able to integrate renewable power sources and manage power dispatch. The new systems should be well equipped, operated and maintained with high technical skills. At the institutional level, the governance structure of UAE gives each emirate its own autonomy in running its economic activities. The national energy strategy of the federal Government is based on the integration of the energy strategies of each emirate.
Abu Dhabi and Dubai have in place the right governmental institutions which include all the energy-related public-sector stakeholders. More attention is required by the five other smaller emirates in order to have active participation in the national strategy.
Additional policy recommendations to mitigate the above-mentioned barriers include:
1. Economic and financial challenges
The IPP-PPA business model will encourage the private sector, including financial institutions, to invest in renewable energies. This will reduce the financial burden of the Government;
The Government of UAE can take advantage of its renewable energy policies to build up the industry in the value chain, especially in manufacturing, where it can oblige the equipment provider to manufacture a percentage of the equipment used locally in renewable energy projects. This will increase know-how and job opportunities.
Commercial, bankruptcy, immigration and residency laws should be re-evaluated to encourage more entrepreneurial risk taken by startups and direct foreign investments in the renewable energy sector.
2. Market challenges
More assurances are needed from utilities to guarantee buying the power offtake over the economic life of the installed renewable power systems;
Allowing an active wholesale market in UAE and between different Gulf Cooperation Council (GCC) countries will encourage the adoption of renewable energies;
Reducing or eliminating fossil-fuel subsidies in the power sector and calculating the true social, economic and environmental costs (tangibles and intangibles) for using such fuel to make renewable energies more competitive.

9
3. Political, institutional/governance, regulatory and administrative
Future energy-related strategic decisions in each emirate should be made in collaboration and coordination among all governmental institutions, the private sector (renewable energy, financial institutions, etc.), research and development (R&D) institutions and non- governmental organizations (NGOs).
Even though policies and institutional frameworks to drive the adoption of renewable energy are made at the emirate level, only Abu Dhabi and Dubai have so far taken a proactive step in that direction. The other five emirates have taken no action. The federal Government should play an important role in creating synergy between Abu Dhabi and Dubai on the one hand and kick-start renewable energy programmes and build on previous experience in the five other emirates;
The federal Government, working with different emirates, should adopt innovative policies and mechanisms to encourage the adoption of renewable energy technologies (RETs) in off-grid uses, including rooftop solar photovoltaic (PV). Solar rooftop and building-integrated photovoltaics (BIPV) can be successful during the six months of cool, sunny weather (November–April). During hot weather, the energy needed to cool villas and buildings represents at least 70% of the energy bill. The Dubai net metering model, which allows consumers to feed power to the grid, is a good mechanism and other emirates should follow suit but this needs good management. Eliminating electricity and water subsidies, and unifying the bills for both expatriates and nationals with additional financial mechanisms from the savings generated from subsidies should encourage solar PV installations and reduce waste in existing structures. New regulations and incentives should be in place for new structures.
Renewable energy and clean energy targets should be complemented with CO2 emission- reduction targets.
4. Cultural, behavioural and educational challenges
More R&D, funding which currently represents less than 1% of GDP in UAE. Funding should be at least 3% of GDP and should be directed to the development of the needed economic sectors, including renewable energy. Funding should be accompanied by the appropriate institutions and mechanisms. Academic institutions at the national level should be engaged in R&D activities, which will eventually contribute to human capacity-building;
The true cost of solar PV to utilities, even with low LCOE, should be reflected in the consumers’ bill. This should be complemented with an awareness campaign.
5. Technical/technological challenges
More accurate direct normal irradiation (DNI) and global horizontal irradiation (GHI) measurements are needed over at least a 10-year period in order to give investors a clear idea of the potential power-generation capacity of solar plants;
Sharing the performance of existing solar power plants with government institution, R&D institutions, and the renewable energy industry can improve policy decisions and finding technical solutions to some of the challenges of RETs, especially in UAE;
UAE has wind-power potential and the Government should explore this opportunity further;
Policies should address the potential of renewable energy applications in desalination, which has the opportunity to decouple power and water, especially with the advancement of reverse osmosis (RO) and membrane technologies.


11
Table of Content
Preface 3
Executive summary 5
Table of Content 11
List of tables 12
List of figures 12
List of abbreviations 13
I. Introduction 15
II. Country brief 15
III. Energy-sector characteristics 163.1 Primary-energy supply 16
3.2 Characteristics of the electricity sector 17
3.3 Energy-demand characteristics 21
3.4 Energy intensity 23
3.5 Energy–water nexus 23
3.6 CO2 emissions/footprint 25
IV. Renewable energy potential 264.1 Renewable energy potential for power generation 26
4.2 Renewable energy potential for direct uses 30
V. Assessment methodology 305.1 Assumptions made 31
VI. Current and previous policy status 316.1 Renewable energy strategy and targets 31
6.2 Present renewable energy policies and institutional framework 33
6.3 Suitability of present renewable energy policies and institutional framework to meet announced strategies and targets 35
6.4 Renewable energy policy and institutional reforms being introduced/considered 35
VII. Economic, environmental and policy analysis 367.1 Overall impact of the policy measures that were introduced or are being considered on the renewable energy market in the country 36
7.2 Analysis of potential economic and social impacts of the evolution of the renewable energy market 37
7.3 Environmental impacts 37
VIII. Policy design considerations 38
IX. Barriers/challenges facing implementation of renewable energy projects and lessons learned 399.1 Economics and financial challenges 39
9.2 Market challenges 39
9.3 Political, institutional/governance, regulatory and administrative challenges 39
9.4 Cultural, behavioural and educational challenges 40
9.5 Technical/technological challenges 40
X. Conclusions and ways forward 40
Annex A: Economic and Energy Data of UAE 43
Annex B: Solar PV Manufacturers and Summary of Employment Factor by Technology and Job 43Annex B.1: Solar PV manufacturers in UAE 43
Annex B.2: Summary of Employment factor by Technology and Job 44
Annex C: Electricity Tariffs and selected Fuel products prices in UAE 46Annex C.1: Electricity Tariffs in Dubai 46
Annex C.2: Electricity Tariffs in Abu Dhabi 47
Annex C.3: List of Petrol Prices (AED) for 2016 47
Annex D: UAE Public Institutions Related to the Energy Sector 48
Annex E: Electricity generated and associated Reductions of CO2 Emissions by technology 49Annex E.1: Electricity Generated from different Technology (KWh/year) 49
Annex E.2: CO2 Emission reductions (tons CO2e/KWh) from each technology 49
Annex F: Interview of RE companies operating in UAE 50

12 CASE STUDY ON POLICY REFORMS TO PROMOTE RENEWABLE ENERGY IN THE UNITED ARAB EMIRATES
List of tables
List of figures
Figure 1: Population trends in UAE 15
Figure 2: UAE economic profile in 2010 16
Figure 3: Economic and energy data of UAE 16
Figure 4: Total final energy consumption by sector and fuel inputs 16
Figure 5: Energy Consumption Trend by fuel type 17
Figure 6: Generation technology for the installed capacity for each utility in 2014 18
Figure 7: Electricity consumption in UAE, 2008–2014 19
Figure 8: Electricity generated in UAE, 2008–2014 19
Figure 9: Share of total energy generated by each utility in 2014 20
Figure 10: Electricity system network, 2015 20
Figure 11: Share of electricity consumption by sector in 2014 22
Figure 12: Installed and peak load capacity in UAE, 2008–2014 22
Figure 13: Projected power capacity for UAE 22
Figure 14: UAE energy intensity 23
Figure 15: Water production statistics for UAE, 2008–2014 23
Figure 16: Breakdown of UAE desalination capacity 24
Figure 17: Direct normal irradiation and global horizontal irradiation for UAE in 2010 26
Figure 18: Average wind-speed map at 100 m in UAE 28
Figure 19: Projected daily power generation for UAE in 2030 by technology 29
Figure 20: LCOE of utility-scale electricity generation technologies in GCC (US cents/kWh) 29
Figure 21: Potential CO2 emission reduction from clean-energy deployment 37
Figure 22: CO2 emission trends in UAE before and after adopting mitigation strategies 37
Table 1: Total installed capacity of solar projects 17
Table 2: Energy consumption by sector in UAE
in 2013 and 2014 (GWh) 21
Table 3: Total installed capacity of solar projects 22
Table 4: Maximum peak load capacity(MW) in UAE, 2008-2014 22
Table 5: Electricity exports (GWh) from Abu Dhabi to FEWA and SEWA in 2013 and 2014 22
Table 6: Energy requirements and cost of water for different desalination technologies 24
Table 7: UAE greenhouse-gas inventory for 2005 25
Table 8: Existing, announced and future solar projects in UAE 27
Table 9: Total installed capacity of solar projects 27
Table 10: Mean wind speed in different UAE locations 28
Table 11: Total waste-to-energy projects 28
Table 12: Plant capacity factors for different power-generation technologies 31
Table 13: Estimated CO2 Emissions for different power-generation technologies 31
Table 14: Announced power generation targets 32
Table 15: Demand-reduction targets 32
Table 16: Institutions and regulatory bodies involved in policymaking and planning in the UAE energy sector 33
Table 17: The value chain for existing renewable energy projects in UAE 34

13
List of abbreviations
ADEA Abu Dhabi Energy Authority
ADSW Abu Dhabi Sustainability Week
ADWEA Abu Dhabi Water and Electricity Authority
ADWEC Abu Dhabi Water and Electricity Company
BIPV building-integrated photovoltaics
bscf/d billion standard cubic feet per day
CCS carbon capture and sequestration
CCT combined cycle turbine
CDM Clean Development Mechanism
CER Currently Certified Emission Reductions
CG cogeneration
CO2 carbon dioxide
COP21 21st Conference of the Parties (UNFCCC)
CSP concentrated solar power
DECC Department of Climate Change and Environment
DEWA Dubai Water and Electricity Authority
DNI direct normal irradiation
DSCE Dubai Supreme Council of Energy
EIA Energy Information Agency (USA)
ENEC Emirates Nuclear Energy Corporation
EOR enhanced oil recovery
EPC Engineering, procurement and construction
ESIA Emirates Solar Industry Association
ESP electrostatic precipitators
FEWA Federal Water and Electricity Authority
GCC Gulf Cooperation Council
GDP gross domestic product
GE General Electric
GHG greenhouse gas
GHI global horizontal irradiation
GWh gigawatt hour
IPP independent power project
IRENA International Renewable Energy Agency
IWPP independent water and power producer
KEPC Korean Electric Power Corporation
kWh kilowatt hour
LCOE levelized cost of energy
MBTu million British thermal units
MED multiple-effect distillation
MENA Middle East and North Africa
MESIA Middle East Solar Association
Mtpa Million tons per annum
MSF multi-stage flash
MW megaWatt
PPA power purchase agreement
PV photovoltaic
RE renewable energy
RET renewable energy technology
RO reverse-osmosis
R&D research and development
SA standalone
SEWA Sharjah Water and Electricity Authority
SWFGD seawater flue gas desulfurization
TDS total dissolved solids
TAQA Abu Dhabi National Energy Company
TVC thermal vapour compression
UAE United Arab Emirates
UN United Nations
UNFCCC United Nations Framework Convention on Climate Change
US$ United States dollar
VC: vapour compression
WFES World Future Energy Summit
WTE waste to energy
ZFEP Zayed Future Energy Prize

15
I. Introduction
II. Country brief
The journey to renewable energy in UAE started in Abu Dhabi in 2006, when the Government announced the creation of the Masdar Initiative, the first renewable energy firm of its kind in the region. In addition, land near Abu Dhabi airport was allocated to build Masdar City, the first sustainable city in the world, powered by renewable energy. The Masdar Initiative was part of the Abu Dhabi 2030 Vision to diversify the economy. When the announcement was made, it sent shockwaves across the region and the world because no one believed that UAE – a major oil producing country – was transforming its economy to include sustainable energy in the power sector. This was only the beginning: UAE today has the largest operating solar PV and CSP power plants in the world and more will become operation in the future. This report details renewable energy policy reforms that have been taking place in UAE since 2006 and their implications on national sustainable development. The report starts with a brief description of UAE and then details the energy-sector characteristics before assessing renewable energy potentials and their contribution to future CO2 emission reductions. Finally, the report highlights the current and previous policy status; economic, environmental and policy analysis; policy design considerations; and challenges facing implementation of renewable energy projects, including lessons learned. The report concludes with policy recommendations and ways forward.
This section provides a brief description of UAE geography, climate, demography, governance and economy, according to the Ministry of Energy [1]. UAE has a total area of 83,600 km2 and is composed of seven emirates. Abu Dhabi is the largest with an area of 67,340 km2 and contains all the oil and gas reserves. Dubai is next and is considered to be the economic centre of the country. The remaining emirates are Fujairah, Ajman, Ras Al Khaimah, and Umm al-Quwain. UAE is located on the Arabian Peninsula and has coastlines on both the Arabian Gulf, near the Strait of Hormuz, and the Indian Ocean. The climate in UAE is considered to be arid and has two seasons. A mild winter occurs between November and April, when the temperature varies between 26 °C and 15 °C. The
summer is considered to be harsh and temperatures can reach 50 °C; the climate is hot, humid, and dusty. The average rainfall per year is between 140 mm and 200 mm and in the mountain regions it can reach up to 350 mm per year.
The population reached 9.35 million in 2013 and has tripled since 2000, when it was only 3.03 million. The population explosion was due to the economic growth of the country during that period and it is expected that the population will continue to grow over the next 20–30 years. Figure 1 shows the rapid population growth between 2000 and 2013. The majority of the population (83%) lives in urban areas, especially in big cities like Abu Dhabi and Dubai [1]. In 2010, the Federal Competitiveness and Statistics Authority (FCSA) conducted a population consensus and it was found that the expatriate population was some 88% of the total population [2]. The UAE governance structure is based on a federal system. Each emirate retains a certain power and establishes its own public agencies. The country is run by the President, Supreme Council and Council of Ministers headed by the Vice-President. The UAE’s economy is strong but the economic crisis in 2008 and the drop in oil prices affected the GDP growth. GDP grew at an average of 4.3% between 2000 and 2010 and the inflation rate was below 1% in 2011. The resilience of the economy against global financial crisis was due to the fact that UAE has a diversified economy and the non-hydrocarbon of 70% of GDP in 2010 which grew 3.3% in 2011. Figure 2 shows the economic profile of UAE in 2010 when GDP was at US$286 billion. The hydrocarbon sector contribution was only 30% compared to other sectors [1].
2000
2001
2002
2003
2004
2005
2006
2007
2008
2009
2010
2011
2012
2013
0123456789
10
3.03
3.13 3.22 3.37 3.66 4.
15 4.88 5.
8
6.8
7.72 8.
44 8.93 9.21 9.35
Mill
ions
Figure 1: Population trends in UAE
Population (Millions)
Source: UAE Ministry of Energy 2012

16 CASE STUDY ON POLICY REFORMS TO PROMOTE RENEWABLE ENERGY IN THE UNITED ARAB EMIRATES
III. Energy-sector characteristics
Figure 2: UAE economic profile in 2010
Crude oil production
Utilities
Finance & Insurance
Other services
Government
Real estate & business services
Construction
Trade
Transport, storage & communication
Agriculture
Manufacturing
30%
11%2%
9%
1%
4%3%10%
7%
14%
9%
Figure 3 shows that economic growth in UAE resulted in an increase in electricity consumption which, in turn, resulted in an increase in CO2 emissions. It is noticeable, however, that CO2 emissions per capita are decreasing and the decreasing CO2 emissions per GDP (CO2/GDP) are showing a slight increase. Annex 1 gives the values of the data in Figure 3 [3].
Figure 3: Economic and energy data of UAE
250
2000
2001
2002
2003
2004
2005
2006
2007
2008
2009
2010
2011
2012
2013
200
150
100
50
0
GDP 2005 US$ billions
CO2 emissions (Mt of CO2)
CO2/GDP (kg CO2/2005 US$)
Electricity consumption (TWh)
CO2/Population (t CO2/capita)
Population (millions)
UAE is one of the major hydrocarbon reserve-holders and exporters. In 2015, UAE oil reserves were at 97,800 million barrels and gas reserves were at 6.1 trillion m3. UAE ranked as the eighth largest oil producer at 3.902 million barrels per day and 14th gas producer at 5.4 bscf/d. UAE has a long-term commitment to export 0.7 bscf/d to Japan. Domestic consumption is at 6.7 bscf/d. UAE signed an agreement with Qatar to import gas through the Dolphin pipeline at a rate of 2 US$/MBtu for the period 2010–2032 to make up for a gas shortage. The low costs of production and domestic pricing of oil and gas led to high per capita energy consumption. With the increase in population, the domestic fossil-fuel demand tripled in the past 15 years and UAE became a gas importer in 2007 [4]. Figure 4 shows the energy consumption by sector and fuel inputs in 2013 [3]. The total final energy consumption was 48,833 ktoe. Figure 5 shows the trend of energy consumption by fuel type.
3.1 Primary-energy supply
Figure 4: Total final energy consumption by sector and fuel inputs
Oil products
Natural gas
Industry
Transport Coal
Electricity
Others
Buildings
59%
28%
4%
3%
15%
22%
16%
53%
Source: UAE Ministry of Energy 2012
Source: IEA (International Energy Agency), Economic and Energy Data of UAE, 2016. Source: IEA (International Energy Agency), Economic and Energy Data of UAE, 2016.

17
Figure 5: Energy Consumption Trend by fuel type
Energy Consumption Trend60,000
50,000
40,000
30,000
20,000
10,000
2008 2009 2010 2011 2012 2013
Coal
Natural gas
Electricity
Oil products
Biofuel and waste
Total
This section discusses the structure of the UAE energy sector in UAE. The four main electricity and water authorities are:
The Abu Dhabi Water and Electricity Authority (ADWEA) provides the electricity and water needs for the Emirate of Abu Dhabi and the northern emirates other than Dubai and Sharjah;
The Dubai Water and Electricity Authority (DEWA) provides the electricity and water needs for the Emirate of Dubai;
The Sharjah Water and Electricity Authority (SEWA) provides the electricity and water needs for the Emirate of Sharjah;
The Federal Water and Electricity Authority (FEWA): provides the electricity and water needs for the remaining northern emirates, mainly Umm al-Quwain, Ajman, Ras Al Khaimah and Fujairah. All water and electricity needs are imported from Abu Dhabi.
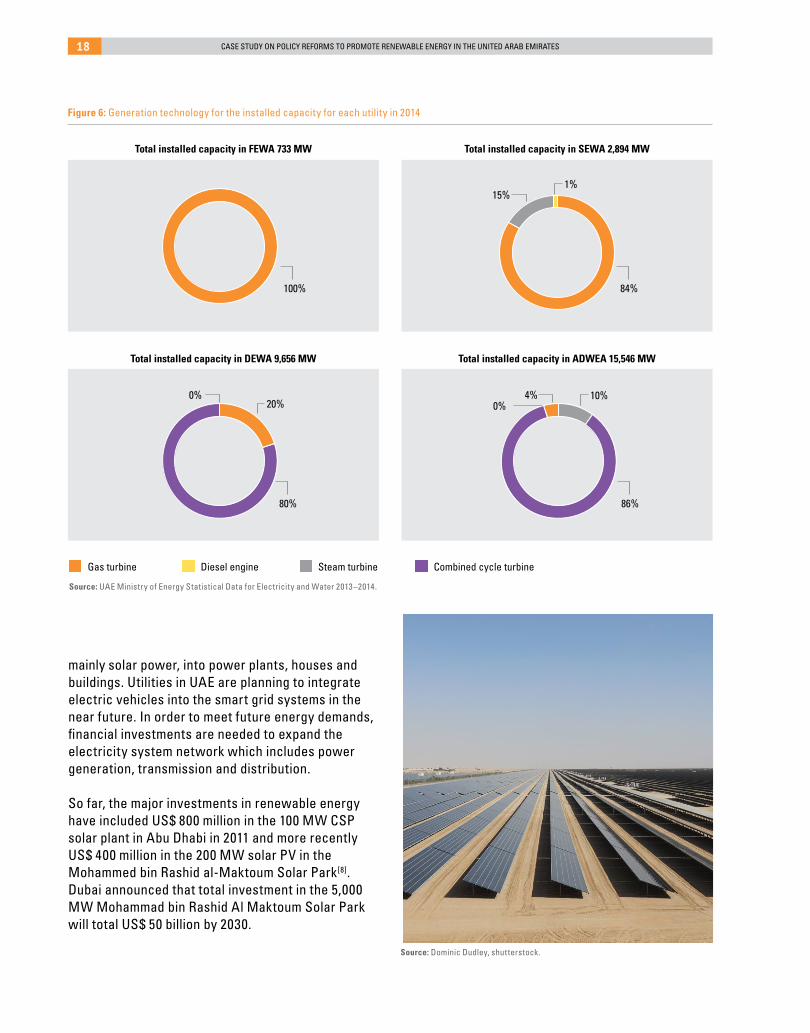
In many instances, DEWA and SEWA have had to buy electricity and water from Abu Dhabi to cover shortages. Statistics on the electricity sector in UAE are shown for the years 2008–2014, which are the latest official data on the UAE energy sector of the Ministry of Energy, in tables and figures below[5] and[6]. Table 1 shows the total installed capacity for the different authorities. Figure 6 shows the different generation technologies for the installed capacity for the year 2014. It may be observed that combined cycle turbines (CCTs) constitute the majority of the generation technologies because the excess heat generated by them is used for thermal desalination, which is common in UAE.
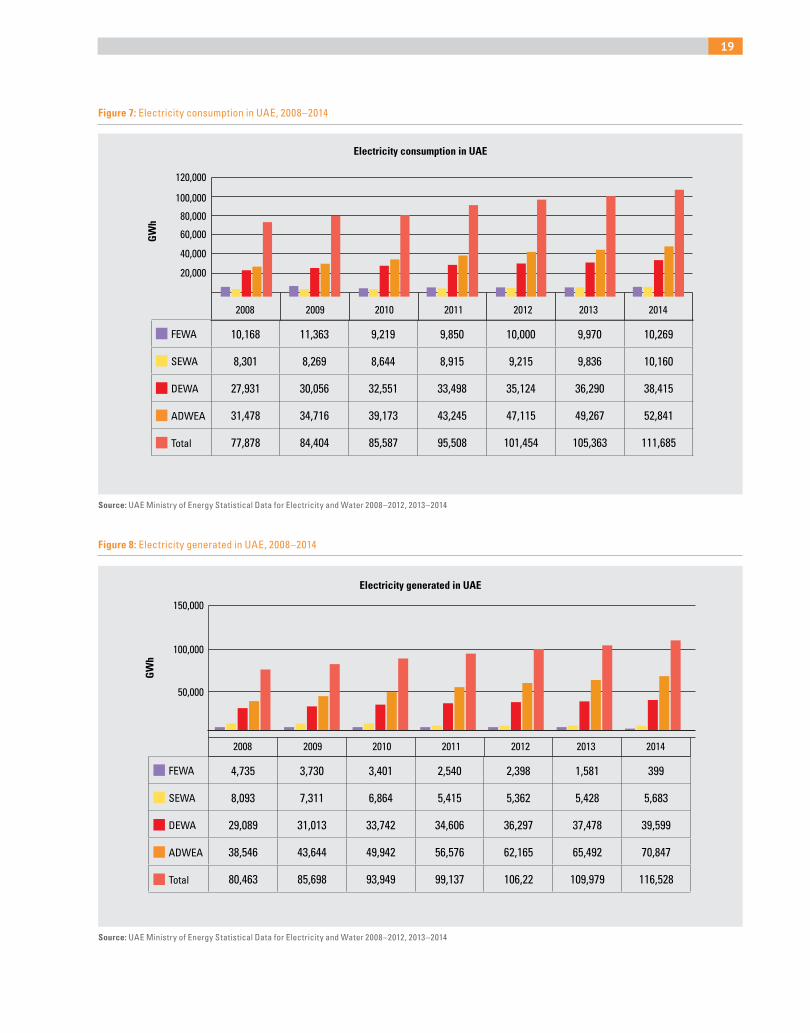
Figure 7 shows the electricity consumption in UAE for the period 2008–2014. Total electricity consumption increased from 77,878 GWh in 2008 to 111,685 GWh in 2014. Figure 8 shows the electricity generated in UAE for the period 2008–2014. Similarly, the electricity generated increased from 80,463 GWh in 2008 to 116,528 GWh in 2014. This increasing trend is expected to continue in the future. Figure 9 shows the share of electricity generations in each utility in 2014.
3.2 Characteristics of the electricity sector
Table 1: Total installed capacity of solar projects
FEWA SEWA DEWA ADWAEA TOTAL
2008 1,119 2,382 6,676 9,637 19,814
2009 1,080 2,382 6,997 10,110 20,569
2010 1,056 2,576 7,361 12,222 23,215
2011 985 2,576 8,721 13,850 26,132
2012 924 2,768 9,646 13,842 27,180
2013 924 2,895 9,656 13,899 27,374
2014 733 2,894 9,656 15,546 28,829
UAE infrastructure in is highly advanced, especially the power-system network as shown in Figure 10[7]. From the smart grid point of view, both Abu Dhabi and Dubai are trying to fully install digital electricity and water meters. Abu Dhabi has already installed 506,000 digital electricity and water meters, which represent 90% of the total meters. The remaining 10% represents the analogue meters in old buildings and will soon be replaced. All these digital meters will be linked to a meter data-management system to provide real daily consumption data[1]. Dubai has also started installing smart meters; 10,000 were installed in 2010 and 200,000 in 2016. In addition, the smart grid systems in UAE aim also at integrating renewable energy,
Source: IEA (International Energy Agency), Economic and Energy Data of UAE, 2016.
Source: UAE Ministry of Energy Statistical Data for Electricity and Water 2008–2012,2013–2014
18 CASE STUDY ON POLICY REFORMS TO PROMOTE RENEWABLE ENERGY IN THE UNITED ARAB EMIRATES
Total installed capacity in FEWA 733 MW
Total installed capacity in DEWA 9,656 MW
Total installed capacity in SEWA 2,894 MW
Total installed capacity in ADWEA 15,546 MW
Figure 6: Generation technology for the installed capacity for each utility in 2014
84%
80% 86%
100%
1%
20%10%
15%
0%0% 4%
Gas turbine Diesel engine Steam turbine Combined cycle turbine
Source: UAE Ministry of Energy Statistical Data for Electricity and Water 2013–2014.
mainly solar power, into power plants, houses and buildings. Utilities in UAE are planning to integrate electric vehicles into the smart grid systems in the near future. In order to meet future energy demands, financial investments are needed to expand the electricity system network which includes power generation, transmission and distribution.
So far, the major investments in renewable energy have included US$ 800 million in the 100 MW CSP solar plant in Abu Dhabi in 2011 and more recently US$ 400 million in the 200 MW solar PV in the Mohammed bin Rashid al-Maktoum Solar Park[8]. Dubai announced that total investment in the 5,000 MW Mohammad bin Rashid Al Maktoum Solar Park will total US$ 50 billion by 2030.
Source: Dominic Dudley, shutterstock.
19
Figure 7: Electricity consumption in UAE, 2008–2014
Figure 8: Electricity generated in UAE, 2008–2014
10,168 11,363 9,219 9,850 10,000 9,970 10,269
8,301 8,269 8,644 8,915 9,215 9,836 10,160
27,931 30,056 32,551 33,498 35,124 36,290 38,415
31,478 34,716 39,173 43,245 47,115 49,267 52,841
77,878 84,404 85,587 95,508 101,454 105,363 111,685
DEWA
120,000
2008 2009 2010 2011 2012 2013 2014
100,000
80,000
60,000
40,000
20,000
SEWA
ADWEA
Total
FEWA
GW
h
4,735 3,730 3,401 2,540 2,398 1,581 399
8,093 7,311 6,864 5,415 5,362 5,428 5,683
29,089 31,013 33,742 34,606 36,297 37,478 39,599
38,546 43,644 49,942 56,576 62,165 65,492 70,847
80,463 85,698 93,949 99,137 106,22 109,979 116,528
DEWA
150,000
2008 2009 2010 2011 2012 2013 2014
100,000
50,000
SEWA
ADWEA
Total
FEWA
GW
hElectricity consumption in UAE
Electricity generated in UAE
Source: UAE Ministry of Energy Statistical Data for Electricity and Water 2008–2012, 2013–2014
Source: UAE Ministry of Energy Statistical Data for Electricity and Water 2008–2012, 2013–2014

20 CASE STUDY ON POLICY REFORMS TO PROMOTE RENEWABLE ENERGY IN THE UNITED ARAB EMIRATES
Figure 9: Share of total energy generated by each utility in 2014
Figure 10: Electricity system network, 2015
34%
5%1%
60%
DEWA
SEWAADWEA
FEWA
{PAGE\*MERGEFORMAT}
Figure 9. Share of total energy generated by each utility in 2014 [6]
Figure 10. Electricity system network, 2015 [7]
3.2.1 Future energy mix
UAE is moving vigorously to incorporating clean power-generation technologies in its energy mix, including both renewables and non-renewables. The RETs will be discussed in more detail in the following sections. UAE is adding nuclear power and clean coal to its mix. In addition, UAE is considering several CCS projects to mitigate the impact of CO2 emissions from fossil-fuel power-generation plants.
Source: UAE Ministry of Energy Statistical Data for Electricity and Water 2013–2014.
Source: ADWEC, August 2016.
Source: echuyu2014, enveto.

21
3.2.1 Future energy mix
UAE is moving vigorously to incorporating clean power-generation technologies in its energy mix, including both renewables and non-renewables. The RETs will be discussed in more detail in the following sections. UAE is adding nuclear power and clean coal to its mix. In addition, UAE is considering several CCS projects to mitigate the impact of CO2 emissions from fossil-fuel power-generation plants.
3.2.1. 1 Nuclear powerThe Emirates Nuclear Energy Corporation (ENEC) was established in December 2009. It is in charge of implementing the UAE nuclear energy programme to produce electricity. The Korean Electric Power Corporation (KEPCO) was commissioned to build four 1,400 MW nuclear power plants in UAE. The first plant will be operational in 2018 and the reaming plants should be operational by 2020 for a total of 5.6 GW capacity at a total cost of US$ 20 billion[9].
3.2.1.2 Clean coalRecently in Dubai, as part of its energy-mix diversification in the power sector, new, clean coal-powered stations will be built for a total capacity of 2.4 GW. The project is a joint venture between DEWA and the Hassyan Energy Company. The engineering, procurement and construction (EPC) contract to build the power stations was awarded to General Electric and Harbin Electric International. The agreed model
3.3 Energy-demand characteristics
Table 2 shows the energy consumption by sector. The residential and commercial sectors consume more energy in general, especially ADWEA and DEWA, as shown in Figure 11. The other sectors have the highest energy-consumption figures because of the oil and gas industry and government buildings. Table 3 shows the number of consumers in each authority in 2013 and 2014. Table 4 shows the peak load capacity for the period 2008–2014 and Figure 12 compares the installed capacity against the peak load capacity; this confirms that UAE has more installed capacity than needed. Finally, Table 5 shows the total electricity export from Abu Dhabi to FEWA and SEWA in 2013 and 2014. Peak loads in UAE occur usually in summer. Essentially, there are two peaks load during the hot weather: the first major peak is between 1 pm and 3 pm when the installed peak capacity is needed; the second peak is smaller and occurs between 6 pm and 7 pm when people return home from work.
used was an EPC and a PPA for 25 years between the utility and Acwa Power Company. The first unit, 600 MW, is expected to be operational by 2020; the other three units will be commissioned in 2021, 2022 and 2023[10] and[11]. All the plants will be equipped with CO2 capture capabilities as required by the Government of Dubai[12].
Table 2: Energy consumption by sector in UAE in 2013 and 2014 (GWh)
FEWA SEWA DEWA ADWAEA TOTAL
2014 2013 2014 2013 2014 2013 2014 2013 2014 2013
Residential 4,616 4,469 15,535 14,731 4,135 4,015 10,835 10,077 35,121 33,292
Industrial 4,108 3,977 5,284 4,779 2,279 2,212 2,684 2,596 14,355 13,564
Commercial 1,432 1,386 15,958 14,780 1,805 1,753 18,397 17,326 37,592 35,245
Others 4 4 16,064 14,977 2,050 1,990 6,499 6,291 24,617 23,262
Total 10,160 9,836 52,841 49,267 10,269 9,970 38,415 36,290 111,685 105,363
Source: UAE Ministry of Energy Statistical Data for Electricity and Water, 2013–2014

22 CASE STUDY ON POLICY REFORMS TO PROMOTE RENEWABLE ENERGY IN THE UNITED ARAB EMIRATES
Figure 11: Share of electricity consumption by sector in 2014
Residential
OthersIndustrial
Commercial
31%
13%
22%
34%
Table 3: Total installed capacity of solar projects
Table 5: Electricity exports (GWh) from Abu Dhabi to FEWA and SEWA in 2013 and 2014
Figure 13: Projected power capacity for UAE
Table 4: Maximum peak load capacity(MW) in UAE, 2008-2014
Figure 12: Installed and peak load capacity in UAE, 2008–2014
FEWA SEWA DEWA ADWAEA TOTAL
2013 255,814 377,794 652,200 459,648 1,745,456
2014 278,325 388,372 677,751 474,934 1,819,382
FEWA SEWA Total
2013 9,025 5,644 14,669
2014 11,080 5,542 16,622
FEWA SEWA DEWA ADWAEA TOTAL
2008 1,790 1,817 5,287 5,616 14,510
2009 1,840 1,853 5,622 6,255 15,570
2010 1,850 1,934 6,161 6,885 16,830
2011 1,840 1,958 6,206 7,683 17,687
2012 2,060 2,087 6,637 8,278 19,062
2013 2,045 2,150 6,857 8,599 19,651
2014 2,157 2,150 7,233 8,983 20,523
In order to assess the potential future impacts of the different mitigation strategies that UAE is adopting in its energy mix, a baseline needs to be established for the power growth in UAE for the years 2020 and 2030, which will be used in our analysis to determine the future energy mix capacity and the corresponding CO2 emission reduction potentials. According to the International Renewable Energy Agency (IRENA)[16], the projected growth in power capacity between 2010 and 2020 is expected to be 6.2% per year and 4.2% per year between 2020 and 2030. Using these growth rates, the projected power capacity calculations are shown in Figure 13.
30,000
70,000
2008
2010
2012
2014
2016
2018
2020
2022
2024
2026
2028
2030
25,000
60,000
50,000
40,000
30,000
20,000
10,000
-
20,000
15,000
10,000
5,000
-
2008 2009 2010 2011 2012 2013 2014
Total Installed Capacity (MW) 19,814 20,569 23,215 23,215 26,136 27,374 28,829
Peak Load (MW) 14,510 15,570 16,830 17,687 19,062 19,651 20,523
FEWA SEWA DEWA ADWEA TotalSource: UAE Ministry of Energy Statistical Data for Electricity and Water, 2013–2014
Source: UAE Ministry of Energy Statistical Data for Electricity and Water 2008–2012, 2013–2014
Source: UAE Ministry of Energy Statistical Data for Electricity and Water 2008–2012, 2013–2014
Source: IRENA-Remap.
Source: philipus, Fotolia.
Source: Ministry of Energy, Statistical Data For Electricity and Water 2013- 2014.
Source: UAE Ministry of Energy Statistical Data for Electricity and Water, 2013–2014
Installed and peak load capacity
MW
MW
Projected Power capacity for UAE

23
3.4 Energy intensity
3.5 Energy–water nexus
Energy intensity (EI) represents the total primary-energy consumption per US$ of GDP per year. Figure 14 shows the energy intensity for Kuwait, Saudi Arabia, UAE and the world average[14]. Energy intensity in UAE, as in Kuwait and Saudi Arabia, started increasing over the last two years due to increased economic activity. World EI is decreasing, which means more action is needed by UAE to reduce its EI by taking more energy conservation and efficiency measures.
Figure 15 shows the water statistics for UAE for the period 2008–2014[5-6]. In 2012, the water-desalination capacity in UAE reached 1,583 million imperial gallons per day (MIG/day). The breakdown by desalination technology for UAE is shown in Figure 16. The energy for the multi-stage flash (MSF) desalination plants, which constitutes more than 80% of the desalinated
Figure 14: UAE energy intensity
Figure 15: Water production statistics for UAE, 2008–2014
World Kuwait Saudi Arabia United Arab Emirates
0.200
2000
2001
2002
2003
2004
2005
2006
2007
2008
2009
2010
2011
2012
2013
2014
2015
0.1800.1600.1400.1200.1000.0800.0600.0400.0200.000
water, comes from thermal co-generation power plants[13]. Water production in UAE will remain dependent on desalination technologies, which depend heavily on energy, both thermal and electric. The adoption of future desalination technologies by independent water and power producers (IWPPs) in UAE will be driven by their economic feasibility.
Mill
ions
of I
mpe
rial
Gal
lons
(MIG
)
MW
2008 2009 2010 2011 2012 2013 2014
Water Production (MIG/Y) 350,660 370,621 373,629 376,870 393,878 412,363 428,770
Water Consumption (MIG/Y) 323,159 344,082 344,462 347,867 369,731 373,483 390,538
Installed capacity (MIG/D) 1,167 1,243 1,361 1,547 1,585 1,616 1,610
Peak water Demand (MIG/D) 1,056 1,139 1,147 1,157 1,331 1,311 1,344
450,000
400,000
350,000
300,000
250,000
200,000
150,000
100,000
50,000
0
Energy intensity
Source: Enerdata (2016): Global Enengy Statistical Yearbook 2016
Source: UAE Ministry of Energy Statistical Data for Electricity and Water 2008–2012, 2013–2014

24 CASE STUDY ON POLICY REFORMS TO PROMOTE RENEWABLE ENERGY IN THE UNITED ARAB EMIRATES
Figure 16: Breakdown of UAE desalination capacity
Multiple-effect distillation
HybridMuti-stage flash
Reverse-osmosis
83%
11% 4% 2%
Table 6 shows the energy requirement and cost of water of the different desalination technologies. Multi-stage flash and multiple-effect distillation (MED) are mature technologies but more desalination plants are adopting reverse osmosis (RO) with increased advancement and lower cost of the membrane technology. In addition, RO relies on electricity more than heat. In any case, energy is the main driver of all the desalination processes.
Table 6: Energy requirements and cost of water for different desalination technologies
FEWA SEWA DEWA
Energy requirement (kWh/m3)
Seawater: 4–8 kWh/m3
Brackish water: 2–3 kWh/m3
Electrical (standalone or cogenerated): 3.5–5.0 kWh/m3
Standalone (thermal):69.44–83.33 kWh/m3
Cogenerated (thermal): 44.44–47.22 kWh/m3
Standalone (electric): O.5–1.5 kWh/m3
Cogenerated: (electric): 1.5–2.5 kWh/m3
Standalone (thermal): 41.67–61.11 kWh/m3
Cogenerated (thermal): 27.78 kWh/m3
Cost of water (US$/m3)
0.99 US$/m3 for seawater RO
0.53 $/m3 for Ashkelon
0.2–0.7 US$/m3 for brackish water
0.9–1.5 US$/m3: the cost falls with cogeneration and unit capacity.
Around 1 US$/m3:
0.827 US$/m3 for Jubail II plant in Saudi Arabia; the cost drops with cogenerated use of thermal vapour compression and unit capacity.
The major environmental impacts of desalination are increased discharge of brine and total dissolved solids (TDS) [16]. Demand for water is increasing and desalination will remain the main source for water in UAE, which is heavily dependent on energy. Future electricity generated from nuclear power plants – clean energy as compared to fossil fuel – will be used for RO water-desalination production. This will reduce the dependence on fossil fuel.
Source: UAE Ministry of Energy Statistical Data for Electricity and Water, 2013–2014 Source: Sunset of powerhouse, by penguiiin, fotolia.
Source: Mezher, T., H. Fath, Z. Abbas and A. Khaled, 2011.
Breakdown of UAE desalination capacity (2012)

25
3.6 CO2 emissions/footprint
In December 2012, UAE developed the third National Communication under the United Nations Framework Convention on Climate Change (UNFCCC), where the UAE inventory of greenhouse gas emissions for 2005 was presented as shown in Table 7. Total GHG emissions were 174,833 Gg CO2-equivalent which is mostly associated with energy production[1].
Table 7: UAE greenhouse-gas inventory for 2005
GHG sources and sinks
CO2-equivalent
(Gg)CO2 CH4 N2O NOx CO NMVOC SO2
Energy 153,833 128,824 1,011 12 330 491 27 10,346
Industrial processes 9,426 8,629 0 0 2 207 37 9
Solvent and other product use
0 0 0 0 0 0 0 0
Agriculture 3,976 0 75 8 0 0 0 0
Land-use change and forestry
-13,223 -13,223 0 0 0 0 0 0
Waste 7,122 0 339 0 0 0 0 0
Total national emissions 174,357 137,453 1,425 20 332 698 64 10,355
Net national emissions 161,134 124,230 1,425 20 332 698 64 10,355
Figure 3 in Section 2 showed that CO2 emissions per capita for UAE decreased over the years to reach 17.93 tCO2/capita in 2013 and CO2 emissions per GDP (CO2/GDP) in 2013 was 0.71 kg CO2/ US$ 2005 compared to 0.76 (kg CO2/US$ 2005) in 2012[3].
3.6.1 Carbon capture and sequestration projects
There are two CCS projects. The first one is designed to capture approximately 0.8 million tons per annum (Mtpa) of CO2 starting from 2016.
The CO2 will be captured from a dehydration and compression unit at an existing steel plant, Emirates Steel Industries.
In 2020, the second project plans to capture 2 Mtpa of CO2 from an existing natural-gas-based power plant at an aluminium smelter complex, Emirates Aluminium[16].
Source: UAE Ministry of Energy, 2012.

26 CASE STUDY ON POLICY REFORMS TO PROMOTE RENEWABLE ENERGY IN THE UNITED ARAB EMIRATES
Figure 17: Direct normal irradiation and global horizontal irradiation for UAE in 2010
4.1.1 Solar power
IV. Renewable energy potential
4.1 Renewable energy potential for power generation
UAE has high solar potentials and receives over 10 hours of sunlight daily. The country also has about 350 sunny days. Total solar energy received is some 6.5 kWh/m2/day and direct normal solar radiation is 4-6 kWh/m2/day, depending on location and time of year [13]. Figure 17 shows both DNI and GHI for UAE in 2010 [15]. DNI is a key input for CSP technology and GHI is a key input for PV technology. Dust particles, haze and humidity are big challenges for large-
scale deployment of CSP which can cause a great reduction in DNI. More monitoring and maintenance are therefore required for both CSP and PV to ensure the technologies are working at their full potential. The Masdar Institute Research Centre for Renewable Energy Mapping and Assessment (ReCREMA) [17] in Abu Dhabi is carrying out real-time measurements for both DNI and GHI which take into account the weather and dust monitoring. The Shams 1 solar plant with a capacity of 100 MW is the largest CSP plant in the world. Solar PV’s modular scalability, operating simplicity and ability to utilize diffuse light make it more suitable for the region. The 10 MW PV Masdar City power plant uses both cadmium telluride thin film and crystalline technologies [13].
{PAGE\*MERGEFORMAT}
4.1.1 Solar power UAE has high solar potentials and receives over 10 hours of sunlight daily. The country also has about 350 sunny days. Total solar energy received is some 6.5 kWh/m2/day and direct normal solar radiation is 4-6 kWh/m2/day, depending on location and time of year [13]. Figure 17 shows both DNI and GHI for UAE in 2010 [15]. DNI is a key input for CSP technology and GHI is a key input for PV technology. Dust particles, haze and humidity are big challenges for large-scale deployment of CSP which can cause a great reduction in DNI. More monitoring and maintenance are therefore required for both CSP and PV to ensure the technologies are working at their full potential. The Masdar Institute Research Centre for Renewable Energy Mapping and Assessment (ReCREMA) [17] in Abu Dhabi is carrying out real-time measurements for both DNI and GHI which take into account the weather and dust monitoring. The Shams 1 solar plant with a capacity of 100 MW is the largest CSP plant in the world. Solar PV’s modular scalability, operating simplicity and ability to utilize diffuse light make it more suitable for the region. The 10 MW PV Masdar City power plant uses both cadmium telluride thin film and crystalline technologies [13].
Figure 17. Direct normal irradiation and global horizontal irradiation for UAE in 2010 [17]
Bids have been invited in Abu Dhabi in 2016 for the newly announced solar 350 solar PV plant, Nour 1, which will be located in Sweihan. Abu Dhabi is planning to have 1,500 MW of solar power capacity of which 500 MW will be rooftop PV by 2020. Dubai, on the other hand, commissioned its first 13 MW solar PV plant Mohammed bin Rashid Al Maktoum 1 in 2013. The 200 MW solar PV plant, Mohammed bin Rashid Al Maktoum 2, was awarded to an IPP in 2015 for the first time. The PPA with DEWA was a LCOE of 5.84 US cents/kWh, which was a global milestone for the PV industry. DEWA selected another IPP for its 800 MW solar PV plant, Mohammed bin Rashid Al Maktoum 3 at an astonishing LCOE of 2.99 US cents/kWh. Both plants should be operational by 2020. Dubai is planning to have an additional 4,000 MW of solar power by 2030 for a total capacity of 5,000 MW. Table 8 shows the existing, announced and planned solar PV and CSP projects in UAE. Table 9 shows the total solar power capacity for the years 2016, 2020 and 2030.
Global horizontal irradiation irradiation (GHI) (2010)
Direct normal irradiation Direct normal irradiation Global horizontal irradiation (GHI)
Source: ReCREMA, 2013.

27
Bids have been invited in Abu Dhabi in 2016 for the newly announced solar 350 solar PV plant, Nour 1, which will be located in Sweihan. Abu Dhabi is planning to have 1,500 MW of solar power capacity of which 500 MW will be rooftop PV by 2020.
Dubai, on the other hand, commissioned its first 13 MW solar PV plant Mohammed bin Rashid Al Maktoum 1 in 2013. The 200 MW solar PV plant, Mohammed bin Rashid Al Maktoum 2, was awarded to an IPP in 2015 for the first time. The PPA with DEWA
was a LCOE of 5.84 US cents/kWh, which was a global milestone for the PV industry. DEWA selected another IPP for its 800 MW solar PV plant, Mohammed bin Rashid Al Maktoum 3 at an astonishing LCOE of 2.99 US cents/kWh. Both plants should be operational by 2020. Dubai is planning to have an additional 4,000 MW of solar power by 2030 for a total capacity of 5,000 MW. Table 8 shows the existing, announced and planned solar PV and CSP projects in UAE. Table 9 shows the total solar power capacity for the years 2016, 2020 and 2030.
Table 8: Existing, announced and future solar projects in UAE
Capacity (MW)
Existing renewable energy power plants
Dubai solar PV plant, Mohammed bin Rashid Al Maktoum 1 13
Abu Dhabi Masdar City PV plant 10
Abu Dhabi Shams 1 CSP Plant 100
Announced renewable energy power plants
Dubai solar PV plant by 2020, Mohammed bin Rashid Al Maktoum 2 200
Dubai solar PV plant by 2020, Mohammed bin Rashid Al Maktoum 3 800
Abu Dhabi solar PV power plants by 2020, Nour 1 in Sweihan 350
Future renewable energy plantsDubai is planning to add 4,000 MW of solar PV and maybe CSP by 2030. 4000
Abu Dhabi is planning to add solar PV plants by 2020, Nour 2 540
Future renewable rooftop Abu Dhabi is planning to add solar PV rooftop by 2020 500
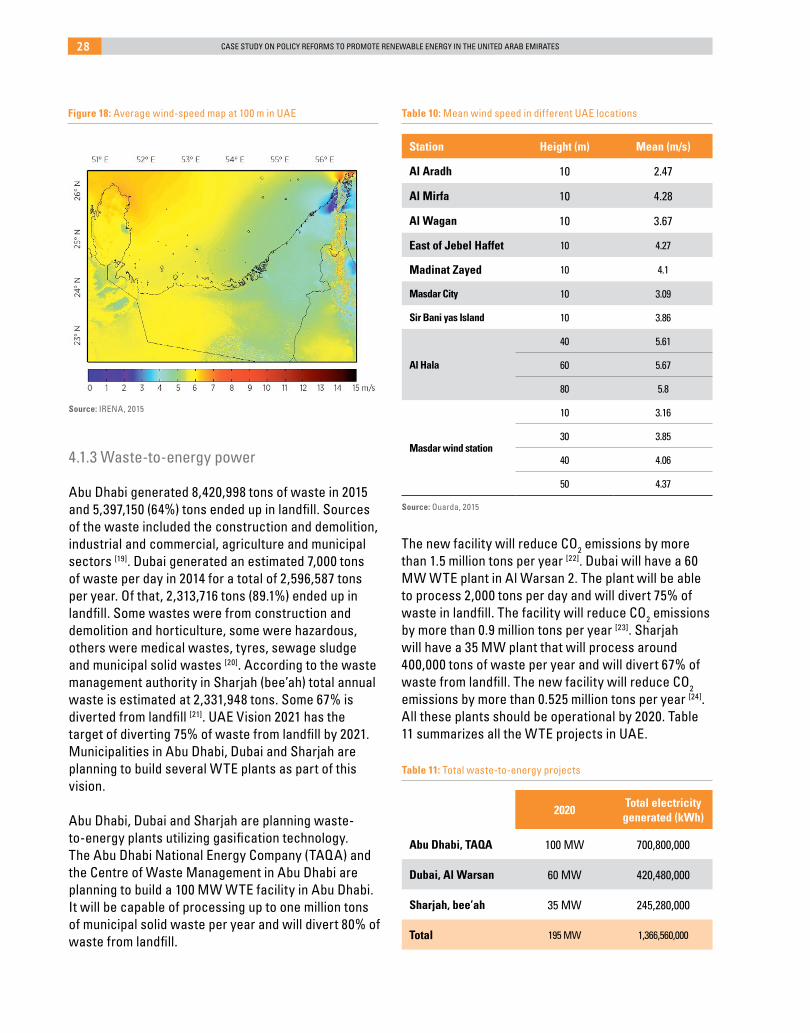
Wind resources in the country are less abundant than solar but there is still a potential for wind energy in the country’s energy mix. Wind speed varies according to the weather and climate. Table 10 shows the mean wind speed at different locations throughout UAE. Wind speed ranges between 2.47 m/s and 5.8 m/s [18]. Figure 18 shows the average wind-speed map at 100 m [13]. Currently, only one 30 MW wind turbine has been built in Abu Dhabi but it is not connected to the grid. No utility company in UAE has announced future plans for wind power.
4.1.2 Wind power Table 9. Total installed capacity of solar projects
Total installed capacity
2016 2020 2030
Solar PV power plants and rooftop 23 MW 2,500 MW 6,500 MW
Solar CSP power plant 100 MW 100 MW 100 MW
Total 123 MW 2,600 MW 6,600 MW
Source: IRENA-Rmap
28 CASE STUDY ON POLICY REFORMS TO PROMOTE RENEWABLE ENERGY IN THE UNITED ARAB EMIRATES
Abu Dhabi generated 8,420,998 tons of waste in 2015 and 5,397,150 (64%) tons ended up in landfill. Sources of the waste included the construction and demolition, industrial and commercial, agriculture and municipal sectors [19]. Dubai generated an estimated 7,000 tons of waste per day in 2014 for a total of 2,596,587 tons per year. Of that, 2,313,716 tons (89.1%) ended up in landfill. Some wastes were from construction and demolition and horticulture, some were hazardous, others were medical wastes, tyres, sewage sludge and municipal solid wastes [20]. According to the waste management authority in Sharjah (bee’ah) total annual waste is estimated at 2,331,948 tons. Some 67% is diverted from landfill [21]. UAE Vision 2021 has the target of diverting 75% of waste from landfill by 2021. Municipalities in Abu Dhabi, Dubai and Sharjah are planning to build several WTE plants as part of this vision.
Abu Dhabi, Dubai and Sharjah are planning waste-to-energy plants utilizing gasification technology. The Abu Dhabi National Energy Company (TAQA) and the Centre of Waste Management in Abu Dhabi are planning to build a 100 MW WTE facility in Abu Dhabi. It will be capable of processing up to one million tons of municipal solid waste per year and will divert 80% of waste from landfill.
4.1.3 Waste-to-energy power
Table 10: Mean wind speed in different UAE locations
Table 11: Total waste-to-energy projects
Figure 18: Average wind-speed map at 100 m in UAE
Station Height (m) Mean (m/s)
Al Aradh 10 2.47
Al Mirfa 10 4.28
Al Wagan 10 3.67
East of Jebel Haffet 10 4.27
Madinat Zayed 10 4.1
Masdar City 10 3.09
Sir Bani yas Island 10 3.86
Al Hala
40 5.61
60 5.67
80 5.8
Masdar wind station
10 3.16
30 3.85
40 4.06
50 4.37
2020Total electricity generated (kWh)
Abu Dhabi, TAQA 100 MW 700,800,000
Dubai, Al Warsan 60 MW 420,480,000
Sharjah, bee’ah 35 MW 245,280,000
Total 195 MW 1,366,560,000
{PAGE\*MERGEFORMAT}
Table 10. Mean wind speed in different UAE locations [18]
Station Height (m) Mean (m/s) Al Aradh 10 2.47 Al Mirfa 10 4.28 Al Wagan 10 3.67 East of Jebel Haffet 10 4.27 Madinat Zayed 10 4.1 Masdar City 10 3.09 Sir Bani yas Island 10 3.86
Al Hala 40 5.61 60 5.67 80 5.8
Masdar wind station
10 3.16 30 3.85 40 4.06 50 4.37
Figure 18. Average wind-speed map at 100 m in UAE [13]
4.1.3 Waste-to-energy power
Abu Dhabi generated 8,420,998 tons of waste in 2015 and 5,397,150 (64%) tons ended up in landfill. Sources of the waste included the construction and demolition, industrial and commercial, agriculture and municipal sectors [19]. Dubai generated an estimated 7,000 tons of waste per day in 2014 for a total of 2,596,587 tons per year. Of that, 2,313,716 tons (89.1%) ended up in landfill. Some wastes were from construction and demolition and horticulture, some were hazardous, others were medical wastes, tyres, sewage sludge and municipal solid wastes [20]. According to the waste management authority in Sharjah (bee’ah) total annual waste is estimated at 2,331,948 tons. Some 67% is diverted
The new facility will reduce CO2 emissions by more than 1.5 million tons per year [22]. Dubai will have a 60 MW WTE plant in Al Warsan 2. The plant will be able to process 2,000 tons per day and will divert 75% of waste in landfill. The facility will reduce CO2 emissions by more than 0.9 million tons per year [23]. Sharjah will have a 35 MW plant that will process around 400,000 tons of waste per year and will divert 67% of waste from landfill. The new facility will reduce CO2 emissions by more than 0.525 million tons per year [24]. All these plants should be operational by 2020. Table 11 summarizes all the WTE projects in UAE.
Source: IRENA, 2015
Source: Ouarda, 2015

29
All existing and proposed renewable energy projects (small, medium or large) are utility-scale plants and will be connected directly to the grid. Figure 19 shows the potential daily contribution to power generation
4.1.4 Integration of renewable energy into the power-generation mix
0:00
40
30
20
10
20
15
10
5
0
0
2:00
Solar PV Gas($1-$8/MMbtu)
LNG($8-$16/MMbtu)
Oil($40-$80/Barrel)
Coal Nuclear
4:00 6:00 8:00 10:00 12:00 14:00 16:00 18:00 22:0020:00
Figure 19: Projected daily power generation for UAE in 2030 by technology
Figure 20: LCOE of utility-scale electricity generation technologies in GCC (US cents/kWh)
Solar PV Wind CSP (with storage) Cogeneration Waste to Energy
Time
Electricity generation (GW)
LCOE (US cents/kWh)
Nuclear
of different technologies. Figure 20 shows LCOE of utility-scale electricity generation technologies in the GCC (US cents/kWh) [8]. As can be seen in Figure 19, PV solar power can cater for the midday demand peak, whatever the LCOE of the technology is; CSP with storage can be useful to address the evening peaks.
Source: IRENA, August 2015.
Source: IRENA, August 2015.

30 CASE STUDY ON POLICY REFORMS TO PROMOTE RENEWABLE ENERGY IN THE UNITED ARAB EMIRATES
In addition to integrating renewables in the power sector, there are serious plans for integrating them in desalination. On a smaller scale, solar pumps are used in UAE for agriculture and other purposes. All street lights used in Masdar City are solar-powered, in addition to a few other streets in the country. The Masdar Company is involved with several projects in UAE suitable for renewable energy, including several pilot desalination plants. The ultimate goal is to have a commercial facility operating in the Middle East and North Africa (MENA) region by 2020 [25]. Masdar also has in its portfolio several small projects as shown below [26]. • Al Hayl: 15 hybrid systems of 200 kW peak in Al Hayl Island, UAE, that are supported by a diesel generator, batteries and a reverse-osmosis package; • Al Jarnain: a 750-kW peak grid of photovoltaic power on Al Jarnain Island, UAE;
• Al Wathba camel farm: an 850 kW wind turbine in Al Wathba, UAE;
• Al Wathba stables: a solar PV facility with a 120 kW peak on grid;
• Omran hospital: rooftop PV with 450 kW peak plus PV-powered streetlights in Ras Al Khaimah, UAE;
• Sea Palace: 200 kW peak on-grid PV power, Abu Dhabi;
• Sustainable farm: an eight-acre sustainable farm in Al Ain, UAE;
• Concentrated PV pilot: 600 kW peak grid in Masdar City, UAE.
Potential for local integration and manufacturing Currently in UAE, there are four solar energy manufacturers in UAE, which build PV modules from imported parts to fit the needs of local and international markets. Most of their products are for off-grid uses, mainly water pumps, solar roofs,
4.2 Renewable energy potential for direct uses
streetlights, signals and signs, etc. Many have small-scale projects in Asia and Africa. Although this industry is small at present, it may grow with the right incentives from the Government. Annex 2.1 lists all the solar energy manufacturers in UAE.
The potential for job-creation opportunities from renewable energy are high throughout the value chain for each technology and not just for manufacturing but the literature reports different figures in different countries. Annex 2.2 shows the summary of employment factor by technology and job in certain countries. The jobs range between management, engineering, highly skilled technicians and unskilled labour levels. UAE nationals are more suitable for management and engineering jobs. There are several free zones where investments can be made in renewable energy manufacturing plants, as long as there are potential local and international markets.
V. Assessment methodology
In order to determine the potential CO2 emission reductions from different power-generation technologies, the following equations are used to calculate both annual electricity generation (kWh/year) and annual CO2 emissions (tCO2/year) [27]:
Annual electricity generation ( kWhyear)= plant capacity
(kW) × Plant capacity factor x 8,760 h (1)
Annual CO2 e mmisions (tons CO2)= power generation ( kWh
year )× Emission factor (Tons CO2kWh
) (2)
Annual CO2 emmision reductions (tons CO2)=
Emissions from natural power generation-
Emissions from other technologies (3)
Table 12 shows the plant-capacity factors for different power-generation technologies. Table 13 shows the estimated CO2 emissions for different power-generation technologies and the potential CO2 emission reductions for each technology compared to gas-fired power plants.

31
Table 12: Plant capacity factors for different power-generation technologies
Table 13: Estimated CO2 Emissions for different power-generation technologies
Technology Capacity factor (2010) Capacity factor (2020) Capacity factor (2030)
CSP 22% 35% 45%
PV 22% 22% 22%
Wind 24% 24% 24%
WTE 80% 80% 80%
Nuclear 80% 80% 80%
Coal 58% 58% 58%
Gas (cogeneration) 65% 65% 65%
CO2 emissions (gCO2e/kWh) Reduction of CO2 emissions from gas substitutions
Wind 10 -433
Solar thermal 13 -430
Solar PV 32 -411
Nuclear 66 -377
Natural gas 443 -
Coal with scrubbing 960 517
5.1 Assumptions made
6.1 Renewable energy strategy and targets
The UAE 2021 vision, which was established in 2010, set a new path and a national agenda. The themes of the new agenda include: cohesive society and preserved identity; competitive knowledge economy;
The following assumptions are made in the calculations:
• Power-generation plants in UAE are mostly fuelled by natural gas. All existing and announced renewable energy, nuclear and coal plants’ capacity that will be added will substitute natural gas power plants;
• All the renewable energy technologies are based on existing, announced and future renewable energy plants, as shown in Tables 10 and 11;
• The additional 4,000 MW solar PV forecast by Dubai by 2030 will be added regularly – 400 MW per year – for the following 10 years, starting in 2021. It is still not clear if CSP plants will be part of the announced capacity by 2030;
• No wind capacity is added, because no future announcement by any utility in UAE has been made;
• 2,400 MW coal plants with CCS in Dubai will have zero CO2 emissions;
• No additional renewable energy adoption scenarios are considered.
VI. Current and previous policy status
Source: IRENA, EIA, August 2015.
Source: Sovacool, B.K., 2008.

32 CASE STUDY ON POLICY REFORMS TO PROMOTE RENEWABLE ENERGY IN THE UNITED ARAB EMIRATES
Table 14: Announced power generation targets
Table 15: Demand-reduction targets
2020 2021 2030 2050
UAE 24 % of clean energy of the total energy mix
Abu Dhabi 7% renewables (solar), 19% nuclear
Dubai 7% renewables 25% renewables (solar),
7% nuclear75 % of energy needs will be met from clean
sources
Abu Dhabi Enactment in 2010 of Estidama1, mandatory building and landscape sustainability regulations to cut energy and water consumption by one-third and pricing reforms
DubaiEstablishment of 30 % demand reduction target by 2030 through a mix of pricing reforms, performance codes
and efficient investments (building regulations, building retrofits, district cooling, standards and labels for appliances and equipment, outdoor lighting and change of tariff rates)
world-class healthcare; a first-rate education system, a safe, public and fair judiciary; and sustainable environment and infrastructure. The last theme highlights the need to improve air quality, preserve water resources, increase the contribution of clean energy and establish green growth plans. It gave clear signals to the different emirates about the seriousness of the Government in adopting clean energy strategies and developing the needed policies.
The first renewable energy policy started in Abu Dhabi when the Government announced in 2009 that 7% of power capacity will be renewables by 2020. Afterwards, Dubai announced several renewable energy targets in the past but its present targets are 7% of solar power by 2020 and 25% of solar power by 2030. In 2016, Dubai announced that it aimed to provide 75% of its energy through clean energy sources by 2050. Solar and other renewable technologies, especially storage, are advancing fast and will eventually lead to newer renewable energy targets and energy mix in the future [1], [13], [30]. Table 14
shows clean power-generation targets set by UAE, Abu Dhabi and Dubai. In addition, Abu Dhabi and Dubai have set demand-reduction targets as shown in Table 15. The demand-side management will definitely include renewable energies such as PV rooftops and BIPV but only Abu Dhabi has announced that 500 MW of solar rooftops will be installed by 2020. In March 2015, Dubai announced the Shams Dubai Initiative which is based on a net metering scheme that allows consumers to generate electricity from PV solar panels and feed the excess to the grid which can be recovered when needed at no cost.
The large-scale solar projects are supported by auction schemes in order to achieve a well-planned and cost-efficient deployment [1], [13], [30]. The 10 MW and 13 MW solar PV power plants are considered to be small compared to the 100 MW and announced CSP plants. All these power plants are connected to the grid. Other potential small-scale off-grid deployments were mentioned previously. Such opportunities will increase in the future.
1 Estidama is a building rating system used by Abu Dhabi Emirate to ensure sustainability
Source: UAE Ministry of Energy 2012, IRENA 2015, DEWA August 2016.
Source: UAE Ministry of Energy 2012, IRENA 2015, DEWA August 2016.

33
6.2 Present renewable energy policies and institutional framework
Renewable energy plans and targets must be backed by clear policies, as well as by institutions and regulatory bodies. The institutions and regulatory bodies in UAE that are relevant to such policies are shown in Table 16. Each emirate in UAE sets its own policies and regulations. ADWEA in Abu Dhabi and DEWA in Dubai are the bodies that will ensure renewable energy policy implementations. In Dubai, for instance, the Government established the Dubai Supreme Council of Energy (DSCE) in 2010 and its mandate is to set the strategic direction of Dubai towards securing sustainable supply of energy. It is the governing body tasked with strategic policy and regulation decisions. DSCE leadership is composed of all related government authorities (oil and gas, utility, transportation, nuclear, etc.) that are affected by the decisions. DSCE led to the integration of the 13 MW solar PV power plant into the grid.
At the national level, UAE has been the most active country in GCC in establishing specialized institutions to promote renewable energies. In addition to the Ministry of Energy which is in charge of strategic energy decisions, a separate unit, the Directorate of Energy and Climate Change (DECC), was established in 2010 within the Ministry of Foreign Affairs. In addition to its active role at the international stage (climate change negotiations and monitoring, interface with relevant international agencies, etc.), DECC has also played an important role in the development of sustainable energy.
The electricity tariffs that consumers pay in UAE are still considered to be subsidized but are higher compared to other GCC countries. Dubai in 2011 and Abu Dhabi in 2015 raised the electricity and water tariffs and both adopted a slab tariff as shown in Annex 3.1 and Annex 3.2. UAE also liberalized petrol prices in 2015 to reflect international oil prices as shown in Annex 3.3.
Regarding tariff policies for electricity from renewable energy, Abu Dhabi and Dubai are currently implementing an auction mechanism that follows the IPP-PPA model and turns away from the EPC model which was followed by most of the power plants in Dubai. This means that the power plants are totally owned and operated by a Dubai utility company. Abu Dhabi, on the other hand, has always used an IPP-PPA business model with conventional fuel power plants and continues and will continue to do so with existing and future power plants. Moving from an EPC to a PPA and IPP model was an important decision to involve the private sector more in the power sector, including financial institutions that are more willing to pay the high upfront cost for renewable energy power plants. PPA reflects the LCOE per kWh that the utilities will buy from IPPs. Only the 13 MW solar PV plant in Dubai was an implemented EPC model. The 10 MW solar PV plant in Masdar City was the first plant connected to the grid and using the net metering system. During the day, excess power is fed to the grid and at night power is fed from the grid to Masdar City. Annex 4 summarizes the role and decrees for the establishment of the public institutions involved in the energy sector in UAE.
Table 16: Institutions and regulatory bodies involved in policymaking and planning in the UAE energy sector
Institutions Regulatory bodies
UAE Ministry of Energy
Electricity is regulated by emirate-level insti-tutions in Abu Dhabi, Dubai and Sharjah. The
remaining are covered by the Federal Electricity and Water Authority
Abu Dhabi Abu Dhabi Water and Electricity Authority, Abu Dhabi Energy Authority (2016)
Abu Dhabi Regulation and Supervision Bureau; Abu Dhabi Water and Electricity Authority
Dubai Dubai Water and Electricity Authority and Dubai Supreme Council of Energy
Dubai Regulation and Supervision Bureau; Dubai Electricity and Water Authority
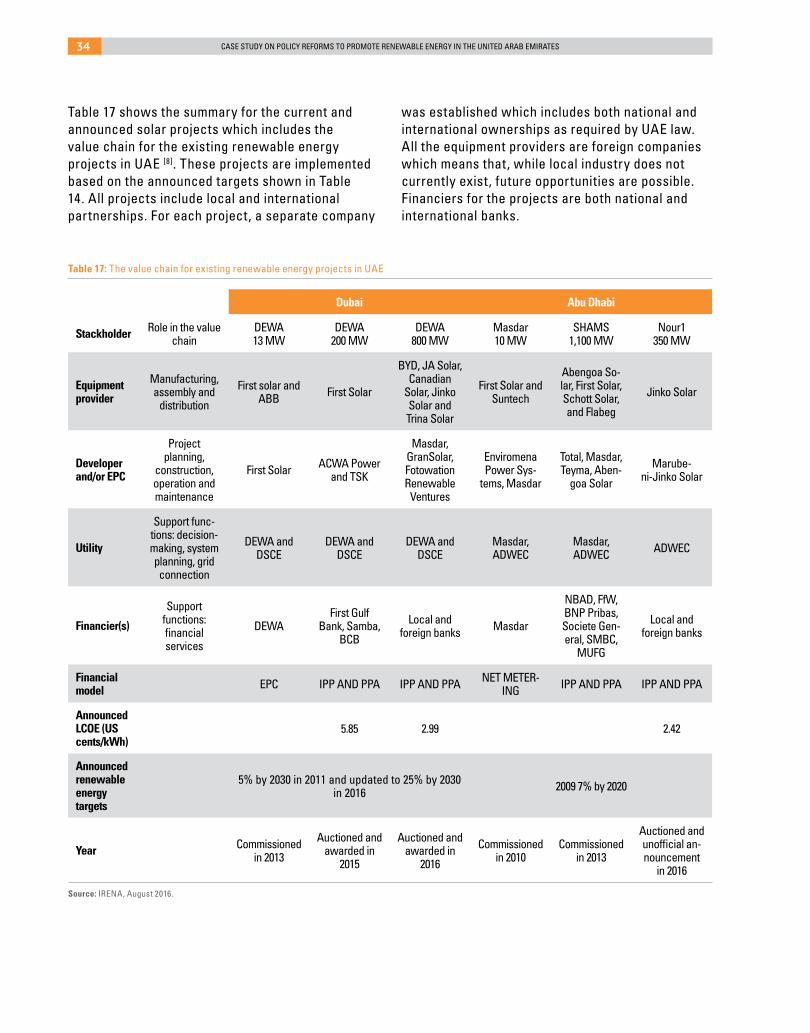
34 CASE STUDY ON POLICY REFORMS TO PROMOTE RENEWABLE ENERGY IN THE UNITED ARAB EMIRATES
Table 17 shows the summary for the current and announced solar projects which includes the value chain for the existing renewable energy projects in UAE [8]. These projects are implemented based on the announced targets shown in Table 14. All projects include local and international partnerships. For each project, a separate company
was established which includes both national and international ownerships as required by UAE law. All the equipment providers are foreign companies which means that, while local industry does not currently exist, future opportunities are possible. Financiers for the projects are both national and international banks.
Table 17: The value chain for existing renewable energy projects in UAE
Dubai Abu Dhabi
Stackholder Role in the value chain
DEWA 13 MW
DEWA 200 MW
DEWA 800 MW
Masdar 10 MW
SHAMS 1,100 MW
Nour1 350 MW
Equipment provider
Manufacturing, assembly and
distribution
First solar and ABB First Solar
BYD, JA Solar, Canadian
Solar, Jinko Solar and Trina Solar
First Solar and Suntech
Abengoa So-lar, First Solar, Schott Solar, and Flabeg
Jinko Solar
Developer and/or EPC
Project planning,
construction, operation and maintenance
First Solar ACWA Power and TSK
Masdar, GranSolar, Fotowation Renewable
Ventures
Enviromena Power Sys-
tems, Masdar
Total, Masdar, Teyma, Aben-
goa Solar
Marube-ni-Jinko Solar
Utility
Support func-tions: decision- making, system planning, grid connection
DEWA and DSCE
DEWA and DSCE
DEWA and DSCE
Masdar, ADWEC
Masdar, ADWEC ADWEC
Financier(s)
Support functions: financial services
DEWAFirst Gulf
Bank, Samba, BCB
Local and foreign banks Masdar
NBAD, FfW, BNP Pribas, Societe Gen-eral, SMBC,
MUFG
Local and foreign banks
Financial model EPC IPP AND PPA IPP AND PPA NET METER-
ING IPP AND PPA IPP AND PPA
Announced LCOE (US cents/kWh)
5.85 2.99 2.42
Announced renewable energy targets
5% by 2030 in 2011 and updated to 25% by 2030 in 2016 2009 7% by 2020
Year Commissioned in 2013
Auctioned and awarded in
2015
Auctioned and awarded in
2016
Commissioned in 2010
Commissioned in 2013
Auctioned and unofficial an-nouncement
in 2016
Source: IRENA, August 2016.

35
Two major reforms were introduced in UAE in 2016 that will have an impact on future policies.
It is observed that the LCOE in Dubai varied in a short time from 5.85 to 2.99 US cents/kWh: the reason for this being the economy of scale. The first power plant was 200 MW and the second one was 800 MW. The latest announcement by Abu Dhabi for the 350 MW plant, LCOE was 2.42 US cents/kWh and it will drop further if the capacity is increased.
6.3 Suitability of present renewable energy policies and institutional framework to meet announced strategies and targets
6.4 Renewable energy policy and institutional reforms being introduced/ considered
At the emirate level, in Abu Dhabi, Masdar worked with RSB and ADWEA to facilitate the grid integration of both the 10 MW solar PV plant in Masdar City and the Shams 1,100 MW CSP plant. The lessons learned and experience gained from the two plants will accelerate the integration of future projects into the grid. The same thing was done in Dubai; DSCE worked with RSB and ADWEA facilitated the building and integration of the 13 MW PV power into the grid. The lessons learned from these existing policies and institutional frameworks will help meet the announced targets, especially with the speed in announcing the new projects as shown in Table 19. By 2020, the real success of existing renwable energy policies and related institutional frameworks will be much clearer.
Masdar Institute in Abu Dhabi is the only graduate level (Masters and PhD programmes) academic institution in UAE. It was established in 2007 in collaboration with the Massachusetts Institute of Technology in the USA and is devoted to R&D in sustainable energy and water technologies. Masdar Institute has also established the Research Centre for Renewable Energy Mapping and Assessment (ReCREMA), which is measuring DNI and GHI all over UAE, taking into account that the atmosphere is full of dust and humidity. ReCREMA is unique in the region.
The first reform was the major overhaul of the UAE’s federal Government. Many new ministries were established and the Ministry of Climate Change and Environment (previously Ministry of Environment and Water) was established. DECC is no longer under the Ministry of Foreign Affairs, which shows the seriousness of UAE in tackling climate change and environmental issues. Another major change was the newly established Council of Scientists to review UAE’s national policy on science and technology and to nurture a new generation of UAE scientists. This shows the importance of R&D in advancing science and technology in UAE that will eventually contribute to the growth and diversification of the economy, including the sustainable energy sector. No change was made to the Ministry of Energy. The second reform was in Abu Dhabi, where the government established the Energy Authority (ADEA), similar to DSCE in Dubai, which includes all the government entities (major energy producers and consumers, etc.) for collective strategic policymaking and regulations. The new institutional reforms will help in accelerating renewable energy adoption and integration in UAE in terms of coordination, collaboration and sharing of information between all related stakeholders at both national and emirate levels in order to meet national targets and international commitment to climate change. Major decisions regarding adoption of technologies are made at the emirate level and all the accomplishments are then collected and disseminated to international agencies.
Even with the announced policies and institutional reforms, there is no clear national vision for a renewable energy strategy for the whole country: the federal Government is only reacting to initiatives made by Abu Dhabi and Dubai. Federal Government intervention is limited by the decentralized decision-making process in the country. The other five emirates should learn from Abu Dhabi and Dubai and start their own reforms to initiate renewable energy projects. The federal Government can play an important role in creating synergy between Abu Dhabi and Dubai on the one hand and the other five emirates to kick-start renewable energy programmes.

36 CASE STUDY ON POLICY REFORMS TO PROMOTE RENEWABLE ENERGY IN THE UNITED ARAB EMIRATES
7.1 Overall impact of the policy measures that were introduced or are being considered on the renewable energy market in the country
In general, renewable energy policy in any country should support the national sustainable development vision thereof, which includes climate change, public health, economic development and energy access and security. The policy should follow a clear vision and strategy in terms of setting achievable targets, building the right institutions and regulatory framework, setting the policy instruments and selecting the most suitable RETs. Many critical events have occurred in UAE since 2008 that had direct and indirect impacts on renewable energy adoption, highlighting not only the importance of renewable energy as a power technology but also in building policies and related institutions, infrastructure and human capacity. These events brought global experiences of renewable energy in its entire spectrum. They include:
• The creation of the Masdar Initiative in 2006;
• The World Future Energy Summit (WFES) in Abu Dhabi since 2008: an annual event which brings together all the players in renewable energy, sustainable development and water. WFES became part of the annual Abu Dhabi Sustainability Week (ADSW) which also includes the International Water Summit, the Zayed Future Energy Prize (ZFEP) and the IRENA General Assembly. ADSW became the major platform to announce major renewable energy policies in UAE in addition to sharing developments;
• The establishment of ZFEP was announced in 2008 at WFES. The Prize is awarded annually, Winners have been a large corporation, a small and medium enterprise, a non-profit organization, a lifetime achievement recipient and as many as five high schools in five different regions of the world;
• Abu Dhabi became the home and headquarters for IRENA in 2009. The IRENA headquarters are currently located in Masdar City; • Building the first sustainable city in the world in 2010: Masdar City;
VII. Economic, environmental and policy analysis
• Commissioning several renewable energy power plants in the country, including the 10 MW solar PV in Masdar City, the 100 MW solar CSP plant in the western region of Abu Dhabi and the 13 MW solar PV plant in Dubai;
• On 26 July 2016, the fully powered solar PV aircraft, Solar Impulse 2, made its final destination in Abu Dhabi after an epic journey around the world which started in March 2015;
• UAE will be hosting the 2020 World Expo in Dubai. This event is critical and gives a new momentum for the renewable energy sector where sustainable development is a highly important focus.
The previously mentioned milestones created a very dynamic market. Many related international companies established offices in UAE in partnership with local companies. Two major associations were created in UAE. The first one is the Middle East Solar Association (MESIA) which was established in 2009. Its main objectives are to promote solar power and networking for solar professionals and to produce technical and policy reports from the private sector point of view. MESIA has over 100 local and international prospective members located in UAE from all segments of the value chain, such as engineering, professional services, manufacturing and contracting companies. The second association is the Emirates Solar Industry Association (ESIA), established in 2012. It provides UAE solar professionals with the opportunity to meet through workshops, conferences and lectures. Its members also represent all segments of the value chain, which includes manufacturers, suppliers, project developers and consultancies; system integrators; research and education; legal and industry consultants; and financial services. Also, Masdar City includes a high-technology cluster of energy companies collaborating with both the Masdar Company and Masdar Institute to advance the adoption of renewable energy technology in UAE and the region. All the above associations

37
and Masdar Company are playing a crucial role in the development of the market. By signing a PPA agreement with an IPP to build and operate a solar plant, the Government guarantees payment for the energy produced. This, in turn, encourages financial institutions to invest in renewable energy projects. The Shams 1 plant was a good example of a successful PPA-IPP model. All IPPs in UAE are mostly owned by the Government (60% in case of Shams 1) and this is an additional incentive for the financial sector.
7.2 Analysis of potential economic and social impacts of the evolution of the renewable energy market
7.3 Environmental impacts
The establishment of the renewable energy industry in UAE is part of the Government’s vision to diversify its economy. By 2030, therefore, it should be able to contribute to the growth of GDP. Since 2006, many companies have been established in UAE which have led to direct job creation. Many supporting businesses were created around the industry which resulted in indirect job creation. This gave UAE an advantage in building the private sector and human capital knowledge and expertise in the sector which will expand its operation to other countries in the region and beyond. The Masdar Company has become an international brand and has many renewable energy projects with partners in many countries around the globe.
Figure 21 shows the potential CO2 emission reductions from the different energy mix in the power sector in UAE and it can be seen that nuclear power will play an important role in mitigating the CO2 emission impact. Annex 5.1 and Annex 5.2 show the values for annual electricity generation (kWh/year) and annual CO2 emissions (tCO2/year). Air pollution from fossil-fuel power generation will be reduced proportionally by the capacity replaced by cleaner technologies.
Figure 22 shows the CO2 emission trends in UAE before and after adopting mitigation strategies based on declared existing and future clean-energy capacities (baseline). The majority of the reduction comes from
2016 2020 2025 2030
30,000,000,000
180,000,000,000
160,000,000,000
140,000,000,000
120,000,000,000
100,000,000,000
80,000,000,000
60,000,000,000
40,000,000,000
20,000,000,000
0
20,000,000,000
25,000,000,000
15,000,000,000
Other CCS Projects
CSP
Coal + CCS
PV (Rooftop)
Nuclear
PV (Utility)
WTE
10,000,000,000
5,000,000,000
0
Figure 21: Potential CO2 emission reduction from clean-energy deployment
Figure 22: CO2 emission trends in UAE before and after adopting mitigation strategies
2010
2013
2016
2019
2022
2025
2028
With mitigations strategies-baseline
With mitigations strategies
With mitigations strategies-Scenario one
nuclear power rather than from renewable energy. It can be seen that, after 2020, the CO2 trend starts increasing due to an increased demand for energy. If we assume another scenario, Scenario One, where Abu Dhabi installs additional 4,000 MW of PV by 2030 similar to Dubai, we notice a slight additional decline in CO2 emissions but it is not significant.
According to IRENA [8], RE plans could result in an approximately 5% reduction in water withdrawal and consumption. The water savings come from replacing regular fossil-fuel power plants and the extracting fuel needed. The negative impact of renewable energy deployment would be in the increase of water used
Source: Abu Zahra, 2015.

38 CASE STUDY ON POLICY REFORMS TO PROMOTE RENEWABLE ENERGY IN THE UNITED ARAB EMIRATES
VIII. Policy design considerations
for cleaning PV panels and CSP mirrors due to the permanent dust and humidity. This could be solved in finding more sustainable technical solutions. Oil is used for heating in the 100 MW CSP plant in Abu Dhabi instead of water.
The main driver for shaping renewable energy policies and institutional framework in UAE is the Government. In the Abu Dhabi 2030 Vision, the Government realized that economic and population growth would result in increased energy and water demands. This means that more fossil-fuel resources will have to be diverted for local consumption instead of exporting them for income purposes. Another factor is the entrance of new players (competitors) in the global oil and gas market, especially with the exploration of shale gas. In addition, UAE has become a net importer of natural gas, which is the main source of fuel for the power sector for both electricity and water production. All these factors made the Government realize that innovative solutions are needed to make the economy less dependent on fossil fuel. Some of the solutions included the diversification of the economy, especially in Abu Dhabi, and finding new sustainable energy sources for the energy mix in the power sector. Of course, the abundance of solar resources in UAE was a critical factor. Because the public policy model in UAE is considered to be a top-down approach, the Government needs to take first step in shaping the renewable energy policy and the institutional framework.
Dubai with its Plan 2021 and Integrated Energy Strategy 2030, took similar initiatives but was mainly driven by finding a sustainable energy source for its power sector because oil and gas production in Dubai is nil and fuel is bought in the open market. UAE as a nation has developed its Vision 2021 which is in line with both the Abu Dhabi and Dubai visions. The country has played an important role in promoting renewable energy at the global level since 2008.
On 22 October 2015, UAE submitted its Intended Nationally Determined Contribution at the 21st session of the Conference of Parties (COP21) to UNFCCC, in Paris, France. The submission comprises
a portfolio of actions, including an increase of clean energy to 24% of the total energy mix by 2021. The actions that will be taken are: clean energy target, improvements in energy-intensive industries and the oil and gas sector, energy and water efficiency, transport and infrastructure and the waste sector. Adaptation actions with mitigation co-benefits include: water management; wetlands, coastal and marine environment conservation (blue carbon); food security; innovation and research and development; and education, training and public awareness. The document includes processes for monitoring, reporting and verification [32].
The implications for promoting renewable energy policies in UAE are very beneficial:
CO2 emission reduction;
Saving fossil fuel which can be used for export for income-generation purposes;
Building a new renewable energy sector which will have direct and indirect impacts on the economy and society;
Companies like Masdar are becoming important regional and global players in the renewable energy sector;
UAE taking a leading role in international climate change agreements;
Building the knowledge and expertise in the renewable energy sector in both public and private sectors;
Becoming the hub for the major players throughout the value chain of the renewable energy sector;
Hosting the largest international annual meeting, Abu Dhabi Sustainability Week;
Currently, there are 14 projects that have been registered as CDM programmes since 2009. Currently certified emission reductions (CERs) were issued for an equivalent of 617,974 tCO2 to the registered projects in UAE which include all the existing solar power plants[31].

39
IX. Barriers/challenges facing implementation of renewable energy projects and lessons learned
Since the announcement by the government of Abu Dhabi in 2009 of its 7% renewable energy target for 2020, only a few projects were implemented. The economic crisis in 2009 and the drop in oil prices slowed the momentum for investments. World Expo 2020 that will be held in Dubai has restored the momentum, but many challenges still exist that UAE needs to address in order to build a successful renewable energy sector.
9.1 Economics and financial challenges
9.2 Market challenges
9.3 Political, institutional/governance, regulatory and administrative challenges
The economic crisis in 2008 in UAE slowed down the renewable energy momentum that was created in 2006 with the Masdar Initiative;
The drop in oil prices imposed some restraints on fiscal budgets and income tax does not exist in UAE. This could limit the incentives and mechanisms to renewable energy policies;
High upfront cost and a long payback period for projects may discourage investors;
Additional cleaning cost for PV modules and CSP mirrors due to dust and humidity;
Power-sector subsidies for fossil fuel remain a barrier to adopting renewable energies;
When adopting RETs in the power sector, the true cost for utilities is not just the PPA with IPPs: additional costs will be accrued for additional grid connection, managing the smart grid for intermittencies, and operating and maintaining fossil-fuel backup plants. All these costs added together could make renewable energy less attractive than conventional power generation technologies.
A wholesale competitive market is lacking in UAE, even though transmission lines are connected between utilities. Renewable energy can play an important role in the wholesale market, especially during peak hours;
The renewable energy sector in UAE is mostly controlled by foreign companies through the value chain of the industry. Currently, most foreign companies have local partners but it is important to ensure that the knowledge is transferred to local companies. Current targets should allow the development of the solar manufacturing industry;
Commercial and bankruptcy laws in addition to strict immigration and residency laws hinder new investors from seeking business opportunities in UAE.
Expatriates form 80% of population in UAE are and they are considered to be transient. The housing sector is controlled by nationals. Therefore, they are no incentives for locals or expatriates to integrate renewable energy solutions in buildings or houses because of their long-term payback, especially in existing structures. In addition, expatriates pay higher tariffs for electricity and water than nationals;
No CO2 emission reduction targets have been set;
Income tax does not exist in UAE and this will limit the incentives and mechanisms that can be used for adopting renewable energy, especially for off- grid uses;
Dubai and Abu Dhabi have created the right institutions for renewable energy policies but the other five emirates, which are less resourceful than the former two, would need more attention

40 CASE STUDY ON POLICY REFORMS TO PROMOTE RENEWABLE ENERGY IN THE UNITED ARAB EMIRATES
9.4 Cultural, behavioural and educational challenges
9.5 Technical/technological challenges
from the federal Government to work with both FEWA and SEWA and create more opportunities, especially for off-grid uses;
There is no clear national vision or strategy for renewable energy for the whole country. The federal Government is only reacting to initiatives made by Abu Dhabi and Dubai. Federal Government intervention is limited by the decentralized decision-making process in the country;
Decision-making takes place at the government level without the coordination and the collaboration of the private sector, R&D institutions or NGOs;
There are no economic, social or environmental studies that highlight the direct and indirect negative impacts of fossil fuel in the power sector. This puts an additional burden on the national budget.
Baseload power concerns in intermittencies of solar power and high cost of storage, especially for thermal solar, will limit the solar capacity that can be added to the power-energy mix.
Solar power will result in additional grid connection lines and further management and control of the grid;
• Lack of awareness of the benefits of renewable energy and overestimation of the associated risks, especially for off-grid applications;
• Lack of awareness and programmes at all levels of the educational system throughout UAE on the challenges from climate change facing the country;
• Subsidies in electricity and water encourage consumers to waste precious resources.
During cloudy and rainy days, and at night, fossil-fuel power generation capacity will be needed to maintain a stable power supply. Operating and maintaining the additional capacity will put additional technical and financial burdens on utilities;
Accurate measures for DNI and GHI for UAE are needed. In the past, the DNI measures used for Shams 1 were not very accurate and had an adverse impact on the performance of the solar plant. DNI and GHI measurements also vary each year and can give different results;
The performance of existing solar power plants is not shared in public.
X. Conclusions and ways forward
It is evident that UAE has rebuilt its momentum in renewable energy, especially in the power sector. UAE can meet its renewable energy targets because of the new business model adopted by the utilities PPA-IPP, which will lift the financial burden of the government. The LCOE for solar PV is as low as 2.42 US cents/kWh, making it a viable technology.
Renewable energy readiness in UAE is measured by the readiness of its infrastructure, institutions and human capacity; the challenges mentioned previously could have serious impacts on the readiness of the country in renewable energy deployment.
The current power infrastructure in UAE is well built and up to date but is based on fossil-fuel technologies. More attention should be given to building smart grid systems to be able to integrate renewable power sources and manage power dispatch. The new systems should be well operated and maintained and equipped with high technical skills.
At the institutional levels, the governance structure of UAE gives each emirate autonomy in running its economic activities. The federal Government’s

41
national energy strategy is based on the integration of the energy strategy for each emirate. Abu Dhabi and Dubai have in place the right governmental institutions which include all the energy-related public-sector stakeholders. More attention needs to be paid to the five smaller emirates which should have active participation in the national strategy.
Annex 6 contains results of interviews carried out with four companies in the private sector that are heavily involved in the UAE renewable energy sector. The names of the companies will remain anonymous. All their answers are reflected in this case study.
Additional policy recommendations to mitigate the above-mentioned barriers include:
Economics and financial
The IPP-PPA business model will encourage the private sector, including financial institutions, to invest in renewable energy. This will reduce the financial burden on the government;
The Government of UAE can take advantage of its renewable energy policies to build up the industry in the entire value chain, especially in manufacturing, where it can oblige equipment providers to manufacture a percentage of their equipment used in projects locally. This will increase know-how and job opportunities in the country;
Commercial, bankruptcy, immigration and residency laws should be re-evaluated to encourage more entrepreneurial risk in startups and direct foreign investments in the renewable energy sector.
Market
More assurances are needed from utilities to guarantee buying the power offtake over the economic life of the installed renewable power systems;
Allowing active wholesale market in UAE and between GCC countries will encourage adoption of renewable energy;
Reducing or eliminating fossil-fuel subsidies in the power sector and calculating the true social, economic and environmental costs (tangibles and intangibles) for using such fuel make renewable energy more competitive.
Political, institutional/governance, regulatory and administrative
Future energy-related strategic decisions in each emirate should be made in collaboration and coordination with all governmental institutions, the private sector (renewable energy sector, financial institutions, etc.), R&D institutions and NGOs;
Although relevant policies and the institutional framework drive the adoption of renewable energy at the emirate level, only Abu Dhabi and Dubai have so far taken a proactive step in that regard. The other five emirates are left out. The federal Government should play an important role in creating synergy between Abu Dhabi and Dubai and the other five emirates to kick-start programmes and build on previous experience;
The federal Government, working with different emirates, should adopt innovative policies and mechanisms to encourage the adoption of RETs in off-grid uses, including rooftop solar PV. Solar rooftop and BIPV can be very successful during the six months of cool sunny weather (November–April). During the hot weather, the energy needed to cool villas and buildings represents at least 70% of the energy bill. The Dubai net metering model, which allows consumers to feed power to the grid, is a good mechanism and other emirates should follow suit but this should be well managed. Eliminating electricity and water subsidies, and unifying the bills for both expatriates and nationals with additional financial mechanisms from the savings generated from subsidies should encourage solar PV installations and reduce waste in existing structures. New regulations and incentives should be in place for new structures;
Renewable energy and clean energy targets should be complemented with CO2 emission reduction targets.

42 CASE STUDY ON POLICY REFORMS TO PROMOTE RENEWABLE ENERGY IN THE UNITED ARAB EMIRATES
Cultural, behavioural and educational challenges
More R&D funding which currently represents less than 1% of the UAE GDP. Funding should be at least 3% of GDP and should be directed to the development of the certain economic sectors, including renewable energy. Funding should be accompanied with the right institutions and mechanisms. Academic institutions at the national level should be engaged in R&D activities, which will eventually contribute to human capacity- building;
The true cost of solar PV to utilities, even with low LCOE, should be reflected in the consumers’ bill. This should be complemented with an awareness campaign.
Technical/technological
More accurate DNI and GHI measures are needed and over at least a 10-year period in order to give
investors a clear and accurate idea of the potential power generation capacity of solar plants;
Sharing the performance of existing solar power plants with government institutions and R&D institutions and renewable energy industry can improve policy decisions and finding technical solutions to some of the challenges of RETs;
UAE has wind-power potential and the Government should explore this opportunity further;
Policies should address the potential of renewable energy applications in desalination, which have the opportunity to decouple power and water, especially with the advancement of RO and membrane technologies.

43ESCWA
Annex A: Economic and Energy Data of UAE
Annex B: Solar PV Manufacturers and Summary of Employment Factor by Technology and Job
2000 2001 2002 2003 2004 2005 2006 2007 2008 2009 2010 2011 2012 2013
Population (Millions) 3.03 3.13 3.22 3.37 3.66 4.15 4.88 5.8 6.8 7.72 8.44 8.93 9.21 9.35
GDP (Billions 2005 USD) 139.12 141.07 144.5 157.21 172.25 180.6 198.39 204.7 211.2 200.2 203.4 213.4 223.4 235
Electricity Consumptions (TWh)
38.59 40.07 43.49 45.9 48.66 56.34 61.98 70.65 80.07 84.07 90.72 92.04 95.22 98.58
CO2 emissions (Mt of CO2) 85.52 85.87 96.21 101.11 106.17 108.7 114.94 124.2 143.9 147 151.8 158.7 170.5 167.6
CO2/ Population (t CO2/capita) 28.26 27.42 29.84 30.01 29.02 26.19 23.57 21.42 21.16 19.04 17.98 17.79 18.53 17.93
CO2/GDP (kg CO2/2005 USD) 0.61 0.61 0.67 0.64 0.62 0.6 0.58 0.61 0.68 0.73 0.75 0.74 0.76 0.71
Manufacturers name Product
Bhatia Brothers Photovoltaic systems, solar water heating systems, photovoltaic modules, solar lighting systems, solar power packs.
Hollandia Solar
Solar panels, photovoltaic, solar batteries maintenance free (GEL), solar charge controller, Inverters, DC lighting, Solar Street Lights, LED Lighting, Indoor and Outdoor Lighting, Solar Refrigerators, Solar Water Pumps, Solar Fans, Solar Air Conditioner, AGM batteries, LED lights, solar billboards, DC to AC inverters, Solar off grid, on-grid.
Al Yousuf Green TechPhotovoltaic systems residential, solar street lighting, photovoltaic systems commercial, portable power systems, solar water pumping system components, solar water heating systems, DEWA approved, Roof top Solar Solution Providers.
JNC Solar
Solar (panels air conditioner water pumps fans), Batteries (Lead acid, GEL, AGM, VRLA), LED Lights (indoor- outdoor), Solar photovoltaic systems, photovoltaic modules monocrystalline silicon, DC to AC power inverters, solar charge controllers, solar street lighting, Solar PV Mobile light towers for Construction Sites and remote areas.
E-SOLAR MIDDLE EAST Photovoltaic modules, solar systems, backup power systems, solar water pumps, solar batteries, charge controllers, solar refrigeration, DC-AC inverters.
Elsy Industrial SystemsPhotovoltaic systems, solar water heating systems, batteries VRLA, battery chargers, uninterruptible power supplies UPS, DC to AC power inverters sine wave, UPS, Battery Charger, Frequency Converter, AVR.
Eurostar Solar EnergySolar traffic lighting systems, photovoltaic modules, solar water heating systems, solar street lighting, solar lighting systems, backup power systems, solar water pumping, solar obstruction lights, solar home lighting kits, solar green building solutions, Solar On grid systems.
Green Crystals Solar & Energy Solutions
LED lighting, photovoltaic cells, solar traffic lighting systems, solar street lighting, portable power systems, photovoltaic systems commercial, Designer Custom Solar Streetlighting, Power Backup Solutions, Mounting Hardware, On/Off-grid power.
Microsol InternationalPhotovoltaic cells monocrystalline silicon, photovoltaic cells polycrystalline silicon, photovoltaic modules monocrystalline silicon, photovoltaic cells polycrystalline silicon, solar water heating systems, solar street lighting.
Midland Trading LLCSolar thermal energy, solar air heating system components, solar collectors flat plate, solar water heating components collectors flat plate, solar water heating components storage tanks, solar water heating systems, Solar air-conditioning systems.
Annex B.1: Solar PV manufacturers in UAE
Source: FCSA, September 2016.

44 CASE STUDY ON POLICY REFORMS TO PROMOTE RENEWABLE ENERGY IN THE UNITED ARAB EMIRATESGuidebook for Project Developers for Preparing Renewable Energy Investments Business Plans
Source: http://energy.sourceguides.com/businesses/byGeo/byC/UAE/byP/solar/byB/manufacturers/manufacturers.shtml.
Tergeo InternationalPhotovoltaic Modules, LED Lighting (Indoor, Outdoor), Batteries (Lead acid, AGM, GEL, VRLA )Solar Inverters, Solar Air Cooling Systems, Solar Charge Controllers, Solar Lanterns, Solar Lighting Kits, Solar Refrigerators/Freezers.
Vista Eco SolutionsSolar water heating and solar pool heating systems, solar photovoltaic energy systems for residential & commercial, building integrated PV (BIPV), solar street lighting & LED, solar thermal water desalination and wind turbine energy systems.
WAROM Electric Middle East (SolarIn)
Photovoltaic cells monocrystalline silicon, solar charge controllers, solar lighting systems, solar thermal electric power systems, Solar power systems.
Alternate Energy Solution Providers
Solar electric power systems, LED lighting, DC lighting, DC powered appliances, water pumps, backup power systems, Solar Cieling Fans, Solar Sewing Machine Systems, Solar Cooling System.
Binseddiq InternationalSolar thermal electric power systems, solar street lighting, solar roofing systems, solar tracking systems, solar lighting systems, solar air heating system components, aviation, marine, oil, gas, environmental, instrumental, industrial, safety products, systems, services.
Specialised & Interactive Systems LLC
Photovoltaic systems, DC to AC power inverters, photovoltaic modules, solar charge controllers, solar water pumping systems, solar water heating systems, Power Backup Systems, DC-DC Converters, DC Lighting, Solar Garden Lights, Solar Outdoor Lighting, AC & DC Refrigerators & Freezers, Batteries, Cathodic Protection Systems, Portable Power Systems, Remote Home Power Systems, Aviation Obstruction Lighting, Intelligent Traffic Systems, Custom Designed Systems.
Annex B.2: Summary of Employment factor by Technology and Job
TECHNOLOGY JOB EMPLOYER FACTOR RELEVANCY COUNTRY
Solar PV
- Manufacturing, construction, Installation
- O&M
5.76 – 6.21 jobs/MWp
1.2 – 4.8 jobs/MWp
Not specified
Not specified
Not specified
- PV module manufacturing3-7 jobs/MWp
12-20 jobs/MWp
Direct
IndirectEU
- PV panel production
- Wholesale, retail, installation & maintenance
- Installation
- O&M
10 jobs/MWp
36 jobs/MWp
346 jobs/MWp
2.7 jobs/MWp
Direct
Direct
Direct
Direct
Turkey
- Construction
- Operation
17.2 man-years/MW
9.4 man-years/MW
7.2 man-years/MW
4.1 man-years/MW
1.6 man-years/MW
2.7 man-years/MW
Direct
Indirect
Induced
Direct
Indirect
Induced
Greece
- Project Construction 33–39 job-years/MWp Direct & indirect US

45
CSAP
- Manufacturing
- Contracting and installation jobs
- O&M
4 jobs/MWp
6 jobs/MWp
0.3 jobs/MWp
Direct
Direct
Direct
Turkey
- Design, manufacturing of components and construction
10 jobs /year/MW Direct Global average
- Construction
- Operation
4.55 job-years/MW
35 job-years/MW
0.38 job-years/MW
0.56 job-years/MW
Direct
Indirect
Direct
Indirect
US
Wind
- Manufacturing, construction and Installation
- O&M
0.43 – 2.51 jobs/MWp
0.27 JOBS/MWP
Not specified
Not specified
Not specified
- Construction
- Operation
8.8 man-years/MW
4.8 man-years/MW
3.6 man-years/MW
7.5 man-years/MW
3.4 man-years/MW
4.1 man-years/MW
Direct
Indirect
Induced
Direct
Indirect
Induced
Greece
- Project Construction 10–15 job-years/MWp Direct & indirect US
- Manufacturing, component supply, wind farm development, construction, transportation etc.
- O&M
14 PYE/MWp
0.33 PYE/MWp
Not specified
Not specified
Global average

46 CASE STUDY ON POLICY REFORMS TO PROMOTE RENEWABLE ENERGY IN THE UNITED ARAB EMIRATES
Source: Sooriyaarachchi, T.H., Tsai, I., El Khatib, S., Farid, A., and Mezher, T. Job Creation Potentials and Skill Requirements in, PV, CSP, Wind, Water-to-Energy and Energy Efficiency Value Chains Renewable and Sustainable Energy Reviews, Vol. 52, pp. 653-668, December 2015.
Waste to Energy
- Waste collection and transfer in the Connecticut State
- Operation of 6 plants
4,000 jobs
2,691 jobs
3,257 jobs
381 jobs
209 jobs
349 jobs
Direct
Indirect
Induced
Direct
Indirect
Induced
US
- Operation of 4 plants
228 jobs
160 jobs
209 jobs
Direct
Indirect
Induced
US
- Construction
- Operation
615 FTE jobs
1,063 jobs
51 jobs
34 jobs
Direct
Indirect
Direct
Indirect
US
- Construction- Operation
750 FTE jobs 1,875 FTE jobs 115 jobs
Direct Indirect Direct & indirect
US
- Operation 150 jobs Direct SOUTH AFRICA
Annex C: Electricity Tariffs and selected Fuel products prices in UAE
Annex C.1: Electricity Tariffs in Dubai
Consumption/ month Slab tariff
Residential/ Commercial
0-2000 kWh 23 fils / kWh
2001-4000 kWh 28 fils / kWh
4001-6000 kWh 32 fils / kWh
6001 kWh & Above 38 fils / kWh
Industrial 0-10000 kWh 23 fils / kWh
10001 kWh & Above 38 fils / kWh
Fuel Surcharge based on Oil prices 6.5 fils / kWh in August 2016
Source: https://www.dewa.gov.ae/en/customer/services/consumption-services/tariff

47
Annex C.2: Electricity Tariffs in Abu Dhabi
Annex C.3: List of Petrol Prices (AED) for 2016
Fils/KWh Daily Consumption KWh/day
Residential
NATIONAL
FLAT5 UP TO 30
5.5 OVER 30
VILLA5 UP TO 400
5.5 OVER 400
Expat
FLAT21 UP TO 20
Regulated OVER 20
Villa21 Up to 400
Regulated Over 400
Government Cost reflective tariff*
Commercial 16
Agriculture including Ranches 3
Industry 16
Source: http://www.addc.ae/en/Tariff%20tables%20English.PDF
Unleaded 98 Unleaded 98 Unleaded 98 Diesel
January 1.69 1.58 1.51 1.61
February 1.58 1.47 1.4 1.37
March 1.47 1.36 1.29 1.4
April 1.62 1.51 1.44 1.56
May 1.78 1.67 1.6 1.6
June 1.86 1.75 1.68 1.77
July 1.88 1.77 1.7 1.85
August 1.73 1.62 1.55 1.76

48 CASE STUDY ON POLICY REFORMS TO PROMOTE RENEWABLE ENERGY IN THE UNITED ARAB EMIRATES
Annex D: UAE Public Institutions Related to the Energy Sector
Institution Role (Mission) DECREE
Ministry of Energy1
Organizing and developing general policies and legislations under the consultation of the stakeholders involved to fit the energy sector as per the international standards and following up its implementation; also representing the Country`s interests concerned with energy, water and mineral resources and drafting any related specialized studies.
Abu Dhabi Water and Electricity Authority (ADWEA)2
The Authority is held responsible to execute governmental policy related to Water & Electricity sector in the emirate including privatization of the sector.
ADWEA has been incorporated in March 1998 by virtue of Amiri Decree No. 2/1998 to replace dissolved Abu Dhabi Water & Electricity Department.
Dubai Electricity and Water Authority (DEWA)3
We are committed to the happiness of our stakeholders and promoting Dubai’s vision through the delivery of sustainable electricity and water services at a world-class level of reliability, efficiency and safety in an environment that nurtures innovation with a competent workforce and effective partnerships; supporting resources sustainability.
The Dubai Electricity and Water Authority (DEWA) was formed on 1 January, 1992, by a decree issued by His Highness Sheikh Maktoum bin Rashid Al Maktoum to take over and merge the Dubai Electric Company and the Dubai Water Department that had been operating independently for several years until then
Federal Electricity & Water Authority (FEWA)4
Its Main objective is to cater the needs of Electricity and potable Water for the population of the Northern Emirates.
Federal Law No. 31 for 99 for establishing Federal Electricity & Water Authority to undertake Ministry of Electricity & Water activities of producing and distributing Water and Electricity in the Northern Emirates.
Sharjah Electricity & Water Authority (SEWA)5
To distribute and generate electricity, water and gas to the nationals and residents of the emirate.
His Highness Sheikh Dr. Sultan Bin Mohammed Al-Qassimi, Member of Supreme Council and Ruler of Sharjah issued Decree No. 39/2014 on establishment of Sharjah Electricity and Water Authority (SEWA) as financially and administratively independent entity.
Regulation & Supervision Bureau (RSB) Abu Dhabi6
RSB is considered the independent regulator of the water, wastewater and electricity sector in the Emirate of Abu Dhabi. It has exclusive authority to regulate all companies undertaking activities associated with electricity and water production, transmission, distribution and supply. In addition, the Bureau also regulates the wastewater sector which is responsible for ensuring the safe collection, treatment and disposal of wastewater products.
The Regulation and Supervision Bureau (The Bureau) was established under Law No. (2) of the year 1998.
Regulation & Supervision Bureau (RSB) Dubai7
RSB supports Dubai’s economic, social and environmental objectives through development of an effective, independent and transparent regulatory regime.The RSB works under the auspices of the Dubai Supreme Council of Energy, developing regulatory frameworks to support Dubai’s economic growth through secure energy supply & efficient energy use while meeting environmental and sustainability objectives.
The RSB was established by Dubai Executive Council Resolution Number 2 of 2010.

49
Dubai Supreme Council of Energy (DSCE)8
The new Governing body seeks to ensure that the Emirate's growing economy will have sustainable energy while preserving the environment. The Authority is developing alternative and renewable energy sources for the Emirate, while increasing energy efficiency to reduce demand.
The Dubai Supreme Council of Energy (DSCE) was formed in August 2009 under Law 19 of 2009, issued by His Highness Sheikh Mohammed bin Rashid Al Maktoum, Vice President and Prime Minister of the UAE, and Ruler of Dubai.
Abu Dhabi Energy Authority (ADEA)9
Energy strategic policy making and regulations. (Please note the Energy Authority is still under development)
The President and Ruler of Abu Dhabi issued an Emiri decree on March 15, 2016 the restructuring of the Abu Dhabi Executive Council and establishing the Energy Authority.
1 https://www.moenr.gov.ae/2 http://www.adwea.ae/en/ 3 https://www.dewa.gov.ae/en/about-dewa/about-us/about-us/our-history 4 http://www.fewa.gov.ae/en/AboutFEWA/Pages/AboutUs.aspx5 https://www.sewa.gov.ae/en
Annex E: Electricity generated and associated Reductions of CO2 Emissions by technology
Annex E.1: Electricity Generated from different Technology (KWh/year)
Annex E.2: CO2 Emission reductions (tons CO2e/KWh) from each technology
Technology 2016 2020 2025 2030
Gas 185,138,215,965 235,501,751,485 289,289,543,558 355,362,282,804
PV utility 44,325,600 4,818,000,000 8,672,400,000 12,526,800,000
PV Rooftop - 876,000,000 876,000,000 876,000,000
CSP 192,720,000 192,720,000 192,720,000 192,720,000
WTE - 1,366,560,000 1,366,560,000 1,366,560,000
Nuclear - 39,244,800,000 39,244,800,000 39,244,800,000
Clean Coal - 3,048,480,000 12,193,920,000 12,193,920,000
Technology 2016 2020 2025 2030
PV (Utility) 18,217,822 1,980,198,000 3,564,356,400 5,148,514,800
PV( Rooftop) 360,036,000 360,036,000 360,036,000
CSP 83,062,320 83,062,320 83,062,320 83,062,320
WTE 2,925,000 2,925,000 2,925,000
Nuclear 14,795,289,600 14,795,289,600 14,795,289,600
Coal + CCS 1,576,064,160 6,304,256,640 6,304,256,640
Other CCS Projects
800,000 2,800,000 2,800,000 2,800,000
Total 102,080,142 18,800,375,080 25,112,725,960 26,696,884,360
6 http://rsb.gov.ae7 http://www.rsbdubai.gov.ae/about-us/ 8 http://www.dubaisce.gov.ae/default.aspx 9 https://www.abudhabi.ae/
Source: http://www.ramboll.com/projects/re/waste-to-energy-facility-in-abu-dhabi b. Reference (abu zahra, 2015).

50 CASE STUDY ON POLICY REFORMS TO PROMOTE RENEWABLE ENERGY IN THE UNITED ARAB EMIRATES
Annex F: Interview of RE companies operating in UAE
Company 1
Company 2
1. What do you think is the role of the private sector in general and Company 1 in particular in the development of RE and EE sector in UAE?
The case of the UAE is a clear case of a strong government-driven demand for all that has to do with green growth. Top-down approach. The market is in its infancy (although a bit more advanced that other GCC countries) therefore no (or very scattered) private sector demand for these matters. In the few cases that there is a demand from the private sector, it is international companies applying environmental commitments to all regions across the world. The role of the ESCO companies/ Energy consultancies is to:
closely collaborate with the government (PPP) to develop the market from scratch
support with awareness raising
For Company 1, to develop a knowledge transfer strategy from Europe to Spain and create local teams that can take care of the EE market in the ME
2. From private sector point of view, are the current RE and EE policies in UAE enough to attract RE and EE projects and investments? Do you think that more is needed?
I am not aware of the whole RE story but in the case of EE, investment comes mainly from the public sector (be it in new buildings or for retrofitting existing buildings). However, it is too slow to bring more investment and commitment from gov. entities who are obliged to undertake energy audits.
3. What do you think are the drivers and barriers to the development RE and EE projects and investments in UAE?
I think it is more or less mentioned above:
Drivers: Government objectives, current building stock very inefficient, knowledgeable companies
Barriers: electricity price, slow (1 tender may take 6 months), lack of awareness
1. What do you think is the role of the private sector in general in the development of RE sector in UAE?
The private sector handles the full execution scope for utility scale and distributed solar sectors in UAE. This includes the full value chain from project development, EPC, O&M and project finance. The private sector can accelerate the deployment of solar targets in UAE and provide diversification to the local economy
2. From private sector point of view, are the current RE policies in UAE enough to attract RE projects and investments? Do you think that more is needed?
More is needed on the commercial and industrial solar installation side, this includes more clarity and refinement of existing regulations and closing gaps on missing regulations etc. utility scale projects are administered through competitive bidding which is working well so far for DEWA, ADWEA and soon FEWA
3. What do you think are the drivers and barriers to the development RE projects and investments in UAE?
Finance mechanisms for distributed solar, clarity on regulations and processes for permitting and installations. Debt financing for utility scale PV plants in terms of availability and providing competitive terms

51
Company 3
Company 4
1. What do you think is the role of the private sector in general and Masdar in particular in the development of RE sector in UAE?
Company 3 played an important role in promoting renewable energy in UAE and the region in general. Back 2008 Company 3 introduced the biggest PV plant in the MENA region (Masdar City 10MW) and in the year 2010 construction started for the largest CSP plant in the world. Both experiences were successful and paved the road for further developments in the region such as; Sheikh Mohamed Bin Rashed Solar Park phase 1, 2 &3 and Abu Dhabi 350MW PV (tendering stage). Private sector can actively participate for the advisory, bidding, financing, construction, supply for the utility scale renewable energy projects. In Dubai, companies can participate also the roof top program (Shams Dubai).
2. From private sector point of view, are the current RE policies in UAE enough to attract RE projects and investments? Do you think that more is needed?
The current policies are enough to attract developers/contractors for the large scale projects however, other potential policies such as FIT, net metering..etc are required to attract the smaller players
3. What do you think are the drivers and barriers to the development RE projects and investments in UAE?
I don’t see are real barriers, system are working properly for large scale projects. However, I think elimination of subsidy will encourage private sector and customers to consider the RE option.
1. What do you think is the role of the private sector in general in the development of RE sector in UAE?
The private sector had a leading role in the development of the RE sector in the UAE as projects were funded through public private partnerships (PPP), where private companies front
the investment in return for a stake in the project and a steady return from selling the electricity produced
The private sector can bring a host of technology solutions and global expertise. Technology solutions that are suited to the climate needs, particularly the hot and harsh climate that characterizes this part of the region.
The dialogue between the private and the public sector is also key in advancing RE applications because that opens up potential opportunities and creates a window for collaborative and creative thinking to address the UAE’s needs for RE. That dialogue will help build awareness on the latest in this field and will help the private sector guide the UAE in what is needed to create a more conducive environment for the development of RE.
The private sector should also continue to be creative in bringing to the table a host of ideas that would help bring down the cost of RE. Not only through technology development but also through creative business models and financing mechanisms. For example working closely with the end user to understand PPA terms, financial model, pricing mechanisms….that will help understand where & when one can optimize the overall system. Also looking at ways to optimized supply chain and overall system efficiency that looks beyond only product by product efficiencies but broadens the view to the whole optimization of the system is beneficial. That holistic approach will require closer engagement with the end user. The private sector also plays a role in developing the local talent required to grow the RE sector whether through training, workshops, joint R&D. In some instances, localizing can also help in improving supply chain, building local talent and expertise and boosting the role of the sector.
2. From private sector point of view, are the current RE policies in UAE enough to attract RE projects and investments? Do you think that more is needed?
Currently there is no UAE federal PPP Law in place defining long term PPP concessions with the private sector. This can help give security to the investor. Each UAE federal body is developing

52 CASE STUDY ON POLICY REFORMS TO PROMOTE RENEWABLE ENERGY IN THE UNITED ARAB EMIRATES
it is own procurement methodology and contractual templates.
Encourage the ISCC (Integrated Solar Combined Cycle) schemes such as the hybrid approach to existing OCPP and CSP(Concentrated Solar Power) technologies to reduce the cost. More efforts can be put into introducing solar into existing installed base, this would require a study of existing PPA terms and discussions on a cost-benefit analysis with existing developers to understand how combining solar could create wins in saving fuel, reducing emissions, and reducing costs. Even cost of desalinating water may go down if a new approach could be introduced where solar is brought into winter period when gas is burned primarily to secure water and not electricity
Encourage building Waste-to-energy on a small municipal scale in each Emirate
The RE policies in the UAE has attracted various mix of some of the world’s largest international solar and renewable energy developers as could be seen in the third phase of the DEWA 800MW Solar PV and ADWEA Sweihan 350MW tenders. More of these flag ship projects is needed.
More can also be done in the small scale distributed solar applications. Where home owners can generate their own power and export to the grid. That would help drive the growth of the sector.
3. What do you think are the drivers and barriers to the development RE projects and investments in UAE?
Drivers : Safe country and stable government for investment. Clear vision on where RE is heading. High sun intensity & long sun hours conducive for solar energy
Barriers : So far PV has been the most successful technology, but storage remains a gap. Storage cost is high. Solar PV occupies large land area & additional labor may be required for maintenance due to sandy and dusty climate.
High humidity & hot climate impacts the overall system durability.
Not suitable for Wind & Hydro. But more investigation can be done for geothermal & tidal and maybe other forms of RE.
One of the major barriers to the development of RE projects in the UAE is the falsely perceived cost-competitiveness of subsidized fossil fuel and the outdated perception of “cheap gas” compared to renewable energy and namely Solar PV. Solar PV competitiveness has been recognized through the DEWA 800MW solar PV project where Masdar signed a 25 years PPA with DEWA at $2.99c/kWh, this not only marks the lowest cost ever for solar power, but also easily beats all available fossil-fuel options in Dubai on cost. Hassyan coal power station has been awarded at a much higher tariff of $4.5c/kWh. Gas-fired power plants in Dubai have an even higher generation cost.

53
[1]. UAE Ministry of Energy (2012): UAE 3rd National Communication Report. https://www.moenr.gov.ae/en/knowledge-center/reports.aspx. Accessed 3 August 2016.
[2]. FCSA (Federal Competitiveness and Statistics Authority), Population Estimates 2006–2010. http://fcsa.gov.ae/en-us/Lists/D_StatisticsSubject/Attachments/68/Population%20Estimates%20 2006%20-%202010.pdf. Accessed 14 September 2016.
[3]. IEA (International Energy Agency), Economic and Energy Data of UAE. http://www.iea.org/statistics/ statisticssearch/report/?&country=UAE&product=Indicators. Accessed 3 August 2016.
[4]. BP (British Petroleum), BP Statistical Review of World Energy June 2016. http://www.bp.com/content/ dam/bp/pdf/energy-economics/statistical-review-2016/bp-statistical-review-of-world-energy-2016-full- report.pdf. Accessed 15 September 2016.
[5]. UAE Ministry of Energy Statistical Data for Electricity and Water 2008–2012. https://www.moenr.gov.ae/ en/knowledge-center/reports.aspx. Accessed 3 August 2016.
[6]. UAE Ministry of Energy Statistical Data for Electricity and Water 2013–2014. https://www.moenr.gov.ae/ en/knowledge-center/reports.aspx. Accessed 3 August 2016.
[7]. ADWEC (Abu Dhabi Water and Electricity Company) (2016): Statistical Report 1998–2014. http://www.adwec.ae/Documents/Report/2014/2014%20Statistical%20Report.pdf. Accessed 15 August 2016.
[8]. IRENA (International Renewable Energy Agency) (2016): Renewable Energy Market Analysis: The GCC Region. http://www.irena.org/DocumentDownloads/Publications/IRENA_Market_GCC_2016.pdf. Accessed 1 August 2016.
[9]. ENEC (Emirates Nuclear Energy Corporation) (2016): UAE Nuclear Power Program, https://www.enec.gov.ae/news/uae-peaceful-nuclear-energy-program-one-of-the-most-diverse- multinational-and-multicultural-nuclear-programs/. Accessed 10 August 2016.
[10]. Ventures onsite (2016): Dewa awards major EPC contract for 2,400 MW Hassyan Clean Coal project. https://www.venturesonsite.com/news/dewa-awards-major-epc-contract-for-2400-mw-hassyan-clean- coal-project/. Accessed 10 August 2016.
[11]. Contraction Week Online.com (2016): Dewa signs PPA and SHA for Hassyan power plant. http://www.constructionweekonline.com/article-39463-dewa-signs-ppa-and-sha-for-hassyan-power- plant/. Accessed 10 August 2016.
[12]. Alstom (2015): Alstom selected as preferred bidder for DEWA’s Hassyan clean coal power plant project in Dubai. http://www.alstom.com/press-centre/2015/10/the-first-ultra-supercritical-power-plant-in-the- middle-east/. Accessed 11 August 2016.
[13]. IRENA (2015): REmap 2030, A Renewable Energy Roadmap: Renewable Energy Prospect: United Arab Emirates. http://www.irena.org/-/media/Files/IRENA/Agency/Publication/2015/IRENA_REmap_UAE_ report_2015.pdf. Accessed 1 August 2016.
[14]. Enerdata (2016): Global Enengy Statistical Yearbook 2016: UAE. https://yearbook.enerdata.net/energy- intensity-GDP-by-region.html. Accessed 12 August 2016.
[15]. Mezher, T., H. Fath, Z. Abbas and A. Khaled (2011): Techno-economic Assessment and Environmental Impacts of Desalination Technologies, Desalination, 266: 1-3, 263–273.
[16]. Abu Zahra (2015). Separation Processes for CO2 Capture Applications, Lecture 2. Masdar Institute, Abu Dhabi, UAE.
[17]. ReCREMA (2013). The UAE Solar Atlas. Research Center for Renewable Energy Mapping and Assessment, Masdar Institute, April 2013, Abu Dhabi, UAE.
Bibliography
54 CASE STUDY ON POLICY REFORMS TO PROMOTE RENEWABLE ENERGY IN THE UNITED ARAB EMIRATES
[18]. Ouarda, T.B.M.J., C. Charron, J.Y. Shin, P.R. Marpu, A.H. Al-Mandoos, M.H. Al-Tamimi, H. Ghedira and T.N. Al Hosary (2015): Probability distributions of wind speed in the UAE. Energ. Convers. Manage., 93 (March), 414-434. DOI : 10.1016/j.enconman.2015.01.036.
[19]. SCAD (Statistics Centre Abu Dhabi) (2016): Waste Statistics in Abu Dhabi 2015. https://www.scad.ae/en/ Pages/ThemeReleaseDetail.aspx?ReleaseID=780&ThemeID=7. Accessed 8 August 2016.
[20]. Government of Dubai (2015): Request for Prequalification Project No. GS 002, Engineering, Procurement and Construction related to Waste to Energy Project. https://login.dm.gov.ae/wps/wcm/connect/5d20efeb-eb41- 4150-8651-0692dca55ace/Waste+to+Energy+Project+Pre-Qualification+Request.pdf?MOD=AJPERES. Accessed 8 August 2016).
[21]. Bee’ah (2016): Working towards Zero Waste. http://beeah.ae/. Accessed 8 August 2016.
[22]. TAQA (Abu Dhabi National Energy Company) (2012), TAQA and CWM Abu Dhabi to Develop Waste to Energy Plant, 20 June 2012. https://www.taqaglobal.com/media/media-releases/taqa-and-cwm-abu-dhabi-develop- waste-energy-plant. Accessed 8 August 2016.
[23]. Government of Dubai (2015): The Waste to Energy Project. https://login.dm.gov.ae/wps/wcm/ connect/5d20efeb-eb41-4150-8651-0692dca55ace/Waste+to+Energy+Project+Pre-Qualification+Request. pdf?MOD=AJPERES. Accessed 9 August 2016.
[24]. Bee’ah (2016): Waste to Energy. http://beeah.ae/re-newable-energy/. Accessed 9 August 2016.
[25]. Masdar (2016): Masdar Special Projects: Renewable Energy Desalination Pilot Programme. http://www. masdar.ae/en/energy/detail/renewable-energy-water-desalination-in-uae. Accessed 15 August 2016.
[26]. Masdar (2016): Masdar Special Projects: Other Projects. http://masdar.ae/en/energy/detail/other-projects. Accessed 15 August 2016.
[27]. Mezher, T., D. Goldsmith and N. Choucri (2011): Renewable Energy in Abu Dhabi: Opportunities and Challenges, ASCE Journal of Energy Engineering, 137:4, 169-176.
[28]. EIA (US Energy Information Administration) (2016): Capacity Factors for Utility Scale Generators Primarily Using Fossil Fuels, January 2013–May 2016. https://www.eia.gov/electricity/monthly/epm_table_grapher. cfm?t=epmt_6_07_a. (Accessed 14 August 2016).
[29]. Sovacool, B.K. (2008): Valuing the greenhouse gas emissions from nuclear power: A critical survey, Energy Policy, 36, 2940–2953.
[30]. DEWA: DEWA’s Shams Dubai initiative continues renewable energy use projects. https://www.dewa.gov. ae/en/about-dewa/news-and-media/press-and-news/latest-news/2016/03/dewas-shams-dubai-initiative- continues_march7. Accessed 21 August 2016.
[31]. MOE, DCCE and UNDP (2016): UAE State of the Energy Report 2016, Ministry of Energy in partnership with UNDP and Dubai Carbon. http://dcce.ae/state-of-energy-report-2016/. Accessed 1 August 2016.
[32]. UNFCCC (2015): Submission by the United Arab Emirates: Intended Nationally Determined Contribution of the United Arab Emirates, 22 October 2015. http://www4.unfccc.int/submissions/INDC/Published%20 Documents/United%20Arab%20Emirates/1/UAE%20INDC%20-%2022%20October.pdf. Accessed 21 August 2016).
[33]. (https://www.moenr.gov.ae/en/knowledge-center/reports.aspx) retreived July 31, 2016
[34]. http://www.ramboll.com/projects/re/waste-to-energy-facility-in-abu-dhabi b. Reference (abu zahra, 2015)
[35]. (https://www.moenr.gov.ae/en/knowledge-center/reports.aspx) retreived July 31, 2016)

17-0
0731