casey family programs kinship caregiver navigator … family programs kinship caregiver navigator...
TRANSCRIPT

Casey Family Programs Kinship Caregiver Navigator Pilot
Final Pilot Evaluation Report (July 1, 2004 through November 30, 2005)
December 2005
Prepared for Casey Family Programs
6549 1st Avenue NW Seattle, WA 98117
206.612.8564

Table of Contents and Acknowledgments TriWest Group Kinship Navigator Final Evaluation Report
Table of Contents Executive Summary ....................................................................................................... i Introduction and Methods ............................................................................................ 1 Description of Services Provided and Caregivers Served ........................................ 5 Baseline and Three-Month Caregiver Needs ............................................................ 21 Exploration of Program Costs and Benefits ............................................................. 28 Conclusions and Recommendations ........................................................................ 30 APPENDIX................................................... March 2005 Final Pilot Evaluation Report

Table of Contents and Acknowledgments TriWest Group Kinship Navigator Final Evaluation Report
Acknowledgments TriWest Group would like to acknowledge the dedication and involvement of the many people who made this pilot and study possible. This includes input and direction from the leaders and members of the Washington State Kinship Oversight Committee, particularly the thoughtful guidance of Hilari Hauptman, Barbara Bofinger, and Tom Berry. The leadership of Casey Family Program staff was integral to both the development of the Navigator Program, its successful continuation throughout the pilot period, and the conduct of the evaluation. In particular, Washington State Strategy Director Ron Murphy, Seattle Field Office Site Director Lyman Legters, and Yakima Field Office Site Director Lynn Biggs gave much time, assistance, and timely advice to program and evaluation staff alike. Project supervisors Dana Boales (Seattle) and Grace Smith (Yakima) gave many hours of extra effort to move the implementation and study from concept to reality and have our thanks. Finally, the wise counsel of Peter Pecora regarding the design and execution of the evaluation and the delightfully timely and reliable responsiveness of Catherine Roller White through the IRB process (and many updates) was invaluable. Of course, none of this would have been possible without the Navigators. In particular, the two Casey Navigators – Dotty Simpson in Yakima and Helen Sawyer in Seattle – gave much of themselves to develop the program and support the evaluation. Dotty in particular invested much of her time and heart to make this project a success. Thank you both for teaching us all so much. At the two new Navigator sites – Catholic Family and Child Services of Yakima and Senior Services of Seattle-King County – both site directors (Darlene Darnell and Terra McCaffree) and the new Navigators (Mary Pleger, Terry Aguilera-Flemming, and Greg Townsend) were gracious and flexible as they quickly implemented both a new program and new evaluation. Finally, we thank the many caregivers who shared with us their all-too-limited time and inspiring stories for the purposes of this report. We thank them for adding us to the long list of people they have given to and helped.

Page i TriWest Group Kinship Navigator Six-Month Pilot Evaluation Report
Executive Summary Casey Family Programs implemented the Kinship Navigator project in July 2004, in collaboration with the Washington State Kinship Oversight Committee. The project responds to a mandate from the 2003 Kinship Care Bill (SHB-1233), passed in the Washington State Legislature. Two contract positions were created initially, one at the Casey field office in Yakima (DSHS Region 2) and one at the Casey field office in Seattle (DSHS Region 4). In July 2005, two additional Kinship Navigator positions were approved through the Washington State Legislature, with funding provided to the Department of Social and Health Services Aging and Disability Services Administration. These funds were then allocated to two local Area Agencies on Aging – Aging and Disability Services-Seattle King County and Southeast Washington Aging and Long Term Care – who contracted with two local organizations to deliver additional Navigator supports: Senior Services of Seattle-King County and Catholic Family and Child Services of Yakima This Final Pilot Evaluation Report focuses on sixteen months of pilot operations for the two Casey sites and 1-3 months of operations for the AAA sites. In that time, 637 total kinship caregivers received either information or navigator services. Of those, 443 adults (305 in Yakima and 138 in Seattle) caring for 1148 children (767 of whom were children of kin) received documented navigator services. The evaluation focused on these caregivers and the subset of 150 who provided additional information on their family needs. An additional 194 caregivers received brief informational services over the telephone. The evaluation examined differences in data from each of the four agencies serving kinship caregivers (data are available in the body of the report from each individual site.) While there were consistent regional differences between Seattle and Yakima, there were minimal differences between the caregivers and children served by the Casey sites and AAA sites. The evaluation results are clearly positive. The initial sixteen month finding of program effectiveness was as robust as was possible given the evaluation methods. The positive results documented in the first six months of the pilots were sustained over the entire 16-month period for the Casey sites, and the positive results demonstrated in the Casey sites were replicated in the first one to three months of operations at the AAA sites. This study’s comprehensive review of services and associated outcomes yielded three policy recommendations: (1) Sustain the existing program capacity, (2) Increase the scope of the program across time and more sites in order to make its clearly documented benefits more widely available, as well as to facilitate more definitive evaluation of its effects and sustainability; and (3) as the program is sustained create opportunities to extend this research by creating an evaluation that has a benefit-cost component so that the economic impact of this program can be more fully documented. Description of Services Provided and Caregivers Served The program served 443 families who were caring for 767 children of kin. An additional 196 caregivers received informational support through the program. Caregiver services totaled 1,026 hours across 2,056 encounters, all targeting the areas of need originally envisioned and further validated as needed through the baseline quantitative assessments of family needs.

Page ii TriWest Group Kinship Navigator Six-Month Pilot Evaluation Report
Services were provided to a diverse array of caregivers and their children, generally reflecting community demographics and priority target groups:
Average age was just under 50 years (49.2); ages ranged from 21 to 86 years. Caregivers in Seattle tended to be older than caregivers in Yakima.
Just under 93% were female (427); only 33 male caregivers were served. 44% (200) were non-Hispanic White, 26% (119) were African American, 17% (75) were
Hispanic, 11% (51) were American Indian / Alaskan Native, 1% (6) identified as being multiracial, < 1% were Asian American (2).
Racial/ethnic distribution varied significantly by region. In Seattle, 67% (101) of those served were African American; in Yakima, 56% were non-Hispanic White (164), 23% were Hispanic (68), and 16% were American Indian / Alaskan Native (47).
94% of caregivers across all four sites (425) spoke English; 6% (28) spoke Spanish. In the Seattle region, 134 caregivers reported a total of 305 non-adult household members. In
Yakima, 305 caregivers reported 843 non-adult household members. Almost half of these 1087 children living with caregivers (47% or 512) were grandchildren. Another one-fourth of the children (25% or 274) were the caregivers’ own children also in the home, while almost one-fifth (19% or 203) were a nephew or niece of the caregiver. Just 2% of the children (22) were fictive kin, another 2% (22) were listed as other relatives, and another 2% (20) were cousins. Just 1% (14) were step-children and another 1% (10) were siblings. Significantly more grandchildren lived with caregivers in Seattle; more nieces/nephews lived with caregivers in Yakima.
Legal status was tracked. The highest percentage (37% or 403) of the youth had no legal status established, 26% (280) were the caregivers’ biological children, 11% (117) had the caregivers as guardians, 9% (100) were in temporary custody, 4% (46) were state dependents, 4% (46) were listed as in non-parental custody, 3% (35) were in third-party custody, and 2% (22) had other types of legal status. Just 1% (15) were in the process of having guardianship established, another 1% (14) were adopted, and another 1% (7) were foster children. More Seattle children lived with caregivers as guardians or no legal relationship; in Yakima, more children lived under a non-parental custody arrangement.
Although information was only available for Yakima sites, it appeared that AAA sites served fewer caregivers of children that had current or past involvement with Child Protective Services (CPS). 46% of children (53 of 117) of caregivers served by the Yakima Casey site reported current or past involvement with CPS, but only 3% (4) of the 124 children served by the Yakima AAA site did so.
Total average time living with the caregiver, excluding biological, adopted, and step-children, was 2.4 years with a range of one month to 19 years. This differed significantly by region. In Seattle, the average was 3.3 years; in Yakima, only 2.0 years.
The service delivery infrastructure in Yakima and Seattle differed and these differences led to different priorities for the Navigator programs in each region. The Seattle program required more effort to identify and engage the wide array of service providers, and the Yakima program required more effort to provide direct supports to caregivers given the relative lack of existing kinship service resources there. The Navigator services provided also reflected this difference, with a greater emphasis in Seattle on referrals, information and supportive listening provided primarily by telephone and a greater emphasis in Yakima on follow-up linkages and advocacy provided primarily in person.

Page iii TriWest Group Kinship Navigator Six-Month Pilot Evaluation Report
Baseline and Three-Month Caregiver Needs Caregivers involved at least three months showed significant and varied needs in multiple areas, further documenting kinship caregivers’ urgent, multiple and diverse needs. Even though many needs, on average, were not experienced very often, every need area had at least one caregiver report it as “almost always” a need at baseline. In addition, caregivers at the Seattle Casey site had more frequent needs reported in many areas. Significant improvement in 11 of 31 possible need areas (10 of the top 19) is a very positive result over three months time. What is more, the 11 needs areas with significant positive improvement all fit the Navigator’s model of change. Had any of the models’ peripheral need areas changed significantly, we might instead suspect an across-the-board improvement in caregiver status independent from the Kinship Navigator program. Given that all improvements fit the model, the findings robustly argue for the pilot’s effectiveness in its targeted areas. The lack of a comparison group prevents a definitive conclusion, but the preponderance of the data strongly suggests success. Furthermore, the initial pilot findings were replicated when the study period was extended across an additional nine months and two additional sites. Exploration of Program Costs and Benefits At about five months into the program, anecdotal observation by the evaluation team and discussions with program staff suggested that kinship caregivers seemed to be providing care to many children who might otherwise have been routed into foster care. While any cost savings attributable to the Navigator Program was beyond the scope of this study, we were able to estimate the range of potential savings enabled by Navigator support of caregivers. This design limited the findings to only caregiver self-reports, validated only by the lay opinions of the Navigators based on their current communications with agency staff and caregiver self-reports. These estimates should therefore be viewed with caution given that they were based primarily on caregiver self-reports of their perceptions as to whether or not the kin for whom they care would have been placed in foster care without their involvement. Actual decisions to place a child in foster care are made by state agency personnel trained in the specific protocols and statutes involved in such a decision. Caregiver perceptions are not based on these technical factors, but instead on their memories of their communications with other parties (including in many cases state agency staff) and of events that transpired at the time that their kin came to live with them, events that lay people can view differently from professional case work staff. The study design did not include a mechanism for verifying these reports with additional information from such state agency staff. As a result, these exploratory findings should not be viewed as definitive estimates of whether or not foster care placements actually would have taken place in the absence of caregiver involvement; the findings instead represent caregiver perceptions of the value of the role they serve. Using estimates of foster care need provided by the Navigators and 107 caregivers surveyed, we estimated that kinship care diverted approximately 690 children from foster care. Using an average time of Navigator services provided to these families of 3.9 months and multiplying it by 690, we estimated that over 16 months the Navigator program supported just over 2,694 months of kinship care for youth that may have otherwise been in foster care. Based on this theory, as many as 2,694 months of foster care were averted. Now that the pilot has documented the Navigator program’s feasibility and initial effectiveness, we recommend that future studies

Page iv TriWest Group Kinship Navigator Six-Month Pilot Evaluation Report
combine specific program cost measures with a more rigorous control group design to more completely document the program’s actual costs and benefits.

Page 1 TriWest Group Kinship Navigator Six-Month Pilot Evaluation Report
Introduction and Methods Casey Family Programs implemented the Kinship Navigator project in July 2004, in collaboration with the Washington State Kinship Oversight Committee. The project collaborated with the Washington State Department of Social and Health Services (DSHS), under a mandate from the 2003 Kinship Care Bill (SHB-1233) passed in the Washington State Legislature. Originally, two contract positions were created—one in Yakima (DSHS Region 2) and one in Seattle (DSHS Region 4)—to assist kinship caregivers with understanding and navigating the system of out-of-home care services for children, and to reduce service-access barriers faced by kinship caregivers. Two added positions were created in Summer 2005 at Area Agencies on Aging (AAA) under contract to the DSHS Aging and Disabilities Services Administration. The project was based on the following assumptions:
Kinship caregivers have difficulty accessing services. Many kinship caregivers find the “system” cumbersome and difficult to navigate, describing widely varying levels of helpfulness, professionalism and knowledge among service providers.
Establishing “Kinship Navigators” as community-based liaisons would provide a local and consistent direct service function, helping help reduce or eliminate system barriers attributed by kinship families to navigating numerous family and child-serving agencies.
Proactive information, support and access to services for kinship families can avert crises and potentially reduce complex situations requiring intensive and more costly services.
Evaluation Approach: Casey Family Programs contracted with TriWest Group to conduct two evaluations of its Kinship Navigator project: the formative evaluation between July 2004 and March 2005 and an extended evaluation between September and December 2005. The goal of both evaluations was to guide implementation and replication of the pilot and to determine the extent to which it resulted in increased awareness of and access to needed kinship caregiver supports. The formative evaluation included three-month and six-month reports to Casey Family Programs to inform their interactions with the Legislature and other decision-makers regarding the future of kinship navigator initiatives in Washington. The extended evaluation resulted in this final report and covered Navigator services provided by the two Casey Offices (Seattle and Yakima) for 16 months, as well as two additional AAA sites (Senior Services of Seattle King County and Yakima Catholic Family and Child Services) for one to three months. TriWest designed the evaluation to answer two research questions: 1. What are the components of the Navigator intervention model set forth in the legislation and
prioritized by stakeholders and to what degree did implementation adhere to the principles of the model?
2. To what degree did kinship caregivers served by the Navigators change in their awareness of and access to needed supports in the community?
The extended evaluation added two more questions: 1. Were the positive results documented in the first six months of the pilots sustained over the
entire 16 month period for the Casey sites?

Page 2 TriWest Group Kinship Navigator Six-Month Pilot Evaluation Report
2. Are there indications that the positive results demonstrated in the Casey sites were replicated in the first one to three months of operations at the AAA sites?
Evaluation Design: The formative design sought primarily to describe and inform the pilot project and document the degree to which participating caregivers changed in their awareness of and access to needed supports. The evaluation employed a simple pre/post design with no comparison group. The results demonstrate the project’s intended goals, the faithfulness to those goals, and the subsequent effect on participating caregivers’ self-reported awareness of and access to needed supports. It should be noted that the lack of a control group and the relatively short evaluation period for the AAA sites limit the report findings’ general applicability. The results simply describe what happened during the project’s first 16 months at the Casey sites and first 1-3 months at the AAA sites. It is therefore important to cautiously interpret the findings and to understand them as consistent with a pilot project. While the overall positive results and the multiple positive findings are persuasive that the pilot achieved its goals, more rigorous evaluation, including a control group and a longer evaluation period, would help compare these results to the situations of other kinship caregivers and determine if the positive changes found are sustained over time. A cost-benefit component would also help document any fiscal savings. Nevertheless, this evaluation clearly documents the kinship Navigators’ positive impact in participants’ lives. Subjects: The evaluation sought to involve all caregivers served by Navigators over the first sixteen months of implementation (mid-July 2004 through end of November 2005). The two Casey Navigators were expected to serve about 80 kinship caregivers over the first six months of the evaluation, providing information, referrals, and linkages to community agencies. In addition, the four Casey and AAA Navigators were expected to serve an additional 80 kinship caregivers during the extended evaluation period, ending in November 2005. These targets were greatly exceeded, with 443 caregivers receiving documented services in the sixteen-month focus of this evaluation and many more contacting the program for information and lesser needs. Analyses involving anonymous data sets were conducted for all 443 caregivers served. Analysis of individually identifiable data regarding family needs was conducted for the subset of 150 caregivers that gave written consent to participate in the formal evaluation. This was a sufficient sample to both describe baseline caregiver needs, assess changes over time across the entire program, and identify differences in need profiles between caregivers served at each of the four individual sites. During the initial evaluation, focus groups and caregiver interviews were conducted. These have been reported on previously in the six-month report for this project. Human subjects protection: Two levels of data were used in the evaluation. One set involved anonymous data and did not require informed consent; the other included individual identifiers and primary collection by the evaluation of personal information.

Page 3 TriWest Group Kinship Navigator Six-Month Pilot Evaluation Report
The anonymous data set involved program information collected by the Kinship Navigators. This data set was collected through a Microsoft Access database that generated a de-identified report of demographic factors (race/ethnicity, gender, year of birth) and contact summaries (number, types, and month of contact). This anonymous data set was analyzed without any identifying information to describe caregiver and family demographics, as well as Navigator service use. The pre/post component of the study involved confidential, self-reported needs assessment data. While Navigators described this information as helpful in targeting needed assistance, it was collected primarily as an evaluation component and was therefore only collected for consenting caregivers Discussions with the Navigators and cooperating Casey Family Program staff led us to develop a collaborative approach for obtaining consent. TriWest evaluation staff provided training for the Navigators in the consent process and participants’ rights. The Navigators then reviewed the consent form with each caregiver during their initial contact. The initial program contact with the Navigators tended to be in person, during which the Kinship Navigators obtained basic demographic information and sought written consent to participate in the evaluation. When the initial contact was not in person, the Navigators explained the study and the consent form over the phone and mailed the form to the caregivers to sign and return. As a quality check on this process, TriWest evaluation staff randomly selected five caregivers who consented to be involved in the study from Region 2 and another five from Region 4 (10 caregivers total). These 10 were selected out of the first 20 caregivers enrolled in the study. The TriWest evaluation staff person contacted the caregivers by phone to verify that all questions were answered and that the caregiver did indeed freely consent to be involved in the study. This was done to identify any quality issues regarding the consent process. Based on our review of these findings, TriWest evaluation staff are confident that study participants did indeed provide voluntary informed consent. Final Evaluation Report Format: As noted above, this final evaluation report focuses on the pilot program’s first sixteen months and includes the following sections:
Description of Caregivers Served – This section describes the demographic and family characteristics of the 443 caregivers receiving documented services from all four sites during the pilot’s sixteen months. It also describes the services provided to them, focusing on whether the service delivery model developed in the Casey sites over the first six months was sustained for the Casey sites and initially replicated at the AAA sites.
Baseline and Three-Month Caregiver Needs – This section reports the baseline and three-month follow-up results of the Family Needs Scale, which was used to assess caregiver needs for the 150 caregivers who provided consent to be involved in the larger evaluation.
Exploration of Program Costs and Benefits – This section takes a preliminary look at the program’s costs and potential scope of benefits, focusing on the number of months children resided in kinship care as opposed to state-funded foster care.
The report closes with a discussion of conclusions and recommendations. Three policy recommendations are reached based on an overall review and synthesis of pilot findings: 1. Sustain the existing program capacity;

Page 4 TriWest Group Kinship Navigator Six-Month Pilot Evaluation Report
2. Increase the scope of the program across time and more sites in order to make its clearly documented benefits more widely available, as well as to facilitate more definitive evaluation of its effects and their durability over time; and
3. As the program is sustained create opportunities to extend this research by creating an evaluation that has a benefit-cost component so that the economic impact of this program can be more fully documented.
Page 5 TriWest Group Kinship Navigator Six-Month Pilot Evaluation Report
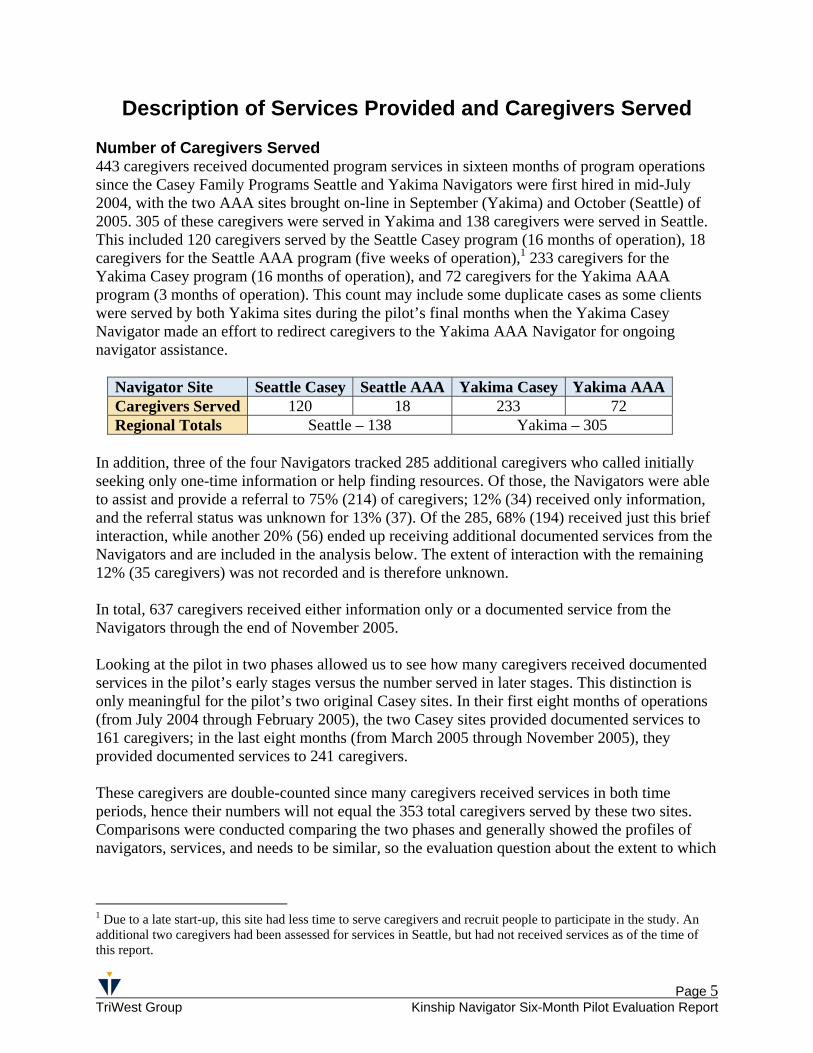
Description of Services Provided and Caregivers Served Number of Caregivers Served 443 caregivers received documented program services in sixteen months of program operations since the Casey Family Programs Seattle and Yakima Navigators were first hired in mid-July 2004, with the two AAA sites brought on-line in September (Yakima) and October (Seattle) of 2005. 305 of these caregivers were served in Yakima and 138 caregivers were served in Seattle. This included 120 caregivers served by the Seattle Casey program (16 months of operation), 18 caregivers for the Seattle AAA program (five weeks of operation),1 233 caregivers for the Yakima Casey program (16 months of operation), and 72 caregivers for the Yakima AAA program (3 months of operation). This count may include some duplicate cases as some clients were served by both Yakima sites during the pilot’s final months when the Yakima Casey Navigator made an effort to redirect caregivers to the Yakima AAA Navigator for ongoing navigator assistance.
Navigator Site Seattle Casey Seattle AAA Yakima Casey Yakima AAACaregivers Served 120 18 233 72 Regional Totals Seattle – 138 Yakima – 305
In addition, three of the four Navigators tracked 285 additional caregivers who called initially seeking only one-time information or help finding resources. Of those, the Navigators were able to assist and provide a referral to 75% (214) of caregivers; 12% (34) received only information, and the referral status was unknown for 13% (37). Of the 285, 68% (194) received just this brief interaction, while another 20% (56) ended up receiving additional documented services from the Navigators and are included in the analysis below. The extent of interaction with the remaining 12% (35 caregivers) was not recorded and is therefore unknown. In total, 637 caregivers received either information only or a documented service from the Navigators through the end of November 2005. Looking at the pilot in two phases allowed us to see how many caregivers received documented services in the pilot’s early stages versus the number served in later stages. This distinction is only meaningful for the pilot’s two original Casey sites. In their first eight months of operations (from July 2004 through February 2005), the two Casey sites provided documented services to 161 caregivers; in the last eight months (from March 2005 through November 2005), they provided documented services to 241 caregivers. These caregivers are double-counted since many caregivers received services in both time periods, hence their numbers will not equal the 353 total caregivers served by these two sites. Comparisons were conducted comparing the two phases and generally showed the profiles of navigators, services, and needs to be similar, so the evaluation question about the extent to which
1 Due to a late start-up, this site had less time to serve caregivers and recruit people to participate in the study. An additional two caregivers had been assessed for services in Seattle, but had not received services as of the time of this report.
Page 6 TriWest Group Kinship Navigator Six-Month Pilot Evaluation Report
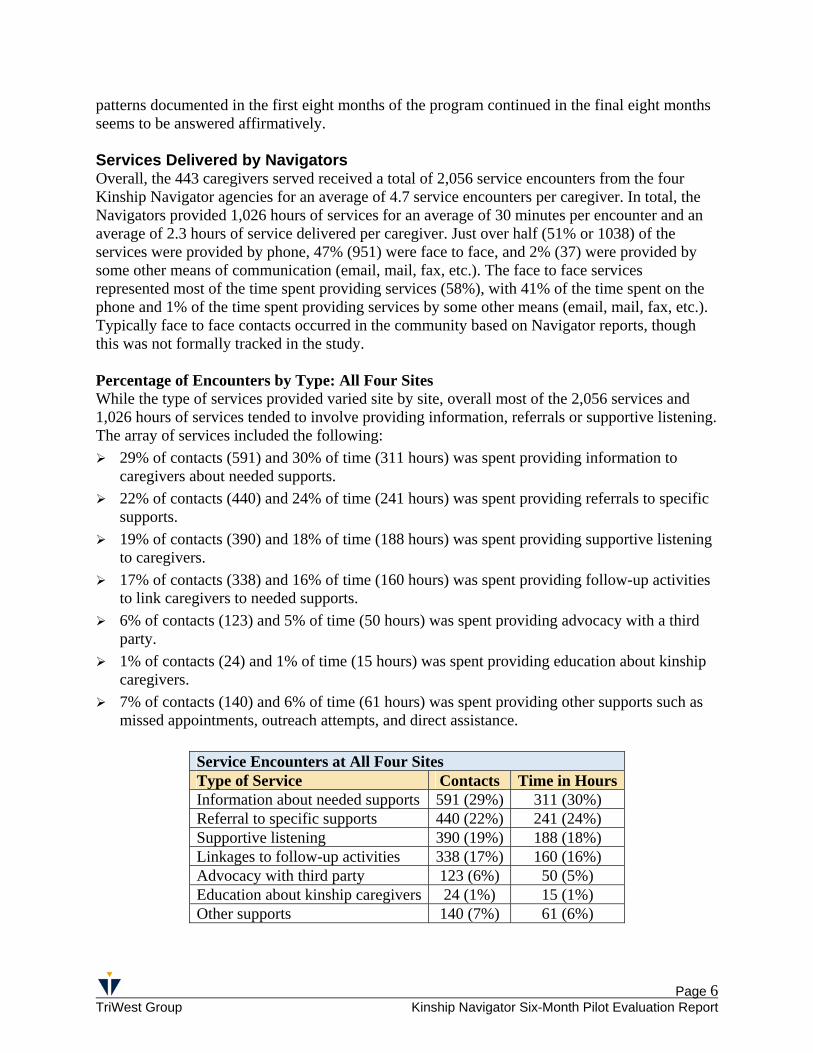
patterns documented in the first eight months of the program continued in the final eight months seems to be answered affirmatively. Services Delivered by Navigators Overall, the 443 caregivers served received a total of 2,056 service encounters from the four Kinship Navigator agencies for an average of 4.7 service encounters per caregiver. In total, the Navigators provided 1,026 hours of services for an average of 30 minutes per encounter and an average of 2.3 hours of service delivered per caregiver. Just over half (51% or 1038) of the services were provided by phone, 47% (951) were face to face, and 2% (37) were provided by some other means of communication (email, mail, fax, etc.). The face to face services represented most of the time spent providing services (58%), with 41% of the time spent on the phone and 1% of the time spent providing services by some other means (email, mail, fax, etc.). Typically face to face contacts occurred in the community based on Navigator reports, though this was not formally tracked in the study. Percentage of Encounters by Type: All Four Sites While the type of services provided varied site by site, overall most of the 2,056 services and 1,026 hours of services tended to involve providing information, referrals or supportive listening. The array of services included the following:
29% of contacts (591) and 30% of time (311 hours) was spent providing information to caregivers about needed supports.
22% of contacts (440) and 24% of time (241 hours) was spent providing referrals to specific supports.
19% of contacts (390) and 18% of time (188 hours) was spent providing supportive listening to caregivers.
17% of contacts (338) and 16% of time (160 hours) was spent providing follow-up activities to link caregivers to needed supports.
6% of contacts (123) and 5% of time (50 hours) was spent providing advocacy with a third party.
1% of contacts (24) and 1% of time (15 hours) was spent providing education about kinship caregivers.
7% of contacts (140) and 6% of time (61 hours) was spent providing other supports such as missed appointments, outreach attempts, and direct assistance.
Service Encounters at All Four Sites Type of Service Contacts Time in Hours Information about needed supports 591 (29%) 311 (30%) Referral to specific supports 440 (22%) 241 (24%) Supportive listening 390 (19%) 188 (18%) Linkages to follow-up activities 338 (17%) 160 (16%) Advocacy with third party 123 (6%) 50 (5%) Education about kinship caregivers 24 (1%) 15 (1%) Other supports 140 (7%) 61 (6%)

Page 7 TriWest Group Kinship Navigator Six-Month Pilot Evaluation Report
Services Delivered: Yakima and Seattle Geography was the primary factor related to different profiles of service delivery among the four sites. That is, the pattern of service delivery in the two Seattle pilots was different from that observed in the two Yakima pilots. This same finding was documented in the initial pilot report on the two Casey sites, and seems to have continued throughout the project. The Yakima site delivered more total services and more face to face services. Of the 443 caregivers receiving 2,056 service encounters, the two Yakima agencies provided 1,606 documented service encounters to 305 caregivers while the two Seattle agencies provided 450 service encounters to 138 caregivers. This pattern appears to be related to the different context of service delivery—Seattle’s large urban area versus Yakima’s less densely populated small city and rural areas. However, the Seattle AAA site, while only operating for about five weeks during the time frame of this study, did exhibit a pattern of more face to face service delivery that better matched that of the two Yakima sites than that of the Seattle Casey site. More time is needed to determine how the Seattle AAA site’s service pattern will evolve, so it should be kept in mind that the regional differences in service delivery detailed in this subsection have only been clearly documented in the Seattle Casey site. As a result, it is possible that this difference is not regional, but instead simply a function of the operations at the Seattle Casey site. Regardless, the challenges of operating in Seattle’s larger, more complex system clearly related to the pattern of service delivery observed at the Seattle Casey site. The chart below shows the difference in the way services were delivered in each region.
Navigator Service Delivery Methods by Region
0%10%20%30%40%50%60%70%80%90%
Face to Face Telephone Other
SeattleYakima
The 305 Yakima caregivers received a total of 1,606 documented service encounters (703 hours of service), for an average of 5.3 encounters and 2.3 hours of support per caregiver. 54% (862) of the services were provided face to face, 43% (692) by telephone, and 2% (37) were not provided directly in person (these tended to be by email). The face to face services represented most of the time spent providing services (71%), with 28% over the phone and 2% not provided in person.

Page 8 TriWest Group Kinship Navigator Six-Month Pilot Evaluation Report
The 138 Seattle caregivers received a total of 450 documented service encounters (323 hours of service), for an average of 3.3 encounters and 2.3 hours of support per caregiver. The total amount of service time per caregiver in Seattle was essentially identical to the amount of time per caregiver in Yakima, but the mode of delivery differed dramatically. Most of the Seattle services were provided by phone (80% or 346 of the 435 encounters where the type of delivery was documented) and 20% (89) were face to face. In terms of time, nearly three-quarters (70%) was on the telephone, and 30% was delivered face to face. The difference was statistically significant (p<.001, Chi Square= 191.1, df=3, n=2056). The two regions also differed in type of services provided. Overall, Seattle services provided tended to be referrals, information and supportive listening, while in Yakima services tended to involve more follow-up linkages and advocacy. This seemed to relate primarily to the different service systems available to caregivers in each region. Based on input from the Navigators, the Seattle program required more effort to identify and point caregivers to the right source of help among the relatively wider array of service providers in a large urban area, whereas the Yakima program required more effort to provide direct supports to caregivers given the relative lack of existing kinship service resources there. The Navigator services provided seemed to reflect this difference, with a greater emphasis in Seattle on information and referrals and a greater emphasis in Yakima on linkages and advocacy. The difference was statistically significant (p<.001, Chi Square= 176.6, df=7, n=2056). The following chart summarizes the frequency of service contacts across service types for both regions.
Types of Services Delivered by Region
0%5%
10%15%20%25%30%35%40%
Advocacywith 3rd Party
Educationabout Kinship
Givers
Information Linkage Referral SupportiveListening
Other Support
SeattleYakima
Differences in the array of services provided by region included:
Providing follow-up linkages was a much higher proportion of Yakima’s supports than Seattle’s. In Yakima, 20% of contacts (313) and 21% of time (149 hours) was spent providing follow-up linkages to specific supports, while in Seattle just 6% of contacts (25) and 4% of time (12 hours) was spent providing follow-up linkages.
Providing referrals took a much higher proportion of Seattle’s contacts (36% (161) as compared with 17% (279) in Yakima) and a much higher proportion of Seattle’s time as well (37% (120 hours) compared with 17% (121 hours) in Yakima).

Page 9 TriWest Group Kinship Navigator Six-Month Pilot Evaluation Report
The Yakima Navigators spent 7% of their contacts (119) and 7% of their time (47 hours) providing caregivers with advocacy involving third party. This type of service was only provided by the Seattle Navigators four (4) times making up just 1% of all contacts and 1% of all time spent (3 hours). The Seattle Navigators spent 5% of their contacts (20) and 4% of their time (14 hours) providing education about Kinship caregivers. This was not a significant service in Yakima, as the Navigators there only provided this service four (4) times for less than 1% of all contacts and less than 1% of all time spent (just 1 hour).
Navigators in the two regions provided information to caregivers in similar proportion, but the proportion of time spent was slightly higher in Yakima (32% or 226 hours), compared with Seattle (27% or 86 hours). In Yakima, 29% of contacts (466) was spent providing information to caregivers about needed supports, while 28% of contacts (125) was spent by the Seattle Navigators providing information.
Navigators in both regions provided supportive listening to the same proportion of contacts (19% for both, 304 for Yakima and 86 for Seattle) although the proportion of time spent was slightly higher in Seattle at 21% (66 hours), compared with 17% in Yakima (121 hours).
Additionally, Navigators in the two regions spent time providing other supports to an almost equal proportion of their contacts.
Services Delivered by Region: Seattle and Yakima
Seattle Yakima Type of Service Contacts Time
(in hours) Contacts Time (in hours)
Linkages to follow-up activities 25 (6%) 12 (4%) 313 (20%) 149 (21%) Referral to specific supports 161 (36%) 120 (37%) 279 (17%) 121 (17%) Advocacy with third party 4 (1%) 3 (1%) 119 (7%) 47 (7%) Education about kinship caregivers
20 (5%) 14 (4%) 4 (<1%) 1 (<1%)
Information about needed supports
125 (28%) 86 (27%) 466 (29%) 226 (32%)
Supportive listening 86 (19%) 66 (21%) 304 (19%) 121 (17%) Other supports 26 (6%) 23 (7%) 114 (7%) 38 (5%) Services Delivered: Casey and AAA Sites We also examined differences in the pattern of service delivered in the Casey and AAA programs. The caregivers served by the AAA sites tended to have fewer services (2.3-3.4 encounters, versus 3.4-5.9) and less time spent (0.7-1.3 hours, versus 2.6) on average, than the Casey sites. However, when we looked only at the first 30 days of operations for each program, the Casey sites more closely resembled the AAA sites, suggesting that this difference may reflect the newness of the programs rather than differences between the types of sites. The proportion of face to face versus telephone contacts was also examined. The geographic difference (Seattle versus Yakima) was the primary factor observed, so no difference between Casey and AAA sites was evident.
Page 10 TriWest Group Kinship Navigator Six-Month Pilot Evaluation Report
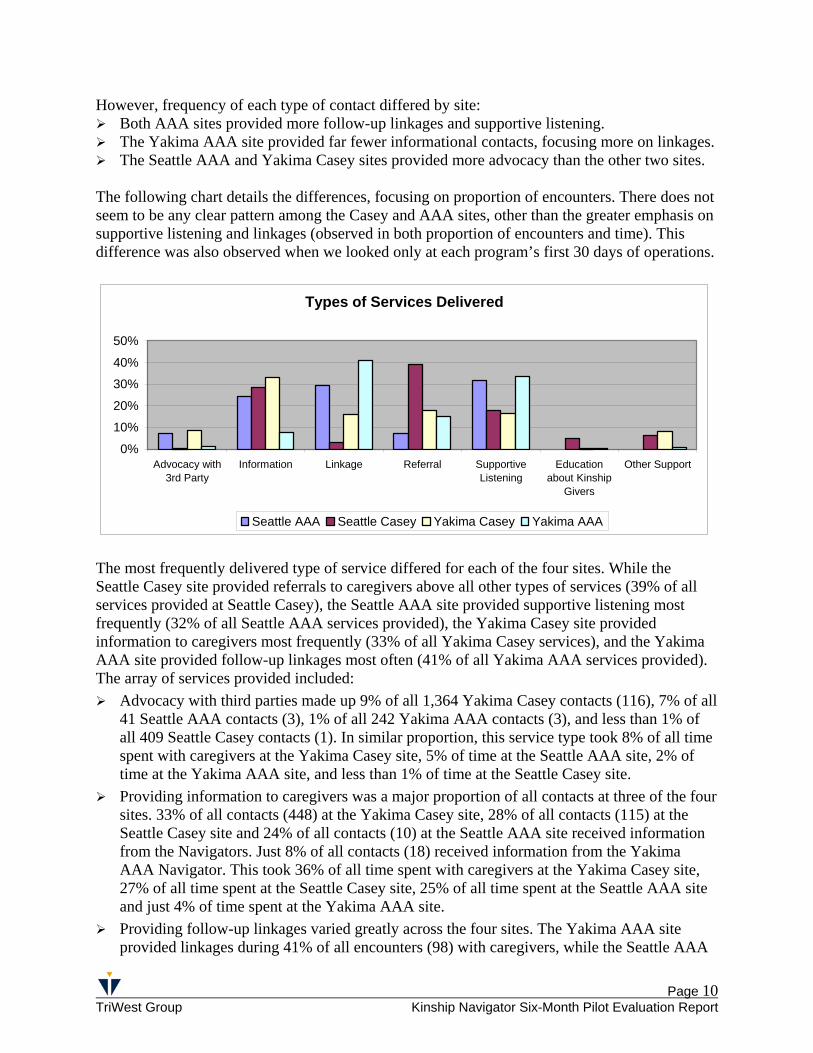
However, frequency of each type of contact differed by site: Both AAA sites provided more follow-up linkages and supportive listening. The Yakima AAA site provided far fewer informational contacts, focusing more on linkages. The Seattle AAA and Yakima Casey sites provided more advocacy than the other two sites.
The following chart details the differences, focusing on proportion of encounters. There does not seem to be any clear pattern among the Casey and AAA sites, other than the greater emphasis on supportive listening and linkages (observed in both proportion of encounters and time). This difference was also observed when we looked only at each program’s first 30 days of operations.
Types of Services Delivered
0%
10%
20%
30%
40%
50%
Advocacy with3rd Party
Information Linkage Referral SupportiveListening
Educationabout Kinship
Givers
Other Support
Seattle AAA Seattle Casey Yakima Casey Yakima AAA
The most frequently delivered type of service differed for each of the four sites. While the Seattle Casey site provided referrals to caregivers above all other types of services (39% of all services provided at Seattle Casey), the Seattle AAA site provided supportive listening most frequently (32% of all Seattle AAA services provided), the Yakima Casey site provided information to caregivers most frequently (33% of all Yakima Casey services), and the Yakima AAA site provided follow-up linkages most often (41% of all Yakima AAA services provided). The array of services provided included:
Advocacy with third parties made up 9% of all 1,364 Yakima Casey contacts (116), 7% of all 41 Seattle AAA contacts (3), 1% of all 242 Yakima AAA contacts (3), and less than 1% of all 409 Seattle Casey contacts (1). In similar proportion, this service type took 8% of all time spent with caregivers at the Yakima Casey site, 5% of time at the Seattle AAA site, 2% of time at the Yakima AAA site, and less than 1% of time at the Seattle Casey site.
Providing information to caregivers was a major proportion of all contacts at three of the four sites. 33% of all contacts (448) at the Yakima Casey site, 28% of all contacts (115) at the Seattle Casey site and 24% of all contacts (10) at the Seattle AAA site received information from the Navigators. Just 8% of all contacts (18) received information from the Yakima AAA Navigator. This took 36% of all time spent with caregivers at the Yakima Casey site, 27% of all time spent at the Seattle Casey site, 25% of all time spent at the Seattle AAA site and just 4% of time spent at the Yakima AAA site.
Providing follow-up linkages varied greatly across the four sites. The Yakima AAA site provided linkages during 41% of all encounters (98) with caregivers, while the Seattle AAA

Page 11 TriWest Group Kinship Navigator Six-Month Pilot Evaluation Report
site provided linkages during 29% of all encounters (12). The Yakima Casey site spent 16% of all encounters (215) and the Seattle Casey site spent just 3% of all encounters (13) providing such services. This service type accounted for 34% of all time spent at the Yakima AAA site, 20% of all time spent at the Seattle AAA site, 19% of all time spent at the Yakima Casey site, and just 3% of time spent at the Seattle Casey site.
The Seattle Casey site provided the largest proportion of referrals at 39% (158). The Yakima Casey site provided referrals during 18% of its service encounters, the Yakima AAA site provided referrals during 15% of its service encounters, and the Seattle AAA site provided just 3 referrals which made up 7% of its service encounters. The proportion of time spent at each agency providing referrals closely matched the proportions of services provided at each site. The Seattle Casey Navigator spent 38% of her time providing referrals, while the Yakima Casey Navigator spent 18%, the Yakima AAA Navigator spent 9% of her time, and the Seattle AAA Navigators spent 5% of their time providing referrals to caregivers.
The Yakima AAA site provided supportive listening to caregivers during 34% of all its service encounters (80), and the Seattle AAA site Navigator listened supportively during 32% of all its services (13). The Seattle Casey site provided supportive listening in 18% of all service encounters (73), while the Yakima Casey site provided supportive listening in 17% of all its service encounters (224). This type of service took almost half of the time spent providing services at the Seattle AAA site (46%) and exactly half of the time at the Yakima AAA site (50%). It took 20% of all time at the Seattle Casey site and just 13% of all time spent providing services at the Yakima Casey site.
The only site that provided education about Kinship Caregivers more than a few times was the Seattle Casey site, which delivered this service in 5% of contacts (20). The proportion of time spent for this service closely matched the proportions of services provided at each site.
Services Delivered at Each Site
Seattle AAA Seattle Casey Yakima AAA Yakima Casey Type of Service Contacts Time* Contacts Time* Contacts Time* Contacts Time* Advocacy with third party
3 (7%)
1 (5%)
1 (<1%)
2 (<1%)
3 (1%)
1 (2%)
116 (9%)
46 (8%)
Information about needed supports
10 (24%)
3 (25%)
115 (28%)
83 (27%)
18 (8%)
4 (4%)
448 (33%)
222 (36%)
Linkages to follow-up activities
12 (29%)
2 (20%)
13 (3%)
9 (3%)
98 (41%)
31 (34%)
215 (16%)
118 (19%)
Referral to specific supports
3 (7%)
1 (5%)
158 (39%)
120 (38%)
36 (15%)
8 (9%)
243 (18%)
113 (18%)
Supportive listening
13 (32%)
6 (46%)
73 (18%)
61 (20%)
80 (34%)
45 (50%)
224 (17%)
76 (13%)
Education about kinship caregivers
0 (0%)
0 (0%)
20 (5%)
14 (4%)
1 (<1%)
<1 (<1%)
3 (<1%)
1 (<1%)
Other supports 0 (0%)
0 (0%)
26 (6%)
23 (8%)
2 (1%)
1 (<1%)
112 (8%)
37 (6%)
*Time is shown in hours

Page 12 TriWest Group Kinship Navigator Six-Month Pilot Evaluation Report
Services Delivered: Early Pilot and Late Pilot For the two Casey sites, we were also able to examine services delivered in the first six months of the pilot versus services delivered in the last six months. No differences were observed. Services Provided to Agencies Services were also provided to agencies by the two Casey sites. Most of these services were provided in the pilot’s early phase and involved formal presentations to spread the word about the Navigator services. After April of 2005, sufficient demand existed for the Navigators in the two Casey sites to spend all of their time providing services to individual caregivers. The two AAA sites had enough demand for individual caregiver services from their outset. Overall, 101 agency services were provided by the two Casey sites, reaching a total of 1,843 people. This included 35 events and 324 people in Yakima and 66 events and 1,519 people in Seattle. Seattle events tended to reach more people, with 350 people attending a Holiday Gathering and 100-150 at each of four other events. The largest event in Yakima reached 63 people. Overall, 187 hours of service were provided to agencies across the two programs, 149 hours in Seattle (average contact was 135 minutes) and 38 hours in Yakima (average contact was 64 minutes). Written materials such as the Kinship Navigator program brochure were reported as distributed at 97% of the Yakima events and 68% of the Seattle events. Contact information was distributed at all of the Yakima events and 70% of the Seattle events. The Yakima Casey site had an additional outreach effort, sending out a mass mailing to 119 faith-based organizations in the pilot’s early stages. Outreach occurred at multiple agencies: 14% at schools (14), 13% at Department of Social and Health Services (DSHS) groups (13), 11% at caregiver support groups (11), 7% at faith-based organizations (7), 5% at aging services agencies (5), 4% at advocacy groups (4), 3% at youth services agencies (3), 3% at physical health providers (3) and 42% at a range of other agencies (43), including mental health and substance abuse providers, an apartment complex, a legislator, non-profit agencies, community centers, a homelessness forum and clothing distribution sites. The outreach by the Seattle Casey Navigator included: 15% at schools (10), 11% at kinship caregiver support groups (7), 6% at aging services agencies (4) and 5% at DSHS groups, faith-based organizations and physical health providers (3 each), 3% at advocacy groups (2), 2% at a substance abuse provider, an apartment complex and youth services agency (1 each), and 47% at a range of other agencies (31). The outreach by the Yakima Casey Navigator included: 28% at DSHS groups (10), 11% at caregiver support groups, faith-based organizations and schools (4 each), 6% at advocacy groups and youth services agencies (2 each), 3% at aging services agencies and mental health service agencies (1 each), and 22% at a range of other agencies (8).

Page 13 TriWest Group Kinship Navigator Six-Month Pilot Evaluation Report
Age Data on age was available for 470 caregivers. The average age of caregivers served by the program was just under 50 years (49.2). Caregiver ages varied considerably, ranging from 21 years of age to 86 years of age. The figure below shows the age distribution of all 470 caregivers across all four sites. The figure shows that most caregivers (32% or 150) were between 50 and 59 years of age, closely followed by the 31% (145) between the ages of 40 and 49. 17% of caregivers (82) were 60 or older, 13% (61 caregivers) were between the ages of 30 and 39, and just 7% of caregivers (32) were under the age of 30.
Age Distribution: all Sites
(82)
(150)(145)
(61)
(32)
0%
5%
10%
15%
20%
25%
30%
35%
under 30 30-39 40-49 50-59 60 and over
All Sites
Age of Caregivers: Yakima and Seattle Comparing the ages of the caregivers between the two regions shows that the caregivers served in Seattle were slightly older on average (52.5 years of age) than those served in Yakima (47.4 years of age). This difference was statistically significant (t =4.4, p<.001). Of the 470 caregivers, 303 were served in Yakima and 167 in Seattle. Of the 303 served in Yakima, the ages ranged from 21 to 83 while, of the 167 served in Seattle, the age range was slightly higher, ranging from 24 to 86. The figure below shows the age distribution of the caregivers between the two regions.
Age Distribution: Seattle vs Yakima
0%5%
10%15%20%25%30%35%40%
under 30 30-39 40-49 50-59 60 and over
SeattleYakima

Page 14 TriWest Group Kinship Navigator Six-Month Pilot Evaluation Report
Comparing the ages of the caregivers between the Casey sites and the AAA sites suggests that the caregivers served at the AAA sites were slightly older on average (50.5 years of age) than those served at the Casey sites (48.9 years of age). However, the difference was not statistically significant. Similarly, there was almost no difference in caregiver ages between those served in the pilot’s early stages and those served in the pilot’s late stages. Comparing the ages of the caregivers at the four individual Kinship Navigator sites shows that the caregivers served at the Seattle AAA site were significantly older on average (61.9 years of age) than the caregivers at the other three sites (51.2 years of age at the Seattle Casey site, and 47.4 years of age at both the Yakima Casey site and the Yakima AAA site). These differences were statistically significant (F=11.2, p<.001). The figure below shows the age distribution of the caregivers served at each of the four sites.
Age Distribution: All Sites
0%
10%
20%
30%
40%
50%
60%
under 30 30-39 40-49 50-59 60 and over
Seattle CaseySeattleAAAYakima AAAYakima Casey
Gender Data on gender was available for 460 participants across the four Kinship Navigator sites. Of these caregivers, the vast majority was female (427 or just under 93%), while just over 7% (33) were male. Of the 460 caregivers for whom gender data was available, 299 were served in Yakima and 161 in Seattle. Of the 299 served in Yakima, 92% (275) were female and 8% (24) were male. This is slightly different from the combined gender data for all four sites. Of the 161 served in Seattle, over 94% (152) were female and 6% (9) were male, which also differed just slightly from the overall data. The difference between the two regions was not statistically significant. Statistically insignificant patterns were also found when comparing the Casey (92% female) and AAA (97% female) sites. Race/Ethnicity and Language Data on race and ethnicity was available and analyzed for 453 participants across the four sites, based on the information recorded in the primary race/ethnicity field of the Navigators’ databases. If the primary race/ethnicity field was blank and only one of the race/ethnicity

Page 15 TriWest Group Kinship Navigator Six-Month Pilot Evaluation Report
categories was checked, that category was used. If no primary race/ethnicity was designated and multiple categories were checked, that participant was considered “multi-racial” for the sake of this analysis. The chart below shows the racial distribution for the 453 pertinent caregivers
Racial/Ethnic Distribution of Caregivers: All Sites
(6)
(200)
(75)
(119)
(2)
(51)
0%5%
10%15%20%25%30%35%40%45%50%
AmericanIndian or
Alaskan Native
Asian Americanor PacificIslander
Black or AfricanAmerican
Hispanic/Latino White Muli-Racial
All Sites
The majority of caregivers served by the four sites were non-Hispanic White (44% or 200), followed by African American (26% or 119). Another 17% (75) were Hispanic, 11% were American Indian/Native Alaskan (51), and 1% (6) identified as being multi-racial. Just two (2) caregivers were Asian American, less than 1% of all caregivers. Race/Ethnicity of Caregivers by Region: Yakima and Seattle The race/ethnicity data on the 294 caregivers served in Yakima differed greatly from the racial make-up of the 159 caregivers served in the Seattle region, as shown by the chart below.
Race/Ethnicity of Caregivers by Region: Seattle vs Yakima
0%10%20%30%40%50%60%70%80%
AmericanIndian or
Alaskan Native
Asian Americanor PacificIslander
Black or AfricanAmerican
Hispanic/Latino White Muli-Racial
SeattleYakima
The majority of caregivers served in the Seattle region were African American (67% or 101), while just 4% of those served in Yakima (12) were African American. Over half of the caregivers served in Yakima were non-Hispanic White (56% or 164), while only 23% (36) of the

Page 16 TriWest Group Kinship Navigator Six-Month Pilot Evaluation Report
caregivers in Seattle identified as White. Of the caregivers served in Yakima, 23% (68) identified as Hispanic, while only 4% (7) caregivers in Seattle identified as Hispanic. Also, 16% (47) of caregivers in Yakima identified as American Indian/Alaskan Native, and just 3% (4) of caregivers in Seattle identified as American Indian/Alaskan Native. The differences in race between the two regions was statistically significant (Chi Square = 225, p<.001). The race/ethnicity data on the 84 caregivers served by the AAA sites was quite similar to the race/ethnicity data on the 369 caregivers served by the Casey sites. Also, no statistical differences were found comparing the early and late pilot periods of the Casey sites. Primary Language: All Four Sites Data on primary language was available for 454 participants across the four sites. The vast majority (94% or 425) of the caregivers spoke English as their primary language and 6% (28) spoke Spanish.
Primary Language of Caregivers Across All Four Sites
128
(425)
0%
20%
40%
60%
80%
100%
English Spanish Other (specify)
All Sites
While 97% (151) of those served in Seattle spoke English as their primary language, only 92% (274) of those served in Yakima were English speakers. This difference was not significant. Just 3% (4) of the Seattle caregivers spoke Spanish as their primary language while 8% (24) of those served in Yakima spoke Spanish as their primary language. Another 1% of caregivers in Seattle (1) spoke Samoan as their primary language. No differences were found comparing the Casey and AAA sites or the early/late pilot periods. Information Regarding Caregiver Children Data on caregivers’ children (both their own children and children of kin) was available for 439 participants across the four sites, totaling 1,148 children, for an average of over two (2.6) per caregiver. While many caregivers also had their own children in their homes, all were seeking Navigator supports primarily to help them with the kin living with them. Caregivers’ own children (biological children, adopted children, step children) were excluded from all analyses of children of kin. However, their presence in the home is important as an indicator of the overall

Page 17 TriWest Group Kinship Navigator Six-Month Pilot Evaluation Report
extent of care provided (and related burdens faced) by each caregiver. The number of children reported living with each caregiver ranged from one to ten.
Navigator Sites Caregivers ChildrenTotal 439 1148
Seattle 134 305 Seattle AAA 20 38 Seattle Casey 114 267 Yakima 305 843 Yakima AAA 73 216 Yakima Casey 232 627
Casey 346 894 AAA 93 254
The range of relationships reported across all sites is summarized in the chart below.
Relationship of Children to Caregiver for All Four Sites
22101410
203
512
22
274
0%
10%
20%
30%
40%
50%
Child Cousin Fictive Kin Grandchild Nephew orNiece
Sibling Step-Child Other Non-Relative
OtherRelative
All Sites
20
Relationship data was recorded for 1087 of the 1148 children at the four sites. Almost half of these 1087 children living with caregivers (47% or 512) were grandchildren. Another one-fourth of the children (25% or 274) were the caregivers’ own children, while almost one-fifth (19% or 203) were a nephew or niece of the caregiver. Just 2% of the children (22) were fictive kin, another 2% (22) were listed as other relatives, and another 2% (20) were cousins. Just 1% (14) were step-children and another 1% (10) were siblings. The remaining 1% (10) were listed as “other non-relative.” We also examined the legal status of the children, as shown in the next table below. Legal status was reported for 1085 of the 1148 children with the highest percentage (37% or 403) of the youth having no legal status established, 26% (280) being the caregivers’ biological children, 11% (117) for whom the caregivers were guardians, 9% (100) in temporary custody, 4% (46) state dependents, 4% (46) listed as in non-parental custody, 3% (35) in third-party custody, and

Page 18 TriWest Group Kinship Navigator Six-Month Pilot Evaluation Report
2% (22) with other types of legal status. Just 1% (15) were in the process of having guardianship established, another 1% (14) were adopted, and another 1% (7) were foster children.
Legal Status of Children: All Four Sites
10046
403
46
117
715
280
1435
0%5%
10%15%20%25%30%35%40%
3rd
Par
tyC
usto
dy
Ado
pted
Bio
logi
cal
Chi
ld
Est
ablis
hing
Gua
rdia
nshi
p
Fost
er C
hild
Gua
rdia
n
Non
Par
enta
lC
usto
dy
Non
eE
stab
lishe
d
Sta
teD
epen
dent
Tem
pora
ryC
usto
dy
The length of time that children had lived with their kinship caregiver was reported for 743 children (excluding biological and adopted children, as well as those with a missing legal status), averaging just over two (2.4) years, with a range of one month to 19 years. Caregiver Children: Seattle and Yakima Of the 439 caregivers and 1148 children, 134 caregivers with 305 children were in the Seattle region, for an average of just over two (2.3) children per caregiver. 305 caregivers with 843 children were in the Yakima region, for an average of just under three (2.8) children per caregiver. This difference is statistically significant, with Yakima caregivers, on average, caring for more children per household than caregivers in Seattle (t=2.9; p<.005). The number of children reported by caregivers in Seattle ranged from one to eight, while the number of children in Yakima ranged from one to ten. Of the 305 children in Seattle, 260 had relationship data reported while 827 of the 843 children in Yakima had relationship data recorded. The chart below shows the range of relationships reported on the children by region. While the largest number of children were reported as being grandchildren in both regions, there were proportionally more grandchildren in Seattle (64% or 167) than in Yakima (42% or 345). Conversely there were a larger percentage of children reported as child and niece/nephew in Yakima than in Seattle. In Yakima 29% of all children (238) were children of caregivers, while just 14% (36) were children in Seattle. Another 21% (172) were nieces or nephews of the Yakima caregivers, while just 12% (31) were nieces or nephews in Seattle. The remaining relationship categories did not account for many children in either region. These differences were statistically significant overall between Yakima and Seattle (p<.001, Chi Square= 190.5, df=27, n=1148).

Page 19 TriWest Group Kinship Navigator Six-Month Pilot Evaluation Report
Relationship of Children to Caregiver: Seattle vs Yakima
0%10%20%30%40%50%60%70%
Child Cousin Fictive Kin Grandchild Nephew orNiece
Sibling Step-Child Other Non-Relative
OtherRelative
Seattle Yakima
In terms of legal status of children of kin living in the home, more children in Seattle lived with their caregivers as guardians or with no legal relationship. In Yakima, more children lived under a non-parental custody arrangement, in addition to the greater number of caregiver’s own children already noted. Other categories were comparable between the regions.
Legal Status of Children by Region: Seattle versus Yakima
0%10%20%30%40%50%
3rd
Par
tyC
usto
dy
Ado
pted
Bio
logi
cal
Chi
ld
Est
ablis
hing
Gua
rdia
nshi
p
Fost
er C
hild
Gua
rdia
n
Non
Par
enta
lC
usto
dy
Non
eE
stab
lishe
d
Tem
pora
ryC
usto
dy
Oth
er
Seattle Yakima
Of the 743 children of kin with data reported for length of stay with their kinship caregiver, 202 children were served in the Seattle region and 541 children were served in the Yakima region. The average length of time the children lived with their caregiver in Seattle was just over three (3.3) years, with a range of one month to 19 years. The average length of time the children lived with their caregivers in Yakima was two (2.0) years, with a range of one month to 17 years. The difference in the average number of years with caregivers between regions was statistically significant (t=4.9, p<.001). Caregiver Children: Casey and AAA Sites One notable difference was identified between Casey and AAA sites, and it involved the proportion of children served that had current or past involvement with Child Protective Services
Page 20 TriWest Group Kinship Navigator Six-Month Pilot Evaluation Report
(CPS). Due to difficulties with the database, only Yakima’s Casey and AAA sites successfully collected data on this variable and only during the last three months of the project. Despite the limited data available, it was clear that children of caregivers served by the Yakima Casey site had greater levels of involvement with CPS, with 46% of children (53 of 117) in families reporting this information having such involvement currently, at the time when they came to live with the caregiver, or previously. Only 3% (4) of the 124 children served by the Yakima AAA site during this time frame reported such involvement, and this makes sense given rules governing the use of caregiver funds dispersed by the Area Agencies on Aging. This difference is statistically significant (p<.001, Chi Square= 60.0, df=1, n=242) and the pattern also fits with anecdotal information reported by the Seattle Casey and AAA sites. No differences were found comparing the Casey and AAA sites or the early/late pilot periods in terms of relationships, legal status, or length of time with the caregiver.

Page 21 TriWest Group Kinship Navigator Six-Month Pilot Evaluation Report
Baseline and Three-Month Caregiver Needs For caregivers who consented to be involved in the evaluation, baseline and 3-month follow up needs were assessed using a modified version of the Family Needs Scale. Don Cohon of the Edgewood Institute for the Study of Community-Based Services developed a 31-item family needs scale based on the work of Carl Dunst and colleagues (Dunst, Trivette & Deal, 1988).2 The items from this scale overlapped considerably with input TriWest had received from the Navigator Project Logic Model, discussions with project leadership, and a 2002 study of kinship care in Washington State (Mayfield, Pennucci & Lyon, 2002).3 While the Family Needs Scale developed for this study used most of the items from the Edgewood Institute scale, we made three types of modifications: (1) we added eight (8) items prioritized by Washington State stakeholders that were not included in the original scale (e.g., kinship support groups, school-related needs); (2) we modified four (4) inquiries for greater specificity (e.g., breaking down a question on legal supports into three sub-components); and (3) we deleted 11 less relevant items for brevity (e.g., help budgeting, help learning to cook). One additional item (“information on where to get help”) was added two months into the project. Data on needs was collected during the first six months and last three months of the study period, so it was not available for all caregivers served. Needs were rated by caregivers according to their experienced frequency. The rating scale included: always (6), almost always (5), often (4), sometimes (3), almost never (2), and never (1). Average scores across all caregivers were computed and re-categorized as follows: always (5.5-6), almost always (4.5-5.4), often (3.5-4.4), sometimes (2.5-3.4), almost never (1.5-2.4), and never (1-1.4). Information on family needs (unlike service and demographic data, which was collected throughout the entire pilot period) was only collected during formal study periods from caregivers who provided consent to be asked about and share this additional information. The study sought consent during the period of July 2004 through mid-February 2005 (for only the two Casey sites), then again from September 2005 through November 2005 (for all four sites, other than the Seattle AAA site which did not participate in the study until late October 2005). During these two periods, consent was obtained from 150 caregivers who completed the initial Family Needs Scale:
20 from the Seattle AAA site (111% of the 18 receiving a service, since the total includes two who had not received a documented service yet when the study period ended),
23 from the Seattle Casey site (19% of the 120 receiving a documented service), 23 from the Yakima AAA site (32% of the 72 receiving a documented service), and 84 from the Yakima Casey site (36% of the 233 receiving a documented service).
2 C.J. Dunst, C.M. Trivette, & A.G. Deal. (1988). Enabling and Empowering Families: Principles and Guidelines for Practice. Cambridge, MA: Brookline Books. 3 Mayfield, J., Pennucci, A., & Lyon, C. (June, 2002). Kinship Care in Washington State: Prevalence, Policy, and Needs. Olympia, WA: WSIPP.
Page 22 TriWest Group Kinship Navigator Six-Month Pilot Evaluation Report
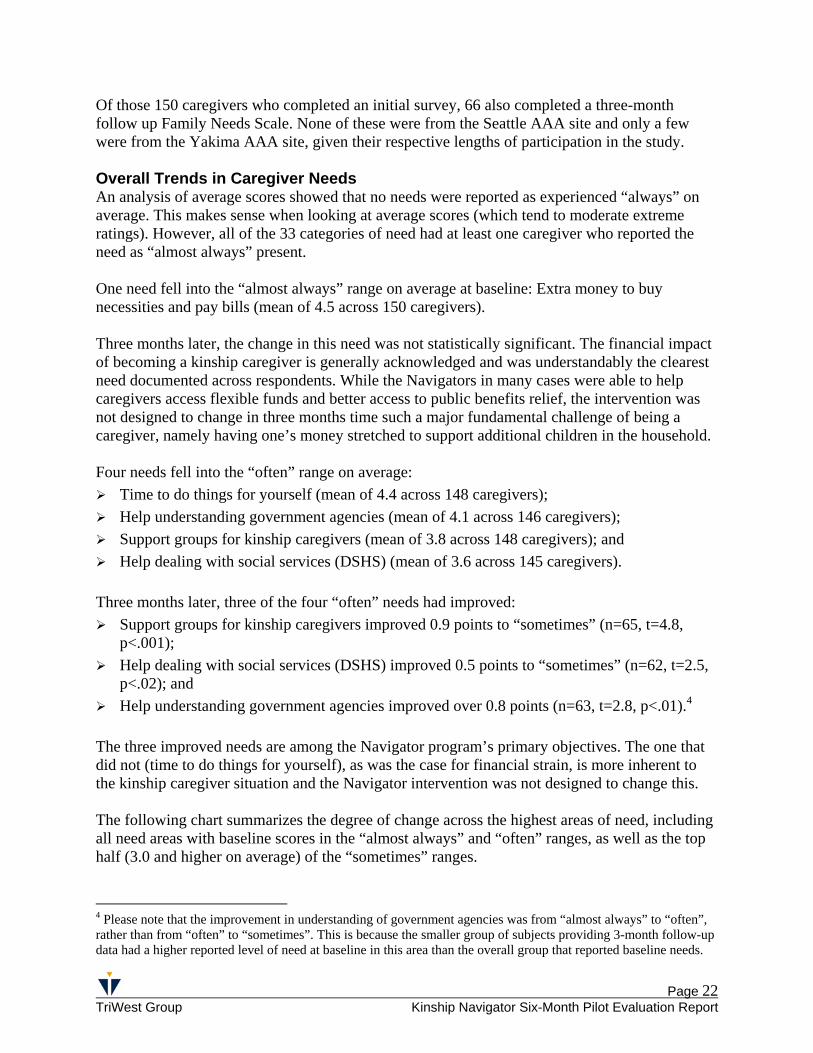
Of those 150 caregivers who completed an initial survey, 66 also completed a three-month follow up Family Needs Scale. None of these were from the Seattle AAA site and only a few were from the Yakima AAA site, given their respective lengths of participation in the study. Overall Trends in Caregiver Needs An analysis of average scores showed that no needs were reported as experienced “always” on average. This makes sense when looking at average scores (which tend to moderate extreme ratings). However, all of the 33 categories of need had at least one caregiver who reported the need as “almost always” present. One need fell into the “almost always” range on average at baseline: Extra money to buy necessities and pay bills (mean of 4.5 across 150 caregivers). Three months later, the change in this need was not statistically significant. The financial impact of becoming a kinship caregiver is generally acknowledged and was understandably the clearest need documented across respondents. While the Navigators in many cases were able to help caregivers access flexible funds and better access to public benefits relief, the intervention was not designed to change in three months time such a major fundamental challenge of being a caregiver, namely having one’s money stretched to support additional children in the household. Four needs fell into the “often” range on average:
Time to do things for yourself (mean of 4.4 across 148 caregivers); Help understanding government agencies (mean of 4.1 across 146 caregivers); Support groups for kinship caregivers (mean of 3.8 across 148 caregivers); and Help dealing with social services (DSHS) (mean of 3.6 across 145 caregivers).
Three months later, three of the four “often” needs had improved:
Support groups for kinship caregivers improved 0.9 points to “sometimes” (n=65, t=4.8, p<.001);
Help dealing with social services (DSHS) improved 0.5 points to “sometimes” (n=62, t=2.5, p<.02); and
Help understanding government agencies improved over 0.8 points (n=63, t=2.8, p<.01).4 The three improved needs are among the Navigator program’s primary objectives. The one that did not (time to do things for yourself), as was the case for financial strain, is more inherent to the kinship caregiver situation and the Navigator intervention was not designed to change this. The following chart summarizes the degree of change across the highest areas of need, including all need areas with baseline scores in the “almost always” and “often” ranges, as well as the top half (3.0 and higher on average) of the “sometimes” ranges.
4 Please note that the improvement in understanding of government agencies was from “almost always” to “often”, rather than from “often” to “sometimes”. This is because the smaller group of subjects providing 3-month follow-up data had a higher reported level of need at baseline in this area than the overall group that reported baseline needs.

Page 23 TriWest Group Kinship Navigator Six-Month Pilot Evaluation Report
Changes in Top Baseline Caregiver Needs After Three Months5
1 1.5 2 2.5 3 3.5 4 4.5 5 5.5 6
Help getting/keeping public assistance
Dental care for family
Help learning to be more effective parent
Time to do fun things with family
Someone to talk to about child(ren)
Legal assistance (adoption/custody)
Someone to talk to about getting help for child
Info on where to get help
Help with social services
Kinship support groups
Understanding govt. agencies
Time to do things for yourself
Extra money for needs/bills
5 Please note that average baseline need scores were computed across all 150 baseline surveys. Follow-up survey data was only available for 66 participants. As a result, the baseline needs scores shown in the table are different from those computed for the overall group. It should also be noted that two categories in the chart (“Information on where to get help” and “Someone to talk to about getting help for your child”) did improve a great deal. However, the study’s sensitivity to statistically demonstrate improvements for these two items was limited due to a smaller sample size (n=24 and n=22) than the other items (n=66) that resulted from a database error in the initial phase of the pilot.
Never Almost Never Sometimes Often
Almost Always Always
Significant Improvement
Significant Improvement
Significant Improvement
Significant Improvement
Significant Improvement Significant Improvement
Improvement (see note)
Improvement (see note)
Significant Improvement
Baseline
3 Months

Page 24 TriWest Group Kinship Navigator Six-Month Pilot Evaluation Report
Sixteen needs fell into the “sometimes” range on average: Information on where to get help (mean of 3.4 across 100 caregivers); Someone to talk to about getting help for your child (mean of 3.4 across 105 caregivers); Legal assistance related to being a kinship caregiver (adoption or third party custody) (mean
of 3.4 across 150 caregivers); Someone to talk to about your child(-ren) (mean of 3.3 across 148 caregivers); Time to do fun things with your family (mean of 3.2 across 147 caregivers); Help learning how to be a more effective parent (mean of 3.1 across 147 caregivers); Dental care for your family (mean of 3.0 across 149 caregivers); Help getting and keeping public assistance (Medicaid, SSI, TANF, other) (mean of 3.1 across
148 caregivers); Help getting enough food daily for two meals for your family (mean of 3.0 across 149
caregivers); Respite care (someone to help care for my child when I need a break) (mean of 2.9 across
147 caregivers); Medical care for your family (mean of 2.9 across 149 caregivers); Help getting places you need to go for yourself (mean of 2.8 across 150 caregivers); Help transporting my child places, including appointments (mean of 2.7 across 148
caregivers); Mental health services for your child (mean of 2.6 across 147 caregivers); To belong to parent groups or clubs (mean of 2.6 across 146 caregivers); and Legal assistance related to benefits (Medicaid, Social Security, child support, other) (mean of
2.6 across 149 caregivers). Three months later, seven of the sixteen “sometimes” needs had improved:
Legal assistance related to being a kinship caregiver (adoption or third party custody) improved 0.7 from “often” to “sometimes” for the 66 caregivers completing two Family Needs Scales (n=66, t=2.3, p<.04);6
Dental care for your family improved 0.9 points to “almost never” (n=66, t=3.7, p<.001); Help getting and keeping public assistance (Medicaid, SSI, TANF, other) improved 0.9
points to “almost never” (n=65, t=3.1, p<.001); Medical care for your family improved 1.0 points to “almost never” (n=66, t=3.7, p<.001); To belong to parents groups or clubs improved 0.6 to “almost never” (n=64, t=2.1, p<.05); Help getting places you need to go for yourself improved 0.6 points to “almost never” (n=66,
t=2.9, p<.02); and Help transporting my child places, including appointments improved 0.4 points to “almost
never” (n=66, t=2.2, p<.05).
6 Please note that the baseline rating for the 66 caregivers who provided 3-month follow-up data was higher (“often”) than the rating for the overall group of 150 caregivers providing baseline needs data (“sometimes”).

Page 25 TriWest Group Kinship Navigator Six-Month Pilot Evaluation Report
Again, the seven improved needs fit the focus of the Navigator interventions: all involved help accessing a service. Two additional needs directly related to the Navigator intervention (“information on where to get help” and “someone to talk to about your children”) varied considerably after three months, but had too few respondents for adequate power to document statistical significance. Of the seven remaining needs that did not change significantly, four make sense. As with the money and time needs noted above, “time to do fun things” and “help getting enough food daily” are beyond the scope of the Navigator intervention’s design. Similarly, the needs of “someone to talk to about your children” and “help learning to be a more effective parent” are ongoing needs that one would not expect to resolve in three months. The three other needs (“respite care”, “mental health care for children”, and “legal assistance related to benefits” are needs for which the Navigator intervention might have helped the caregivers access resources, but for some reason did not. Eleven needs fell into the “almost never” range on average, even though at least one caregiver rated each of them as “always”:
Emergency health care for your family (mean of 2.4 across 148 caregivers); Emergency child care (mean of 2.3 across 148 caregivers); Help managing the daily needs of my child at home (mean of 2.2 across 148 caregivers); Special education services for your child (mean of 2.2 across 149 caregivers);7 Routine child care (mean of 2.1 across 147 caregivers); Help getting a place to live (mean of 2.1 across 149 caregivers); School services for my child (mean of 2.1 across 147 caregivers); Other legal assistance (mean of 2.1 across 149 caregivers); Assistance with alcohol or other substance abuse problems either for myself or family
member (mean of 1.9 across 147 caregivers); Help getting a job (mean of 1.7 across 149 caregivers); and Vocational training services for your child (mean of 1.6 across 147 caregivers).
Just one need fell into the “never” range on average at baseline, even though at least one caregiver rated this need as “almost always”: “Help enrolling my child in school” with a mean of 1.3 across 147 caregivers. Three months later, just one of the eleven lowest rated needs had changed significantly. “Emergency health care for your family” improved 0.6 from “sometimes” to “almost never” (n=64, t=2.5, p<.02).8 For the remainder, given multiple needs and the priority placed by the program on caregivers’ highest needs, it is not surprising that the lowest average needs did not change significantly. 7 A database error caused a significant portion of the data for this item to be lost. As a result, there were too few cases with three-month follow-up data to be tested for changes. 8 Please note that the baseline rating for the 66 caregivers who provided 3-month follow-up data was higher (“often”) than the rating for the overall group of 150 caregivers providing baseline needs data (“sometimes”).

Page 26 TriWest Group Kinship Navigator Six-Month Pilot Evaluation Report
Looked at in sum, finding significant improvement in 11 of 31 possible need areas (10 of the top 19) is a very positive result over three months time. What is more, the 11 need areas with significant positive improvement all fit the Navigator’s model of change. Had any of the models’ peripheral need areas changed significantly, we might instead suspect an across-the-board improvement in caregiver status independent from the Kinship Navigator program. Given that all improvements fit the model, the findings robustly argue for the pilot’s effectiveness in its targeted areas. The lack of a comparison group prevents a definitive conclusion, but the preponderance of the data strongly suggests success and these changes were replicated when the study period was extended across a greater range of time and more sites. Differences in Baseline Caregiver Needs There was sufficient data to look for differences in average baseline needs ratings between the Seattle and Yakima regions, between the AAA and Casey sites, and between the four individual sites, but not at changes in needs between baseline and 3 months. While these baseline differences are useful for exploration and program development, they should not be generalized beyond caregivers served by the programs and do not demonstrate broader differences between kinship caregiver needs in the two communities. 11 of the 33 need areas showed significant differences in baseline average scores between the Seattle and Yakima sites, with Seattle showing significantly greater need in all but one area. It is impossible to determine if Seattle has greater needs or if Seattle raters tended to assign higher scores. Several were consistent with Seattle caregivers’ greater emphasis on financial needs, documented in qualitative analyses conducted in the pilot’s first evaluation phase. 7 of the 33 need areas showed significant differences in baseline average scores between the AAA and Casey sites, with the Casey sites showing all of the significantly greater needs. Analysis of individual site data (see the table below; the highest rating for each need among the four sites is in bold9) suggests that the Seattle Casey program tended to have the highest ratings of baseline need among the four sites. Of the 15 need areas showing significant differences among the four sites, 14 areas had the highest rating at the Seattle Casey site. This suggests that higher need ratings at just the Seattle Casey site was a common factor leading to observed differences overall both between Casey and AAA sites and between the Seattle and Yakima regions.
9 Please note that sometimes the rating categories shown in the table are the same, even though the numerical average underlying the categorical rating differ significantly. The bolded item always has the highest numeric score.

Page 27 TriWest Group Kinship Navigator Six-Month Pilot Evaluation Report
Differences in Baseline Needs Between Caregivers at Four Individual Sites
Area of Need Seattle AAA Site Need Level (n)
Seattle Casey Site Need Level (n)
Yakima AAA Site Need Level (n)
Yakima Casey Site Need Level (n)
Needs Greatest for Seattle Casey Site
Other Legal Assistance Almost Never (20) Often (23) Almost Never (23) Almost Never (83) Help getting enough food daily for two meals for your family
Often (20) Often (23) Sometimes (23) Sometimes (83)
Help getting places you need to go for yourself Often (20) Often (23) Sometimes (23) Almost Never (84)
Help transporting my child places, including appointments
Sometimes (19) Often (23) Sometimes (23) Almost Never (83)
Someone to talk to about getting help for your child Sometimes (20) Almost Always (16) Sometimes (23) Sometimes (46)
Time to do things for yourself Sometimes (20) Almost Always (23) Often (23) Almost Always (82)
Help managing the daily needs of your child at home Almost Never (20) Often (23) Almost Never (23) Almost Never (82)
Respite care Almost Never (20) Often (22) Almost Never (23) Sometimes (82) Time to do fun things with your family Sometimes (20) Almost Always (22) Sometimes (23) Sometimes (82)
Help getting and keeping public assistance Sometimes (20) Often (22) Almost Never (23) Sometimes (82)
School services for your child Sometimes (20) Sometimes (22) Almost Never (23) Almost Never (82)
Help understanding government agencies Sometimes (20) Almost Always (21) Sometimes (23) Often (82)
Help dealing with social services Sometimes (20) Almost Always (20) Often (23) Often (82)
Information on where to get help Sometimes (19) Often (12) Sometimes (23) Often (46)
Needs Greatest for Yakima Casey Site Support groups for kinship
caregivers Sometimes (20) Often (22) Sometimes (23) Often (83)

Page 28 TriWest Group Kinship Navigator Six-Month Pilot Evaluation Report
Exploration of Program Costs and Benefits
In mid-December 2004, an idea was brought up in our monthly meeting with the Yakima program to try to add some exploration of costs and benefits to the final report. The notion was that the kinship caregivers seemed to be providing care in many cases that might otherwise have resulted in foster care placements for the children involved. Before going further, we examined conceptually the relationship between caregiver support of children and Navigator supports for caregivers. In the final two months of the pilot study we were not able to identify any method to document the specific impact of the Navigators on helping prevent costs in the foster care system. However, to the degree that the evaluation found that Navigators supported kinship caregivers in their efforts, we decided that it would be helpful to document the value of the kinship caregiver support itself. While we could not quantify the fiscal value of the Navigator services, if we could better quantify the value of the kinship caregiver supports, this would lend important background toward understanding the value of any Navigator services that had a positive impact on the continuity of those supports. While we could not determine the proportion of savings of foster care resources through kinship care attributable to the Navigators, we could at least define the range of potential savings supported by supporting the caregivers responsible for the savings. After exploring various ways to document which caregivers were caring for children who otherwise would have ended up in foster care, it was decided to add two additional ratings at the end of the Family Needs Scale (FNS). The first asked caregivers their opinion as to whether or not the children of kin in their care would have ended up in foster care had they not become their caregiver. The second asked the Navigator to give their opinion as a partial validity check. Given the simple design, respondents were asked to respond with a yes or no. This minor addition to the FNS questions was therefore approved and coordinated through Casey’s IRB process. This design limited the findings to only caregiver self-reports, validated only by the lay opinions of the Navigators based on their current communications with agency staff and caregiver self-reports. These estimates should therefore be viewed with caution given that they were based primarily on caregiver self-reports of their perceptions as to whether or not the kin for whom they care would have been placed in foster care without their involvement. Actual decisions to place a child in foster care are made by state agency personnel trained in the specific protocols and statutes involved in such a decision. Caregiver perceptions are not based on these technical factors, but instead on their memories of their communications with other parties (including in many cases state agency staff) and of events that transpired at the time that their kin came to live with them, events that lay people can view differently from professional case work staff. The study design did not include a mechanism for verifying these reports with additional information from such state agency staff. As a result, these exploratory findings should not be viewed as definitive estimates of whether or not foster care placements actually would have take place in the absence of caregiver involvement; the findings instead represent caregiver perceptions of the value of the role they serve. These questions were asked starting in mid-December of 2004 of all caregivers when completing either initial or follow-up FNS protocols. Through this approach, 107 of the 150 consented

Page 29 TriWest Group Kinship Navigator Six-Month Pilot Evaluation Report
caregivers in the study provided this additional information. In all cases the Navigators agreed with the caregivers’ assessments of whether or not foster care was averted through their involvement. We then used this information to try to estimate the number of months of foster care that would have been potentially incurred in the absence of these caregivers’ support. Several analytic steps led to the estimate: 1. We began with the families that responded that their support had averted use of foster care.
Eighty-seven of the families (81%) responded that foster care was averted. An additional six families (6%) reported that the children came to live with them after being in foster care. Fourteen families (13%) did not report that any level of foster care was averted.
2. We then used the demographic database for each family to count only the children of kin living in those homes, (excluding biological children, step-children, adopted children, and foster children of those parents from the analysis). Of the total 193 children of kin, 169 (88%) had either avoided or stepped down from foster care. Of those 169, 160 had avoided foster care and nine (9) had stepped down from foster care.
3. We then used the demographic database to sum the number of months that these 169 children had resided with their kinship caregivers. For these 169 children a total of 5,171 months was calculated. The average time in kinship care per child was 30.6 months.
4. Since 88% of the children of kin of caregivers responding to these questions had avoided or stepped down from foster care, we then extrapolated the average per child to 88% of the total 789 children of kin living with families involved in the study or 690 children.
5. To calculate the number of months foster care that was potentially averted for all children of kin served by the four Navigators, we multiplied 690 by the average of 30.6 months of time in kin care per child calculated from the sub-sample (see step 3 above) to yield an estimate of 21,140 months of foster care averted by the kinship care placements.
6. Of course, the Navigator program cannot take credit for a 30.6 month average stay with kin when the Navigators had only been helping out for several months on average. Average time of kinship service provided could not be calculated for all of these families due to errors in data entry for the Seattle Casey program during the extended evaluation period and the relatively short period of implementation evaluated for the AAA sites. Using only the Yakima data seemed problematic given the clear regional differences, so we used the average time receiving Navigator services calculated for the evaluation of the first twelve months of operations at both Casey sites of 3.9 months. Using an average time of kinship services provided to these families of 3.9 months and multiplying it by 690 yields an estimate of 2,694 months of kinship care supported by the Navigator program in its first sixteen months.
The evaluation design did not include the tracking of specific program costs, so the costs of these 2,694 months of averted foster care cannot be directly weighed against the costs incurred by the Navigator Program. However, these 2,694 months certainly offer a point of comparison when looking at program costs. Now that the feasibility and initial effectiveness of the Navigator Program has been documented through this pilot evaluation, it is recommended that future studied incorporate specific measures of program costs and a more rigorous control group design to document the actual costs and benefits of the program.

Page 30 TriWest Group Kinship Navigator Six-Month Pilot Evaluation Report
Conclusions and Recommendations
Looked at in total, these evaluation results are clearly positive and provide about as robust a finding of program effectiveness as was possible given the evaluation methods used. In terms of the two primary evaluation questions identified for this report, the first focused on whether the positive results documented in the first six months of the pilots were sustained over the entire 16 month period for the Casey sites. The answer to this is clearly affirmative, given that the findings of the extended evaluation replicate and in many cases document even more strongly the major findings from the evaluation of the initial pilot period, including:
Findings of significant positive change in 11 of 31 possible need areas and 10 of the 19 most important, which is a very positive result over three months time. Furthermore, the 11 changes were all in areas that fit the model of change underlying the intervention, suggesting that changes occurred in areas targeted by the intervention, but not in areas not targeted by the intervention.
Significantly exceeding the initial projection of the number of caregivers served over the evaluation period by serving 443 families that were caring for 767 children of kin. An additional 196 caregivers received informational support through the program.
A total of 1026 hours of caregiver services across 2056 encounters were provided, all targeting the areas of need originally envisioned and further validated as needed through the baseline quantitative assessments of family needs.
Provision of services to a diverse array of caregivers and their children that generally reflects the demographics of the communities served and target groups prioritized.
A total of 101 agency services were provided, impacting a total of 1843 people. The service delivery infrastructure in Yakima and Seattle differed and these differences led
to different priorities for the Navigator programs in each region. The Seattle program required more effort to identify and engage the wide array of service providers, and the Yakima program required more effort to provide direct supports to caregivers given the relative lack of existing kinship service resources there. The Navigator services provided also reflected this difference, with a greater emphasis in Seattle on referrals, information and supportive listening provided primarily by telephone and a greater emphasis in Yakima on follow-up linkages and advocacy provided primarily in person.
Significant and varied needs in multiple areas were documented for the caregivers served, evidence of the very significant, multiple and diverse needs experienced by kinship caregivers. Even though many needs were not experienced very often on average, every need area had at least one caregiver report it as “almost always” a need at baseline. In addition, caregivers served by the Seattle Casey program had more frequent needs reported in many areas.
Program challenges were few and primarily reflected the need to adapt to the different service needs of the two regions. The one lesson learned was to put more emphasis on administrative and data tracking skills than was initially foreseen.
In terms of the second primary evaluation question of whether there are indications that the positive results demonstrated in the Casey sites were replicated in the first one to three months of operations at the AAA sites, the answer is again affirmative, at least for the short time period examined. Other than an initial pattern of AAA sites serving far fewer caregivers of kin involved

Page 31 TriWest Group Kinship Navigator Six-Month Pilot Evaluation Report
with Child Protective Services than Casey sites, no major differences were found that did not also characterize the first few months of the implementation at the Casey sites. If anything, implementation was more rapid, building on the base of awareness across caregiver-serving agencies that the Casey sites had established. The AAA sites also resembled the Yakima Casey site more in their pattern of service delivery (more follow-up linkages, fewer referrals), but also had some emphases similar to the Seattle Casey site (more supportive listening, more informational contacts). The differences do not fit a particular pattern overall, suggesting that each site is responding with a somewhat different set of service emphases, but within the same general range. As noted throughout this report, the methods available to this evaluation and its formative nature preclude a full definitive assessment of the program’s effectiveness and value. In particular, the lack of a comparison group keeps us from concluding if the findings would generalize to caregivers beyond those in the study. However, the preponderance of the data available points in that direction which leads to the interim conclusion that the program is strongly associated with positive change in the areas of need targeted. Furthermore, these changes were replicated when the study period was extended across a greater range of time and more sites. Given this, we offer three policy recommendations:
1. Sustain the existing program capacity; 2. Increase the scope of the program across time and more sites in order to make its clearly
documented benefits more widely available, as well as to facilitate more definitive evaluation of its effects and their durability over time; and
3. As the program is sustained, create opportunities to extend this research by creating an evaluation that has a benefit-cost component so that the economic benefits of this program can be more fully documented.

Page i TriWest Group Kinship Navigator Six-Month Pilot Evaluation Report
APPENDIX ONE
Casey Family Programs Kinship Caregiver Navigator Pilot
Final Pilot Evaluation Report (July 1, 2004 through February 18, 2005)
March 2005
Prepared for Casey Family Programs
6549 1st Avenue NW Seattle, WA 98117
206.612.8564

Page 0 TriWest Group Kinship Navigator Six-Month Pilot Evaluation Report
Table of Contents Executive Summary ....................................................................................................... i Introduction and Methods ............................................................................................ 1 Case Studies of Four Kinship Caregivers................................................................... 5 Description of Services Provided and Caregivers Served ........................................ 9 Baseline and Three-Month Caregiver Needs ............................................................ 17 Satisfaction with Navigator Services......................................................................... 23 Qualitative Assessment of Program Components................................................... 24 Exploration of Program Costs and Benefits ............................................................. 32 Conclusions and Recommendations ........................................................................ 34
Page i TriWest Group Kinship Navigator Six-Month Pilot Evaluation Report
Executive Summary In collaboration with the Washington State Kinship Oversight Committee, Casey Family Programs implemented the Kinship Navigator project in July 2004. The project responds to a mandate from the 2003 Kinship Care Bill (SHB-1233) passed in the Washington State Legislature. Two contract positions were created, one in Yakima (DSHS Region 2) and one in Seattle (DSHS Region 4). This Final Pilot Evaluation Report focuses on the first seven months of the pilot, from mid-July 2004 when the Navigators were hired through mid-February 2005. In that time, 223 total kinship caregivers received either information or navigator services. Of those, 148 adults (92 in Yakima and 56 in Seattle) caring for 372 children (224 of whom were children of kin) received documented navigator services, exceeding by 85% the initial goal to serve 80 caregivers. The evaluation focused on these caregivers and the subset of 97 who provided additional information on their family needs. An additional 75 caregivers received brief informational services over the telephone. The evaluation results are clearly positive and provide about as robust an initial seven month finding of program effectiveness as was possible given the evaluation methods used and the short period of time of the pilot and evaluation period. Based on this study’s comprehensive review of these services and their associated outcomes, the report concludes with two policy recommendations: (1) Sustain the existing program, and (2) Increase the scope of the program across time and more sites in order to facilitate more definitive evaluation of its effects, their durability over time, and cost-benefits. Case Studies of Four Kinship Caregivers The report begins with four case summaries profiling two caregivers from each of the pilot programs. These stories detail typical and exemplary levels of help provided by the program. Description of Services Provided and Caregivers Served Services delivered exceeded by 85% the initial projection of 80 caregivers served over the evaluation period by serving 148 families and caring for 224 children of kin. An additional 75 caregivers received informational support through the program. A total of 404 hours of caregiver services across 829 encounters were provided, all targeting the areas of need originally envisioned and further validated as needed through the baseline quantitative assessments of family needs and focus groups. Services were provided to a diverse array of caregivers and their children that generally reflected the demographics of the communities served and target groups prioritized. While the addition of a bilingual capacity in a setting like Yakima would undoubtedly increase the proportion of services going to Spanish-speaking people there, the use of interpreters supported a few such services being delivered even through the pilot. Demographic and family information includes:
Average age was just over 50 years (50.1), and the age range was 21 to 83 years. Most were female (just under 95%); only eight caregivers served were male. Of the caregivers for whom data on race and ethnicity was available (n = 144), 40% (57)
were non-Hispanic White, 31% (44) were African American, 15% (21) were Hispanic, 9%

Page ii TriWest Group Kinship Navigator Six-Month Pilot Evaluation Report
(13) were American Indian / Alaskan Native, 1% (1) was Asian American, and 6% (8) multiracial. There were differences in the distribution of race and ethnicity between the two sites, with 74% (39) of Seattle participants African American and larger numbers in Yakima of non-Hispanic White (49 or 54%), Hispanic (18 or 20%), and American Indian / Alaskan Native (13 or 14%) participants. Most (96% or 135) spoke English; 4% (6) spoke Spanish.
In Seattle, 43 caregivers reported a total of 105 non-adult household members. In Yakima, 92 caregivers reported 237 non-adult household members.
Legal status was tracked. In Seattle, the largest group (27%) had no legal status established (19), 25% (18) guardianship, 18% (13) biological children, 2% (1) foster children, and 28% (20) other types of legal status (custody, temporary custody, or custody in process). In Yakima, the largest group (36%) had no legal status established (85), 27% (64) biological children, 12% (29) guardianship, 1% (3) foster children, and 23% (53) other types of legal status (some type of custody or dependents of the state).
Excluding biological, adopted, and step-children, average time living with the caregiver for kin was 4.5 years in Seattle and 2.4 years in Yakima.
For relationships, most were grandchildren (70% in Seattle, 40% in Yakima), followed by biological children (17% in Seattle, 26% in Yakima), nieces/nephews (10% in Seattle, 23% in Yakima), fictive kin (5% in Yakima), cousins (2% in Yakima), step-children (1.5% in Seattle, 1% in Yakima), siblings (1% in Yakima), and other (1.5% in Seattle, 2% in Yakima).
Half of the children were boys, half girls. In terms of race and ethnicity, breakdowns were similar in Seattle between caregivers and children. In Yakima, a larger percentage of children were Hispanic (41%) than was observed for the Yakima caregivers (20%).
The service delivery infrastructure in Yakima and Seattle differed and these differences led to different priorities for the Navigator programs in each site. The Seattle program required more effort to identify and engage the wide array of service providers, and the Yakima program required more effort to provide direct supports to caregivers given the relative lack of existing kinship service resources there. The Navigator services provided also reflected this difference, with a greater emphasis in Seattle on information and referrals and a greater emphasis in Yakima on support, linkages and advocacy.
In Yakima, 92 caregivers received 679 service encounters, taking 320 hours. Service encounters involved the provision of information and referrals (42% of contacts, 51% of time), linkages and advocacy (25% of contacts, 27% of time), supportive listening (19% of contacts, 13% of time spent), and other activities (15% of contacts, 9% of time).
In Seattle, fewer caregivers were served (56) and fewer hours of service provided (150). This was primarily due to the Seattle program needing to spend more time involved in relationship building and coordination with the wide array of agencies currently serving kinship caregivers. Seattle provided 74 agency services (as opposed to 34 in Yakima), reaching over 1000 people (versus just over 300 in Yakima).
The pattern of services delivered also differed in Seattle, with 78% of contacts and 54% of time involving the provision of information and referral, and the remainder divided among linkages (7% of contacts, 10% of time), supportive listening (4% of contacts, 4% of time), and other activities (10% of contacts, 17% of time). No advocacy was provided in Seattle.

Page iii TriWest Group Kinship Navigator Six-Month Pilot Evaluation Report
Baseline and Three-Month Caregiver Needs Significant and varied needs in multiple areas were documented for the caregivers served, further documenting the very significant, multiple and diverse needs experienced by kinship caregivers. Even though many needs were not experienced very often on average, every need area had at least one caregiver report it as “almost always” a need at baseline. In addition, Seattle caregivers reported more frequent needs in many areas. Findings of significant positive change were found in nine of 31 possible need areas, a very positive result over three months time. Only one area worsened. What is more, the nine positive changes were all in areas that fit the model of change underlying the intervention. Had any of the need areas less centrally related to the model changed significantly, we might instead suspect an across-the-board improvement in caregiver status independent from the Kinship Navigator program. Given that all changes fit the model (including the one area that worsened), the findings robustly argue for the pilot’s effectiveness in the areas it targeted. The lack of a comparison group keeps us from concluding this definitively, but the preponderance of the data available points in that direction. Satisfaction with Navigator Services In terms of overall helpfulness, 93% found the program to be “Often” to “Always” helpful, including 100% of the 32 Yakima respondents. Extremely high rates of satisfaction were found with the Navigator services, with 98% either “Very Satisfied” (81%) or “Satisfied” (17%). Only one out of 42 caregivers interviewed expressed dissatisfaction. Specific comments made by the caregivers typifying these overwhelmingly high levels of satisfaction included:
“I have nothing but good things to say about [the Navigator] and this program.” “It’s a great and awesome program.” “In my opinion, this is the best social program I’ve seen… It works. It would truly be worth
the money from the government.” In addition, unanimous endorsement of the program as deserving continuation was given by both the 42 satisfaction survey respondents and the 18 participants in the final round of focus groups who provided ratings. Qualitative Assessment of Program Components The focus group findings on needs addressed by the program generally reflected the same array of needs documented in the quantitative findings (information needs, financial needs, legal needs, and linkages to specific supports). With the exception of direct help with financial needs, all of these areas fit into the initial legislative and oversight committee vision for the project. If help linking to financial supports is considered, then all major needs were addressed to some degree by the program. What is more, all of these areas showed significant improvement over the three month period, including help accessing financial supports. In the first round of focus groups, five needs stood out as among the most important: 1. Information and knowledge – This was identified as one of the most important needs in
both groups and had the highest average scores from the 10 Yakima caregivers. 2. Kinship caregivers have less legal authority – This was the next highest rated theme in
Yakima and also emphasized by the Seattle caregivers. The lack of legal rights to carry out

Page iv TriWest Group Kinship Navigator Six-Month Pilot Evaluation Report
caregiving functions was detailed by both groups, with an additional emphasis on the perceived bias in systems toward biological parents and less respect for kinship caregivers.
3. Financial needs – This was the most emphasized need in the Seattle group and tied for third highest ranked in Yakima. Caregivers discussed being overextended financially and often lacking funds for basics such as clothing, school supplies, and housing.
4. Legal assistance – Caregivers in both groups also stressed the need for affordable and qualified legal assistance from professionals knowledgeable about caregiver needs and family law.
5. Special needs resources – Caregivers in both groups also emphasized resources for children with special needs, including specialized child care, educational supports, mental health supports, transportation, specialized supports for adolescents, and supports to address multiple challenges at once.
The second round of focus groups examined the helpful features of the Navigator Program. Those identified on average across both groups as among the most important included: 1. Understanding of kinship caregiver needs – Participants gave the highest average rating to
this feature, stressing the importance of being “sensitive to needs” and “helping [caregivers] figure out their needs.”
2. Helping with benefits and paperwork – Examples of help filling out forms, particularly complex forms related to custody, were discussed and similar help to access benefits. The emphasis in Yakima was on custody paperwork, and the emphasis in Seattle was on benefits, consistent with the different needs documented at each site in the quantitative data
3. Knowledge and expertise regarding local kinship caregiver supports – Participants focused on being “full of knowledge across programs” and being “well informed.”
4. Availability to talk when upset or about problems – Participants focused here on support and talking, including listening skills and timely responses.
Program challenges identified were few and primarily reflected the need to adapt to the different service needs of the two regions. The challenges differ between the urban setting of Seattle and the more rural setting of Yakima. In Yakima, the primary challenge is having too few providers. While gaps in funding and a lack of specialized kinship caregiver supports was also noted in Seattle, Yakima needs seemed exacerbated by the shortage of service providers and their need to provide services across large geographic areas. Yet, because of the small number of key service providers, the Yakima program has a smaller group of providers with which to coordinate. While Seattle Navigator program staff had more provider resources to draw on, their sheer number made coordination and the establishment of collaborative relationships more challenging. Additionally, the sense of need in Yakima may have made agencies more willing to respond actively to Navigator outreach efforts. The primary lesson learned was to put more emphasis on administrative and data tracking skills than was initially foreseen. In addition to helping caregivers with a broad array of needs, the administrative tasks of tracking services and managing data both to support service delivery and the evaluation required an additional set of skills. Navigators are not just helpers. They are also expected to document needs and support advocacy efforts that require information management skills. This need was identified early and additional training and support was provided by Casey Family Programs, but the lesson learned was that administrative expectations need to be

Page v TriWest Group Kinship Navigator Six-Month Pilot Evaluation Report
incorporated more robustly into the selection, training and orientation process. In addition, feedback to supervisors and database links to enable supervisors to track progress should be implemented from the outset of implementation. Exploration of Program Costs and Benefits It was observed anecdotally five months into the program that kinship caregivers seemed to be providing care in many cases that might otherwise have resulted in foster care placements for the children involved. While it was beyond the scope of this study to determine the proportion of savings of foster care resources through kinship care attributable to the Navigator Program, we were able to estimate the range of potential savings supported by supporting the caregivers responsible for the savings. Using estimates of need for foster care provided by the Navigators and 44 caregivers surveyed in the last two months of the project, we estimated that approximately 213 children had foster care use averted by the provision of kinship care. Using the average time that Navigator Program services were provided to these families of 3.4 months, we estimated that 724 months of kinship care substituting for foster care were supported by the Navigator Program over seven months. The evaluation design did not include the tracking of specific program costs, so the costs of these 724 months of averted foster care could not be directly weighed against the costs incurred by the Navigator Program. However, these 724 months offer a point of comparison when looking at program costs. Now that the feasibility and initial effectiveness of the Navigator Program has been documented through this pilot evaluation, it is recommended that future studied incorporate specific measures of program costs and a more rigorous control group design to document the actual costs and benefits of the program.

Page 1 TriWest Group Kinship Navigator Six-Month Pilot Evaluation Report
Introduction and Methods In collaboration with the Washington State Kinship Oversight Committee, Casey Family Programs implemented the Kinship Navigator project in July 2004. This project was carried out in collaboration with the Washington State Department of Social and Health Services (DSHS) under a mandate from the 2003 Kinship Care Bill (SHB-1233) passed in the Washington State Legislature. Two contract positions were created, one in Yakima (DSHS Region 2) and one in Seattle (DSHS Region 4), to assist kinship caregivers with understanding and navigating the system of services for children in out-of-home care, and to reduce barriers faced by kinship caregivers when accessing services.
The project was based on the following assumptions:
Kinship caregivers find access to services difficult. Many kinship caregivers find the “system” cumbersome and difficult to navigate and describe widely varying levels of helpfulness, professionalism, and knowledge among service providers.
The establishment of “Kinship Navigators” as community-based positions would provide a local and consistent direct service function to assist in reducing or eliminating systems barriers for kinship families attributed to navigating multiple family and child-serving resources.
Providing kinship families with information and support and facilitating access to services before situations reach crisis can potentially reduce the number of families who later present with chronic situations and require more costly and intensive system interventions.
Evaluation Approach: Casey Family Programs contracted with TriWest Group to conduct the formative evaluation of its Kinship Navigator project between July 2004 and March 2005. The goal of the evaluation was to inform the implementation of the pilot and to determine the extent to which it increases awareness of and access to needed supports for the kinship caregivers served during the initial six months of implementation. The evaluation includes three-month and six-month reports to Casey Family Programs that will be shared with the oversight committee to inform their interactions with the legislature and other decision-makers regarding the future of kinship navigator initiatives in Washington. TriWest designed the evaluation to answer two research questions: 1. What are the components of the Navigator intervention model set forth in the legislation and
prioritized by stakeholders and to what degree did implementation adhere to the principles of the model?
2. To what degree did kinship caregivers served by the Navigators change in their awareness of and access to needed supports in the community?
This report focuses on the first seven months of program operations in an effort to provide an answer to these two questions. Evaluation Design: The evaluation was formative in design and therefore sought primarily to describe and inform the pilot project and document the degree to which caregivers served through the project changed in their awareness of and access to needed supports. The evaluation employed a simple pre/post design with no comparison group. The results demonstrate the

Page 2 TriWest Group Kinship Navigator Six-Month Pilot Evaluation Report
process goals intended for the project, the degree to which the project was faithful to those goals, and the degree to which parents involved changed in their self-reported awareness of and access to needed supports following receipt of Navigator services. It should be noted that the lack of a control group and relatively short period of implementation tracked for this report limits the ability to generalize the report findings. The results simply describe what happened during the first seven months of this project. It is therefore important to interpret the findings with caution and to understand them to be in keeping with the nature of this project as a pilot. While the overall direction of the results is positive and the multiple positive findings are persuasive as to the pilot’s achievement of its goals, more rigorous evaluation including a control group would help compare these results to the situations of other kinship caregivers, and a longer period of evaluation is needed to determine if the positive changes found are sustained over time. Nevertheless, the results of this pilot evaluation clearly document the positive impact of the kinship navigators in the lives of the people participating in the pilot. Subjects: The evaluation sought to involve all of the caregivers served by the Navigators over the first seven months of implementation (mid-July 2004 through mid-February 2005). The two Navigators were expected to serve about 80 kinship caregivers over the entire six months of the evaluation with information, referrals, and linkages to community agencies. These targets were greatly exceeded, with 148 caregivers receiving documented services in the first seven months of operations which are the focus of this evaluation and many more contacting the program for information and lesser needs. Analyses involving anonymous data sets were conducted for all 148 caregivers served. Analysis of individually identifiable data regarding family needs was conducted for the subset of 97 caregivers that gave written consent to participate in the formal evaluation. This was a sufficient sample to both describe baseline caregiver needs, assess changes over time across the entire program, and identify differences in need profiles between Yakima and Seattle caregivers. Two additional subsets of caregivers were selected and asked to consent to be involved in focus groups conducted in early October and early January. Participants received a $20 stipend for their participation in a focus group. Participants in the first set of focus groups were identified by the two Navigators as typical of caregivers served and invited to participate. The first round took place in October (one in Seattle and one in Yakima) to inquire about the needs of kinship caregivers and their views on how the Navigators could best respond to them. This information, combined with the quantitative information regarding caregiver needs, was used to assess the degree to which the project is serving the people it was intended to serve. The second round of focus groups took place in January (again one in Seattle and one in Yakima) to inquire about the ways in which the Navigator was most helpful to the kinship caregiver. Participants in this set of focus groups were identified by the two Navigators as typical of caregivers helped by the program, and the groups focused on what factors were found to be most helpful. This information, combined with the satisfaction survey results and caregiver

Page 3 TriWest Group Kinship Navigator Six-Month Pilot Evaluation Report
interviews, was used to assess the helpfulness of the Navigators and the value of the pilot program. A final set of participants was recruited for in-depth interviews to better understand the process whereby Navigators worked with them. Two caregivers were recruited from each site. Caregivers were identified through a multi-step process. First, the Navigators identified several caregivers who they believed were helped by the program, some more so that average and some to be more typical of the overall group. These cases were then reviewed with the evaluation team and Family Needs Scale data were used to compare them to the overall group of caregivers served in each site on baseline needs. From each site, one caregiver was selected to represent those most helped and one to represent a more typical case. All of those identified were willing to participate. Participants received a $30 stipend for their participation in the interview.
Human subjects protection: Two levels of data were used in the evaluation. One set involved anonymous data and did not require informed consent; the other included individual identifiers and primary collection by the evaluation of personal information. The anonymous data set involved program information collected by the Kinship Navigators. This data set was collected through a Microsoft Access database that generated a de-identified report of demographic factors (race/ethnicity, gender, year of birth) and contact summaries (number, types, and month of contact). This anonymous data set was analyzed without any identifying information to describe caregiver and family demographics, as well as Navigator service use. The pre/post component of the study involved confidential self-reported needs assessment data. While this information was described by the Navigators as helpful in targeting needed assistance, it was collected primarily as a component of the evaluation and was therefore only collected for caregivers that gave consent to be involved in the study. Discussions with the Navigators and CFP program staff working with them led us to develop a collaborative approach for obtaining consent. TriWest evaluation staff provided training for the two Navigators in the consent process and the rights of evaluation participants. The Navigators then reviewed the consent form with each caregiver during their initial contact. The initial program contact with the Navigators tended to be in person, during which the Kinship Navigators obtained basic demographic information and sought written consent to participate in the evaluation. When the initial contact was not in person, the Navigators explained the study and the consent form over the phone and mailed the form to the caregivers to sign and return. As a quality check on this process, TriWest evaluation staff randomly selected five caregivers who consented to be involved in the study from Region 2 and another five from Region 4 (10 caregivers total). These 10 were selected out of the first 20 caregivers enrolled in the study. The TriWest evaluation staff person contacted the caregivers by phone to verify that all questions were answered and that the caregiver did indeed freely consent to be involved in the study. This was done to identify any quality issues regarding the consent process. Based on our review of these findings, TriWest evaluation staff are confident that study participants did indeed provide voluntary informed consent.

Page 4 TriWest Group Kinship Navigator Six-Month Pilot Evaluation Report
Final Evaluation Report Format: As noted above, this evaluation report focuses on the first seven months of the pilot. The report includes the following sections:
Case Studies of Four Caregivers Served – This section presents four case studies of kinship caregivers served by the program in order to provide a framework for understanding how discrete program and evaluation elements came together in the lives of individual caregivers. These stories bring together quantitative service and outcome data, as well as qualitative details that are examined across all caregivers systematically in the following sections.
Description of Caregivers Served – This section describes the demographic and family characteristics of the 148 caregivers receiving documented services through the pilot. It also describes the services provided to them.
Baseline and Three-Month Caregiver Needs – This section reports the baseline and three-month follow-up results of the Family Needs Scale, which was used to assess caregiver needs for the 97 caregivers who provided consent to be involved in the larger evaluation.
Satisfaction with Navigator Services – This section outlines the results of satisfaction surveys conducted with 42 caregivers who received 3 months or more of services.
Qualitative Assessment of Program Components – This section uses the results of the focus groups and caregiver interviews, as well as interviews with oversight committee members and project staff to interpret the quantitative results reported in the previous three sections and determine the degree to which the project adhered to its programmatic goals and what model components were perceived as most useful.
Exploration of Program Costs and Benefits – This section takes a preliminary look at the program’s costs and potential scope of benefits, focusing on the number of months children resided in kinship care as opposed to state-funded foster care.
The report concludes with a discussion of conclusions and recommendations. Two policy recommendations are reached based on an overall review and synthesis of pilot findings: 1. Sustain the existing program, and 2. Increase the scope of the program across time and more sites in order to facilitate more
definitive evaluation of its effects, their durability over time, and cost-benefits.

Page 5 TriWest Group Kinship Navigator Six-Month Pilot Evaluation Report
Case Studies of Four Kinship Caregivers
To set the stage for understanding the impact of this program on the lives of individual kinship caregivers, we begin the evaluation report by presenting four case studies of individual caregivers served by the program. These individual stories bring together quantitative service and outcome data, as well as qualitative details that are examined across all caregivers systematically in the following sections. Before presenting those more systematic details, the case studies are offered to provide a framework for understanding how these discrete program and evaluation components came together in the lives of four of the 223 caregivers served through this program. In-depth interviews to document qualitative factors involved in the delivery of Navigator services were conducted with two caregivers in each region – one selected as representing typical levels of help received by caregivers in the region and the other selected to represent exemplary levels of helpfulness received. All four interviews were conducted in February 2005. Caregivers were identified through a multi-step process. First, the Navigators identified several caregivers who they believed were helped by the program, some more so that average and some to be more typical of the overall group. These cases were then reviewed with the evaluation team and Family Needs Scale data were used to compare them to the overall group of caregivers served in each site on baseline needs. From each site, one caregiver was selected to represent those most helped and one to represent a more typical case. All of those identified were willing to participate and two provided the additional help of reading through a draft of their story to make sure they supported how we reported what they told us. The other two were offered this, but declined. All four participants each received a $30 stipend for their participation in the interview. The interviews yielded pictures of caregivers who received exemplary and typical levels of service from the Navigator programs. They pull together many of the themes documented separately in the quantitative and focus group discussions of caregiver needs and the descriptions of services provided by the Navigators. To make the interview descriptions read better, we used fictional names made up for each of the caregivers. The names used below are not real. The two Seattle interviews both involved African American grandmothers representing the status of most of the Seattle caregivers served. The emphasis in both cases was on information and referral supports, as well as the qualitative Navigator factors highlighted in the focus groups as most helpful: understanding, help with paperwork, and knowledge. The Yakima interviews involved one American Indian great aunt and one elderly non-Hispanic White grandmother, reflecting the greater breadth of diversity served by that program. The services received by these caregivers also involved primarily referrals and linkages, but also the greater emphasis on advocacy and direct support that characterized the Yakima program. Finally, all four caregivers described the situations that gave rise to their involvement with the children of kin for whom they now provide care. In each case, issues significant enough to

Page 6 TriWest Group Kinship Navigator Six-Month Pilot Evaluation Report
warrant foster care in the absence of kinship care were described which was, again, typical of the caregivers served through this project. Seattle Exemplary Interview – “Vivian” Vivian is a retired, disabled 61 year-old African-American grandmother and the mother of four adults, all of whom have had trouble with the law that has resulted in her grandchildren being left in her care. Prior to coming into contact with the Navigator program, the FBI arrested two of her children and she was called to pick up six of her grandchildren immediately to come live with her. At this point, all four of Vivian’s children were in jail at the same time, and she therefore had 10 grandchildren living with her. Just prior to beginning to receive Navigator services, five of those grandchildren went back to live with their parents, so Vivian had five, ages 6 to 17, living with her. Vivian came into contact with the Seattle Kinship Navigator through a grandparents’ support group last fall and says about the Seattle Navigator: “She has been a lifesaver because she cares, she understands what I’m going through . . . I most appreciate the fact that [the Seattle Navigator] cares. If there is information out there, she makes sure she gets the information to the people who need it.” The Seattle Navigator helped Vivian’s family get “adopted” by a Seattle City department for the holidays which was cited as a tremendous help by Vivian: “This adoption surprise helped us with daily things like toothpaste and toilet paper, but also a brand new Dell computer and printer. I mean state-of-the-art!” Another issue involved housing. Because five of Vivian’s grandchildren went back to living with their parents, the information Vivian had filled out on her Section VIII housing forms was no longer correct. Because of this, she and her grandchildren were in danger of losing their home. Vivian called the Seattle Navigator to enlist her help. According to Vivian, the Seattle Navigator was instrumental in saving Vivian’s Section VIII status and therefore her housing. The Seattle Navigator helped arrange for a hearing with the Section VIII division, she was able to get legal assistance from the Aging and Disability Services Department, and she also contacted state Representative Pettigrew’s office for advocacy in support of the process. Vivian found this all very helpful: “Without the Navigator’s help, we would have been homeless.” Vivian believes that all of her grandchildren would have ended up in state custody were she not available to care for them. Vivian anticipates that three of the five grandchildren living with her now will still be with her in a year. She is hoping that two of the children can return to living with their mother once she is released from jail. “I continue to use [Seattle Navigator] as a resource now. My needs were not a one-time need. I’ll still need her for information. With raising children, you never know what you’re going to need!” Seattle Typical Interview – “Althea” Althea is an African-American grandmother who is 56 years old, employed full time and caring for one 3 year old grandson has lived with her since he was 18 months old. He had been in foster care previous to coming to live with Althea, after his mother lost custody through Child Protective Services related to her drug use. Her grandson’s father is reportedly alcoholic and in

Page 7 TriWest Group Kinship Navigator Six-Month Pilot Evaluation Report
jail. The State had custody of her grandson, and Althea believes that if she had not taken him in he would have continued to be placed in the foster care system. Althea and the Seattle Navigator both belong to a grandparents’ support group. Althea reported that the Seattle Navigator was most helpful to her by providing information that otherwise would have been difficult to access and by helping Althea understand her communication with DSHS. “Since [Seattle Navigator] is inside the system, she can get information more easily. She has a doorway to get information that we on the outside don’t have.” Documented supports that Althea has received include help with TANF benefits, links to legal resources to help with adoption, clothes for her child, and supportive listening. Althea would like to seek legal custody of her grandson so that he can be with her permanently. Althea also noted that she appreciated that the Seattle Navigator always remained patient and calm. Yakima Exemplary Interview – “Cheryl” Cheryl is a multi-racial (American Indian and White) 38 year-old who cares for her 12 year-old great niece and 6 year-old great nephew, in addition to her own three children ages 7 to 13. Cheryl reported that she learned of the Kinship Navigator program through another kinship caregiver family and called the Yakima Navigator to get help obtaining custody of her great niece and nephew. Cheryl noted that the Yakima Navigator was instrumental in walking Cheryl through the steps to obtain custody of her great niece and nephew, helping with judicial paperwork, getting legal assistance, communicating with police, arranging welfare payments for the children, and ongoing supportive listening. Once custody was established, the Navigator helped Cheryl get connected with Catholic Family Services which helped pay their bills and get groceries at Christmas time. Cheryl most appreciated that the Yakima Navigator was “non-judgmental, strong-willed, and dedicated to her job.” Cheryl noted that she very much needed the Yakima Navigator’s help one day when her sister took her grand-nephew from her home. Cheryl reported that the Navigator helped her from 9:00 am until 10:00 pm as they searched for her great-nephew and met with police. “[Yakima Navigator] was there with me through it all. . . Without [Yakima Navigator] I don’t think the police would have listened to me.” On another occasion, the Yakima Navigator helped Cheryl gain temporary custody of her great-niece and great-nephew, meeting her at the court in the morning to help with paperwork and staying through the afternoon until the hearing was over. Cheryl now has custody for one year and believes that they will be living with her for at least another couple of years because of their mother’s continuing drug addiction and involvement as a prostitute. Before taking in her great niece and nephew, Cheryl reported that CPS and the police were called several times to intervene, as the children were not in school and were running around without clothes. Cheryl noted that foster care was never an option in her view because “I would have gone to get them first. That is our family’s culture.” Cheryl reported that she plans to continue to use the Yakima Navigator as a resource because she wants to get her great-niece and great-nephew into counseling. “She has connections to a lot of

Page 8 TriWest Group Kinship Navigator Six-Month Pilot Evaluation Report
resources. She makes things happen. People don’t say no to [Yakima Navigator]! She gets things done.” Yakima Typical Interview – “Sophie” Sophie is an 83 year-old non-Hispanic White grandmother who has permanent legal custody of her 6 month-old grandson. Sophie is retired and divorced and learned about the Kinship Navigator program from her ex-daughter-in-law. When Sophie first called the Yakima Casey Family Program office and spoke with [Yakima Navigator] about getting custody of her grandson she noted that she was told: “Come right on in. I can help you.” Sophie reported that she most appreciated that the Navigator gave her confidence that she could get custody of her grandson even though others had told her she was too old. Sophie feared she would try to get custody of her grandson but would be denied or worse in her view, she would get custody, grow attached, and then the Court would take him away. “[Yakima Navigator] gave me so much confidence. I couldn’t have done this without [Yakima Navigator]. I wouldn’t have known what to do without [Yakima Navigator]. The thought of Court scares me to death. I get upset and sick when I don’t know what to do. But if I know what to do and have someone like [Yakima Navigator] then I can go forward.” The Yakima Navigator helped Sophie fill out all of the custody papers and walked her through the legal process. Once custody was established through the family court judge, the Kinship Navigator helped Sophie get a crib, car seat, and changing table from the Central Washington Foster Parents Association. She also helped Sophie learn about available grants, where to get clothing, and about occupational therapy resources for the child at the Children’s Village in Yakima. She also surprised Sophie with a Thanksgiving basket. “I’ve never known anyone who can find resources like [Yakima Navigator] can. She can dig things up from anywhere.” Sophie has referred three other families to the Yakima Kinship Navigator program and she noted that she does not know what those families would have done were it not for this program. Sophie knows her grandson will be living with her one year from now because his biological father (Sophie’ son) is an alcoholic and is still in the county jail. When Sophie took her grandson in, CPS was preparing to take him. She believes that he would have ended up in the foster care system if Sophie had not taken him in.

Page 9 TriWest Group Kinship Navigator Six-Month Pilot Evaluation Report
Description of Services Provided and Caregivers Served Number of Caregivers Served In seven months of program operations since the Seattle and Yakima Navigators were first hired in mid-July 2004, 148 caregivers received documented services through the programs. This included 56 caregivers for the Seattle program and 92 caregivers for the Yakima program. This exceeded the pilot project goal of 80 by 85%. In addition, 139 caregivers contacted the two Navigators seeking information and help finding resources. Of those, the Navigators were able to assist and provide a referral to 73% (101) caregivers; 21% (29) received only information, and the referral status was unknown for six percent (6% or 9 caregivers). Of the 139, 54% (75) received just this brief interaction, while another 37% (52) ended up receiving additional documented services from the Navigator and are included in the analysis below. The extent of interaction with the remaining 9% (12 caregivers all from Seattle), was not recorded and is therefore unknown Combined in an unduplicated count of all caregivers receiving either information only or a documented service from the Navigators, 223 people were served by the program in seven months. Services Delivered by Navigators Before examining the individual patterns of service delivery within the Seattle and Yakima pilots, it is necessary to consider first an important contextual difference between the implementation of the two programs. The Seattle program had to spend more time involved in relationship building and coordination with the wide array of agencies currently serving kinship caregivers. These activities understandably took time away from direct service delivery to caregivers. This contextual difference from activities in the relatively less urban Yakima region is discussed in more detail in the agency services section below. This difference seemed to be the primary factor contributing over the initial seven month program implementation period to a four-fold difference in the number of services and two-fold difference in the amount of service time between Yakima and Seattle. The 92 Yakima caregivers received a total of 679 documented service encounters (320 hours of service), for an average of 7.4 encounters and 3.5 hours of support per caregiver. Most (56% or 380) of the services were provided by phone, 41% (274) face to face, and 3% (20) were not provided directly in person (these tended to be by email). The face to face services represented most of the time spent providing services (64%), with 33% over the phone and 3% not provided in person. The 56 Seattle caregivers received a total of 150 documented service encounters (84 hours of service), for an average of 2.7 encounters and 1.5 hours of support per caregiver. Most of the services were provided by phone (89% or 124 of the 140 encounters where the type of delivery was documented); 11% (16) were face to face. In terms of time, nearly three-quarters (74%) was on the telephone, 22% face to face, and 4% not delivered in person. In addition to the contextual differences discussed above, the Seattle program encountered significant difficulties early on with the documentation process through the automated database, so these figures likely

Page 10 TriWest Group Kinship Navigator Six-Month Pilot Evaluation Report
undercount the amount of service provided. In addition, program staff estimate that 90 additional kinship caregivers were provided information about resources and parenting issues through a single event convened in October in collaboration with other caregiver serving agencies in Seattle. Staff reported that few of these caregivers were among those served directly by the Navigator program, beyond the information and education provided at this event. This event was unique to Seattle and is described in more detail later in this section. The frequency of service contacts and percent of time they were provided across service types for both sites is summarized in the following chart and reported in detail below. Percentage of Encounters by Type and Site
05
1015202530354045
Information
Referrals
Listening
Linkages
Advocacy
Other
Seattle Yakima
Overall, Seattle services tended to be information and referrals; Yakima services tended to involve more intensive supports, including follow-up linkages, advocacy, and supportive listening. The array of services included the following:
27% (225) of contacts and 32% of time was spent providing information to caregivers about needed supports. This was a higher proportion of Seattle’s contacts (37%) than Yakima’s (25%), but the proportion of time overall was similar between the two sites at 31% for Seattle and 33% for Yakima.
21% (175) of contacts and 22% of time was spent providing referrals to specific supports. This was a higher proportion of Seattle’s supports than Yakima’s, both in terms of contacts (41% versus 17%) and time spent (38% versus 18%).
16% (133) of contacts and 12% of time was spent providing supportive listening. This was a higher proportion of Yakima’s contacts (19%) than Seattle’s (4%). This involved 13% of time spent in Yakima and 4% of time spent in Seattle.
13% (104) of contacts and 15% of time was spent providing follow-up activities to link caregivers to needed supports. The majority of these contacts (93) were made by the Yakima program and this was a higher proportion of Yakima’s contacts (14%) than Seattle’s (7%). This involved 17% of Yakima’s time and 10% of Seattle’s time.

Page 11 TriWest Group Kinship Navigator Six-Month Pilot Evaluation Report
9% (76) of contacts and 8% of time was spent providing advocacy with a third party. This type of service was only provided by the Yakima program and represented 11% of its contacts and 10% of its time.
14% (115) of contacts and 11% of time was spent providing other supports, including missed appointments, outreach attempts, and direct assistance. This was a higher proportion of Yakima’s contacts (15%) than Seattle’s (10%), but the proportion of time was greater for the Seattle program (17%) than for the Yakima program (9%). A review of these supports suggested that many could have been included in the primary categories (for example, outreach and direct assistance to link caregivers to supports).
An analysis was conducted of the distribution of services provided in the first three months for all caregivers who received services over at least a three month period tracked by the evaluation. Of those services, most (54%) were provided during the first month of interaction with the caregivers, falling off to 26% in month two and 20% in month three. In Seattle, 86% of the services were delivered in the first month, 12% in the second month and 2% in month three. In Yakima the proportion was 46%, 30%, and 24% by month, respectively. In the first month of service 89 caregivers were served at an average of 2.8 service encounters and about two (2) hours of service per caregiver. In the second month, 47 caregivers were served, receiving 2.6 service encounters and 0.8 hours of service per caregiver, and in month three, 35 caregivers were served with 2.6 encounters and 0.9 hours of service per caregiver. This trend of more services being delivered in the first month of enrollment fits with the nature of the Navigator program and its emphasis on connecting caregivers with needed supports, as opposed to delivering ongoing care. Percent Distribution of Services Over Time by Site
0
20
40
60
80
100
1st Month 2nd Month 3rd Month
Seattle Yakima

Page 12 TriWest Group Kinship Navigator Six-Month Pilot Evaluation Report
Services were also provided to agencies. Overall, 74 agency services were provided, with a total of 1368 people reached across the contacts. This included 34 events and 312 people in Yakima and 40 events and 1056 people in Seattle. Seattle events tended to reach more people, with 350 people attending a Holiday Gathering, nearly 150 a Kinship Symposium, and over 100 at each of two other events. The largest event in Yakima reached 63 people. Overall, over 148 hours of service were provided to agencies across the two programs, 112 hours in Seattle (average contact was 167 minutes) and 37 hours in Yakima (average contact was 66 minutes). Written materials (usually brochures and navigator contact information) were reported as distributed at all of the Yakima events and 60% of the Seattle events. Outreach occurred at multiple agencies, including: 18% at schools (13), 16% at Department of Social and Health Services (DSHS) groups (12), 10% at caregiver support groups (7), 5% at faith-based organizations (4), 5% at aging services agencies (4), 4% at youth services agencies (3), 3% at advocacy groups (2), 3% at physical health providers (2), and 36% at a range of other agencies (24) including court staff/agencies, mental health and substance abuse providers, a legislator, non-profit agencies, community centers, a homelessness forum, and clothing distribution sites. One particular event underscores the different challenges and needs in Seattle. On October 16, 2004, Casey Family Programs, in collaboration with the Seattle Navigator program, the Department of Social and Health Services, and other child and kinship family-serving agencies, sponsored the 2004 King County Kinship Symposium. The full day program included seven morning and five afternoon sessions on the following topics: government agency resources, legal issues, housing options for kin and youth, access to education, fathering, transition services, and kinship care. Of the 147 documented attendees, approximately 20% represented local agencies, 60% kinship caregivers, and 20% older adolescent children of kinship caregivers. An additional 60 children were provided with structured day care so their caregivers could participate. The Kinship Symposium was a direct response to the contextual needs experienced by the Seattle program. As in Yakima, there is no one place for a kinship caregiver to go to receive information about available services. However, King County has a much wider array of social service agencies currently providing various supports to kinship families, posing a greater challenge to establishing collaborative relationships across this large group of agencies. Most of the estimated 90 caregivers impacted through the Kinship Symposium were already linked to these agencies, but were seen as needing more focused support. The symposium offered the opportunity to educate caregivers about available services, while helping to launch a more formal level of kinship collaboration among King County agencies. As is discussed in more detail in the last section of this report, the Yakima program faced a different challenge – a lack of current providers serving kinship caregivers. The implications of the different contexts faced by the two programs are discussed more in the conclusion section of the report.
Age Data on age was available for 147 caregivers. The average age of caregivers served by the program was just over 50 years (50.1). The average and median ages for the Seattle program were both 54 years of age, while in Yakima the average age was 48 and the median age was 47

Page 13 TriWest Group Kinship Navigator Six-Month Pilot Evaluation Report
years old. Caregiver ages varied considerably, ranging from 21 to 83 years old. The range was somewhat greater for Yakima (22 to 83 years) than for Seattle (34 to 80 years). The figure below shows that most caregivers 33% (48) were between 40 and 49 years of age, closely followed by the 31% (46) between the ages of 50 and 59. One fifth of caregivers were age 60 and older (20% or 29) and the remaining caregivers fell into the 30 to 39 (12% or 18) and under 30 brackets (4% or 6). Age Distribution by Site
0
10
20
30
40
50
Under30
30-39 40-49 50-59 60 andOver
Seattle Yakima
The distribution between the two programs was similar but not identical. In Seattle where the average age was 54 years, 45% (25) of the caregivers fell between the ages of 50 to 59, and 25% (14) were 60 or older. An additional 21% (12) were aged 40 to 49, and 9% (5) were between the ages of 30 and 39. There were no caregivers under the age of 30 in Seattle. In Yakima, the average age of the caregivers was slightly younger at 48, with 40% (36) falling in the 40 to 49 age category, 23% (21) in the 50 to 59 category, and 16% (15) in the 60 and older age category. In addition, 14% (13) of caregivers were aged 30 to 39 and 7% (6) were under the age of 30. Gender Data on gender was available for 145 participants, including all 92 of the Yakima participants and 53 of the Seattle participants. Of the caregivers for whom data on gender was available, the vast majority was female (137 or just under 95%). Just under six percent (8) were male. Gender distributions across programs were similar. Race/Ethnicity and Language Data on race and ethnicity was available for 144 participants, including 91 of 92 (99%) of the Yakima participants and 53 of 56 (95%) of the Seattle participants. Of the caregivers for which data on race and ethnicity was available, 40% (57) were non-Hispanic White, 31% (44) were African American, 15% (21) were Hispanic, 9% (13) were American Indian / Alaskan Native,

Page 14 TriWest Group Kinship Navigator Six-Month Pilot Evaluation Report
one participant was Asian American, and 6% (8) identified themselves as multiracial with no further specification. There were differences in the distribution of race and ethnicity between the two sites summarized in the chart below. Race and Ethnicity Distribution by Site
01020304050607080
African Am.
Native Am.
Asian Am.
Non-Hisp. White
Hispanic
Multi-Racial
Seattle Yakima
The majority of caregivers in Seattle were African American (39 or 74%). Another 15% (8) of the caregivers identified as non-Hispanic White, while 5% (3) of the caregivers were Hispanic, one was Asian American, and another 4% (2) identified as multiracial. In Yakima, the largest racial group served was non-Hispanic White (49 or 54%). The second largest group served were Hispanics (18 or 20%), followed by American Indian / Alaskan Natives (13 or 14%). Of the remaining caregivers, 7% (6) identified as multiracial and 6% (5) identified as African American. Data on primary language was available for 141 participants, including 91 of the Yakima participants and 50 of the Seattle participants. The vast majority (96% or 135) of the caregivers spoke English as their primary language, and 4% (6) spoke Spanish. Of those who spoke Spanish, two (2) were served in Seattle and four (4) were served in Yakima. Information Regarding Caregiver Children Data on the children of the caregivers (both their own children and children of kin) was available for 135 participants, including all 92 of the Yakima participants and 43 of the Seattle participants. The range of relationships reported across both sites is summarized in the figure below.

Page 15 TriWest Group Kinship Navigator Six-Month Pilot Evaluation Report
Range of Child Relationships to Caregiver by Site
010203040506070
Grandchild
Biological Child
Niece-Nephew
Step Child
Fictive Kin
Cousin
Sibling
Other (Relative)
Other (not realtive)
Seattle Yakima
In Seattle, the 43 caregivers reported a total of 105 non-adult household members for an average of over two (2.4) per caregiver. The number of children reported per caregiver ranged from one to eight. The legal status was reported as 27% (19) of the youth having no legal status established, 25% (18) guardianship, 18% (13) biological children, 2% (1) foster child, and 28% (20) of the youth having other types of legal status, including 18 for whom there is custody, temporary custody or custody status is in process. The length of time that the Seattle children had lived with the caregiver was reported for just over half (54) of the children, averaging almost four and one half (4.5) years, with a range of 2 months to 17 years. The gender split for the Seattle children was 55% (51) boys and 45% (42) girls. The breakdown by race and ethnicity was 78% African American (80), 10% Hispanic (10), 6% multiracial (6), 3% non-Hispanic White (3), 2% other (2), and 1% Asian American. The primary language reported for 88 of the children (91%) was English, with Spanish reported for another 9 children (9%). Information on the relationship of the children to their caregivers was available for 69 (66%) of the Seattle children. Most (70%) of the children living with the caregivers were grandchildren (48), and another 17% were biological children (12). An additional 10% were nieces or nephews (7), 1.5% were step-children (1), and 1.5% was another type of relative. The length of time that the Seattle children had lived with their kinship caregiver was computed for 54 children (excluding biological and adopted children, plus those with a missing legal status), averaging over four (4.5) years, with a range of two months to 17 years. Just fewer than 4% (2) of the children had been living with their caregiver for less than three months. Another 28% (15) had lived with their caregiver between three and 12 months. The remaining two thirds of children (37) had lived with their caregiver over one year.

Page 16 TriWest Group Kinship Navigator Six-Month Pilot Evaluation Report
The gender split for the Seattle children was over half (51 or 55%) boys and just under half (42 or 45%) girls. The breakdown for Seattle children by race and ethnicity was 76% African American (80), 10% Hispanic (10), 6% multiracial (6), and 3% non-Hispanic White (3). The primary language spoken by 91% of the children (88) was English. The other 9% (9 children) spoke Spanish. For the Yakima program, 92 caregivers reported a total of 237 non-adult household members for an average of 2.5 children per caregiver. The number of children reported per caregiver ranged from one to eight. Legal status was reported, with the largest group of the children having no legal status established (85 or 36%), 27% (64) biological children, 12% (29) guardianship, 1% (3) foster children, 0.4% (1) an adopted child, and 23% (53) other types of legal status including over half (33) reported as some type of custody and 20 reported as dependents of the state. The length of time that the Yakima children had lived with the caregiver was computed for 160 children (excluding biological and adopted children, plus those with a missing legal status), averaging over two (2.4) years, with a range of one month to 16 years. Just over 25% (41) of the children had been living with their caregiver for less than three months. Another 28% (44) had lived with their caregiver between three and 12 months. The remaining 47% of children (75) had lived with their caregiver over one year. The gender split for the Yakima children was almost half (111 or 47%) boys and just over half (123 or 53%) girls. The breakdown for Yakima children by race and ethnicity was 41% Hispanic (94), 34% non-Hispanic White (78), 10% American Indian / Native Alaskan (24), 10% multiracial (24), and 4% African American (10). The primary language spoken by all but three of the children (219 or 99%) was English. The other 1% (3 children) spoke Spanish. Information on the relationship of the children to their caregivers was available for 235 of the Yakima children. A plurality (40%) of the children living with the caregivers were grandchildren (95), while 26% were biological children (62), and 23% were nieces or nephews (55). Another 5% were fictive kin (11), 2% were cousins (4), 1% were step-children (2), 1% were siblings (2), 1% were another type of relative (2), and another 1% had a relationship that was recorded as “other non-relative” (2).

Page 17 TriWest Group Kinship Navigator Six-Month Pilot Evaluation Report
Baseline and Three-Month Caregiver Needs For caregivers who consented to be involved in the evaluation, baseline and 3-month follow up needs were assessed using a modified version of the Family Needs Scale. Don Cohon of the Edgewood Institute for the Study of Community-Based Services developed a 31-item family needs scale based on the work of Carl Dunst and colleagues (Dunst, Trivette & Deal, 1988).10 The items from this scale overlapped considerably with input TriWest had received from the Navigator Project Logic Model, discussions with project leadership, and a 2002 study of kinship care in Washington State (Mayfield, Pennucci & Lyon, 2002).11 While the Family Needs Scale developed for this study used most of the items from the Edgewood Institute scale, we made three types of modifications: (1) we added eight (8) items prioritized by Washington State stakeholders that were not included in the original scale (e.g., kinship support groups, school-related needs); (2) we modified four (4) of the items that needed to be asked about with greater specificity (e.g., breaking down a question on legal supports into three sub-components); and (3) we deleted 11 less relevant items in order to shorten it (e.g., help budgeting, help learning to cook). One additional item (“information on where to get help”) was added two months into the project. Needs were rated by caregivers according to the frequency at which they were experienced. The rating categories on the scale included: always (6), almost always (5), often (4), sometimes (3), almost never (2), and never (1). Average scores across all caregivers were computed and re-categorized as follows: always (5.5-6), almost always (4.5-5.4), often (3.5-4.4), sometimes (2.5-3.4), almost never (1.5-2.4), and never (0-1.4). Consent was obtained from 97 caregivers who completed the Family Needs Scale, 74 from Yakima (80% of the 92 served in Yakima) and 23 from Seattle (41% of the 56 served in Seattle). An analysis of average scores showed that no needs were reported as experienced “always” on average. This makes sense when looking at average scores (which tend to moderate extreme ratings). However, all of the 33 categories of need had at least one caregiver who reported the need as always present and the remaining category had at least one person rate the need as almost always present. Three needs fell into the “almost always” range on average at baseline:
Time to do things for yourself (mean of 4.9 across 96 caregivers); Help understanding government agencies (mean of 4.7 across 95 caregivers); and Extra money to buy necessities and pay bills (mean of 4.6 across 97 caregivers).
Three months later, one of the three “almost always” needs improved: “Help understanding government agencies” improved 0.9 points to “often” (n=46, t=2.0, p<.05). Of the three needs, understanding relates most directly to the Kinship Navigator interventions, for increasing understanding of government agencies is a primary objective of the program. The other two needs are more inherent to the kinship caregiver situation and more intractable, at least over three 10 C.J. Dunst, C.M. Trivette, & A.G. Deal. (1988). Enabling and Empowering Families: Principles and Guidelines for Practice. Cambridge, MA: Brookline Books. 11 Mayfield, J., Pennucci, A., & Lyon, C. (June, 2002). Kinship Care in Washington State: Prevalence, Policy, and Needs. Olympia, WA: WSIPP.
Page 18 TriWest Group Kinship Navigator Six-Month Pilot Evaluation Report
months. While the Navigators were able to help caregivers access flexible funds and better access to public benefits relief in many cases, the intervention was not designed to change in three months time the two major fundamental challenges of being a caregiver, namely having one’s time and money stretched to support additional children in the household. Seven needs fell into the “often” range on average:
Support groups for kinship caregivers (mean of 4.3 across 96 caregivers); Information on where to get help (mean of 4.1 across 45 caregivers);12 Help dealing with social services (DSHS) (mean of 3.8 across 94 caregivers); Legal assistance related to being a kinship caregiver (adoption or third party custody) (mean
of 3.5 across 97 caregivers); Someone to talk to about your child or children (mean of 3.5 across 96 caregivers); Time to do fun things with your family (mean of 3.5 across 96 caregivers); and Help getting and keeping public assistance (for example, Medicaid, Supplemental Security
Income [SSI], Temporary Assistance to Needy Families [TANF], other) (mean of 3.5 across 96 caregivers).
Three months later, four of the six “often” needs for which sufficient data was available to test had improved:
Support groups for kinship caregivers improved 1.2 points to “sometimes” (n=47, t=3.9, p<.001);
Help dealing with social services (DSHS) improved 0.9 points to “sometimes” (n=47, t=2.5, p<.02);
Legal assistance related to being a kinship caregiver improved 0.8 points to “sometimes” (n=48, t=2.0, p<.05); and
Help getting and keeping public assistance improved 1.1 points to “almost never” (n=47, t=3.9, p<.001).
Again, the four needs that changed made sense: all four involved help accessing a service. In particular, “help dealing with social services (DSHS)” responds directly to the intent of the legislation (“2.d Assisting in establishing stable, respectful relationships between kinship caregivers and department staff”).13 Of the two “often” needs that did not change, change in one (“Time to do fun things with your family”) would have involved (as with the previous items that did not change) not just help accessing supports, but a change in status. The other (“Someone to talk to about your child or children”), did involve at least to some degree a secondary support provided by the Kinship Navigators (16% of contacts and 12% of time was spent in “supportive listening”). However, one wonders if any effect of this attributable to the Kinship Navigator might have diminished by the third month given that the amount of contact overall with caregivers tended to decline sharply after the first month. The following chart summarizes the degree of change across the highest areas of need (all need areas with baseline scores in the “almost always” or “often” range).
12 This item was added two months into the data collection process. As a result, there were too few cases with three-month follow-up data to be tested for changes. 13 2003 Kinship Care Bill (SHB-1233)

Page 19 TriWest Group Kinship Navigator Six-Month Pilot Evaluation Report
Changes in Top Baseline Caregiver Needs After Three Months14
1 1.5 2 2.5 3 3.5 4 4.5 5 5.5 6
Assistance with publicassistance
Time to do fun things withfamily
Someone to talk to aboutchildren
Legal assistance(adoption/custody)
Help with social services
Info on where to get help
Kinship support groups
Extra money forneeds/bills
Understanding govt.agencies
Time to do things foryourself
Baseline3 months
Not enough responses to test for differences
Thirteen needs fell into the “sometimes” range on average:
Respite care (someone to help care for my child when I need a break) (mean of 3.4 across 96 caregivers);
Someone to talk to about how things are going for you (mean of 3.1 across 97 caregivers); Dental care for your family (mean of 3.1 across 97 caregivers); Help getting enough food daily for two meals for your family (mean of 3.0 across 97
caregivers); Help learning how to be a more effective parent (mean of 3.0 across 96 caregivers); Mental health services for your child (mean of 2.9 across 96 caregivers);
14 Please note that average baseline need scores were computed across all 97 baseline surveys. Follow-up survey data was only available for 48 participants, 10 from Seattle and 38 from Yakima. As a result, the baseline needs scores shown in the table are different from those computed for the overall group.
Never Almost Never Sometimes Often
Almost Always Always
Significant Improvement
Significant Improvement
Significant Improvement
Significant Improvement
Significant Improvement

Page 20 TriWest Group Kinship Navigator Six-Month Pilot Evaluation Report
Medical care for your family (mean of 2.9 across 97 caregivers); Help transporting my child places, including appointments (mean of 2.8 across 97
caregivers); Emergency health care for your family (mean of 2.8 across 96 caregivers); To belong to parent groups or clubs (mean of 2.8 across 96 caregivers); Help getting places you need to go for yourself (mean of 2.7 across 97 caregivers); Emergency child care (mean of 2.6 across 96 caregivers); and Legal assistance related to benefits (Medicaid, Social Security, child support, other) (mean of
2.6 across 97 caregivers). Three months later, four of the thirteen “sometimes” needs improved:
Dental care for your family improved 0.9 points to “almost never” (n=48, t=2.8, p<.01); Medical care for your family improved 1.0 points to “almost never” (n=48, t=2.8, p<.01); Emergency health care for your family improved 0.7 points to “almost never” (n=47, t=2.2,
p<.04); and Help getting places you need to go for yourself improved 0.6 points to “almost never” (n=48,
t=2.5, p<.02). One of the “sometimes” needs was worse three months later: “Someone to talk to about how things are going” worsened 0.8 points to “often” (n=48, t=-2.2, p<.03). This was the only need that worsened among the 31 with enough data to test. The four “sometimes” needs that improved all involved supports with which the Navigators reported having helped link caregivers: dental care, medical care (routine and emergency), and transportation. The one that worsened (“Someone to talk to about how things are going”) involved a secondary support provided by the Kinship Navigators (16% of contacts and 12% of time was spent in “supportive listening”). While too much should not be made of any one finding given the number of analyses conducted, this does fit with the general pattern observed of Kinship Navigators reducing the amount of contact with caregivers after the first month. It may also reflect more freedom to focus on one’s own needs as a caregiver. Of the eight items that did not change, two related directly to the two major fundamental challenges of being a caregiver already discussed, namely less time (the respite need) and resources (having enough food). The other six involved supports that were subjects of referrals and linkages by the caregivers (parenting help, mental health, parent groups other than kinship support groups, help transporting children rather than oneself, emergency child care, legal help related to benefits), but at a rate that in all but one case we know was less frequent than for the items where changes were found (medical and dental care). The one case that seems less clear is why there should have been a change in transportation needs for oneself and not for one’s children. One issue here is simply the limitations of statistical analysis. The magnitude of the significant change (p<.02) for one’s own transportation needs was 0.56 of a point and the magnitude of the non-significant change (p<.07) for one’s children’s transportation needs was 0.46. Small differences in change can be enough to push a difference into the significant range, even though the actual difference in measured change was not particularly meaningful.

Page 21 TriWest Group Kinship Navigator Six-Month Pilot Evaluation Report
Nine needs fell into the “almost never” range on average, even though at least one caregiver rated each of them as “always”:
Help managing the daily needs of my child at home (mean of 2.4 across 96 caregivers); Special education services for your child (mean of 2.2 across 47 caregivers);15 Routine child care (mean of 2.2 across 96 caregivers); School services for my child (mean of 2.2 across 96 caregivers); Other legal assistance (mean of 2.1 across 97 caregivers); Assistance with alcohol or other substance abuse problems either for myself or family
member (mean of 2.0 across 96 caregivers); Help getting a place to live (mean of 2.0 across 97 caregivers); Help getting a job (mean of 1.6 across 97 caregivers); and Vocational training services for your child (mean of 1.6 across 96 caregivers).
One need fell into the “never” range on average at baseline, even though at least one caregiver rated this need as “almost always”: “Help enrolling my child in school” with a mean of 1.1 across 95 caregivers. Three months later, none of the nine “almost never” and one “never” needs had changed significantly. One had too few cases to test. For the remainder, given multiple needs and the priority placed by the program on caregivers’ highest needs, it is not surprising that the lowest average needs did not change significantly. Looked at in sum, a finding of significant positive change in nine of 31 possible need areas is a very positive result over three months time. What is more, the nine changes were all in areas that fit the model of change underlying the intervention. Had any of the need areas less centrally related to the model changed significantly, we might instead suspect an across-the-board improvement in caregiver status independent from the Kinship Navigator program. Given that all changes fit the model (including the one area that worsened), the findings robustly argue for the pilot’s effectiveness in the areas it targeted. The lack of a comparison group keeps us from concluding this definitively, but the preponderance of the data available points in that direction. There was sufficient data to look for differences in average baseline needs ratings between the Seattle and Yakima programs, but not at changes in needs given that the Seattle program had only nine to ten cases available for analysis. While these findings of baseline differences are useful for exploration and program development, they should not be generalized to caregivers beyond those served by the programs to try to understand broader differences between kinship caregiver needs in the two communities. Significant differences in baseline average scores included 15 of the 33 need areas. All but one of the significantly greater needs involved greater needs in Seattle than in Yakima. It is impossible to determine if these are a function of greater needs in Seattle or a tendency on the part of the Seattle rater to assign higher scores. Several were consistent with a greater emphasis on financial needs in the Seattle focus group, discussed further in that section. 15 A database error caused a significant portion of the data for this item to be lost. As a result, there were too few cases with three-month follow-up data to be tested for changes.

Page 22 TriWest Group Kinship Navigator Six-Month Pilot Evaluation Report
Differences in Baseline Needs Between Seattle and Yakima Caregivers
Area of Need Seattle Need Level (n)
Yakima Need Level (n)
Needs Greater in Seattle
Help dealing with social services (DSHS) Almost Always (22) Sometimes (74)
Time to do fun things with your family Almost Always (24) Sometimes (74)
Respite care (someone to help care for my child when I need a break) Almost Always (24) Sometimes (74)
Help getting enough food daily for two meals for your family Almost Always (24) Sometimes (75)
Someone to talk to about your child or children Often (24) Sometimes (74)
Someone to talk to about how things are going for you Often (24) Sometimes (74)
Help transporting my child places, including appointments Often (24) Almost Never (75)
Help getting places you need to go for yourself Often (24) Almost Never (75)
Help managing the daily needs of my child at home Often (24) Almost Never (74)
Other legal assistance (beyond help with custody or benefits) Often (24) Almost Never (75)
Emergency child care Sometimes (24) Almost Never (74)
Routine child care Sometimes (24) Almost Never (74)
School services for my child Sometimes (24) Almost Never (74)
Help getting a place to live Sometimes (24) Almost Never (75)
Needs Greater in Yakima
Support groups for kinship caregivers Sometimes (24) Almost Always (74)

Page 23 TriWest Group Kinship Navigator Six-Month Pilot Evaluation Report
Satisfaction with Navigator Services
As part of the evaluation, we conducted telephone surveys with 42 of the 59 caregivers from both programs who had received three months or more of services, for a completion rate of 71%. Of the 42 we were able to reach, 24% (10) were from the Seattle program and 76% (32) were from the Yakima program. We asked these caregivers a set of four questions to give them the opportunity to report on how satisfied they were with the services they received from their respective Kinship Navigator. The first question focused on the perceived usefulness of the Navigator services, using frequency scaling similar to the Family Needs Scale. In response to the question “How frequently did the Navigator help your family get and keep the resources and supports you need to be a good caregiver for your child?” a total of 93% responded in the “Often” to “Always” range (and 100% of the caregivers from Yakima). More specifically, 81% (34) of the caregivers responded with an “Always” or “Almost Always” satisfied answer, and an additional 12% (5) responded “Often.” We also asked caregivers about satisfaction. In response to the question “How satisfied are you with how the Navigator has tried to help your family get and keep needed resources and supports?” 98% (41) of the caregivers answered “Very Satisfied” (81%) or “Satisfied” (17%). Only one caregiver fell into the dissatisfied range, a caregiver from Seattle who responded “Very Dissatisfied.” We then asked caregivers their opinion about whether or not the program should continue, given its pilot nature. A full 100% (42) of the caregivers responded that the Kinship Navigator program should continue, of whom 91% (38) responded that the program should be made available to more families. When asked if changes should be made to the program, three-fourths responded that no changes were needed. Of the 26% (11) of the caregivers who responded that changes should be made, most suggested changes that focused on making more resources available to caregivers and not specific changes to the Navigator role. Additional comments made by the caregivers during the satisfaction surveys that typified these overwhelmingly high levels of satisfaction included:
“I have nothing but good things to say about [the Navigator] and this program.” “It’s a great and awesome program.” “In my opinion, this is the best social program I’ve seen… It works. It would truly be worth
the money from the government.”

Page 24 TriWest Group Kinship Navigator Six-Month Pilot Evaluation Report
Qualitative Assessment of Program Components As noted in the introduction, the Kinship Navigator Pilot was implemented to help kinship caregivers better understand and navigate the service systems for children in out-of-home care and to reduce barriers faced by kinship caregivers when accessing services. This project was carried out under a mandate through the 2003 Kinship Care Bill (SHB-1233) passed in the Washington State Legislature, which defined the overall goals and attributes of the pilot program in the following language (Section 2):
(1) The department of social and health services shall collaborate with one or more nonprofit community-based agencies to develop a grant proposal for submission to potential funding sources, including governmental entities and private foundations, to establish a minimum of two pilot projects to assist kinship caregivers with understanding and navigating the system of services for children in out-of-home care. The proposal must seek to establish at least one project in eastern Washington and one project in western Washington, each project to be managed by a participating community-based agency. (2) The kinship care navigators funded through the proposal shall be responsible for at least the following:
(a) Understanding the various state agency systems serving kinship caregivers;
(b) Working in partnership with local community service providers; (c) Tracking trends, concerns, and other factors related to kinship
caregivers; and (d) Assisting in establishing stable, respectful relationships
between kinship caregivers and department staff. While the language of SHB-1233 formed the basis of the Kinship Navigator model, we also talked with key members of the Oversight Committee for the project, who identified the following additional expectations of the project:
To respond to the well documented need for information that kinship caregivers have repeatedly expressed through surveys and focus groups;
To be sensitive to differences in needs and resources between the two pilot communities (Seattle and Yakima);
To keep the model strength-based so that it did not devolve into a form of case management; For the Navigator to be able to simultaneously work from inside and outside the formal
systems that serve kinship caregivers, serving as someone knowledgeable regarding and with strong linkages to formal system resources who operates from outside the system with flexibility to respond to diverse needs and advocate for individual caregiver concerns; and
To identify and help respond to gaps across the current array of formal systems serving kinship caregivers, though doing so without becoming a formal part of the service delivery system.
The formative evaluation used four sets of qualitative data to help assess both the degree to which the Kinship Navigator program as implemented addressed the project’s expectations and the specific program components that were judged most helpful by caregivers. These included:

Page 25 TriWest Group Kinship Navigator Six-Month Pilot Evaluation Report
An initial round of focus groups conducted in October 2004 with caregivers served by the pilot and deemed able to represent the broader needs of kinship caregivers in each region in order to confirm that the caregivers targeted for this project had needs that fit the intended service model and to get input from caregivers regarding what priorities they thought the model should focus on.
A second round of focus groups conducted in January 2005 with caregivers that had been positively impacted by the program in each region in order to identify those program components viewed as most helpful.
In-depth interviews with two caregivers in each region – one selected as representing typical levels of help received by caregivers in the region and the other selected to represent the highest levels of helpfulness received – that were conducted in February 2005 to explore how multiple program factors came together in the lives of individual caregivers. Results of these were discussed in the initial section of the report.
Monthly interviews with program staff to track program implementation and identify any challenges that emerged.
Initial Focus Groups: Assessing Fit Between Targeted Needs, Actual Needs, and Model Components The initial round of focus groups we carried out in Seattle and Yakima in early October focused on two questions in an effort to confirm that the caregivers targeted for this project had needs that fit the intended service model and to get input from caregivers regarding what priorities they thought the model should focus on. The two groups involved 25 caregivers, 13 in Seattle and 12 in Yakima. Detailed demographic information was not collected, but the following information was provided:
In terms of gender, in Seattle all 13 caregivers were women and in Yakima four of the 12 were men who attended with their significant others. This balance reflected the emphases of the two programs, both of which primarily served women and of which only Yakima served any men.
In terms of race and ethnicity, 12 caregivers were non-Hispanic White, 11 were African American, one was American Indian, and one was Hispanic. The composition of the two groups reflected the relative populations served by the two programs, with all but three of the Seattle group being African American and all but two of the Yakima group being non-Hispanic White. The Seattle group also included one Hispanic and two non-Hispanic White participants, and the Yakima group included one each of African American and American Indian participants.
In terms of relationships to the children they cared for, the vast majority of the caregivers were grandparents and at least one in each group was an aunt. Many also cared for other biological or foster children in their homes.
In addition to differences in racial and ethnic composition of the two groups, there was one additional difference between them. Participants in the Seattle project had not yet received any Navigator services, whereas participants in Yakima had received significant amounts of service. Implications of these differences are discussed below.

Page 26 TriWest Group Kinship Navigator Six-Month Pilot Evaluation Report
Kinship Caregiver Needs: The first question each group responded to was: “Based on your experience and that of other Kinship Caregivers you know, what are the most important needs of Kinship Caregivers?” Caregivers identified 32 needs across the two groups, 14 of which were identified by both groups. We were also able to gather importance ratings for the needs from 10 of the Yakima caregivers. Due to logistical difficulties, there was not time to gather importance ratings from the Seattle caregivers related to needs so only qualitative indicators of importance were analyzed. Through this analysis, five needs stood out as among the most important: 1. Information and knowledge – This was identified as one of the most important needs in
both groups and had the highest average scores from the 10 Yakima caregivers. 2. Kinship caregivers have less legal authority – This was the next highest rated theme in
Yakima and also emphasized by the Seattle caregivers. The lack of legal rights to carry out caregiving functions was detailed by both groups, with an additional emphasis on the perceived bias in systems toward biological parents and a secondary emphasis on a generalized lack of respect toward kinship caregivers.
3. Financial needs – This was the most emphasized need in the Seattle group and tied for third highest ranked in Yakima. Caregivers discussed being overextended financially and often lacking funds for basics such as clothing, school supplies, and housing.
4. Legal assistance – Caregivers in both groups also stressed the need for affordable and qualified legal assistance from professionals knowledgeable about caregiver needs and family law. Secondarily, both groups talked about how rules vary across types of courts and different DSHS eligibility categories.
5. Special needs resources – Caregivers in both groups also emphasized resources for children with special needs, including specialized child care, educational supports, mental health supports, transportation, specialized supports for adolescents, and supports to address multiple challenges at once.
Comparing this to the quantitative findings on needs described above, we see that two of the five needs – information needs and financial needs – were expressed in two of the top three quantitatively assessed needs found across caregivers (at the “almost always” level). Legal assistance/support and specialized kinship supports (support groups, help with DSHS, and help with public assistance) fell into the second tier of quantitatively assessed needs (at the “often” level). Clearly, the caregiver needs expressed in the focus groups and reflected in the quantitative findings were among the primary needs targeted by the pilot. One other important theme that only came up at the Seattle group was the issue of racism. The primarily African American group clearly noted that specific instances of racism and a more institutionalized set of racist practices posed challenges for kinship caregivers of color when seeking services from formal agencies and systems of care. This important issue was also a specific focus of inquiry in the final round of focus groups and case studies with individual caregivers, described below. Desired Kinship Navigator Qualities: We also asked the caregivers about what they thought were the most important aspects of the Kinship Navigator role. We asked this question for two reasons. First, we wanted to hear from the caregivers in order to have their input into how the
Page 27 TriWest Group Kinship Navigator Six-Month Pilot Evaluation Report
pilot should be carried out. Second, we wanted to see if the priorities expressed by the caregivers served by the project matched those of the legislative pilot. Since the legislation was largely developed by kinship caregivers and the advocates and agencies that serve them, we believed that if the priorities of the caregivers served by the pilot matched these, this would be a good indication that the pilot program was eliciting expectations that adhered to the original model. We first read a brief description of the Kinship Navigator job that reflected the points in the introduction to this report, then asked the caregivers to “tell us the most important things a navigator can do to help you.” Given that the Yakima group was composed of caregivers who had already received Navigator services and the Seattle group was composed of people who had not, one difference emerged immediately. Whereas the Seattle group that had not yet received any services stuck to the meeting agenda and responded first to our question about caregivers’ needs, when we asked the Yakima group about their needs, after briefly noting one or two, the discussion went immediately to all the ways in which they had been helped already by the program. This seemed to be a positive sign of the program’s impact in their lives, and we look forward to seeing if it generalizes across other families when the three-month outcome and satisfaction data is analyzed in the final report. Despite the differences in experience of Navigator services between the two groups, there was significant overlap between the groups. Of the 36 responses across the groups, 10 came up in both groups. Another 14 were unique to Seattle, and 12 were unique to Yakima. We also able gathered importance ratings regarding the Navigator qualities from 10 of the Yakima caregivers and 12 of the Seattle caregivers. Interestingly, the rank ordering of the 10 common themes was nearly identical for the top three and very similar for the remaining seven between the groups. The top three attributes had average scores in the most important range and included:
1. Knowledge of resources, referring to the full range of resources that caregivers need; 2. Linkages to helpers, including DSHS, health, mental health, and schools, and knowing
the right person to talk to at each agency; and 3. An ability to impact legislation and the law, focusing on the potential of the Kinship
Navigator pilot and the specific position to advocate for and promote change within formal systems of care.
Two of these top attributes (knowledge and linkages) fit well with the quantitative data on services provided, as well as caregiver needs described above, including both the top needs at baseline and those needs that changed for the better over time. The third attribute of ability to impact legislation and the law was not directly assessed through the quantitative needs data, and will be discussed further in the second round of focus groups. However, the overwhelmingly positive satisfaction data that showed both awareness among kinship caregivers of the need to promote the program and 100% support for the program’s continuation further underscores the extent to which caregivers viewed the program, not just as a source of immediate support, but as a means to advocate for greater awareness of and responsiveness to kinship caregiver needs. Both sets of caregivers also stressed the importance of getting the word out to caregivers about the availability of Kinship Navigator supports, as well as having the Navigator be someone who

Page 28 TriWest Group Kinship Navigator Six-Month Pilot Evaluation Report
cares, listens, and motivates caregivers to access the supports they need. Life experience, including direct life experience as a kinship caregiver, was also identified as important. Second Focus Groups: Identifying Most Helpful Program Components The second round of focus groups we carried out in Seattle and Yakima in January 2005 focused on an in-depth review of a single question: what was most useful about the program. Participants in this set of focus groups were identified by the two Navigators as typical of caregivers helped by the program, given the focus on factors found to be most helpful. The groups had originally been intended to cover a second question as well, namely, what would have made the program more helpful. However, caregivers had little response to this question and those responses provided focused on unmet needs such as additional financial support and systemic preferences in support for caregivers in the foster parent system, neither of which related directly to the Navigator program. It’s possible that the focus of recruitment on caregivers who were helped by the program resulted in missing out on more critical assessments by other caregivers. However, as the satisfaction data showed, there were few to no caregivers who expressed negative views about the program. The two groups involved 20 caregivers, 16 in Yakima and four (4) in Seattle. More detailed demographic information was collected for these participants, with 15 of the Yakima participants and all the Seattle participants providing information:
In terms of gender, the groups reflected the overall group of people served, with most participants being women. In Seattle all four caregivers were women and in Yakima two of the 15 were men, who attended with their significant others.
In terms of age, the average age overall was 52 and was 50 for Yakima and 60 for Seattle. In terms of race and ethnicity, all of the Seattle caregivers were African American. In
Yakima 14 provided this information, including five caregivers who were non-Hispanic White, four who were American Indian / Alaskan Native, three who were Hispanic, one who was African American, and one who identified as “American.” The composition of the two groups roughly mirrored the populations served by the two programs, though with higher proportions of Hispanic and American Indian participants in Yakima than in the overall group.
The participants reported caring for 50 children (unduplicated, given that several of the Yakima participants lived together), most of whom were grand-children or great-grand-children (26), 12 of whom were nieces/nephews/great-nieces/great-nephews, 10 of whom were biological children, and 2 of whom were step-children. The average number of children in each household was 3.1 (ranging from one to 10). Ages of children ranged from 7 months to 23 years.
The primary question each group responded to was: “Think about what your Kinship Navigator has done for you. What has been most helpful to you and your children?” Caregivers identified 33 helpful features across the two groups, 13 of which were identified by both groups. We were also able to gather importance ratings for the needs from 14 of the Yakima caregivers and all four of the Seattle caregivers.
Page 29 TriWest Group Kinship Navigator Six-Month Pilot Evaluation Report
Through this analysis, four helpful features stood out rated on average across both groups as among the most important:
Understanding of kinship caregiver needs – Participants gave the highest average rating to this feature, stressing the importance of being “sensitive to needs” and “helping [caregivers] figure out their needs.”
Helping with benefits and paperwork – Examples of help actually filling out forms, particularly complex forms related to custody, were discussed and similar help to access benefits. The emphasis in Yakima was on custody paperwork, and the emphasis in Seattle was on benefits, consistent with the different needs documented at each site in the quantitative data
Knowledge and expertise regarding local kinship caregiver supports – Participants focused on being “full of knowledge across programs” and being “well informed.”
Availability to talk when upset or about problems – Participants focused here on support and talking, including listening skills and timely responses.
Ten additional factors were rated on average as important. They included, in descending order of average importance:
Facilitating access to concrete supports and help – The focus here was on non-financial support of basic needs, particularly clothing, food, major household items such as televisions, and help with home repairs and maintenance.
Caring – The discussion focused on the importance of the Navigator being caring, giving, warm, patient, listening, kind, loving, and nice. One person said: “She doesn’t sweat the small stuff.” Another said: “She touched by heart.”
Making linkages – Going beyond just a referral to link the caregiver by helping make an appointment or introducing them to a specific person in an agency.
Following up / Checking in – Participants talked about the importance of help over time and checking in by the Navigator on progress and challenges.
Responsiveness – Responding quickly and flexibly, both initially and in an ongoing manner were all emphasized here.
Financial support – Also important was being able to link caregivers to flexible funds in response to immediate or emergent needs, such as a house payment, fixing a roof, or travel to reconnect with family in support of the child.
Links to medical help – Primary care, specialist services, and dental care were all noted. Flexing with new challenges – The availability of extra help and attention when new
challenges came up and flexing schedules as needs changed were discussed. Links to support groups – These linkages were also stressed as important. Handling complexity – Both groups noted that multiple needs and complex systems
required that Navigators be able to cope well with complexity. Each set of caregivers also identified program features that were discussed only in one focus group. The most important of these on average are reported below, though the fact of a feature coming up only in one group should not be interpreted to mean that it was necessarily more important in that region.

Page 30 TriWest Group Kinship Navigator Six-Month Pilot Evaluation Report
The most important additional features brought up in the Yakima group included: Confidentiality – Knowing that important, private details will be respected was among the
most important on average. Passion – Enthusiasm and “loving what she does” were noted, with one participant
observing: “She never makes you feel like she is overwhelmed.” Helping when others will not – Being willing to help when others said no or supports were
just not available was emphasized. Educating caregivers – Passing knowledge on to caregivers, in addition to just helping, was
noted. Helping caregivers ask for help – The importance of helping caregivers cope with shame
over asking for help was discussed, with many noting how hard it was to do so. Only one additional feature was independently rated as most important on average in Seattle, specifically advocacy for change on a systemic level. The remaining unique features brought up in both groups and rated as important on average included: life experience, friendly support staff at the Navigator site, special gifts over the holidays, links to specific supports (counseling, transportation, legal assistance), a focus on self-help, parenting advice, ongoing education about available supports, and support when kinship caregivers experience the inequality of supports for foster care versus kinship care were all noted. One issue that came up in the first round of focus groups in Seattle were perceptions of institutional racism. These did not come up in either group on their own, which is not surprising given the focus of the groups on successful Navigator program features and the positive experiences with the program by the participants. We asked about the issue in Seattle, but there was no detailed discussion beyond a general affirmation that it was the case. Given the dynamic of two White, relatively unknown interviewers, asking African American participants who were their elders in a group setting about a particularly sensitive issue, the lack of additional discussion makes sense. Additional attention to this issue in forums and evaluations better suited to and specifically focused on issues of racism could help better understand the more specific concerns underlying the general issues raised. Finally, before ending each group we asked people to rate the importance of continued funding for the program. One participant in the first group asked if we meant public (as in government) or private (as in foundation) funding, so we asked both groups to rate each option. Both alternatives were favorably viewed, but ongoing government funding was rated most highly, with the highest possible rating given to it by all 18 participants providing ratings. Monthly Interviews with Program Staff In addition to the focus group and interview findings, we also met monthly with the Kinship Navigators and their supervisors to review implementation progress and identify emerging challenges. Overall, implementation went smoothly and reflected the overwhelmingly positive program results described throughout this report. However, to help inform and improve future

Page 31 TriWest Group Kinship Navigator Six-Month Pilot Evaluation Report
implementation of such programs, two programmatic challenges were identified through this process. First is the challenge of interacting with the existing system of service providers. The challenges differ between the urban setting of Seattle and the more rural setting of Yakima. In Yakima, the primary challenge is having too few providers. Significant gaps in funding, the challenges of single agency providers that must cover large geographic areas, and a lack of resources for Spanish-speaking families were noted. While gaps in funding and a lack of specialized kinship caregiver supports was also noted in Seattle, Yakima needs seemed exacerbated by the shortage of service providers and their need to provide services across large geographic areas. Interestingly, this challenge also created an opportunity for the Yakima Kinship Navigator program. Given the small number of key service providers, the Yakima program has a smaller group of providers with which to coordinate. Furthermore, both Navigator program staff and a group of six Yakima providers interviewed reported that the limited set of providers who had known each other over time made collaboration simpler. While Seattle Navigator program staff had more provider resources to draw on, their sheer number made coordination and the establishment of collaborative relationships more challenging. Additionally, the sense of need in Yakima may have made agencies more willing to respond actively to Navigator outreach efforts. Second was the challenge posed by the multiple tasks that the Navigators must carry out. While the needs surveys and focus groups documented a broad array of needs and expectations of the Navigator program, the interviews with program staff identified other tasks. In particular, the administrative tasks of tracking services and managing data both to support service delivery and the evaluation require an additional set of skills. Navigators are not just helpers. They are also expected to document needs and support advocacy efforts that require information management skills. This has been a particular challenge for the Seattle program, where initial implementation efforts rightly focused on establishing helpful links to agencies and providing supports to caregivers, but where data collection and information management activities fell behind. This need was identified early and additional training and support was provided by Casey Family Programs, but the lesson learned was that administrative expectations need to be incorporated more robustly into the selection, training and orientation process. In addition, feedback to supervisors and database links to enable supervisors to track progress should be implemented from the outset of implementation. Administrative processes pose a common challenge for new programs, as they must simultaneously implement supports and develop new administrative processes. New programs therefore often require greater autonomy and assertiveness on the part of staff to initiate and work out new routines and processes that often require revision and refinement over time. Overall, the Navigator staff and their supervisors demonstrated these qualities sufficiently to surpass initial program goals and achieve the uniform positive results described throughout this report.

Page 32 TriWest Group Kinship Navigator Six-Month Pilot Evaluation Report
Exploration of Program Costs and Benefits
In mid-December 2005, an idea was brought up in our monthly meeting with the Yakima program to try to add some exploration of costs and benefits to the final report. The notion was that the kinship caregivers seemed to be providing care in many cases that might otherwise have resulted in foster care placements for the children involved. Before going further, we examined conceptually the relationship between caregiver support of children and Navigator supports for caregivers. In the final two months of the pilot study we were not able to identify any method to document the specific impact of the Navigators on helping prevent costs in the foster care system. However, to the degree that the evaluation found that Navigators supported kinship caregivers in their efforts, we decided that it would be helpful to document the value of the kinship caregiver support itself. While we could not quantify the fiscal value of the Navigator services, if we could better quantify the value of the kinship caregiver supports, this would lend important background toward understanding the value of any Navigator services that had a positive impact on the continuity of those supports. While we could not determine the proportion of savings of foster care resources through kinship care attributable to the Navigators, we could at least define the range of potential savings supported by supporting the caregivers responsible for the savings. After exploring various ways to document which caregivers were caring for children who otherwise would have ended up in foster care, it was decided to add two additional ratings at the end of the Family Needs Scale (FNS). The first asked caregivers their opinion as to whether or not the children of kin in their care would have ended up in foster care had they not become their caregiver. The second asked the Navigator to give their opinion as a partial validity check. Given the simple design, respondents were asked to respond with a yes or no. This minor addition to the FNS questions was therefore approved and coordinated through Casey’s IRB process. These questions were asked starting in mid-December of all caregivers when completing either initial or follow-up FNS protocols. Through this approach, 44 of the 97 consented caregivers in the study provided this additional information. In all cases the Navigators agreed with the caregivers’ assessments of whether or not foster care was averted through their involvement. We then used this information to try to estimate the number of months of foster care that would have been potentially been incurred in the absence of these caregivers’ support. Several analytic steps led to the estimate:
We began with the families that responded that their support had averted use of foster care. All but five of the families (39 or 89%) responded that foster care was averted. An additional 3 families (7%) reported that the children came to live with them after being in foster care. Only 2 families (4%) did not respond that some level of foster care was averted.
We then used the demographic database for each family to count only the children of kin living in those homes, excluding biological children, step-children, adopted children, and foster children of those parents from the analysis. We were left with a total of 77 children of kin (95% of the total), 71 of whom avoided foster care and six (6) of whom stepped down from foster care.

Page 33 TriWest Group Kinship Navigator Six-Month Pilot Evaluation Report
We then used the demographic database to sum the number of months that these 77 children had resided with their kinship caregivers. This data was not available for three of the children, so for the 74 remaining children a total of 2,426 months was calculated. The average time in kin care per child was 32.8 months.
We then extrapolated the average per child to all 95% of the total 224 children of kin living with families involved in the study or 212.9 children.
To calculate this, we multiplied 212.9 by the average of 32.8 months of time in kin care per child from the sub-sample to yield an estimate of 6,980.9 months of foster care averted by the kinship care placements.
Of course, the Navigator program cannot take credit for a 32.8 month average stay with kin when the Navigators had only been helping out for several months on average. Using the average time of kinship services provided to these families of 3.4 months and multiplying it by 212.9 yields an estimate of 724 months of kinship care supported by the Navigator program in its first seven months.
The evaluation design did not include the tracking of specific program costs, so the costs of these 724 months of averted foster care cannot be directly weighed against the costs incurred by the Navigator Program. However, these 724 months certainly offer a point of comparison when looking at program costs. Now that the feasibility and initial effectiveness of the Navigator Program has been documented through this pilot evaluation, it is recommended that future studied incorporate specific measures of program costs and a more rigorous control group design to document the actual costs and benefits of the program.
Page 34 TriWest Group Kinship Navigator Six-Month Pilot Evaluation Report
Conclusions and Recommendations
Looked at in total, these evaluation results are clearly positive and provide about as robust an initial seven month finding of program effectiveness as was possible given the evaluation methods used and the short period of time of the pilot and evaluation period. These findings include:
Findings of significant positive change in nine of 31 possible need areas, which is a very positive result over three months time. Furthermore, the nine changes were all in areas that fit the model of change underlying the intervention, suggesting that changes occurred in the areas targeted but not in the areas not targeted by the intervention.
Significantly exceeding the initial projection of 80 caregivers served over the evaluation period by serving 148 families and caring for 224 children of kin. An additional 75 caregivers received informational support through the program.
A total of 404 hours of caregiver services across 829 encounters were provided, all targeting the areas of need originally envisioned and further validated as needed through the baseline quantitative assessments of family needs and focus groups.
Provision of services to a diverse array of caregivers and their children that generally reflects the demographics of the communities served and target groups prioritized. While the addition of a bilingual capacity in a setting like Yakima would undoubtedly increase the proportion of services going to Spanish-speaking people there, the use of interpreters supported a few such services being delivered even through the pilot.
A total of 74 agency services were provided, impacting a total of 1368 people. The service delivery infrastructure in Yakima and Seattle differed and these differences led
to different priorities for the Navigator programs in each site. The Seattle program required more effort to identify and engage the wide array of service providers, and the Yakima program required more effort to provide direct supports to caregivers given the relative lack of existing kinship service resources there. The Navigator services provided also reflected this difference, with a greater emphasis in Seattle on information and referrals and a greater emphasis in Yakima on support, linkages and advocacy.
Significant and varied needs in multiple areas documented for the caregivers served, further documenting the very significant, multiple and diverse needs experienced by kinship caregivers. Even though many needs were not experienced very often on average, every need area had at least one caregiver report it as “almost always” a need at baseline. In addition, Seattle caregivers reported more frequent needs in many areas.
In terms of overall helpfulness, 93% found the program to be “Often” to “Always” helpful, including 100% of the 32 Yakima respondents.
Extremely high rates of satisfaction with the Navigator services, with 98% either “Very Satisfied” (81%) or “Satisfied” (17%). Only one out of 42 caregivers interviewed expressed dissatisfaction.
Unanimous endorsement of the program as deserving continuation according to both the 42 satisfaction survey respondents and the 18 participants in the final round of focus groups who provided ratings.
The focus group findings on needs addressed reflected the same array of needs documented in the quantitative findings (information needs, financial needs, legal needs, and linkages to specific supports). With the exception of direct help with financial needs, all of these areas fit into the initial legislative and oversight committee vision for the project. If help linking to

Page 35 TriWest Group Kinship Navigator Six-Month Pilot Evaluation Report
financial supports is considered, then all major needs were addressed to some degree by the program. What is more, all of these areas showed significant improvement over the three month period, including help accessing financial supports.
Program challenges were few and primarily reflected the need to adapt to the different service needs of the two regions. The one lesson learned was to put more emphasis on administrative and data tracking skills than was initially foreseen.
As noted throughout this report, the methods available to this evaluation and its formative nature preclude more definitive assessment of the program’s effectiveness and value. In particular, the lack of a comparison group keeps us from concluding any of the above findings definitively enough to generalize to caregivers beyond those in the study. However, the preponderance of the data available points in that direction leads to the interim conclusion that the program is effective and clearly much appreciated by the people served by it. Given this, we offer two policy recommendations:
1. Sustain the existing program, and 2. Increase the scope of the program across time and more sites in order to facilitate more
definitive evaluation of its effects, their durability over time, and cost-benefits.
More specific programmatic recommendations will be provided as part of the replication manual that will be developed subsequent to this report.