cash crop report 2015 - agri · pdf filecash crop report 2015 key results of the 2014 agri...
TRANSCRIPT
Report
2015/3
Cash Crop Report 2015
Key results of the 2014 agri benchmark farm comparison

Cover photo: © Pierre-Yves Babelon/fotolia.com

Working Paper 2014/5
agri benchmark Cash Crop Report 2015 Key results of the 2014 agri benchmark farm comparison1
Yelto Zimmer2
Table of Contents
1 Introduction 1
2 Global agri benchmark Cash Crop Partners 3
3 Evolution of major commodity world markets in 2014 7
4 Economics of wheat production in 2014 10
5 Economics irrigated vs. non-irrigated corn 17
6 Rapeseed vs. sunflowers and soybeans- How do oilseeds compare on-farm economically? 22
7 Economics of rice production in Africa vs. Vietnam 30
1 Please cite as follows: Zimmer, Yelto et al. (2015): agri benchmark Cash Crop Report 2015, Thünen Institute,
Braunschweig, Germany. 2 Coordinator agri benchmark Cash Crop Network, Thünen Institute of Farm Economics,
contact: [email protected].

Economics of Global Crop Production 2014 - 2 -
1 Introduction
2014 was a challenging year for many crop producers in the world. While prices were still relatively high when comparing them to pre-boom levels they have gone down now for the second time in a row. In countries such as the USA, this decline was rather sharp while in others such as Brazil, Russia or the EU, it was only modest – mainly because of currency devaluation.
In this report we take a closer look at the following topics: (1) Economics of global wheat production, (2) How profitable is irrigation in corn, (3) On-farm competitiveness of rapeseed vs. sunflower and soybeans and (4) Economics of rice production in typical farms in Africa and Asia. For more information and analysis – please get in touch with us (e-mail: [email protected]). Our methodological background can be found here: www.agribenchmark.org/cash-crop/publications-and-projects0/ methodology.html. On pages 3 to 5 the reader may find an overview of agri benchmark network partners who are co-authors of this report. The performance of agri benchmark is based on the contributions of all partners involved. We also thank our commercial partners for their financial support.
The names of the typical farms should be read like this: the first two letters indicate the country, the figure refers to the size of the farm in hectares, and the letter code at the end represents the region. The farms analyzed represent the prevailing production systems in the “hot spots” of crop production in the member countries. Therefore, the results are not representative for the whole country. A more detailed explanation can be found here: http://www.agribenchmark.org/fileadmin/Dateiablage/B-Cash-Crop/Misc/SOP-cashcrop-0512.pdf
agri benchmark Cash Crop is a non-profit global farm comparison network, which is driven by farm economists from more the 35 countries, local advisors and growers3. We combine our farm-level knowledge with an analysis of international commodity markets and value chains. In this way we are able to provide scientifically consistent and soundly based answers on strategic issues to decision-makers in policy, agriculture and agribusiness.
3 For more information on agri benchmark, see our website: www.agribenchmark.org

Economics of Global Crop Production 2014 - 3 -
2 Global agri benchmark Cash Crop Partners
Europe
Yelto Zimmer Thomas de Witte Tanja Möllmann
Samuel Balieiro Friederike Rösner Elizabeth Lunik
Sergey Chetvertakov Barbara Wildegger
Institute of Farm Economics, Johann Heinrich von Thünen Institute (TI), Braunschweig, Germany
Benoît PagesArvalis – Institut du Végétal, Economic Studies Department, Paris, France
Ben LangDepartment of Land Economy, University of Cambridge, Cambridge, United Kingdom
Svea SieversGerman Agricultural Society (DLG), Frankfurt, Germany
Reimer MohrHanse Agro GmbH, Bordesholm, Germany
Zoltán ZsigaUniversity of Kaposvar Kaposvar, Hungary
Peter Borreby Ole Maagaard Pedersen Michael Stensgaard ToftPatriotisk Selskab, Odense, DenmarkKlaus Nehring
Insight Investment, London, United Kingdom
Nele JurkenaiteLithuanian Institute of Agrarian Economics (LIAE), Vilnius, Lithuania
The agri benchmark Cash Crop network
agri benchmark researchers, co-editors

Economics of Global Crop Production 2014 - 4 -
Europe (continued)
Elena GueorguievaCeres Agriculture Fund Limited, Sofia, Bulgaria
Johan LagerholmLantmännen, Stockholm, Sweden
Pawel BoczarPoznań University of Life Sciences, Poznan, Poland
Igor OstapchukAssociation Ukrainian Agribusiness Club (UCAB), Kiev, Ukraine
Dmitri Rylko Evgeny ZaytsevInstitute for Agricultural Market Studies (IKAR), Moscow, Russian Federation
Bohdana Janotová Jan BoudnýUZEI – Institute of Agricultural Economics and Information, Prague, Czech Republic
Xiangdong HuInstitute of Agricultural Economics and Development, Chinese Academy of Agricultural Science, Beijing, P.R. China
Hisako SekineNational Agriculte and Food Research Organization, Tsukuba, Ibaraki, Japan
Somporn Isvilanonda Piyatat PananurakKnowledge Network Institute of Thailand (KNIT), Bangkok, Thailand
Evangeline Sibayan Jesusa C. BeltranPhilRice, Science City of Munoz, Philippines
Khamsavang SombounkhanhChampasak Agriculture and Forestry College, Pakse, Champasak Province, Laos
Khiem Nguyen TriAn Giang University, Long Xuyen, Vietnam
Pipat WeerathawornNational Research Council of Thai-land (NRCT), Bangkok, Thailand
SDCC Sustainable Development
Climate Change Luan Nguyen NgocSustainable Development Climate Change (SDCC), HCM city, Vietnam
Mohd Arif SimehMalaysian Palm Oil Board (MPOB), Kajang, Selangor, Malaysia
Tin Maung ShweAgribusiness and Rural Development Consults, Pbedan Township, Yangon, Myanmar
Razak PurbaIndonesian Oil Palm Research Institute (IOPRI), Medan, Indonesia
Asia

Economics of Global Crop Production 2014 - 5 -
Africa
Mohamed BoughlalaCentre Régional de la Recherche Agronomique (INRA), Settat, Morocco
Divan van der Westhuizen Tracy DavidsUniversity of Pretoria, Bureau for Food & Agricultural Policy (BFAP), Pretoria, South AfricaAdama Ouédraogo
Institut National pour L'Environment et de Recherches Agricoles, Ouagadougon, Burkina Faso
Natson Eyram AmengorCrops Research Institute (CSIR), Kumasi, Ghana
Christo JoubertNational Agricultural Marketing Council (NAMC), Pretoria, South Africa
Wachira Kaguongo Charity Mukami MainaNational Potato Council of Kenya, Nairobi, Kenia
Sani Usman Musa Yusuf Muhammad HuduNational Agricultural Extension Research and Liaison Service, Zaria, Kaduna State, Nigeria
Juliana MwakasendoAgricultural Research Institute (ARI-UYOLE), Mbeya, Tanzania
North America
Richard A. Schoney Cecil NagyDepartment of Bioresource Policy Business and Economics, University of Saskatchewan, Saskatoon, Canada
Kelvin LeiboldDepartment of Economics, Iowa State University, Ames, Iowa, USA
John MolenhuisMinistry of Agriculture, Food and Rural Affairs, Brighton, Ontario, Canada
Michael LangemeierPurdue University, Center for Commercial Agriculture West Lafayette, Indiana, USA
Andrew L. SwensonDepartment of Agricultural Economics, North Dakota State University, Fargo, North Dakota, USA
Mykel TaylorDepartment of Agricultural Econom-ics, University of Kansas Manhattan, Kansas, USA
Economics of Global Crop Production 2014 - 6 -
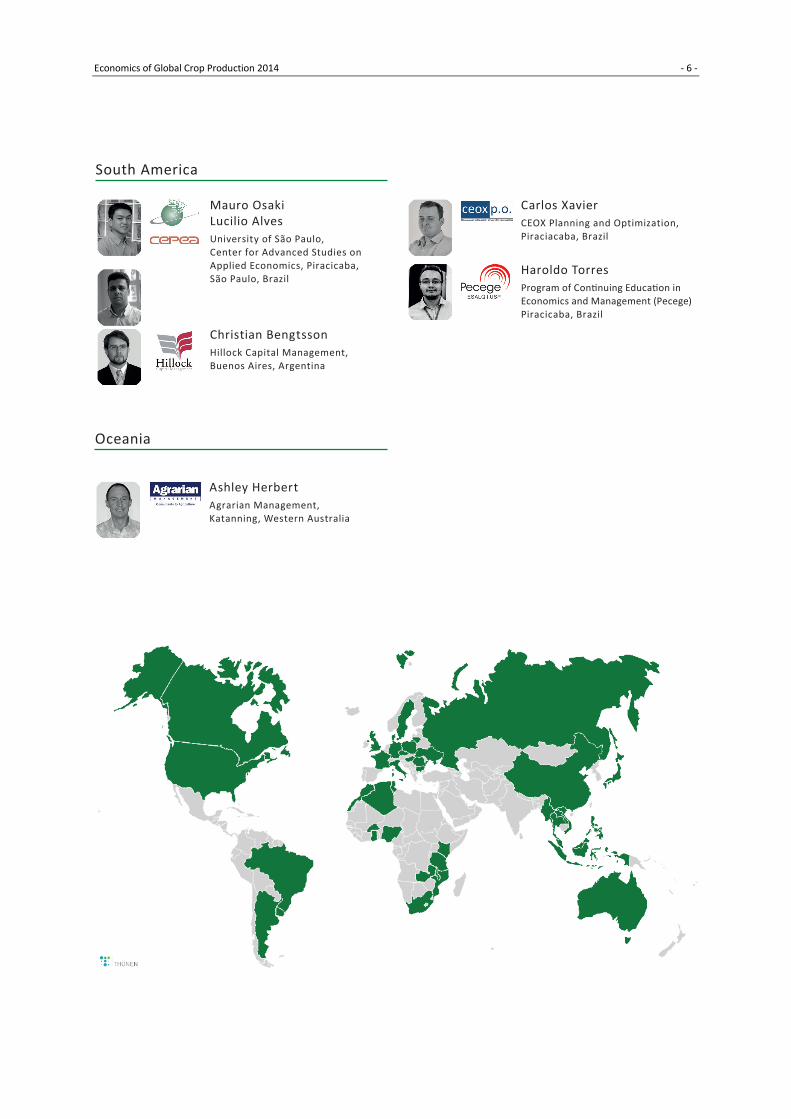
Oceania
Ashley HerbertAgrarian Management, Katanning, Western Australia
South America
Mauro Osaki Lucilio AlvesUniversity of São Paulo, Center for Advanced Studies on Applied Economics, Piracicaba, São Paulo, Brazil
Carlos XavierCEOX Planning and Optimization, Piraciacaba, Brazil
Haroldo TorresProgram of Continuing Education in Economics and Management (Pecege) Piracicaba, Brazil
Christian BengtssonHillock Capital Management, Buenos Aires, Argentina
Economics of Global Crop Production 2014 - 7 -
3 Evolution of major commodity world markets in 2014
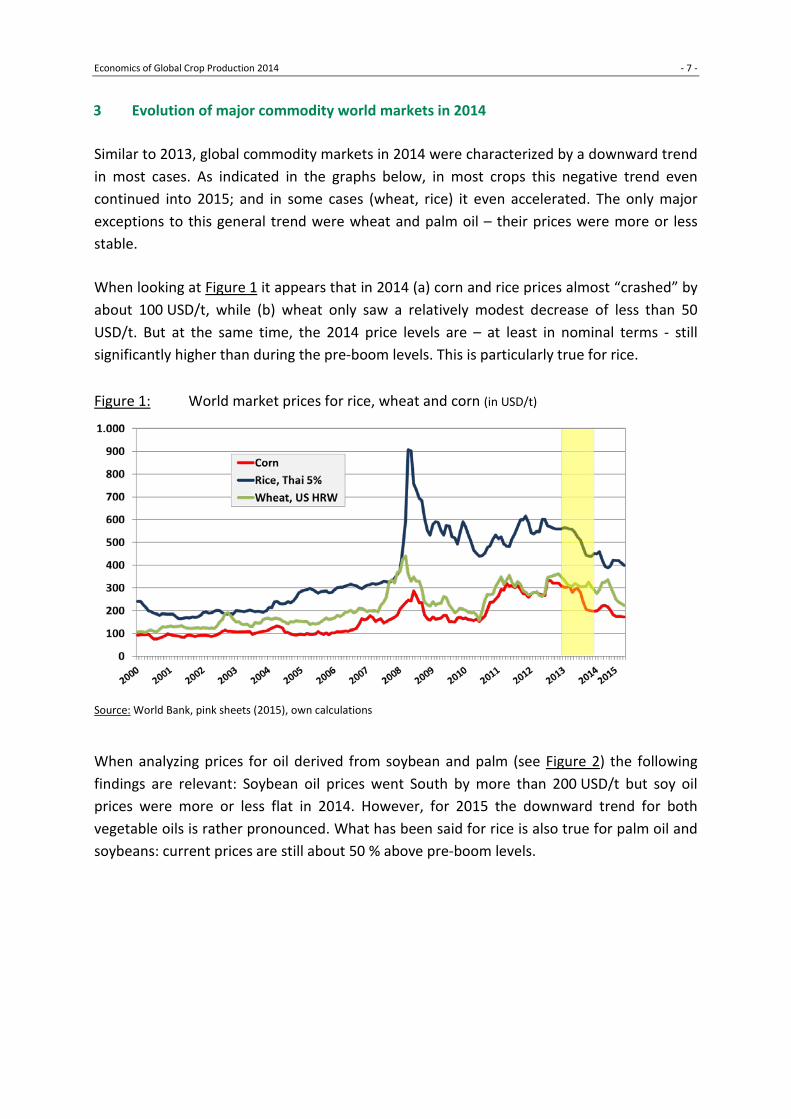
Similar to 2013, global commodity markets in 2014 were characterized by a downward trend in most cases. As indicated in the graphs below, in most crops this negative trend even continued into 2015; and in some cases (wheat, rice) it even accelerated. The only major exceptions to this general trend were wheat and palm oil – their prices were more or less stable.
When looking at Figure 1 it appears that in 2014 (a) corn and rice prices almost “crashed” by about 100 USD/t, while (b) wheat only saw a relatively modest decrease of less than 50 USD/t. But at the same time, the 2014 price levels are – at least in nominal terms - still significantly higher than during the pre-boom levels. This is particularly true for rice.
Figure 1: World market prices for rice, wheat and corn (in USD/t)
Source: World Bank, pink sheets (2015), own calculations
When analyzing prices for oil derived from soybean and palm (see Figure 2) the following findings are relevant: Soybean oil prices went South by more than 200 USD/t but soy oil prices were more or less flat in 2014. However, for 2015 the downward trend for both vegetable oils is rather pronounced. What has been said for rice is also true for palm oil and soybeans: current prices are still about 50 % above pre-boom levels.

Economics of Global Crop Production 2014 - 8 -
Figure 2: World market prices palm oil & soybean oil (USD/t)
Source: World Bank, pink sheets (2014), own calculations
Given the fact that economics of crop production are also dependent on input markets, in Figure 3 prices for key fertilizers and crude oil are displayed.
Figure 3: World market prices urea, DAP & crude oil (in USD/t or bbl)
Source: World Bank, pink sheets (2015), own calculations
Economics of Global Crop Production 2014 - 9 -
As far as these input factors are concerned it can be expected that the downward trend on output prices was partially compensated by lower costs. In fact, compared to 2013, urea prices went down by about 50 to 80 USD/t; while DAP prices decreased by approximately 100 USD/t. Of course, whether and to what degree this evolution in global markets was transferred to each domestic market needs to be checked.
Regarding farm-level analysis, these findings allow us to conclude that assuming average yields, revenues should have gone down for most of our typical farms. This general trend was to a certain degree compensated by lower fertilizer costs. Since fertilizers only account for 15 to 20 % of total costs on most of the farms, it is rather questionable whether profits have been stable compared to 2013.
Economics of Global Crop Production 2014 - 10 -
4 Economics of wheat production in 2014
By Elizabeth Lunik, Andy Swenson
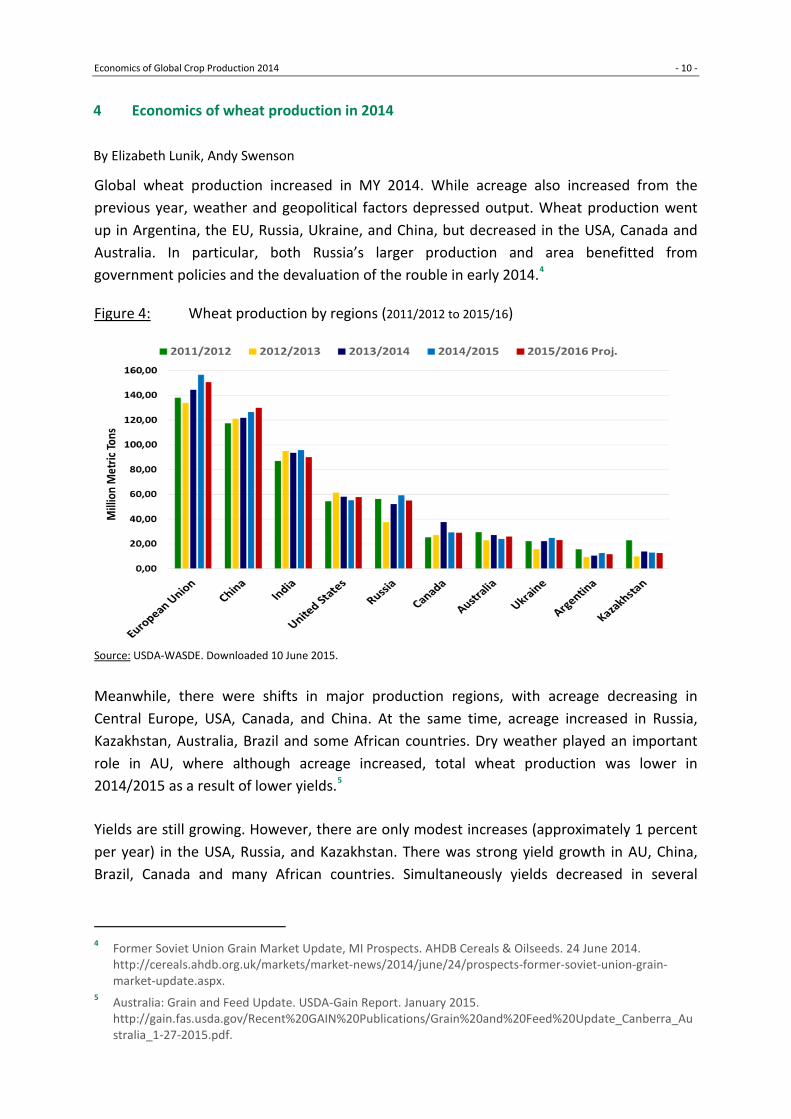
Global wheat production increased in MY 2014. While acreage also increased from the previous year, weather and geopolitical factors depressed output. Wheat production went up in Argentina, the EU, Russia, Ukraine, and China, but decreased in the USA, Canada and Australia. In particular, both Russia’s larger production and area benefitted from government policies and the devaluation of the rouble in early 2014.4
Figure 4: Wheat production by regions (2011/2012 to 2015/16)
Source: USDA-WASDE. Downloaded 10 June 2015.
Meanwhile, there were shifts in major production regions, with acreage decreasing in Central Europe, USA, Canada, and China. At the same time, acreage increased in Russia, Kazakhstan, Australia, Brazil and some African countries. Dry weather played an important role in AU, where although acreage increased, total wheat production was lower in 2014/2015 as a result of lower yields.5
Yields are still growing. However, there are only modest increases (approximately 1 percent per year) in the USA, Russia, and Kazakhstan. There was strong yield growth in AU, China, Brazil, Canada and many African countries. Simultaneously yields decreased in several
4 Former Soviet Union Grain Market Update, MI Prospects. AHDB Cereals & Oilseeds. 24 June 2014.
http://cereals.ahdb.org.uk/markets/market-news/2014/june/24/prospects-former-soviet-union-grain-market-update.aspx.
5 Australia: Grain and Feed Update. USDA-Gain Report. January 2015. http://gain.fas.usda.gov/Recent%20GAIN%20Publications/Grain%20and%20Feed%20Update_Canberra_Australia_1-27-2015.pdf.

Economics of Global Crop Production 2014 - 11 -
countries, such as the UK and France, due to pest problems. Russia experienced a modest increase in acreage and yields (despite a very low starting point).6
In Figure 5, 2014 wheat yields from all agri benchmark typical farms growing wheat can be seen. As always, yields were considerably higher in Europe than in North or South America, reflecting the more favorable agronomic conditions for wheat in this area, as well as the favorable incentives created by relatively high farm gate prices.
Figure 5: Wheat yields on typical farms (2014, t/ha)
Source: agri benchmark Cash Crop, 2014.
Case study of nine typical farms
While there are many farms with wheat rotations in our database, we focus on nine farms from major, wheat-export countries to gain a deeper understanding. The location, wheat
6 Zimmer, Y. and Balieiro, S. “Economic Challenges for Wheat Production from a Global Perspective.” 11 Feb
2015. Bayer CropScience-Cereal Future Forum 2015.
EU EAST NO. AMERICA SO. HEMISPHERE

Economics of Global Crop Production 2014 - 12 -
harvesting period, and years of rotation are detailed here: (1) AR700SBA, is located southeast of Buenos Aires, Argentina; harvest in November; wheat is a double crop in a 3-year rotation; (2) AU4000WB*, is located in the southwest region of Australia; harvest in November; a 4-year rotation; (3) CA2000SAS, is located in Saskatoon, Canada; harvest in late September; wheat follows rapeseed or peas in a 8-year rotation; (4) DE1300MB, is located in the Saxony-Anhalt region of Germany; harvest in August; grows wheat after wheat twice in a 6-year rotation; (5) DK605FYN, located south of Odense, Denmark; harvest in August; wheat follows rapeseed in a 8-year rotation; (6) PL2011ST*, located in Stargard county in Poland; harvest in July; wheat follows rapeseed or sugar beets in a 3-year rotation; (7) RU200000BS, located in the Black Soils region in Russia; harvest in July; a 4-year rotation; (8) UA2600WU, located near Kremenets, Ukraine; harvest in July; wheat once in a 5-year rotation; (9) US1000ND, located in Barnes county, North Dakota, U.S.; harvest in August; and 4-year rotation.
Figure 6 shows the 2014 yields for the nine farms. All of these farms reached 2014 yields higher than their 2010-2014 average yields, except for the Canadian and Argentine farm. These farms can be divided into low-yield and high-yield systems. Surprisingly, many major wheat-producing countries have low yields (AU, CA, USA, and RU) of between 1,5 to 3 tons per hectare.
Figure 6: Wheat yields of typical farms (2014, t/ha)
Source: agri benchmark Cash Crop (2015). The same for the following figures.
Economics of wheat production on per hectare basis
The low-yield systems correspond with lower input costs per hectare. As seen in Figure 7, the typical farms in AR, AU, CA, RU, and UA, for example, had crop establishment costs under 250 USD/ha. Meanwhile, EU farms operated with a higher establishment costs on a per hectare basis, especially with regards to crop protection costs. In Ukraine, farmers reduced their inputs in 2014, due to the economic problems and the increased cost of inputs—at least fertilizers— due to the devaluation of the currency.

Economics of Global Crop Production 2014 - 13 -
Figure 7: Crop establishment costs of typical farms (2014, USD/ha)
As usual, EU farms also had much higher operating costs, in particular due to labor costs. The Argentine farm was very efficient due to competitive contractor industry, and the AU, BR, CA and US farms were on a similar level. The substantial labor costs on the Danish farm reflect the scarce labor available.
Figure 8: Operating costs of case study farms (2014, USD/ha)
Total costs, gross revenues, and decoupled payments (USD/ha)
In 2014, typical farms in DE, PL, RU and UA were profitable in wheat production. It should be highlighted though, that the agri benchmark definition of profitability is different from most profit and loss account calculations because (a) it includes opportunity cost for labor, land and capital provided by the family and (b) because depreciation is calculated against
Economics of Global Crop Production 2014 - 14 -
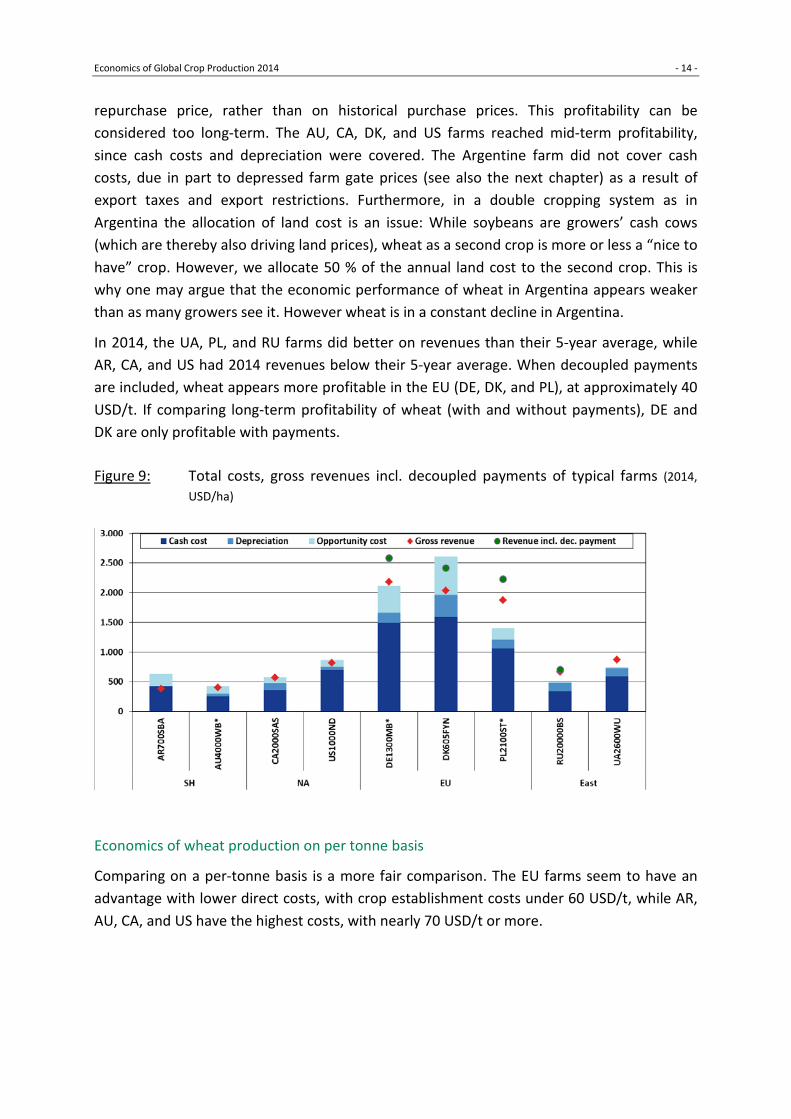
repurchase price, rather than on historical purchase prices. This profitability can be considered too long-term. The AU, CA, DK, and US farms reached mid-term profitability, since cash costs and depreciation were covered. The Argentine farm did not cover cash costs, due in part to depressed farm gate prices (see also the next chapter) as a result of export taxes and export restrictions. Furthermore, in a double cropping system as in Argentina the allocation of land cost is an issue: While soybeans are growers’ cash cows (which are thereby also driving land prices), wheat as a second crop is more or less a “nice to have” crop. However, we allocate 50 % of the annual land cost to the second crop. This is why one may argue that the economic performance of wheat in Argentina appears weaker than as many growers see it. However wheat is in a constant decline in Argentina.
In 2014, the UA, PL, and RU farms did better on revenues than their 5-year average, while AR, CA, and US had 2014 revenues below their 5-year average. When decoupled payments are included, wheat appears more profitable in the EU (DE, DK, and PL), at approximately 40 USD/t. If comparing long-term profitability of wheat (with and without payments), DE and DK are only profitable with payments.
Figure 9: Total costs, gross revenues incl. decoupled payments of typical farms (2014, USD/ha)
Economics of wheat production on per tonne basis
Comparing on a per-tonne basis is a more fair comparison. The EU farms seem to have an advantage with lower direct costs, with crop establishment costs under 60 USD/t, while AR, AU, CA, and US have the highest costs, with nearly 70 USD/t or more.

Economics of Global Crop Production 2014 - 15 -
Figure 10: Crop establishment costs of typical farms (2014, USD/t)
In Figure 11, when looking at per tonne values, again AR has outstanding operating efficiency due to use of contractors. CA, US, and DE are still very competitive, despite high wage rates. EU farms (except DK) tend to have lower operating costs per tonne, despite lower labor efficiency than North America. Again on a per tonne basis, the Danish farm had the highest operating costs in the group, due to high wages and machinery depreciation costs. Interestingly, the AU farm reversed its position. On a per hectare basis, it was the lower cost producer, while on a per tonne basis it is close to the DK farm. Finally, on the UA farm, despite low wage rates (approximately 1,45 USD/ha), labor costs per ton is not that low because much of the labor costs go to overhead, and labor productivity on the field is low due to management issues (nearly 4xs labor input per ton as the next farm—RU).
Figure 11: Operating costs of typical farms (2014, USD/t)

Economics of Global Crop Production 2014 - 16 -
Total costs, gross revenues, and decoupled payments (USD/t)
When looking at total cost and gross revenues the following issues are worth mentioning:
• While for the “western” farms wheat prices are fairly similar, the farm in Argentina, Russia, and Ukraine had to accept significant discounts.
• Within the group of western farms, the Canadian farm experienced the lowest prices – despite the fact that Canadian wheat tends to be high quality, commanding a premium. It can be assumed that this is due to the shortage in transport capacities.
• Direct payments in the EU are a very important component in economics of crop production.
• Russia started to move in that direction as well, while in the US this kind of intervention is almost meaningless.
Figure 12: Total costs, gross revenues incl. decoupled payments of typical farms (2014, USD/t)

Economics of Global Crop Production 2014 - 17 -
5 Economics irrigated vs. non-irrigated corn
By Samuel Balieiro
Irrigation is commonly accepted as an important strategy to enhance productivity of crops, as well as to enable cultivation in regions where rain patterns are insufficient for rainfed production. Corn is irrigated in several countries belonging to the agri benchmark cash crop network; however only in a few cases both irrigated and non-irrigated corn are produced side-by-side in one typical farm. Therefore, only three typical farms will used as basis for the economic analysis of irrigation in corn. These farms are located in Lalomitia County, southeastern Romania (RO6500IL), northwest Kansas, USA (US2025KS), and in the region Western Free State of South Africa (ZA1700WFS).
Figure 13: Comparison of corn yields in the typical farms (t/ha)
Figure 13 shows yields differences between rainfed and irrigated corn in these mentioned farms for 2012 and 2013. In all regions irrigation appears to bring a significant increase in yields, with more than doubling yields on the US and ZA farms. The Romanian farm also obtained a tremendous increase in yields, around 80% when compared to rainfed production. Interestingly, across these regions the yields of rainfed corn varies around 4 to 6 tons per ha, whereas irrigated yields vary from 9 to more than 12 tons per ha, showing a rather homogenous pattern across countries. However the question is: what are the effects on costs of production when moving from rainfed to irrigated corn on a per tonne basis? While it is obvious that such a major step to intensify production will lead to increasing cost on a per hectare basis, the effect on unit cost is far from being clear.
Economics of Global Crop Production 2014 - 18 -
Irrigated Rainfed Difference Irrigated¹ Rainfed DifferenceMachinery & Labor (Irrigation) USD/ha 85 + 85 180 + 180Investments (pivot & power units)
Price USD 80,000 57,000Depreciation years 25 22Salvage value USD 7,000 26,000
Irrigation (variable cost) USD/ha 180 + 180 360 + 360Total labor cost USD/ha 55 50 + 5 85 110 + 9Other operating costs USD/ha 290 250 + 40 330 330 0Total cost per ha² USD/ha 1,500 850 + 650 1,700 800 + 900Input cost² USD/t 120 190 - 70 160 185 - 25
¹ intensive ti l lage system while raifed is under conservational ti l lage system² excluding land costs
Item UnitUS2015KS ZA1700WFS
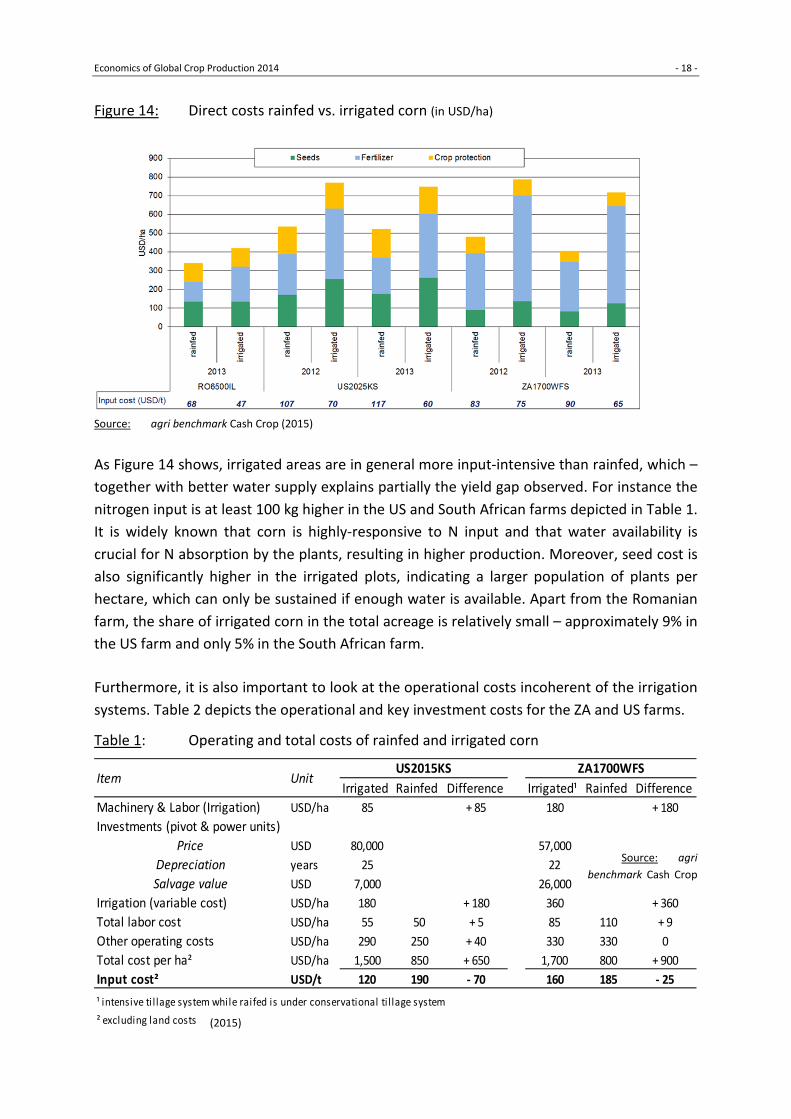
Figure 14: Direct costs rainfed vs. irrigated corn (in USD/ha)
Source: agri benchmark Cash Crop (2015)
As Figure 14 shows, irrigated areas are in general more input-intensive than rainfed, which – together with better water supply explains partially the yield gap observed. For instance the nitrogen input is at least 100 kg higher in the US and South African farms depicted in Table 1. It is widely known that corn is highly-responsive to N input and that water availability is crucial for N absorption by the plants, resulting in higher production. Moreover, seed cost is also significantly higher in the irrigated plots, indicating a larger population of plants per hectare, which can only be sustained if enough water is available. Apart from the Romanian farm, the share of irrigated corn in the total acreage is relatively small – approximately 9% in the US farm and only 5% in the South African farm.
Furthermore, it is also important to look at the operational costs incoherent of the irrigation systems. Table 2 depicts the operational and key investment costs for the ZA and US farms.
Table 1: Operating and total costs of rainfed and irrigated corn
Source: agri benchmark Cash Crop
(2015)

Economics of Global Crop Production 2014 - 19 -
As Table 1 shows irrigation costs are an additional 650 USD/ha in the US and 900 USD/ha in South Africa. However due to the significant gains in productivity, it reduces the tonnage cost by 70 and 25 USD/t, respectively. When comparing US to South Africa it becomes clear that the former has much lower variable cost – i.e. half, but rather higher investment when it comes to the pivot acquisition – approximately 40% higher. From the current data, it appears that there is a strong market for used irrigation machinery in South Africa, since salvage values are relatively high (i.e. 45% of the purchase price). That does not seem to be the case in the US, where the residue value is less than 10% of the value of new equipment.
The interesting finding from Table 1 is that while on a per hectare basis the increase in cost (both in variable cost as well as in operating cost) is rather significant, the cost per unit is actually lower in the irrigated system when compared to rainfed systems. The obvious reason is that the increase in total cost is lower than the increase in yield. When considering the profitability of land use the finding implies that irrigation greatly increases return to land, which we define as the margin of gross revenue over total cost, excluding land cost and direct payments. In Figure 15 these figures are presented. What is important is that the increase in return to land is indeed very strong – at least 50 % and up to fivefold.
Figure 15: Returns to land in selected typical farms comparing rainfed to irrigated corn (USD/ha)
Source: agri benchmark Cash Crop (2015)
As expected all farms experienced higher returns to land from corn produced under irrigation. The US farm shows an interesting pattern: in 2012 when corn prices were relatively high, both alternatives brought positive returns to land, with the irrigated corn bringing almost 3 times higher returns. Interestingly, in 2013, when the corn prices were around USD 180/t, the rainfed corn brought negative returns to land, whereas the irrigated

Economics of Global Crop Production 2014 - 20 -
corn was able to bring returns of more than USD 800/ha. Therefore, it is safe to assume that yield gains in irrigated corn were able to secure positive returns to land even when prices are not favorable for rainfed corn production. A similar pattern can be seen in the South African farm, even though both alternatives were still profitable in 2013. Apparently prices did not react as strong as in North America.
In summary, the results indicate that irrigation is a very profitable investment for corn production, which combined with higher intensity of inputs, brings impressive gains in productivity. These gains are able to overrule the increase in cost resulting in significant reduction of production costs in a per ton basis. Moreover, drop in corn prices in 2013 affected more significantly the rainfed production, with irrigated corn bringing still relatively high returns to land. In most parts of the world, access to water (legally and technically) is a major constraint. Still these figures indicate how attractive it can be for growers who have access and are even willing to invest in water storage facilities.
Economics of Global Crop Production 2014 - 21 -
6 Rapeseed vs. sunflowers and soybeans- How do oilseeds compare on-farm economically?
By Y. Zimmer, R. Mohr, J. Zimmermann, E. Huber
Introduction
In many parts of the world, at the farm level there used to be little to no competition between rapeseed and other oilseeds, such as sunflowers or soybeans. However, in a growing number of regions growers actually have such a choice. Due to improved breeding and new varieties, more sites are becoming suitable for new crops – e.g. soybeans in Canada - plus, growers are becoming aware of new options they didn’t have in the past due to political and market restrictions.
As economic framework conditions become tighter for crop production, it is worthwhile to better understand the strengths and weaknesses of these oilseed crops from a grower’s perspective. Then it will be possible to draw conclusions regarding future trends in crop acreage. Therefore the authors decided to run case studies7 to evaluate the on-farm competitiveness of rapeseed vs. competing oilseeds for agri benchmark farms in Canada, Hungary and Ukraine.
The key questions to be addressed are:
(1) How do the three crops compare on-farm in terms of profitability?
(2) Are there any major differences regarding working capital needs? And if so, does that change the likelihood that growers will prefer one crop over another?
(3) Are there any other non-monetary factors, such as rotational benefits or liabilities that will impact grower’s preferences for either of the crops?
In order to have a solid basis to answer these questions, the 3-year average data (2012-2014) will be used. With regard to the last question, expert opinions from growers and advisors will be referred to.
The section is organized as follows: First, the individual results from each of the three case studies will be presented. Since structural conditions and business models differ significantly within the farming population in Hungary and Ukraine, there are two farms included in each of these case studies to represent the different farm structures. Finally, the results will be compared across all farms and we will draw some conclusions. More graphs illustrating both the statistics cited here, as well as the farm economics, are available here: http://www.agribenchmark.org/cash-crop/sector-country-farm-information/oilseeds.html.
7 The authors are grateful for financial support for this project from the Canadian Canola Growers Association.
Results from this research have been presented at the 2015 International Rapeseed Conference.

Economics of Global Crop Production 2014 - 22 -
Oilseed production in Manitoba/Canada
Manitoba has seen a massive expansion in soybean acreage moving from almost zero in 2005 to about half a million hectares in 2015. However, while rapeseed acreage has gone down a bit in recent years, it is still by far the most important oilseed with about 1 million hectares.
The growth in soybeans is an “invasion” from the South, as soybean genetics have continuously been adapted from varieties coming from the major soybean-growing areas in the United States. The key drivers for this increase in acreage are: (a) breeders have developed varieties with a shorter growing period and (2) climate change extended the frost free season. Yield statistics indicate that rapeseed yields in Manitoba are approximately 2 t/ha and soybeans yields about the same.
The typical farm we are considering here is about 2,000 ha in size; and is located close to Winnipeg with an annual precipitation of about 500 mm. The planted crop shares are as follows: 45 % wheat (2/3 spring, 1/3 winter wheat), 35 % spring rapeseed and 25 % soybeans. Oilseed yield levels are slightly higher for this farm when compared to the provincial average; both crops are at about 2.5 t/ha. This advantage stems from the fact that this region is more favorable for crop production than other parts of the province. The tillage system is mulch seeding, which is a bit more intensive (one pass harrowing after harvest) than the no-till system applied in most parts of the Prairie Provinces.
Table 2 contains key economic data for the two crops (2012-2014 average). It appears that the overall profitability of soybeans compared to rapeseed was significantly higher: +100 USD/ha or 50 % more. Even more important is that in a relatively poor year such as 2014 with low crop prices and only moderate yields in rapeseed, the return to land8 was negative for rapeseed (-50 USD/ha) while soybeans still generated a positive return to land of approximately 50 USD/ha.
8 We define the term as follows: gross revenue minus total cost (excluding land cost).

Economics of Global Crop Production 2014 - 23 -
Table 2: Key features rapeseed & soybeans CA2000RRV (Ø 2012 -2014)
Rapeseed Soybeans Price (USD/ha) 460 430
Direct cost (USD/ha) 500 300 Seed
Nitrogen Crop protection
160 150 100
190 10 50
Operating cost (USD/ha) 270 230 Return to land (USD/ha) 200 300 Liquidity needs (USD/ha) 700 500
Source: agri benchmark Cash Crop (2015)
Finally, it is obvious from the empirical findings that soybeans are far less demanding in regards to liquidity needs. While growers have to spend about 700 USD/ha for rapeseed, they only spend 500 USD/ha for soybeans.
Beyond these cost considerations of the two crops non-monetary factors are relevant. When compared to rapeseed, soybeans have the following advantages: • Their production cycle within the year is different than rapeseed. Soybeans are seeded
later and harvested later in order to help stretch out machinery use and avoid high workload periods.
• Soybeans can better cope with wet conditions, which is an important consideration in the region considered here.
• Soybeans are less prone to heating in storage, which is of some concern to growers in Manitoba.
On the contrary, soybeans have some disadvantages relative to rapeseed: • Growers may need some special equipment (land rollers, special combine headers, etc.) • Soybeans are more susceptible to early and late frost, which again is a relevant issue in
Manitoba.
Conclusions for Manitoba
From the data presented here, it can be concluded that rapeseed will remain a core element of rotations in Manitoba, but soybean acreage will expand in the years to come. In particular, soybeans may expand quickly if crop prices diminish further because this will make it even harder for growers to obtain finance.
Another favorable condition for soybeans: So far the majority of output has been exported from the region, with respective negative impact on farm gate prices. Currently local processing facilities are under construction with anticipation of increased local consumption, and hence farm gate prices will go up – at least relatively.

Economics of Global Crop Production 2014 - 24 -
Oilseed production in Ukraine – Holding farm vs. owner operations
Ukraine used to be a pure “sunflower” country – both soybeans and rapeseed are newcomers since the early 2000s. Still sunflowers account for about 5 million ha (approximately 65 %), while soybeans and rapeseed only cover approximately 1.5 million and 1 million ha, respectively. However, the average growth rates in acreage for the two crops are impressive: 18 and 24 %, respectively, between 2003 and2013. It should be noted that while it’s not legal to produce GM soybeans, a significant portion of the output is indeed GM.
In Ukraine, the analysis includes two typical farms. One is located in the West and is part of a large agro-holding (UA2600WU). The other farm is operating in the central region and is a top-performing farm managed by Western growers (UA2000CU), as well as supported by Western investors. Both farms enjoy the benefits from deep black soils, but UA2600WU receives a bit more precipitation (600 vs. 550 mm). The latter does mulch seeding, while the other runs a minimum tillage system.
Figure 16: Crops planted on UA2600WU and UA2000CU farms (ha)
UA2600WU UA2000CU
Source: agri benchmark Cash Crop (2015)
The planted crop shares of the two farms are displayed in Figure 16. It appears that the holding farm has similar rapeseed and soybean acreage; which is the same on the Western farm for rapeseed and sunflowers. Furthermore, the Western farm is more “grain-driven” (+70 %) than the holding farm (50 %).
Table 3 contains key economic data for oilseeds at the two farms. The most important findings are:
(1) In terms of return to land, rapeseed outcompetes sunflowers by a margin of about 340 USD/ha, or by more than 50 %, on the top-performing farm.
(2) For the agro-holding farm, the two oilseeds have been about the same with regards to return to land (+/- 200 USD/ha). However, liquidity needs for rapeseed are more than twice as high as in soybeans.

Economics of Global Crop Production 2014 - 25 -
(3) The holding farm treats soybeans much more extensive than rapeseed. This is true not only with regards to inputs (360 USD/ha vs. 170 USD/ha), but also for operating costs (420 USD/ha vs. 250 USD/ha).
(4) Given the fact that inoculants for soybeans are still far from being optimal for conditions in Ukraine, growers tend to use some nitrogen. Similar practices can be observed in Russia.
(5) Despite the fact that climatic conditions tend to be a bit better for the holding farm, rapeseed yields are rather low compared to the top-performing individual farm. When considering the use of nitrogen and crop protection this difference cannot entirely be explained by differences in intensity of inputs used. Together with low yields in soybeans, it is assumed that farm management and business strategy also play a significant role.
Table 3: Key features of oilseeds for UA2600WU and UA2000CU (Ø 2012 -2014)
UA2000CU UA2600WU Rapeseed Sunflowers Rapeseed Soybeans Yields (t/ha) 4 3.5 2.7 1.7 Price (USD/t) 450 380 430 410 Direct cost (USD/ha) 380 330 360 170 Seed Nitrogen Crop protection
30 170 75
60 50 50
50 130 120
65 20 60
Operating cost (USD/ha) 400 360 420 250 Return to land (USD/ha) 940 600 200 180 Liquidity needs (USD/ha) 420 355 415 190
Source: agri benchmark Cash Crop (2015)
Non-monetary effects
Crop choices are influenced very often by factors other than profits. These factors have been considered for the two typical farms. On the holding farm (UA2600WU), when compared to soybeans, rapeseed has the following advantages:
• Rapeseed is a superior preceding crop to wheat when compared to soybeans. The yield penalty for wheat following soybeans is in the range of 1/ha because of later seeding times.
• Since rapeseed is sold to Western Europe markets, conditions and prices tend to be better than for soybeans, which are primarily marketed locally.
For the top-performing individual farm (UA2000CU), rapeseed is also the better preceding crop to wheat when compared to sunflowers, because harvest takes place earlier (approximate 5 % yield advantage for wheat).
Economics of Global Crop Production 2014 - 26 -
Conclusions for Ukraine
Typical farm data suggest that under Ukrainian conditions, rapeseed is the best crop for top-performing growers, who operate high intensity systems. Rapeseed tends to yield better than sunflower, and prices have been better as well. In such an environment it can be expected that there is significant room for further growth of rapeseed acreage.
On the contrary, for holding farms it seems to be hard for rapeseed to compete against soybeans, especially if crop prices will further decrease, and thereby farm liquidity becomes an even more important criterion. Further, holding farms have systematic problems to improve technical performance (problems to incentivize and control operators). This is why corn as a more “industrial crop” is a more attractive option for them when compared to wheat. Since soybeans nicely fit into corn rotations – and not that well into wheat rotations – it can assumed that rapeseed will have even more problems to compete against soybeans on such farms.
Oilseed production in Hungary – Traditional local farms vs. western producers
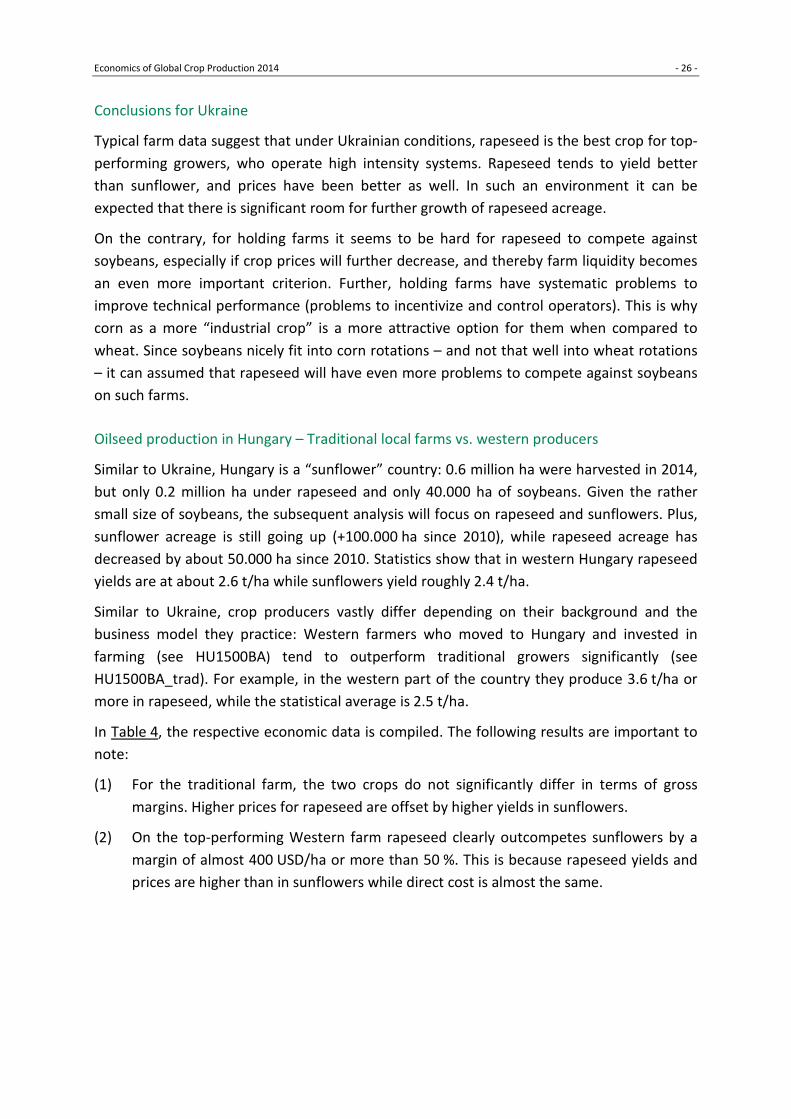
Similar to Ukraine, Hungary is a “sunflower” country: 0.6 million ha were harvested in 2014, but only 0.2 million ha under rapeseed and only 40.000 ha of soybeans. Given the rather small size of soybeans, the subsequent analysis will focus on rapeseed and sunflowers. Plus, sunflower acreage is still going up (+100.000 ha since 2010), while rapeseed acreage has decreased by about 50.000 ha since 2010. Statistics show that in western Hungary rapeseed yields are at about 2.6 t/ha while sunflowers yield roughly 2.4 t/ha.
Similar to Ukraine, crop producers vastly differ depending on their background and the business model they practice: Western farmers who moved to Hungary and invested in farming (see HU1500BA) tend to outperform traditional growers significantly (see HU1500BA_trad). For example, in the western part of the country they produce 3.6 t/ha or more in rapeseed, while the statistical average is 2.5 t/ha.
In Table 4, the respective economic data is compiled. The following results are important to note:
(1) For the traditional farm, the two crops do not significantly differ in terms of gross margins. Higher prices for rapeseed are offset by higher yields in sunflowers.
(2) On the top-performing Western farm rapeseed clearly outcompetes sunflowers by a margin of almost 400 USD/ha or more than 50 %. This is because rapeseed yields and prices are higher than in sunflowers while direct cost is almost the same.

Economics of Global Crop Production 2014 - 27 -
Table 4: Key features of oilseeds for HU1500BA and HU1500BA_trad (Ø 2012 -2014)
HU1500BA HU1500BA_trad Rapeseed Sunflowers Rapeseed Sunflowers Yields (t/ha) 3.6 3.2 2.5 2.7 Price (USD/t) 400 360 390 360 Direct cost (USD/ha) 550 560 500 460 Seed Nitrogen Crop protection
60 180 210
80 150 190
50 170 210
70 100 170
Gross margin (USD/ha) 890 570 480 460
Source: Hanse Agro (2015)
Conclusions for Hungary
The data presented here suggest that the top-performing Hungarian farm is way better off with rapeseed than with sunflower. This is primarily due to higher prices and higher yields for rapeseed. Therefore it seems that if more Western technology and know-how becomes adopted by Hungarian agriculture, rapeseed will benefit in terms of acreage and output.
For traditional producers the situation looks quite different: Here gross margins for the two crops are almost identical while direct cost is higher for rapeseed compared to sunflowers. This situation limits the potential for rapeseed acreage in this market segment.
Conclusions for on-farm competitiveness of oilseeds
Based on the analysis presented here the following conclusions can be drawn:
(1) The economics of oilseeds differ significantly with management skills and intensity levels: For top-performing growers in Hungary and Ukraine who use a lot of inputs in a sophisticated manor, rapeseed tends to be the most profitable oilseed. This implies that know-how and technology adoption may lead to more rapeseed production. However, it has to be kept in mind that as of today soybeans are less developed in these countries, both in terms of varieties as well as regarding inoculants. Also, growers are lacking experience in this particular crop.
(2) If local soybean varieties are available, as well as the know-how, soybeans would be very competitive vs. rapeseed. This rather strong position of soybeans in Canada – compared to the situation in Europe – can eventually be explained by the fact that rapeseed is only produced as a spring crop in Canada, whereas in Europe winter rapeseed is grown. The status “winter crop” implies a rather high yield level when compared to spring crops soybeans and sunflowers. Furthermore, in the Americas revenue from soybean breeding is much more attractive compared to the non-GM breeding in Europe. This is because the GM traits bred into varieties in the Americas allows breeders to recover their investments and to generate a higher profit.

Economics of Global Crop Production 2014 - 28 -
(3) Again, in regions in which winter crops are being produced, there are strong rotational benefits from rapeseed when produced together with wheat.
(4) On the contrary, when corn is the first choice of growers, sunflowers and soybeans do not result in yield penalties in the subsequent wheat crop.
(5) In a situation in which liquidity and/or risks are important constraints, soybeans tend to be the better options for growers because they tend to be relatively low input crops and hence low cost.

Economics of Global Crop Production 2014 - 29 -
7 Economics of rice production in Africa vs. Vietnam
In this report for the first time we present key results from a global comparison in rice. Based on our work for CARI9 we are able to include typical farm data for Nigeria and Tanzania. This is of particular importance since (a) rice is a fast growing food in Africa, and (b) in most African countries rice imports are necessary to meet demand and consumer preferences. On the other hand, Asian countries – in particular Vietnam – are major exporters into Africa.
In this section we will therefore compare the data for the two African countries with data from typical farms in Vietnam. What is important to know is the fact that generally African consumers perceive domestically produced rice as being inferior in terms of quality relative to imported rice. Therefore, a comprehensive comparison does not only have to look at cost of production as a key parameter for competitiveness but also at quality. However, this first analysis will not be able to take this factor into account; of course in the future this needs to be done.
Finally, one has to know that in most African countries rice is a highly protected crop (e.g. in Tanzania import tariff is at 75 %). These tariffs however, are to a certain degree undermined by illegal imports from neighboring countries with lower tariffs or even none. As in Asia, African rice production is predominantly performed by smallholders. Very often it is a staple food for the farmer’s family as well as a cash crop. More comprehensive information on rice production in Tanzania and Nigeria, as well as on the features of the typical farms presented hereinafter is available on the agri benchmark website: http://www.agribenchmark.org/cash-crop/sector-country-farm-information/rice-initiative.html
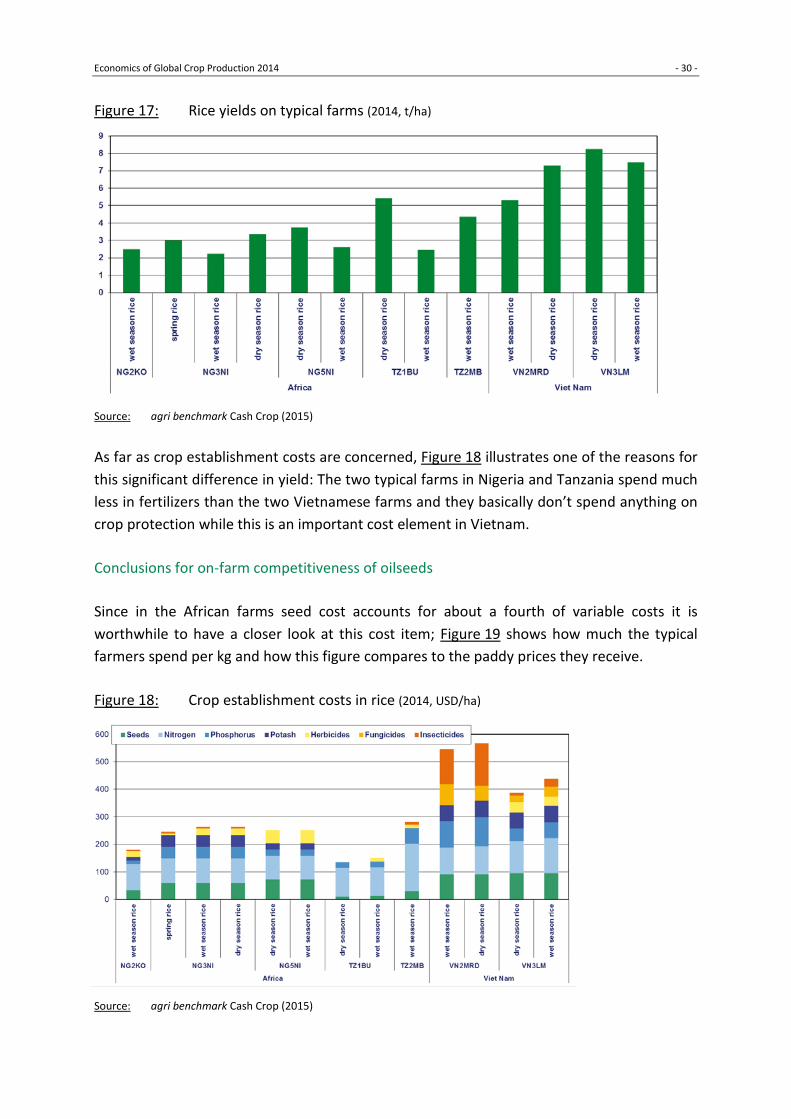
First of all, Figure 17 clearly indicates that rice yields for the typical Vietnamese farms are significantly higher than those in Nigeria and Tanzania. It should be highlighted though that this margin is even higher when comparing national statistics. This reflects the fact that in the two African countries only a limited share of rice is produced under irrigation while in Vietnam the bulk of produce comes from such production systems.
What can be learned from Figure 17 as well is the fact that dry season rice − which is produced under irrigation − tends to yield better than wet season rice. Especially for the African farms this margin is pretty substantial with an increase of about 50 % or even more.
9 Competitive African Rice Initiative (CARI) is funded by the German Ministry for Economic Cooperation and
Development and co-funded by the Bill and Melinda Gates Foundation and the Walmart Foundation. For details see: http://cari-project.org
Economics of Global Crop Production 2014 - 30 -
Figure 17: Rice yields on typical farms (2014, t/ha)
Source: agri benchmark Cash Crop (2015)
As far as crop establishment costs are concerned, Figure 18 illustrates one of the reasons for this significant difference in yield: The two typical farms in Nigeria and Tanzania spend much less in fertilizers than the two Vietnamese farms and they basically don’t spend anything on crop protection while this is an important cost element in Vietnam.
Conclusions for on-farm competitiveness of oilseeds
Since in the African farms seed cost accounts for about a fourth of variable costs it is worthwhile to have a closer look at this cost item; Figure 19 shows how much the typical farmers spend per kg and how this figure compares to the paddy prices they receive.
Figure 18: Crop establishment costs in rice (2014, USD/ha)
Source: agri benchmark Cash Crop (2015)

Economics of Global Crop Production 2014 - 31 -
The most obvious result: except for the farm TZ1BU, which uses farm saved seeds, seed prices tend to be much higher than the commercial product (which is usual − see typical farms in Vietnam) but the margin is almost twice as high for the farms in Nigeria compared to the farms in Vietnam. Most likely this is the outcome from a rather poor performance of the commercial seed sector in these countries. Further research should be looking at this issue more closely. The typical farm NG2KO is selling milled rice locally which is why its farm gate price is way above the rice prices the other farms realize.
Figure 19: Rice seed prices vs. paddy rice prices (2014, USD/kg)
Source: agri benchmark Cash Crop (2015)
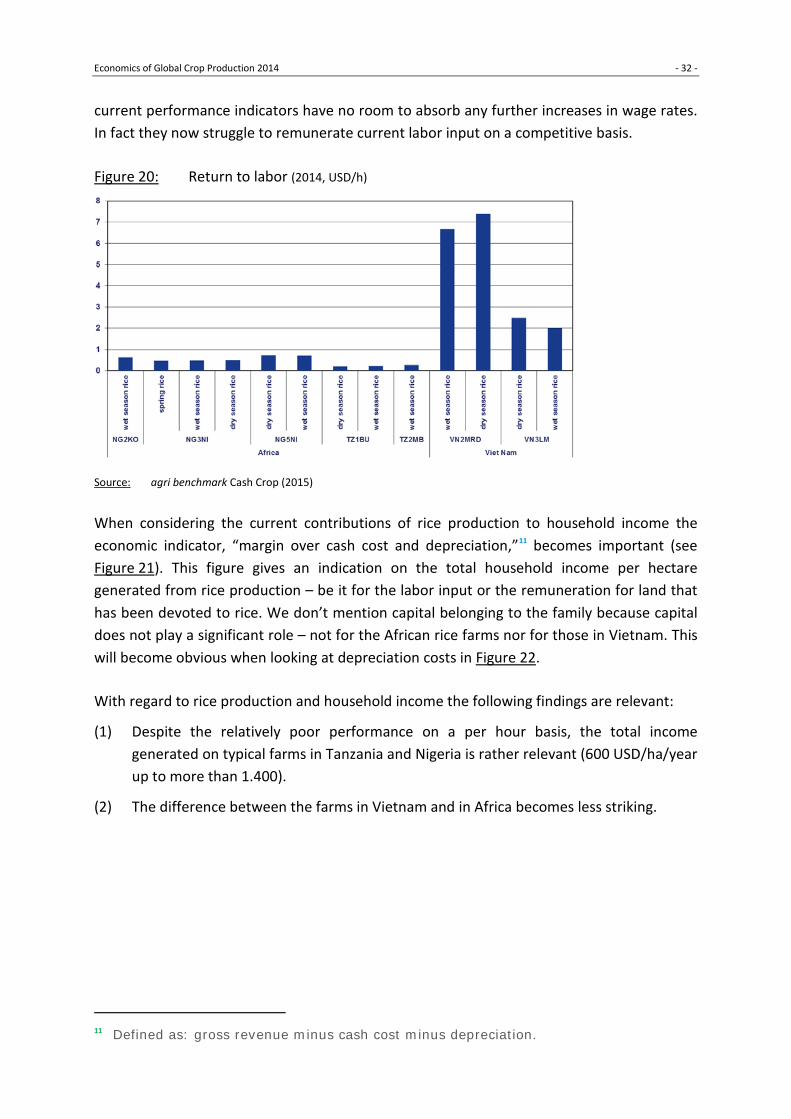
Given the fact that rice production in Africa as well as in Asia is often at least to a certain degree part of the livelihood strategy, rather than a purely commercial activity, we looked at return to labor10 as a key indicator: how much money farmers earn through rice production. It has to be highlighted that labor input data for those farms have a large margin of error because farmers of don’t keep thorough records. Furthermore, very often the operations are outsourced to contractors who do the work based on results (e.g. weeding of a particular field) rather than on a per-hour basis.
Despite these caveats Figure 20 clearly suggests that economic labor productivity on the typical farms in Tanzania and Nigeria is drastically lacking when compared to the two typical farms in Vietnam. What is even more important for the economic sustainability of the current systems: wage rates for the Nigerian farms are in the range of 0.5 USD/h and for the two Tanzanian farms at about 0.2 USD/h. This implies that these farming systems with their
10 This indicator is defined as follows: gross revenue minus all costs (excluding labor costs) per hectare divided
by total labor input (hired and family labor) in h/ha.
Economics of Global Crop Production 2014 - 32 -
current performance indicators have no room to absorb any further increases in wage rates. In fact they now struggle to remunerate current labor input on a competitive basis.
Figure 20: Return to labor (2014, USD/h)
Source: agri benchmark Cash Crop (2015)
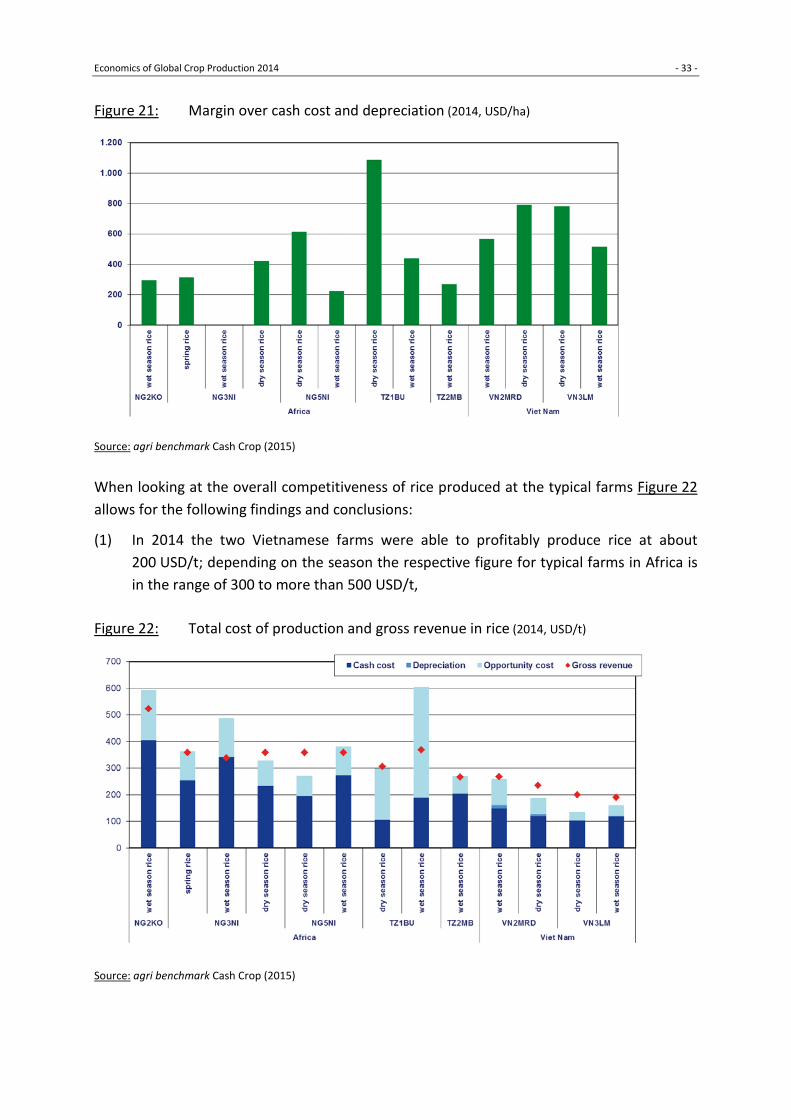
When considering the current contributions of rice production to household income the economic indicator, “margin over cash cost and depreciation,”11 becomes important (see Figure 21). This figure gives an indication on the total household income per hectare generated from rice production – be it for the labor input or the remuneration for land that has been devoted to rice. We don’t mention capital belonging to the family because capital does not play a significant role – not for the African rice farms nor for those in Vietnam. This will become obvious when looking at depreciation costs in Figure 22.
With regard to rice production and household income the following findings are relevant:
(1) Despite the relatively poor performance on a per hour basis, the total income generated on typical farms in Tanzania and Nigeria is rather relevant (600 USD/ha/year up to more than 1.400).
(2) The difference between the farms in Vietnam and in Africa becomes less striking.
11 Defined as: gross revenue minus cash cost minus depreciation.
Economics of Global Crop Production 2014 - 33 -
Figure 21: Margin over cash cost and depreciation (2014, USD/ha)
Source: agri benchmark Cash Crop (2015)
When looking at the overall competitiveness of rice produced at the typical farms Figure 22 allows for the following findings and conclusions:
(1) In 2014 the two Vietnamese farms were able to profitably produce rice at about 200 USD/t; depending on the season the respective figure for typical farms in Africa is in the range of 300 to more than 500 USD/t,
Figure 22: Total cost of production and gross revenue in rice (2014, USD/t)
Source: agri benchmark Cash Crop (2015)
Economics of Global Crop Production 2014 - 34 -
(2) While the Vietnamese farms were able to cover total cost and to even generate an entrepreneurial profit, this was true only in two cases for the farms in Tanzania and Nigeria. The others are more or less break-even while some clearly struggle to cover total cost or even cash cost.
(3) When comparing dry season rice with wet season rice it appears that wet season rice for the farms in Nigeria and Tanzania are performing particularly weak. This raises the question whether there are other crops available that could be produced instead, or whether there are easy options to improve productivity in rice during the rainy season.
(4) The poor economic performance of rice production for typical farms in Tanzania and Nigeria is even more remarkable when taking into account the fact that farm gate prices are up to 150 USD/t higher for the African farms compared to those in Vietnam.
(5) Due to the fact that typical farms in Tanzania and Nigeria not only have to pay a lot for variable inputs such as seed and fertilizers, they also have significant cash expenses for hired labor. This implies that they are quite susceptible to fluctuations in rice prices and/or yields because they are running the risk of generating cash losses.

Economics of Global Crop Production 2014 - 35 -
agri benchmark Working Papers
A new Paradigm for Global Agricultural Commodity Markets? Working Paper 2015/7 www.agribenchmark.org/fileadmin/Dateiablage/B-Cash-Crop/Working-Paper/cc-1502-commodity-markets.pdf
Leasing and purchasing arable land - legal rules, profitability and investor´s view Working Paper 2014/6 http://www.agribenchmark.org/fileadmin/Dateiablage/B-Cash-Crop/Working-Paper/cc-1406-land-markets-YZ.pdf
Report on the Workshop on the South East Asian agri benchmark Rice Network Working Paper 2014/5, Nguyen NL. www.agribenchmark.org/fileadmin/Dateiablage/B-Cash-Crop/Working-Paper/cc-1305-RiceWS-Luan.pdf
German rapeseed on the verge of collapse? Consequences of a new EU biofuel policy Working Paper 2013/4, Zimmer Y. http://www.agribenchmark.org/fileadmin/Dateiablage/B-Cash-Crop/Working-Paper/cc-1304-EU-biofuel-YZ.pdf
China ́s Corn Production - Where to establish agri benchmark farms in corn? Working Paper 2013/3, Hu X; Zimmer Y. www.agribenchmark.org/fileadmin/Dateiablage/B-Cash-Crop/Working-Paper/cc-1303-China-XH-YZ.pdf
Specialty crops - A perspective for Kazakh arable producers? Working Paper 2013/2, Zimmer Y; Börsch M. www.agribenchmark.org/fileadmin/Dateiablage/B-Cash-Crop/Working-Paper/cc-1302-Kazakhstan-YZ.pdf (English Version); www.agribenchmark.org/fileadmin/Dateiablage/B-Cash-Crop/Working-Paper/cc-1302-Kazakhstan-YZ-rus.pdf (Russian Version)
Rapeseed in Central and Eastern Europe - A lot of room for growth Working Paper 2012/1, Zimmer Y. www.agribenchmark.org/fileadmin/Dateiablage/B-Cash-Crop/Working-Paper/cc-1201-rapeseed-YZ-en.pdf (English Version); www.agribenchmark.org/fileadmin/Dateiablage/B-Cash-Crop/Working-Paper/cc-1201-rapeseed-YZ-rus.pdf (Russian Version)
agri benchmark Reports
Economics of Southeast Asian Rice Production Report 1/2014, B. Liese, S. Isvilanonda, K. N. Tri, L. N. Ngoc, P. Pananurak, R. Pech, T. M. Shwe, K. Sombounkhanh, T. Möllmann, Y. Zimmer http://www.agribenchmark.org/fileadmin/Dateiablage/B-Cash-Crop/Reports/Report-2014-1-rice-FAO.pdf