cash holdings of politically connected firms
TRANSCRIPT
J. of Multi. Fin. Manag. 23 (2013) 338– 355
Contents lists available at ScienceDirect
Journal of Multinational FinancialManagement
journal homepage: www.elsevier.com/locate/econbase
Cash holdings of politically connected firms�
Narjess Boubakria,∗, Sadok El Ghoulb, Walid Saffarc
a American University of Sharjah, UAE & CIRPÉE-HEC, Montréal, Québec, Canadab University of Alberta, Edmonton, AB T6C 4G9, Canadac School of Accounting and Finance, The Hong Kong Polytechnic University, Hong Kong
a r t i c l e i n f o
Article history:Received 13 August 2012Accepted 9 June 2013Available online 17 June 2013
JEL classification:G32G34
Keywords:Political connectionsCash holdingsCorporate governance
a b s t r a c t
Politically connected firms benefit from soft-budget constraints andare unlikely to suffer from liquidity constraints. This argument sug-gests that politically connected firms should hold less cash thannon-connected peers. Another view posits that these firms exhibitacute corporate governance problems. In this setting, politicallyconnected firms are more likely to hold more cash than non-connected firms. Using a sample of 50,119 firm-year observationsfrom 31 countries, we find that politically connected firms holdmore cash than their non-connected peers. We put forth two expla-nations for this result. Firstly, politicians use politically connectedfirms as “cash cows” to advance their political agendas. Secondly,political connections are conducive to agency problems. In addi-tional analyses, we find that the positive relationship betweenpolitical connections and cash holdings is stronger when corporategovernance is weak.
© 2013 Elsevier B.V. All rights reserved.
1. Introduction
The agency conflicts raised by excess liquidity are described in Jensen (1986), who defines freecash flow as cash flow in excess of what is needed to finance all positive net present value (NPV)projects (Faleye, 2004). This excess cash flow can either be invested by the firm to finance growth
� We appreciate comments from Omrane Guedhami, Sattar Mansi, Jeffrey Pittman, Samir Trabelsi, and participants at the2012 Illinois International Journal of Accounting Symposium. We gratefully acknowledge the generous financial support fromCanada’s Social Sciences and Humanities Research Council. All remaining errors are ours.
∗ Corresponding author.E-mail addresses: [email protected] (N. Boubakri), [email protected] (S.E. Ghoul), [email protected] (W. Saffar).
1042-444X/$ – see front matter © 2013 Elsevier B.V. All rights reserved.http://dx.doi.org/10.1016/j.mulfin.2013.06.002

N. Boubakri et al. / J. of Multi. Fin. Manag. 23 (2013) 338– 355 339
opportunities, or is returned to shareholders. In developing the free cash flow (FCF) hypothesis, Jensen(1986) and Stulz (1990) argue that leaving excess resources under management control will lead self-interested utility maximizing managers to squander them and use them for perquisite consumption,all at shareholders’ expense. While managers would prefer to retain excess liquidity, shareholders tryto limit the managers’ access to free cash flow in order to mitigate agency conflicts.
The empirical literature offers several insights on the cash holdings of firms, notably on the deter-minants of corporate cash holdings. For instance, Kim et al. (1998) examine a sample of U.S. firms andfind that firms facing higher costs of external financing, having more volatile earnings hold signifi-cantly larger liquid assets. They also find that cash holdings are relatively lower for those firms thatexhibit a higher opportunity cost for investments in liquidity measured by the difference betweenreturns on assets and the return on Treasury bills. In the same vein, Opler et al. (1999) show thatlarger cash holdings characterize small firms, firms with riskier cash flows, as well as firms withstrong growth opportunities. For a cross-country sample of firms from the United States, Germany,and Japan, Pinkowitz and Williamson (2001) report similar evidence. More recently, the literaturegained interest in international studies that address the link between cash holdings and country cor-porate governance, more specifically the protection of shareholders rights. Notable studies are Dittmaret al. (2003), Pinkowitz et al. (2006), and Kalcheva and Lins (2007). The main conclusion of thesestudies is that better country-level investor protection is associated with lower cash holdings, sug-gesting that whenever shareholders rights are better protected, managers are led to retain less cash,leaving them with less opportunity to squander the firm’s resources and expropriate shareholders’wealth.
The purpose of this paper is to advance the literature on the firm-level determinants of corporatecash holdings using an international setting. More specifically, in this study we narrow the gap in theliterature by examining the cash holdings of an international sample of politically connected firms(PCFs). We consider a firm to be politically connected if at least one of the firm’s largest shareholdersor one of its top officers is a member of parliament, a minister, a head of state, or is closely relatedto a top official (as in Faccio, 2006).1 In conducting our analysis, we seek to provide an answer to thefollowing question: Do PCFs around the world tend to stockpile cash reserves?
The literature puts forth several reasons to explain the incentives of firms to keep cash or liquidassets. First, firms hoard cash for precautionary reasons. According to this view, the firm keeps cashbalances to avoid unanticipated events and costly foregone investment opportunities. Firms withvolatile cash flows are thus, expected to hold more cash. Another view holds that cash is a low-costfinancing means for firms (transaction cost view). To undertake investments while short of internalfunds, the firm will have to raise external funds, which is a costly alternative, mostly because ofinformational asymmetries between firms and external investors (Myers and Majluf, 1984). To avoidthe transaction costs associated with external financing in imperfect capital markets, firms are morelikely to accumulate higher cash balances, especially those firms with large growth opportunities.Finally, Faleye (2004) rationalizes cash holdings as a takeover defense against hostile bidders. Theauthor argues that excess cash, in fact, provides the firm with different antitakeover options, includingthe possibility to repurchase stock (and hence concentrate voting power), which increases the costof the transaction to the bidder as well as the possibility to acquire a competitor of the bidder or thebidder himself.
Given that holding large amounts of free cash flows is costly as discussed above, and may leadto agency conflicts and overinvestment, the right amount of cash to be held in the firm becomes atrade-off between: (1) having enough money for precautionary and transaction costs motives, and (2)not having too much cash under the control of managers as this may create incentives to use it forperquisite consumption. We believe that, in this context, focusing our attention on PCFs that exhibitdistinct corporate governance features may offer important insights on the link between corporate
1 In this paper, we follow Chen et al. (2010) and Chaney et al. (2011) among others, and consider mainly the literature onpolitically connected firms. We do not take into account lobbying and campaign contribution in determining what constitutepolitical connections. Faccio (2006) states that the political connections documented in her study are possibly more direct andmore explicit.

340 N. Boubakri et al. / J. of Multi. Fin. Manag. 23 (2013) 338– 355
liquidity policy and corporate governance. First, PCFs are close to politicians and, hence may obeypolitical objectives (i.e., using firms and resources therein to enhance political support, maximizingemployment, etc.) that generally go against shareholders’ profit- and wealth maximization objectives.Since cash is the most valuable asset that entrenched managers can expropriate from the firms (Myersand Rajan, 1998), shareholders’ expropriation in firms with excess cash becomes more likely. Second,typical corporate governance mechanisms, such as company boards within the firm, cannot play theirrole of monitoring decision makers. This may lead entrenched managers to pursue their own interestsat the expense of shareholders, including retaining large free cash flows and squandering them byconsuming perquisites or making inefficient investment decisions (Jensen, 1986) sometimes withimpunity. Third, from a corporate governance perspective, PCFs exhibit acute agency problems aspointed out by Chaney et al. (2011) who argue that political connections are a reflection of a firm’sagency problems and the quality of its corporate governance. As a matter of fact, PCFs are generallyinsulated from market discipline through government bailout guarantees and preferential access tobank lending, all of which contribute further to entrench politically connected managers comparedto their non-connected peers. We conjecture that these particular corporate governance features willshape the corporate liquidity policy of PCFs. In a nutshell, analyzing the cash holdings of PCFs aroundthe world provides us with a natural laboratory in which to examine how firm-level governanceaffects cash holdings, and how country-level governance affects this relation. Particularly, it allows usto investigate the corporate liquidity policy of these firms and determine whether it is a manifestationof agency problems (i.e., leading to shareholders’ expropriation).
Under the agency view of PCFs, and given the typical corporate governance arguments describedabove that are related to the political objectives (i.e., political extraction) of managers, and the lackof effective monitoring mechanisms, we expect PCFs to hold more cash. Conversely, PCFs may not belikely to hold cash for transaction costs motives as typical firms do, since, as documented in the litera-ture, they usually benefit from a soft budget constraint, easy access to credit at lower cost, and bailoutprotection in the event of financial distress. For example, Leuz and Oberholzer-Gee (2006) find thatmanagers of PCFs tend to avoid bonding themselves to higher corporate governance standards asso-ciated with issuing American depository receipts (ADRs), as they prefer the private benefits extractedfrom their firms by maintaining them domestic. For the same reasons, they are unlikely to hold cashfor precautionary motives. Therefore, we expect PCFs to have less need for large cash balances thantypical non-connected firms under the transaction and precautionary motives. This is all the moretrue given their preferential access to credit and bank lending. Our empirical analysis of cash holdingsof PCFs will allow us to disentangle these two competing effects, and will add insight to the ongoing,still unresolved, debate on the agency cost explanation for corporate cash holdings.
Using a sample of 50,119 firm-year observations from 31 countries over the period from 1997 to2001, we find strong and economically significant evidence that PCFs hold larger cash balances thannon-connected peers. These results go against evidence in Harford et al. (2008) who find that U.S. firmswith weaker corporate governance structures actually have smaller cash reserves. However, our resultsare consistent with the findings of cross-country studies, which document that poorly governed firmshoard larger cash balances (e.g., Dittmar et al., 2003; Kalcheva and Lins, 2007). Our results are robustto a battery of tests and sensitivity analyses including considering alternative periods, econometricapproaches, dependent variables, and confronting the issue of endogeneity. In additional analyses, wefind that the positive relationship between political connections and cash holdings is stronger whencorporate governance is weak. In a nutshell, one can conclude that political connections, despite theirsoft budget constraints, are a channel of political extraction by entrenched managers pursuing politicalobjectives. Because they can raise funds at better terms (Boubakri et al., 2012b; Chaney et al., 2011) andpay fewer taxes than non-PCFs, these firms hold more cash than their non-connected peers. This allowsentrenched managers to extract political benefits at the expense of shareholders, by undertaking suchdecisions as (1) financing election campaigns, paying bribes, and using the firms’ funds to build popularsupport for the government, or (2) by making inefficient investment decisions (e.g., overinvesting inunprofitable regions to secure votes for connected politicians), very often in total impunity.
Our study contributes to the existing literature on several grounds. First, we add evidence to theliterature on cash holdings in an international context by examining atypical firms where firm-levelcorporate governance is weak and hence expropriation of shareholders’ rights more likely. Second, we

N. Boubakri et al. / J. of Multi. Fin. Manag. 23 (2013) 338– 355 341
contribute to the corporate governance literature as we allow for cross-country variation in the extentof investor protection, while considering firms with weak firm-level governance. Lastly, we add to therecent extensive literature on the characteristics of PCFs, which have been shown to enjoy soft budgetconstraints, mainly owing to the implicit guarantee of government bailout of connected firms shouldthey face economic downturn or financial distress (Faccio et al., 2006). Faccio (2010) also determinesthat PCFs generally pay fewer taxes and, thus benefit from lower operating costs. In addition, they havea lower cost of equity (Boubakri et al., 2012b) and a lower cost of debt (Chaney et al., 2011). Politicalconnections and close ties to the government are supposed to allow corporations to overcome marketand state failures, such as high corruption or weak investor protection (Hay and Shleifer, 1998). Ourresults provide evidence on the extent of agency costs in PCFs, thus adding to the extant literaturethat has mainly focused on the benefits of political connections.2
The remainder of the paper is organized as follows. Section 2 reviews the literature and lays outour main hypothesis. Section 3 describes our research design. Section 4 presents the empirical resultsand Section 5 states our conclusion.
2. Literature review and hypothesis
2.1. Cash holdings
The literature advances several reasons to explain why firms hoard cash. First, firms may hold cashfor precautionary reasons. Specifically, firms accumulate cash balances to circumvent adverse eco-nomic shocks and avoid underinvestment problems. Firms with volatile cash flows should hold morecash. The transaction cost view offers another rationale for hoarding cash. Informational asymmetriesbetween firms and external investors (Myers and Majluf, 1984) make it costly for firms to raise externalfunds. In instances where informational asymmetries are severe, firms may use cheaper alternativessuch as internal funds to finance profitable investment opportunities. Therefore, firms with profitablegrowth opportunities should hold more cash. This view is largely based on the pecking order theory.Finally, cash holdings may serve as a powerful antitakeover defense against hostile bidders (Faleye,2004). Excess cash balances offer potential targets opportunities to counter unfriendly takeover bids.These include the possibility to repurchase stock as well as the possibility to acquire a competitor ofthe bidder or the bidder himself.
The existing evidence on the value of cash reserves to shareholders is mixed, especially when onecompares U.S. evidence to results from cross-country studies. Mikkelson and Partch (2003) show thatlarge cash balances do not necessarily reflect agency conflicts between managers and shareholders asthey enhance firm value. In the same vein, Opler et al. (1999) suggest that managers tend to hold cash asa precautionary measure. Harford (1999) finds, however, that entrenched managers of firms with largefree cash flows are more likely to overinvest in negative NPV projects (namely acquisitions). Dittmarand Mahrt-Smith (2007) validate this finding as they uncover that shareholders assign a lower valueto an additional dollar of cash reserves when agency problems are likely to be greater at the firm. Morerecently, Harford et al. (2008) sustain that free cash flow can be harmful to shareholders only whenshareholders’ rights are not protected, which brings light to the apparently conflicting results in theempirical literature. According to the authors, managers of firms with weakly enforced shareholders’rights can take advantage of the resources under their control with relative immunity. Such behaviorcannot be sustainable in a market where investor protection is high, such as the U.S. Confirming resultsappear in an international study conducted by Dittmar et al. (2003), who show that in countries whereinvestor protection is higher, firms tend to hold less cash.
Pinkowitz et al. (2006) also examine the effect of cross-country shareholders’ rights protection onthe amount of cash holdings, and show that in countries with low investor protection, cash is worth
2 Examples of such benefits include borrowing from state-owned banks at advantageous terms (e.g., Sapienza, 2004; Dinc ,2005; and Charumilind et al., 2006); getting bailed out by the government (Faccio et al., 2006); securing favorable regulatoryconditions (Agrawal and Knoeber, 2001); obtaining import licences more easily at favorable terms (Khwaja and Mian, 2005;and Mobarak and Purbasari, 2009); and discouraging foreign competition through import taxation (e.g., Goldman et al., 2009).

342 N. Boubakri et al. / J. of Multi. Fin. Manag. 23 (2013) 338– 355
less to minority shareholders. This finding is consistent with the hypothesis that poor protection ofinvestors’ rights makes it easier for management and controlling shareholders to expropriate corporateresources for their own benefit. Similarly, Kalcheva and Lins (2007) provide evidence that firms aroundthe world hold more cash in countries with weaker investor protection. Interestingly, they find strongevidence that when external country-level governance is weak, outside shareholders apply a valuationdiscount to high cash balances carried by firms whose managers are also expected to be entrenched,but do not discount high cash levels in general.
A way to contribute to this literature is to consider PCFs from a large sample of countries that arediverse in their legal and institutional environment attributes. We describe in what follows the extantliterature on political connections before we draw our main hypothesis.
2.2. Political connections
Empirical evidence on the value of political connections points to three potential sources of benefitsfrom political connections: preferential access to credit, tax discounts, and market power. Faccio (2010)finds that connected firms indeed have higher leverage (i.e., preferential access to credit), lower taxrates (i.e., tax discounts), and greater market shares (i.e., market power). Faccio et al. (2006) identifyan additional direct channel through which connections create value by showing that PCFs are morelikely than unconnected firms to be bailed out by the government in case of financial distress. In thesame vein, Boubakri et al. (2012a) conduct an international event study, and find that firm performanceand leverage increase after the nomination of a politician on the board of directors of publicly listedfirms or after an executive enters politics. They also document that the political connection is morevaluable, whenever the ties are closer to political power, which confirms evidence in Faccio (2006).
The potential costs of political connections are scarcely documented, except in the privatizationliterature, where Boubakri et al. (2008) find that with politically connected boards, privatization willnot create the necessary managerial incentives to maximize shareholders’ wealth and to improveoverall firm performance. Additional evidence that close ties with the government may be costly toshareholders is found in Guedhami et al. (2009) who document that state-owned firms are associatedwith lower demand for accounting transparency. Few other studies have argued that the grabbinghand of governments make close ties detrimental to shareholders given the likely rent extractionfrom politicians of the firms’ resources (Frye and Shleifer, 1997; Shleifer and Vishny, 1998). On thisissue, Caprio et al. (2013) provide direct evidence by showing that firms anticipating such behaviorwill tend to structure their asset holdings in a way that shelters them from politicians and bureaucrats,especially in countries where the threat of political extraction is high.
More broadly, one can consider that, as recently pointed out by Chaney et al. (2011), PCFs exhibitacute agency problems and poor internal corporate governance.
2.3. Hypothesis
As documented by previous studies, PCFs are more likely to be bailed-out in the event of crisis.They also benefit from a soft budget constraint and easy access to credit at preferential rates. Theyare, thus unlikely to suffer from liquidity constraints, and do not need to hold large amounts of cashfor either precautionary or transactions costs motives. Finally, holding cash as a takeover defense ishighly unlikely outside the U.S., where there is barely a takeover market worth talking about. For allthese reasons, we expect PCFs to hold lower cash balances than their non-connected peers.
Alternatively, from a corporate governance perspective, PCFs exhibit acute agency problems. AsChaney et al. (2011) point out, political connections may be considered a reflection of a firm’s agencyproblems and quality of corporate governance. As such, weak firm-level governance will lead to highercash holdings in PCFs, especially given that connected managers typically obey political objectivesthat may contradict profit-maximizing objectives and shareholders’ wealth maximization. In addi-tion, typical corporate governance mechanisms, such company boards within the firm, cannot playtheir role of monitoring decision makers. Besides, PCFs are better positioned to accumulate large cashbalances given that they can raise funds at better terms (Boubakri et al., 2012b; Chaney et al., 2011)and pay fewer taxes than non-PCFs. This, combined with poor corporate governance in PCFs, may lead
N. Boubakri et al. / J. of Multi. Fin. Manag. 23 (2013) 338– 355 343
entrenched managers to pursue their own interests at the expense of shareholders, including retain-ing large free cash flows and squandering them by consuming perquisites (e.g., pursuing politicalobjectives, such as financing election campaigns, paying bribes, and using the funds to build popularsupport for the government, etc.) or making inefficient investment decisions (e.g., overinvesting inunprofitable regions to secure votes for connected politicians), very often in total impunity. Based onthese arguments, we expect PCFs to hold higher cash balances than their non-connected peers.
3. Data description
3.1. The sample
To analyze the impact of political connections on cash holdings, we hand-match data from twosources: political connections data from Faccio (2006), and cash holdings and financial statement datafrom Worldscope. After dropping firm-years with insufficient data to measure corporate cash holdingsand firm-level control variables and countries without political connections in Faccio (2006), we endup with a sample of 50,119 firm-year observations from 31 countries. Following Chen et al. (2010),we consider the period from 1997 to 2001 over which Faccio’s (2006) database was constructed.
3.2. Variables measurement
3.2.1. Measuring cash holdingsWe follow extensive prior research (Kim et al., 1998; Opler et al., 1999; Dittmar et al., 2003) by
gauging cash holding using the ratio of cash and cash equivalents to net assets, where net assets aretotal assets minus cash and cash equivalents. We label this variable CASH. In sensitivity tests, we alsolook at two alternative methods to measure cash holdings. First, we compute cash holdings using theratio of cash and cash equivalent to total assets. Then, we compute cash holdings using the ratio ofcash and cash equivalent to total sales. Using either measure, we find similar results to those reportedusing the cash to net assets ratio.
3.2.2. Measuring political connectionsWe rely on Faccio’s (2006) database and we consider a politically connected firm if, “at least one of
its large shareholders (anyone controlling at least 10% of voting shares) or one of its top officers (CEO,president, vice president, chair, or secretary) is a member of parliament, a minister, or is closely relatedto a top politician or party.”3 Applying this definition, Faccio (2006) identifies 541 firms with politicalconnections. We follow extensive recent research by specifying our main test variable as a dummyvariable (POLITICAL) that takes the value of one if a company is identified as politically connectedin Faccio’s (2006) database and zero otherwise (e.g., Faccio et al., 2006; Boubakri et al., 2008; Faccio,2010; Chaney et al., 2011). We exclude the countries without any PCF from our analysis.
3.2.3. Control variablesIn our multivariate regression analysis, we control for two sets of variables known to affect cash
holdings according to prior research (e.g., Opler et al., 1999; Dittmar et al., 2003). The first set includesthe following firm-level characteristics: the market-to-book value of assets (MTB); the natural loga-rithm of total assets (SIZE); cash flow to net assets (CF); net working capital to net assets (NWK); andresearch and development expenses to sales (RDEV). The second set of controls covers two macro-economic variables: the ratio of the stock value traded to GDP (SVTRADED), and the ratio of privatecredit to GDP (PVCRDGDP). Additionally, in all estimations, we control for industry (according to the12 categories in Campbell, 1996), country, and year fixed effects.
3 More comprehensive descriptions of the political connections database can be found in Faccio (2006), Faccio et al. (2006),Faccio (2010), and Chaney et al. (2011).
344 N. Boubakri et al. / J. of Multi. Fin. Manag. 23 (2013) 338– 355
3.3. Descriptive statistics
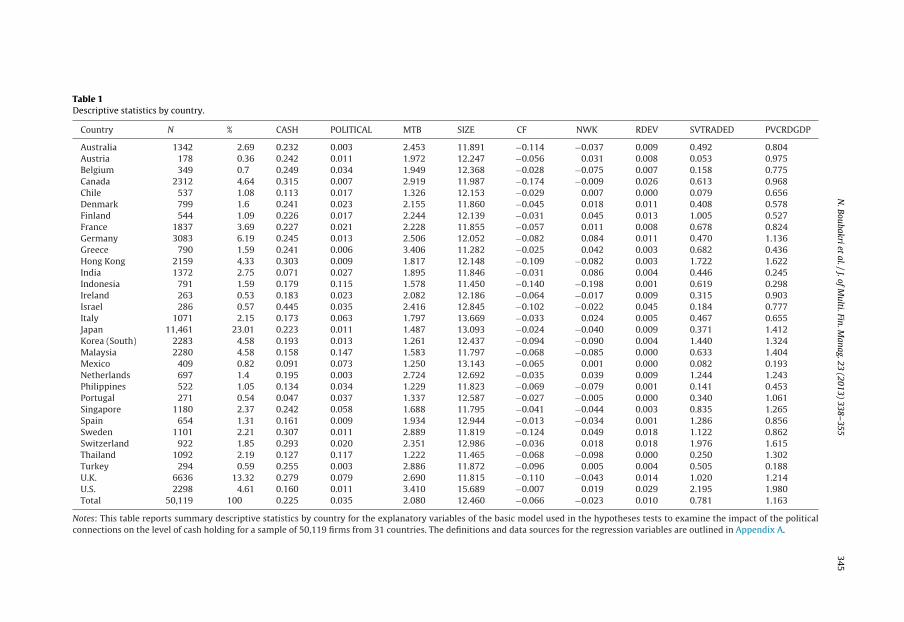
Table 1 reports the descriptive statistics of the variables (CASH, POLITICAL, MTB, SIZE, CF, NWK,RDEV, SVTRADED, and PVCRDGDP) by country for all firms in the sample. The sample is fairly diver-sified across geographical regions, including South Asia, Eastern Europe, and Latin America, whichis important when examining the impact of political connections in an international setting. Japanand the United Kingdom contribute the largest shares of the sample, 23.01% and 13.32%, respec-tively, followed by Germany (6.19%), Canada (4.64%), United States (4.61%), Malaysia and South Korea(4.58%), and Hong Kong (4.33%). All other countries comprise less than 4% of the sample. There isconsiderable cross-country variation in the cash to net assets ratio. On average, firms from Israel,Canada, Sweden, and Hong Kong have more than 30% of their net assets in cash. At the otherend, firms from Mexico, India, and Portugal have an average cash to net assets ratios below 10%.Table 1 also presents the distribution of the PCFs by country. Consistent with Faccio (2006), wefind that Malaysia, Thailand, and Indonesia have the highest incidence of PCFs; those firms accountfor more than 10% of the population. In contrast, PCFs are very rare in Hong Kong, Spain, Canada,Greece, Turkey, Australia, and the Netherlands, where they account for less than 1% of the popula-tion.
Panel A of Table 2 reports descriptive statistics for the variables used in the analysis. Includedare the mean, median, standard deviation, minimum and maximum value for CASH, political con-nection, economic, and financial variables. The dependent variable CASH has a mean, median, andstandard deviation of 0.225, 0.086, and 0.474, respectively. PCFs account for 3.5% of the total firm-yearobservations with a standard deviation of 0.18. In her original data, Faccio (2006) finds that con-nected firms represent 2.7% of all listed firms. In terms of economic variables, the mean (median)value of our first proxy for economic development (SVTRADED) is 0.78 (0.56) with a standarddeviation of 0.63. Also, the mean (median) value of our second proxy for economic development(PVCRDGDP) is 1.16 (1.16) with a standard deviation of 0.44. In terms of firm-specific characteristics,the results show that our sample includes small and large firms, as well as high and low research-and-development-intensive firms. For our sample firm, the mean (median) size is 12.46 (12.27) andthe mean (median) expense in research and development (R&D) is 0.01 (0.00). Companies in thesample exhibit a relatively high level of growth measured by the MTB with a mean (median) of 2.08(1.24).
Panel B of Table 2 describes the industry distribution of the sample (in absolute num-bers and in percentages) using the standard Security Industry Classification (SIC) codes thatwere used in Campbell (1996). We use two-digit SIC codes to control for industry effects inour empirical analysis. The industries are basic industries, capital goods, construction, consumerdurables, food and tobacco, leisure, finance, petroleum, services, textile and trade, transporta-tion, and utilities. A large portion of the sample is concentrated in finance (16.86), consumerdurables (15.25%), basic industries (12.46%), capital goods (9.75%), textile/trade (8.90%), and services(8.68%).
Panel C of Table 2 provides the correlation coefficients between cash holding, political connec-tion, and various control measures. CASH is positively correlated with MTB, RDEV, and PVCRDGDP,and negatively correlated with POLITICAL, SIZE, CF, NWK, SVTRADED. However, because of possibleconfounding effects by other variables, we use a multivariate framework to explore our hypotheses.
4. Empirical results
To investigate the impact of political connections on the level of cash holdings, we estimate thefollowing regression (subscripts are omitted for simplicity):
Log(CASH) = + ˇ1 · POLITICAL + ˇ2 · Z + FIXED EFFECTS + e (1)
where CASH is cash holdings divided by net assets, POLITICAL is an indicator variable for whetherthe firm is politically connected, Z is a vector of control variables commonly used in cash holdingsregressions and discussed in Section 3.2.3 (MTB, RDEV, PVCRDGDP, SIZE, CF, NWK, and SVTRADED), andFIXED EFFECTS denotes a set of industry, country, and year fixed effects, and ε is the error term. To
N.
Boubakri et
al. /
J. of
Multi.
Fin. M
anag. 23 (2013) 338– 355
345
Table 1Descriptive statistics by country.
Country N % CASH POLITICAL MTB SIZE CF NWK RDEV SVTRADED PVCRDGDP
Australia 1342 2.69 0.232 0.003 2.453 11.891 −0.114 −0.037 0.009 0.492 0.804Austria 178 0.36 0.242 0.011 1.972 12.247 −0.056 0.031 0.008 0.053 0.975Belgium 349 0.7 0.249 0.034 1.949 12.368 −0.028 −0.075 0.007 0.158 0.775Canada 2312 4.64 0.315 0.007 2.919 11.987 −0.174 −0.009 0.026 0.613 0.968Chile 537 1.08 0.113 0.017 1.326 12.153 −0.029 0.007 0.000 0.079 0.656Denmark 799 1.6 0.241 0.023 2.155 11.860 −0.045 0.018 0.011 0.408 0.578Finland 544 1.09 0.226 0.017 2.244 12.139 −0.031 0.045 0.013 1.005 0.527France 1837 3.69 0.227 0.021 2.228 11.855 −0.057 0.011 0.008 0.678 0.824Germany 3083 6.19 0.245 0.013 2.506 12.052 −0.082 0.084 0.011 0.470 1.136Greece 790 1.59 0.241 0.006 3.406 11.282 −0.025 0.042 0.003 0.682 0.436Hong Kong 2159 4.33 0.303 0.009 1.817 12.148 −0.109 −0.082 0.003 1.722 1.622India 1372 2.75 0.071 0.027 1.895 11.846 −0.031 0.086 0.004 0.446 0.245Indonesia 791 1.59 0.179 0.115 1.578 11.450 −0.140 −0.198 0.001 0.619 0.298Ireland 263 0.53 0.183 0.023 2.082 12.186 −0.064 −0.017 0.009 0.315 0.903Israel 286 0.57 0.445 0.035 2.416 12.845 −0.102 −0.022 0.045 0.184 0.777Italy 1071 2.15 0.173 0.063 1.797 13.669 −0.033 0.024 0.005 0.467 0.655Japan 11,461 23.01 0.223 0.011 1.487 13.093 −0.024 −0.040 0.009 0.371 1.412Korea (South) 2283 4.58 0.193 0.013 1.261 12.437 −0.094 −0.090 0.004 1.440 1.324Malaysia 2280 4.58 0.158 0.147 1.583 11.797 −0.068 −0.085 0.000 0.633 1.404Mexico 409 0.82 0.091 0.073 1.250 13.143 −0.065 0.001 0.000 0.082 0.193Netherlands 697 1.4 0.195 0.003 2.724 12.692 −0.035 0.039 0.009 1.244 1.243Philippines 522 1.05 0.134 0.034 1.229 11.823 −0.069 −0.079 0.001 0.141 0.453Portugal 271 0.54 0.047 0.037 1.337 12.587 −0.027 −0.005 0.000 0.340 1.061Singapore 1180 2.37 0.242 0.058 1.688 11.795 −0.041 −0.044 0.003 0.835 1.265Spain 654 1.31 0.161 0.009 1.934 12.944 −0.013 −0.034 0.001 1.286 0.856Sweden 1101 2.21 0.307 0.011 2.889 11.819 −0.124 0.049 0.018 1.122 0.862Switzerland 922 1.85 0.293 0.020 2.351 12.986 −0.036 0.018 0.018 1.976 1.615Thailand 1092 2.19 0.127 0.117 1.222 11.465 −0.068 −0.098 0.000 0.250 1.302Turkey 294 0.59 0.255 0.003 2.886 11.872 −0.096 0.005 0.004 0.505 0.188U.K. 6636 13.32 0.279 0.079 2.690 11.815 −0.110 −0.043 0.014 1.020 1.214U.S. 2298 4.61 0.160 0.011 3.410 15.689 −0.007 0.019 0.029 2.195 1.980Total 50,119 100 0.225 0.035 2.080 12.460 −0.066 −0.023 0.010 0.781 1.163
Notes: This table reports summary descriptive statistics by country for the explanatory variables of the basic model used in the hypotheses tests to examine the impact of the politicalconnections on the level of cash holding for a sample of 50,119 firms from 31 countries. The definitions and data sources for the regression variables are outlined in Appendix A.

346 N. Boubakri et al. / J. of Multi. Fin. Manag. 23 (2013) 338– 355
Table 2Descriptive Statistics.
Mean Median Standard deviation Min Max
Panel A: Descriptive statistics of key regression variablesCASH 0.225 0.086 0.474 0.000 3.518POLITICAL 0.035 0.000 0.183 0.000 1.000MTB 2.080 1.243 2.818 0.448 20.214SIZE 12.460 12.275 2.202 −0.132 20.756CF −0.066 −0.016 0.233 −1.578 0.229NWK −0.023 −0.012 0.267 −1.432 0.552RDEV 0.010 0.000 0.034 0.000 0.225SVTRADED 0.781 0.566 0.635 0.020 3.268PVCRDGDP 1.163 1.162 0.440 0.167 2.113
Industry classifications Two-digit SIC codes Number of observations Percentage (%)
Panel B: Sample industry classificationsBasic industries 10, 12, 14, 24, 26, 28, 33 6209 12.46%Capital goods 34, 35, 38 4859 9.75%Construction 15–17, 32, 52 3643 7.31%Consumer durables 25, 30, 36, 37, 50, 55, 57 7594 15.25%Food/tobacco 1, 9, 20, 21, 54 3097 6.22%Leisure 27, 58, 70, 78, 79 2383 4.78%Finance 60–69 8399 16.86%Petroleum 13, 29 843 1.69%Services 72, 73, 75, 80, 82, 87, 89 4322 8.68%Textiles/trade 22, 23, 31, 51, 53, 56, 59 4434 8.90%Transportation 40–42, 44, 45, 47 1760 3.53%Utilities 46, 48, 49 2086 4.19%Other The remaining two-digit SIC codes 184 0.37%Total 50,119 100.00%
Cash Political MTB Size CF NWK RDEV SVTRADED
Panel C: Pearson correlation coefficientsPOLITICAL −0.019MTB 0.377 −0.018SIZE −0.229 0.083 −0.276CF −0.137 0.003 −0.310 0.298NWK −0.164 −0.046 −0.185 0.050 0.291RDEV 0.227 −0.025 0.348 −0.053 −0.210 0.054SVTRADED −0.027 −0.022 0.112 0.120 −0.023 −0.011 0.081PVCRDGDP 0.090 −0.007 −0.008 0.216 0.030 −0.054 0.055 0.357
Notes: Panel A reports summary descriptive statistics for the regression variables used in the empirical tests to examine theimpact of political connections on corporate cash holding for a maximum sample of 50,119 firm-year observations from 31countries over the period 1997–2001. The definitions and data sources for the regression variables are outlined in AppendixA. Panel B provides industry classification as in Campbell (1996) for a sample of 50,119 from 31 countries over the period1997–2001. The definitions and data sources for the regression variables are provided in Appendix A. Panel C reports Pearsoncorrelations for the regression variables. Boldface indicates statistical significance at the 1% level. The definitions and datasources for the variables are outlined in Appendix A.
control for outliers we winsorize the firm-level variables at the 1% and 99% levels. Our focus in theanalysis is the coefficient ˇ1, which measures the sensitivity of cash holdings to political connection.A positive value indicates that connected firms hold more cash than non-connected firms do at theinternational level.
4.1. Main evidence
To examine the impact of political connections on cash holdings, we regress the log of cash tonet assets on the political connection dummy, and firm- and country-level variables using pooled

N. Boubakri et al. / J. of Multi. Fin. Manag. 23 (2013) 338– 355 347
Table 3Regressions of cash holding on firm-level and macroeconomic variables.
Variable Basic reduced model Full model Sales growth(1) (2) (3)
POLITICAL 0.228*** 0.238*** 0.264***
(4.717) (4.425) (4.636)MTB 0.178*** 0.147***
(30.357) (30.725)SIZE −0.110*** −0.080*** −0.153***
(−8.665) (−5.739) (−14.225)CF 0.362** 0.138 0.346
(2.125) (1.054) (1.412)NWK −0.752*** −1.069*** −1.052***
(−4.362) (−8.927) (−4.371)RDEV 5.554*** 5.658*** 10.020***
(12.231) (12.076) (11.804)SVTRADED 0.020 0.015 0.034
(0.580) (0.458) (1.294)PVCRDGDP 0.042 0.095* −0.046
(0.795) (1.718) (−0.608)CAPEX 1.220***
(6.104)LEVERAGE −1.089***
(−8.175)DIVIDEND 5.203***
(4.303)SALES GROWTH 0.180***
(9.264)Intercept −2.303*** −2.771*** −1.417***
(−9.704) (−10.665) (−6.151)YEAR EFFECTS Yes Yes YesIND effects Yes Yes YesCNTRY effects Yes Yes Yes
P-value 0.000 0.000 0.000Adj. R2 0.316 0.343 0.251N 50,119 45,971 50,119
Note: This table reports pooled OLS estimation results of the following cash-holding model. Log(CASHit) = + ˇ1 POLITICALit + ˇ2
Zit + FIXED EFFECTS + ε. Where CASHit is the level of cash holding over net assets; Politicalit is a dummy variable equal to oneif the firm is politically connected and zero otherwise; and Z is a set of firm- and country-level control variables. Fixed effectsis a set of dummy variables controlling for the year, industry, and country fixed effects. Model 1 is our baseline specification.Model 2 controls for LEVERAGE, CAPEX, and DIVIDEND along with the other variables considered in our baseline model. Model3 includes sales growth as an alternative proxy for future growth opportunities. The full sample includes 50,119 firm-yearobservations from 31 countries. Beneath each estimate is reported the robust t-statistic clustered at the country level. Thedefinitions and data sources for the variables are outlined in Appendix A.
* Statistical significance at the 10% level.** Statistical significance at the 5% level.
*** Statistical significance at the 1% level.
cross-sectional time series regressions with robust standard errors clustered at the country level.4
Table 3 reports the estimation of various specifications of Eq. (1).In Model 1, our basic specification, we estimate a reduced model in which we include the political
connection dummy (POLITICAL) and the main firm-level variables shown in the literature to explaincash holdings. We find the coefficient on POLITICAL is positive and statistically significant at the 1%
4 Faccio (2006) and Chen et al. (2010) shed light on the impact of the country-level institutions in clustering the effects ofthe political connections.

348 N. Boubakri et al. / J. of Multi. Fin. Manag. 23 (2013) 338– 355
level (t-stat = 4.717) implying that PCFs hoard more cash than non-PCFs.5 This finding complements theevidence in Caprio et al. (2013) who show that firms hold less cash in countries where the likelihood ofpolitical extraction is high. Our results suggest that political connections, which reduce the likelihoodof outside political extraction (i.e., government predation of firms’ resources), attenuate the need todisgorge cash out of the firm. Our finding of excess cash holdings in PCFs is consistent with those firmsaccumulating liquidity to finance the various (legal or illegal) programs and the political agenda of thepoliticians to which they are close. As for the firm-specific controls, we find that firm size (SIZE) andnet working capital to net assets (NWK) are significantly and negatively associated with cash holdings,suggesting that smaller firms hold more cash and that short-term assets are substitutes for cash. Inaddition, we find that MTB, CF, and RDEV enter the regressions with significantly positive coefficients.Those findings suggest that firms with better future growth opportunities, higher cash flows, and worseasymmetric information problems hoard more cash. Overall, those results are consistent with priorliterature, including Dittmar et al. (2003) among others. Our result is also economically significant.Setting all other variables at their mean values and moving the variable POLITICAL from zero to oneincreases cash holdings by 24.31%, from 0.074 to 0.092.
In Model 2, we expand our analysis by estimating a more exhaustive model in which we augmentthe baseline model with additional firm-level variables, namely, the debt to assets ratio (LEVERAGE),capital expenditures to net assets (CAPEX), and total dividends to net assets (DIVIDEND). Althoughwe recognize that those variables may be endogenous to cash holdings, our aim is to make sure thosedifferences in capital structure, investment, and dividend policies across politically connected andnon-connected firms are not driving our results. As expected, the adjusted R2 increases from 31.6% to34.3%. The results show that LEVERAGE is negatively associated with cash holdings, while CAPEX andDIVIDEND are positively associated with cash holdings, consistent with Opler et al. (1999). But, moreimportant for our purposes, we continue to estimate a positive and highly significant coefficient onPOLITICAL.
Finally, we recognize that the market to book ratio of assets (MTB) may be a less than a perfect proxyfor future growth opportunities since it can be affected by cross-country differences in accountingpractices and stock liquidity, among others. To address that issue, we replace MTB with sales growth(SALES GROWTH) in Model 3. Like MTB, we find that SALES GROWTH loads positively and significantlyat the 1% level suggesting that measurement errors associated with MTB are not affecting our results.Importantly, we continue to find that POLITICAL is positively and significantly (at the 1% level) relatedto cash holdings.
In summary, the results of various specifications of Eq. (1) reported in Table 3 suggest that PCFshold a significantly higher level of cash compared to non-connected firms. In the next section, weexamine the robustness of our main finding.
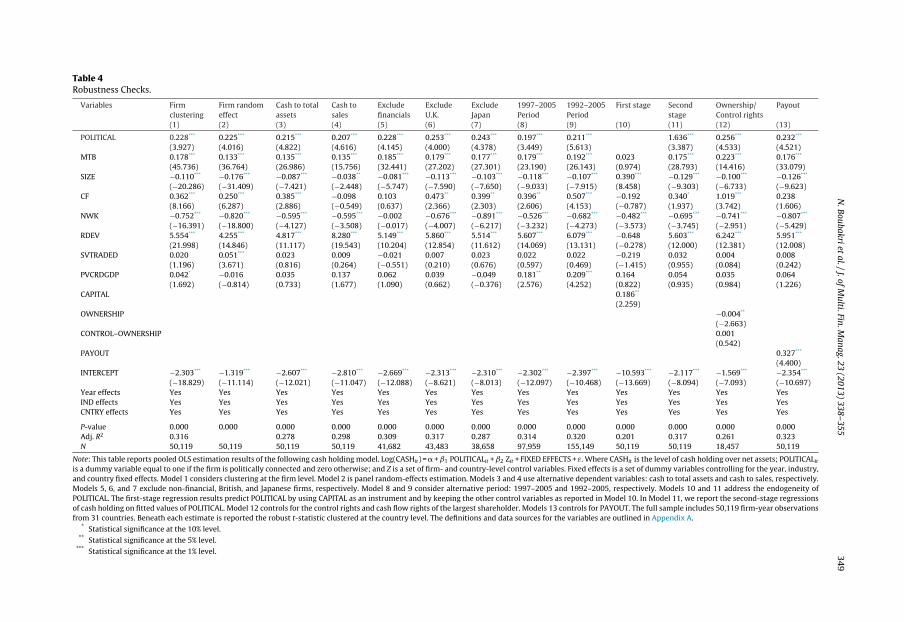
4.2. Sensitivity checks
In Table 4, we report the results of additional tests that assess the robustness of our findings.Specifically, we employ alternative econometric approaches, alternative dependent variables, andalternative sample composition and period. We also address the endogeneity issue. Finally, we includeadditional firm-level control variables.
5 Our research design follows prior research that investigates the impact of corporate governance on cash holdings (e.g.,Dittmar et al., 2003; Kalcheva and Lins, 2007). As an alternative, we could estimate the optimal amount of cash for our samplefirms and compare excess cash holdings (i.e., actual cash holdings minus optimal cash holdings) across PCFs and non-PCFs. Wefollow Opler et al. (1999) to determine the optimal amount of cash. Specifically, we estimate Eq. (1) after excluding POLITICALand save the predicted values of the dependent variable. Since our dependent variable is logged, we take the exponential of thepredicted values to obtain the optimal level of cash holdings. Then, we compute excess cash as the difference between actualcash and estimated optimal cash. A firm with positive excess cash holds more cash than predicted by our model. The resultsshow that the average (median) of excess cash for our sample is 5.54% (0.72%). When we split our sample into connected firmsand non-connected firms, we find that the mean (median) excess cash of connected firms is equal to 7.19% (1.80%) compared to5.59% (0.76%) for non-connected firms. These differences are statistically significant at the 1% level. Hence, using this alternativeresearch design, we reach the same conclusion that PCFs hold more excess cash than non-connected firms.
N.
Boubakri et
al. /
J. of
Multi.
Fin. M
anag. 23 (2013) 338– 355
349
Table 4Robustness Checks.
Variables Firmclustering
Firm randomeffect
Cash to totalassets
Cash tosales
Excludefinancials
ExcludeU.K.
ExcludeJapan
1997–2005Period
1992–2005Period
First stage Secondstage
Ownership/Control rights
Payout
(1) (2) (3) (4) (5) (6) (7) (8) (9) (10) (11) (12) (13)
POLITICAL 0.228*** 0.225*** 0.215*** 0.207*** 0.228*** 0.253*** 0.243*** 0.197*** 0.211*** 1.636*** 0.256*** 0.232***
(3.927) (4.016) (4.822) (4.616) (4.145) (4.000) (4.378) (3.449) (5.613) (3.387) (4.533) (4.521)MTB 0.178*** 0.133*** 0.135*** 0.135*** 0.185*** 0.179*** 0.177*** 0.179*** 0.192*** 0.023 0.175*** 0.223*** 0.176***
(45.736) (36.764) (26.986) (15.756) (32.441) (27.202) (27.301) (23.190) (26.143) (0.974) (28.793) (14.416) (33.079)SIZE −0.110*** −0.176*** −0.087*** −0.038** −0.081*** −0.113*** −0.103*** −0.118*** −0.107*** 0.390*** −0.129*** −0.100*** −0.126***
(−20.286) (−31.409) (−7.421) (−2.448) (−5.747) (−7.590) (−7.650) (−9.033) (−7.915) (8.458) (−9.303) (−6.733) (−9.623)CF 0.362*** 0.250*** 0.385*** −0.098 0.103 0.473** 0.399** 0.396** 0.507*** −0.192 0.340* 1.019*** 0.238
(8.166) (6.287) (2.886) (−0.549) (0.637) (2.366) (2.303) (2.606) (4.153) (−0.787) (1.937) (3.742) (1.606)NWK −0.752*** −0.820*** −0.595*** −0.595*** −0.002 −0.676*** −0.891*** −0.526*** −0.682*** −0.482*** −0.695*** −0.741*** −0.807***
(−16.391) (−18.800) (−4.127) (−3.508) (−0.017) (−4.007) (−6.217) (−3.232) (−4.273) (−3.573) (−3.745) (−2.951) (−5.429)RDEV 5.554*** 4.255*** 4.817*** 8.280*** 5.149*** 5.860*** 5.514*** 5.607*** 6.079*** −0.648 5.603*** 6.242*** 5.951***
(21.998) (14.846) (11.117) (19.543) (10.204) (12.854) (11.612) (14.069) (13.131) (−0.278) (12.000) (12.381) (12.008)SVTRADED 0.020 0.051*** 0.023 0.009 −0.021 0.007 0.023 0.022 0.022 −0.219 0.032 0.004 0.008
(1.196) (3.671) (0.816) (0.264) (−0.551) (0.210) (0.676) (0.597) (0.469) (−1.415) (0.955) (0.084) (0.242)PVCRDGDP 0.042* −0.016 0.035 0.137 0.062 0.039 −0.049 0.181** 0.209*** 0.164 0.054 0.035 0.064
(1.692) (−0.814) (0.733) (1.677) (1.090) (0.662) (−0.376) (2.576) (4.252) (0.822) (0.935) (0.984) (1.226)CAPITAL 0.186**
(2.259)OWNERSHIP −0.004**
(−2.663)CONTROL–OWNERSHIP 0.001
(0.542)PAYOUT 0.327***
(4.400)INTERCEPT −2.303*** −1.319*** −2.607*** −2.810*** −2.669*** −2.313*** −2.310*** −2.302*** −2.397*** −10.593*** −2.117*** −1.569*** −2.354***
(−18.829) (−11.114) (−12.021) (−11.047) (−12.088) (−8.621) (−8.013) (−12.097) (−10.468) (−13.669) (−8.094) (−7.093) (−10.697)Year effects Yes Yes Yes Yes Yes Yes Yes Yes Yes Yes Yes Yes YesIND effects Yes Yes Yes Yes Yes Yes Yes Yes Yes Yes Yes Yes YesCNTRY effects Yes Yes Yes Yes Yes Yes Yes Yes Yes Yes Yes Yes Yes
P-value 0.000 0.000 0.000 0.000 0.000 0.000 0.000 0.000 0.000 0.000 0.000 0.000 0.000Adj. R2 0.316 0.278 0.298 0.309 0.317 0.287 0.314 0.320 0.201 0.317 0.261 0.323N 50,119 50,119 50,119 50,119 41,682 43,483 38,658 97,959 155,149 50,119 50,119 18,457 50,119
Note: This table reports pooled OLS estimation results of the following cash holding model. Log(CASHit) = � + ˇ1 POLITICALit + ˇ2 Zit + FIXED EFFECTS + ε. Where CASHit is the level of cash holding over net assets; POLITICALit
is a dummy variable equal to one if the firm is politically connected and zero otherwise; and Z is a set of firm- and country-level control variables. Fixed effects is a set of dummy variables controlling for the year, industry,and country fixed effects. Model 1 considers clustering at the firm level. Model 2 is panel random-effects estimation. Models 3 and 4 use alternative dependent variables: cash to total assets and cash to sales, respectively.Models 5, 6, and 7 exclude non-financial, British, and Japanese firms, respectively. Model 8 and 9 consider alternative period: 1997–2005 and 1992–2005, respectively. Models 10 and 11 address the endogeneity ofPOLITICAL. The first-stage regression results predict POLITICAL by using CAPITAL as an instrument and by keeping the other control variables as reported in Model 10. In Model 11, we report the second-stage regressionsof cash holding on fitted values of POLITICAL. Model 12 controls for the control rights and cash flow rights of the largest shareholder. Models 13 controls for PAYOUT. The full sample includes 50,119 firm-year observationsfrom 31 countries. Beneath each estimate is reported the robust t-statistic clustered at the country level. The definitions and data sources for the variables are outlined in Appendix A.
* Statistical significance at the 10% level.** Statistical significance at the 5% level.
*** Statistical significance at the 1% level.
350 N. Boubakri et al. / J. of Multi. Fin. Manag. 23 (2013) 338– 355
4.2.1. Alternative standard errorsSo far, we report robust standard errors adjusted for clustering at the country level. We examine
the sensitivity of our results to alternative controls for cross-sectional and serial dependence in theresiduals. Specifically, we present the results of estimating our baseline model using standard errorsadjusted for clustering at the firm-level (Model 1) and firm-random effects (Model 2). In those twospecifications, we still find that political connections exert a positive and significant impact on cashholdings at the 1% level. The control variables also load significantly with the expected sign. Hence,using different econometric approaches does not change our main inference on the positive impactof political connections on the level of cash holdings.
4.2.2. Alternative deflator variablesWe follow standard practice in the literature (e.g., Dittmar et al., 2003) by deflating cash holdings,
cash flow, and net working capital by net assets (i.e., total assets minus cash holdings). We identify twopossible issues with this choice of the deflator variable. First, when cash holdings increase, the ratioof cash holdings to net assets increases more than proportionally, leading to the possibility of outliersin our regressions. To control for this possibility, we replace net assets by total assets as the deflatorvariable in Model 3. Second, previous research highlights that there are significant cross-country dif-ferences in earnings management (Leuz et al., 2003) and accounting practices, such as conservatism(i.e., the tendency to reflect bad news more often than good news in reported earnings). For instance,Leuz et al. (2003) show that firms in countries with poor investor protection are more likely to man-age earnings downward in order to hide private benefit extraction. Bushman and Piotroski (2006)find that firms in countries with stronger judicial systems and securities laws use more conservativeaccounting. Earnings management and accounting conservatism depress asset values, which in turn,increase the cash to net assets ratio. In Model 4, we use total sales as an alternative deflator variable,because sales are less likely to be affected by earnings manipulation and accounting practices. In thosetwo models, we continue to estimate a positive and significant coefficient on POLITICAL.
4.2.3. Alternative sample compositionFinancial firms arguably hold cash for different reasons (e.g., regulation) than industrial firms. In
order to increase comparability of our sample firms, in Model 5 of Table 4, we rerun our baselineregression after excluding financial firms (i.e., firms with a SIC code between 6000 and 6999). For thisreduced sample, we continue to find that PCFs hold significantly more cash than other firms. POLITICALloads positive and is statistically significant at the 1% level. Hence, financial firms are not behind ourevidence.
Because political connections may be country specific, we consider different country samples inModels 6 and 7. The largest number of PCFs is in the United Kingdom. Therefore, we run our analysisexcluding U.K. firms from our sample. The results reported in Model 6 show that the relation betweenpolitically connected firms and cash holdings remain unaffected. We also exclude Japanese firmsas they represent the largest part in our sample. The results, reported in Model 7, show that ourconclusions are not sensitive to this exclusion.6
4.2.4. Alternative sample periodWe restrict the sample to the 1997–2001 period, which matches the time over which political
connections are recorded in the Faccio’s (2006) dataset. Political connections, however, may last longeror alternatively originate earlier than our actual sample period. In alternative specifications, we extendour sample period to 1997–2005 (Model 8) as in Chaney et al. (2011) and 1992–2005 (Model 9).
6 We also exclude PCFs from East Asia given the substantial preferential treatment these firms enjoy in addition to thepotential impact of the East Asian financial crisis on these firms (Johnson and Mitton, 2003). The unreported results show thatour conclusions are not sensitive to the presence of Thai, Indonesian, or Malaysian firms. Indeed POLITICAL loads positive (0.217)and statistically significant at the 1% level (t-stat = 2.890).

N. Boubakri et al. / J. of Multi. Fin. Manag. 23 (2013) 338– 355 351
Using those longer sample periods, we continue to find that political connections are positively andsignificantly associated with cash holdings at the 1% level in both models.7
4.2.5. EndogeneitySome unobserved determinants of firms’ cash holdings that may also explain political connections
could potentially render our dummy variable POLITICAL endogenous and, cause our reported OLSestimates to be biased and inconsistent. In this section, we address the issue of endogeneity usinginstrumental variables’ estimation. We specify firm’s location as an instrument for political connec-tions. This choice is motivated by previous studies providing evidence on the influence of the firm’slocation on political connections (Roberts, 1990; Agrawal and Knoeber, 2001; Bertrand et al., 2009).8
In the first-stage regression, we employ a logit model to predict political connections using the loca-tion of the company’s headquarters, CAPITAL, along with the set of independent variables that weincluded in Eq. (1). We define CAPITAL as a dummy variable that takes the value one if the firm isheadquartered in the capital city of its country and zero otherwise. The first-stage fitted values forpolitical connections are then used in the second-stage OLS regressions. In the first stage (Model 10),the results show that the presence of a firm’s headquarters in the capital city is a significant predictorof political connections. Moreover, in the second stage regression (Model 11), the instrumented valueof connections is positive and statistically significant. This result reinforces our basic inferences onthe impact of political connections on cash holding and suggests that PCFs hold higher cash holdingscompared to non-connected firms.
4.2.6. Additional controlsKalcheva and Lins (2007) find that firm-level governance, measured by managerial control con-
centration, is positively associated with cash holdings. First, to make sure that firm-level corporategovernance is not an omitted variable, we control in Model 12, for the cash flow right of thelargest shareholder (OWNERSHIP) and excess control (CONTROL–OWNERSHIP) measured as the dif-ference between the ultimate control and cash flow right of the largest shareholder, which we obtainfrom Claessens et al. (2000) for East Asian firms and Faccio and Lang (2002) for Western Europeanfirms.9 Consistent with the incentive alignment effect of large shareholdings, we find that OWN-ERSHIP is negatively related to cash holding at the 5% level. Most important for our purposes, thepolitical connections dummy, POLITICAL, still loads positive and statistically significant at the 1%level.
Second, we control in Model 13 for the dividend payout (PAYOUT) to ensure that differences inpayout policy across PCFs and non-PCFs is not driving our results. We find that although PAYOUT ispositively related to cash holdings as one might expect (e.g., Opler et al., 1999), we document thatpolitical connections are still positively and significantly associated with cash holdings.
Altogether the results reported in Table 4 reinforce our earlier evidence, namely that politicalconnections are positively associated with cash holding. This result holds when we use alternativesamples, alternative dependent variables, and additional control variables. Our results also hold whenwe employ an instrumental variables technique, thus alleviating concerns that political connectionsare endogenous.
4.3. The impact of corporate governance on the relationship between political connections and cashholdings
Previous research shows that effective corporate governance helps attenuate the tendency of insid-ers to hoard excessive cash reserves. Dittmar et al. (2003) find that firms operating in countries with
7 When we follow Faccio (2010) and consider only the 1997 observations, we find similar results. The variable POLITICALloads positive and significant at the 1% level.
8 This approach to addressing endogeneity is typical in research on the role of political interference (e.g., Boubakri et al.,2008; Chen et al., 2010; and Chaney et al., 2011).
9 In unreported tests, we compare the cash flow rights and excess control of PCFs to those of non-PCFs. We find that, onaverage, the largest shareholders of PCFs hold lower cash flow rights (20.96% compared to 22.51%) and achieve higher excesscontrol (4.62% compared to 3.93%). These tests lend support to our conjecture that agency problems are more important in PCFsthan in non-PCFs.

352 N. Boubakri et al. / J. of Multi. Fin. Manag. 23 (2013) 338– 355
Table 5The impact of corporate governance on the relationship between political connections and cash holdings.
Variable Common law SOX Governance
No Yes Before After Low High(1) (2) (3) (4) (5) (6)
Political 0.263** 0.161 0.217*** 0.138 0.241*** 0.172(2.062) (1.531) (3.443) (1.401) (3.152) (0.604)
MTB 0.176*** 0.177*** 0.166*** 0.187*** 0.154*** 0.154***
(20.598) (12.180) (25.654) (13.372) (22.261) (11.606)Size −0.124*** −0.120*** −0.123*** −0.123*** −0.118*** −0.215***
(−6.028) (−7.771) (−10.215) (−6.785) (−7.699) (−11.843)CF 0.271 0.380* 0.252 0.522*** 0.419* 0.113
(1.015) (1.950) (1.428) (3.909) (1.852) (0.719)NWK −0.544** −0.362 −0.673*** −0.338* −1.180*** −0.303*
(−2.405) (−1.345) (−4.038) (−2.005) (−8.695) (−2.067)RDEV 5.814*** 5.496*** 5.506*** 5.465*** 6.477*** 6.905***
(13.864) (9.057) (10.738) (15.454) (5.520) (6.289)SVTRADED −0.064 −0.061 −0.046 0.016 −0.058* 0.000
(−1.406) (−0.819) (−0.651) (0.278) (−1.768) (0.008)PVCRDGDP 0.190 0.275 0.213 0.213 0.324** 0.438***
(0.914) (0.978) (0.948) (0.523) (2.160) (13.955)INTERCEPT −2.021*** −2.241*** −2.272*** −1.910*** −2.134*** −0.653**
(−9.612) (−6.540) (−8.172) (−6.273) (−15.483) (−2.619)Year effects Yes Yes Yes Yes Yes YesIND effects Yes Yes Yes Yes Yes YesCNTRY effects Yes Yes Yes Yes Yes Yes
P-value 0.000 0.000 0.000 0.000 0.000 0.000Adj. R2 0.298 0.334 0.328 0.321 0.386 0.433N 26,552 23,567 31,464 34,002 7969 10,024
Note: This table reports pooled OLS estimation results of the following cash-holding model:.Log(CASHit) = + ˇ1 POLITICALit + ˇ2 Zit + FIXED EFFECTS + ε. Where CASHit is the level of cash holding over net assets; POLITICALit
is a dummy variable equal to one if the firm is politically connected and zero otherwise; and Z is a set of firm- and country-levelcontrol variables. Fixed effects is a set of dummy variables controlling for the year, industry, and country fixed effects. Models 1and 2 report the results for subsamples of firms from non-common law and common law countries, respectively. Models 3 and4 report the results for periods of before and after SOX adoption, respectively. Models 5 and 6 report the results for subsamplesof firms with low and high governance, respectively. The full sample includes 50,119 firm-year observations from 31 countries.Beneath each estimate is reported the robust t-statistic clustered at the country level. The definitions and data sources for thevariables are outlined in Appendix A.
* Statistical significance at the 10% level.** Statistical significance at the 5% level.
*** Statistical significance at the 1% level.
strong legal protection hold less cash than firms located in countries with poor legal protection. Theirevidence is consistent with strong legal protection forcing insiders to disgorge cash to shareholders.Kusnadi and Wei, 2011 find that firms’ cash flow sensitivity of cash (i.e., the propensity to save cashout of cash flow) is lower in countries with strong shareholder protection. Kalcheva and Lins (2007)report that firms with entrenched managers hold less cash in countries with strong shareholder rightsprotection compared to countries with poor shareholder protection.
We investigate whether effective corporate governance attenuates the inclination of PCFs to holdmore cash. We consider country- and firm-level proxies of corporate governance in Table 5. We startwith country-level governance measured using the legal regime. Compared to civil law, common lawprovides better protection to minority shareholders (La Porta et al., 1998). We estimate in Models 1and 2 our basic specification (Model 1 of Table 3) in subsamples of civil law and common law countries,respectively. We find that the coefficient on POLITICAL is positive in both subsamples, although thiscoefficient is only statistically significant in the civil law subsample. This result suggests that commonlaw restrains the ability of PCFs to hoard excess cash.
Then, we consider the Sarbanes–Oxley Act (SOX). In the aftermath of an unprecedented wave ofcorporate fraud scandals, the U.S introduced the SOX, which contained a set of new and improved

N. Boubakri et al. / J. of Multi. Fin. Manag. 23 (2013) 338– 355 353
corporate governance standards. Although the provisions of the SOX apply to firms listed on U.S stockexchanges, it appears that several countries have adopted these provisions as part of their regulatoryregime.10 We estimate our Model in equivalent windows that cover the pre-SOX (1999–2001) andpost-SOX (2003–2005) periods. We find that POLITICAL has a positive and significant impact on cashholdings only in the pre-SOX period (Model 3 of Table 5). This result suggests that the tightening ofcorporate governance standards worldwide after the passage of the SOX has constrained the abilityof PCFs to hold higher cash reserves.
Next, we turn to firm-level governance. We consider an index of corporate governance developedby Institutional Shareholder Services (ISS) and create in Models 5 and 6 two subsamples: firms withbelow- and above-median governance index, respectively. Despite the significant sample attritiondue to the limited coverage of ISS, we find that the coefficient of POLITICAL is positive and significantonly in the below-median governance subsample. This result suggests that as firm-level governanceimproves, the propensity of PCFs to hold excess cash decreases.
Overall, the results in Table 5 support the idea that effective corporate governance, measured atthe firm- and country-levels, mitigates the tendency of PCFs to accumulate excessive cash holdings.
5. Conclusion
Previous studies show that PCFs are more likely to be bailed out in the event of crisis, to ben-efit from a soft budget constraint, and to have easy access to credit at preferential rates. They are,thus, unlikely to suffer from liquidity constraints as typical firms do and do not need to hold largeamounts of cash for either precautionary or transactions costs motives. In addition, holding cashas a takeover defense is highly unlikely outside the United States, where there is barely a takeovermarket worth talking about. These arguments suggest that PCFs should hold less cash than non-PCFs.
However, an alternative view posits that PCFs are more likely to hoard cash in order to finance theirpolitical agenda through either legal or illegal activities. Also, because they reduce political extraction,these firms are more likely than their non-connected peers to hold liquidity. Finally, agency problemsare likely to be more acute in PCFs, because of the divergent agendas of connected managers/boardsand shareholders, which increases the likelihood of holding more cash. As shown by Jensen (1986)and Stultz (1990), this cash is likely to be used for perquisite consumption (to achieve political goals)to benefit self-interested, utility-maximizing managers at the expense of shareholders. In the case ofPCFs, this can be done in all impunity.
Using 50,119 observations from 31 countries over the period from 1997 to 2001, we find that PCFshold larger cash balances than non-connected peers. We put forth two explanations for this result:Firstly, politicians use PCFs as “cash cows” to advance their political agendas. Indeed, our resultssuggest that despite their soft budget constraints, PCFs constitute a channel of political extractionby entrenched managers in pursuing political objectives at the expense of the firms’ shareholders.PCFs might hold more cash than their non-connected peers and use these funds to finance elec-tion campaigns, and to build popular support for the government. To this end, they are also likelyto overinvest in unprofitable regions to secure votes for connected politicians, very often in totalimpunity. Secondly, political connections are conducive to agency problems. Political extraction inPCFs through excessive cash holdings is as detrimental to shareholders as the extraction of pri-vate benefits of control in regular firms. The economic cost of such behavior can be tremendous asthese inefficiently high levels of cash could be directed toward profitable projects elsewhere in thecountry, and contribute to higher economic growth. As such, our results suggest that higher cash hold-ings could be a channel through which political connections are detrimental to economic growth aswell.
10 In his testimony before the U.S. House Committee on Financial Services in 2006, Chairman of the SEC, Christopher Cox states“While competitors in other countries are using Sarbanes–Oxley as a reason for foreign companies to list in their jurisdictions,many of those same countries are adopting provisions of the Act as part of their own regulatory regimes. As we consider theeffect of Sarbanes–Oxley on U.S. competitiveness, it is important to keep in mind how broadly many of its tenets have beentaken up overseas”.
354 N. Boubakri et al. / J. of Multi. Fin. Manag. 23 (2013) 338– 355
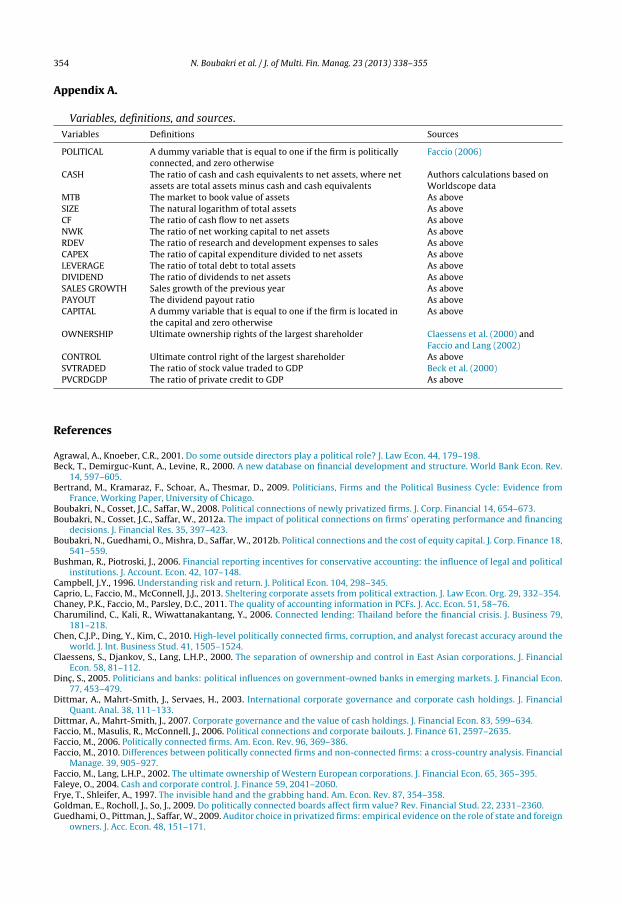
Appendix A.
Variables, definitions, and sources.Variables Definitions Sources
POLITICAL A dummy variable that is equal to one if the firm is politicallyconnected, and zero otherwise
Faccio (2006)
CASH The ratio of cash and cash equivalents to net assets, where netassets are total assets minus cash and cash equivalents
Authors calculations based onWorldscope data
MTB The market to book value of assets As aboveSIZE The natural logarithm of total assets As aboveCF The ratio of cash flow to net assets As aboveNWK The ratio of net working capital to net assets As aboveRDEV The ratio of research and development expenses to sales As aboveCAPEX The ratio of capital expenditure divided to net assets As aboveLEVERAGE The ratio of total debt to total assets As aboveDIVIDEND The ratio of dividends to net assets As aboveSALES GROWTH Sales growth of the previous year As abovePAYOUT The dividend payout ratio As aboveCAPITAL A dummy variable that is equal to one if the firm is located in
the capital and zero otherwiseAs above
OWNERSHIP Ultimate ownership rights of the largest shareholder Claessens et al. (2000) andFaccio and Lang (2002)
CONTROL Ultimate control right of the largest shareholder As aboveSVTRADED The ratio of stock value traded to GDP Beck et al. (2000)PVCRDGDP The ratio of private credit to GDP As above
References
Agrawal, A., Knoeber, C.R., 2001. Do some outside directors play a political role? J. Law Econ. 44, 179–198.Beck, T., Demirguc-Kunt, A., Levine, R., 2000. A new database on financial development and structure. World Bank Econ. Rev.
14, 597–605.Bertrand, M., Kramaraz, F., Schoar, A., Thesmar, D., 2009. Politicians, Firms and the Political Business Cycle: Evidence from
France, Working Paper, University of Chicago.Boubakri, N., Cosset, J.C., Saffar, W., 2008. Political connections of newly privatized firms. J. Corp. Financial 14, 654–673.Boubakri, N., Cosset, J.C., Saffar, W., 2012a. The impact of political connections on firms’ operating performance and financing
decisions. J. Financial Res. 35, 397–423.Boubakri, N., Guedhami, O., Mishra, D., Saffar, W., 2012b. Political connections and the cost of equity capital. J. Corp. Finance 18,
541–559.Bushman, R., Piotroski, J., 2006. Financial reporting incentives for conservative accounting: the influence of legal and political
institutions. J. Account. Econ. 42, 107–148.Campbell, J.Y., 1996. Understanding risk and return. J. Political Econ. 104, 298–345.Caprio, L., Faccio, M., McConnell, J.J., 2013. Sheltering corporate assets from political extraction. J. Law Econ. Org. 29, 332–354.Chaney, P.K., Faccio, M., Parsley, D.C., 2011. The quality of accounting information in PCFs. J. Acc. Econ. 51, 58–76.Charumilind, C., Kali, R., Wiwattanakantang, Y., 2006. Connected lending: Thailand before the financial crisis. J. Business 79,
181–218.Chen, C.J.P., Ding, Y., Kim, C., 2010. High-level politically connected firms, corruption, and analyst forecast accuracy around the
world. J. Int. Business Stud. 41, 1505–1524.Claessens, S., Djankov, S., Lang, L.H.P., 2000. The separation of ownership and control in East Asian corporations. J. Financial
Econ. 58, 81–112.Dinc , S., 2005. Politicians and banks: political influences on government-owned banks in emerging markets. J. Financial Econ.
77, 453–479.Dittmar, A., Mahrt-Smith, J., Servaes, H., 2003. International corporate governance and corporate cash holdings. J. Financial
Quant. Anal. 38, 111–133.Dittmar, A., Mahrt-Smith, J., 2007. Corporate governance and the value of cash holdings. J. Financial Econ. 83, 599–634.Faccio, M., Masulis, R., McConnell, J., 2006. Political connections and corporate bailouts. J. Finance 61, 2597–2635.Faccio, M., 2006. Politically connected firms. Am. Econ. Rev. 96, 369–386.Faccio, M., 2010. Differences between politically connected firms and non-connected firms: a cross-country analysis. Financial
Manage. 39, 905–927.Faccio, M., Lang, L.H.P., 2002. The ultimate ownership of Western European corporations. J. Financial Econ. 65, 365–395.Faleye, O., 2004. Cash and corporate control. J. Finance 59, 2041–2060.Frye, T., Shleifer, A., 1997. The invisible hand and the grabbing hand. Am. Econ. Rev. 87, 354–358.Goldman, E., Rocholl, J., So, J., 2009. Do politically connected boards affect firm value? Rev. Financial Stud. 22, 2331–2360.Guedhami, O., Pittman, J., Saffar, W., 2009. Auditor choice in privatized firms: empirical evidence on the role of state and foreign
owners. J. Acc. Econ. 48, 151–171.

N. Boubakri et al. / J. of Multi. Fin. Manag. 23 (2013) 338– 355 355
Hay, J., Shleifer, A., 1998. Private enforcement of public laws: a theory of legal reform. Am. Econ. Rev. 88, 398–403.Harford, J., 1999. Corporate cash reserves and acquisitions. J. Finance 54, 1969–1997.Harford, J., Mansi, S.A., Maxwell, W.F., 2008. Corporate governance and firm cash holdings in the U.S. J. Financial Econ. 87,
535–555.Jensen, M.C., 1986. Agency cost of free cash flow, corporate finance and takeovers. Am. Econ. Rev. 76, 323–329.Johnson, S., Mitton, T., 2003. Cronyism and capital controls: evidence from Malaysia. J. Financial Econ. 67, 351–382.Kalcheva, I., Lins, K.V., 2007. International evidence on cash holdings and expected managerial agency problems. Rev. Financial
Stud. 20, 1087–1112.Khwaja, A.I., Mian, A., 2005. Do lenders favor PCFs? Rent provision in an emerging financial market. Quart. J. Econ. 120,
1371–1411.Kim, C.S., Mauer, D.C., Sherman, A.E., 1998. The determinants of corporate liquidity: theory and evidence. J. Financial Quant.
Anal. 33, 335–359.Kusnadi, Y., Wei, K.C.J., 2011. The determinants of corporate cash management policies: evidence from around the world. J.
Corp. Finance 17, 725–740.La Porta, R., Lopez-de-Silanes, F., Shleifer, A., Vishny, R.W., 1998. Law and finance. J. Political Econ. 106, 1113–1155.Leuz, C., Nanda, D., Wysocki, P., 2003. Earnings management and investor protection: an international comparison. J. Financial
Econ. 69, 505–527.Leuz, C., Oberholzer-Gee, F., 2006. Political relationships, global financing, and corporate transparency: evidence from Indonesia.
J. Financial Econ. 81, 411–439.Mikkelson, W.H., Partch, M.M., 2003. Do persistent large cash reserves hinder performance? J. Financial Quant. Anal. 38, 275–294.Mobarak, A.M., Purbasari, D.P., 2009. Corrupt Protection for Sale to Firms: Evidence from Indonesia, Working Paper, University
of Colorado, Boulder.Myers, S., Majluf, N., 1984. Corporate financing and investment decision when firms have information that investors do not
have. J. Financial Econ. 13, 187–221.Opler, T., Pinkowitz, L., Stulz, R., Williamson, R., 1999. The determinants and implications of corporate cash holdings. J. Financial
Econ. 52, 3–46.Pinkowitz, L., Williamson, R., 2001. Bank power and cash holdings: evidence from Japan. Rev. Financial Stud. 14, 1059–1082.Pinkowitz, L., Stulz, R., Williamson, R., 2006. Does the contribution of cash holdings and dividends to firm value depend on
governance? A cross-country analysis. J. Finance 61, 2725–2751.Roberts, B., 1990. A dead senator tells no lies: seniority and the distribution of federal benefits. Am. J. Political Sci. 34, 31–58.Sapienza, P., 2004. The effects of government ownership on bank lending. J. Financial Econ. 72, 357–384.Shleifer, A., Vishny, R.W., 1998. The Grabbing Hand: Government Pathologies and their Cures. Harvard University Press,
Cambridge, MA.Stulz, R., 1990. Managerial discretion and optimal financing policies. J. Financial Econ. 26, 3–27.