catalysts evaluation for catalytic steam cracking of de
TRANSCRIPT
University of Calgary
PRISM: University of Calgary's Digital Repository
Graduate Studies The Vault: Electronic Theses and Dissertations
2015-11-18
Catalysts Evaluation for Catalytic Steam Cracking of
De-asphalted Oil in a Fixed Bed Reactor
Garcia Hubner, Eduardo Antonio
Garcia Hubner, E. A. (2015). Catalysts Evaluation for Catalytic Steam Cracking of De-asphalted
Oil in a Fixed Bed Reactor (Unpublished master's thesis). University of Calgary, Calgary, AB.
doi:10.11575/PRISM/25223
http://hdl.handle.net/11023/2641
master thesis
University of Calgary graduate students retain copyright ownership and moral rights for their
thesis. You may use this material in any way that is permitted by the Copyright Act or through
licensing that has been assigned to the document. For uses that are not allowable under
copyright legislation or licensing, you are required to seek permission.
Downloaded from PRISM: https://prism.ucalgary.ca

UNIVERSITY OF CALGARY
Catalysts Evaluation for Catalytic Steam Cracking of De-asphalted Oil in a Fixed Bed Reactor
by
Eduardo Antonio Garcia-Hubner
A THESIS
SUBMITTED TO THE FACULTY OF GRADUATE STUDIES
IN PARTIAL FULFILLMENT OF THE REQUIREMENTS FOR THE
DEGREE OF MASTER OF SCIENCE
GRADUATE PROGRAM IN CHEMICAL ENGINEERING
CALGARY, ALBERTA
NOVEMBER, 2015
©Eduardo Antonio Garcia-Hubner 2015
ii
Abstract
The present study aims to show performance of a catalytic steam cracking unit when processing
de-asphalted oil, as part of a proposed upgrading scheme. Improve in the properties of the oil
regarding viscosity and API gravity is intended, in order to make it pipeline transportable.
All the experiments were performed in a continuous bench scale plant fitted with a fixed bed
reactor, working at 150-400 psi and temperatures between 350 °C and 400 °C. The results from
the evaluation of the catalysts, shows capability for catalytic water dissociation, hydrogen
production, hydrocarbon cracking and hydrogenation, especially one catalyst containing Mo2C.
This catalyst, working at 370°C and 400 psi, generated a product able to meet viscosity
specification at 14°C. The Syncrude produced required 16% less diluent to be pumped and
improvement in sulphur content and Total Acid Number (TAN) was also observed.

iii
Acknowledgements
I place on record, my sincerest gratitude to Dr. Pedro Pereira-Almao. I have been honored to
receive the opportunity to work among such a talented and supportive staff like the one you lead.
I am sure this excellent experience left an essential mark in my professional and personal growth.
I would like also to thank you for all the guidance, wisdom and encouragement provided at any
time during the materialization of this research project.
I also want to take this opportunity to thank Dr. Josefina Scott and Dr. Gerardo Vitale for their
endless support and particularly, for their availability whenever doubts arose. To Azfar Hassan,
Josune Carbognani, Laura Sosa and Dr. Argenis Aguero for their constant help in all the activities
related to the laboratory. To Mr. Lante Carbognani and Dr. Scott for sharing their wisdom.
Thanks to Natural Science and Engineering Research Council of Canada (NSCERC), Nexen Inc,
Alberta Innovates Energy and Environmental Solutions; and The Chemical and Petroleum
Engineering Department from University of Calgary, for providing the financial support to carry
out this research.
In general, I want to thank all the members of the Catalysts for Bitumen Upgrading Group
(CBUG). In one way or another, all of them were involved in the successful accomplishment of
this research project.
Last but not least, I have special gratitude to my family. My parents, Eduardo Garcia and Maria
Elena Hubner, have always given 100% of themselves to support me in achieving each one of my
goals, no matter how hard they might seem. To my siblings, Adrian Garcia and Eira Garcia, and
my grandma Clemencia Liscano. Finally, I wanted to thank to my beloved Lorena Bernal for being
my life partner and encouraging me during the hardest moments.

iv
Dedication
To: The eternal cotton lover
My dear friend mom
My amazing siblings
My love
This is for and thanks to you...

v
Table of Contents
Abstract .......................................................................................................................................... ii
Acknowledgements ...................................................................................................................... iii
Table of Contents ...........................................................................................................................v
List of Tables .............................................................................................................................. viii
List of Figures ............................................................................................................................... ix
List of Symbols ........................................................................................................................... xiii
Introduction ...........................................................................................................1
1.1 Background ................................................................................................................................1
1.2 Objectives ..................................................................................................................................5
Literature Review .................................................................................................7
2.1 Petroleum ...................................................................................................................................7
2.1.1 Classification ......................................................................................................................8
2.1.2 Chemical and fractional composition .................................................................................9
2.2 Upgrading ................................................................................................................................14
2.2.1 Carbon rejection processes ...............................................................................................16
2.2.2 Hydrogen addition processes ............................................................................................20
2.3 Catalytic Steam Cracking (CSC) .............................................................................................24
2.3.1 Thermodynamics and mechanism ....................................................................................26
2.3.2 Technologies .....................................................................................................................30
2.4 Catalyst Development ..............................................................................................................34
2.4.1 Cat 1: CsBaNi-Metakaolin ................................................................................................36
2.4.2 Cat 2: NiCe-Calcined Hydrotalcite ...................................................................................37
2.4.3 Cat 3: NiCe-Aegirine ........................................................................................................39
2.4.4 Cat 4: NiCe-Faujasite ........................................................................................................40
vi
2.4.5 Cat 5: NiCe-Calcined Hydrotalcite+Molybdenum Carbide .............................................42
Experimental Section .......................................................................................44
3.1 Catalyst Preparation .................................................................................................................44
3.1.1 Cat 1: CsBaNi-Metakaolin ................................................................................................44
3.1.2 Cat 2: NiCe-Calcined Hydrotalcite ...................................................................................45
3.1.3 Cat 3: NiCe-Aegirine ........................................................................................................46
3.1.4 Cat 4: NiCe-Faujasite ........................................................................................................47
3.1.5 Cat 5: NiCe-Calcined Hydrotalcite+Molybdenum Carbide .............................................47
3.2 Catalyst Characterization .........................................................................................................48
3.2.1 Textural properties ............................................................................................................48
3.2.1 Temperature Programmed Techniques .............................................................................49
3.2.1 Thermogravimetric Analysis (TGA) ................................................................................50
3.2.1 X-Ray Diffraction (XRD) .................................................................................................50
3.2.2 X-Ray Photoelectron Spectroscopy (XPS) .......................................................................51
3.1 Carborundum cleaning .............................................................................................................52
3.2 Feedstock .................................................................................................................................52
3.3 Plant description.......................................................................................................................54
3.3.1 Operating procedure .........................................................................................................59
3.4 Characterization of Samples ....................................................................................................62
3.4.1 High Temperature Simulated Distillation (HTSD) ...........................................................62
3.4.2 Water content ....................................................................................................................64
3.4.3 Oil density .........................................................................................................................64
3.4.4 Microcarbon residue .........................................................................................................65
3.4.5 Gases .................................................................................................................................66
3.4.6 Viscosity ...........................................................................................................................68
3.4.7 Microdeasphalting ............................................................................................................68
3.4.8 Elemental analysis (Sulphur and Nitrogen) ......................................................................69
3.4.9 P-value ..............................................................................................................................69
3.4.10 Bromine number .............................................................................................................70
3.4.11 Total Acid Number (TAN) .............................................................................................70
vii
Catalyst Characterization Results ....................................................................72
4.1 Nominal metal composition for each catalyst ..........................................................................72
4.2 Textural properties ...................................................................................................................73
4.3 Temperature Programmed Reduction (TPR) ...........................................................................74
4.4 Temperature Programmed Desorption of Ammonia (TPD) ....................................................78
4.5 Powder X-Ray Diffraction (XRD) ...........................................................................................83
4.1 X-Ray Photoelectron Spectroscopy (XPS) ..............................................................................89
4.1.1 Decomposition of Ni 2p3/2 ................................................................................................91
4.1.2 Decomposition of Ce 3d5/2 ................................................................................................94
Pilot Plant Operations ........................................................................................97
5.1 Thermal steam cracking ...........................................................................................................98
5.2 Catalytic steam cracking ........................................................................................................103
5.2.1 Preliminary catalyst screening ........................................................................................103
5.2.2 Catalyst stability and product comparison ......................................................................108
5.2.3 Experimental demonstration of catalytic water splitting ................................................114
5.2.4 Operational and catalyst improvements ..........................................................................118
5.3 Upgrading scheme evaluation ................................................................................................129
Summary and Recommended Future Work ....................................................132
References ...................................................................................................................................137
Appendix A: STANDARD OPERATING PROCEDURE OF CATALYST TESTING UNIT
(CTU-1) .......................................................................................................................................142
Appendix B: Catalyst Characterization Data .........................................................................174
viii
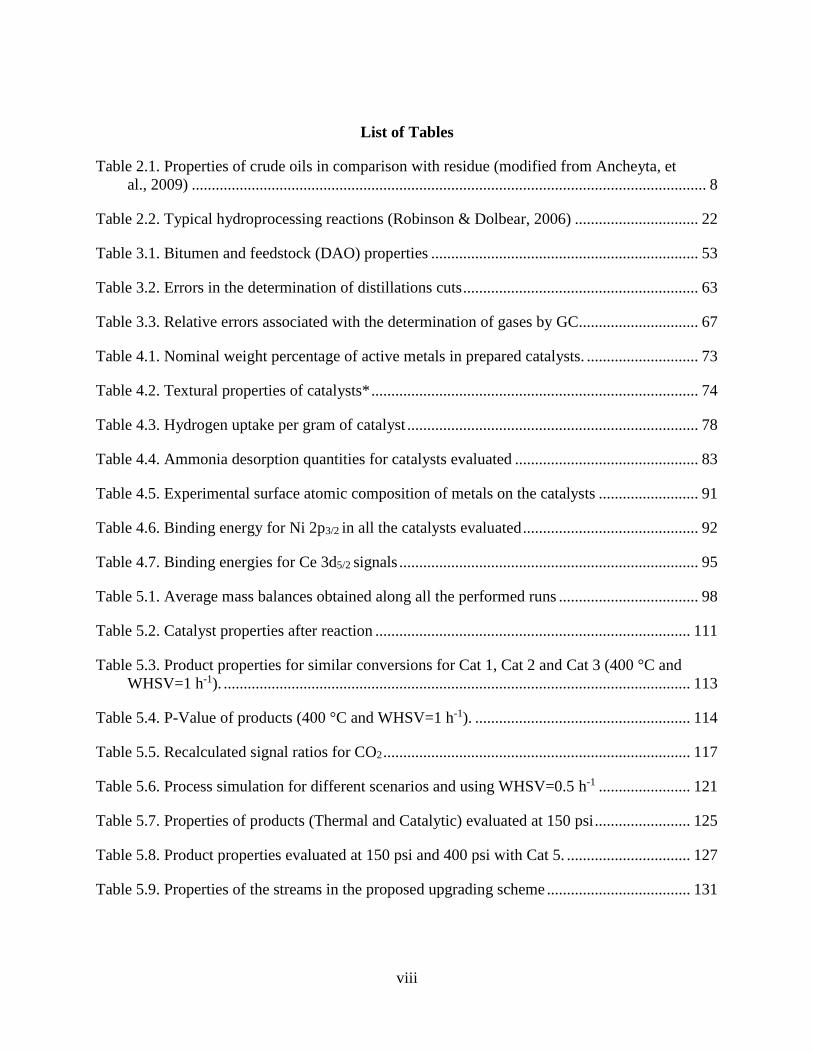
List of Tables
Table 2.1. Properties of crude oils in comparison with residue (modified from Ancheyta, et
al., 2009) ................................................................................................................................. 8
Table 2.2. Typical hydroprocessing reactions (Robinson & Dolbear, 2006) ............................... 22
Table 3.1. Bitumen and feedstock (DAO) properties ................................................................... 53
Table 3.2. Errors in the determination of distillations cuts ........................................................... 63
Table 3.3. Relative errors associated with the determination of gases by GC .............................. 67
Table 4.1. Nominal weight percentage of active metals in prepared catalysts. ............................ 73
Table 4.2. Textural properties of catalysts* .................................................................................. 74
Table 4.3. Hydrogen uptake per gram of catalyst ......................................................................... 78
Table 4.4. Ammonia desorption quantities for catalysts evaluated .............................................. 83
Table 4.5. Experimental surface atomic composition of metals on the catalysts ......................... 91
Table 4.6. Binding energy for Ni 2p3/2 in all the catalysts evaluated ............................................ 92
Table 4.7. Binding energies for Ce 3d5/2 signals ........................................................................... 95
Table 5.1. Average mass balances obtained along all the performed runs ................................... 98
Table 5.2. Catalyst properties after reaction ............................................................................... 111
Table 5.3. Product properties for similar conversions for Cat 1, Cat 2 and Cat 3 (400 °C and
WHSV=1 h-1). ..................................................................................................................... 113
Table 5.4. P-Value of products (400 °C and WHSV=1 h-1). ...................................................... 114
Table 5.5. Recalculated signal ratios for CO2 ............................................................................. 117
Table 5.6. Process simulation for different scenarios and using WHSV=0.5 h-1 ....................... 121
Table 5.7. Properties of products (Thermal and Catalytic) evaluated at 150 psi ........................ 125
Table 5.8. Product properties evaluated at 150 psi and 400 psi with Cat 5. ............................... 127
Table 5.9. Properties of the streams in the proposed upgrading scheme .................................... 131
ix
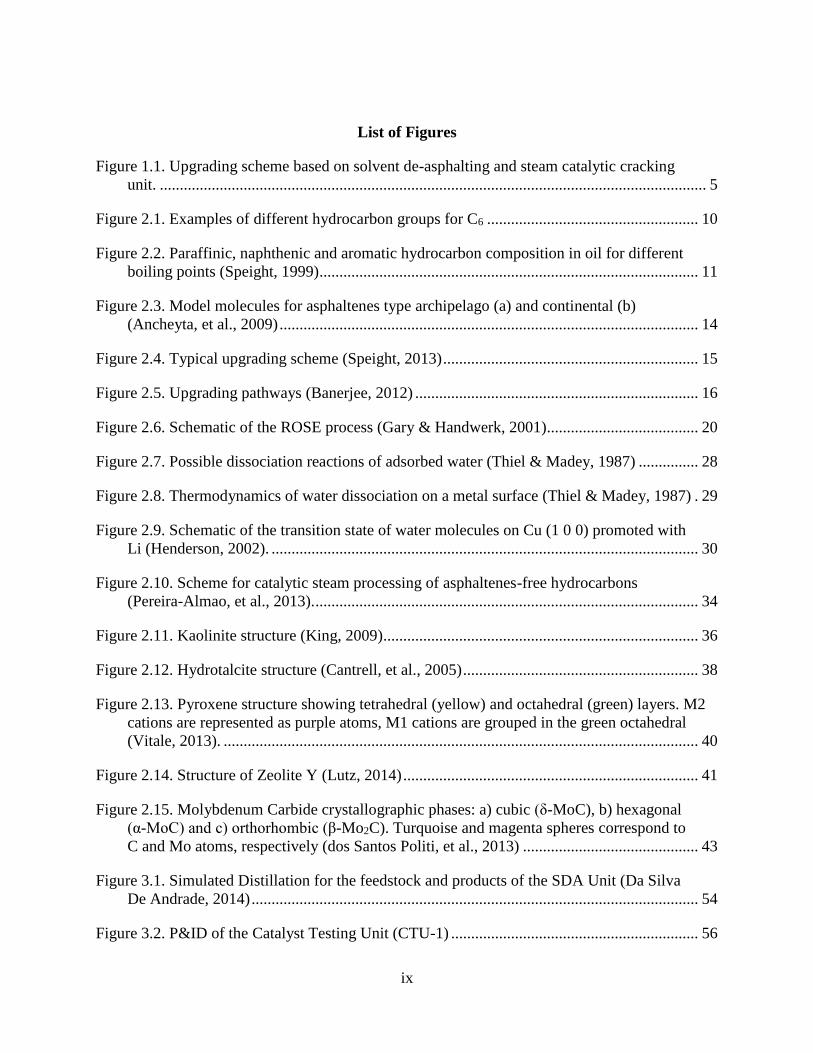
List of Figures
Figure 1.1. Upgrading scheme based on solvent de-asphalting and steam catalytic cracking
unit. ......................................................................................................................................... 5
Figure 2.1. Examples of different hydrocarbon groups for C6 ..................................................... 10
Figure 2.2. Paraffinic, naphthenic and aromatic hydrocarbon composition in oil for different
boiling points (Speight, 1999) ............................................................................................... 11
Figure 2.3. Model molecules for asphaltenes type archipelago (a) and continental (b)
(Ancheyta, et al., 2009) ......................................................................................................... 14
Figure 2.4. Typical upgrading scheme (Speight, 2013) ................................................................ 15
Figure 2.5. Upgrading pathways (Banerjee, 2012) ....................................................................... 16
Figure 2.6. Schematic of the ROSE process (Gary & Handwerk, 2001)...................................... 20
Figure 2.7. Possible dissociation reactions of adsorbed water (Thiel & Madey, 1987) ............... 28
Figure 2.8. Thermodynamics of water dissociation on a metal surface (Thiel & Madey, 1987) . 29
Figure 2.9. Schematic of the transition state of water molecules on Cu (1 0 0) promoted with
Li (Henderson, 2002). ........................................................................................................... 30
Figure 2.10. Scheme for catalytic steam processing of asphaltenes-free hydrocarbons
(Pereira-Almao, et al., 2013). ................................................................................................ 34
Figure 2.11. Kaolinite structure (King, 2009)............................................................................... 36
Figure 2.12. Hydrotalcite structure (Cantrell, et al., 2005) ........................................................... 38
Figure 2.13. Pyroxene structure showing tetrahedral (yellow) and octahedral (green) layers. M2
cations are represented as purple atoms, M1 cations are grouped in the green octahedral
(Vitale, 2013). ....................................................................................................................... 40
Figure 2.14. Structure of Zeolite Y (Lutz, 2014) .......................................................................... 41
Figure 2.15. Molybdenum Carbide crystallographic phases: a) cubic (δ-MoC), b) hexagonal
(α-MoC) and c) orthorhombic (β-Mo2C). Turquoise and magenta spheres correspond to
C and Mo atoms, respectively (dos Santos Politi, et al., 2013) ............................................ 43
Figure 3.1. Simulated Distillation for the feedstock and products of the SDA Unit (Da Silva
De Andrade, 2014) ................................................................................................................ 54
Figure 3.2. P&ID of the Catalyst Testing Unit (CTU-1) .............................................................. 56

x
Figure 3.3. Reactor assemblies ..................................................................................................... 58
Figure 4.1. Catalysts after preparation .......................................................................................... 72
Figure 4.2. H2-TPR for Cat 1 ........................................................................................................ 75
Figure 4.3. H2-TPR for Cat 2 ........................................................................................................ 76
Figure 4.4. H2-TPR for Cat 3 ........................................................................................................ 76
Figure 4.5. H2-TPR for Cat 4 ........................................................................................................ 77
Figure 4.6. H2-TPR for Cat 5 ........................................................................................................ 77
Figure 4.7. NH3-TPD for Cat 2 ..................................................................................................... 79
Figure 4.8. NH3-TPD for Cat 3 ..................................................................................................... 80
Figure 4.9. NH3-TPD for Cat 4 ..................................................................................................... 81
Figure 4.10. NH3-TPD for Cat 5 ................................................................................................... 82
Figure 4.11. XRD diffractogram for Cat 1 ................................................................................... 84
Figure 4.12. XRD diffractogram for Cat 2 ................................................................................... 85
Figure 4.13. XRD diffractogram for Cat 3 ................................................................................... 86
Figure 4.14. XRD diffractogram for as provided FAU. ............................................................... 87
Figure 4.15. XRD diffractogram for Cat 4. .................................................................................. 87
Figure 4.16. XRD for Molybdenum Carbide. ............................................................................... 88
Figure 4.17. XRD diffractogram for Cat 5 fresh and treated in hydrogen at 500°C .................... 89
Figure 4.18. Survey scan for Cat 1 ............................................................................................... 91
Figure 4.19. Decomposition of Ni 2p3/2 for all catalysts ............................................................. 93
Figure 4.20. Decomposition of Ce 3d ........................................................................................... 95
Figure 5.1. Effect of temperature and residence time over the residue conversion in thermal
cracking ............................................................................................................................... 100
Figure 5.2. API variation with residue conversion ..................................................................... 101
Figure 5.3. Log of viscosity variation with residue conversion .................................................. 102

xi
Figure 5.4. Asphaltenes content vs. residue conversion ............................................................. 102
Figure 5.5. Microcarbon vs. residue conversion. ........................................................................ 103
Figure 5.6. Effect of temperature and catalyst type on residue conversion. Blue symbols
correspond to runs at 380 °C and patterned red symbols at 400°C. The respective
thermal conversions are also shown at 380 °C (dotted line) and 400 °C (continuous
line). .................................................................................................................................... 105
Figure 5.7. Components gas flowrate reached at the end of each temperature for the catalytic
runs, in comparison with the thermal runs. ......................................................................... 107
Figure 5.8. Deactivation profile of the catalyst tested at 400 °C and WHSV=1 h-1. .................. 108
Figure 5.9. Gas production at stabilization (400 °C and WHSV=1 h-1). .................................... 109
Figure 5.10. Hydrogen and methane production evolution with time (400 °C and
WHSV=1 h-1). ..................................................................................................................... 110
Figure 5.11. Product Distribution at similar conversion for Cat 1, Cat 2 and Cat 3 (400 °C
and WHSV=1 h-1). .............................................................................................................. 112
Figure 5.12. m/z-xx / m/z-44 ratios for experiments at 360, 380 and 400 °C ............................ 116
Figure 5.13. Results for Cat 4 evaluation at 380°C and WHSV=1 h-1. ...................................... 119
Figure 5.14. Product distribution for Cat 4 in comparison with Cat 1, 2 and 3. ......................... 120
Figure 5.15. Experimental results for water content/parameter variations ................................. 123
Figure 5.16. Evaluation of Cat 4 and Cat 5 at 150 psi. Blue symbols refer to runs at 350°C
and patterned red symbols at 370°C. Lines correspond to the thermal runs. ...................... 125
Figure 5.17. Pressure effect on residue conversion for Cat 5 evaluated at 350°C (blue
symbols) and 370 °C (red symbols). Straight lines correspond to their respective
thermal runs. Light blue for thermal at 150 psi and dark blue for thermal at 400 psi. ....... 127
Figure 5.18. Gas analysis for Cat 5 evaluation at 150 and 400 psi ............................................. 129
Figure 5.19. Upgrading Scheme with only gas and syncrude as products ................................. 131
Figure B.1. Isotherm and pore distribution charts for Cat 1 ....................................................... 174
Figure B.2. Isotherm and pore distribution charts for Cat 1 ....................................................... 174
Figure B.3. Isotherm and pore distribution charts for Cat 3 ....................................................... 175

xii
Figure B.4. Isotherm and pore distribution charts for Cat 4 ....................................................... 175
Figure B.5. Isotherm and pore distribution charts for Cat 5 ....................................................... 176
Figure B.6. Survey scan for Cat 2 ............................................................................................... 176
Figure B.7. Survey scan for Cat 3 ............................................................................................... 177
Figure B.8. Survey scan for Cat 4 ............................................................................................... 177
Figure B.9. Survey scan for Cat 5 ............................................................................................... 178
xiii
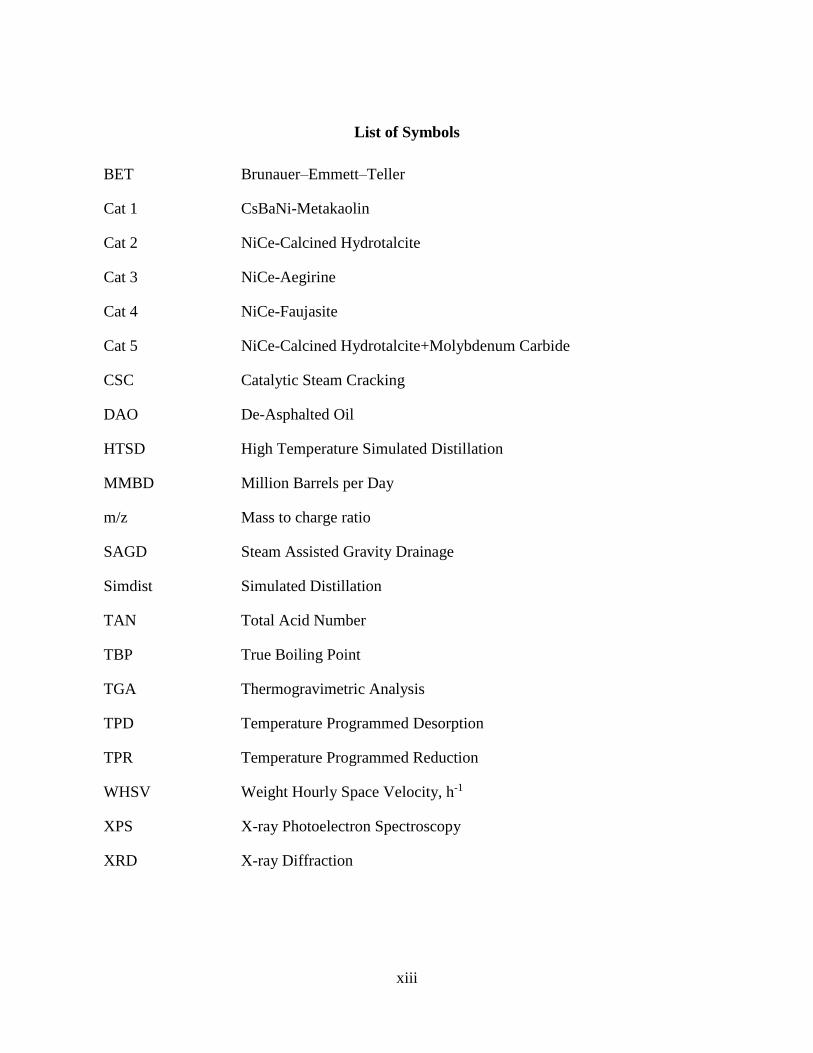
List of Symbols
BET Brunauer–Emmett–Teller
Cat 1 CsBaNi-Metakaolin
Cat 2 NiCe-Calcined Hydrotalcite
Cat 3 NiCe-Aegirine
Cat 4 NiCe-Faujasite
Cat 5 NiCe-Calcined Hydrotalcite+Molybdenum Carbide
CSC Catalytic Steam Cracking
DAO De-Asphalted Oil
HTSD High Temperature Simulated Distillation
MMBD Million Barrels per Day
m/z Mass to charge ratio
SAGD Steam Assisted Gravity Drainage
Simdist Simulated Distillation
TAN Total Acid Number
TBP True Boiling Point
TGA Thermogravimetric Analysis
TPD Temperature Programmed Desorption
TPR Temperature Programmed Reduction
WHSV Weight Hourly Space Velocity, h-1
XPS X-ray Photoelectron Spectroscopy
XRD X-ray Diffraction

1
Introduction
1.1 Background
The continuous increase in energy demand is a clear evidence of the worldwide unceasing growth
of the economies, especially of the developing countries. According to the U.S Energy Information
Administration (U.S. Energy Information Administration, 2014), an increase of 30.5% in the
global petroleum consumption ending up in 86.8 MMBD was experienced between 1990 and 2010,
as a consequence of the progress of the countries to reach an overall growth of 86% in their Gross
Domestic Product. Furthermore, the projections indicate that the world will require an extra 32.6
MMBD of petroleum in the market by 2040 in order to satisfy, specifically, the demand of the
developing countries not belonging to the Organization for Economic Cooperation and
Development. Those countries are expected to grow about 290% between 2010 and 2040 with an
average of 4.6% increase per year.
In order to meet the upcoming oil demand, the industry will have to face a variety of challenges
associated with the production of this material regardless of operation costs and investments, as
long as some profit can be generated. Out of the 6.5 trillions of technically recoverable oil reserves
in the world, at least 58% are categorized as unconventional oil due to the complexities involved
in the production of it, mainly attributable to the low porosity and permeability of the matrix rock
and/or by the extra heaviness and high carbon content of the material. As part of the
unconventional oil reserves, bitumen and extra heavy oil represent about 29% of the total (Gordon,
2013), where Venezuela and Canada are the world leaders with around 513 and 177 billion of
barrels of proven reserves, respectively (Banerjee, 2012). Therefore, the development of
technologies to improve the production, the quality of the products and the efficiency and economy
of the process is a key point in the exploitation of this raw material.
2
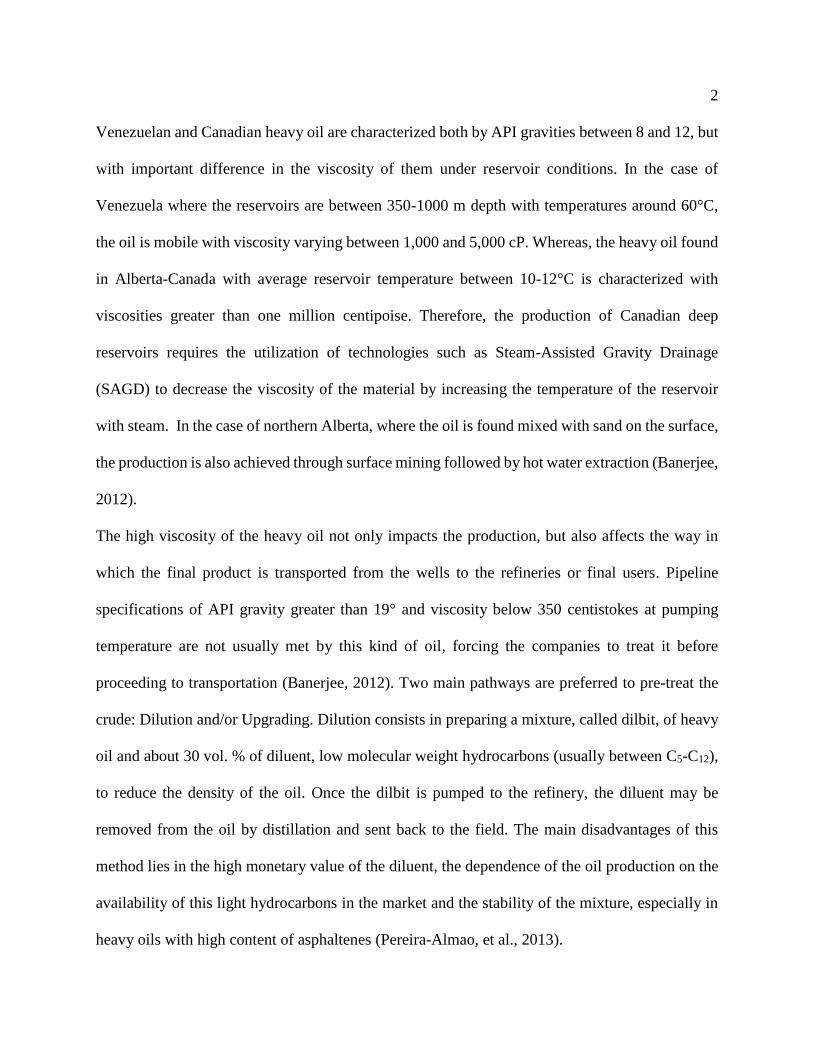
Venezuelan and Canadian heavy oil are characterized both by API gravities between 8 and 12, but
with important difference in the viscosity of them under reservoir conditions. In the case of
Venezuela where the reservoirs are between 350-1000 m depth with temperatures around 60°C,
the oil is mobile with viscosity varying between 1,000 and 5,000 cP. Whereas, the heavy oil found
in Alberta-Canada with average reservoir temperature between 10-12°C is characterized with
viscosities greater than one million centipoise. Therefore, the production of Canadian deep
reservoirs requires the utilization of technologies such as Steam-Assisted Gravity Drainage
(SAGD) to decrease the viscosity of the material by increasing the temperature of the reservoir
with steam. In the case of northern Alberta, where the oil is found mixed with sand on the surface,
the production is also achieved through surface mining followed by hot water extraction (Banerjee,
2012).
The high viscosity of the heavy oil not only impacts the production, but also affects the way in
which the final product is transported from the wells to the refineries or final users. Pipeline
specifications of API gravity greater than 19° and viscosity below 350 centistokes at pumping
temperature are not usually met by this kind of oil, forcing the companies to treat it before
proceeding to transportation (Banerjee, 2012). Two main pathways are preferred to pre-treat the
crude: Dilution and/or Upgrading. Dilution consists in preparing a mixture, called dilbit, of heavy
oil and about 30 vol. % of diluent, low molecular weight hydrocarbons (usually between C5-C12),
to reduce the density of the oil. Once the dilbit is pumped to the refinery, the diluent may be
removed from the oil by distillation and sent back to the field. The main disadvantages of this
method lies in the high monetary value of the diluent, the dependence of the oil production on the
availability of this light hydrocarbons in the market and the stability of the mixture, especially in
heavy oils with high content of asphaltenes (Pereira-Almao, et al., 2013).
3
On the other hand, upgraders are large facilities consisting of a set of chemical and physical
processes that aim to either separate the heavy fractions of the oil or to convert it into compounds
of lower molecular weight (Griffiths & Dyer, 2008; Banerjee, 2012). Depending on the level of
residue conversion, the final product is a synthetic crude (Syncrude), whose characteristics can be
as good as a light conventional oil or one that just meets pipeline specifications. Most commercial
upgraders consist of deep conversion refineries adaptation located in remote locations, which
increase their high initial investment, complexity and the operational costs (Pereira-Almao, et al.,
2013).
One technology proposed by Pereira-Almao, et al., 2013 (Patent US20130015100 A1) consists of
a simple scheme for upgraders targeting mild improvement of the properties of the oil to reach
pipeline specification, instead of reaching full conversion of the heavy fraction in it as done by
other technologies such as coking. The idea is based on processing the heavy streams free of
asphaltenes with steam in a tubular reactor, using nano catalysts in ultradispersed form. Water is
dissociated by the catalyst to produce hydrogen and benefit the hydrogenation of the oil, which
gives stability to the final product, reduces the production of olefins and polyaromatics and in
general increases the H/C ratio. The streams are separated by distillation units and the asphaltenes
are removed from the heavy cuts in the solvent de-asphalting unit. The final product, a synthtic
crude oil, is a mixture of the lights and upgraded cuts with some of the original heavy material
(Pereira-Almao, et al., 2013). One of the main advantages of this technology is the capability of
having hydrogenation reactions during the upgrading without the need of using hydrogen, which
is usually expensive to produce and transport.
Despite the high activity and low production cost involved in the use of ultradispersed catalysts
during catalytic steam cracking, there are some drawbacks regarding the recovery of the catalytic
4
material and the costly separation process required (Pereira-Almao, et al., 2011). For that reason,
the Catalyst for Bitumen Upgrading Group at the University of Calgary under the supervision of
Dr. Pedro Pereira-Almao has put effort into developing supported catalysts able to perform steam
catalytic cracking in a fixed bed reactor. This type of reactor has been around for a long time and
used in different kinds of processes, which is the reason why its realiable operations are well
known. Besides, the use of a catalytic bed allows the relatively easy replacement of it and even the
in situ regeneration of the catalyst, if possible. However, supported catalysts in the presence of the
whole bitumen rich in asphaltenes tend to plug and produce coke, leading to de-activation.
Therefore, the upgrading scheme presented in the Figure 1.1 is proposed, where the oil is firstly
deasphalted to split it into two streams: an asphaltenes rich stream called pitch and de-asphalted
oil (DAO). The latter is processed in a steam catalytic cracking unit with a fixed bed reactor.
Depending on the quality of the products in terms of viscosity and °API, they can be either mixed
with the whole pitch or with a certain fraction of it until meeting pipeline specification. By means
of this scheme, the complexity and investment cost of upgraders is considerably reduced, as well
as, the important amount of energy required by distillation units at the beginning of most common
processes.

5
Figure 1.1. Upgrading scheme based on solvent de-asphalting and steam catalytic cracking
unit.
1.2 Objectives
In order to prove the viability of processing heavy oils via the scheme proposed above with steam
catalytic cracking in a fixed bed reactor as conversion unit, a different kinds of supported catalysts
were developed and tested in a bench scale plant. The catalysts consisted of solid extrudates
containing combinations of transition metals, rare earth and alkali metals dispersed in selected
oxide matrixes. Therefore, the general goal of the present research project is to evaluate those
catalysts, and thus, determine whether the level of residue conversion and quality of the products
obtained catalytically is suitable for implementing the proposed idea as a lower cost upgrader
scheme.
To accomplish the previous general goal, the following specific objectives can be established:
Design, procure and construct a bench scale plant able to operate with small amounts of
the proposed catalysts, in order to avoid the preparation of a large amount of them.

6
Prepare and characterize supported catalysts that promote the water splitting mechanism
and thus, the targeted in-situ production of hydrogen.
Evaluate the developed catalysts in the bench scale plant, using De-asphalted Oil (DAO)
as feedstock in the presence of steam.
Characterize the products obtained catalytically and compared them with the ones obtained
via thermal steam cracking under the same conditions.
Verify the water splitting mechanism by using labeled water and analyzing the gases in a
quadrupole mass spectrometer.
Incorporate into the catalyst hydrogen activating sites that could increase the global
performance of the catalyst in the process.

7
Literature Review
The following chapter aims to generate the knowledge required to understand the background of
the project and the different topics to be discussed during the development of it. Besides, it also
highlights previous findings and their relationship with this subject. The literature review chapter
is divided into four main sections, starting with a basic understanding of petroleum and its typical
characteristics. Then, explanation about the concept of crude oil upgrading and different
technologies currently applied is also presented. The third section introduces catalytic steam
cracking and its basis, as an interesting and economical way to improve the properties of crude
oils. Finally, a literature review and description of the metals and materials used for the elaboration
of the supported catalyst used in this research, is also presented.
2.1 Petroleum
The natural thermal evolution and transformation of sedimentary organic matter embedded in a
specific rock, called source rock, is what it is known as Petroleum (Huc, 2011). Therefore,
petroleum can be generally classified as the naturally occurring mixture of hydrocarbons, whether
in liquid, gaseous or solid phase (Speight, 1999). Once petroleum is generated in the source rock,
it migrates upwards through porous and fractured permeable rocks and along pervasive faults, until
it is trapped by “defaults” of the draining system. This upward migration brings as a consequence
a decrease in the temperature of the material, in some instances, the temperature values can be low
enough to enable the development of bacterial activity that feeds on the petroleum and modifies
its physical and chemical properties. As a result, an increase in the viscosity is experienced and
heavy, extra heavy oil and bitumen are formed (Huc, 2011).
8
2.1.1 Classification
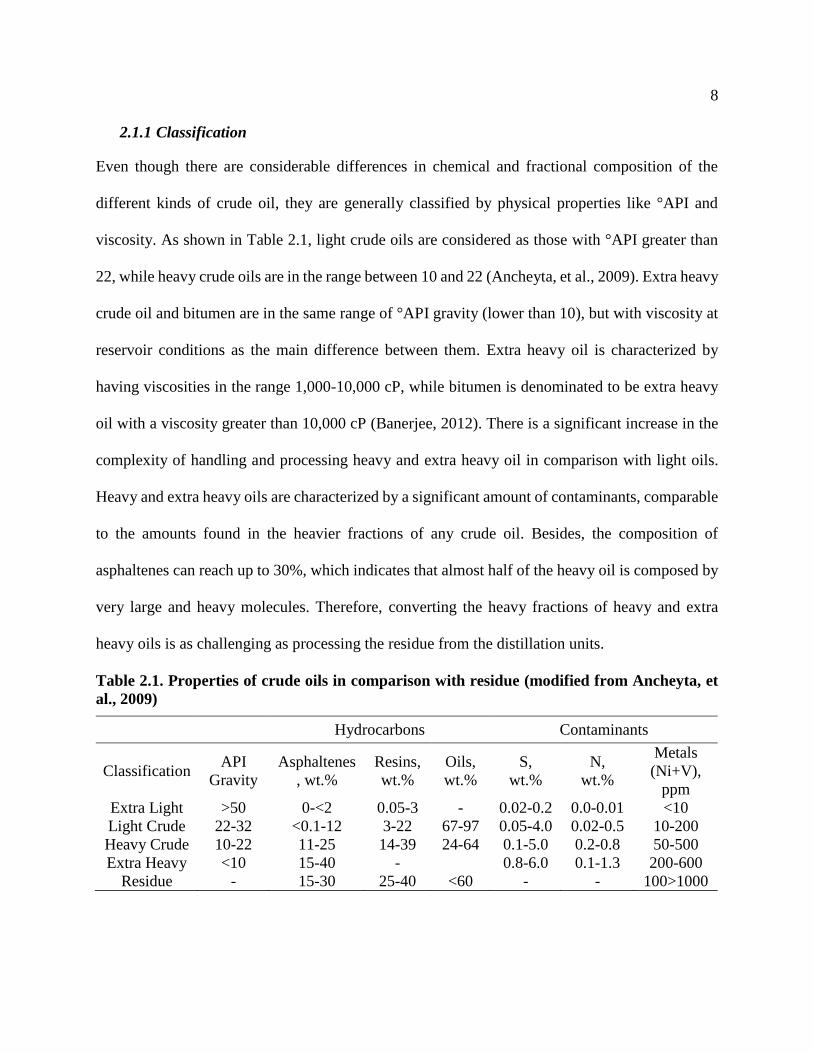
Even though there are considerable differences in chemical and fractional composition of the
different kinds of crude oil, they are generally classified by physical properties like °API and
viscosity. As shown in Table 2.1, light crude oils are considered as those with °API greater than
22, while heavy crude oils are in the range between 10 and 22 (Ancheyta, et al., 2009). Extra heavy
crude oil and bitumen are in the same range of °API gravity (lower than 10), but with viscosity at
reservoir conditions as the main difference between them. Extra heavy oil is characterized by
having viscosities in the range 1,000-10,000 cP, while bitumen is denominated to be extra heavy
oil with a viscosity greater than 10,000 cP (Banerjee, 2012). There is a significant increase in the
complexity of handling and processing heavy and extra heavy oil in comparison with light oils.
Heavy and extra heavy oils are characterized by a significant amount of contaminants, comparable
to the amounts found in the heavier fractions of any crude oil. Besides, the composition of
asphaltenes can reach up to 30%, which indicates that almost half of the heavy oil is composed by
very large and heavy molecules. Therefore, converting the heavy fractions of heavy and extra
heavy oils is as challenging as processing the residue from the distillation units.
Table 2.1. Properties of crude oils in comparison with residue (modified from Ancheyta, et
al., 2009)
Hydrocarbons Contaminants
Classification API
Gravity
Asphaltenes
, wt.%
Resins,
wt.%
Oils,
wt.%
S,
wt.%
N,
wt.%
Metals
(Ni+V),
ppm
Extra Light >50 0-<2 0.05-3 - 0.02-0.2 0.0-0.01 <10
Light Crude 22-32 <0.1-12 3-22 67-97 0.05-4.0 0.02-0.5 10-200
Heavy Crude 10-22 11-25 14-39 24-64 0.1-5.0 0.2-0.8 50-500
Extra Heavy <10 15-40 - 0.8-6.0 0.1-1.3 200-600
Residue - 15-30 25-40 <60 - - 100>1000

9
Another definition well used in the oil industry to categorize crude oils is based on the type of
recovery method used to produce the raw material. Conventional oil is the name assigned to those
oils that can be produced by primary and even conventional secondary recovery methods. In
general, the conditions of the reservoirs and the characteristic of the oil is such that no thermal
methods are required to flow the material into the wellbore (Speight, 1999). Light oils and even
heavy oils can be considered as conventional. However, extra heavy oils and bitumen require
enhanced oil recovery methods to produce them, thus they are part of the so called unconventional
oils (Banerjee, 2012). Even though shale oils are mostly light hydrocarbons, they are also classified
within unconventionally produced oils. It is important to highlight that primary production is the
one obtained at initial stages of the production, when the displacement of the oil is driven by the
natural existing energy in the reservoir such as gas drive, gas-cap drive, water drive, fluid and rock
expansion and gravity drainage. Secondary recovery methods require the injection of fluids such
as water or gas to maintain the reservoir pressure and displace hydrocarbons. In tertiary recovery
methods, or commonly named enhanced oil recovery methods (EOR), gases (hydrocarbons or
CO2) or chemicals (polymers, surfactants etc.) are injected into the reservoir to favor the
displacement of the oil. Thermal processes, either steam injection or in situ thermal generation by
oil combustion, are also considered as EOR methods (Green & Willhite, 1998).
2.1.2 Chemical and fractional composition
The composition of the petroleum is influenced by several factors such as the location and the
depth of the reservoirs and the age of the oil. Nevertheless, in general, it consists of a complex
mixture of different kinds of hydrocarbons, including small amounts of organic compounds
containing heteroatoms (nitrogen, sulphur and oxygen) and metals (vanadium, nickel, iron and
copper) (Speight, 1999).
10
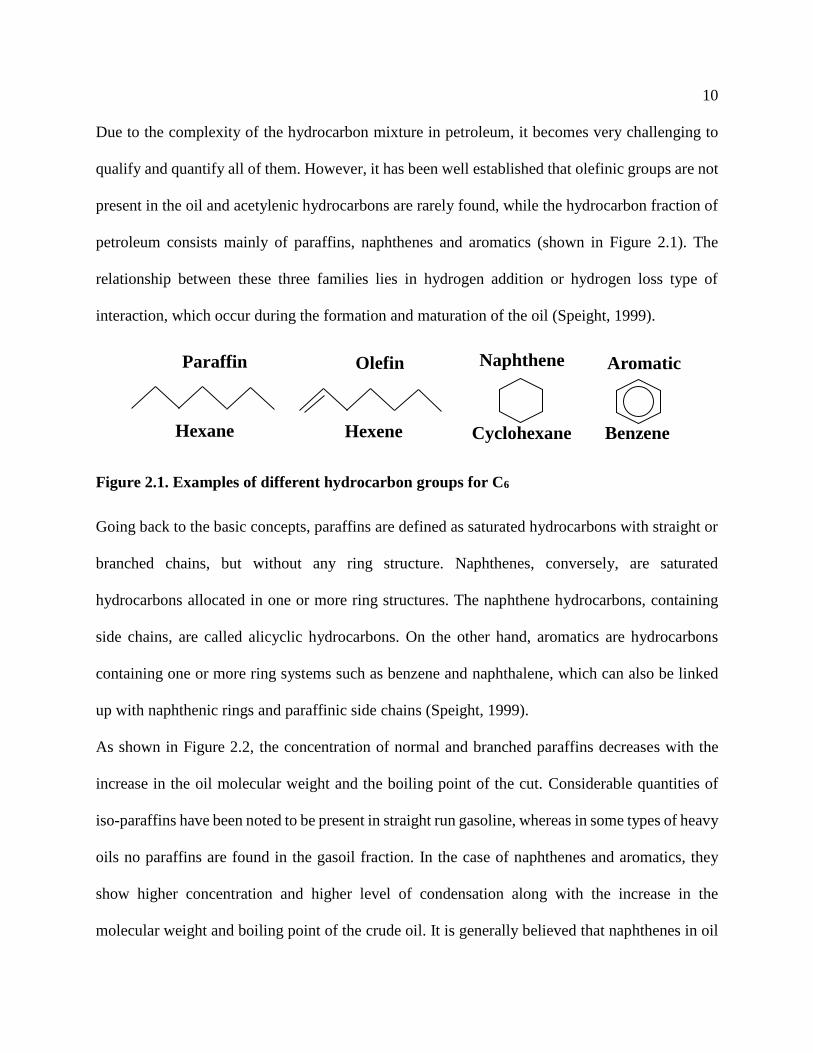
Due to the complexity of the hydrocarbon mixture in petroleum, it becomes very challenging to
qualify and quantify all of them. However, it has been well established that olefinic groups are not
present in the oil and acetylenic hydrocarbons are rarely found, while the hydrocarbon fraction of
petroleum consists mainly of paraffins, naphthenes and aromatics (shown in Figure 2.1). The
relationship between these three families lies in hydrogen addition or hydrogen loss type of
interaction, which occur during the formation and maturation of the oil (Speight, 1999).
Figure 2.1. Examples of different hydrocarbon groups for C6
Going back to the basic concepts, paraffins are defined as saturated hydrocarbons with straight or
branched chains, but without any ring structure. Naphthenes, conversely, are saturated
hydrocarbons allocated in one or more ring structures. The naphthene hydrocarbons, containing
side chains, are called alicyclic hydrocarbons. On the other hand, aromatics are hydrocarbons
containing one or more ring systems such as benzene and naphthalene, which can also be linked
up with naphthenic rings and paraffinic side chains (Speight, 1999).
As shown in Figure 2.2, the concentration of normal and branched paraffins decreases with the
increase in the oil molecular weight and the boiling point of the cut. Considerable quantities of
iso-paraffins have been noted to be present in straight run gasoline, whereas in some types of heavy
oils no paraffins are found in the gasoil fraction. In the case of naphthenes and aromatics, they
show higher concentration and higher level of condensation along with the increase in the
molecular weight and boiling point of the crude oil. It is generally believed that naphthenes in oil
Paraffin
Hexane Cyclohexane
Naphthene Aromatic
Benzene
Olefin
Hexene
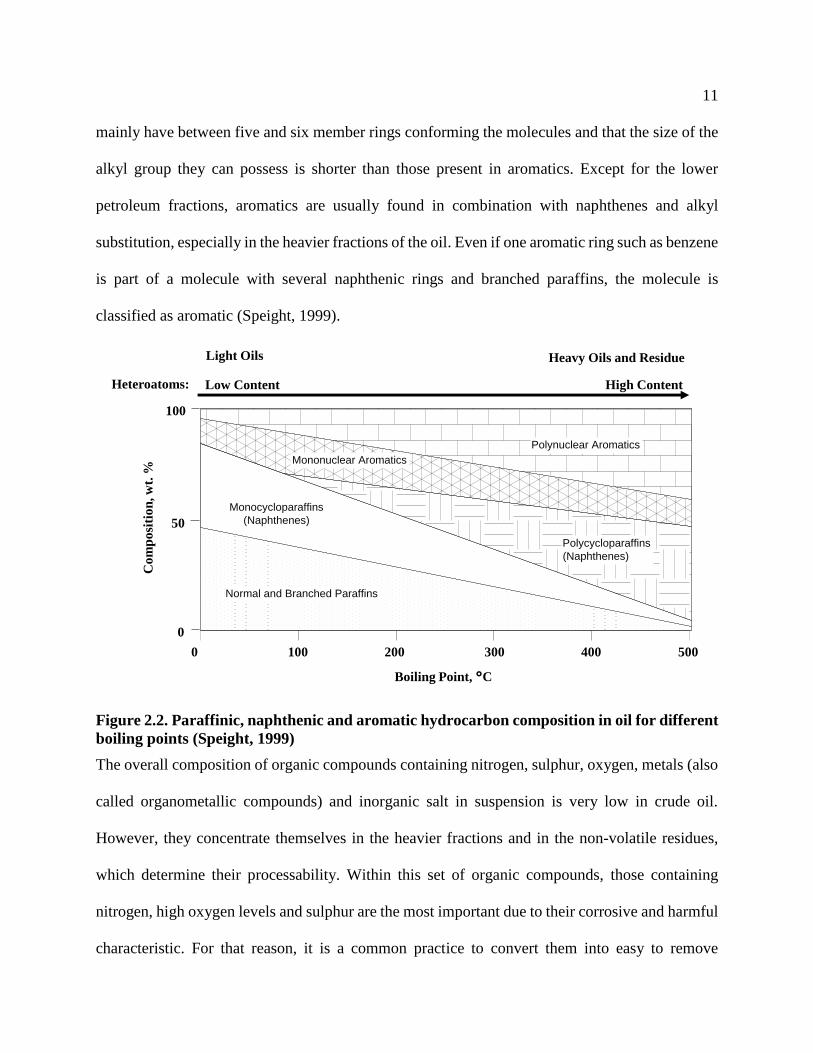
11
mainly have between five and six member rings conforming the molecules and that the size of the
alkyl group they can possess is shorter than those present in aromatics. Except for the lower
petroleum fractions, aromatics are usually found in combination with naphthenes and alkyl
substitution, especially in the heavier fractions of the oil. Even if one aromatic ring such as benzene
is part of a molecule with several naphthenic rings and branched paraffins, the molecule is
classified as aromatic (Speight, 1999).
Figure 2.2. Paraffinic, naphthenic and aromatic hydrocarbon composition in oil for different
boiling points (Speight, 1999)
The overall composition of organic compounds containing nitrogen, sulphur, oxygen, metals (also
called organometallic compounds) and inorganic salt in suspension is very low in crude oil.
However, they concentrate themselves in the heavier fractions and in the non-volatile residues,
which determine their processability. Within this set of organic compounds, those containing
nitrogen, high oxygen levels and sulphur are the most important due to their corrosive and harmful
characteristic. For that reason, it is a common practice to convert them into easy to remove
Polynuclear Aromatics
Mononuclear Aromatics
Monocycloparaffins
(Naphthenes)
Normal and Branched Paraffins
Polycycloparaffins
(Naphthenes)
0
50
0 100 200 300 400 500
100
Co
mp
osi
tio
n, w
t. %
Boiling Point, °C
Heavy Oils and ResidueLight Oils
Heteroatoms: Low Content High Content

12
molecules. Oxygen is usually present in crude oil in less than 2% mainly as carboxylic acids in
naphthene molecules (also called napthenic acids). Nitrogen, instead, is found in oil as basic and
non-basic types of compounds, composed mainly of molecules consisting of pyridine and pyrrole
type molecules. In the case of the metals, they can be found in oil either as organometallic
surfactants (for Zn, Ti, Ca, Mg) in the water/oil interphase or as oil-soluble compounds (for V, Ni,
Fe, Cu). They can generate problems of corrosion and interference with catalytic processes by
poisoning the catalyst, which is the reason why their concentration must be reduced (Speight,
1999). Additionally, sulphur is an important contaminant for the refining surroundings and if
present in the fuel, it can also cause acid rain.
Several analytical techniques allow the fractionation of crude oil into families of compounds with
common characteristics. By this means, laboratories are able to compare differences in the
composition of these families in crude oils from different origins, as well as the effect of refinery
processes in the chemistry of the hydrocarbons. One of the most commonly used separation
techniques focuses on fractionation of the crude oil according to a set of molecules of similar
boiling point. Every boiling point can be directly correlated with properties such as viscosity and
density (Huc, 2011). The heavier the crude oil, the higher the amount of heavy molecules with
high boiling point, viscosity and density.
Chemical fractionation of the crude oil by polarity is commonly performed to divide the crude oil
into saturates, aromatics, resins and asphaltenes (SARA). Saturates consist of non-polar material
constituted by linear, branched and cyclic saturated hydrocarbons (paraffins and napthenic kind of
molecules). The aromatics containing one or more aromatic rings are more polarizable. The latter
two, resins and asphaltenes, are the most polar compounds due to their polar substituents. The
difference between them lies in the insoluble character of asphaltenes in excess of paraffins such

13
as heptane or pentane (Fan, et al., 2002). Resins and asphaltenes are very similar in molecular
structure, but the latter are characterized with higher molecular weight up to 1650 g/mol
(Ancheyta, et al., 2009).
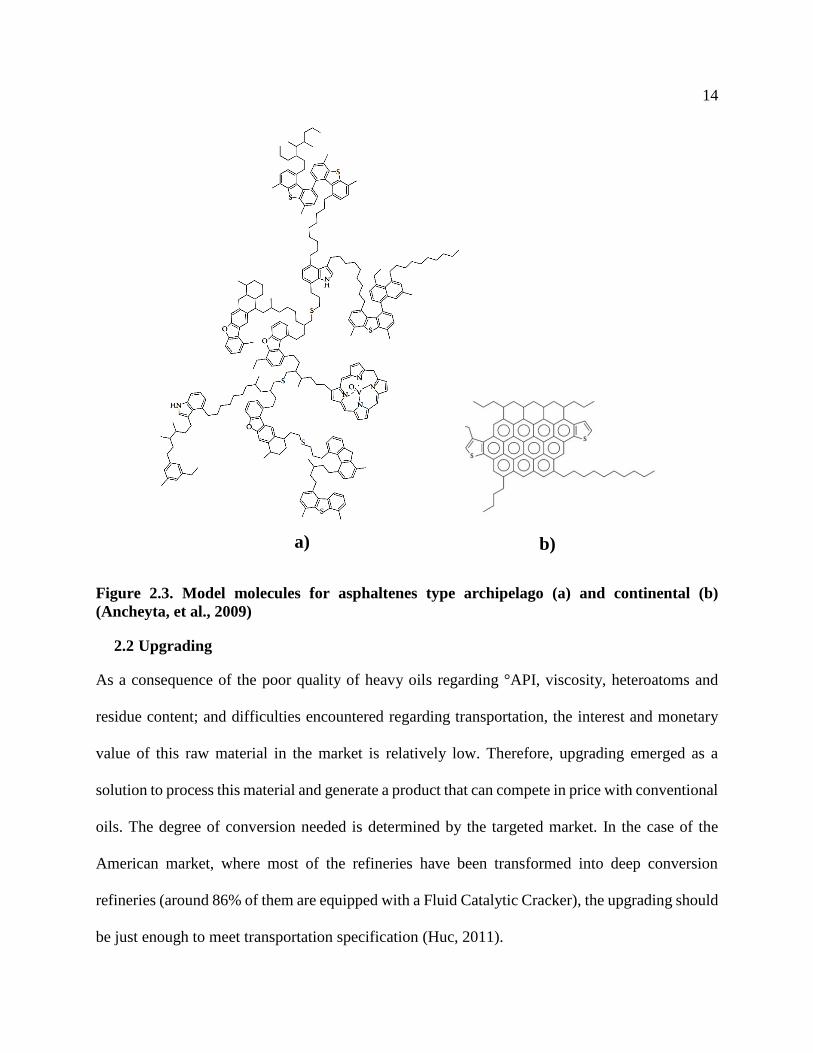
The asphaltene fraction is mainly constituted by aromatic rings with alkyl chains up to C30, sulphur
compounds (e.g. benzothiophene), nitrogen and metalorganic compounds, ketones, phenols and
carboxylic acids. Asphaltenes molecules have been modeled in two different ways (shown in
Figure 2.3): archipelago type (a) and continental type (b). The first one is represented as small
cores of a few aromatic rings linked to each other by bridging alkanes and sulfur, while the
continental type is described as a composition of seven or more aromatic rings conforming the
core of the molecule. Both of them aggregate in different ways, the archipelago-type asphaltenes
develop planar aggregates in asphaltene solutions. In the case of the continental asphaltenes, they
tend to stack and form columns (Ancheyta, et al., 2009).
The stability of asphaltenes is a major issue in the oil industry to avoid plugging and fouling along
the different steps involved in the production, transportation and refining of crude oil. Due to the
insolubility of asphaltenes in paraffins, crudes with high content of saturates tend to be unstable,
while crudes rich in aromatics are more stables (Ancheyta, et al., 2009). The stability of
asphaltenes in the crude is also critically related to the amount of resin content. However, it is still
not well understood if both fractions work together as a colloidal system or if resins improve the
solubilisation of asphaltenes in the crude oil; or if both mechanisms occur simultaneously
(Carnahan, et al., 2007).
14
Figure 2.3. Model molecules for asphaltenes type archipelago (a) and continental (b)
(Ancheyta, et al., 2009)
2.2 Upgrading
As a consequence of the poor quality of heavy oils regarding °API, viscosity, heteroatoms and
residue content; and difficulties encountered regarding transportation, the interest and monetary
value of this raw material in the market is relatively low. Therefore, upgrading emerged as a
solution to process this material and generate a product that can compete in price with conventional
oils. The degree of conversion needed is determined by the targeted market. In the case of the
American market, where most of the refineries have been transformed into deep conversion
refineries (around 86% of them are equipped with a Fluid Catalytic Cracker), the upgrading should
be just enough to meet transportation specification (Huc, 2011).
a) b)
15
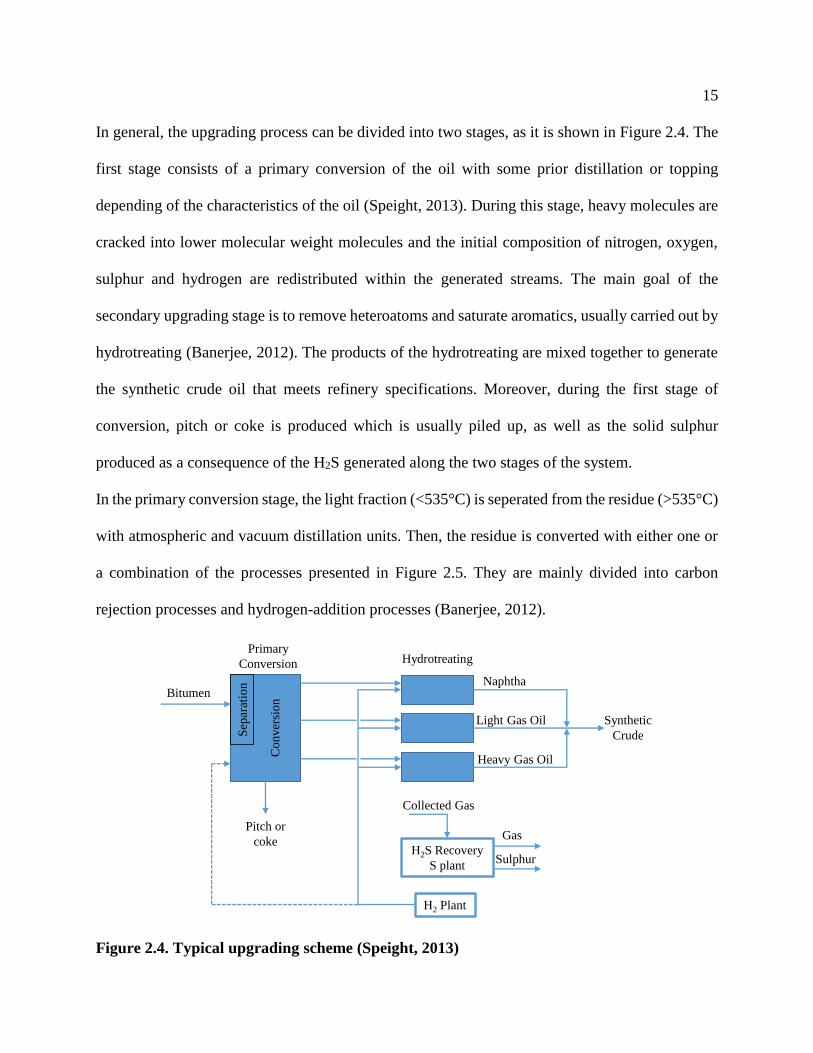
In general, the upgrading process can be divided into two stages, as it is shown in Figure 2.4. The
first stage consists of a primary conversion of the oil with some prior distillation or topping
depending of the characteristics of the oil (Speight, 2013). During this stage, heavy molecules are
cracked into lower molecular weight molecules and the initial composition of nitrogen, oxygen,
sulphur and hydrogen are redistributed within the generated streams. The main goal of the
secondary upgrading stage is to remove heteroatoms and saturate aromatics, usually carried out by
hydrotreating (Banerjee, 2012). The products of the hydrotreating are mixed together to generate
the synthetic crude oil that meets refinery specifications. Moreover, during the first stage of
conversion, pitch or coke is produced which is usually piled up, as well as the solid sulphur
produced as a consequence of the H2S generated along the two stages of the system.
In the primary conversion stage, the light fraction (<535°C) is seperated from the residue (>535°C)
with atmospheric and vacuum distillation units. Then, the residue is converted with either one or
a combination of the processes presented in Figure 2.5. They are mainly divided into carbon
rejection processes and hydrogen-addition processes (Banerjee, 2012).
Figure 2.4. Typical upgrading scheme (Speight, 2013)
H2S Recovery
S plant
H2 Plant
Hydrotreating
Collected Gas
Primary
Conversion
Naphtha
Heavy Gas Oil
Light Gas Oil
Pitch or
coke
Bitumen
Gas
Sulphur
Synthetic
CrudeSep
arat
ion
Co
nv
ersi
on

16
Figure 2.5. Upgrading pathways (Banerjee, 2012)
2.2.1 Carbon rejection processes
The main goal of this kind of processes is to remove heavy carbonaceous material from light
hydrocarbons. Therefore, as a result, one stream containing heavy material is produced along with
another stream containing the lights generated. This type of process can be subdivided depending
on the nature of the separation, which can be either chemical rupture of the molecules by heat or
physical separation of the asphaltenes using a solvent (Banerjee, 2012).
2.2.1.1 Thermal processes
Thermal cracking is one of the oldest conversion processes used in the oil industry to treat heavy
hydrocarbons. Its attractiveness lies in the low operating pressures, high temperatures and the lack
of need for catalysts, which are usually expensive (Speight, 2013). The chemistry of the process
consists in carrying out a set of endothermic chemical reactions that break the side chains of the
aromatic complexes and even their ring structure via free radicals. The mechanism starts with the
Upgrading Processes
Carbon Rejection
Thermal Solvent Extraction
Hydrogen Addition
Hydro-ConversionCatalytic Steam
Cracking
Visbreaking
Delayed Coking
Fluid/ Flexicoking
17
scission of the bonds C-C, C-S, C-O, C-N and even C-H at high temperatures (above 400°C),
which create free radicals. Then, these radicals promote other reactions to occur, such as: activation
of surrounding molecules via H-transfer (propagation of free radicals), decomposition of the free
radical into olefins, isomerization and cyclization reactions, condensation reactions to form poly-
aromatic compounds, etc. When two free radical encounters each other, they recombine to form a
bond and the reaction concludes (Huc, 2011).
The quality of the products of a thermal process is highly dependent on the operating pressure and
temperature. Temperatures greater than 500°C and pressures lower than 100 psi tend to produce
lower molecular weight hydrocarbons than those processes operated at temperature lower than
500°C and pressures between 400 and 1000 psi. The severity of the process may be adjusted to the
requirements. Mild cracking conditions generate a high amounts of gasoline of poor quality, less
gas and decrease coke formation. On the contrary, high severity conditions generate important
amount of gas, more coke production and less gasoline (Speight, 2013).
The most common thermal processes can be divided into visbreaking (viscosity breaking) and
coking. The first one is undertaken at mild conditions of 450-500°C with residence time of 1-5
min, in order to break the C-C bonds that attach paraffins to the nucleus of the polyaromatic rings.
In that way, the main goal of the process is to decrease the viscosity of the oil without getting rid
of the heavy fraction. The main disadvantage consists in the instability produced by chemical
conversion of the asphaltenes that tend to precipitate (Banerjee, 2012).
On the other hand, coking can be at the same time divided into delayed coking and fluidized
coking. Both of them work at high severity for long residence time, aiming to convert 100% of the
residue. However, they differ significantly in the way they operate. Delayed coking is carried out
in drums that work as batch reactors at 430-450°C, 30-60 psi with long residence time. The feed,
18
typically vacuum residue, is preheated in a furnace at 490-500 °C, loaded into the drums from the
bottom and left it there for hours to promote coking. Fluidized coking, instead, consists of a
continuous process, where a fluidized bed riser reactor operating at higher temperatures (about
540°C) with a residence time of minutes, targets the increase in the liquids yields and decrease of
the coke formation (Banerjee, 2012).
2.2.1.2 Solvent extraction
Solvent extraction, also called solvent de-asphalting, is a physical process in which the feedstock
can be separated into structural families rather than in boiling point as in the case of distillation
(Huc, 2011). Therefore, when the bitumen encounters the solvent, the dispersion of the oil
components is disrupted and the polar constituents such as asphaltenes and the heaviest resins
precipitate (Speight, 2013). As a result, two streams are produced: one called pitch, enriched in
asphaltenes and another one called De-asphalted Oil (DAO) mainly constituted by saturates,
aromatics and light resins. It is important to note that the solvent de-asphalting unit is not a
conversion process, and thus, it must be considered as a preliminary separation integrated to any
of the other technologies that convert the heavy fractions of the oil (Huc, 2011).
The selection of the solvent is one of the main parameters in the solvent de-asphalting unit. They
consist of light paraffins ranging from C3 up to C7, whose selection depends on the quality and the
yield of DAO expected. The heavier the solvent, the poorer the quality of the DAO but the higher
the yield obtained. Butane is recommended to obtain high quality DAO with an acceptable yield
of 40% in the case of processing Athabasca bitumen, while pentane gives a poorer DAO but with
yields of 75%. Another important parameter is the solvent to feed ratio, which is proportional to
the yield of DAO and inversely proportional to the quality of the DAO produced in terms of metals,
19
nitrogen and sulphur. With a ratio 4:1 less than 0.05% of asphaltenes can be reached in the DAO,
but typical industrial values are around 5:1 (Huc, 2011).
Moreover, the temperature has an important effect in the operation and in the quality of the product
obtained. The higher the temperature level, the better the contaminants and asphaltenes removal
from the DAO, but the lower the yield obtained toward this stream. The operating pressure, instead,
has little effect in the selectivity of the process and it is just fixed slightly above the critical pressure
of the solvent (Huc, 2011).
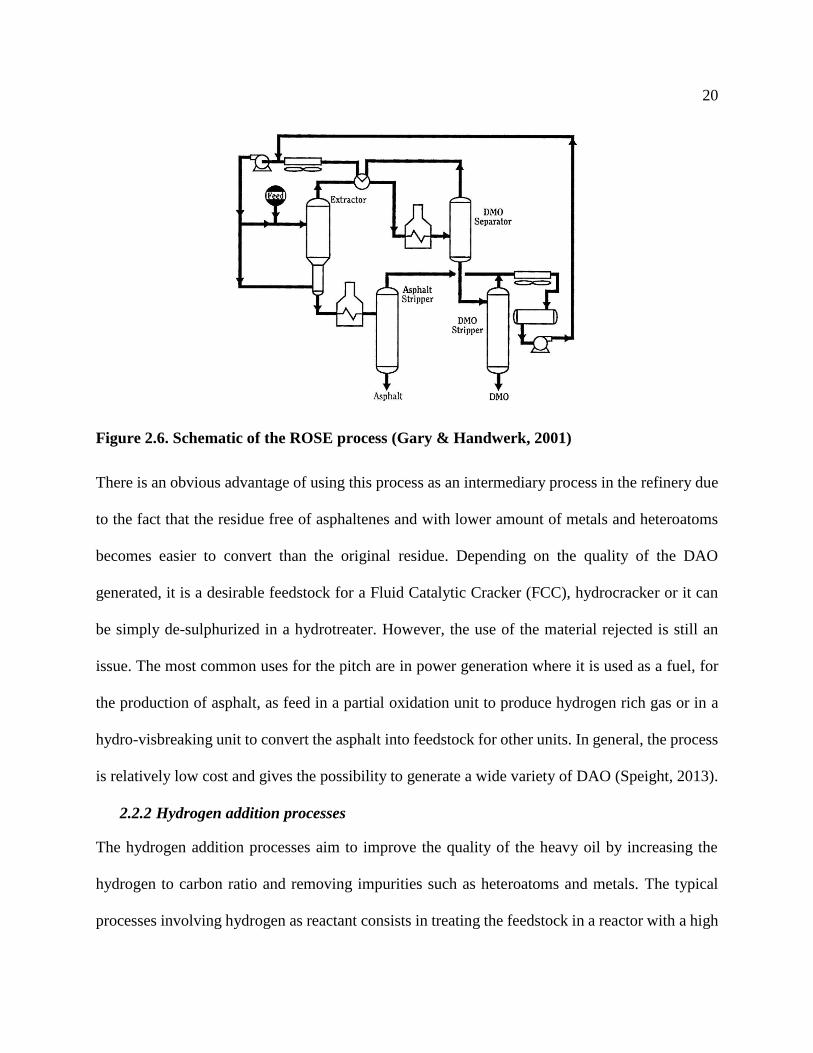
The two most common industrial processes are DEMEX licensed by UOP and ROSE licenced by
Kerr-McGee. Both of them work at subcritical conditions for the extraction and supercritical
conditions to recover the solvent. The separation of the solvent is performed by slightly increasing
the temperature of the product above the critical temperature of the solvent. In Figure 2.6, the
schematic of the ROSE process is presented. The feed is mixed with solvent previously recovered
and inserted into the extractor to produce DAO (called here De-Metallized Oil, DMO) and asphalt,
both still containing the solvent. Then, the streams are heated up and pumped into the separators
to recover the solvent, which is cooled down and recirculated at the inlet of the system (Gary &
Handwerk, 2001).
20
Figure 2.6. Schematic of the ROSE process (Gary & Handwerk, 2001)
There is an obvious advantage of using this process as an intermediary process in the refinery due
to the fact that the residue free of asphaltenes and with lower amount of metals and heteroatoms
becomes easier to convert than the original residue. Depending on the quality of the DAO
generated, it is a desirable feedstock for a Fluid Catalytic Cracker (FCC), hydrocracker or it can
be simply de-sulphurized in a hydrotreater. However, the use of the material rejected is still an
issue. The most common uses for the pitch are in power generation where it is used as a fuel, for
the production of asphalt, as feed in a partial oxidation unit to produce hydrogen rich gas or in a
hydro-visbreaking unit to convert the asphalt into feedstock for other units. In general, the process
is relatively low cost and gives the possibility to generate a wide variety of DAO (Speight, 2013).
2.2.2 Hydrogen addition processes
The hydrogen addition processes aim to improve the quality of the heavy oil by increasing the
hydrogen to carbon ratio and removing impurities such as heteroatoms and metals. The typical
processes involving hydrogen as reactant consists in treating the feedstock in a reactor with a high
21
partial pressure of hydrogen in the presence of a catalyst. During oil hydroprocessing several
reactions occur, and they can be grouped into three: Hydrocracking, Hydrotreating and
Hydrogenation. In the first set of reactions, heavy molecules are cracked into smaller molecules,
leading to the formation of free radicals that are further stabilized with hydrogen. The presence of
hydrogen avoids condensation reactions between large organic molecules (especially aromatics)
that promote coke formation. Within hydrotreating reactions, heteroatoms and metals are removed
via Hydrodesulphurization (HDS), Hydrodenitrogenation (HDN), Hydrodeoxygenation (HDO)
and Hydrodemetallation (HDM). Hydrogenation reactions target the saturation of aromatics and
they are also involved in the final stabilization of the unsaturated molecules produced during
cracking (Banerjee, 2012). Oil hydroprocessing favors disaggregation and cracking of asphaltenes,
as well as reduction of Conradson Carbon (Huc, 2011).
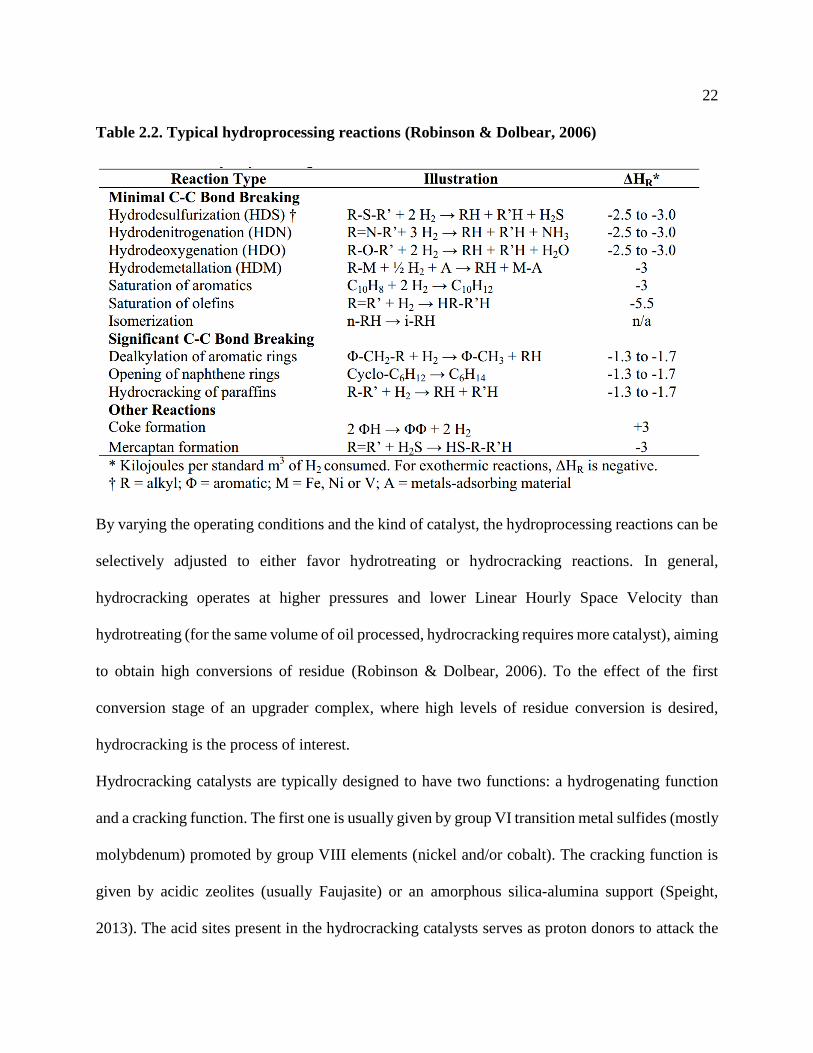
Table 2.2 shows the main reactions occurring during hydroprocessing. As it can be seen, most of
them are exothermic reactions, especially those involved in the saturation of olefins. Reactions
involved in the metal and heteroatoms removal are mostly catalytic, while those involved in the
hydroconversion or hydrocracking of the feedstock are a combination of thermal and catalytic
reactions. Molecular cracking itself occurs mainly because of the effect of the temperature, which
makes it an endothermic process. However, the hydrogenation of the free radicals produced during
thermal cracking is highly exothermic, giving in general a slightly exothermic process (Huc, 2011).
22
Table 2.2. Typical hydroprocessing reactions (Robinson & Dolbear, 2006)
By varying the operating conditions and the kind of catalyst, the hydroprocessing reactions can be
selectively adjusted to either favor hydrotreating or hydrocracking reactions. In general,
hydrocracking operates at higher pressures and lower Linear Hourly Space Velocity than
hydrotreating (for the same volume of oil processed, hydrocracking requires more catalyst), aiming
to obtain high conversions of residue (Robinson & Dolbear, 2006). To the effect of the first
conversion stage of an upgrader complex, where high levels of residue conversion is desired,
hydrocracking is the process of interest.
Hydrocracking catalysts are typically designed to have two functions: a hydrogenating function
and a cracking function. The first one is usually given by group VI transition metal sulfides (mostly
molybdenum) promoted by group VIII elements (nickel and/or cobalt). The cracking function is
given by acidic zeolites (usually Faujasite) or an amorphous silica-alumina support (Speight,
2013). The acid sites present in the hydrocracking catalysts serves as proton donors to attack the

23
hydrocarbon, in order to follow a cracking via carbonium ion (Greensfelder, et al., 1949). Further
development of catalysts for hydrocracking offers the ultradispersion of a bi- or tri-metallic
catalyst from the group VI and VIII in the feedstock. As a consequence of the nano scale particle
diameter, the surface area available and the activity are increased, while deactivation problems
tend to be reduced (Pereira-Almao, et al., 2011).
Through the years and because of the changes in the feedstock used, the reactors for hydrocracking
have had to evolve. The first kind of reactor was based on a fixed-bed originally designed to treat
light oils with low amounts of impurities. As these impurities increased, the plugging of the
catalyst pore was often observed, leading to de-activation and frequent shutdowns of the unit. In
order to solve this problem, the next generation of reactors consisted in moving beds able to be
displaced by gravity from the top to the bottom with the purpose to frequently replace the catalytic
bed. On the other hand, the ebullated bed hydrocracker is another type of moving bed reactor that
works up-flow with the liquids producing the fluidization of the fresh catalyst incorporated. This
kind of reactor was successful at processing vacuum and atmospheric residue at the expenses of
the relative high partial pressure of hydrogen required and the high catalyst replacement rate. In
order to control the catalyst addition rate, the slurry-phase type of reactor was created in which the
micro size catalyst is incorporated in the feedstock along with powder carbon based additives to
promote the coke agglomeration and avoid fouling of the system. Therefore, the ratio of catalyst
to oil is easily controlled, as well as the residence time in the reactor. This type of reactor works
at high temperature aiming to reach conversion higher than 90% (Banerjee, 2012).
Steam catalytic cracking technologies such as Aquaconversion can be also considered part of the
hydrogen addition processes; with the difference that hydrogen is not directly supplied into the
system, but provided by the catalytic splitting of the water molecule.

24
2.3 Catalytic Steam Cracking (CSC)
The use of steam for processing hydrocarbons is a common practice in the oil industry. In the
thermal cracking of paraffins to produce olefins needed in polymer production, steam works as a
diluent to decrease the partial pressure of hydrocarbons in the reactor and thus, favor the production
of olefins, which are first-order reactions, but not the condensation reactions, of higher order, that
leads to coke formations (Froment, 1992). However, in the steam reforming of methane and light
hydrocarbons for the production of hydrogen, the water molecule has an important role as a
reactant in the oxidation process of the carbon atoms.
Steam reforming of methane mainly involves the following three reactions, typically performed in
the presence of a nickel catalyst:
Reforming I: 𝐶𝐻4 + 𝐻2𝑂 → 𝐶𝑂 + 3𝐻2 Eq. 2.1
Reforming II: 𝐶𝐻4 + 2𝐻2𝑂 → 𝐶𝑂2 + 4𝐻2 Eq. 2.2
Water Gas Shift: 𝐶𝑂 + 𝐻2𝑂 → 𝐶𝑂2 + 𝐻2 Eq. 2.3
Methane can be also produced via CO methanation:
Methanation: 𝐶𝑂 + 3𝐻2 → 𝐶𝐻4 + 𝐻2𝑂 Eq. 2.4
The first and third reaction (Eq. 2.1 and Eq. 2.3) are highly endothermic, while the second one is
slightly exothermic. Therefore, due to the high endothermic character of steam reforming
reactions, the process is usually performed between 820-880°C and pressures of 294-368 psi.
Steam reforming of heavier hydrocarbons than methane follows the path: cracking of the
molecules to obtain methane and then proceed to its reformation (Fahim, et al., 2010).
The simplest application of this chemistry to the cracking of hydrocarbons is the de-alkylation of
alkylaromatics, which is one of the main pathways to produce benzene and has been industrially

25
performed under hydrogen atmosphere in the presence of a catalyst. In order to reduce the
consumption of hydrogen in the different units in a refinery, intense effort has been allocated into
developing a technology able to substitute the hydrogen by steam. Therefore, selective steam
reforming of the alkyl group in the molecule, in the presence of a catalyst was developed. One of
the main advantages of this process is that not only hydrogen was substituted by water, but also
hydrogen was produced in the reaction as a by-product. Several metals from the Group VIII have
been evaluated, showing Rh as the most active metal and with an important effect of the support
in the activity of such catalysts (Duprez, 1992). In order to avoid full oxidation of the hydrocarbon
to CO and CO2, the steam reforming conditions were reduced up to temperatures between 350-
500°C, pressures between 14.7-427 psi and weight hourly space velocity between 0.3-3 h-1
(Uchiyama, et al., 1974).
The problems found in the typical thermal conversion processes regarding the amount of solid
material generated (in the case of coking) from the crude and the instability of the products in
visbreaking, favor the utilization of hydrogen addition processes looking for a better yield and
quality products. However, the most common technology in the market is hydrocracking that
requires high pressure of hydrogen and special material and equipment to work at those conditions.
Therefore, a solution to those issues and based on the previous experience collected with steam
processing of light hydrocarbons, steam catalytic cracking was developed to process heavy
hydrocarbons with high content of alkylpolyaromatic compounds. The idea is to take advantage of
the hydrogen produced by reforming reactions in order to saturate cracked molecules and give
stability to the products.
26
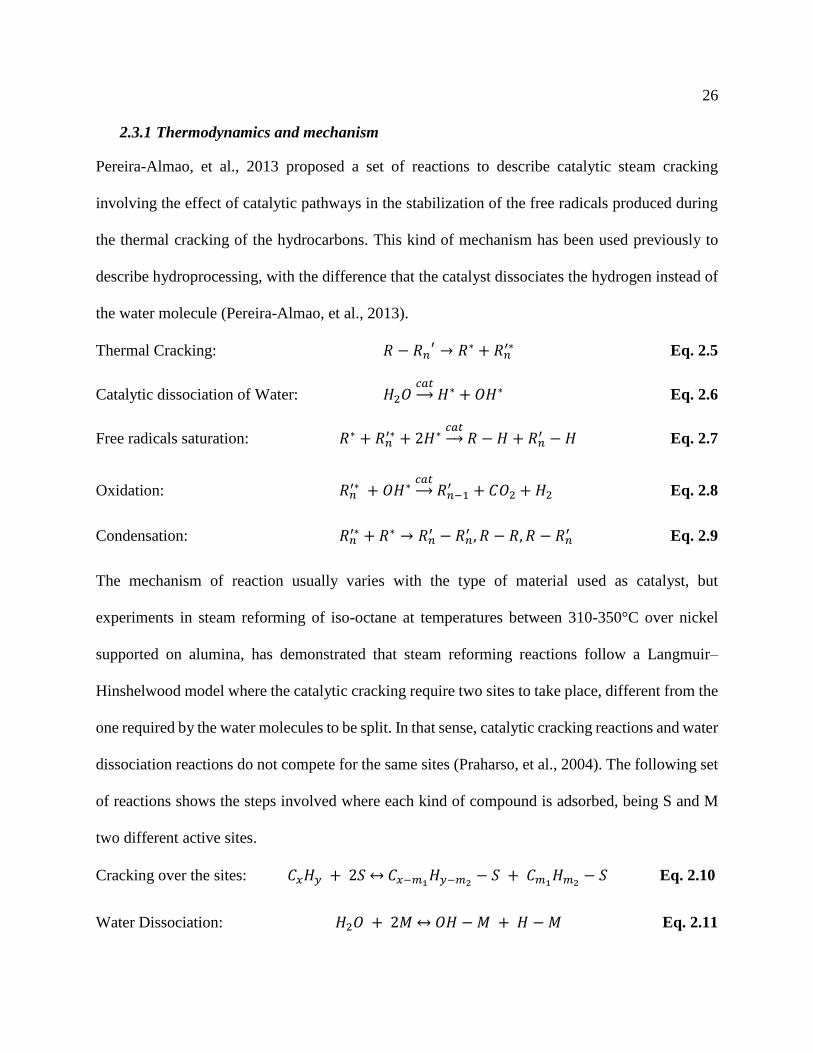
2.3.1 Thermodynamics and mechanism
Pereira-Almao, et al., 2013 proposed a set of reactions to describe catalytic steam cracking
involving the effect of catalytic pathways in the stabilization of the free radicals produced during
the thermal cracking of the hydrocarbons. This kind of mechanism has been used previously to
describe hydroprocessing, with the difference that the catalyst dissociates the hydrogen instead of
the water molecule (Pereira-Almao, et al., 2013).
Thermal Cracking: 𝑅 − 𝑅𝑛′ → 𝑅∗ + 𝑅𝑛
′∗ Eq. 2.5
Catalytic dissociation of Water: 𝐻2𝑂𝑐𝑎𝑡→ 𝐻∗ + 𝑂𝐻∗ Eq. 2.6
Free radicals saturation: 𝑅∗ + 𝑅𝑛′∗ + 2𝐻∗
𝑐𝑎𝑡→ 𝑅 − 𝐻 + 𝑅𝑛
′ − 𝐻 Eq. 2.7
Oxidation: 𝑅𝑛′∗ + 𝑂𝐻∗
𝑐𝑎𝑡→ 𝑅𝑛−1
′ + 𝐶𝑂2 + 𝐻2 Eq. 2.8
Condensation: 𝑅𝑛′∗ + 𝑅∗ → 𝑅𝑛
′ − 𝑅𝑛′ , 𝑅 − 𝑅, 𝑅 − 𝑅𝑛
′ Eq. 2.9
The mechanism of reaction usually varies with the type of material used as catalyst, but
experiments in steam reforming of iso-octane at temperatures between 310-350°C over nickel
supported on alumina, has demonstrated that steam reforming reactions follow a Langmuir–
Hinshelwood model where the catalytic cracking require two sites to take place, different from the
one required by the water molecules to be split. In that sense, catalytic cracking reactions and water
dissociation reactions do not compete for the same sites (Praharso, et al., 2004). The following set
of reactions shows the steps involved where each kind of compound is adsorbed, being S and M
two different active sites.
Cracking over the sites: 𝐶𝑥𝐻𝑦 + 2𝑆 ↔ 𝐶𝑥−𝑚1𝐻𝑦−𝑚2 − 𝑆 + 𝐶𝑚1𝐻𝑚2 − 𝑆 Eq. 2.10
Water Dissociation: 𝐻2𝑂 + 2𝑀 ↔ 𝑂𝐻 −𝑀 + 𝐻 −𝑀 Eq. 2.11

27
Hydrocarbon/Coke Oxidation : 𝐶𝑚1𝐻𝑚2 − 𝑆 + 𝑂𝐻 −𝑀 → 𝐶𝑚1𝐻𝑚2𝑂 − 𝑆 + 𝐻 −𝑀 Eq. 2.12
Further HC cracking: 𝐶𝑚1𝐻𝑚2𝑂 − 𝑆 + 𝑆 → 𝐶𝑂 − 𝑆 + 𝐶𝑚1−1𝐻𝑚2 − 𝑆 Eq. 2.13
Hydrogen Formation: 𝐻 −𝑀 + 𝐻 −𝑀 → 𝐻2 + 2𝑀 Eq. 2.14
Carbon Monoxide Desorption: 𝐶𝑂 − 𝑆 ↔ 𝐶𝑂 + 𝑆 Eq. 2.15
In order to favor the occurrence of the catalytic steam cracking process, two main reactions must
be favored: the hydrocarbon cracking (either catalytically or thermally) and the catalytic water
dissociation. The hydrocarbon cracking via thermal cracking is an endothermic reaction and it is
favored by increase of the temperature. However, it can be improved by the incorporation of an
acidic material like those in hydrocracking type of catalysts where the reaction follows the
carbenium ion mechanism like in conventional catalytic cracking. This kind of mechanism leads
to the production of a large amount of branched paraffins. In the case of aromatic reactants, the
carbeniun ion mechanism in the presence of hydrogen leads to the de-alkylation or saturation of
the aromatic rings into naphthene molecules (Flinn, et al., 1960).
The dissociation of water molecules is a key step in the production of the hydrogen required to
avoid the undesirable condensation reactions. Therefore, it is important to understand the
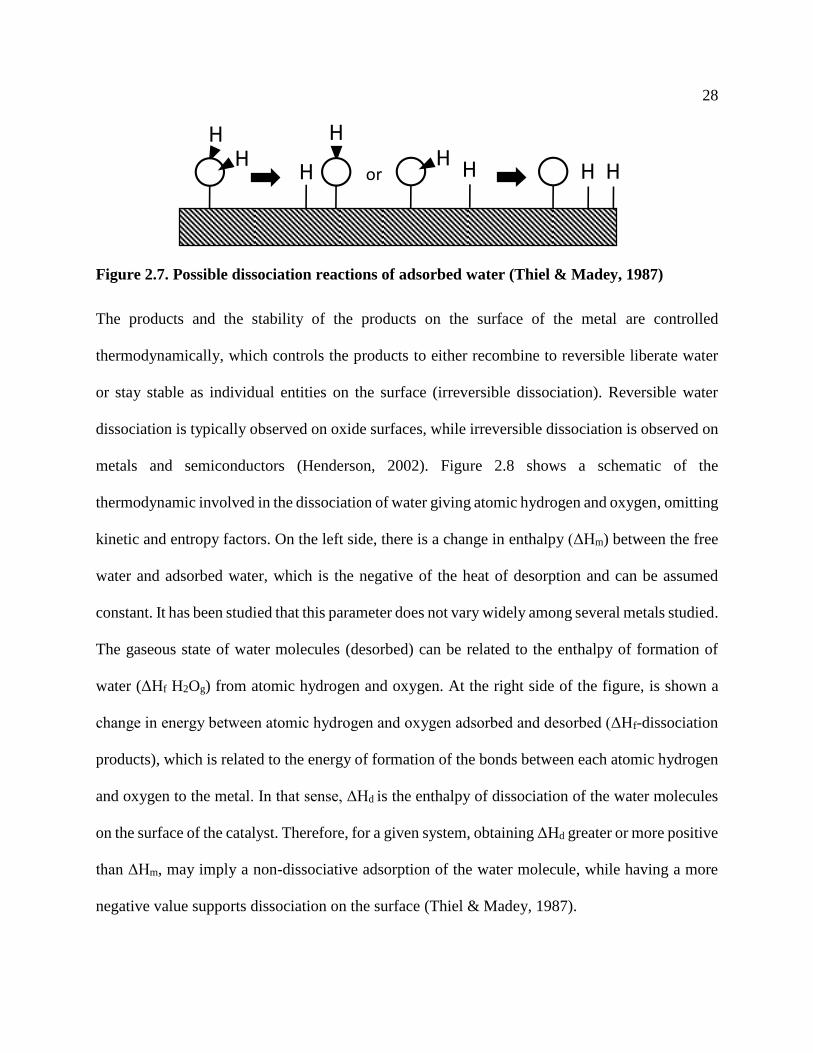
chemistry involved in the adsorption and dissociation of the water elements. In Figure 2.7, it is
shown the pathway followed by the adsorbed water molecule, which can either split into adsorbed
hydroxyl and atomic hydrogen, or further split into atomic hydrogen and atomic oxygen (Thiel &
Madey, 1987).
28
Figure 2.7. Possible dissociation reactions of adsorbed water (Thiel & Madey, 1987)
The products and the stability of the products on the surface of the metal are controlled
thermodynamically, which controls the products to either recombine to reversible liberate water
or stay stable as individual entities on the surface (irreversible dissociation). Reversible water
dissociation is typically observed on oxide surfaces, while irreversible dissociation is observed on
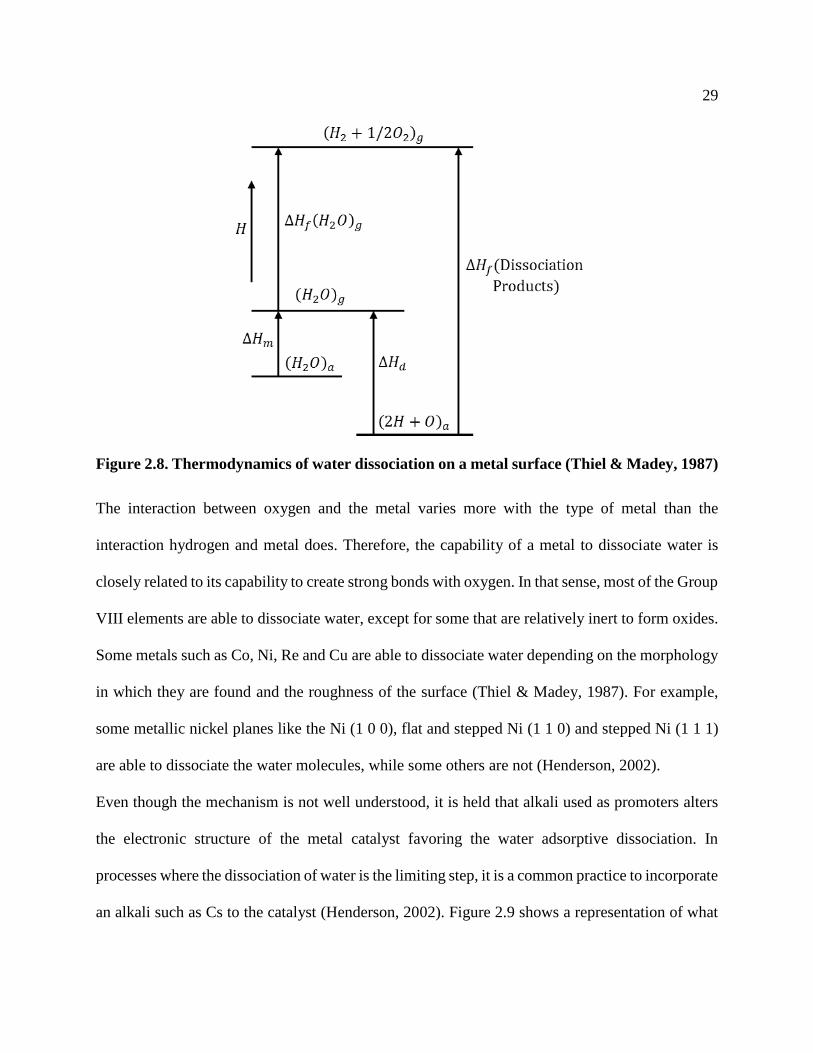
metals and semiconductors (Henderson, 2002). Figure 2.8 shows a schematic of the
thermodynamic involved in the dissociation of water giving atomic hydrogen and oxygen, omitting
kinetic and entropy factors. On the left side, there is a change in enthalpy (ΔHm) between the free
water and adsorbed water, which is the negative of the heat of desorption and can be assumed
constant. It has been studied that this parameter does not vary widely among several metals studied.
The gaseous state of water molecules (desorbed) can be related to the enthalpy of formation of
water (ΔHf H2Og) from atomic hydrogen and oxygen. At the right side of the figure, is shown a
change in energy between atomic hydrogen and oxygen adsorbed and desorbed (ΔHf-dissociation
products), which is related to the energy of formation of the bonds between each atomic hydrogen
and oxygen to the metal. In that sense, ΔHd is the enthalpy of dissociation of the water molecules
on the surface of the catalyst. Therefore, for a given system, obtaining ΔHd greater or more positive
than ΔHm, may imply a non-dissociative adsorption of the water molecule, while having a more
negative value supports dissociation on the surface (Thiel & Madey, 1987).
HH
H
HH
or H H H
29
Figure 2.8. Thermodynamics of water dissociation on a metal surface (Thiel & Madey, 1987)
The interaction between oxygen and the metal varies more with the type of metal than the
interaction hydrogen and metal does. Therefore, the capability of a metal to dissociate water is
closely related to its capability to create strong bonds with oxygen. In that sense, most of the Group
VIII elements are able to dissociate water, except for some that are relatively inert to form oxides.
Some metals such as Co, Ni, Re and Cu are able to dissociate water depending on the morphology
in which they are found and the roughness of the surface (Thiel & Madey, 1987). For example,
some metallic nickel planes like the Ni (1 0 0), flat and stepped Ni (1 1 0) and stepped Ni (1 1 1)
are able to dissociate the water molecules, while some others are not (Henderson, 2002).
Even though the mechanism is not well understood, it is held that alkali used as promoters alters
the electronic structure of the metal catalyst favoring the water adsorptive dissociation. In
processes where the dissociation of water is the limiting step, it is a common practice to incorporate
an alkali such as Cs to the catalyst (Henderson, 2002). Figure 2.9 shows a representation of what

30
is believed to occur in the adsorption and dissociation of water on a Cu-catalyst containing alkali
metals. As it can be seen, the oxygen created a preferential interaction with lithium that triggers
the dissociation of the water molecule. As a result, the OH specimen stays adsorbed on the
promoter while the H remains on the surface of the metal.
Figure 2.9. Schematic of the transition state of water molecules on Cu (1 0 0) promoted with
Li (Henderson, 2002).
2.3.2 Technologies
In 1972 the company Phillips Petroleum Co. patented a method for the upgrading of hydrocarbons
based on the in situ generation of hydrogen, via the water gas shift reaction, together with the
processing of the oil to produce materials of low molecular weight, having reduced residue and
sulfur content. The method consisted of incorporating, simultaneously or in series, two catalytic
agents into the oil together with water: one is usually carboxylic salts of alkaline earth metals with
the goal of producing the hydrogen from the water. The second agent is in charge of facilitating
the reaction between the hydrogen and hydrocarbon constituents, for which carboxyl salts of
nickel, cobalt and iron are used. The amount of water incorporated was fixed in a water to oil
volume ratio recommended between of 0.2 to 2.5. After mixing, the stream is brought to reaction
OLi Li
H
O
H
H
H
31
condition between 399 and 454 °C and pressure between 300 and 4000 psig to keep most of the
oil in liquid phase (Pitchford, 1972).
After several years of research in this field, in 1999 PDVSA-Intevep patented a conversion process
technology developed by Pereira-Almao et al 1999, where light hydrocarbons and a reduced level
of coke by-products are obtained from catalytic steam cracking of heavy hydrocarbon. Depending
on the heaviness of the feedstock, the invention proposed two process’ schemes: one for heavy oil
and another for extra heavy oil with °API lower than 10. In the first scheme, either atmospheric or
vacuum residue is separated from the remaining cuts in order to process it. This residue is passed
through a catalyst preparation unit to incorporate the ultra-dispersed catalytic agent into it. Once
the feedstock contains the catalyst, steam is integrated into the stream and both pass through a
soaker reactor, where the desired catalytic steam cracking reactions take place. The products from
the soaker reactor together with the light hydrocarbons obtained in the first separation stage, are
recombined in a cyclone, in order to remove coke and catalysts. Different products can be obtained
from this scheme such as gas topping, naphtha, gas oil and the bottom. When the feedstock consists
of extra heavy hydrocarbons, the technology proposed a similar scheme to the one applied to heavy
oil, but targeting transportable synthetic crude oil. In this case, the synthetic crude consists of the
products of the catalytic steam cracking unit recombined with the lights from the first fractionation
unit, previously desalted to remove catalysts (Pereira-Almao, et al., 1999).
In the catalyst preparation unit, a water in oil emulsion is prepared containing an alkali metal (K
and/or Na) and second metal selected from the Group VIII non-noble metal (Ni or Co) or an
alkaline earth metal(Ca or Mg) and the mixtures thereof. According to the invention, the steam
conversion conditions are reached between 360-520 °C and pressure less than 600 psi, but
preferably the operating conditions should be between 410-470 °C with a pressure of 300 psi. The
32
liquid hourly space velocity is kept constant between 0.001-3.5 h-1 depending on the severity
required; and with steam in between 3 to 12 wt. % of the oil. The technology claims to reach
conversion of up to 65% of 500°C+ with high selectivity toward middle distillates (Pereira-Almao,
et al., 1999).
Nevertheless, the steam conversion of the heavy fractions in the oil, specifically the asphaltenes,
tends to generate stability problems for the products. Cracked asphaltenes start precipitating,
generating fouling problems in pipelines and vessels. In order to solve this issue, Pereira-Almao,
et al., 2013 together with Nexen proposed three posible schemes for upgraders based on the steam
catalytic processing of the heavy streams free of asphaltenes. In the first scheme, the heavy oil is
fractionated into lights (IBP-250°C), full range gasoil (250-540°C) and vacuum residue (>540°C).
One fraction of the vacuum residue is used as fuel and the remaining fraction is recombined at the
end of the process with the upgraded product. The gasoil is processed in the catalytic steam
cracking reactor, for which the operation varies whether a nanosize catalyst is added prior to
reaction or a catalytic fixed bed is used. The liquids are separated from the gases in a hot separator
and mixed with the lights and the fraction of vacuum residue determined. In the case of using
ultradispersed catalysts, the nano particles are separated from the liquid products before the mixing
with the other streams (Pereira-Almao, et al., 2013).
The second scheme for processing asphaltene free streams, consists of topping the crude oil to
separate the stream into lights (IBP-250°C) and topped heavy oil (>250°C). The heavy
hydrocarbons are once again seperated in a Solvent De-Asphalting unit (SDA) into De-Asphalted
Oil (DAO) and an asphaltenes rich fraction, which is partially used as fuel. The DAO is processed
in a steam catalytic cracking reactor and the products are de-gasified in a hot seperator and futher
mixed with the lights and a certain fraction of pitch. The third scheme, presented in Figure 2.10 is

33
basically a combination of the previous two schemes, where the vacuum residue obtained in the
first stage of the process is de-asphalted and processed via catalytic steam cracking. The lights
together with a fraction of the asphaltene rich stream is mixed with the processed gasoil and DAO
free of catalyst. The process claims to be able to reduce considerably the viscosity as well as
mantaining the stability of the final synthetic crude oil within the three schemes presented. The
operating conditions established involved pressure and LHSV constants of 400 psi and 2 h-1,
respectively. 400 °C was used for processing gasoil and 435 °C for DAO (Pereira-Almao, et al.,
2013).
For the purpose of this technology, the nano-catalyst was prepared by pre-mixing an alkali solution
(organic or inorganic) with a transition metal inorganic salt or an organo-soluble salt. The metal
enriched stream is vigorously mixed with the hydrocarbon to assure the incorporation of the
aqueous solution. The developed catalyst preparation methodology, in contrast with Intevep’s
patent, generates smaller particle sizes by decomposing the emulsions in a controlled manner at
high temperature and high flowrates, out of the CSC reactor, specifically in the Catalyst
Preparation Unit. Therefore, an increase in the activity per unit mass of catalyst is obtained. The
invention also proposes the possible use of rare earth oxides such as Ce, Group IV metals such as
Zr oxide and Ti oxide and mixtures thereof together with NiO, alkali metals, CoOx and MoO3
(Pereira-Almao, et al., 2013).
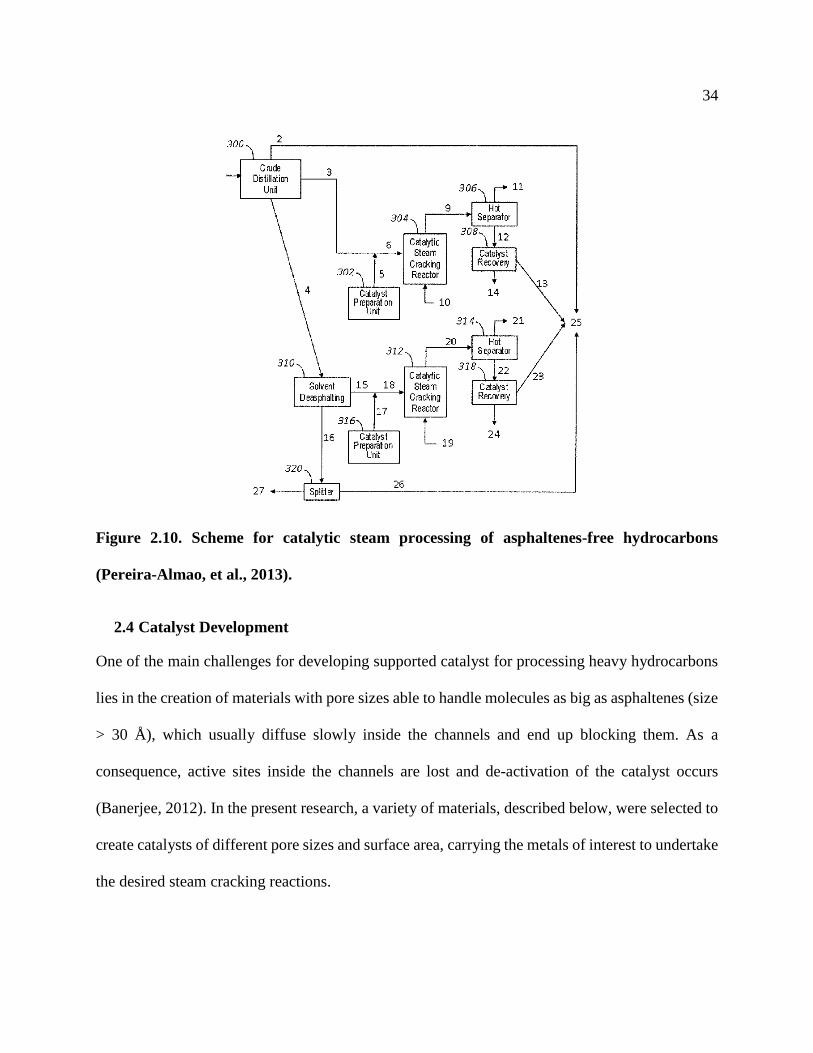
34
Figure 2.10. Scheme for catalytic steam processing of asphaltenes-free hydrocarbons
(Pereira-Almao, et al., 2013).
2.4 Catalyst Development
One of the main challenges for developing supported catalyst for processing heavy hydrocarbons
lies in the creation of materials with pore sizes able to handle molecules as big as asphaltenes (size
> 30 Å), which usually diffuse slowly inside the channels and end up blocking them. As a
consequence, active sites inside the channels are lost and de-activation of the catalyst occurs
(Banerjee, 2012). In the present research, a variety of materials, described below, were selected to
create catalysts of different pore sizes and surface area, carrying the metals of interest to undertake
the desired steam cracking reactions.
35
Regarding the catalyst formulations, as for instance in the case of nano catalysts, the use of
emulsions containing non-noble metals from the Group VIII (Ni and Co) with alkaline earth metals
(Ca, Mg) has been studied with good results toward the production of ultradispersed catalysts
(Pereira-Almao, et al., 1999). Further development of these catalysts allowed the preparation of bi
and trimetallic catalysts, containing non-noble metals from Group VIIIB non noble metal and/or
two metals from Group VIB (Cr, Mo, W) in the presence of a sulfiding agent (Pereira-Almao, et
al., 2011).
For the purpose of this research, bimetallic and trimetallic catalysts were developed. All of the
prepared formulations incorporated Ni, which is commonly used in the oil industry for
hydrogenation, due to its relative low value, high activity and selectivity (Bartholomew &
Farrauto, 2006). The first catalyst (Cat 1) consists of a mixture of kaolin and nano-particles of
nickel together with one alkaline (Cs) and one alkaline earth metal (Ba) added as promoters to
improve the basicity of the catalyst and to favor reactions involving steam (Hassan, et al., 2013).
In the preparation of Cat 2, a hydrotalcite type precursor is used for the formation of a well
dispersed mixture of oxides including Ni and Ce dispersed in amorphous aluminium oxide. From
the literature, the use of Ce increases the dispersion of nickel, reduces coke formation and increases
the activity in steam reforming reactions (Zhang, et al., 2014; Zhang, et al., 2009; Tang, et al.,
2014). The third catalyst (Cat 3) consists of a nano-pyroxene material, the sodium-iron silicate
Aegirine, with Ce (partially replacing Fe) and adding nickel by impregnating the surface. Catalyst
four (Cat 4) is prepared from a Faujasite zeolite X, incorporating Ni and Ce in the cavities of the
material by ion exchange of the original Na. Lastly, Cat 5 was prepared by combining the calcined
hydrotalcite, as in Cat 2, together with a nano-crystalline cubic molybdenum carbide material.
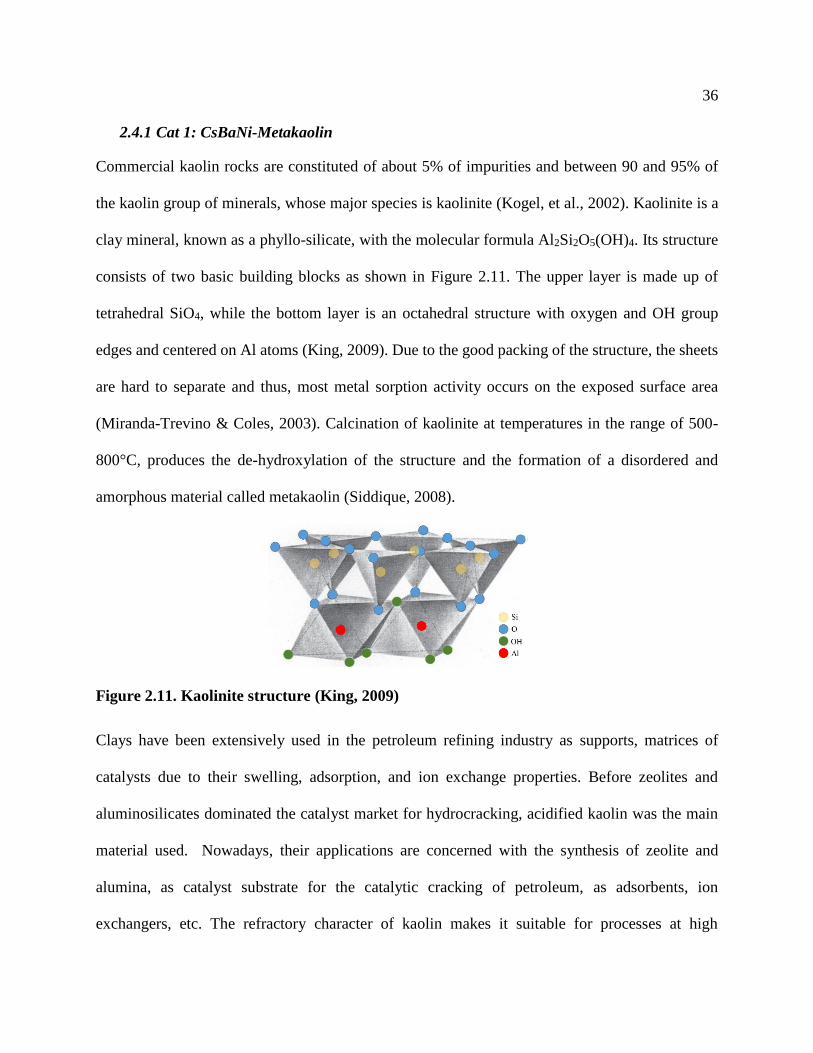
36
2.4.1 Cat 1: CsBaNi-Metakaolin
Commercial kaolin rocks are constituted of about 5% of impurities and between 90 and 95% of
the kaolin group of minerals, whose major species is kaolinite (Kogel, et al., 2002). Kaolinite is a
clay mineral, known as a phyllo-silicate, with the molecular formula Al2Si2O5(OH)4. Its structure
consists of two basic building blocks as shown in Figure 2.11. The upper layer is made up of
tetrahedral SiO4, while the bottom layer is an octahedral structure with oxygen and OH group
edges and centered on Al atoms (King, 2009). Due to the good packing of the structure, the sheets
are hard to separate and thus, most metal sorption activity occurs on the exposed surface area
(Miranda-Trevino & Coles, 2003). Calcination of kaolinite at temperatures in the range of 500-
800°C, produces the de-hydroxylation of the structure and the formation of a disordered and
amorphous material called metakaolin (Siddique, 2008).
Figure 2.11. Kaolinite structure (King, 2009)
Clays have been extensively used in the petroleum refining industry as supports, matrices of
catalysts due to their swelling, adsorption, and ion exchange properties. Before zeolites and
aluminosilicates dominated the catalyst market for hydrocracking, acidified kaolin was the main
material used. Nowadays, their applications are concerned with the synthesis of zeolite and
alumina, as catalyst substrate for the catalytic cracking of petroleum, as adsorbents, ion
exchangers, etc. The refractory character of kaolin makes it suitable for processes at high

37
temperatures and pressures. Besides, it has been demonstrated that the addition of kaolin to FCC
catalysts improves the attrition resistance, reduces coke yield and has high tolerance to
contaminated metals. They are also excellent supports for Lewis acids or transition metals to be
used in organic reactions (Emam, 2013). Hassan et al 2013, evaluated the selective adsorption and
further steam gasification of asphaltenes using kaolin loaded with nanoparticles of nickel oxide.
Alkaline earth elements (Ca and Ba) were incorporated in the preparation of the adsorbent/catalyst
to improve the basicity of the material. The results indicated the positive effect of the catalyst at
reduced temperature, at which the asphaltenes crack in a more controlled manner than in thermal
cracking. Besides, the production of CO2 and hydrogen was favored, related to the steam
gasification reactions (Hassan, et al., 2013).
2.4.2 Cat 2: NiCe-Calcined Hydrotalcite
Hydrotalcites are natural anionic clays, also called magnesium-aluminum hydroxycarbonate that
can be decomposed during calcination to produce a mix of nano-oxides with high surface area
(McKenzie, et al., 1992). They belong to a family of layered double hydroxides (LDHs) with the
general molecular formula shown in Eq. 2.16. The divalent and trivalent metals ions (𝑀𝑥2+ and
𝑀𝑦3+) are found coordinated in the double layered hydroxides with octahedral shape, while the
compensating anions (𝐴−𝑛) are located in the interlayer, as presented in Figure 2.12 (Cantrell, et
al., 2005).
LDHs molecular formula [𝑀1−𝑥2+ 𝑀𝑥
3+(𝑂𝐻)2]𝑥+(𝐴𝑥/𝑛
−𝑛 ) ∙ 𝑦𝐻2𝑂 Eq. 2.16

38
Figure 2.12. Hydrotalcite structure (Cantrell, et al., 2005)
The variation of the parameters involved in the molecular formula of the LDHs allows the
preparation of various types of synthetic materials. The selection of the metals to be incorporated
in the structure, is based on the ionic radius of the metal, which should not be too different from
that of Mg2+ (0.65 Å). Several combinations of Mg, Ni and Co as M2+ with Al as M3+ have been
used in the literature to prepare hydrotalcites for catalytic purposes. The amount of each cation in
the hydrotalcite (x) has been defined to be in the range of 0.2 and 0.33 to obtain pure hydrotalcite,
but it can also be extended to a range between 0.1 and 0.5 with the formation of metal hydroxide
impurities. There are no limitations regarding the nature of the anion used to compensate the
positive charges of the hydroxide layers. However, the size, orientation, number and the strength
of the bonds formed determine the separation interlayer space. In the literature, can be found the
use of anions such as: inorganics (e.g. F-, Cl-, (NO3)-, (SO4)
2-, (CO3)2-), heteropolyacids and
organic acids, the carbonate being the one most commonly used. Those sites in the interlayer not
occupied by the anion are filled with water molecules (Cavani, et al., 1991).

39
The ability to incorporate metals of interest into the structure and the properties of the mixture of
oxides after calcination regarding surface area, basicity, thermal stability and small crystal size,
have made the hydrotalcite a material suitable for the preparation of catalysts with special use in
hydrogenation, polymerization and steam reforming reactions. Catalysts with compositions after
calcination of 56.8 wt. % Ni and 9.5 wt. % Al have been prepared in the literature to compare
catalytic activity under steam reforming conditions against impregnated catalysts with similar
proportion of Ni (61.4% Ni, 19.5% Al2O3 and 1.31% K). The results showed catalytic
improvement at lower temperatures of the coprecipitated catalyst, as well as higher stability and
lifetime. Besides, due to the basicity of the mixed oxides, there is no need to incorporate alkali
metals into the catalyst (Cavani, et al., 1991). Moreover, the addition of rare earth metals such as
La, Zr and specially Ce has been studied, as promoters to improve the dispersion of the metal in
the structure, to avoid sintering and to enhance the carbon removal by improving the redox
properties of the system. Therefore, steam reforming and hydrogenation reactions are considerably
favored (Zhang, et al., 2009; Muñoz, et al., 2012).
2.4.3 Cat 3: NiCe-Aegirine
The pyroxenes are a family of minerals with similar crystal structure and general molecular
formula M2M1T2O6, where M2 is a five to eight coordinated cation (e.g. Na, K, Li, Ca, Ba, or
Fe2+), M1 is a six-coordinated element (e.g. Mg, Mn, Fe2+, Fe3+, Al, Cu, Co, Ni, etc.) and T is
preferably occupied by Si. Aegirine belongs to this family of compounds with M2, M1 and T sites
occupied by Na, Fe and Si, respectively. Thus, the ideal formula of aegirine is NaFeSi2O6 and the
structural shape is presented in Figure 2.13 (Vitale, 2013).

40
Figure 2.13. Pyroxene structure showing tetrahedral (yellow) and octahedral (green) layers.
M2 cations are represented as purple atoms, M1 cations are grouped in the green octahedral
(Vitale, 2013).
There is little information in the literature regarding the use of aegirine for catalytic purposes, but
Vitale, 2013 studied the possibility of exchanging sodium from the crystalline structure by protons,
in order to improve the acidity of the material and use it as a hydrocracking catalyst. The
experiments processing a model molecule, methyl-cyclohexene, in a reactor at 406°C indicated
that the material was indeed able to break the naphthenic rings and to carry out secondary cracking
of the produced hydrocarbons. Improvement of the acidity strength by doping the material with
Zr showed high activity at lower temperatures, as well as, more selectivity for isomerization and
de-hydrogenation. Moreover, experiments to perform hydroxylation of phenol with hydrogen
peroxide in presence of aegirine as catalyst, indicated the possibility of using this material to
catalyze reactions of organic molecules with steam at high temperatures (Vitale, 2013).
2.4.4 Cat 4: NiCe-Faujasite
Zeolites are one of the most common used material in the elaboration of catalysts for
hydrocracking. As previously mentioned, they support the metals involved in the hydrogenation
of molecules, but also their acidity generates the cracking activity required by the process. This
type of material came to the industry to substitute amorphous oxides, because of their potential
acidity, about 1000 times greater, high surface area and their resistance to coking. Within the wide

41
range of types of zeolites, Faujasite type Y zeolites are the most commonly used for hydrocracking,
while ZSM-5 are mostly used in hydro-dewaxing and shape selective cracking (Ward , 1993).
This type of material is constituted by tetrahedral structures consisting of a cation (e.g. Al, Si, P,
Be, Zn, Mg etc.) surrounded by four oxygen atoms. Each of these structures are linked together to
form a crystalline framework containing nano-size cavities and channels. Inside the framework,
water molecules and easy to exchange cations can be found. The framework in zeolite type
faujasite (FAU) consists of linked silicon–aluminum–oxygen with a void volume of about 53%,
whose Si/Al ratio define whether it is a Y zeolite (Si/Al around 1.5-3.0) or X zeolite (Si/Al around
1.0-1.4) (Dyer, 2001). In FAU, the framework is constituted by 12 linked tetrahedra that creates a
super cage of 12 Å with windows of 8Å in diameter, as shown in Figure 2.14 . The zeolites X and
Y are usually prepared in the Na form, which are further ion exchanged with other cations, like for
instance ammonium. To produce the acid form, the resultant material is then calcined to
decompose the ammonium ions and generate in this way the protons that acidify the structure
(Kaduk & Faber, 1995). On the other hand, zeolite X has been of great interest due to the existence
of a maximum in the aluminum content and hence, the possibility of exchanging it for cations of
interest for the reaction (Lee, et al., 1998).
Figure 2.14. Structure of Zeolite Y (Lutz, 2014)
42
2.4.5 Cat 5: NiCe-Calcined Hydrotalcite+Molybdenum Carbide
The carburization of Group VI metals like tungsten and molybdenum has been studied since the
70’s due to the excellent catalytic properties that the metal develops in presence of carbon, which
allows these type of materials to speed up reactions with similar behaviour like those obtained with
noble metals like Pt and Pd (Levy & Boudart, 1973). The main interest toward this solid lies in the
abundance and low cost of the raw materials used in its preparation compared to noble metals, but
specially on their resistance to sulphur and nitrogen poisoning; and their stability under steam
(Kaewpanha, et al., 2015; Da Costa, et al., 2001; Xiao, et al., 2000; Dhandapani, et al., 1998).
However, research into practical methods to prepare this material at lower temperatures and
economically feasible is still carried out. Typically, molybdenum and tungsten carbides are
prepared via temperature programmed reaction, where an oxide of the metal of interest, either
MoO3 or WO3, is thermally treated in presence of a mixture of hydrogen and hydrocarbon until
the metal suffers carburization, generating the product of interest. In the case of the molybdenum,
this procedure generates the stable hexagonal molybdenum carbide at the end of the process. By
using a different precursor such as a cubic oxyhydrate (MoOxHy), the temperature programmed
reaction route produces the cubic face of molybdenum carbide. A preparation method to generate
this cubic oxyhydrate precursor has been found in the literature, where ammonium heptamolybdate
tetra-hydrated is mixed with household sucrose in a solution with water; and then dried out in an
oven at 120°C for 24 h (Vitale, et al., 2015).
In Figure 2.15, the three main stable crystallographic phases for molybdenum carbide are
presented, where due to the strongest charge transfer from Mo to C, the β-Mo2C features metallic
and ionic character and thus, it is the phase that most activates and stabilizes adsorbed molecules
(dos Santos Politi, et al., 2013).

43
Figure 2.15. Molybdenum Carbide crystallographic phases: a) cubic (δ-MoC), b) hexagonal
(α-MoC) and c) orthorhombic (β-Mo2C). Turquoise and magenta spheres correspond to C
and Mo atoms, respectively (dos Santos Politi, et al., 2013)
This phase has been used as a support for different transition metals to carry out methanol steam
reforming between 150 and 400 °C. The results showed the complete conversion of methanol for
the combination Ni-Mo2C at 350°C. The same result is obtained when the temperature reaches up
to 400°C for the pure molybdenum carbide (β-Mo2C) (Ma, et al., 2014). On the other hand, the
hexagonal phase of Mo2C(α-Mo2C) is also able to hydrogenate completely model molecules such
as toluene into methylcyclohexane with no de-activation, at low temperatures of 200°C, low space
velocity (WHSV) of 0.35 h-1and most important low hydrogen pressures of 2.8 MPa (400 psi)
(Frauwallner, et al., 2011). At atmospheric pressure and 90 °C, Rocha Angela S. et al, 2004 was
also able to hydrogenate between 20 and 40% of benzene molecules in a batch recirculating
apparatus using the same phase of molybdenum carbide, but supported on Y zeolites.
Detailed information about the preparations of the catalysts and their characterization can be found
in Chapter Three.
44
Experimental Section
This chapter is intended to explain and provide description of the guidelines followed for the
preparation of the catalysts, as well as their characterization. Moreover, properties of the materials
used in the experiments, pilot plant description and operating procedure; and methodology for the
analysis of the samples generated in the laboratory are also presented within this chapter.
3.1 Catalyst Preparation
By means of the methodology presented below, the preparation of the five catalysts used in this
research was achieved. The first catalyst (Cat 1) consists in a mechanical mixture of Ni, Cs and Ba
oxides in a calcined kaolinite matrix. The second catalyst (Cat 2) is a combination of magnesium
and aluminium oxides together with nickel and cerium oxides, all of them originated from the
calcination of a Ni-Ce incorporated hydrotalcite. Cat 3 was prepared from aegirine, where cerium
was incorporated in the gel that was hydrothermally treated to produce the pyroxene structure with
doped Ce; and nickel was impregnated afterwards. Cat 4 consists of a zeolite matrix type X,
submitted to ion exchange to incorporate Ni and Ce into the structure. The last catalyst (Cat 5) is
the mechanical combination of Cat 2 with 10% of molybdenum carbide.
3.1.1 Cat 1: CsBaNi-Metakaolin
As stated before, the preparation of Cat 1 consisted in the mechanical mixture of the four main
components: Cs, Ba, Ni and kaolin as done by Hassan et al., 2013. For that purpose, in a 100 g
basis, 6 g of CH3COOCs (Sigma-Aldrich, 99.9%) and 6 g of (CH3COO)2Ba (Sigma-Aldrich,
99.9%) were mixed together with 10 ml of water. Another solution of 20 g of sugar in 10 ml of
water was prepared, to work as a porogen in the final extrudates of the catalyst. Then, 65 g of
kaolin provided by EMD was mixed with 3 g of NiO in nano particles (<50 nm) provided by

45
Aldrich with 99.8% purity. Finally, the powder was vigorously mixed with the aqueous solutions,
aiming to obtain good homogenization and wetting of the whole material. More water can be added
to the mixture to reach the desired consistency of the dough for the extrusion process. The machine
used for the extrusion consists of a stainless steel syringe with a piston working with a manual oil
pump, in order to control the pressure applied. The dough was inserted into the syringe and the
spaghetti shaped catalyst was produced by pressing the piston. The product was dried out overnight
at room temperature and then, calcined at 650°C for 8 hours in air, with a heating rate of 10 °C/min.
Before the calcination, the oven was programmed to dry further the material at 120°C for 3 h, with
a heating rate of 5 °C/min. After calcination, the spaghetti-like materials were cut down into
extrudates of 1-3 mm length with an average diameter of 1.5 mm.
3.1.2 Cat 2: NiCe-Calcined Hydrotalcite
The hydrotalcite precursor for Cat 2 was precipitated by the typical co-precipitation method at
constant pH of 11 (Pérez Zurita, et al., 2015). A solution consisting of Mg(NO3)26H2O,
Ni(NO3)26H2O, Al(NO3)39H2O, Ce(NO3)36H2O was prepared in their corresponding amounts to
give the following respective concentration: 0.8, 0.3, 0.2 and 0.2 M. Another basic solution
consisting of NaOH 3.4 M and Na2CO3 1 M was prepared separately in a beaker. Both solutions
were mixed together at a flowrate of 1.6 ml/min under vigorous stirring, followed by an aging time
of 24 h at room temperature with constant agitation, to form the gel. Then, aging was continued at
80°C for another 24 h inside an oven. The final gel was filtered and washed several times with
distilled water until neutral pH was reached. After this point and avoiding completely drying the
material, the hydrotalcite was removed from the filtration system and mixed with sugar to improve
the generation of porosity in the catalyst particles. The amount of sugar added corresponds to 30%
by weight of the dried hydrotalcite, which is why the amount of dried hydrotalcite to be produced

46
is needed to be known a priory. The material was slightly dried out aiming to obtain a suitable
consistency of the dough to shape it into extrudates. The final spaghetti-like material obtained from
the extrusion machine was completely dried out overnight at room temperature and then, calcined
at 450°C on air for 16 h with a heating ramp of 10 °C/min. The final material was then cut into
extrudates of about 1-3 mm.
3.1.3 Cat 3: NiCe-Aegirine
The preparation of Cat 3 followed the methodology described by Vitale, 2013 for the preparation
of aegirine at low temperatures, where cerium was incorporated during the mineral co-precipitation
and nickel was impregnated afterwards. The initial step in the preparation of this catalyst consisted
in the preparation of two solutions. One acidic solution with the following concentration: 2M
H2SO4, 0.12 M Ce(NO3)36H2O and 0.57 M FeCl36H2O, and another basic solution with 1.19 M of
SiO2, 0.19 M of Na2O prepared from sodium silicate (SiO2 26.5 %, Na2O 10.6%); and 11.5 M of
NaOH. Both solutions were mixed together, adding the acidic one over the basic solution to avoid
thickening the mixture, which occurs at pH around 7. Then, the final gel was thermally treated in a
Parr reactor at 160 °C with 300 rpm stirring during 96 h, to favor the crystalline growth. Then, the
material was filtered, washed with abundant water until no chloride was detected in the water and
dried at room temperature overnight.
The acidification of the material was obtained by ion exchange. This procedure allowed every five
grams of aegirine to be in contact for about 20 min with 120 ml of a solution of 0.25 M H2SO4 in
water. After this time, the material was again filtered, washed with water until no sulfate was
detected and dried at room temperature overnight. By empirical experience, these conditions allow
the removal of 30 wt. % of the sodium ions previously existing on the surface of the nano-aegirine
particles.

47
After acidification, 4% of nickel was loaded onto the material by wetness impregnation using a
solution of Ni(NO3)2.6H2O. Then, the solid was allowed to dry at room temperature overnight and
further calcined at 500°C for 6 h to generate a yellow powder that was mixed with ludox provided
by Aldrich (40% Silica in water), in a weight proportion 1:1.4 to favor the agglomeration and the
formation of a suitable dough for extrusion. The catalyst was calcined one more time at 500°C for
6 h and the extrudates were cut down with similar proportions used before. Due to the use of silica
binder, the final concentration of NiCe-Aegirine on the extrudates was about 65%.
3.1.4 Cat 4: NiCe-Faujasite
NiCe-Faujasite was prepared following standard methods of zeolite Faujasite synthesis and
submitted to ion exchange to incorporate Ni and Ce into the alumino-silicate framework. In order
to extrude this powder, each gram of prepared solid was mixed with 0.43 g of kaolin and 0.63 g of
ludox described above. After the extrusion was done, the spaghetti-like materials were calcined at
500°C for 6 h and cut into cylinders of 1-3 mm length. The final concentration of the catalyst in
the produced particles was 61 wt.%.
3.1.5 Cat 5: NiCe-Calcined Hydrotalcite+Molybdenum Carbide
The precursor of molybdenum carbide was prepared as explained elsewhere (Vitale, et al., 2011),
starting from an aqueous solution of ammonium heptamolybdate tetra-hydrate
(NH4)6Mo7O24.4H2O and household sucrose, which was dried out at 120°C for 24 h. Then, this
precursor material was filled into a fixed bed reactor and converted into cubic molybdenum carbide
at 500°C for 24 h, with a heating rate of 10°C/min and flowing 30 ml/min of hydrogen into the
system.
In parallel, hydrotalcite was prepared as previously explained, but sugar was not added nor was
the extrusion carried out. Instead, after washing, the hydrotalcite was completely dried out and

48
calcined at the same conditions previously described for Cat 2. Calcined hydrotalcite and
molybdenum carbide were mixed together in a proportion 10:1. Then, for each gram of this
catalytic mixture, 0.3 g of kaolin, 0.12 g of Ludox and 0.62 g of water were added together to
create the right consistency of the dough for the extrusion. In this case, the catalyst was not calcined
to avoid dicarbidation of molybdenum. The use of silica and kaolin to obtain the dough with the
desired properties led to dilution of the catalytic material in the extrudate particles, whose final
concentration was 76 wt.%.
3.2 Catalyst Characterization
3.2.1 Textural properties
The most common technique used to determine surface area is described by the ASTM D3663-84,
which is based on the adsorption and desorption of nitrogen at -196°C. The equipment used to
obtain the textural properties was a “Micromeritics TriStar 3000” surface area analyzer. The method
consists of a degassing of the sample by flowing an inert material (He) through a glass cell at
150 °C, where the solid was placed. Then, the glass cell was submerged in a vessel with liquid
nitrogen to cool it down to -196°C. After reaching that temperature, several injections of nitrogen
were performed into the system, fixing the partial pressure of the gas. Each injection step had
enough time to allow the system to stabilize and record the amount of nitrogen condensed onto the
surface of the material. Once the nitrogen partial pressure to saturation pressure (at -196°C) ratio
of one is reached, desorption of nitrogen can be started, by decreasing the partial pressure of this
gas. Knowing the volume of nitrogen adsorbed at each partial pressure, it was possible to determine
the total volume of nitrogen adsorbed in the monolayer by the Brunauer, Emmett and Teller (BET)

49
equation. Then, with this volume in the monolayer and the cross sectional area of the nitrogen
atoms, the surface area of the material was determined (Bartholomew & Farrauto, 2006).
3.2.1 Temperature Programmed Techniques
This set of techniques aim to determine the surface reactivity of a solid, as well as the energetic
and kinetic interaction between molecules and surfaces (Bartholomew & Farrauto, 2006). Within
this group of characterization techniques, Temperature Programmed Reduction (TPR) and
Temperature Programmed Desorption (TPD) are the most commonly used. Both of them were
done using a Quantachrome Chembet 3000 and following the same pre-treatment procedure, in
which a known amount of sample (100 mg for TPR and 120 mg for TPD) was placed in a U-tube
and introduced into a temperature controlled furnace. A flow of 15 ml/min of argon was allowed
to pass through the tube at 200°C for 1 h to remove air and physi-sorbed water. In the last part of
the pre-treatment, the tube was cooled down to room temperature, while still passing argon. In the
case of TPR, a diluted reducing gas such as hydrogen (10 vol. % in argon) was flowed into the
tube, while the system was heated up at a rate of 10 °C/min to 950°C. The composition of the gases
at the exit of the U-tube was monitored with a thermal conductivity detector to determine the
consumption of hydrogen during the evaluation (Vitale, 2013).
In the case of TPD, before heating the tube up, 15 ml of a diluted basic gas (10 vol. % of NH3 in
helium) was flowed into the system for 1 h to allow the chemisorption of the molecule onto the
active sites of the catalyst. Then, with the furnace at about 200 °C, pure helium was flowed through
the system to remove the excess of the gas used for the adsorption. After this point, the tube was
heated up at rates similar to the one used in TPR. In this case, the detectors can determine the
amount of ammonia desorbed, in order to evaluate the desorption profile of the gas attached in the
previous step (Vitale, 2013).

50
In general terms, Hydrogen TPR is used to obtain the characteristic reducibility profile of the
catalyst and thus, to determine the most suitable conditions to obtain the total reduction of the
metals incorporated. Moreover, the calibration of the gas analyzer allows one to determine the total
amount of hydrogen consumed and by balance, the amount of metal exposed for reduction. On the
other hand, TPD permits one to determine the acidic or basic properties of a catalysts. In ammonia
TPD, this basic molecule interacts with the acid sites on the surface of the catalyst. Therefore, its
quantification allows one to obtain the total amount of acid sites and strength, regardless of the
type (Lewis or Brønsted) (Vitale, 2013).
3.2.1 Thermogravimetric Analysis (TGA)
This method consists of analyzing the weight and heat changes experienced by a solid sample,
when the latter is submitted to an increase in temperature under the flow of a gas. The equipment
used was a DT Q 600 system from “Thermal Analysis Instruments Company”. Within the several
functions of this equipment, it was used to determine the amount of coke generated on the surface
of the catalyst during reaction. In different runs, fresh and spent catalyst were heated at 20 °C/min up
to 800 ºC under a flow of air (100 Std. mL/min) to allow the oxidation of the coke and thus, being
able to obtain the weight losses. The mass lost obtained between room temperature and 200 ºC was
assigned to moisture and/or solvent elimination, while the mass lost obtained between 200 ºC and 400
ºC was considered as oxidation of remaining hydrocarbon. The mass lost obtained between 400 ºC and
600ºC was attributed to coke and carbon oxidation. By weight difference between the fresh catalyst
and the spent one, the percentage of coke present in the catalyst after reaction can be determined.
3.2.1 X-Ray Diffraction (XRD)
The powder XRD is a technique used mainly to obtain information about the structure of
crystalline materials. A primary use of the technique is the identification and characterization of

51
crystalline compounds based on their diffraction patterns. It consists of analyzing the way in which
an X-ray beam, at a certain angle, diffracts when it hits a specific plane of the solid. The angle of
diffraction varies within the different planes analyzed, which in general create a unique pattern for
crystalline compounds and elements that allow the user to identify and quantify crystalline
structures in the analyzed solid by comparison with a powder diffraction database (Bartholomew
& Farrauto, 2006). The analyses of the solids were performed in a Rigaku ULTIMA III X-ray
diffractometer with Cu Kα radiation, evaluating from 5 to 90 2θ degree, with 0.02 degree step and
a counting time of 0.2 step/s. The powder was placed in a sample holder of 1 mm depth and then
topped with a glass sheet. The domain crystal sizes were measured using the software JADE, based
on the Scherrer equation (Vitale, 2013)
3.2.2 X-Ray Photoelectron Spectroscopy (XPS)
This technique is used to carry out chemical analysis onto the surface of a catalyst, determine
oxidation states and even determine the dispersion of the oxide phases. The analysis consists of
bombarding the surface of the catalyst with X-ray photons that bring as consequence the emission
of photoelectrons from atomic core levels, which can be measured as a function of electron energy
(Bartholomew & Farrauto, 2006). The equipment used to record the XPS spectra was a Physical
Electronics PHI VersaProbe 5000-XPS instrument operating with a monochromatic Al source
(1486.6 eV) at 50 W, Pass energy of 23.5 eV and beam diameter of 200 μm. The samples were loaded
in a custom made sample holder using double faced tape and spectra taken with double neutralization,
i.e., a low energy electron beam and low energy Ar+ beam. The binding energies were reported relative
to C1s at (284.8 +/- 0.2) eV and peak fitting was performed using the Multipak 9.2.0.5 software.

52
3.1 Carborundum cleaning
Silicon Carbide, commonly known as carborundum, is an inert solid material used in this project
to fill the reactor in order to improve thermal transfer at the beginning of it and hold the catalytic
bed. This solid was supplied by Panadyne with a particle size of 841 microns. Due to the impurities,
like the common presence of iron, a standard cleaning procedure was employed. Every 50 g of
carborundum was washed in a rotary evaporator at 45°C with 100 ml of a solution of 10% HNO3
in water, during 3 hours. After this time, the treated carborundum was filtered and washed with
abundant deionized water to get rid of the solubilized iron impurities. Then, more water was added
to the carborundum and tested with potassium thiocyanate as indicator. If the color of the solution
changes to red, there is still iron that must be washed.
3.2 Feedstock
The experiments performed in this research project were done using De-Asphalted Oil (DAO)
produced from processing Athabasca Bitumen (provided by Japan Canada Oil Sand Limited,
obtained via Steam-Assisted Gravity Drainage), in a bench scale Solvent De-asphalting Unit that
existed in the laboratory of the Catalysis for Bitumen Upgrading Group. The heavy oil was
processed with pentane as solvent, at 150 °C and 500 psig. The solvent-to-oil ratio selected was 4,
aiming to remove as much asphaltenes as possible in order to have good pitch yield, required in
another research topic (Da Silva De Andrade, 2014). Therefore, the asphaltene content in the oil
was reduced from 17% to 1.4w%, bringing as a consequence an improvement of the oil in terms
of °API, viscosity and sulphur content. The production of the DAO was performed in 11 runs
under the same conditions with a yield of 73.1%, closing at about 100% mass balance for oil and
90% for solvent. The final DAO has the characteristics shown in Table 3.1.

53
Table 3.1. Bitumen and feedstock (DAO) properties
Property Athabasca Bitumen DAO
API Gravity, °API 8.3 12.0
Viscosity @20°C, cP 152,015 10,584
C5-Asphaltenes, wt.% 17.0 1.7
Distillation Cuts, wt.%
Naphtha, (IBP-190 °C) 1.89 0.06
Kerosene (190-260 °C) 5.32 4.36
Diesel (260-343 °C) 11.89 12.61
LVGO (343-453 °C) 18.29 23.28
HVGO (453-560 °C) 15.65 20.34
Residuum (560+ °C) 46.97 39.36
As it is exposed in Figure 3.1, the theoretical mixing of Pitch and DAO based on their produced
weight proportions, reveals a mixing curve above the original one obtained for Athabasca bitumen,
especially at the beginning of the distillation curve. As explained by Da Silva de Andrade (2014)
in his research thesis, this is a clear indication of light hydrocarbon stripping while removing the
solvent used in the operation. As a consequence, about 2.7 wt. % of the light material was removed
from DAO during the solvent extraction. At industrial scale, the light hydrocarbon can be separated
efficiently from the solvent in order to incorporate it into the DAO or in the final product,
improving its viscosity.

54
Figure 3.1. Simulated Distillation for the feedstock and products of the SDA Unit (Da Silva
De Andrade, 2014)
3.3 Plant description
In order to carry out the set of experiments required to achieve the goals of the thesis, a new bench
scale plant was designed, constructed and placed in the laboratories of the Catalyst for Bitumen
Upgrading Group at University of Calgary. This plant, named Catalyst Testing Unit (CTU-1) was
mainly designed to evaluate small amounts of solid catalysts (between 1-10g) in a fixed bed
reactor, under steam catalytic cracking conditions with complex hydrocarbon feedstocks.
However, it can be also used to carry out thermal cracking reactions and even hydroprocessing
under pressures between 0-490 psi and temperatures up to 500 °C.
The Process and Instrumentation Diagram (P&ID) is presented in Figure 3.2, which can be divided
into three main sections: Feed section, Reaction section and Products Sampling section. The whole
plant is controlled by a LabVIEW program that allows the user to set 8 different heating loops
55
(named H-XX), temperature alarms for them, control the gas flow injected into the plant, the
operation of the pumps, the pressure of the system and even quantification of the amount of gases
exiting the plant. All those parameters can also be recorded by the program in an excel file, saved
in the designated location in the assigned computer.
The feed section comprises the units needed to prepare and handle the reactants before entering
into the reaction section. It contains two inlets for liquids, two inlets for gases and another one in
spare for future uses. One of the two liquid inlets is used to flow oil or any other type of
hydrocarbon, by means of the oil pump (500D Syringe Pump-Teledyne Isco) which is constantly
heated and supplied with the storage tank (T-2). The heating of T-2 is done occasionally, only
when the filling of the pump is required, in which case a variable autotransformer (Staco Energy),
already in place, is in charge of controlling the current send to the heating tape. The second liquid
inlet is used for water, which is pumped into the system with P-2 (500D Syringe Pump-Teledyne
Isco). Nitrogen, used as carrier gas, and hydrogen used during reduction operations and in case of
hydroprocessing operations, are introduced into the plant by means of two SLA5850 Brooks Mass
Flow Controllers (MF-1 of 30 Std. ml/min for nitrogen and MF-2 of 200 Std. ml/min for
hydrogen). The water pumped into the system by P-2 is initially heated up to its respective
saturation temperature, in order to obtain the required phase change. However, a mixer/steam
generator was built (M-1), consisting of a 5 cm long tube of 0.95 cm (3/8’’) diameter filled with
glass beads that generates tortuosity and surface area to assure uniform steam generation. The
resulting steam, occasionally with nitrogen when needed, is then blended with the oil and sent to
the reaction section. Moreover, this section also includes an adjustable relief valve (set at 490 psi)
that opens in case of overpressure, sending fluids to the drainage can.

56
Fig
ure
3.2
. P
&ID
of
the
Cata
lyst
Tes
tin
g U
nit
(C
TU
-1)

57
Two reactor arrangements (Figure 3.3) can be used to vary the mass of catalyst needed. Both of
them consist of an up-flow stainless steel tube, one of 0.95 cm (3/8’’) external diameter with 0.089
cm (0.035’’) wall thickness and another one with 1.27 cm (1/2’’) of external diameter and the same
wall thickness. Including fittings to adapt the reactor to the plant, the arrangement of each reactor
results in a 39.5 cm length for Reactor 1 and 33.5 cm for Reactor 2. Based on empirical assessment
of the system, it was determined that two heating tapes of 1.27x5.08 cm (0.5x2.0’’) were needed
to develop 12.7 cm of isothermal zone suitable to set the catalytic bed. The heating tapes were
controlled with the internal temperature acquisition points 1 and 3, respectively (shown in Figure
3.3). The temperature at these points was measured with a profile Omega probe of 0.32 cm (1/8’’)
diameter, placed inside the reactor with three measurement points separated by 6.35 cm. These
three points allowed the user to evaluate and control the temperature profile along the catalytic
bed. A homogeneous profile was possible to obtain along the whole catalytic bed within 3°C
variations, by physically adjusting the heating tapes.
The bottom of the reactor, from the inlet to the isothermal zone, was filled with carborundum to
hold the bed and to favor the preheating of the reactants and development of a uniform flow pattern.
The small section between the upper fittings and the isothermal section was also filled with
carborundum to avoid the upwards movement of the bed because of the pressure. It is important
to note that quartz wool was placed at the beginning and the end of the tube to avoid the spreading
of solids along the plant. In order to also keep the catalytic bed in place, quartz wool was also
added between the carborundum sections and the catalyst extrudates.
The reaction section also includes a bypass system, which can be used during cleaning or special
operation to avoid sending fluid through the reactor. When needed, this bypass can be heated by
using any of the control loops available with the heating tape and thermocouples already installed.
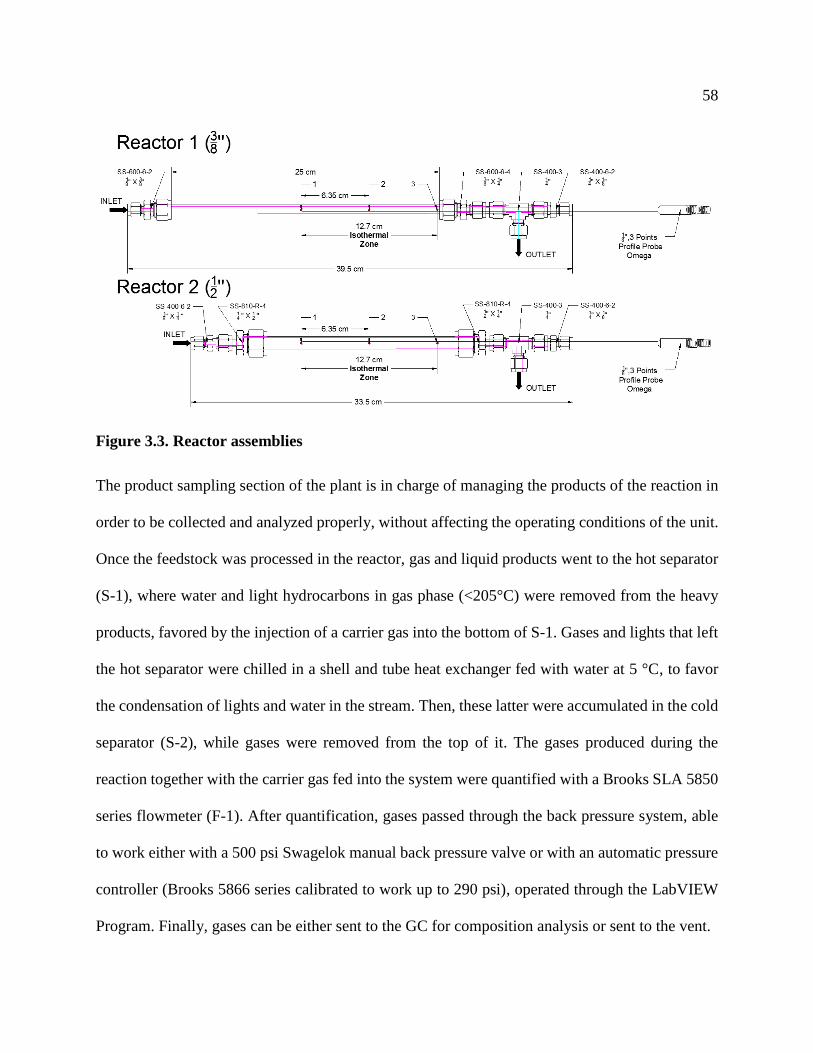
58
Figure 3.3. Reactor assemblies
The product sampling section of the plant is in charge of managing the products of the reaction in
order to be collected and analyzed properly, without affecting the operating conditions of the unit.
Once the feedstock was processed in the reactor, gas and liquid products went to the hot separator
(S-1), where water and light hydrocarbons in gas phase (<205°C) were removed from the heavy
products, favored by the injection of a carrier gas into the bottom of S-1. Gases and lights that left
the hot separator were chilled in a shell and tube heat exchanger fed with water at 5 °C, to favor
the condensation of lights and water in the stream. Then, these latter were accumulated in the cold
separator (S-2), while gases were removed from the top of it. The gases produced during the
reaction together with the carrier gas fed into the system were quantified with a Brooks SLA 5850
series flowmeter (F-1). After quantification, gases passed through the back pressure system, able
to work either with a 500 psi Swagelok manual back pressure valve or with an automatic pressure
controller (Brooks 5866 series calibrated to work up to 290 psi), operated through the LabVIEW
Program. Finally, gases can be either sent to the GC for composition analysis or sent to the vent.

59
Heavy products remaining in the hot separator were transferred into the sampling tank (T-1) by
means of two consecutive automatic valves (V-18 and V-19) working alternatively with a designed
volume between them of 3 ml. While the top valve was open collecting sample, the bottom valve
remained closed. After a certain amount of time the top valve was closed and the bottom one was
opened to transfer the sample, at operating pressure, into T-1. Once the sample transfer was
completed, the bottom valve closed and the top one opened to start collecting all over again. The
idea of the arrangement is to collect heavy products without strongly affecting the pressure of the
system. Every operation of this system generated pressure drops of about 3 psi, which was
recovered afterwards by generated gases and nitrogen. Once the product was in the sampling tank,
it can be easily removed from it through the collecting valves (V-14 and V-22). The time selected
for the automatic operation of the double valve system was assigned depending on the hydrocarbon
flowrates.
The lights and water were removed from the cold separator by means of two manual valves that
operated alternately as done for the heavy products.
3.3.1 Operating procedure
The operation of the CTU-1 to evaluate the effect of each condition over the quality of the product,
involved two previous steps, i.e. reactor filling and metals reduction operation, before the reaction
operation.
Reactor Filling
Following the schematics presented in Figure 3.3, the tube was disconnected from the lower
fittings (either SS-400-6-2 with SS-810-R-4 or SS-600-6-2, respectively) to proceed to its filling
upside down. A small amount of quartz wool is inserted through the tube in order to placed it at
the other end of it (connection between the tube and either SS-600-6-4 or SS-810-R-4). Then,
60
carborundum previously washed, was added to the reactor until reaching the isothermal zone. At
that point, more quartz wool was incorporated before proceeding to fill the isothermal zone with
catalyst. In the case of thermal runs, this section was also filled with carborundum. Once all the
catalyst was added, more quartz wool was placed and the reactor is completely filled with
carborundum. Some room was left free to add more quartz wool into the tube before proceed to
tighten it up to the fittings.
The filled reactor was then assembled into the plant and tested for leakage, at 450 psi for 2 hours,
constantly looking for leakages with Snoop Liquid Leak Detector from Swagelok.
It is important to know that the amount of catalyst loaded into the reactor, together with the oil
mass flowrate to be used, allow the determination of the Weight Hourly Space Velocity (WHSV),
by means of the following equation (Eq. 3.1). The inverse of the WHSV provides the contact time
between the oil and the catalyst.
𝑊𝐻𝑆𝑉[ℎ−1] =𝑜𝑖𝑙 𝑚𝑎𝑠𝑠 𝑓𝑙𝑜𝑤𝑟𝑎𝑡𝑒
𝑚𝑎𝑠𝑠 𝑜𝑓 𝑐𝑎𝑡𝑎𝑙𝑦𝑠𝑡 Eq. 3.1
Reduction Operation
The used catalysts required some of their elements to be in metallic form, which was achieved by
treating the catalysts with a flow of hydrogen under a temperature high enough to produce the
reduction of the oxide species. The operating reduction temperature was obtained by performing
a Temperature Programmed Reduction (TPR) of each solid. These temperatures can vary from one
catalyst to another, however, by previous testing of these solids, all of them proved to be reducible
at 500 °C, which was the temperature selected to proceed with the activation. This operation was
carried out during six hours at atmospheric pressure and flowing 60 Std. ml/min of hydrogen
through the reactor. After the specified time, the hydrogen was purged out of the system with 15
61
Std. ml/min of nitrogen for at least one hour and the temperature of the reactor was decreased to
250 °C. In order to keep consistency and avoid procedural differences, the reduction operations
were always performed before any kind of reaction, even for those cases where no catalyst was
used.
During the reduction step, the oil storage tank is heated up to 100 °C to decrease the viscosity of
the feedstock and start filling the pump (P-1).
Steam Cracking Operation
Once the reduction operation was performed, the remaining cold sections of the plant were heated
up to their respective temperatures. The feed section was heated up to 210 °C (250°C when
operating at 400 psi) with H-1, H-2 and H-3 to favor the gas phase of water. The hot separator was
heated up to 205 °C (270°C when operating at 400 psi) with H-6 to allow the water separation
from the heavy products. The sampling tank (T-1) and pump P-1 were heated to 100 °C with H-7
and H-8 respectively, to keep the oil at low viscosity and improve the quality of the mass balances
in the case of T-1.
Once the plant was heated at the expected conditions, either the pressure controller or the back
pressure valve were set at the operating pressure and the system was pressurized by means of V-20
(needle valve that bypass MF-1). With the desired pressure established, the MF-1 was set at 5 Std.
ml/min and the system was left at these conditions aiming to reach stabilization of the gas flowrate
in order to measure the amount of nitrogen fed into the system. After the nitrogen flowrate was
obtained, the water pump was set at 25 ml/min for 15 min to fill all the lines in the feed sections.
Once the system was filled, the reactor was pre-treated with steam at reaction temperature with a
flowrate of 1 ml/min of water for about three hours. Then, the feed section lines were filled with
the hydrocarbon feedstock for 15 min at 25 ml/min, before setting the oil flowrate.

62
Before the automatic operations of the two consecutive valves (V-18 and V-19) that transfer oil to
the sampling tank was activated, the hot separator and the cold separator were drained. Four main
parameters are involved in the automatic operation of these valves: the time for V-18 (upper valve)
to remain open, the delay time between when V-18 closes and V-19 (lower valve) opens, the repeat
time in which V-19 closes and V-18 open. Based on practical experience, repeat time and delay
time was set at 5 seconds while the time the sample takes to move from the 3 ml accumulator
toward the tank (V-19 open) was set to 290 seconds, to favor the complete transfer of the liquid.
However, the time V-18 remained open was calculated depending on the hydrocarbon flowrates,
aiming to obtain the complete transfer into the sampling tank. By experience, it was established
that at least 10% of the 3 ml accumulator must remain empty to assure the total transfer of any
extra oil pumped by malfunction of the pump.
3.4 Characterization of Samples
3.4.1 High Temperature Simulated Distillation (HTSD)
The High Temperature Simulated Distillation, also named Simdist, is an alternative method to the
time-consuming laboratory-scale physical distillation that aims to determine the amount of
material distilled at different temperatures (boiling point curve). According to this method, 1μl
from a solution consisting of 0.15 g of oil sample in 20 ml of CS2 was injected into a nonpolar
chromatography column placed inside a temperature programmed oven. Hydrocarbons in the
column were separated by boiling points and detected and quantified at the exit of the column by
a flame ionization detector. By running reference n-alkanes, the chromatographic response was
calibrated to obtain a result equivalent to the atmospheric boiling point of the sample aliquots.

63
According to the literature, with the HTSD method, a crude oil can be analyzed to temperatures
up to 732 °C equivalent, with a weight standard deviation below 2% (Villalanti, et al., 2010).
The equipment used to obtain simdist of the liquid sample was an Agilent Technologies Gas
Chromatograph, model 7890 A working at conditions described in ASTM-D7169-2005.
Chromatograms were analyzed with the software Simdist Expert, from the company Separation
Systems Inc.
Based on several repetitions of the same feedstock used in the experiments (DAO), the standard
deviation associated to the determination of each one of the distillation cuts of interest was
obtained, as shown in Table 3.2. However, due to the absence of naphtha in the DAO used, it was
not possible to determine the error for this measurement.
Table 3.2. Errors in the determination of distillations cuts
Distillation Cuts STDV Rel. Error, %
Naphtha, (IBP-190 °C) N/A N/A
Kerosene (190-260 °C) 0.3 7.7
Diesel (260-343 °C) 0.4 3.6
LVGO (343-453 °C) 0.9 4.0
HVGO (453-560 °C) 0.9 4.5
Residue (560+ °C) 2.4 6.0
The main parameter used to evaluate the performance of the reaction was based on the residue
conversion, calculated by means of the following equation (Eq. 3.2). It is important to note that
the residue in the products is calculated taking into consideration the contribution of gases to the

64
total mass of products. The typical standard deviation observed for this parameter is between 3
and 5 units of conversion.
𝑅𝑒𝑠𝑖𝑑𝑢𝑒 𝐶𝑜𝑛𝑣𝑒𝑟𝑠𝑖𝑜𝑛(%) =𝑅𝑒𝑠𝑖𝑑𝑢𝑒 𝑖𝑛 𝐷𝐴𝑂−𝑅𝑒𝑠𝑖𝑑𝑢𝑒 𝑖𝑛 𝑃𝑟𝑜𝑑𝑢𝑐𝑡𝑠
𝑅𝑒𝑠𝑖𝑑𝑢𝑒 𝑖𝑛 𝐷𝐴𝑂∗ 100 Eq. 3.2
3.4.2 Water content
Even though the heavy products are stripped from water and light material (boiling<200 °C) in the
hot separator, a small fraction of water still remains in equilibrium and stable in this stream.
Therefore, it is necessary to know this fraction, in order to account for it during the characterization
of the final products.
The water content was determined with a C20 Coulometric KF titrator from the company Mettler
Toledo. The methodology consisted of preparing a solution of 0.4 g of sample with around 9 g of
tetrahydrofuran (THF) to dissolve it. The amount of water contained in the THF must be previously
determined by adding weighted aliquots of the solvent into the titrator containing Aqua Star®
Coulomat A from EMD. Then, the prepared solution was tested in the titrator by adding weighted
aliquots and giving to the instrument its respective weight. Knowing the amount of sample and
solvent in the solution; and the water content in the solution and in the solvent, it is possible to
determine the water content in the original sample by material balance (Carbognani, et al., 2014).
3.4.3 Oil density
The density of the oil was measured with a DD2910/11 Digital Density Meter from Rudolph
Research Analytical. The principle of operation of this equipment consists of evaluating and
comparing the frequency of oscillation of a glass U-tube when it is empty and when filled with the
sample. This variation in oscillation is directly proportional to the mass contained in the fixed

65
volume. Therefore, with the mass and the volume, the equipment is able to deliver the density of
the sample.
In order to measure heavy oil hydrocarbons, it was necessary to dilute the sample in solvent and
create a calibration curve. Therefore, each sample was diluted in toluene in concentrations around
0.5wt% and 1wt%. Both solutions and the pure solvent were analyzed in the equipment to
determine their density, which were used to create the calibration curve. By extrapolating this
calibration at zero solvent concentration, the density of the original sample could be determined
and thus, the API gravity with a standard deviation of 0.3 API.
3.4.4 Microcarbon residue
The tendency of the bitumen to form coke when it is thermally treated can be determined by
standards methods such as Conradson Carbon Residue (ASTM D-189), Ramsbottom Carbon
Residue (ASTM D-524) and Microcarbon Residue (ASTM D-4530). Under different conditions,
setup and amount of sample, all of those methods aim to determine the amount of residue
remaining after evaporation and pyrolysis of the hydrocarbons present in the sample. The
advantage of Microcarbon against the other methods is the small amount of sample required to
perform the test (Hassan, et al., 2008).
The setup consists of aluminium and stainless steel plate of 10.12 cm diameter with 26 sorted
vertical tubes of 1/8’’ and 3/4’’ length, by which nitrogen can pass through. This plate is placed
inside a Barnstead Muffle furnace with temperature controller. On top of the plate, a glass cover
is placed to create an inert chamber of nitrogen when the gas starts flowing through the tubes. The
initial oxygen in the environment is purged via an orifice (1/8’’) on top of the glass cover.
The procedure consisted of incorporating about 20 mg of sample into a 2 cc glass vial and placing
it on the surface of the metal plate. With the described setup, up to 26 samples could be analyzed

66
at the same time. Then, the system was covered with the glass lid and the nitrogen cylinder was
opened at a flowrate of 900 ml/min at room temperature and atmospheric pressure conditions.
After 45 min purging the oxygen from the system, the furnace was turned on to reach a temperature
of 500 °C at 10°C/min. Once the system reached the desired temperature and went through a
natural cooling under a nitrogen environment, the vials were removed from the furnace to weight
them and then, the calculation of the amount of formed coke is done by weight differences with
an error of 1%.
3.4.5 Gases
3.4.5.1 Gas Chromatography
The molar/volumetric composition of the gases produced during the reactions was determined by
Gas Chromatography (GC). For that purpose, an SRI multiple gas analyzer model 8610C with
Multiple Gas #3 configuration was connected online to the exit of the plant. The equipment
comprises one Flame Ionization Detector (FID), two Thermal Conductivity Detectors (TCD) and
one Flame Photometric Detector (FPD). Besides, it also contained one molecular sieve column
(model MS13X) of 183 cm (6’) and another silica gel column of 183 cm (6’), a combination that
separates hydrogen, nitrogen, carbon monoxide, carbon dioxide, and C1-C5 hydrocarbons. A 60
m capillary column (MXT1-60m) was used to separate sulphur compounds from C1-C5
hydrocarbons (SRI-Instruments, 2014).
Hydrocarbons between C1 and C5 were detected and quantified with the FID using a medium gain
for its amplifier. Their composition was usually corroborated with the values obtained from the
TCD2 at high gain for the amplifier and using helium as a carrier. At the same time, TCD2 was
also used to determine the amount of CO, CO2 and hydrogen (when possible) present in the gas.
Hydrogen was also determined by using TCD1 at low gain for the amplifier and using argon as
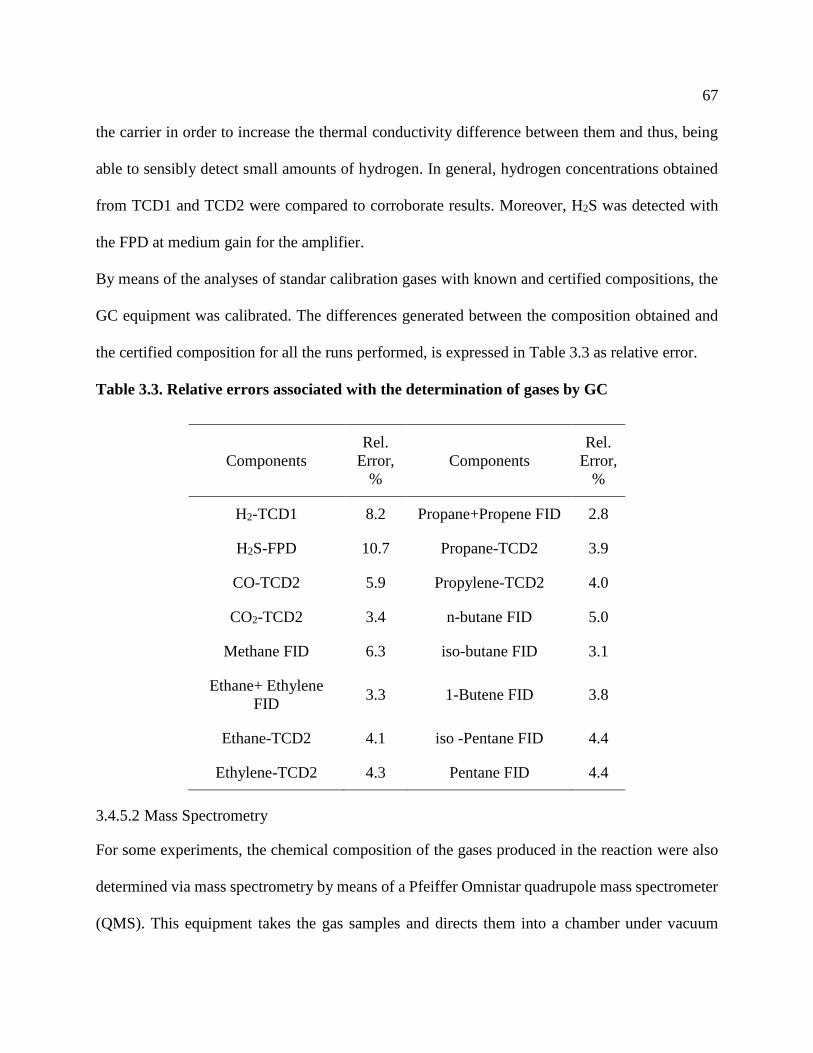
67
the carrier in order to increase the thermal conductivity difference between them and thus, being
able to sensibly detect small amounts of hydrogen. In general, hydrogen concentrations obtained
from TCD1 and TCD2 were compared to corroborate results. Moreover, H2S was detected with
the FPD at medium gain for the amplifier.
By means of the analyses of standar calibration gases with known and certified compositions, the
GC equipment was calibrated. The differences generated between the composition obtained and
the certified composition for all the runs performed, is expressed in Table 3.3 as relative error.
Table 3.3. Relative errors associated with the determination of gases by GC
Components
Rel.
Error,
%
Components
Rel.
Error,
%
H2-TCD1 8.2 Propane+Propene FID 2.8
H2S-FPD 10.7 Propane-TCD2 3.9
CO-TCD2 5.9 Propylene-TCD2 4.0
CO2-TCD2 3.4 n-butane FID 5.0
Methane FID 6.3 iso-butane FID 3.1
Ethane+ Ethylene
FID 3.3 1-Butene FID 3.8
Ethane-TCD2 4.1 iso -Pentane FID 4.4
Ethylene-TCD2 4.3 Pentane FID 4.4
3.4.5.2 Mass Spectrometry
For some experiments, the chemical composition of the gases produced in the reaction were also
determined via mass spectrometry by means of a Pfeiffer Omnistar quadrupole mass spectrometer
(QMS). This equipment takes the gas samples and directs them into a chamber under vacuum

68
conditions. In this chamber, the compounds were bombarded with electrons to induce their
ionization. A quadrupole mass filter, consisting of four parallel rods arranged in the form of a
square, was in charge of separating the ions in mass to charge ratio (m/z or m/e), which were then
detected by a Faraday detector or a secondary electron multiplier. The current detected can be
related to the partial pressure of the compounds or any of their fragments (Pfeiffer-Vacuum, n.d.).
In this way, frequent monitoring of the generated gases, separated in mass to charge ratio, can be
performed.
3.4.6 Viscosity
A Brookfield viscometer model RVDV-II+PRO was used to determine the dynamic viscosity, with a
relative error of 5%, at a given temperature on liquid samples placed in the sampling cup Depending
on the viscosity of the sample and the type of spindle used, the rotation speed was varied to obtain a
final measurement with a torque between 40-60% of the maximum 0.7187 milli N/m. The temperature
of the sample cup was kept constant by means of a Brookfield TC-502 bath.
3.4.7 Microdeasphalting
The utilization of this technique allows the determination of the asphaltene fraction in the sample,
not soluble in a specific solvent. The procedure consisted of placing approximately 0.4 g of the
sample in a 100 ml beaker together with 20 ml of pentane. The mixture was digested for 30 min at
50 °C in a heating plate, keeping the beaker covered with a petri dish to minimize solvent losses.
After this time, the content of the beaker was brought to room temperature (about 22 °C) before
proceeding to filter the precipitate using a 0.45 μm porous membrane (GH Polypro 47 mm
Hydrophilic Polypropylene from Pall Corporation). Then, the membrane with the precipitate was
dried in an oven at 100 °C for 5 min, cooled down at room temperature and weighted. By
membrane weight differences, before and after the filtration process, the amount of asphaltenes

69
was determined and related to the initial known mass of sample (Carbognani, et al., 2007). The
relative error associated to this procedure is about 20%.
3.4.8 Elemental analysis (Sulphur and Nitrogen)
Nitrogen and sulphur contents in the liquid sample was quantified with an Antek 900 Series
Nitrogen and Sulphur analyzer. The operation of the equipment consisted in burning at 1100°C a
solution of 0.38 g of sample in 2.62 g of toluene. Hydrocarbons are converted into CO2 and water,
while nitrogen and sulphur oxides are detected through the pyro-chemiluminescent technology and
Pyro-fluorescent technology, found respectively in the equipment. Each sample was automatically
injected several times in order to assure good precision of less than 5% error.
3.4.9 P-value
The asphaltenes in oil can show the tendency to flocculate and precipitate causing several problems
to the oil industry. The P-value method, developed by Shell, asseses the peptization capacity of
the sample that keeps the asphaltenes in suspension; and can be used to calculate and predict the
stability of crude oils (Van Den Berg, et al., 2010). The P-value of an oil sample was obtained
using Eq 3.3. By titrating the same amount of sample, placed in different vials, using different
volumes of hexadecane, the p-value can be determined. After digestion at 100°C for 30 min, each
final solution was analyzed in an optical microscope to observe formation of particles. The known
volume of hexadecane and mass of sample used gives the P-value of the sample. The higher the
amount of solvent required to observe precipitation, the more stable the product is. If the sample
with no solvent added shows the presence of asphaltenes, a P-value equals to one is reported. For
the purpose of analysis of products, a P-value of 1.15 can be considered as the limit of stability
(Higuerey, et al., 2002).
𝑃 − 𝑣𝑎𝑙𝑢𝑒 = 1 + (𝑣𝑜𝑙𝑢𝑚𝑒 𝑜𝑓 𝐻𝑒𝑥𝑎𝑑𝑒𝑐𝑎𝑛𝑒 (𝑚𝑙)
𝑚𝑎𝑠𝑠 𝑜𝑓 𝑠𝑎𝑚𝑝𝑙𝑒 (𝑔)) Eq. 3.3
70
3.4.10 Bromine number
The bromine number is the ASTM standard method widely used in the industry to determine the
amount of unsaturated compounds existing in an oil sample and thus, its potential reactivity. The
magnitude reflects the grams of bromine that reacts with 100 grams of sample under the given
standard conditions of the test. Within the error of the measurement, part of the bromine consumed
is also involved in side reactions with sulphur, nitrogen and oxygen containing compounds. The
method consists of the coulometric monitoring of the incorporation of bromine molecules into
olefins to produce brominated hydrocarbon compounds. The bromine molecules are produced
electrochemically in the electrode from the titrant solution and the titration ends when this halogen
stops being consumed (Taylor, et al., 1992).
This analysis was performed with a T50 Titration Excellence apparatus provided by Mettler
Toledo, which uses Potassium Bromate/Potassium Bromide 0.1 N as titrant. The procedure entails
the filling of the respective vessel with enough solvent to wet the tip of the electrode that is going
to be inserted after. The solvent was a solution prepared out of acetic acid, dichloromethane,
methanol and sulfuric acid. The vessel was then attached to the instrument, introducing the titrant
dispenser tube, the electrode and a magnetic stirrer inside. About 0.05 g of sample was required to
perform the analysis, which was incorporated into the system as a solution of the oil in
dichloromethane. The analysis was always performed at temperatures lower than 3.9°C to inhibit
aromatics and heterocyclics side reactions.
3.4.11 Total Acid Number (TAN)
The amount of naphthenic acids present in the crude oil is commonly expressed as the number of
milligrams of potassium hydroxide required to neutralize the acidity existing in one gram of crude
oil, which is usually defined as Total Acid Number (TAN) (Speight, 2014).

71
The titration was performed with a T50 Titration Excellence apparatus provided by Mettler
Toledo, using a titrant solution of 0.1 M KOH in 2-propanol. A minimum amount of 1 g of sample
was placed in a vessel and diluted with 60 ml of solvent prepared out of toluene, 2-propanol and
water. This solution was placed in the Titration Excellence autosampler with the electrode and
titrant dispenser tube inside. Once the system started pumping titrant, the neutralization reaction
was monitored by potentiometry until the reaction was completed. The amount of titrant used for
this purpose with its respective concentration and the amount of sample used, gave the final Total
Acid Number reported.

72
Catalyst Characterization Results
The synthesis of the catalysts following the methodology presented in Chapter 3, generated the
solids presented in Figure 4.1, in which Cat 1 is NiCsBa-Metakaolin, Cat 2 is NiCe-
Calcined Hydrotalcite, Cat 3 is NiCe-Aegirine, Cat 4 is NiCe-Faujasite and Cat 5 consists of
calcined NiCe-Hydrotalcite plus Mo2C. Once the catalysts were prepared, they were analyzed via
nitrogen adsorption/desorption, temperature programmed reduction and desorption, X-ray
diffraction and X-ray photoelectron spectroscopy. The results obtained by these techniques are
presented in this chapter, as a way to understand the physical-chemical properties of the
synthesized solids.
Figure 4.1. Catalysts after preparation
4.1 Nominal metal composition for each catalyst
Based on the employed reactant weights in the preparation of each catalyst, their purity, their
expected consumption and the final metal oxidation states, the expected metal concentrations were
calculated and presented in Table 4.1. As shown, the catalyst prepared from the calcination of
hydrotalcite (Cat 2) is the one containing the highest amount of Nickel with about 19%, followed
by its combination with molybdenum carbide (Cat 5). The nickel content in the latter is about 3.8
times greater than that in the Cat 1 and about 5.4 times greater than in the one with the lowest
Cat 1
Cat 2
Cat 3
Cat 5
Cat 4
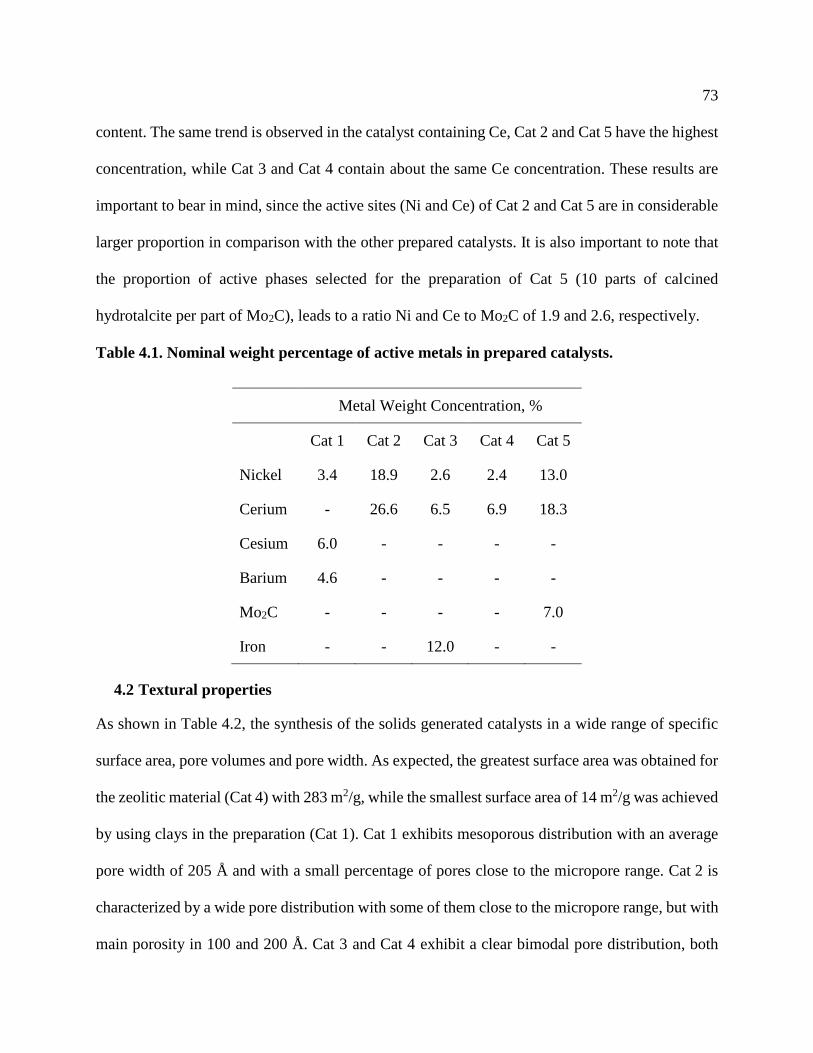
73
content. The same trend is observed in the catalyst containing Ce, Cat 2 and Cat 5 have the highest
concentration, while Cat 3 and Cat 4 contain about the same Ce concentration. These results are
important to bear in mind, since the active sites (Ni and Ce) of Cat 2 and Cat 5 are in considerable
larger proportion in comparison with the other prepared catalysts. It is also important to note that
the proportion of active phases selected for the preparation of Cat 5 (10 parts of calcined
hydrotalcite per part of Mo2C), leads to a ratio Ni and Ce to Mo2C of 1.9 and 2.6, respectively.
Table 4.1. Nominal weight percentage of active metals in prepared catalysts.
Metal Weight Concentration, %
Cat 1 Cat 2 Cat 3 Cat 4 Cat 5
Nickel 3.4 18.9 2.6 2.4 13.0
Cerium - 26.6 6.5 6.9 18.3
Cesium 6.0 - - - -
Barium 4.6 - - - -
Mo2C - - - - 7.0
Iron - - 12.0 - -
4.2 Textural properties
As shown in Table 4.2, the synthesis of the solids generated catalysts in a wide range of specific
surface area, pore volumes and pore width. As expected, the greatest surface area was obtained for
the zeolitic material (Cat 4) with 283 m2/g, while the smallest surface area of 14 m2/g was achieved
by using clays in the preparation (Cat 1). Cat 1 exhibits mesoporous distribution with an average
pore width of 205 Å and with a small percentage of pores close to the micropore range. Cat 2 is
characterized by a wide pore distribution with some of them close to the micropore range, but with
main porosity in 100 and 200 Å. Cat 3 and Cat 4 exhibit a clear bimodal pore distribution, both

74
centered at similar values. In the case of Cat 3, the pore distribution is centered on 35 and 100 Å,
while in Cat 4, it is centered in 35 Å and 90 Å. The variation in the preparation of Cat 2 to generate
Cat 5, modified the surface area and the pore distribution of the solid generated. As it can be
observed, Cat 5 is characterized by lower available surface area, probably because of the
incorporation of kaolin. However, the pore distribution is also wide in this case, but shifted toward
big pores with the average at 165 Å.
Regarding pore volume, Cat 2 and Cat 5 contain the largest pore network in terms of volume per
gram of catalyst. In the case of Cat 1, the pore volume obtained was very small, indicating the
characteristic low porosity of this solid.
Table 4.2. Textural properties of catalysts*
Cat 1 Cat 2 Cat 3 Cat 4 Cat 5
BET Surface Area, m2/g 14 232 180 283 117
Pore Volume, cm3/g 0.08 0.59 0.39 0.14 0.56
Type of Porosity Bimodal Trimodal Bimodal Bimodal Multimodal
Main Pore Widths, Å 35/205 30/100/200 35/100 35/90 35/65/85/165
Avg. Pore Width, Å 205 81 75 70 165
*Adsorption/Desorption curves and pore distribution curves can be found in Appendix B
4.3 Temperature Programmed Reduction (TPR)
The reducibility of the metals contained in each catalyst was evaluated via TPR, from which results
are presented in the following charts (Figure 4.2 to Figure 4.6). Cat 1’s reduction profile (Figure
4.2) exhibits an initial small reducibility at 224°C, but with a main signal centered at 448 °C and
continuous hydrogen uptake between 504°C and 716 °C. In the case of Cat 2 (Figure 4.3), a
considerable amount of hydrogen was consumed between 210 and 533 °C, but the main reduction
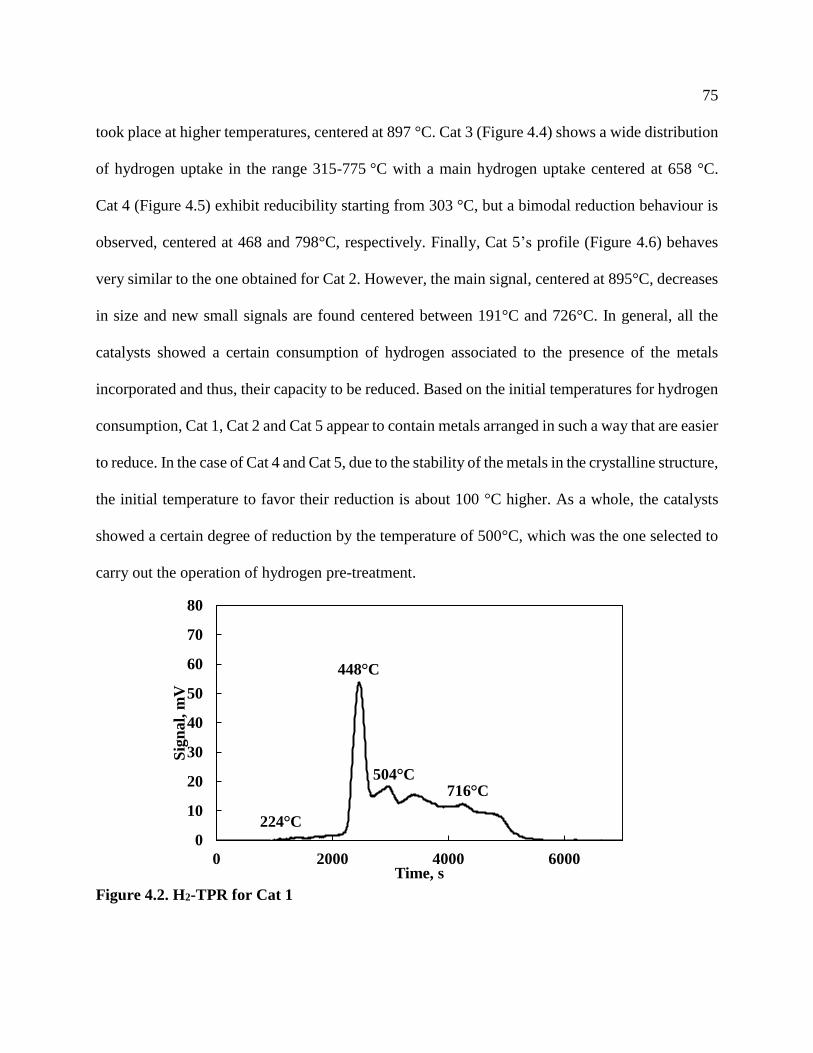
75
took place at higher temperatures, centered at 897 °C. Cat 3 (Figure 4.4) shows a wide distribution
of hydrogen uptake in the range 315-775 °C with a main hydrogen uptake centered at 658 °C.
Cat 4 (Figure 4.5) exhibit reducibility starting from 303 °C, but a bimodal reduction behaviour is
observed, centered at 468 and 798°C, respectively. Finally, Cat 5’s profile (Figure 4.6) behaves
very similar to the one obtained for Cat 2. However, the main signal, centered at 895°C, decreases
in size and new small signals are found centered between 191°C and 726°C. In general, all the
catalysts showed a certain consumption of hydrogen associated to the presence of the metals
incorporated and thus, their capacity to be reduced. Based on the initial temperatures for hydrogen
consumption, Cat 1, Cat 2 and Cat 5 appear to contain metals arranged in such a way that are easier
to reduce. In the case of Cat 4 and Cat 5, due to the stability of the metals in the crystalline structure,
the initial temperature to favor their reduction is about 100 °C higher. As a whole, the catalysts
showed a certain degree of reduction by the temperature of 500°C, which was the one selected to
carry out the operation of hydrogen pre-treatment.
Figure 4.2. H2-TPR for Cat 1
224 C
448 C
504 C716 C
0
10
20
30
40
50
60
70
80
0 2000 4000 6000
Sig
na
l, m
V
Time, s

76
Figure 4.3. H2-TPR for Cat 2
Figure 4.4. H2-TPR for Cat 3
210 C
377 C533 C
897 C
0
50
100
150
200
250
0 2000 4000 6000 8000
Sig
nal,
mV
Time, s
315 C
518 C
658 C
775 C
0
50
100
150
200
250
300
350
0 1000 2000 3000 4000 5000 6000
Sig
nal,
mV
Time, s

77
Figure 4.5. H2-TPR for Cat 4
Figure 4.6. H2-TPR for Cat 5
Based on the H2-TPR results and using the corresponding calibration, the total hydrogen uptake
was calculated and presented in Table 4.3. In the same table, the total dispersion is also presented,
calculated by comparing the experimental hydrogen consumption with the theoretical hydrogen
303 C
468 C
798 C
0
5
10
15
20
25
30
35
40
0 500 1000 1500
Sig
nal,
mV
Time, s
191°C
380°C522°C
726°C
895°C
0
50
100
150
200
250
0 2000 4000 6000
Sig
na
l, m
V
Time, s

78
required to reduce the nominal amount of metals loaded. According to this table, the catalyst
prepared from hydrotalcite (Cat 2) showed the highest hydrogen uptake, which is directly related
to the amount of exposed metal active sites available to perform the reactions. However, based on
calculations for dispersion, only 60 % of the metal loaded is exposed to interact with hydrogen. In
Cat 5, where Ni and Ce from Cat 2 were diluted, the consumption of hydrogen is lower.
Moreover, due to the conservation of their crystalline structures, modified faujasite (Cat 4) and
specially the modified aegirine (Cat 3), showed the best dispersion of the metals among all the
catalysts. The use of a nano powder of NiO in the preparation of Cat 1 influenced the achievement
of a good dispersion of the metal, giving a value of 70%.
Table 4.3. Hydrogen uptake per gram of catalyst
Catalyst Hydrogen Uptake, μmol-
H2/g Cat
*Dispersion, %
Cat 1 398 69.0
Cat 2 2487 59.6
Cat 3 1663 95.4
Cat 4 509 77.0
Cat 5 1567 54.5
*Calculated from theoretical reduction of total metal existing in the catalyst
4.4 Temperature Programmed Desorption of Ammonia (TPD)
The evaluation of the catalysts via ammonia TPD allowed the determination of their total acidity
(Bronsted and Lewis) and their possibility to undertake catalytic cracking of hydrocarbons. In the
case of Cat 1, the adsorption of ammonia on the surface of the catalyst could not be achieved, as a
clear indication of the absence of acid sites in the catalyst. This result agrees with previous
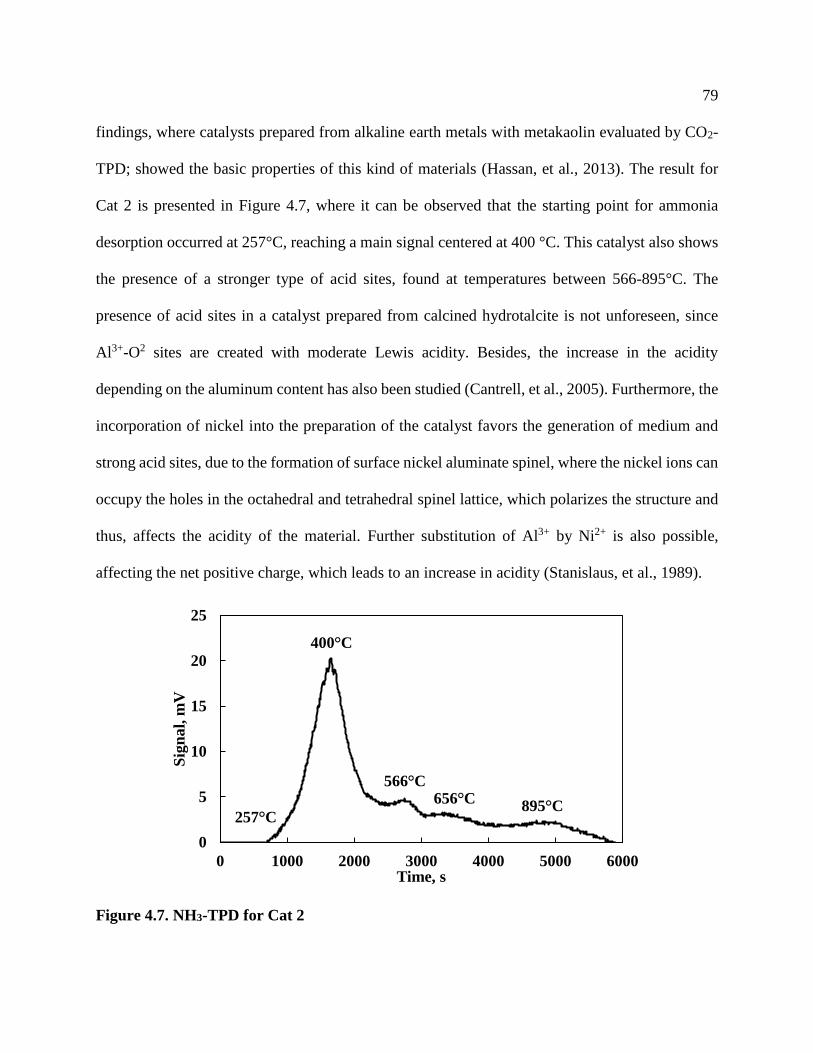
79
findings, where catalysts prepared from alkaline earth metals with metakaolin evaluated by CO2-
TPD; showed the basic properties of this kind of materials (Hassan, et al., 2013). The result for
Cat 2 is presented in Figure 4.7, where it can be observed that the starting point for ammonia
desorption occurred at 257°C, reaching a main signal centered at 400 °C. This catalyst also shows
the presence of a stronger type of acid sites, found at temperatures between 566-895°C. The
presence of acid sites in a catalyst prepared from calcined hydrotalcite is not unforeseen, since
Al3+-O2 sites are created with moderate Lewis acidity. Besides, the increase in the acidity
depending on the aluminum content has also been studied (Cantrell, et al., 2005). Furthermore, the
incorporation of nickel into the preparation of the catalyst favors the generation of medium and
strong acid sites, due to the formation of surface nickel aluminate spinel, where the nickel ions can
occupy the holes in the octahedral and tetrahedral spinel lattice, which polarizes the structure and
thus, affects the acidity of the material. Further substitution of Al3+ by Ni2+ is also possible,
affecting the net positive charge, which leads to an increase in acidity (Stanislaus, et al., 1989).
Figure 4.7. NH3-TPD for Cat 2
257 C
400 C
566 C656 C
895 C
0
5
10
15
20
25
0 1000 2000 3000 4000 5000 6000
Sig
nal,
mV
Time, s

80
Cat 3 (Figure 4.8), in comparison with Cat 2, showed weaker acid sites that started desorbing
ammonia at 196°C and presented a maximum at 287°C. However, Cat 3 contains a proportion of
acid sites of similar strength to those in Cat 2, the desorption of which took place with a maximum
centered at 899°C.
Figure 4.8. NH3-TPD for Cat 3
Desorption of ammonia in Cat 4 (Figure 4.9) occurred in a similar way than for Cat 3 for the first
1500 s of evaluation. The initial desorption and the maximum peaks were reached at about the
same temperature, which indicates similar strength in acid sites. However, the strength of the
following sites was different in both cases. In the case of Cat 4, the rest of the acid sites desorbed
steadily between 484 and 890°C, with a signal in each mentioned temperature.
196 C
287 C
899 C
0
0.4
0.8
1.2
1.6
2
0 2000 4000 6000 8000
Sig
nal,
mV
Time, s

81
Figure 4.9. NH3-TPD for Cat 4
The modification done to the preparation of Cat 2 to synthesize Cat 5, plus the addition of extra
components, altered considerably the profile obtained for the desorption of ammonia, indicating a
noticeable change in total acid distribution. The initial temperature of desorption and peaks
occurring at the beginning of the evaluated catalysts remained very similar, giving a maximum
centered at 430 °C in this case. However, different stronger sites were developed in Cat 5, showing
peaks of desorption centered at 775 and 897 °C. This modification of desorption profile can be
attributed to the interaction created by the incorporation of the silica solution to the calcined
hydrotalcite, rich in amorphous alumina. By this means, the alumina was hydrolyzed and
submitted to a condensation process with hydroxyl groups of the incomplete polymerized silica
solution. As a consequence, a deficiency of positive charge was created in the four-coordinated
aluminium atom, which generates a Lewis acid site (an electron pair acceptor). In solution, this
pair of electrons is donated by water (Tamele, 1950). On the other hand, due to this alumina-silica
interaction, an increase on the strength of the acidity is expected after a thermal treatment, such as
190 C
284 C
484 C
890 C
0
2
4
6
8
10
12
14
0 2000 4000 6000
Sig
nal,
mV
Time, s

82
the one conducted before reaction. The increase in temperature can be a factor in the formation of
strong Brønsted sites, generated by the migration of aluminum atoms and substitution into the
silica structure, which generates a negative charge that requires compensation by protons (Hensen,
et al., 2010).
In general, all the catalysts show the existence of strong acid sites that desorb at temperatures
ranging between 890-900°C, which by comparison of signals, Cat 5 seems to contain the highest
proportion of this type of acid sites.
Figure 4.10. NH3-TPD for Cat 5
Table 4.4 represents the final total amounts of desorbed ammonia obtained for each catalyst. From
these results, the catalyst containing the highest amount of acid sites was Cat 5, followed by Cat 4
and Cat 2. Except for Cat 1 that contains no acidity, Cat 3 is the one with the lowest amount of
acid sites, due to the fact that most of the acidity was induced via ion exchange of sodium, restricted
to a maximum of 30% exchangeable. Originally, the prepared aegirine only accounted for Lewis
type acidity. In the case of Cat 4, the acidity comes from Brønsted acids generated by the
274 C
430 C
775 C
897 C
897 C
0
5
10
15
20
25
30
35
0 2000 4000 6000 8000 10000 12000
Sig
nal,
mV
Time, s

83
hydroxylation of the compensation cations. Besides, ion exchanged rare earths like Ce are also
able to present Lewis acidity when zeolites are dehydrated (Ward, 1969).
Table 4.4. Ammonia desorption quantities for catalysts evaluated
Catalyst Ammonia Desorbed, μmol-
Ammonia/g Cat
Cat 1 17
Cat 2 2134
Cat 3 374
Cat 4 2205
Cat 5 5631
4.5 Powder X-Ray Diffraction (XRD)
The powder analysis for Cat 1 via XRD generated the result presented in Figure 4.11. Due to the
calcination conditions used for Cat 1, the kaolinite added to the catalyst becomes amorphous
(known as metakaolin) and it was no longer observed in the XRD diffractogram. However, some
traces of existing contamination with a crystalline potassium aluminosilicate remained stable even
after the treatment at 650°C. The presence of Cs oxide (PDF#00-009-0104) could not be assessed
with the XRD, probably due to the low concentration present in the material, but some Barium
oxide (PDF#01-071-3780) can be suggested as present in the diffractogram at about 55 degrees of
2-theta. Nickel oxide (PDF#01-075-0269) is also clearly identified in the diffractogram with large
and thin peaks, giving a crystalline domain size in the range of 12±4 nm.
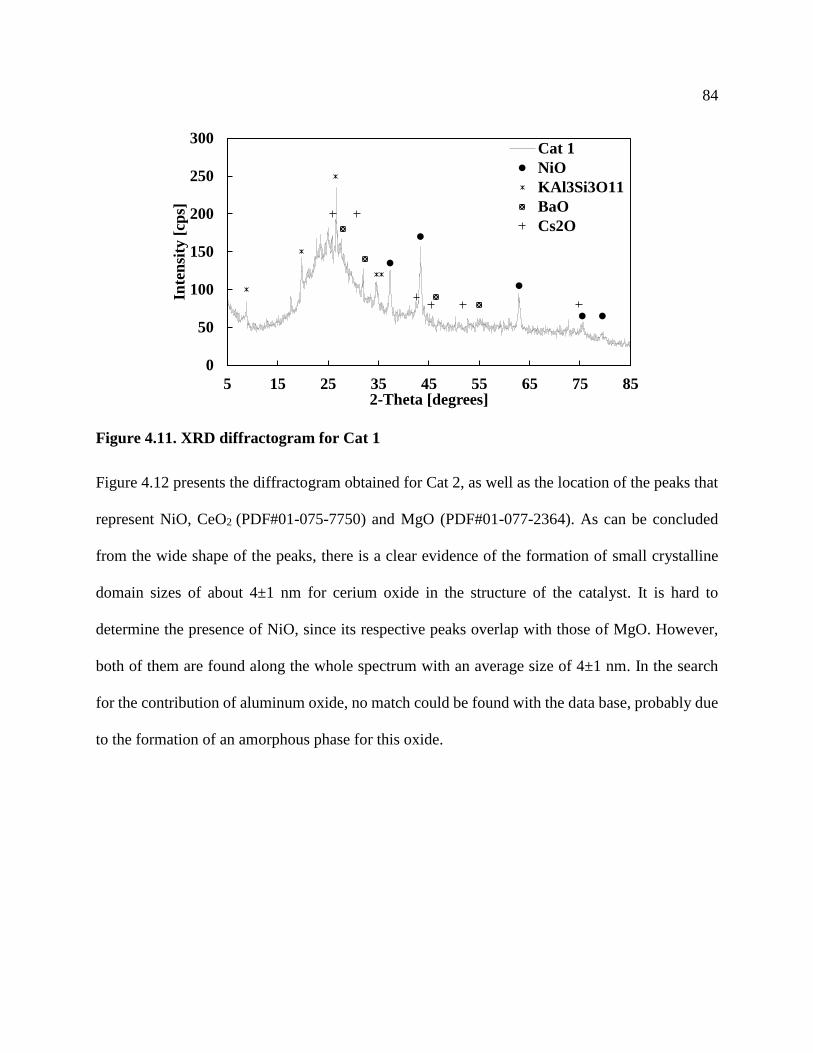
84
Figure 4.11. XRD diffractogram for Cat 1
Figure 4.12 presents the diffractogram obtained for Cat 2, as well as the location of the peaks that
represent NiO, CeO2 (PDF#01-075-7750) and MgO (PDF#01-077-2364). As can be concluded
from the wide shape of the peaks, there is a clear evidence of the formation of small crystalline
domain sizes of about 4±1 nm for cerium oxide in the structure of the catalyst. It is hard to
determine the presence of NiO, since its respective peaks overlap with those of MgO. However,
both of them are found along the whole spectrum with an average size of 4±1 nm. In the search
for the contribution of aluminum oxide, no match could be found with the data base, probably due
to the formation of an amorphous phase for this oxide.
0
50
100
150
200
250
300
5 15 25 35 45 55 65 75 85
Inte
nsi
ty [
cps]
2-Theta [degrees]
Cat 1
NiO
KAl3Si3O11
BaO
Cs2O

85
Figure 4.12. XRD diffractogram for Cat 2
The XRD diffractogram for Cat 3 shown in Figure 4.13, represents clearly the crystalline structure
of the Aegirine (PDF#00-034-0185) with average crystalline domain size of 7±2 nm. The
methodology followed for the preparation of Cat 3, incorporated cerium atoms inside the
crystalline framework, reason why it should not be clearly found the presence of cerium oxide in
the diffractogram, unless some cerium remained outside of the structure and sintered into larger
material than 3 nm, which is the smallest size detectable for mixed compunds with the XRD
methodology followed. In such a case, as occurring with nickel oxide, identifying them becomes
a very difficult task due to the population of the chart with peaks corresponding to the aegirine.
Moreover, the proper wet impregnation of the aegirine with nickel nitrates generated a well
dispersed nickel making NiO, if present, not identifiable by XRD.
0
50
100
150
200
250
300
350
5 15 25 35 45 55 65 75 85
Inte
nsi
ty [
cps]
2-Theta [degrees]
Cat 2NiOCeO2MgO
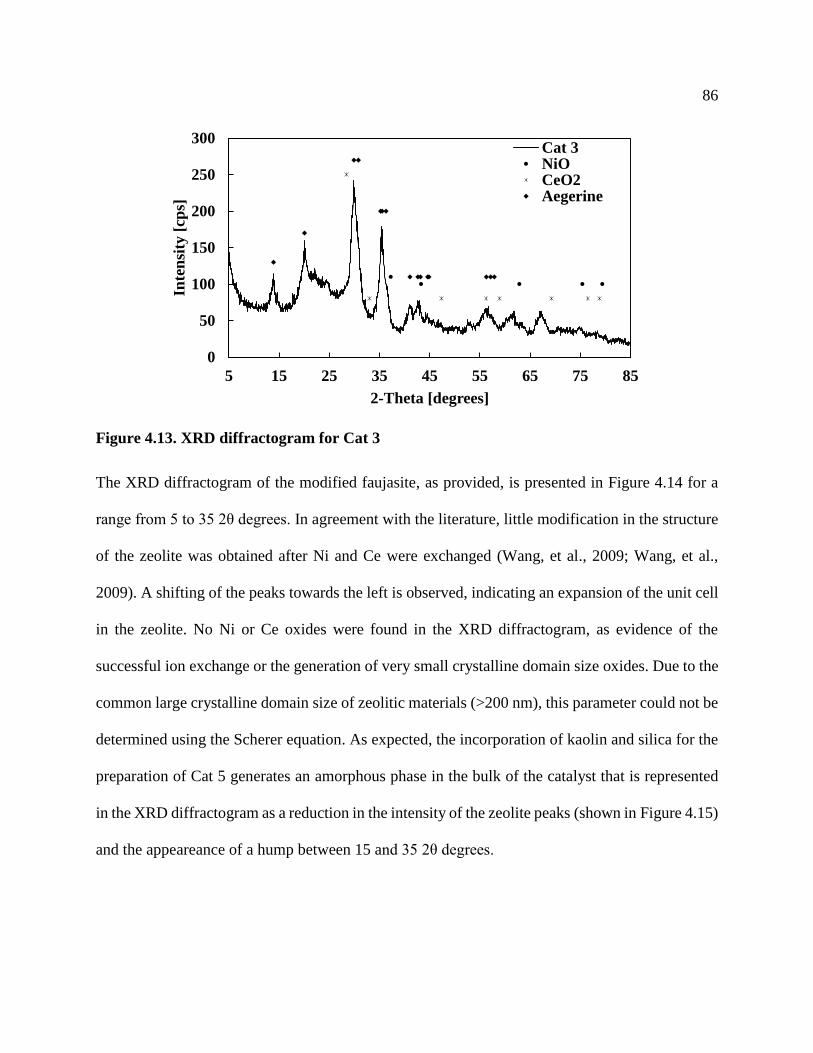
86
Figure 4.13. XRD diffractogram for Cat 3
The XRD diffractogram of the modified faujasite, as provided, is presented in Figure 4.14 for a
range from 5 to 35 2θ degrees. In agreement with the literature, little modification in the structure
of the zeolite was obtained after Ni and Ce were exchanged (Wang, et al., 2009; Wang, et al.,
2009). A shifting of the peaks towards the left is observed, indicating an expansion of the unit cell
in the zeolite. No Ni or Ce oxides were found in the XRD diffractogram, as evidence of the
successful ion exchange or the generation of very small crystalline domain size oxides. Due to the
common large crystalline domain size of zeolitic materials (>200 nm), this parameter could not be
determined using the Scherer equation. As expected, the incorporation of kaolin and silica for the
preparation of Cat 5 generates an amorphous phase in the bulk of the catalyst that is represented
in the XRD diffractogram as a reduction in the intensity of the zeolite peaks (shown in Figure 4.15)
and the appeareance of a hump between 15 and 35 2θ degrees.
0
50
100
150
200
250
300
5 15 25 35 45 55 65 75 85
Inte
nsi
ty [
cps]
2-Theta [degrees]
Cat 3NiOCeO2Aegerine

87
Figure 4.14. XRD diffractogram for as provided FAU.
Figure 4.15. XRD diffractogram for Cat 4.
The thermal treatment of the precursor used to prepare molybdenum carbide, generated the
diffractogram presented in Figure 4.16. As it can be concluded, molybdenum carbide with the
cubic phase (PDF#00-015-0457) was obtained with very small crystalline domain size of 1.8±0.3
nm. However, the thermal treatment was not 100% effective, since traces of MoO2
0
1000
2000
3000
4000
5000
5 10 15 20 25 30 35
Inte
nsi
ty [
cps]
2-Theta [degrees]
Natural FAU
Synthesized FAU
0
200
400
600
800
1000
1200
1400
5 10 15 20 25 30 35
Inte
nsi
ty [
cps]
2-Theta [degrees]
Cat 4
Faujasite

88
(PDF#01-073-1249) were observed as side product. The preparation of Cat 5, by mixing the NiCe
calcined hydrotalcite with molybdenum carbide, kaolin and silica generated the product analyzed
in Figure 4.17. In the same figure, it is also presented the XRD pattern obtained for the catalyst
after reduction with hydrogen at 500 °C, as done during the operation in the pilot plant. The results
highlight the presence of kaolinite in the catalyst bulk of Cat 5 fresh, which was dehydroxilated
after the thermal treatment producing the amorphous metakaolin. Once the kaolinite was converted
into metakaolin, the final XRD pattern for Cat 5 looks very similar to the one obtained for Cat 2,
where cerium oxide is easy to identify, as well as nickel/magnesium oxide. In this case, Mo2C
peaks also overlap with those peaks of Nickel and Magnesium oxide, which makes it hard for
identification.
Figure 4.16. XRD for Molybdenum Carbide.
0
20
40
60
80
100
5 25 45 65 85
Inte
nsi
ty [
cps]
2-Theta [degrees]
Mo2C PreparedMo2C-CubicMoO2
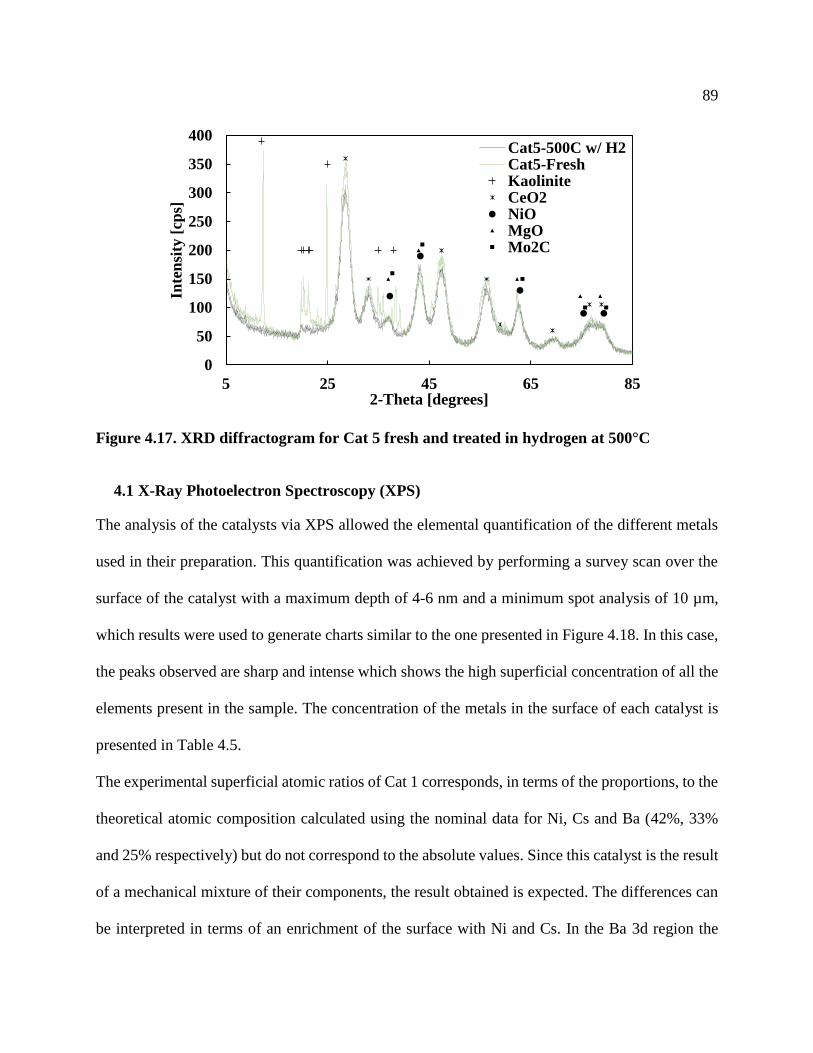
89
Figure 4.17. XRD diffractogram for Cat 5 fresh and treated in hydrogen at 500°C
4.1 X-Ray Photoelectron Spectroscopy (XPS)
The analysis of the catalysts via XPS allowed the elemental quantification of the different metals
used in their preparation. This quantification was achieved by performing a survey scan over the
surface of the catalyst with a maximum depth of 4-6 nm and a minimum spot analysis of 10 µm,
which results were used to generate charts similar to the one presented in Figure 4.18. In this case,
the peaks observed are sharp and intense which shows the high superficial concentration of all the
elements present in the sample. The concentration of the metals in the surface of each catalyst is
presented in Table 4.5.
The experimental superficial atomic ratios of Cat 1 corresponds, in terms of the proportions, to the
theoretical atomic composition calculated using the nominal data for Ni, Cs and Ba (42%, 33%
and 25% respectively) but do not correspond to the absolute values. Since this catalyst is the result
of a mechanical mixture of their components, the result obtained is expected. The differences can
be interpreted in terms of an enrichment of the surface with Ni and Cs. In the Ba 3d region the
0
50
100
150
200
250
300
350
400
5 25 45 65 85
Inte
nsi
ty [
cps]
2-Theta [degrees]
Cat5-500C w/ H2Cat5-FreshKaoliniteCeO2NiOMgOMo2C

90
calcined sample shows a Ba 3d5/2 peak at 780.85 eV attributed to BaCO3 (Moulder, et al., 1995).
The Cs 3d5/2 spectrum of the sample exhibits a peak at 724.7 eV that is an intermediate magnitude
between the values found for thin surface layers of cesium oxide and peroxide on various substrates
(725.2 and 724.5 eV for Cs2O and Cs2O2, respectively) (Larichev, et al., 2007).
For the Ni-Ce containing catalysts, their metal proportions were calculated and compared with the
one obtained from the respective nominal values (shown in Table 4.5). These results show the
occurrence of metal migration to the surface of the catalyst, which is observed as an increment in
the composition of some metals and a decrease of some others. In the case of Cat 2, the Ni/Ce
proportion is strongly reduced by about 92%, while in Cat 3 the same behaviour is observed but
in lower proportion (about 47% reduction). As a consequence, the surface of the catalyst is
enriched with Ce atoms. On the contrary, for Cat 4 and Cat 5 the experimental Ni/Ce ratios are
much higher than the nominal one, which is an indication of the high nickel content on the surface
of the solids. For Cat 4, the content of nickel on the surface was increased almost ten times with
respect to the nominal value, while in Cat 5 the increase was about 6 times. It is interesting to note
that the slight variation in the preparation of Cat 5, with respect to Cat 2, generated as a
consequence the population of the surface of Cat 5 with nickel atoms.

91
Figure 4.18. Survey scan for Cat 1
Table 4.5. Experimental surface atomic composition of metals on the catalysts
Cat. Ni
(%)
Ba
(%)
Cs
(%)
Al
(%)
Mg
(%)
Ce
(%)
Si
(%)
Fe
(%)
Zr
(%)
Mo
(%)
Ni/Ce
(Nom.)
Ni/Ce
(XPS)
1 58.6 26.0 15.4 - - - - - - - - -
2 <0.1 - - 63.3 36.1 0.7 - - - - 1.7 0.14
3 0.3 - - - - 0.6 95.5 2.9 0.6 - 0.95 0.5
4 2.3 - - 18.9 - 0.3 78.5 - - - 0.83 7.7
5 1.0 - - 53.9 44.0 <0.1 - - - 1.0 1.7 10
4.1.1 Decomposition of Ni 2p3/2
Figure 4.19 represents the XPS spectra for Ni 2p3/2 for each one of the catalysts evaluated. The
binding energy values are presented in Table 4.6. In all cases, the Ni 2p spectra correspond to
nickel in the Ni2+ state. The presence of intensive “shake up” satellites located 6 eV apart from the
main peak supports this assignment (Khasin, et al., 2006). In the case of Cat 1, the spectrum shows
a Ni 2p3/2 at 854.70 eV which can be assigned to Ni in bulk NiO (Andonova, et al., 2011). For
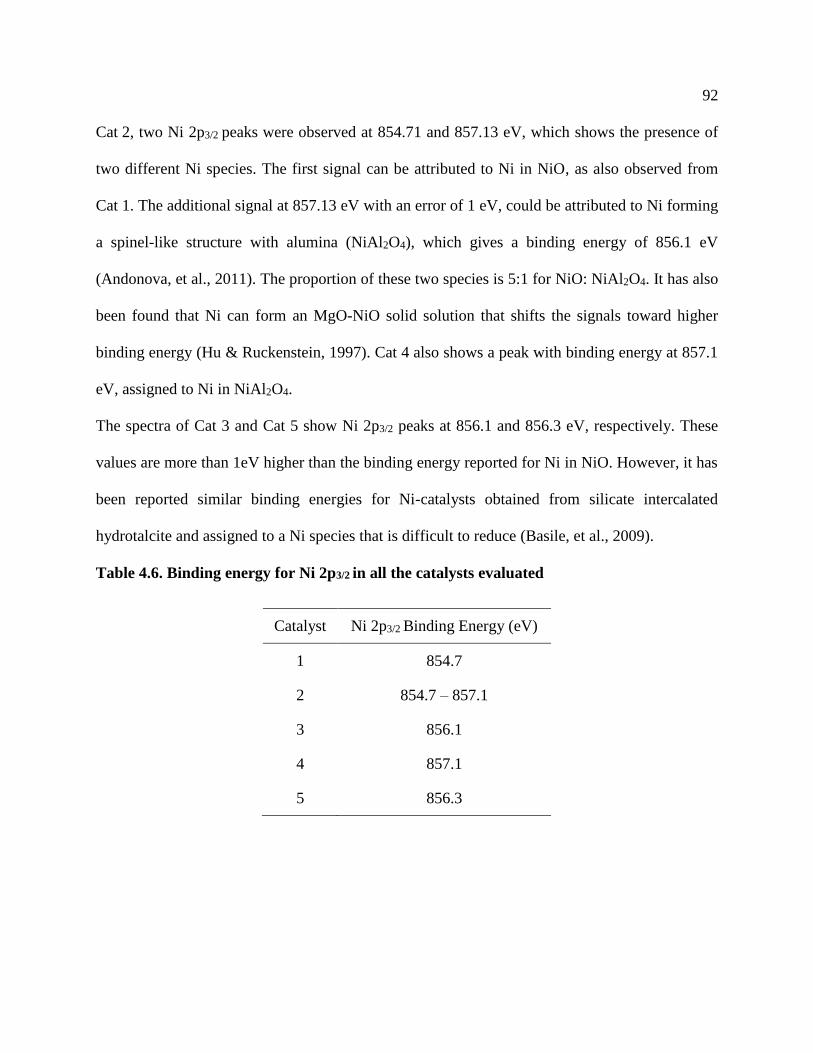
92
Cat 2, two Ni 2p3/2 peaks were observed at 854.71 and 857.13 eV, which shows the presence of
two different Ni species. The first signal can be attributed to Ni in NiO, as also observed from
Cat 1. The additional signal at 857.13 eV with an error of 1 eV, could be attributed to Ni forming
a spinel-like structure with alumina (NiAl2O4), which gives a binding energy of 856.1 eV
(Andonova, et al., 2011). The proportion of these two species is 5:1 for NiO: NiAl2O4. It has also
been found that Ni can form an MgO-NiO solid solution that shifts the signals toward higher
binding energy (Hu & Ruckenstein, 1997). Cat 4 also shows a peak with binding energy at 857.1
eV, assigned to Ni in NiAl2O4.
The spectra of Cat 3 and Cat 5 show Ni 2p3/2 peaks at 856.1 and 856.3 eV, respectively. These
values are more than 1eV higher than the binding energy reported for Ni in NiO. However, it has
been reported similar binding energies for Ni-catalysts obtained from silicate intercalated
hydrotalcite and assigned to a Ni species that is difficult to reduce (Basile, et al., 2009).
Table 4.6. Binding energy for Ni 2p3/2 in all the catalysts evaluated
Catalyst Ni 2p3/2 Binding Energy (eV)
1 854.7
2 854.7 – 857.1
3 856.1
4 857.1
5 856.3

93
Figure 4.19. Decomposition of Ni 2p3/2 for all catalysts

94
4.1.2 Decomposition of Ce 3d5/2
The XPS spectra of Ce 3d5/2 signal for Cat 2, Cat 3, Cat 4 and Cat 5 can be found in Figure 4.20.
It is well known that the Ce 3d5/2 spectrum is composed of three signals in the case of CeO2 and
two signals for Ce2O3 (Romeo, et al., 1993). In the case of the charts presented in Figure 4.20, it is
possible to observe the existence of five signals, indicating the partial reduction state of Ce atoms
present in these samples. However, the detailed characterization of these signals becomes a
difficult task, since up to ten peaks are detected, taking into account the spin-orbit coupling. In the
case of Cat 2 and Cat 5, an additional signal due to a Ni 2p satellite is also observed at ≈ 878.39
eV. The detailed binding energy obtained for each of the signals detected is presented in Table 4.7.
According to this table and using the Ce3+/Ce4+ ratio, Cat 3 is characterized with the lowest content
of Ce3+ and Cat 4 with the highest. Therefore, Cat 4 followed by Cat 5 might have higher activity
for water activation at the initial stage of the process among the Ce containing catalysts, while Cat
3 might have the lowest capability.
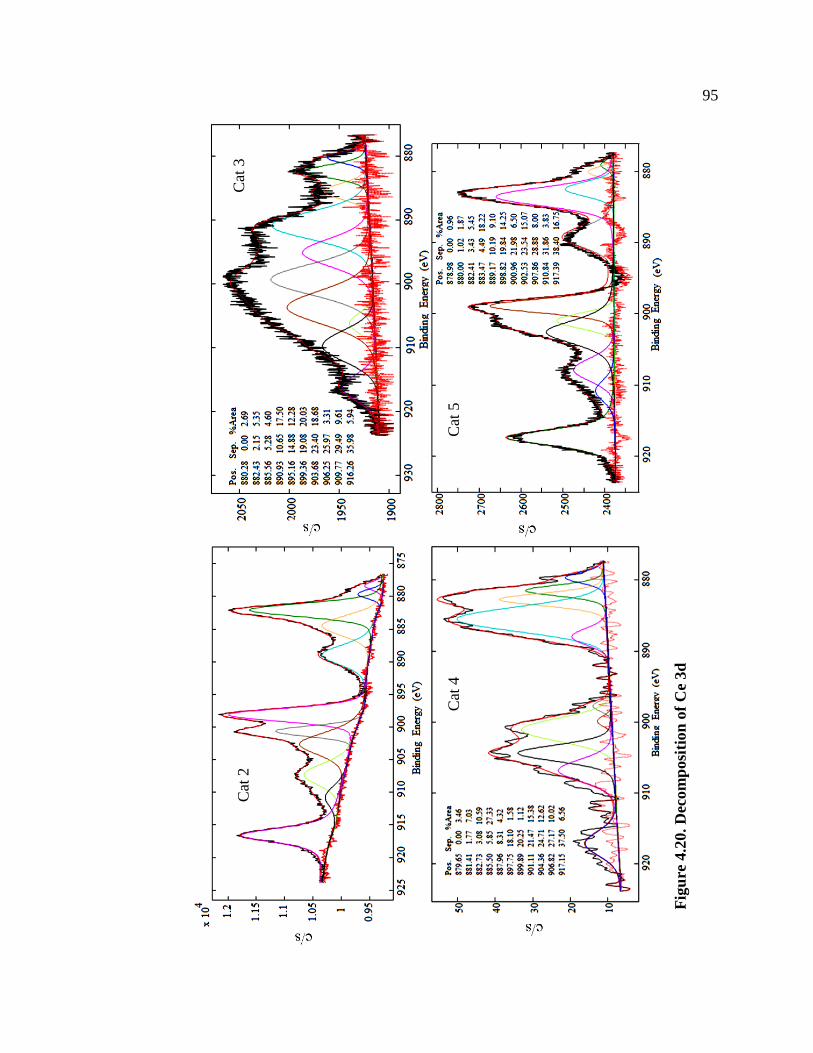
95
Cat
3
Cat
2
Cat
4
Cat
5
Fig
ure
4.2
0.
Dec
om
posi
tion
of
Ce
3d

96
Table 4.7. Binding energies for Ce 3d5/2 signals
From this detailed analysis of the adsorptive, structural and surface chemical characteristic of the
five catalyst tested, it can be concluded that Cat 2, Cat 3 and Cat 5 could have hydrogenating
capabilities at temperature lower than 400°C (from TPR), in particular Cat 5 in which Ni migrated
in abundance to the surface of the catalyst (from XPS). Also, Cat 5 could have higher tendency to
hydrocarbon cracking (from TPD). The complexity of the superficial Ce+n signals makes it difficult
to derive conclusions on the water activation possibilities of the catalysts, making the reactive and
stability evaluation of the catalysts a necessity.
Binding energies, eV
Cat 2 Cat 3 Cat 4 Cat 5 Ce3+ in
CePO4*
Ce4+ in
CeO2*
Ce3+
879.66
884.48
898.16
907.25
880.28
885.56
895.16
906.25
881.41
885.50
897.75
904.36
800.00
883.47
898.82
902.53
880.9
885.2
899.1
903.4
-
Ce4+
882.09
888.96
900.66
902.59
910.58
916.57
882.43
890.93
899.36
903.68
909.77
916.26
882.73
887.96
899.89
901.11
906.82
917.15
882.41
889.17
900.96
907.86
910.84
917.38
-
882.7
888.5
898.3
901.3
907.3
916.9
Ce3+/ Ce4+
ratio 0.66 0.30 1.01 0.75 - -
*Beche, et al., 2008
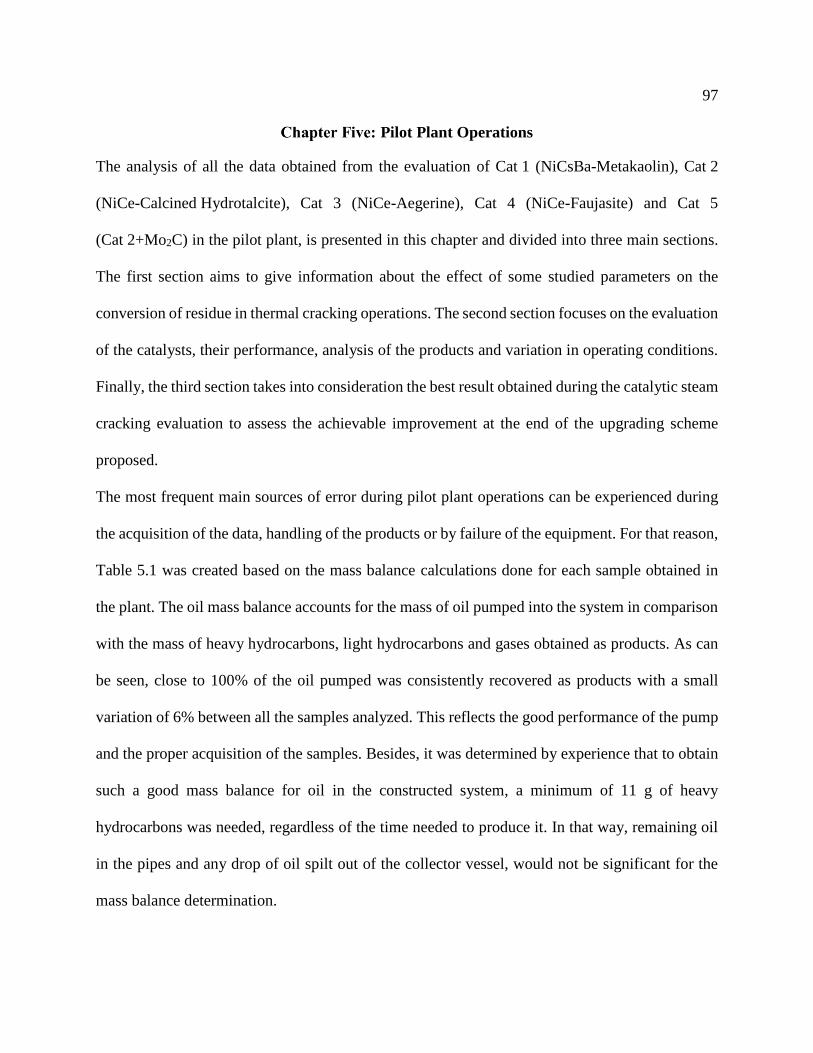
97
Pilot Plant Operations
The analysis of all the data obtained from the evaluation of Cat 1 (NiCsBa-Metakaolin), Cat 2
(NiCe-Calcined Hydrotalcite), Cat 3 (NiCe-Aegerine), Cat 4 (NiCe-Faujasite) and Cat 5
(Cat 2+Mo2C) in the pilot plant, is presented in this chapter and divided into three main sections.
The first section aims to give information about the effect of some studied parameters on the
conversion of residue in thermal cracking operations. The second section focuses on the evaluation
of the catalysts, their performance, analysis of the products and variation in operating conditions.
Finally, the third section takes into consideration the best result obtained during the catalytic steam
cracking evaluation to assess the achievable improvement at the end of the upgrading scheme
proposed.
The most frequent main sources of error during pilot plant operations can be experienced during
the acquisition of the data, handling of the products or by failure of the equipment. For that reason,
Table 5.1 was created based on the mass balance calculations done for each sample obtained in
the plant. The oil mass balance accounts for the mass of oil pumped into the system in comparison
with the mass of heavy hydrocarbons, light hydrocarbons and gases obtained as products. As can
be seen, close to 100% of the oil pumped was consistently recovered as products with a small
variation of 6% between all the samples analyzed. This reflects the good performance of the pump
and the proper acquisition of the samples. Besides, it was determined by experience that to obtain
such a good mass balance for oil in the constructed system, a minimum of 11 g of heavy
hydrocarbons was needed, regardless of the time needed to produce it. In that way, remaining oil
in the pipes and any drop of oil spilt out of the collector vessel, would not be significant for the
mass balance determination.

98
The results obtained for the water mass balance were lower than expected, since in general 81%
of the water was recovered with an important variation of 16%. These low recoveries for water are
related to the very little amount of water injected and handled at the end as product. In most cases,
the time selected only allowed the recovero of as much as 1 ml of water sample. Therefore, any
minimum amount of water lost by handling or evaporation would mean an important variation in
the mass balance. Additionally, the mass balance for water does not account for the amount of
water consumed during reaction, which is transferred to the hydrocarbon products and the gases.
Therefore, this might be another reason for the obtained low mass balance for water. Nevertheless,
the employed syringe pump for water and oil are very reliable. They work by volume difference
and thus, the volume of fluid pumped into the plant is exactly the same as that obtained from the
volume variation in the syringe. Notwithstanding this, in general, 97% of all the reactants injected
into the system were recovered at the end of the process, with a small variation of 8% among all
the samples evaluated.
Table 5.1. Average mass balances obtained along all the performed runs
Thermal Runs Catalytic Runs All Runs
Avg. Oil Mass Balance, % 103±6 100±6 101±6
Avg. Water Mass Balance, % 76±15 85±16 81±16
Avg. Global Mass Balance, % 102±5 96±8 97±8
5.1 Thermal steam cracking
The proper evaluation of the catalytic activity of the solids developed in the laboratory, requires
an initial understanding of the residence time and thermal effect on the conversion of molecules
existing in the used feedstock, especially on those heavy molecules located within the residue

99
fraction (>560°C). In order to obtain this knowledge, it was necessary to operate the designed plant
with the 3/8’’reactor free of catalyst and filled only with an inert material (washed carborundum).
In this way, flow patterns and residence times of the oil in the reactor were kept relatively constant,
by having solids that approximately simulate the catalytic bed but with no effect on the conversion
of the hydrocarbon molecules. In order to obtain a weight hourly space velocity (WHSV) of
reference for each used flowrate for the thermal runs, a mass of catalyst of 3.5 g was assumed for
the calculations, which together with its corresponding oil flowrate, allowed the determination of
a value for WHSV that can be used to compare with catalytic runs.
As shown in Figure 5.1, the thermal experiments involved seven runs (black dots) with
temperatures in the range of 360-400°C, and with space velocities between 0.5 and 1.5 h-1.
Intermediate values were linearly interpolated, while conversion at 360°C/WHSV=1.5 h-1 and
400°C/WHSV=0.5 h-1 were linearly extrapolated from the experimental data obtained. The surface
chart is in agreement with what is expected, increases in space velocity leads to lower residence
time of the oil in the reactor and thus, less time for the molecules to be cracked. On the other hand,
increases in temperature favor the rupture of C-C, C-H and C-heteroatom bonds by producing free
reactive radicals, which is reflected in a reduction of the residue content in the oil. Therefore, the
final conversion of residue and product distribution is highly dependent on the severity of the
process, expressed as residence time-temperature combination (del Bianco, et al., 1993). It is also
interesting to note the sensitivity of the system toward temperature changes, especially over the
residue conversion. Taking the point 380°C/WHSV=1.0 h -1 as reference, large variations in space
velocity of about 50% can lead to a decrease in conversion of 8 points or an increases of 16 points.
Conversely, improvements in the residue conversion of 23 points or reduction of 12 points can be
achieved with a variation in the temperature as small as 20°C (3% variation in Kelvin units). For

100
that reason, it is important to have a good control of the temperature during the operation of the
reactor in order to obtain the degree of thermal cracking expected for each condition.
Figure 5.1. Effect of temperature and residence time over the residue conversion in thermal
cracking
The results of the analytics performed to the products generated in the plant are presented in Figure
5.2 to Figure 5.5 (API, viscosity, asphaltenes and microcarbon vs. residue conversion). According
to the results obtained, the API can be estimated from a linear regression with an R2 of 93%. The
final two points of the chart, seem to deviate slightly from the trend generated by the rest of them.
The very final point corresponds to a conversion of 42% of residue, where the presence of
precipitated asphaltenes was observed by optical microscope analysis. Therefore, the analytics of
this sample might be affected by the fact that it was not completely homogeneous.
0.5
0.75
1
1.25
1.5
360
370
380
390
4000
10
20
30
40
50
60
WHSV, h-1Temperature, Degree C
Resi
du
e C
on
versi
on
, %
0
5
10
15
20
25
30
35
40
45
50
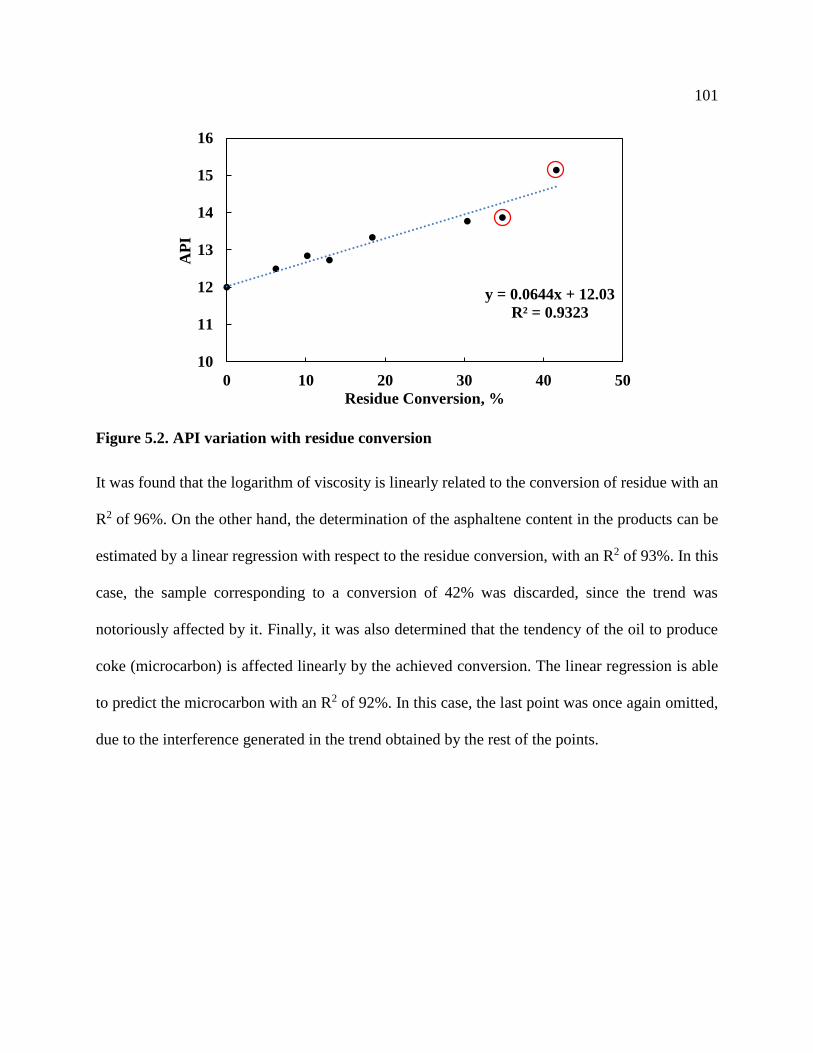
101
Figure 5.2. API variation with residue conversion
It was found that the logarithm of viscosity is linearly related to the conversion of residue with an
R2 of 96%. On the other hand, the determination of the asphaltene content in the products can be
estimated by a linear regression with respect to the residue conversion, with an R2 of 93%. In this
case, the sample corresponding to a conversion of 42% was discarded, since the trend was
notoriously affected by it. Finally, it was also determined that the tendency of the oil to produce
coke (microcarbon) is affected linearly by the achieved conversion. The linear regression is able
to predict the microcarbon with an R2 of 92%. In this case, the last point was once again omitted,
due to the interference generated in the trend obtained by the rest of the points.
y = 0.0644x + 12.03
R² = 0.9323
10
11
12
13
14
15
16
0 10 20 30 40 50
AP
I
Residue Conversion, %
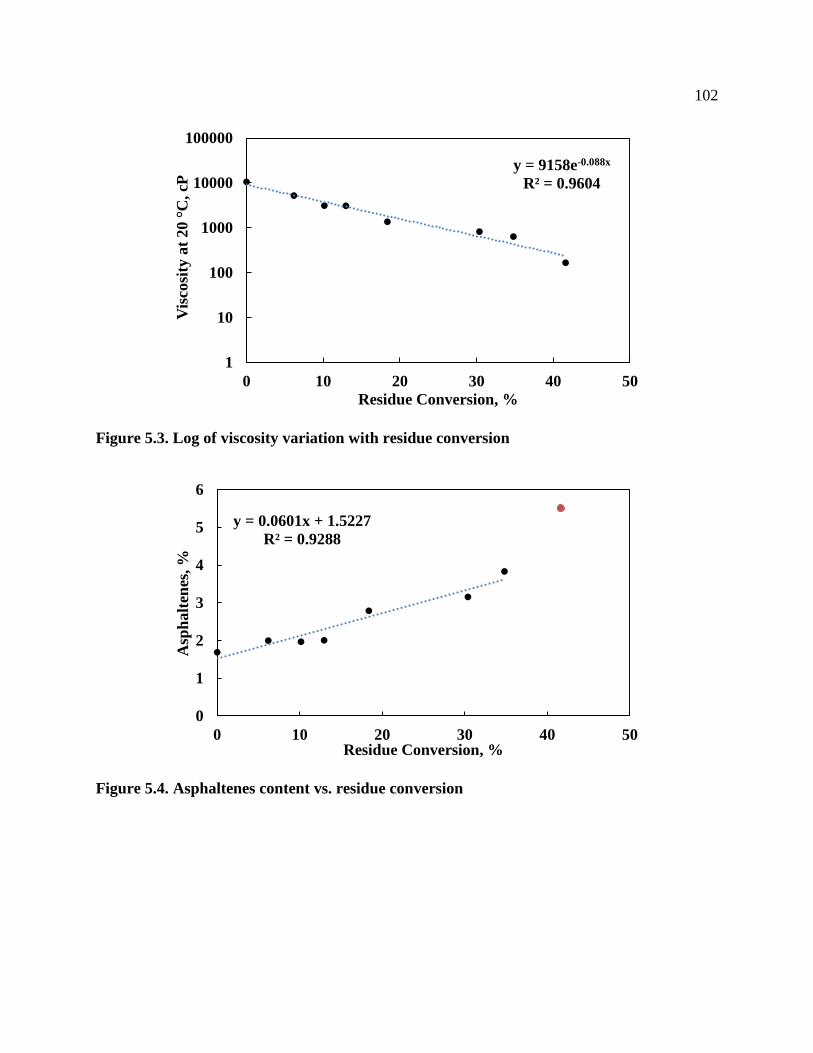
102
Figure 5.3. Log of viscosity variation with residue conversion
Figure 5.4. Asphaltenes content vs. residue conversion
y = 9158e-0.088x
R² = 0.9604
1
10
100
1000
10000
100000
0 10 20 30 40 50
Vis
cosi
ty a
t 20
C, cP
Residue Conversion, %
y = 0.0601x + 1.5227
R² = 0.9288
0
1
2
3
4
5
6
0 10 20 30 40 50
Asp
halt
enes
, %
Residue Conversion, %
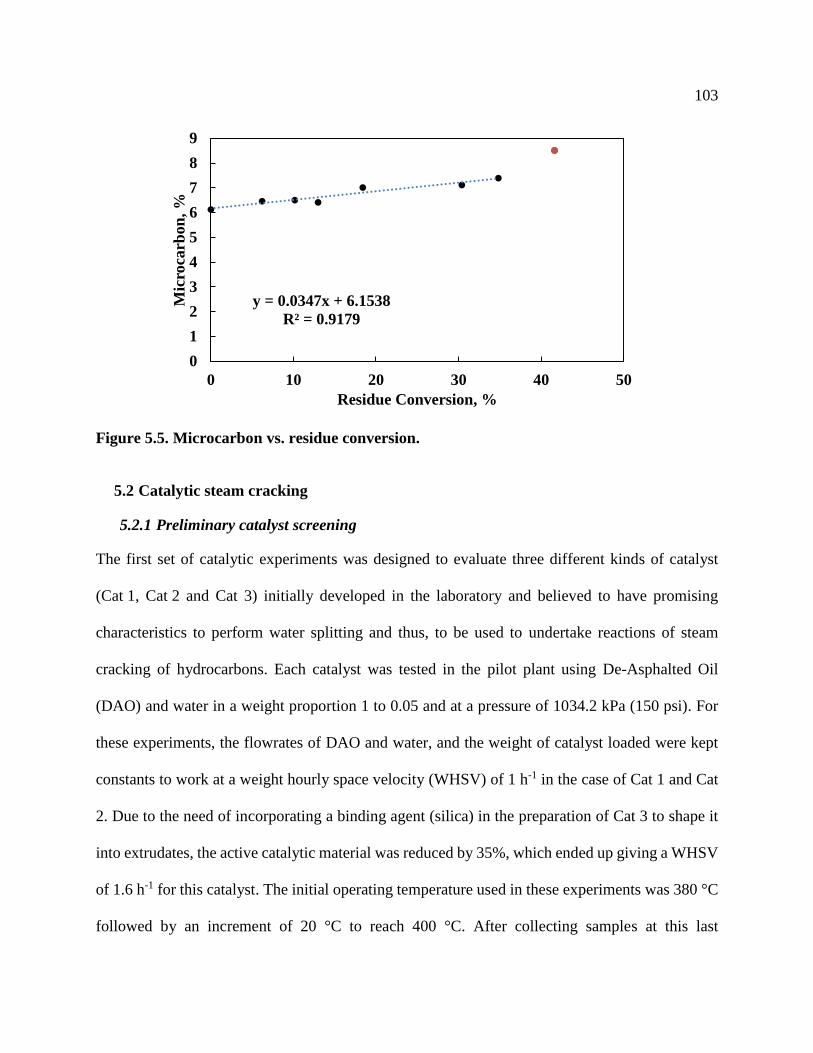
103
Figure 5.5. Microcarbon vs. residue conversion.
5.2 Catalytic steam cracking
5.2.1 Preliminary catalyst screening
The first set of catalytic experiments was designed to evaluate three different kinds of catalyst
(Cat 1, Cat 2 and Cat 3) initially developed in the laboratory and believed to have promising
characteristics to perform water splitting and thus, to be used to undertake reactions of steam
cracking of hydrocarbons. Each catalyst was tested in the pilot plant using De-Asphalted Oil
(DAO) and water in a weight proportion 1 to 0.05 and at a pressure of 1034.2 kPa (150 psi). For
these experiments, the flowrates of DAO and water, and the weight of catalyst loaded were kept
constants to work at a weight hourly space velocity (WHSV) of 1 h-1 in the case of Cat 1 and Cat
2. Due to the need of incorporating a binding agent (silica) in the preparation of Cat 3 to shape it
into extrudates, the active catalytic material was reduced by 35%, which ended up giving a WHSV
of 1.6 h-1 for this catalyst. The initial operating temperature used in these experiments was 380 °C
followed by an increment of 20 °C to reach 400 °C. After collecting samples at this last
y = 0.0347x + 6.1538
R² = 0.9179
0
1
2
3
4
5
6
7
8
9
0 10 20 30 40 50
Mic
roca
rbon
, %
Residue Conversion, %

104
temperature, the reactor was cooled down to 380 °C to evaluate possible de-activation of the
catalyst.
The results of these experiments in terms of residue (560°C+) conversion against time are
presented in Figure 5.6. As can be seen, Cat 1 shows strong de-activation of 26% in the first 6
hours of reaction at 380 °C, giving a conversion slightly higher than the thermal run evaluated at
the same conditions. When evaluated at 400 °C, Cat 1 was not able to improve its catalytic activity
and practically all the conversion generated was produced by the effect of temperature. Returning
back to a temperature of 380 °C, no significant improvement was observed for Cat 1, which kept
converting residue in a similar proportion obtained in the first stage of the experiment. In the case
of Cat 2, the solid remained stable during the first 10 hours of operation giving catalytic conversion
with an advantage of 10 points above the thermal one. The same extra catalytic activity was
observed at 400 °C, since about 7 points were observed above the 42% of conversion generated
by the thermal effect. This good performance could be explained by its characteristic acidity and
higher amount of active sites in comparison with the other catalysts, for which de-activation would
take longer. After three hours of operation at 400 °C, the de-activation was favored, which was
confirmed in the third stage of the experiment, where the activity of Cat 2 went from 30%
conversion (first stage) to about 22%. Presumably, this de-activation is caused by the high
temperatures that induced coke formation and blocking of the pores and active sites. Cat 3 did not
perform better than the other two catalysts evaluated. Due to operational problems, the first sample
was collected after ten hours of operation and by that time, the catalyst seems to be already de-
activated or not active enough to give significant extra conversion besides that obtained by the
thermal effect. This behaviour was observed along the whole experiments and especially at 400
°C.
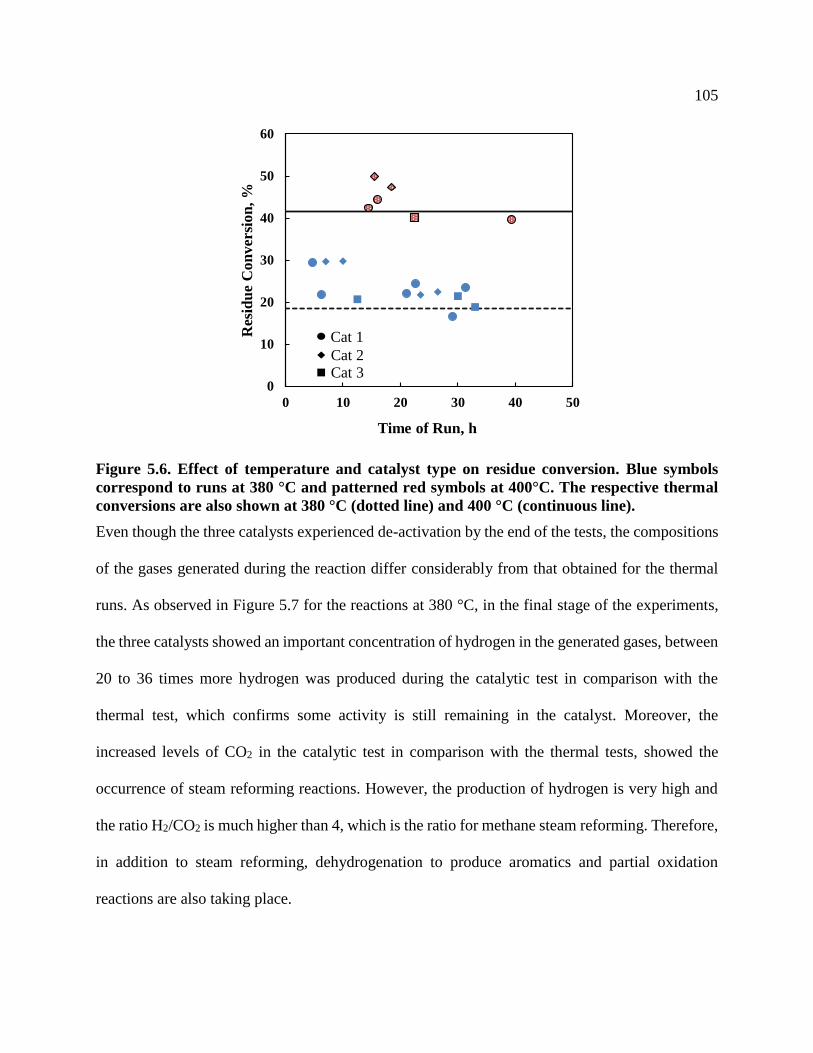
105
Figure 5.6. Effect of temperature and catalyst type on residue conversion. Blue symbols
correspond to runs at 380 °C and patterned red symbols at 400°C. The respective thermal
conversions are also shown at 380 °C (dotted line) and 400 °C (continuous line).
Even though the three catalysts experienced de-activation by the end of the tests, the compositions
of the gases generated during the reaction differ considerably from that obtained for the thermal
runs. As observed in Figure 5.7 for the reactions at 380 °C, in the final stage of the experiments,
the three catalysts showed an important concentration of hydrogen in the generated gases, between
20 to 36 times more hydrogen was produced during the catalytic test in comparison with the
thermal test, which confirms some activity is still remaining in the catalyst. Moreover, the
increased levels of CO2 in the catalytic test in comparison with the thermal tests, showed the
occurrence of steam reforming reactions. However, the production of hydrogen is very high and
the ratio H2/CO2 is much higher than 4, which is the ratio for methane steam reforming. Therefore,
in addition to steam reforming, dehydrogenation to produce aromatics and partial oxidation
reactions are also taking place.
0
10
20
30
40
50
60
0 10 20 30 40 50
Res
idu
e C
on
ver
sio
n,
%
Time of Run, h
Cat 2
Cat 1
Cat 3
106
The good dispersion of Ce and Ni in Cat 3 allows the generation of hydrogen in similar proportions
obtained for Cat 2, whose nominal content of active metals was considerably higher (about 7 times
for Ni and 4 times for Ce). Furthermore, it is interesting to note that this similar proportion of
hydrogen was also obtained despite the fact that Ni is in lower atomic proportion for Cat 2 with
respect to Cat 3 (about 3 times) on the surface of the catalyst, according to XPS analysis. At the
same time, Ce is in similar proportion on the surface of both catalysts. Consequently, it can be
concluded, based on xps analysis, that the hydrogen production is more dependent on the cerium
content than on the nickel content. In general, the generation of hydrogen is significantly better
performed by the use of a Ni-Ce combination, like in Cat 2 and Cat 3, than by the use of alkaline
and alkaline earth metals with Ni (the case of Cat 1).
Moreover, the gas analysis indicates that the use of the evaluated catalysts also improves the
cracking activity, since methane and some others hydrocarbon compounds in the range of gases
up to C5 (saturated compounds denotated as paraffins and unsaturated as olefins) are produced in
the reaction. The improvement in the methane production can be attributed to hydrogenolysis and
methanation type reactions. Among the three catalysts tested, Cat 1 seems to be the least active at
this temperature, due to its lower capacity to produce hydrogen and other gases in general, while
Cat 2 and Cat 3 behave in a similar way.
At 400 °C, while Cat 2 and Cat 3 increase the production of hydrogen 97% and 84% respectively,
Cat 1 increases it by 65%, which reveals it to be less active for water dissociation and
hydrogenation. Instead, the increase in temperature seems to favor Cat 1 to be more selective for
the production of hydrocarbon gases, probably generated via hydrogenolysis.
In comparison with the runs at 380 °C, where differences in the hydrocarbon gas production could
be observed between the catalytic run and the thermal run, at 400 °C the main production of these

107
compounds is probably due to the effect of the temperature. On the other hand, despite the amount
of hydrogen produced in the catalytic runs, it was also observed the production of olefins implying
the absence of a hydrogenating function that would take advantage of the produced hydrogen to
saturate these olefins.
Figure 5.7. Components gas flowrate reached at the end of each temperature for the catalytic
runs, in comparison with the thermal runs.
It is interesting to note that although Cat 3 is producing as much hydrogen as Cat 2, the latter is
the one that is favoring more the carbon-oxygen bond formation (oxygen coming from the water
molecules), evidenced by the generation of CO2. Therefore, the oxygen in Cat 2 experiments is
leaving the system as CO2 molecules, whilst it is expected that the products of Cat 3 might contain
an important amount of oxygenated hydrocarbons compounds (e.g. aldehyde, ketones) in
comparison with those remaining in Cat 2 products. Analyses for these compounds are extremely
difficult and expensive. Thus, Cat 3 was discarded at this catalysts screening stage.
0
0.2
0.4
0.6
0.8
1
1.2
1.4
1.6400 C
Thermal Cat 1 Cat 2 Cat 3
0
0.2
0.4
0.6
0.8
1
1.2
1.4
1.6
Ga
s P
rod
uce
d,
ml/
min
380 C
Thermal Cat 1 Cat 2 Cat 3

108
5.2.2 Catalyst stability and product comparison
In the previous experiments was evaluated the conversion obtained for each catalyst submitted to
a variation of temperatures for a short period of time on stream. In this section, the catalysts were
submitted to a constant temperature of 400°C during longer periods, to evaluate the performance
of the catalyst and the de-activation profile generated by each one of them. In this case, in order to
compare properly, all the reactors were loaded with catalytic material ensuring a WHSV of 1 h-1
for each test. The results of this experiment are presented in Figure 5.8 in terms of conversion of
residue. As can be seen, all the catalysts presented an initial activity higher than 57%, which is 16
points above the thermal conversion of residue. However, after 15-20 hours all the catalysts
experience a strong de-activation until reaching the activity obtained in the thermal run.
Figure 5.8. Deactivation profile of the catalyst tested at 400 °C and WHSV=1 h-1.
Since the catalysts were submitted for a longer period of time at 400°C, it is expected to lose more
active sites by the end of the experiment in comparison with that obtained in the catalytic
0
10
20
30
40
50
60
70
0 10 20 30
Res
idu
um
Con
ver
sion
, %
Time of Run, h
Cat 1 Cat 2 Cat 3 Thermal
Initial catalytic activity

109
screening. However, similar trends in the production of each type of gas are also observed, as
shown in Figure 5.9. Cat 2 and Cat 3 dominate the production of hydrogen, while Cat 1 has a
certain selectivity for hydrocarbon cracking, which generates higher amounts of olefins, paraffins
and methane. Figure 5.10 represents the profile of de-activation from the hydrogen and methane
production points of view. The production of methane remains stable during the whole experiment
at magnitudes similar to that obtained for the thermal run, which is an indication of the strong
effect of temperature on the hydrocarbon cracking to produce gases. Cat 1 shows a slightly higher
activity for methane production. However, there are important differences in the production of
hydrogen. At the beginning of the experiment, Cat 2 was able to produce almost double the amount
of hydrogen produced by the other two catalysts, but after 25 hours of reaction the hydrogen
production equals the value obtained for Cat 3. Cat 1 remained stable during the first 15 h of
reaction, followed by a loss of water splitting activity on average of about 30%. Even though Cat 3
loses 22% of activity toward residue conversion, the activity for water dissociation remains stable
along the whole experiment. This is an indication of the stability of the water splitting sites.
Figure 5.9. Gas production at stabilization (400 °C and WHSV=1 h-1).
0
0.2
0.4
0.6
0.8
1
1.2
H2 CO CO2 Methane Paraffins Olefins
Gas
Pro
du
ced
, m
l/m
in
Thermal Cat 1
Cat 2 Cat 3

110
Figure 5.10. Hydrogen and methane production evolution with time (400 °C and
WHSV=1 h-1).
The recovered catalysts, after each reaction, were cleaned with toluene and dichloromethane in
order to remove any trace of the hydrocarbon feedstock. With the purpose of determining variation
in their physical properties, they were analyzed via TGA and nitrogen adsorption/desorption. The
results are presented in Table 5.2, where the loss in the surface area available for reaction is clearly
seen, presumably due to the formation of coke and blocking of the pore network. Cat 1 and Cat 3
experienced about 85% surface area reduction, while Cat 2 experienced the highest reduction with
94%. On the other hand, it was determined by TGA in air, that Cat 1 and Cat 2 were the solids
with the highest coke content. In the case of Cat 3, the percentage of coke obtained was very small.
It is presumed that the high acidity found in Cat 2 and the severe conditions regarding temperature,
might have favored the production of coke on the surface of the catalyst, and thus, blocking of the
0
0.5
1
1.5
2
2.5
3
0
0.2
0.4
0.6
0.8
1
1.2
1.4
1.6
1.8
2
0 10 20 30
Met
ha
ne
Pro
du
ced
, m
l/m
in
Hyd
rogen
Pro
du
ced
, m
l/m
in
Time of Run, h
Cat 1, Hydrogen
Cat 2, Hydrogen
Cat 3, Hydrogen
Thermal, Hydrogen
Cat 1, Methane
Cat 2, Methane
Cat 3, Methane
Thermal, Methane
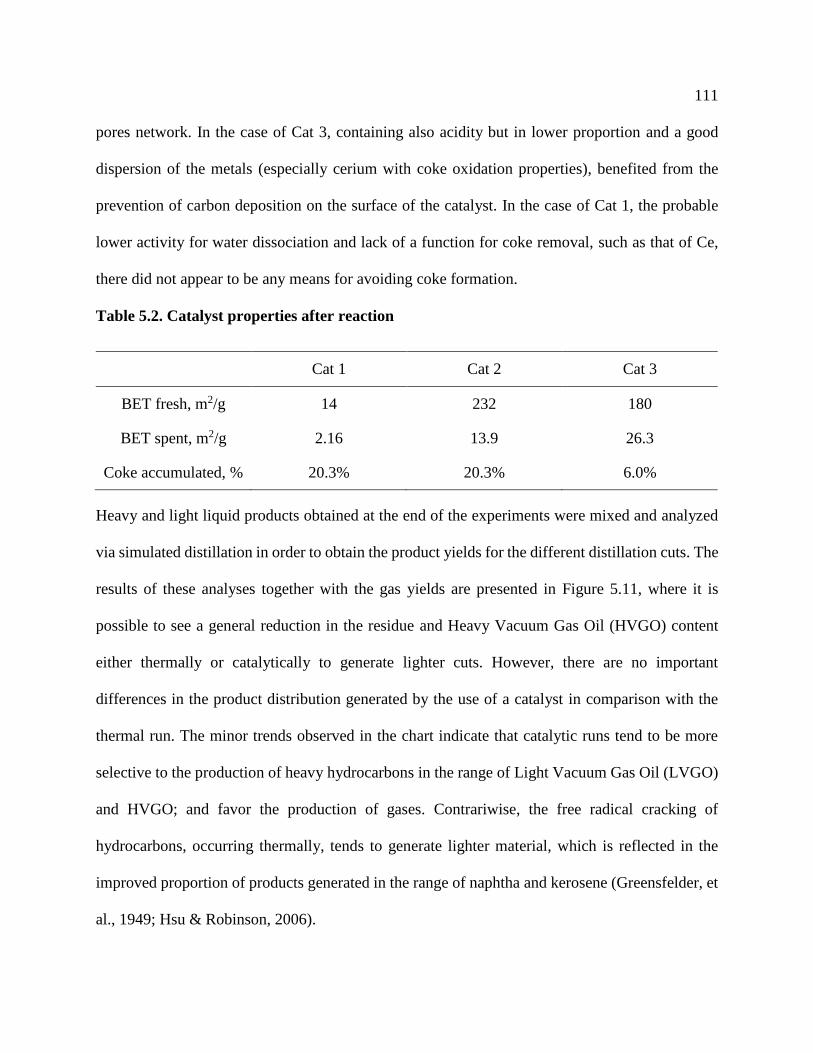
111
pores network. In the case of Cat 3, containing also acidity but in lower proportion and a good
dispersion of the metals (especially cerium with coke oxidation properties), benefited from the
prevention of carbon deposition on the surface of the catalyst. In the case of Cat 1, the probable
lower activity for water dissociation and lack of a function for coke removal, such as that of Ce,
there did not appear to be any means for avoiding coke formation.
Table 5.2. Catalyst properties after reaction
Cat 1 Cat 2 Cat 3
BET fresh, m2/g 14 232 180
BET spent, m2/g 2.16 13.9 26.3
Coke accumulated, % 20.3% 20.3% 6.0%
Heavy and light liquid products obtained at the end of the experiments were mixed and analyzed
via simulated distillation in order to obtain the product yields for the different distillation cuts. The
results of these analyses together with the gas yields are presented in Figure 5.11, where it is
possible to see a general reduction in the residue and Heavy Vacuum Gas Oil (HVGO) content
either thermally or catalytically to generate lighter cuts. However, there are no important
differences in the product distribution generated by the use of a catalyst in comparison with the
thermal run. The minor trends observed in the chart indicate that catalytic runs tend to be more
selective to the production of heavy hydrocarbons in the range of Light Vacuum Gas Oil (LVGO)
and HVGO; and favor the production of gases. Contrariwise, the free radical cracking of
hydrocarbons, occurring thermally, tends to generate lighter material, which is reflected in the
improved proportion of products generated in the range of naphtha and kerosene (Greensfelder, et
al., 1949; Hsu & Robinson, 2006).
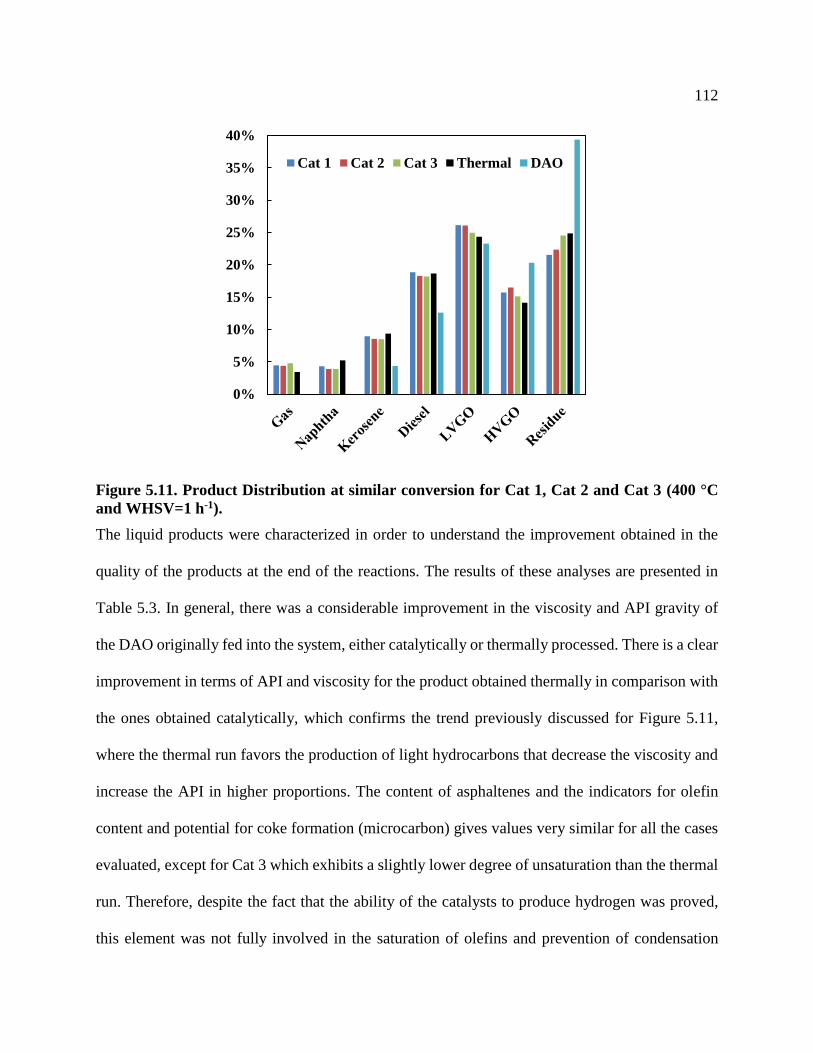
112
Figure 5.11. Product Distribution at similar conversion for Cat 1, Cat 2 and Cat 3 (400 °C
and WHSV=1 h-1).
The liquid products were characterized in order to understand the improvement obtained in the
quality of the products at the end of the reactions. The results of these analyses are presented in
Table 5.3. In general, there was a considerable improvement in the viscosity and API gravity of
the DAO originally fed into the system, either catalytically or thermally processed. There is a clear
improvement in terms of API and viscosity for the product obtained thermally in comparison with
the ones obtained catalytically, which confirms the trend previously discussed for Figure 5.11,
where the thermal run favors the production of light hydrocarbons that decrease the viscosity and
increase the API in higher proportions. The content of asphaltenes and the indicators for olefin
content and potential for coke formation (microcarbon) gives values very similar for all the cases
evaluated, except for Cat 3 which exhibits a slightly lower degree of unsaturation than the thermal
run. Therefore, despite the fact that the ability of the catalysts to produce hydrogen was proved,
this element was not fully involved in the saturation of olefins and prevention of condensation
0%
5%
10%
15%
20%
25%
30%
35%
40%
Cat 1 Cat 2 Cat 3 Thermal DAO
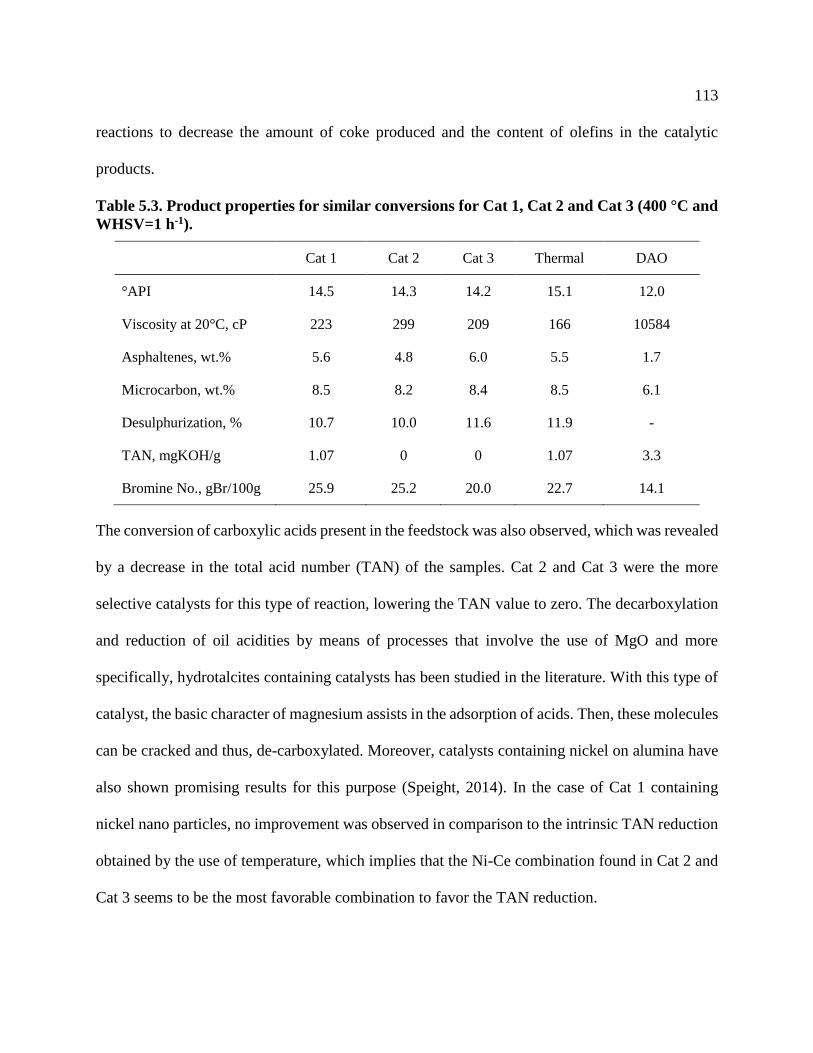
113
reactions to decrease the amount of coke produced and the content of olefins in the catalytic
products.
Table 5.3. Product properties for similar conversions for Cat 1, Cat 2 and Cat 3 (400 °C and
WHSV=1 h-1).
Cat 1 Cat 2 Cat 3 Thermal DAO
°API 14.5 14.3 14.2 15.1 12.0
Viscosity at 20°C, cP 223 299 209 166 10584
Asphaltenes, wt.% 5.6 4.8 6.0 5.5 1.7
Microcarbon, wt.% 8.5 8.2 8.4 8.5 6.1
Desulphurization, % 10.7 10.0 11.6 11.9 -
TAN, mgKOH/g 1.07 0 0 1.07 3.3
Bromine No., gBr/100g 25.9 25.2 20.0 22.7 14.1
The conversion of carboxylic acids present in the feedstock was also observed, which was revealed
by a decrease in the total acid number (TAN) of the samples. Cat 2 and Cat 3 were the more
selective catalysts for this type of reaction, lowering the TAN value to zero. The decarboxylation
and reduction of oil acidities by means of processes that involve the use of MgO and more
specifically, hydrotalcites containing catalysts has been studied in the literature. With this type of
catalyst, the basic character of magnesium assists in the adsorption of acids. Then, these molecules
can be cracked and thus, de-carboxylated. Moreover, catalysts containing nickel on alumina have
also shown promising results for this purpose (Speight, 2014). In the case of Cat 1 containing
nickel nano particles, no improvement was observed in comparison to the intrinsic TAN reduction
obtained by the use of temperature, which implies that the Ni-Ce combination found in Cat 2 and
Cat 3 seems to be the most favorable combination to favor the TAN reduction.
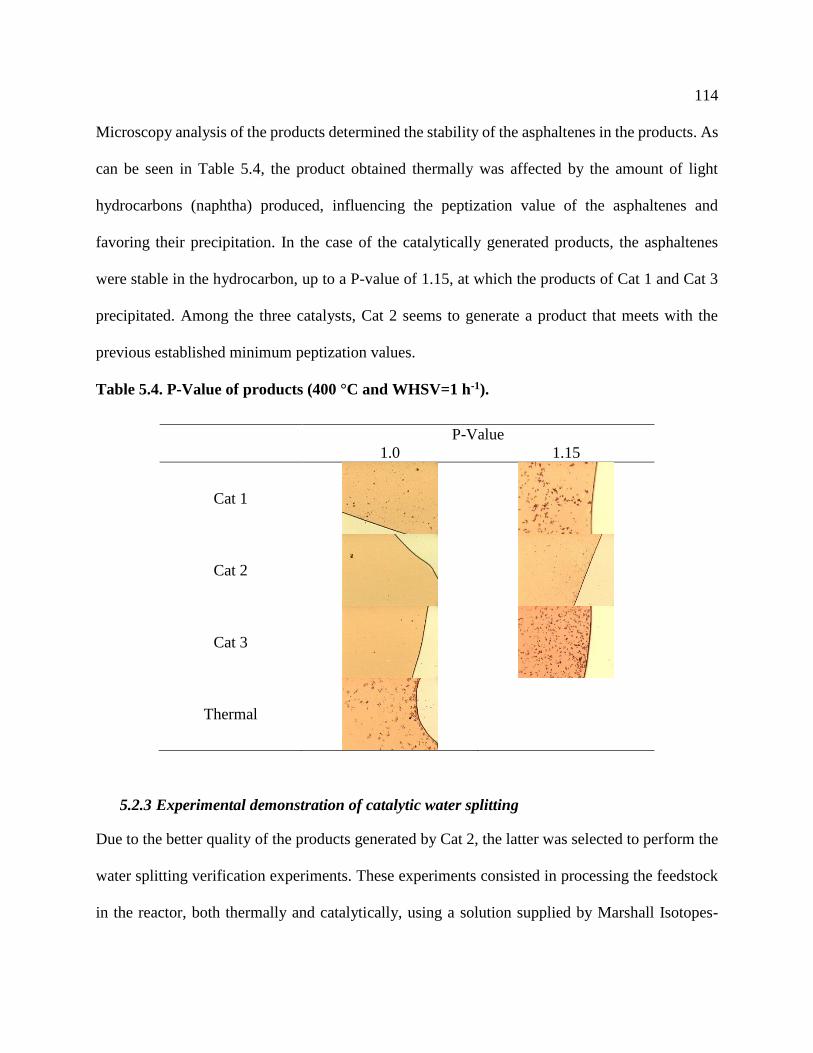
114
Microscopy analysis of the products determined the stability of the asphaltenes in the products. As
can be seen in Table 5.4, the product obtained thermally was affected by the amount of light
hydrocarbons (naphtha) produced, influencing the peptization value of the asphaltenes and
favoring their precipitation. In the case of the catalytically generated products, the asphaltenes
were stable in the hydrocarbon, up to a P-value of 1.15, at which the products of Cat 1 and Cat 3
precipitated. Among the three catalysts, Cat 2 seems to generate a product that meets with the
previous established minimum peptization values.
Table 5.4. P-Value of products (400 °C and WHSV=1 h-1).
P-Value
1.0 1.15
Cat 1
Cat 2
Cat 3
Thermal
5.2.3 Experimental demonstration of catalytic water splitting
Due to the better quality of the products generated by Cat 2, the latter was selected to perform the
water splitting verification experiments. These experiments consisted in processing the feedstock
in the reactor, both thermally and catalytically, using a solution supplied by Marshall Isotopes-

115
Israel with 50 vol. % of isotopic water (H2O18) and 50 vol. % of distillated water (H2O
16). By using
labeled water, it can be confirmed if the oxidation to produce CO2 observed in steam processes
comes from using internal oxygen contained in the reactant feedstock (decomposition of
carboxylic acids and other oxygenates) or from the oxygen and hydroxyl radicals generated during
water dissociation, which react with terminal carbon atoms from hydrocarbon radicals to produce
labeled CO2. In the first case, mostly 16O=C=16O is going to be found in the gas products since 16O
is the most abundant isotope (99.756%) , while in the second case several combinations of CO2
are going to be present in the gas products (16O=C=16O, 16O=C=18O and 18O=C=18O). A similar
procedure has been found in the literature, showing satisfactory results for the dissociation of water
using ultra-dispersed catalysts during steam catalytic cracking reaction at 440 °C (Fathi, 2011).
The monitoring of the gases produced during reaction, via quadrupole mass spectrometry,
generated an ion current signal in amperes for each molar mass with time (shown as mass to charge
ratio m/z), which was used to compare the evolution of the three targeted compounds 16O=C=16O
(m/z-44), 18O=C=16O (m/z-46) and 18O=C=18O (m/z-48). With this information it was possible to
create a profile for the signals ratio between each molecular weight (m/z-XX) against the molecular
weight 44 (m/z-44), associated to regular CO2, as presented in Figure 5.12 for reactions carried
out at 360°C, 380°C and 400°C. These ratios allow one to estimate the amount of isotopic CO2
produced per molecule of regular CO2. However, it is important to highlight that according to mass
spectra for CO2 and propane, about 76% of CO2 molecules and 8% of the propane molecules are
ionized and detected as m/z-44. Therefore, final ratios were recalculated using GC analysis and
gas flowrates measurements in order to approximately remove the contribution of ions generated
from decomposition of propane, in the signal m/z-44. The final results are presented in Table 5.5.

116
Figure 5.12. m/z-xx / m/z-44 ratios for experiments at 360, 380 and 400 °C
As shown in Figure 5.12, the gas analysis via mass spectrometry shows differentiation in the
production of isotopic CO2 when a catalyst is used in comparison with the production of CO2 in
the absence of it at all temperatures studied using the same labeled water. At 360 °C, an induction
period is observed for the catalytic runs, in which probably an equilibrium concentration of 16O
and18O is established at the surface of the catalyst due to water molecules that start adsorbing and
0.00
0.05
0.10
0.15
0.20
0.25
0.30
0.35
0.40
500 1500 2500 3500 4500
m/z
-xx /
m/z
-44
Time of Run, h
360 C
2 8 13 19 24
2 8
Catalytic:
Thermal:
0.00
0.05
0.10
0.15
0.20
0.25
0.30
0.35
0.40
0 1000 2000 3000 4000
m/z
-xx /
m/z
-44
Time of Run, h
380 C
23 28 33 39 45
8 14 20
Catalytic:
Thermal:
0.00
0.05
0.10
0.15
0.20
0.25
0.30
0.35
0.40
0 1000 2000 3000 4000
m/z
-xx /
m/z
-44
Time of Run, h
400 C
m/z-46/m/z-44(Thermal)
m/z-46/m/z-44(Catalytic)
m/z-48/m/z-44(Thermal)
m/z-48/m/z-44(Catalytic)
44 49 55 60 66
18 24 30
Catalytic:
Thermal:

117
dissociating on the surface of the catalyst. Additionally, this induction period can also be related
to the diffusion and concentration of the produced labeled carbon dioxide molecules. After this
period, the catalyst starts dissociating water at a constant rate. This behaviour was experienced at
each temperature evaluated for the catalytic run, whilst the thermal run had the tendency to produce
labeled CO2 at a stable but lower rate during most of the time evaluated. Moreover, the double
oxidation of carbon with labeled oxygen during the catalytic run does not seem to be very
significant, since the results obtained are in the same range of values achieved by the thermal runs
(about one order of magnitude lower than in the case of single oxygen labeled CO2).
Table 5.5. Recalculated signal ratios for CO2
Catalytic Thermal
m/z-xx/m/z-44 360°C 380°C 400°C 360°C 380°C 400°C
46/44(CO2) 0.24 0.35 0.40 0.02 0.03 0.09
48/44(CO2) 0.02 0.06 0.09 0.06 0.09 0.09
The final ratios presented in Table 5.5 state that among all the catalytic experiments, between 2.5-
4 molecules of isotopic CO2 (m/z-46) were produced per 10 molecules of regular CO2 generated.
In the case of the thermal runs, between 2 and 9 molecules were generated per 100 molecules of
CO2. Therefore, that is one order of magnitude difference in the generation of 16O=C=18O (m/z-
46) between the catalytic evaluation and the thermal evaluation. In conclusion, these results
confirm the hypothesis where the dissociation of water molecule takes place on the surface of Cat 2
used in this work. In the case of these experiments, the following reactions best describe the results
obtained, where the production of 18O=C=18O (m/z-48) is negligible. This mechanism is a

118
simplification of more complex chemical exchange processes occurring between the metal oxides
of the catalyst and the water dissociating on the surface of them.
𝐻2 𝑂16𝑐𝑎𝑡→ 𝐻∗ + 𝑂16 𝐻∗ Eq. 5.1
𝐻2 𝑂18𝑐𝑎𝑡→ 𝐻∗ + 𝑂18 𝐻∗ Eq. 5.2
𝑅𝑛′∗ + 𝑂18 𝐻∗ + 𝑂16 𝐻∗
𝑐𝑎𝑡→ 𝑅𝑛−𝑥
′ + 𝑦𝐶 𝑂16 𝑂16 + 𝑧𝐶 𝑂18 𝑂16 + 𝑤𝐶 𝑂18 𝑂18 +𝐻2 Eq. 5.3
With 𝑦 + 𝑧 + 𝑤 = 𝑥.
Regarding the effect of the temperature, it is interesting to note a considerable increase in the signal
for m/z-46/m/z-44 between 360 °C and 380 °C of about 49%, against an increase of just 13%
between 380 °C and 400 °C. This result leads one to consider the water dissociation on the surface
of the catalyst to be considerably improved by the temperature within the range 360-380 °C, but
not significantly improved after this point. At higher temperature than 400 °C, the relative
percentage increase in the production of labeled CO2 might reach a plateau or diminish.
5.2.4 Operational and catalyst improvements
5.2.4.1 Cat 4 evaluation
Based on gas chromatography analysis and the results from the water splitting verification
experiments, the capability of the tested catalysts to dissociate water and generate the required
hydrogen to avoid condensation reactions, was proved. However, on overall, there was not
important evidence for improvements in the quality of the products by taking advantage of the
produced hydrogen. The results also indicated that the catalysts lost their activities for residue
conversion, in a relatively short period of time, probably due to coke formation on the surface of
it, favored by the high temperatures. For these reasons Cat 4 was developed, aiming to work at

119
lower temperatures to avoid coke formation but targeting the improvement or holding the activity
toward residue conversion by the addition of acid sites. The results of the evaluation of this catalyst
at 380°C and WHSV=1 h-1 is presented in Figure 5.13, which shows a rapid decrease in conversion
in the first 10 hours of reaction followed by a recovery of the activity. At the end of the reaction,
the conversion obtained with this catalyst is very similar to that obtained for Cat 2, which is slightly
above that obtained thermally. However, the presence of acid sites in this catalyst, indeed improved
the cracking activity, as more methane and gas hydrocarbons lighter than C5 were detected by GC.
Besides, as presented in Figure 5.13, the overall yield toward gas production is also increased.
Figure 5.13. Results for Cat 4 evaluation at 380°C and WHSV=1 h-1.
0
5
10
15
20
25
30
35
0 10 20 30 40 50
Res
idu
e C
on
ver
sio
n,
%
Time of Run, h
Cat 1 Cat 2
Cat 3 Cat 4
Thermal
0
0.2
0.4
0.6
0.8
1
1.2
1.4
1.6G
as
Pro
du
ced
, m
l/m
in
Thermal
Cat 1
Cat 2
Cat 3
Cat 4
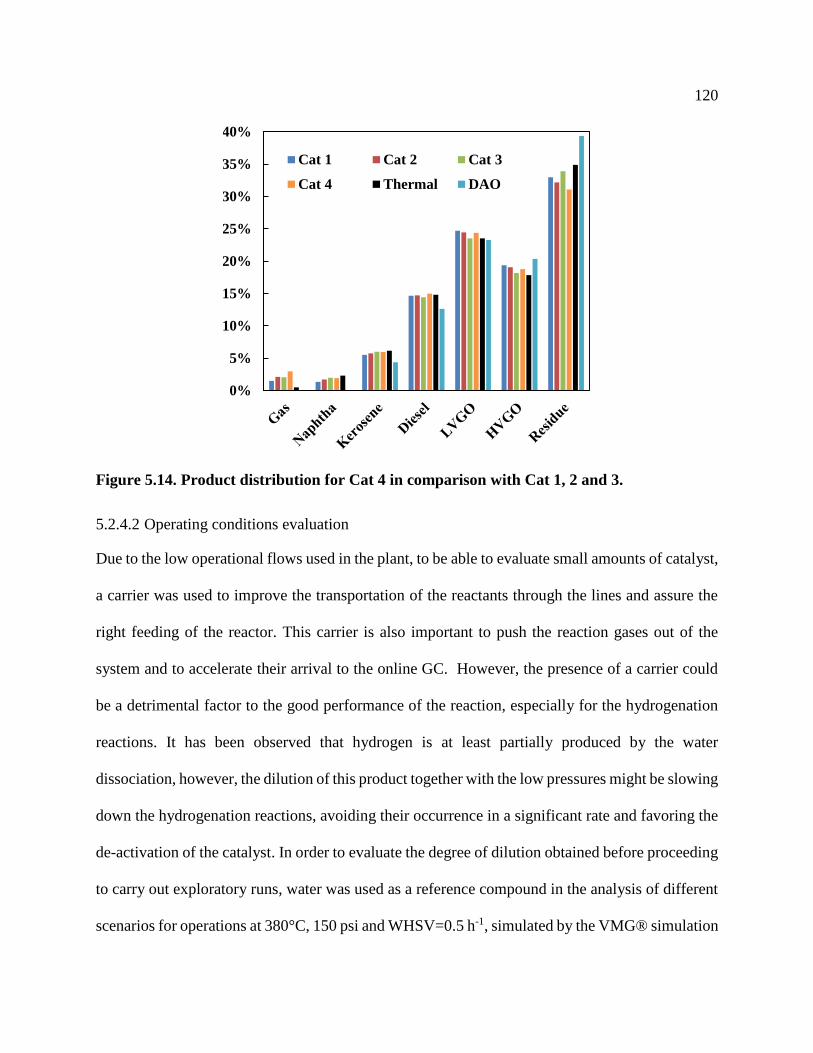
120
Figure 5.14. Product distribution for Cat 4 in comparison with Cat 1, 2 and 3.
5.2.4.2 Operating conditions evaluation
Due to the low operational flows used in the plant, to be able to evaluate small amounts of catalyst,
a carrier was used to improve the transportation of the reactants through the lines and assure the
right feeding of the reactor. This carrier is also important to push the reaction gases out of the
system and to accelerate their arrival to the online GC. However, the presence of a carrier could
be a detrimental factor to the good performance of the reaction, especially for the hydrogenation
reactions. It has been observed that hydrogen is at least partially produced by the water
dissociation, however, the dilution of this product together with the low pressures might be slowing
down the hydrogenation reactions, avoiding their occurrence in a significant rate and favoring the
de-activation of the catalyst. In order to evaluate the degree of dilution obtained before proceeding
to carry out exploratory runs, water was used as a reference compound in the analysis of different
scenarios for operations at 380°C, 150 psi and WHSV=0.5 h-1, simulated by the VMG® simulation
0%
5%
10%
15%
20%
25%
30%
35%
40%
Cat 1 Cat 2 Cat 3
Cat 4 Thermal DAO

121
package and assuming no reaction. The first case evaluated the typical operation where 5 Std.
ml/min of nitrogen was fed into the plant. In the second scenario, no nitrogen was used as carrier
but the gas velocity was kept constant by increasing the mass ratio water to oil to 18%. In the third
case, no nitrogen was used and the typical water to oil proportion of 5% was kept.
The results of these simulations are shown in Table 5.6, where the influence of the carrier can be
observed, which leads to a high gas volumetric fraction of 98.3%. Therefore, the reactor basically
follows a spray flow pattern, where mostly gas was flowing inside of it together with a few drops
of oil. In molar fraction, out of 85.6% of gases present in the reactor, just 21.4% consisted of water
and the rest of it was considered nitrogen and gas hydrocarbons.
Table 5.6. Process simulation for different scenarios and using WHSV=0.5 h-1
Case I Case II Case III
Description
DAO+5 ml/min
N2 as carrier
+5%Water
DAO+18%Water DAO+5%Water
Temperature, °C 380 380 380
Pressure, psi 150 150 150
Gas volume flow (Volumetric
fraction), ml/min 1.52 (98.3%) 1.51 (98.2%) 0.43(93%)
Liquid volume flow, ml/min 0.03 0.03 0.03
Liquid molar fraction, % 14.4 14.3 43
Gas molar fraction, % 85.6 85.7 57
Water molar fraction in gas, % 21.4 78.2 48.5
In the second case, it was observed that by using 18% of water respect to oil mass flowrate, the
flow pattern can be kept constant, but the molar concentration of water in the reactor is improved
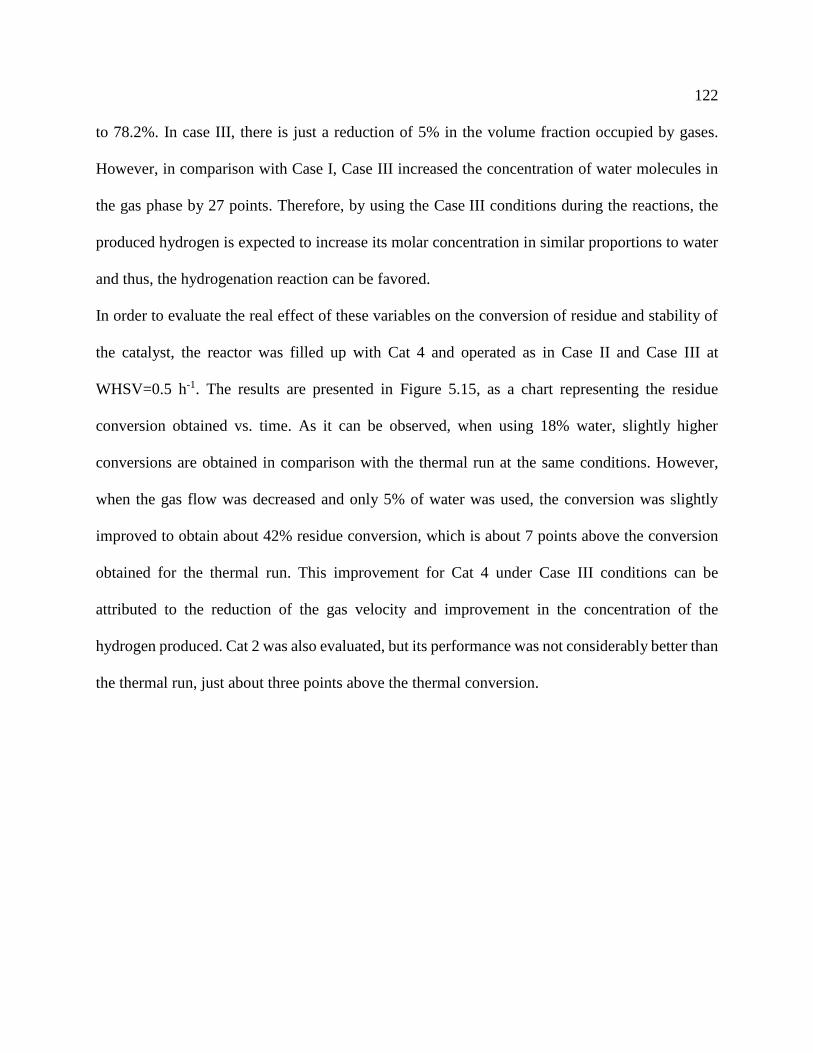
122
to 78.2%. In case III, there is just a reduction of 5% in the volume fraction occupied by gases.
However, in comparison with Case I, Case III increased the concentration of water molecules in
the gas phase by 27 points. Therefore, by using the Case III conditions during the reactions, the
produced hydrogen is expected to increase its molar concentration in similar proportions to water
and thus, the hydrogenation reaction can be favored.
In order to evaluate the real effect of these variables on the conversion of residue and stability of
the catalyst, the reactor was filled up with Cat 4 and operated as in Case II and Case III at
WHSV=0.5 h-1. The results are presented in Figure 5.15, as a chart representing the residue
conversion obtained vs. time. As it can be observed, when using 18% water, slightly higher
conversions are obtained in comparison with the thermal run at the same conditions. However,
when the gas flow was decreased and only 5% of water was used, the conversion was slightly
improved to obtain about 42% residue conversion, which is about 7 points above the conversion
obtained for the thermal run. This improvement for Cat 4 under Case III conditions can be
attributed to the reduction of the gas velocity and improvement in the concentration of the
hydrogen produced. Cat 2 was also evaluated, but its performance was not considerably better than
the thermal run, just about three points above the thermal conversion.

123
Figure 5.15. Experimental results for water content/parameter variations
5.2.4.3 Further improvements in operation and catalysts
Based on the previous experience acquired when evaluating the effect of the carrier in the
conversion obtained in the reactor, the following experiments were performed feeding nitrogen at
the hot separator, in order to keep carrying the reaction gases out of the plant, but without affecting
the internal flow dynamics and concentration of reactants inside the reactor. On the other hand, to
keep avoiding the formation of coke on the surface of the catalyst, the operating temperature was
decreased to a range between 350°C and 370°C, while the amount of catalyst was increased up to
6 g by the incorporation of a bigger reactor of a half inch (Reactor 2, Figure 3.3). All these changes
allow one to undertake reactions at WHSV=0.25 h-1.
For this section, another catalyst was incorporated into the evaluation. In this case, the objective
was to take advantage of one of the previous catalysts evaluated in the first stage of this research
0
10
20
30
40
50
60
0 20 40
Res
idu
e C
on
ver
sion
,%
Time of Run, h
Cat 4: DAO+18%water
Cat 4: DAO+5%Water
Cat 2: DAO+5%Water
Thermal with N2

124
which proved to produce good quantities of hydrogen and incorporate a function that improves the
lack of hydrogenation observed so far. Therefore, Cat 5 was developed such that the mixture of
oxides existing in Cat 2 are combined with active sites of molybdenum carbide, as the
hydrogenating function recently developed in the Catalyst for Bitumen Upgrading (CBU) group.
The results of the evaluation of this new catalyst, together with Cat 4, are presented in Figure 5.16.
As it is shown, important differences can be observed for both catalysts in comparison with the
thermal run under the same condition. By the end of the experiment at 350°C, Cat 4 and Cat 5
were 9 and 13 points respectively above the thermal run, which is a considerable gain in
conversion. Cat 5 was also evaluated at 370 °C and the difference in the obtained conversion was
almost constant, giving this time 15 points above the thermal run. The analysis of the products,
presented in Table 5.7, also reflects the benefits obtained catalytically, where the viscosity is
reduced by more than one half with respect to the thermal products. It is also evidenced, probably
due to the hydrogenation function incorporated in Cat 5, that properties like asphaltenes content,
micro carbon and bromine number are lower in Cat 5 as compared with Cat 4, while the
desulphurization reactions were also improved by Cat 5. However, Cat 4 is considerable better
catalyst for the conversion of carboxylic acids that give the acidity to the oil. At 370 °C Cat 5
improved even more the viscosity and the API of the products, while just slightly affecting the
other properties due to the extra conversion obtained.
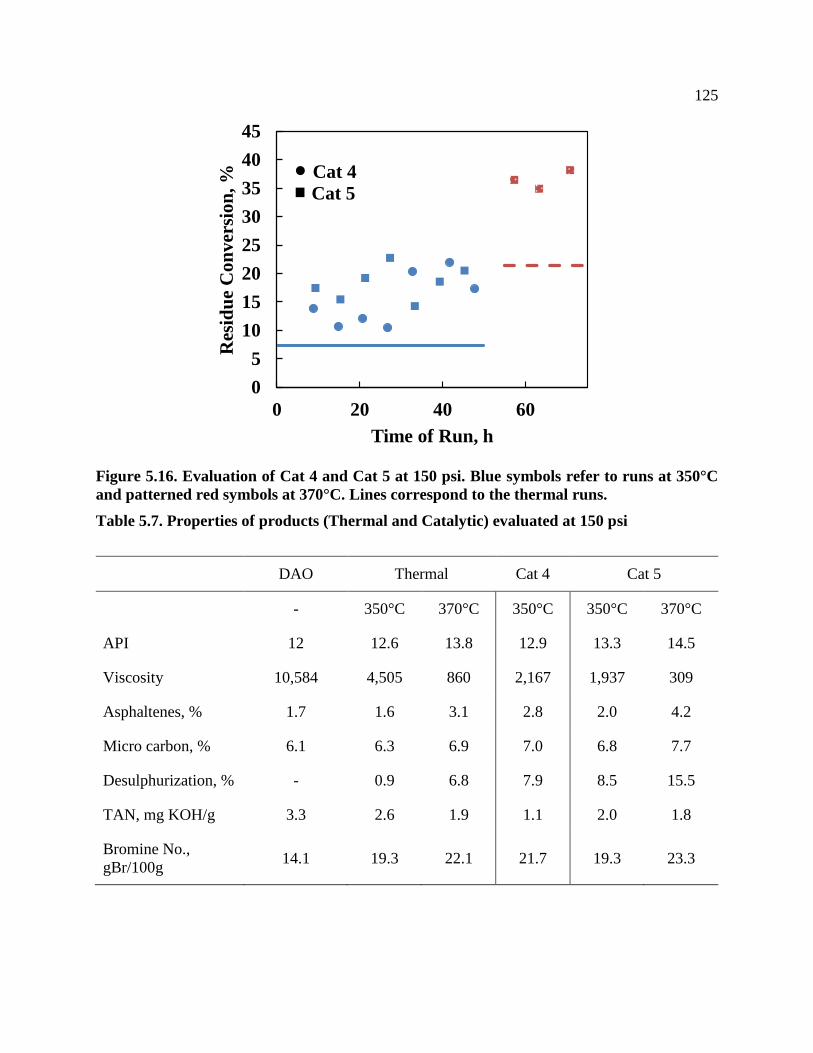
125
Figure 5.16. Evaluation of Cat 4 and Cat 5 at 150 psi. Blue symbols refer to runs at 350°C
and patterned red symbols at 370°C. Lines correspond to the thermal runs.
Table 5.7. Properties of products (Thermal and Catalytic) evaluated at 150 psi
DAO Thermal Cat 4 Cat 5
- 350°C 370°C 350°C 350°C 370°C
API 12 12.6 13.8 12.9 13.3 14.5
Viscosity 10,584 4,505 860 2,167 1,937 309
Asphaltenes, % 1.7 1.6 3.1 2.8 2.0 4.2
Micro carbon, % 6.1 6.3 6.9 7.0 6.8 7.7
Desulphurization, % - 0.9 6.8 7.9 8.5 15.5
TAN, mg KOH/g 3.3 2.6 1.9 1.1 2.0 1.8
Bromine No.,
gBr/100g 14.1 19.3 22.1 21.7 19.3 23.3
0
5
10
15
20
25
30
35
40
45
0 20 40 60
Res
idu
e C
on
ver
sion
, %
Time of Run, h
Cat 4
Cat 5

126
Pressure was another factor of interest that was evaluated. Hydrogenation reactions are industrially
carried out at higher pressures. Therefore, an increase in the magnitude for this variable could
improve the activity and stability of the catalysts. For that purpose, another set of reactions were
carried out only with Cat 5 at 400 psi, using a WHSV=0.25 h-1. Figure 5.17 and Table 5.8 represent
the results obtained when evaluating the effects of the pressure on the conversion and on the
properties of the products generated by Cat 5. In general, it is shown that at 350°C, no important
differences are observed between the operations at these two pressures. At 400 psi the conversion
is improved by just 4 points. It is interesting to note that the two thermal runs performed at this
temperature experienced exactly the same conversion, which indicates that the pressure creates no
effect in the thermal conversion of residue for this pressure range. Nevertheless, the experiments
performed at 370 °C at 150 psi and 400 psi clearly differentiate the gain in conversion obtained
because of the pressure effect for Cat 5. At 400 psi, the conversion is improved by almost 10 points,
which leaves the catalytic operation at 400 psi about 24 points above the thermal run.
Due to the extra conversion gained at higher pressures, the viscosity is considerably improved,
while the API remains at about the same value obtained at 150 psi. It is commonly observed, the
viscosity magnitude is significantly affected by the conversion achieved, while the API is not as
much. For that reason, minor variations in conversion can be easily detected in the viscosity, while
the API might not vary as much for the same sample.
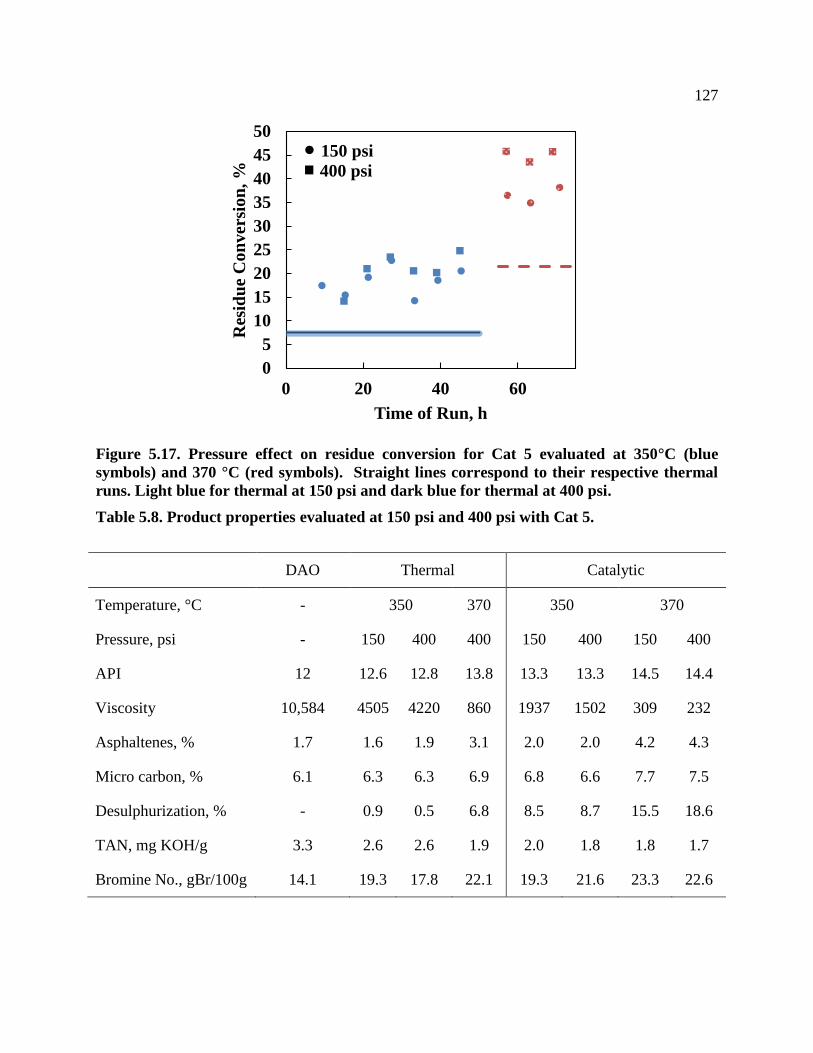
127
Figure 5.17. Pressure effect on residue conversion for Cat 5 evaluated at 350°C (blue
symbols) and 370 °C (red symbols). Straight lines correspond to their respective thermal
runs. Light blue for thermal at 150 psi and dark blue for thermal at 400 psi.
Table 5.8. Product properties evaluated at 150 psi and 400 psi with Cat 5.
DAO Thermal Catalytic
Temperature, °C - 350 370 350 370
Pressure, psi - 150 400 400 150 400 150 400
API 12 12.6 12.8 13.8 13.3 13.3 14.5 14.4
Viscosity 10,584 4505 4220 860 1937 1502 309 232
Asphaltenes, % 1.7 1.6 1.9 3.1 2.0 2.0 4.2 4.3
Micro carbon, % 6.1 6.3 6.3 6.9 6.8 6.6 7.7 7.5
Desulphurization, % - 0.9 0.5 6.8 8.5 8.7 15.5 18.6
TAN, mg KOH/g 3.3 2.6 2.6 1.9 2.0 1.8 1.8 1.7
Bromine No., gBr/100g 14.1 19.3 17.8 22.1 19.3 21.6 23.3 22.6
0
5
10
15
20
25
30
35
40
45
50
0 20 40 60
Res
idu
e C
on
ver
sion
, %
Time of Run, h
150 psi
400 psi

128
It was mentioned before the relationship between most of the properties with the conversion
(Chapter 5.5), where they tend to increase along with the conversion achieved. For that reason, it
becomes a very hard task to evaluate if hydrogenation reactions improved the properties of the
products under the evaluated conditions, because different levels of conversion were achieved.
Nevertheless, for these experiments, regardless of the increase in conversion, all the properties
were slightly improved for the operations at 400 psi, even for the olefins content. This is an
interesting result, since the operation at 400 psi improved the residue conversion by 23%, while
the properties remained stable and slightly improved. This positive effect of the pressure can be
explained as an improvement in the diffusion of the reactants inside the catalyst pores, in order to
take advantage of most of the surface area and active sites. Besides, the increase in pressure keeps
most of the feedstock in the liquid phase and concentrates the amount of hydrogen contained in
the gases, which increases the driving force that favors the hydrogenation reaction. It is also well
known for hydrocracking processes that the high partial pressure of hydrogen also improves the
catalyst life and supresses the catalyst fouling rate (Parkash, 2003).
Figure 5.18 is presented as another proof of the improvement in activity and in the possible
hydrogenation during the operation of the reactor at 400 psi. As it can be concluded from this chart,
at 400 psi the production of carbon dioxide, methane, and paraffins is more pronounced than at
150 psi. The high production of methane and CO2 is an indication of the catalytic activity, since
the oxygen coming from the water splitting is leaving the reactor as CO2, while methane is being
produced from cracking of terminal carbons, but also from the methanation of carbon atoms. As
consequence of this hydrogen consumption, the amount of free hydrogen leaving the plant is lower
and the content of gas olefins seems to be controlled at about the same values obtained at 150 psi.

129
Figure 5.18. Gas analysis for Cat 5 evaluation at 150 and 400 psi
5.3 Upgrading scheme evaluation
The experimental methodology led to the preparation of a catalyst with active sites for water
splitting, acid functions for cracking, but also with a hydrogenating function that can take
advantage of the hydrogen produced via water splitting. The study of the variable also favored the
use of high pressures to benefit the factors previously discussed. As conclusion, it was possible to
obtain about 45% of residue conversion with this catalyst (Cat 5) at 370°C and WHSV of 0.25 h-1.
Now the question is: What does it mean this conversion of residue and improvement in the oil
properties in regards to achieving the initial goals of meeting pipeline specification?
In order to answer this question, let us evaluate the scenario presented in Figure 5.19, where the
whole pitch is mixed back with the processed DAO to generate synthetic crude oil (Syncrude) and
additionally, gas is also part of the generated products. For this case, Table 5.9 is presented with
information about properties for each one of the streams existing in this scheme. As it can be
observed, from the original bitumen fed into the plant, 94.8% can be produced as a syncrude with
0
0.1
0.2
0.3
0.4
0.5
0.6
0.7
0.8
0.9
1
H2 CO CO2 Methane Paraffins Olefins
Gas
Flo
wra
te,
ml/
min
Thermal 370°C , 400 psi
Cat 5 370°C, 150 psi
Cat 5 370°C, 400 psi

130
an important reduced viscosity of 36,936 cP at 20°C (76% reduction), which clearly still does not
meet the pipeline specifications, but reduces the consumption of diluent by about 16 %. Moreover,
important reductions of 88% and 11% are also obtained for the TAN and sulphur content,
respectively. Based on the report prepared by Bacon R. and Tordo S., 2005, for the estimation of
price discounts for different crude oils according to their properties, this improvement in oil
obtained for the syncrude would generate a gain in discount of the bitumen by 0.02$/$Oil Brent in
the case of sulphur and 0.1$/$Oil Brent in the case of the TAN. In general, with a Brent oil pricing
50$ per barrel, the upgrading scheme would improve the value of the bitumen by 1.2$ and 4.9$
per barrel, for the enhancement obtained in sulphur content and TAN, respectively. It is worth
noting that these latter values are not additive, since each one of them was calculated assuming the
rest of the properties of the oil remain constant.
On the other hand, if the 26.9% yield that accounts for pitch can be used for the generation of
energy, sold for asphalt production or sent to coking, the produced syncrude would be basically
DAO processed in the steam catalytic cracking unit. This DAO would not have the 19 API usually
required, but the V50 estimated kinematic viscosity will be 350 cSt at 14°C. Thus, at this
temperature the fluid could be pumped through pipelines with no problems. Therefore, not much
diluent (less than 1 w.% in the mixture) or heat will be needed to pump this oil at the Canadian
average temperature of 12 °C, which improves the overall economy of the process. Additionally,
the oil has more value, since the TAN and sulphur content are both reduced by 29%.
131
Figure 5.19. Upgrading Scheme with only gas and syncrude as products
Table 5.9. Properties of the streams in the proposed upgrading scheme
Property Bitumen DAO DAO
processed Pitch Syncrude Gas
Yields, % - 73.1* 67.9 26.9* 94.8 5.2
API 8.3* 12 14.4 -4.8* 9.0** -
Viscosity
@20°C, cP 152,015 10,000 232 N/A 36,936 -
TAN,
mgKOH/g 2.41 3.3 1.7 0 0.3 -
Sulphur, ppm 40,623 35,420 28,916 54,762** 36,256 -
Asphaltenes, % 17.0* 1.7 4.3 57.2* 19.3** -
* Values reported by Da Silva, 2014
**Estimated by balances
Steam Catalytic
Cracking Unit
Solvent
De-Asphalting
Unit
Bitumen
Pitch
DAO
Syncrude
Fixed
Bed
Reactor
Gas
DAO
Processed

132
Summary and Recommended Future Work
This final chapter aims to present an overview of all the work done with the intention of evaluating
the feasibility of processing De-Asphalted Oil (DAO) in a steam catalytic cracking unit, as part of
a proposed scheme for the upgrading of Athabasca bitumen. The final conclusion reached at the
end of the project are presented as follows:
Five different catalysts were successfully developed with extrudate shape and characterized by
different metal contents. These catalysts are: Cat 1 (NiCsBa-Metakaolin), Cat 2
(NiCe-Calcined Hydrotalcite), Cat 3 (NiCe-Aegerine), Cat 4 (NiCe-Faujasite) and Cat 5 (Cat 2+
Mo2C). Among their properties, they were characterized by surface areas with the following order
Cat 4>Cat 2>Cat 3>Cat 5>Cat 1.
A bench scale plant was designed and constructed to handle very low heavy hydrocarbon flows in
the range of 1.8 ml/h and thus, small amounts of catalyst (between 3-10 g). As an advantage,
several promising catalysts can be tested in this plant without the need to prepare large amounts
of them. The steady operation of the plant could be shown by the minimum pressure drop obtained
because of sampling (about 3 psi), the relative low gradient in the reactor temperatures (less than
3°C) and the good average overall mass balance of 101%.
Thermal cracking evaluations were useful to establish a base line to evaluate the catalytic activity
of the developed solids along all the experiments. From these runs, the strong effect of temperature
variations on the conversion was seen, in comparison with the effect of the residence time.
Moreover, the relationship between conversion and properties such as viscosity, micro carbon,
micro-deasphalting and API gravity was also established.
133
Catalyst Screening
The preliminary evaluation of Cat 1, Cat 2 and Cat 3 showed the fast de-activation of most of the
solids in the first 13 hours of operations, except for Cat 2, for which de-activation took place after
being operated at 400°C. The gas analysis showed strong evidence for catalytic water splitting,
since hydrogen was produced in important quantities, in comparison with the thermal runs. The
production of hydrogen and gas hydrocarbons increased with temperature.
Catalyst Stability
During the long operation at 400 °C, all the catalyst were de-activated in the first 15-20 hours,
showing still a capability for hydrogen production afterwards. Cat 2 and Cat 1 showed high activity
for water dissociation at the beginning of the experiment, followed by de-activation of 50% and
30% respectively. The production of hydrogen by Cat 3 remained stable during the whole
operation. Moreover, analysis of the catalyst after reaction, indicated a strong coke formation on
the surface of Cat 2 and the good performance of Cat 3 at avoiding this..
Thermal cracking under the same conditions generated lighter products with lower API and
viscosity, but with asphaltene instability. Catalytic products remained stable as obtained from the
plant.
Based on product properties, no significant hydrogenation was achieved during these operations.
Water splitting verification
The mechanism proposed for catalytic steam cracking, where water molecules are dissociated on
the surface of the catalyst to generate hydrogen and oxygen radicals, was successfully evaluated
with the use of labeled water (H218O) and a quadrupole mass spectrometer. The signals monitored
with this equipment were mass to charge ratio (m/z) associated to 16O=C=16O, 18O=C=16O, and
18O=C=18O. The results showed that the active phases loaded into Cat 2 were able to dissociate

134
water and generate 18O=C=16O in high abundance in comparison with the quantities detected for
the thermal runs. Moreover, negligible generation rate for CO18O18 was observed. In general, the
transfer of labeled oxygen from the water to the carbon atoms was achieved, which shows the
water dissociation mechanism.
Operational and catalyst improvements
Based on the VMG simulation software and taking water as a reference component, the dilution
obtained when nitrogen, as carrier, was passed through the reactor was evaluated. It is expected
that this dilution also takes place in the case of the produced hydrogen, which would affect the
hydrogenating reactions. As a result, the carrier gas was no longer fed into the feed section passing
through the reactor, but rather into the hot separator.
It was also concluded that the high temperatures used at the initial stages of the evaluations (380-
400°C), were detrimental to the stability of the catalysts, since coking reactions were favored.
Therefore, the experiments were shifted toward the use of longer residence time (WHSV=0.25 h-
1), lower temperatures (350-370°C) and using catalysts containing acid sites to keep a high level
of residue conversion. Moreover, Cat 5 was developed to fix the lack of hydrogenating function
observed in the previous results by the addition of a known hydrogenating solid (Mo2C).
Under the new formulated catalyst and operational conditions, the results showed improvement in
the catalytic conversion of residue by increasing between 9 and 13 points above the thermal run at
350°C. When Cat 5 was evaluated at 370 °C, this difference increased on average by 15 points in
comparison to its respective thermal run.
The evaluation of the parameter pressure using Cat 5, showed that at 400 psi, a higher level of
conversion could be achieved for the same catalyst, temperature and space velocity. This
improvement because of pressure was mainly observed when temperatures of 370°C were used.

135
Under these conditions, Cat 5 showed activity during more than 10 hours of operation without
evidence of deactivation.
Additionally, relatively stable or slight improvements were observed for the products obtained
with Cat 5, despite the extra conversion obtained.
Overall, the best performance of the catalyst was obtained with Cat 5 operating at 400 psi, 0.25 h-1
and at 370°C, giving a residue conversion of about 45%.
Upgrading scheme evaluation
Finally the upgrading scheme was evaluated with the best result obtained using Cat 5 and assuming
the whole pitch was completely mixed with the catalytic steam cracking products. As a conclusion,
the level of conversion achieved for the DAO was not high enough to decrease the viscosity of the
syncrude to such a level that the pipeline specifications could be met. However, a reduction of
16% in the consumption of diluent is achieved in the preparation of the dilbit with this syncrude
and a gain in the price discount of the product is also obtained for improvement in TAN and sulphur
content.
If the pitch were to be used for other purposes such as for asphalt production, the DAO processed
would meet the specifications at temperatures as low as 14 °C without the need of any diluent.
Recommended Future Work
In general, the work done in this research thesis proved the activity of Cat 4 and Cat 5 toward
residue conversion. Hints of hydrogenation were found for the products of Cat 5, but substantial
hydrogenation is needed to target higher conversion or better quality products. Therefore, it is
recommended to carry out a deep study where molybdenum carbide is incorporated into the
preparation of Cat 5 in larger different proportions, while monitoring parameters such as Bromine

136
Number, asphaltenes and microcarbon, which are usually improved by the avoidance of
condensation reactions and olefin generation.
Once a better catalyst, showing good activity for residue conversion and hydrogenation, is
developed, long runs of several weeks must be done in order to assess the stability of the catalyst
with time. This evaluation is very important for the economy of the process.
In parallel, it is recommended to develop a kinetic model in order to have a good understanding
and control over the process.
Finally, the possibility of processing the generated pitch in a parallel catalytic steam cracking unit
using a similar kind of catalysts should be evaluated, but incorporating a guard bed to protect them
from metal compounds. In this way, additional improvement in viscosity can be achieved, reducing
the amount of diluent needed to meet the specifications and eliminating the production of solid
wastes.
137
References
Ancheyta, J., Sanchez, S. & Rodriguez, M. A., 2005. Kinetic Modeling of Hydrocracking of Heavy
Oil Fractions: A Review. Catalysis Today, 109(1-4), pp. 76-92.
Ancheyta, J., Trejo, F. & Rana, M. S., 2009. Asphaltenes. Chemical Transformation During
Hydroprocessing of Heavy Oils. 1st ed. Boca Raton: CRC Press. Taylor and Francis Group.
Andonova, S. et al., 2011. Structure and redox properties of Co promoted Ni/Al2O3 catalysts for
oxidative steam reforming of ethanol. Applied Catalysis B: Environmental, Volume 105, pp.
346-360.
Bacon, R. & Tordo, S., 2005. Crude Oil Price Differentials and Differences in Oil Qualities: A
Statistical Analysis, Washington: ESMAP technical Papers.
Banerjee, D. K., 2012. Oil Sands, Heavy Oil & Bitumen. From Recovery to Refinery. Oklahoma:
Penn Well Corporation.
Bartholomew, C. H. & Farrauto, R. J., 2006. Fundamentals of Industrial Catalytic Processes.
Second Edition ed. New Jersey: John Wiley & Sons, Inc.
Basile, F. et al., 2009. Ni-catalysts obtained from silicate intercalated HTlcs active in the catalytic
partial oxidation of methane: Influence of the silicate content. Catalysis Today, 142(1-2), pp.
78-84.
Beche, E. et al., 2008. Ce 3d XPS investigation of cerium oxides and mixed cerium oxide
(CexTiyOz). Surfaces and Interface Analysis, Volume 40, pp. 264-267.
Cantrell, D. G., Gillie, L. J., Lee, A. F. & Wilson, K., 2005. Structure-Reactivity Correlations in
MgAl Hydrotalcite Catalysts for Biodiesel Synthesis. Applied Catalysis A: General, 287(2), pp.
183-190.
Carbognani, L., Gozalez, M. F. & Pereira-Almao, P., 2007. Characterization of Athabasca Vacuum
Residue and Its Visbroken Products. Stability and Fast Hydrocarbon Group-Type Distributions.
Energy & Fuels, pp. 1631-1639.
Carbognani, L. et al., 2014. Reliable Determination of Water Contents of Bitumen and Vacuum
Residua via Coulometric Karl Fischer Titration Using Tetrahydrofuran. Petroleum Science and
Technology, 32(5), pp. 602-609.
Carnahan, N., Salager, J.-L. & Anton, R., 2007. Effect of Resins on Stability of Asphaltenes-
OTC19002. Offshore Technology Conference, pp. 1-9.
Cavani, F., Trifiro, F. & Vaccari, A., 1991. Hydrotalcite-Type Anionic Clays: Preparation,
Properties and Applications. Catalysis Today, Volume 11, pp. 173-301.
Climent, M. et al., 2004. Increasing the Basicity and Catalytic Activity of Hydrotalcites by
Different Synthesis Procedures. Journal of Catalysis, Volume 225, pp. 316-326.
Da Costa, P. et al., 2001. Tetralin hydrogenation catalyzed by Mo2C/Al2O3 and WC/Al2O3 in
the presence of H2S. Catalysis Today, Volume 65, pp. 195-200.
Da Silva De Andrade, F. J., 2014. Kinetic modeling of catalytic in situ upgrading for Athabasca
bitumen, deasphalting pitch and vacuum residue, Calgary: University of Calgary.
del Bianco, A. et al., 1993. Thermal cracking of petroleum residues. Fuel, Volume 72, pp. 75-80.
Dhandapani, B., Clair, T. S. & Oyama, . S., 1998. Simultaneous hydrodesulfurization,
hydrodeoxygenation, and hydrogenation with molybdenum carbide. Applied Catalysis A:
General, Volume 168, pp. 219-228.
138
dos Santos Politi, J. R., Viñes, F., Rodriguez, J. A. & Illas, F., 2013. Atomic and electronic
structure of molybdenum carbide phases: bulk and low Miller-index surfaces. Phys. Chem.
Chem. Phys, Volumen 15, pp. 12617-12625.
Duprez, D., 1992. Selective Steam Reforming of Aromatic Compounds on Metal Catalysts.
Applied Catalysis A, Volume 82, pp. 111-157.
Dyer, A., 2001. Zeolites. En: Encyclopedia of Materials: Science and Technology. s.l.:Elsevier
Science Ltd., p. 9859–9863.
Emam, E. A., 2013. Clays as Catalysts in Petroleum Refining Industry. ARPN Journal of Science
and Technology, 3(4), pp. 356-375.
Fahim, M., Al-Sahhaf, T. & Elkilani, A., 2010. Fundamentals of Petroleum Refining. First ed.
Great Britain: Elsevier.
Fan, T., Wang, J. & Buckley, J. S., 2002. Evaluating crude Oils by SARA Analysis. SPE.
Fathi, M. &. P.-A. P., 2011. Catalytic Aquaprocessing of Arab Light Vacuum Residue via Short
Space Times. Energy & Fuels, 25(11), pp. 4867-4877.
Flinn, R., Larson, O. & Beuther, H., 1960. The Mechanism of Catalytic Hydrocracking. Ind. Eng.
Chem., 156(52(2)), p. 153.
Frauwallner, M.-L.et al., 2011. Toluene hydrogenation at low temperature using a molybdenum
carbide catalyst. Applied Catalysis A: General, Volume 394, pp. 62-70.
Froment, G., 1992. Kinetic and Reactor Design in the Thermal Cracking for Olefins Production.
Chemicla Engineering Science, 47(9-11), pp. 2163-2177.
Froment, G. F., 2013. Fundamental kinetic modeling of catalytic hydrocarbon conversion
processes. Rev Chem Eng 2013, 29(6), pp. 385-412.
Garbarinoa, G. et al., 2015. A study of Ni/Al2O3 and Ni–La/Al2O3 catalysts for the steam
reforming of ethanol and phenol. Applied Catalysis B: Environmental, pp. 21-34.
Gary, J. H. & Handwerk, G. E., 2001. Petroleum Refining. Technology and Economics. Fourth ed.
New York: Marcel Dekker.
Gordon, D., 2013. The World's Growing Oil Resources: Past Present and Future, s.l.: Carnegie
Endowment for International Peace.
Green, D. W. & Willhite, G. P., 1998. Enhanced Oil Recovery. Richarson, Texas: Society of
Petroleum Engineers.
Greensfelder, B., Voge, H. & Good, G., 1949. Catalytic and Thermal Cracking of Pure
Hydrocarbons. Industrial and Engineering Chemistry, 41(11), pp. 2573-2584.
Griffiths, M. & Dyer, S., 2008. Upgraders Alley. Oil Sands Fever Strike Edmonton. 1st ed. Drayton
Valley, Alberta: The Pembina Institute.
Hassan, A., Carbognani, L. & Pereira-Almao, P., 2008. Development of an alternative setup for
the estimation of microcarbon residue for heavy oil and fractions: Effects derived from air
presence. Fuel, Volume 87, pp. 3631-3639.
Hassan, A. et al., 2013. Development of a support for a NiO catalyst for selective adsorption and
post-adsorption catalytic steam gasification of thermally converted asphaltenes. Catalysis
Today, Volume 207, pp. 112-118.
Henderson, M. A., 2002. The Interaction of Water with Solid Surfaces: Fundamental Aspects
Revisited. Surface Science Reports, 46(1-8), pp. 1-308.
Hensen, E. et al., 2010. Formation of acid sites in amorphous silica-alumina. Journal of Catalysis,
269(1), pp. 201-218.

139
Higuerey, I., Orea, M. & Pereira, P., 2002. Estimation of Visbroken and Selective Catalytic Steam
Cracked Product Stability Using IATROSCAN TLC-FID. Fuel Chemistry Division Preprints,
Volumen 47(2), p. 656.
Hsu, C. S. & Robinson, P. R., 2006. Practical Advances in Petroleum Processing. 1 ed. USA:
Springer.
Huc, A.-Y., 2011. Heavy Crude Oils - From Geology to Upgrading, an Overview. Paris: Editions
Technip.
Hu, Y. H. & Ruckenstein, E., 1997. The characterization of a highly effective NiO/MgO solid
solution catalyst in the CO2 reforming of CH4. Catalysis Letters, Volume 43, pp. 71-77.
Kaduk, J. A. & Faber, J., 1995. Crystal Structure of Zeolite Y as a Function of Ion Exchange.. The
Rigaku Journal, 12(2), pp. 14-34.
Kaewpanha, M. et al., 2015. Hydrogen production by steam reforming of biomass tar over biomass
char supported molybdenum carbide catalyst. International journal of hydrogen energy,
Volume 40, pp. 7974-7982.
Khasin, A. A. et al., 2006. Structure of the Active Component and Catalytic Properties of Catalysts
Prepared by the Reduction of Layered Nickel Aluminosilicates. Kinetics and Catalysis, 47(3),
pp. 412-422.
King, R., 2009. Minerals explained 49: Kaolinite. Geology Today, 25(2), pp. 75-78.
Kogel, J. E., Pickering, S. M. & Shelobolina, E., 2002. Georgia Kaolins : Geology and Utilization.
1st ed. Colorado: Society for Mining Metallurgy and Exploration.
Larichev, Y. V. et al., 2007. XPS and TEM Studies on the Role of the Support and Alkali Promoter
in Ru/MgO and Ru-Cs+/MgO Catalysts for Ammonia Synthesis. J. Phys. Chem. C, Volume
111, pp. 9427-9436.
Lee, Y., Carr, S. W. & Parise, J. B., 1998. Phase Transition upon K+ Ion Exchange into Na-Low
Silica X: Combined NMR and Synchrotron X-ray Powder Diffraction Study. Chem. Mater.,
Volumen 10, pp. 2561-2570.
Levy, R. & Boudart, M., 1973. Platinum-Like Behavior of Tungsten Carbide in Surface Catalysis.
Science, New Series, 181(4099), pp. 547-549.
Lutz, W., 2014. Zeolite Y: Synthesis, Modification, and Properties—A Case Revisited. Advances
in Materials Science and Engineering-Hindawi Publishing Corporation.
Ma, Y. et al., 2014. Low-temperature steam reforming of methanol to produce hydrogen over
various metal-doped molybdenum carbide catalysts. International journal of hydrogen energy,
Volume 39, p. 258.266.
McKenzie, A. L., Fishel, C. T. & Davis, R. J., 1992. Investigation of the Surface Structure and
Basic Properties of Calcined Hydrotalcites. Journal of Catalysis, Volume 138, pp. 547-561.
Minerals, S. R., n.d. Shree Ram Minerals. [Online]
Available at: http://shreeramminerals.com/minerals/about-kaolin/
[Accessed 30 January 2015].
Miranda-Trevino, J. C. & Coles, C. A., 2003. Kaolinite properties, structure and influence of metal
retention on pH. Applied Clay Science, Volume 23, pp. 133-139.
Moulder, J., Stickle, W., Sobol, P. & Bomben, K., 1995. Handbook of X-Ray Photoelectron
Spectroscopy. Eden Prairie, MN: Physical Electronics Inc..
Muñoz, M., Moreno, S. & Molina , R., 2012. Synthesis of Ce and Pr-promoted Ni and Co catalysts
from hydrotalcite type precursors by reconstruction method. International journal of Hydrogen
Energy, Volume 37, pp. 18827-18842.
140
Parkash, S., 2003. Refining Processes Handbook. 1 ed. USA: Elsevier.
Pereira-Almao, P. et al., 1999. Steam Conversion Process and Catalyst. United States, Patent No.
5885441.
Pereira-Almao, P. et al., 2013. Systems and Methods for Catalytic Steam Cracking of Non-
Asphaltene Containing Heavy Hydrocarbons. US, Patent No. 20130015100 A1.
Pereira-Almao, P., Vieman, A., Lopez-Linares, F. & Vasquez, A., 2011. Ultradispersed catalyst
compositions and methods of preparation. US, Patente nº 7897537 B2.
Pérez Zurita, M. J. et al., 2015. Hydrotalcite type materials as catalyst precursors for the Catalytic
Steam Cracking of Toluene. Fuel, Volume 154, pp. 71-79.
Pfeiffer-Vacuum, n.d. Pfeiffer Vacuum. [Online]
Available at: http://www.pfeiffer-vacuum.com/en/know-how/mass-spectrometers-and-
residual-gas-analysis/introduction-operating-principle/
[Accessed 07 July 2015].
Pitchford, A. C., 1972. Upgrading of Crude Oils. US, Patent No. 3676331 A.
Praharso, Adesina, A., Trimm, D. & Cant, N., 2004. Kinetic Study of iso-Octane Steam Reforming
Over a Nickel-Based Catalyst. Chemical Engineering Journal, Volume 99, pp. 131-136.
Robinson, P. R. & Dolbear, G. E., 2006. Hydrotreating and Hydrocracking: Fundamentals. En: C.
S. Hsu & P. R. Robinson, edits. Practical Advances in Petroleum Processing. US: Springer,
pp. 177-218.
Rocha, A. S. et al., 2044. Low temperature low pressure benzene hydrogenation on Y zeolite-
supported carbided molybdenum. Catalysis Today, Volume 98, pp. 281-288.
Romeo, M. et al., 1993. XPS Study of the Reduction of Cerium Dioxide. Surface and Interface
Analysis, Volume 20, pp. 508-512.
Sanchez, S., Rodriguez, M. A. & Ancheyta, J., 2005. Kinetic Model for Moderate Hydrocracking
of Heavy Oils. Ind. Eng. Chem. Res., 44(25), pp. 9409-9413.
Siddique, R., 2008. Waste Materials and By-Products in Concrete. 1st ed. Heidelber: Springer.
Speight, J., 1999. The Chemistry and Technology of Petroleum. 3rd ed. New York: Marcel Dekker.
Speight, J. G., 2013. Heavy and Extra-Heavy Oil Upgrading Technologies. First ed.
Massachusetts: Gulf Professional.
Speight, J. G., 2014. High Acid Crudes. MA: Gulf Publishing Company.
SRI-Instruments, 2014. SRI Instruments. [Online]
Available at: http://www.srigc.com/MG3.pdf
[Accessed 2014 01 13].
Stanislaus, A., Absi-Halabi, M. & Al-Dolama, K., 1989. Effect of Nickel on the Surface Acidity
of y-Alumina and Alumina-Supported Nickel Molybdenum Hydrotreating Catalysts. Applied
Catalysis, Volume 50, pp. 237-245.
Tamele, M., 1950. Chemistry of the surface and the activity of alumina-silica cracking catalyst.
Discuss. Faraday Soc., Volume 8, pp. 270-279.
Tang, M., Xu, L. & Fan, M., 2014. Effect of Ce on 5 wt% Ni/ZSM-5 catalysts in the CO2 reforming
of CH4 reaction. international journal of hydrogen energy, Volume 39, pp. 15482-15496.
Taylor, R. H., Wingbo, C., Christian, G. D. & Ruzicka, J., 1992. Bromine Number Determination
by Coulometric Flow-Injection Titration. Talanta, 39(7), pp. 789-794.
Thiel, P. A. & Madey, T. E., 1987. The Interaction of Water With Solid Surfaces: Fundamental
Aspects. Surface Science Reports, 7(6-8), pp. 211-385.

141
U.S. Energy and Information Administration, 2014. U.S. Energy and Information Administration.
[Online]
Available at: http://www.eia.gov/cfapps/ipdbproject/IEDIndex3.cfm?tid=5&pid=57&aid=6
[Accessed 16 December 2014].
U.S. Energy Information Administration, 2014. International Energy Outlook 2014, Washington:
U.S. Energy Information Administration.
Uchiyama, M., Kaneko, N. & Ibaraki, 1974. Catalytic Steam De-alkilation. United States, Patente
nº 3812196.
Van Den Berg, F. G. A. et al., 2010. Method of producing a pipelineable blend from a heavy
residue of a hydroconversion process. USA, Patent No. US7799206 B2.
Villalanti, D. C., Raia, J. C. & Maynard, J. B., 2010. High-temperature Simulated Distillation
Applications in Petroleum Characterization. En: Encyclopedia of Analytical Chemistry.
Chichester: John Wiley & Sons Ltd, p. 6726–6741.
Vitale, G., 2013. Iron Silicate Nano-Crystals as Potential Catalysts or Adsorbents for Heavy
Hydrocarbons Upgrading, Calgary: University of Calgary.
Vitale, G., Frauwallner, M., Scott, C. & Pereira-Almao, P., 2011. Preparation and characterization
of low-temperature nano-crystalline cubic molybdenum carbides and insights on their
structures. Applied Catalysis A: General, Volume 408, pp. 178-186.
Vitale, G. et al., 2015. Synthesis of nanocrystalline molybdenum carbide materials and their
characterization. Catalysis Today, Volume 250, pp. 123-133.
Wang, H. et al., 2009. Effects of olefin on adsorptive desulfurization of gasoline over Ce(IV)Y
zeolites. Fuel Processing Technology, Volume 90, pp. 835-838.
Wang, J. et al., 2009. The enhanced adsorption of dibenzothiophene onto cerium/nickel-exchanged
zeolite Y. Journal of Hazardous Materials, Volume 163, pp. 538-543.
Ward , J. W., 1993. Hydrocracking processes and catalysts. Fuel Processing Technology, Volume
35, pp. 55-85.
Ward, J. W., 1969. The Nature of Active Sites on Zeolites X. The Acidity and Catalytic Activity
of X Zeolites. Journal of Catalysis, Volume 14, pp. 365-378.
Xiao, T.-c.et al., 2000. Preparation of molybdenum carbide-based catalysts for deep HDN. Acad.
Sci. Paris, Se´rie IIc, Chimie / Chemistry, Volume 3, pp. 451-458.
Zhang, R., Wang, . H. & Hou, X., 2014. Catalytic reforming of toluene as tar model compound:
Effect of Ce and Ce–Mg promoter using Ni/olivine catalyst. Chemosphere, Volume 97, pp. 40-
46.
Zhang, Y. et al., 2009. Influence of Rare Earth Promoters on the Performance of Ni/Mg(Al)O
Catalysts for Hydrogenation and Steam Reforming of Toluene. Rare Metals, 28(6), pp. 582-
589.

142
Appendix A: STANDARD OPERATING PROCEDURE OF CATALYST TESTING UNIT
(CTU-1)
143
University of Calgary
HEALTH, SAFETY AND ENVIRONMENTAL
STANDARD OPERATING PROCEDURE FOR: Catalyst Test Unit 1 (CTU-1
Issued: Eduardo Garcia
Revised: Alejandro Coy
Reviewed:
Pages
1. PURPOSE / BACKGROUND
The Catalyst Testing Unit (CTU-1) was built with the goal of evaluating the performance of
different kinds of catalyst in a fixed bed reactor during catalytic steam cracking process of a heavy
oil cut. The advantage of this system lies in its small size reactors (3/8’’ and ½’’), which allows
the user to evaluate a catalyst in relatively small quantities, ranging between 1-10 g. Moreover, the
plant can be also used for other processes such as thermal cracking and hydroprocessing. With the
current configuration, the plant is able to handle pressures up to 480 psi and a wide variety of
temperature up to 500⁰C for the reactor and 250⁰C for the feed section.
This procedure is written to comply with all of the U of C HS&E regulatory requirements, and to
teach new users, the standard operative protocols of the CTU-1.

144
2. SCOPE
This procedure is intended for all those workers and/or students/interns working in the Upgrading
and Refining Lab that will be operating the Catalyst Testing Unit 1 (CTU-1). The procedure covers
specific information about starting up of the unit, pressurization, heating up, stabilization period,
mass balances procedures, shutting down and learning experiences.
In order to keep track of the information provided in this document, consult the P&ID of the plant
and the instruments, thermocouples, valves, manometer and other devices lists shown in the
Appendix.
3. PREREQUISITES AND SAFETY ISSUES
Specific information related to the feedstock to be processed, catalyst formulation, operational
conditions, test length, have to be provided in the experimental plan. Typical machine shop tools
are required in case of any repair, change or adjustment in the system.
Successful completion of the University of Calgary generic WHMIS course and H2S Alive course
are also be required.
Protocol:
Do not work alone in the laboratory. If required, follow University of Calgary procedures for
working alone (http://www.ucalgary.ca/safety/workingalone)
Be aware of the inherent risks associated to, and the nature of, the processes and materials used
in the laboratory. This is not limited to the risks and hazards in one own equipment, but
extended to include those of every other person in the laboratory.
Wear appropriate laboratory attire (lab coat, safety glasses, and closed shoes).
Maintain a neat and organized working environment.
145
If leaving an experiment unattended, ensure others are aware and understand the situation
including how to deal with an emergency situation. Leave a telephone number at the
experiment for contact purposes.
Dispose of waste in a safe and environmentally friendly manner.
Campus Security:
Hazard Identification (Hazardous Chemicals or Processes):
Hazardous Chemicals
Products and by-products expected from the system are:
o Hot heavy oils from the feed section, reactor and heavy product tanks.
o Toluene in the feed section
o Nitrogen and/or Hydrogen compressed gas
o Light liquid hydrocarbons
o Hydrocarbon gases
o H2S in concentrations lower than 200 ppm
Processes:
Heavy oils flowing under moderate pressure and temperature conditions.
Hazard Assessment:
Products:
Reaction Gas and the gas exit of the storage tank (T-2) is sweetened in a KOH or NaOH solution
at the outlet gases stream.
Personnel must wear personal protective equipment (PPE) all the time when working with the
unit.
Use of toluene should be done discretely and only when strictly needed.

146
Processes:
Heat insulation is used in all process lines under high temperature conditions.
Pressure relief device is located in the feed section to protect the system in the case of an
overpressure caused by plugging of a process line.
Engineering/Ventilation Controls:
The CTU-1 was built inside an enclosure with extraction system able to remove gases produced
by the chemicals involved and the gases produced during operation of the system.
Personal Protective Equipment:
Personal protective equipment (PPE) required for this SOP includes but is not limited to:
Nitrile gloves, safety glasses and laboratory coats are standard safety equipment for all employees,
students and interns in the lab.
Respirators with adequate filters/cartridges when cleaning any oil or emulsion spill from the plant
using any type of solvent like toluene, acetone, gasoline, etc.
Quartz gloves are needed for handling high temperature objects.
4. PLANT DESCRIPTION
4.1.PHYSICAL DESCRIPTION
The unit CTU-1 can be divided in three sections. The first section (Feed section), consist of all the
lines and connections involved in the preparation of the reactants at the desired conditions to be
sent into the reactor. In the P&ID (see Appendix), it can be seen as all the system to the left of the
reactor until the valve V-10. The second section, the reaction sections, involves the reactor, bypass
and the valves V-10 and V-11. The final section called sampling section, is the part of the plant
where the products are separated into liquid and gases to allow the sampling of them.

147
The feed section contains three liquid inlets and two gas inlets to the plant. From the three liquid
inlets, one is used for pumping oil through a Teledyne isco syringe pump (P-1), another Teledyne
isco syringe pump is used for pumping water (P-2) and one extra line is in spare for future
reactants. Gases inlets are considered for nitrogen and hydrogen. Nitrogen is used as carrier gas
and can be fed into the plant either in the feed section or in the hot separator (S-1). Hydrogen is
used for reduction of the metals in the catalyst and can also be used when hydro-conversion
operations are needed. Water is heated in the feed section to favor its vaporization and produce
steam. This steam is mixed with nitrogen (when fed into the feed section) in M-1 and then with
oil. In the last part of the feed section, these three compounds are mixed and heated before entering
the reaction zone.
The reaction zone consists basically of a up-flow fixed bed reactor, with temperature
measurements in the wall, inside the reactor and at the exit of it, to control the operating conditions.
For cleaning and special operations, this section is equipped with a bypass that allows for passing
fluids without contaminating the catalytic bed.
The sampling zone is at the same time divided in two parts: Liquid sampling and Gas sampling.
The products of the reactor are separated in a 150 ml hot separator (S-1), where gases, water and
light hydrocarbons leave the vessel from the top and go to a 75 ml cold separator (S-2). The gases
are cooled down in HE-1, which leads to water and light hydrocarbon condensation. The remaining
gases leave S-2 and are quantified in a flowmeter (F-1). Before gases leave the plant, they have to
go through a pressure controller or back pressure valve, which keep the pressure in the system.
After this point, V-34 allows the operator to send the gases for analysis in a GC or to send them
for H2S neutralization in a KOH containing vessel.
148
The liquids obtained in S-1 are transferred to a 150 ml storage tank (T-1) by aliquots through a
two valve system (V-18 and V-19) controlled with the LabVIEW Program. V-18 is constantly
open during normal operations. When a sample is needed, V-18 close and V-19 open to fill T-1.
After discharging the aliquot of around 3 ml contained in between the two valves, V-18 close and
V-19 open again. In this way, it is possible to obtain samples of the liquids products without
affecting strongly the pressure in the system. Samples of light hydrocarbons and water from S-2
can be obtained by performing similar operations but with V-15 and V-23. Manually, V-15 must
be opened to fill a small volume of tube, and then it must be closed to proceed to open V-23.
4.2. LABVIEW SYSTEM
The CTU-1 is controlled by means of a real time power PC (cRio-9024) from National Instruments,
which is in charge of collecting information from the plant such as temperature, pressures and gas
flows in order to record them in an excel file in the PC located outside of the extracting enclosure.
This system also performs the controlling of the heating tapes, pumps and liquid sampling valves
(V-18 and V-19).
The cRio-9024 system starts up by means of a code written in LabVIEW program, whose shortcut
can be found in the desktop of the computer under the name CTU-1. Once the CTU-1 program is
opened, the following display is obtained.

149
Figure 1. PFD display of the CTU-1 LabVIEW program.
The next step is to click on the run button, which will pop up a window to set the name of the excel
file and the place where all the data is going to be saved. Then, it is necessary to click on the
connect button to start the interaction with cRio-9024. At any moment desired, the stop button will
lead to a completely stop of the program and the activities running by that time.
The whole program consists of four different displays to be selected by means of the tabs buttons
in the Figure 1. The PFD tab basically shows the process flow diagram of the plant with basic
information to keep track of the process. Specifically, it shows the pressure of the system measured
by the pumps and back pressure valve, the temperatures along the plant, the produced gas flow,
nitrogen and hydrogen gas flows and the three internal and one external temperature of the reactor.

150
Figure 2. System control display of the ctu-1 LabVIEW program
The second tab, called system control (Figure 2), allows the operator to monitor and control the
heating tapes, temperatures, flow delivered by the mass flow controllers, to set the pressure in the
pressure controller and to control the liquid sampling valves.
The first row of switches in the Heater Control System gives the possibility to work with a specific
percentage of the heating tape (left) or with a desired temperature set point (right). If desired, the
temperature set point can be reached by means of a ramp by activating the corresponding switch
in the second row of switches. By doing so, it is possible to establish the desired temperature and
the rate (°C/min) required to reach it. The third set of switches can be used to activate the output
limit to establish a maximum output limit for the heating tapes, usually no more than 75% as per
experience. In the PID tuning parameters, the proportional, integral and derivative parameter can
be added for each heater. At the far right of that part, the real value of the temperature and the
output sent to the heating tapes is shown.

151
In the valve control section, the operator can choose between either operate the valve manually
with the green buttons or configure it to work by itself every certain period of time. In the Flow
and Pressure Control, the operator can set the aperture percentage for the MFC-1 and MFC-2; and
the pressure for the pressure controller PC-1. By selecting the desired heater, it is possible to keep
track of the temperature and the profile through the chart in this section. There is also a Heater
Alarm section, in which we can set the HI and HI HI alarms for the heaters. To finish, it is also
possible to carry out of the tuning of the heating tapes controllers.
The third display (ISCO Pump) allows the operator to set either the delivery pressure or flowrate.
Besides, it also gives information regarding the current pressure, volume remaining in the pumps
and flow rate of each pump in the system. The Pump A correspond to the oil pump (P-1) and
Pump B to water pump (P-2).
Figure 3. Isco pump display of the CTU-1 LabVIEW program
The last display called Diagnostic (Figure 4) is used to evaluate the right performance of the
program regarding temperatures, currents of the instruments and heater output at certain time.
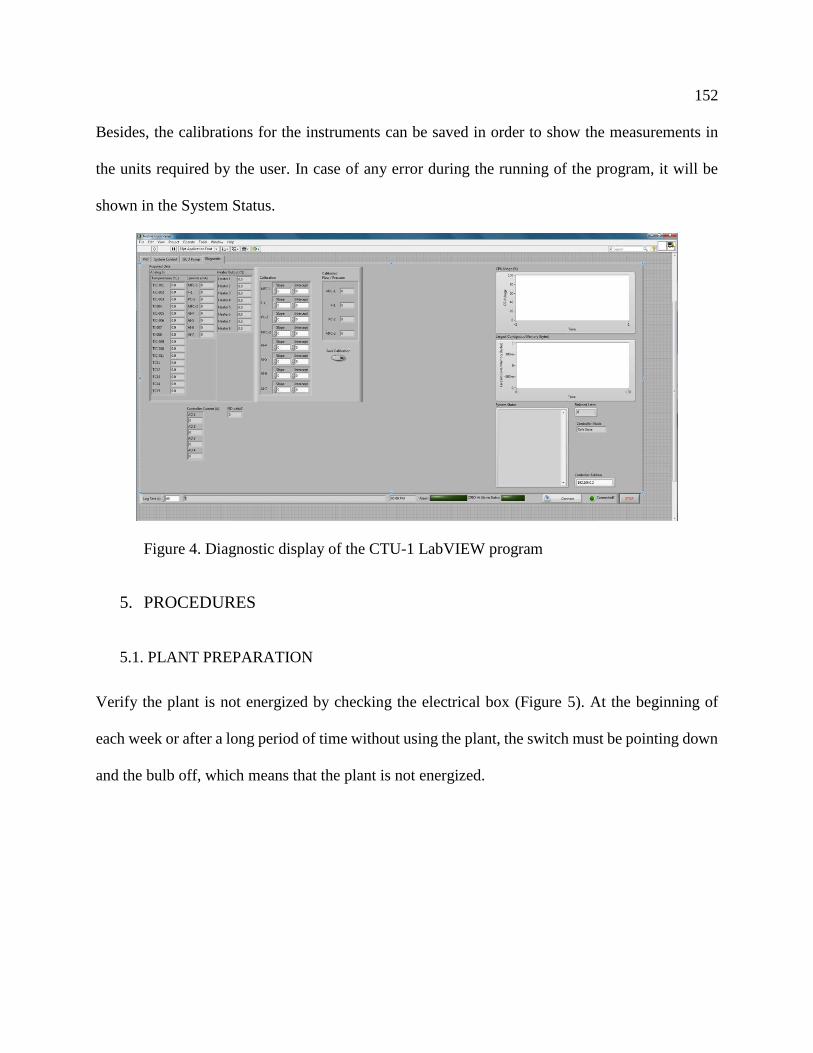
152
Besides, the calibrations for the instruments can be saved in order to show the measurements in
the units required by the user. In case of any error during the running of the program, it will be
shown in the System Status.
Figure 4. Diagnostic display of the CTU-1 LabVIEW program
5. PROCEDURES
5.1. PLANT PREPARATION
Verify the plant is not energized by checking the electrical box (Figure 5). At the beginning of
each week or after a long period of time without using the plant, the switch must be pointing down
and the bulb off, which means that the plant is not energized.

153
Figure 5. Electrical box.
1. Make sure all the valves in the plant are closed and the manometers indicate 0 psi.
2. Check the pressure of the inlet gases (N2 and H2). They shouldn’t be at values greater than
500 psi.
3. Check Nitrogen cylinder pressure, it shouldn’t be below 500 psig.
4. Set the regulator valve at the Nitrogen and Hydrogen cylinder so the supply is 50 psi over
the operating pressure and not greater than 500 psig.
5. Verify there is no pressure in the plant by checking the pressure gauges and indicators and
the pressure readings of the feed pumps and water pumps. In the case the pressure readings
are above 10 psig, open the drain valve on the pressurized section.
Bulb
Switch
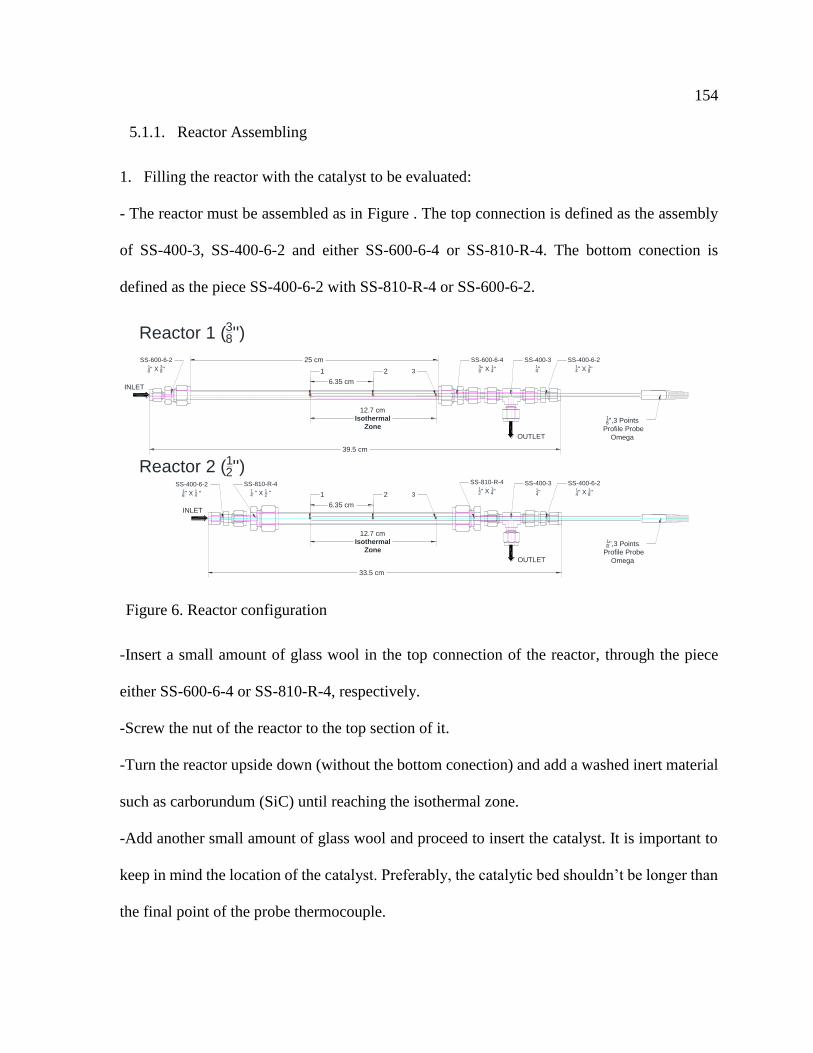
154
5.1.1. Reactor Assembling
1. Filling the reactor with the catalyst to be evaluated:
- The reactor must be assembled as in Figure . The top connection is defined as the assembly
of SS-400-3, SS-400-6-2 and either SS-600-6-4 or SS-810-R-4. The bottom conection is
defined as the piece SS-400-6-2 with SS-810-R-4 or SS-600-6-2.
Figure 6. Reactor configuration
-Insert a small amount of glass wool in the top connection of the reactor, through the piece
either SS-600-6-4 or SS-810-R-4, respectively.
-Screw the nut of the reactor to the top section of it.
-Turn the reactor upside down (without the bottom conection) and add a washed inert material
such as carborundum (SiC) until reaching the isothermal zone.
-Add another small amount of glass wool and proceed to insert the catalyst. It is important to
keep in mind the location of the catalyst. Preferably, the catalytic bed shouldn’t be longer than
the final point of the probe thermocouple.
12.7 cmIsothermal
Zone
25 cm
1 32
6.35 cm
39.5 cm
SS-600-6-218'' X 38''
SS-600-6-438'' X 14''
SS-400-314''
SS-400-6-214'' X 18''
INLET
OUTLET
18'',3 Points
Profile Probe
Omega
OUTLET
18'',3 Points
Profile Probe
Omega
3
12.7 cmIsothermal
Zone
2
6.35 cm
SS-810-R-412'' X 14''
SS-400-314''
SS-400-6-214'' X 18''1
INLET
SS-810-R-414 '' X 12 ''
SS-400-6-218'' X 14 ''
33.5 cm
Reactor 1 (38'')
Reactor 2 (12'')

155
-Put in more glass wool and continue to insert more carborundum until the reactor is almost
full. A small volume must be left for inserting more glass wool.
-Proceed to close the reactor and install it into the plant.
2. Align V-11 to off-mode.
3. Open the valve that feed the system with nitrogen (V-1)
4. Increase the pressure of the system to about 450 psi by opening V-20 (Bypass to the
MFC-1).
5. Add a liquid leak detector to each connection of the reactor and its connection with the
plant.
6. If bubbles are produced in any connection, proceed to tighten it until the leakage stops.
7. Once the desired pressure is reached, close V-20. Make sure the valves that feed the plant
are closed (V-3, V-5, V-7 and V-29).
8. Record the pressure change in the manometer located before entering the reactor (PI-005).
9. In order to operate the plant properly, the pressure drop should be less (preferably zero)
than 0.5% of the pressure used to carry out the leak test in a period of one hour.
10. Once the leak test ends up successfully, two heating tapes of 0.5’’x 2’’ can be located
around the reactor. H-005 start wrapping the reactor from the point 2 to the inlet, while
H-004 does it from the point 2 to the outlet. Both heating tapes must start from the side of
it that is attached to the wire.
11. Allocate the nearby insulation and the jacket.
12. Energize the plant by turning on the switch shown in Figure 5.
13. Turn on the pumps P-1 and P-2.
156
14. Open LabVIEW Program “CTU-1” located in the desktop of the computer.
5.1.2. Reactor disassembling
1. If the system is energized, check the temperatures of the plant in the LabVIEW Program
“CTU-1” and make sure the system had been cooled down.
2. If the electrical box is off, make sure the reactor has been already cooled down.
3. If the manometers are indicating pressure in the system, depressurise the plant as
mentioned in Section 5.2.1.
4. Proceed to remove the jacket and the necessary insulation to disassemble the reactor.
5. Loosen the nut in the bottom of the reactor and in the right exit of the Tee settled at the
top of it.
6. Remove the reactor from the set up.
5.1.3. Pumps loading
1. Depending on the pump to be filled, close V-3, V-5 or V-7 accordingly.
2. Set V-31 in the filling direction for the water pump or open V-33 and make sure that the
drainage (V-32) is close in the case of the oil pump.
3. For P-2, insert the filling tube of the pump into a vessel with the fluid. In the case of P-1,
add the oil to the storage tank (T-2) and pressurize the system with nitrogen using V-36.
4. In the case of oil, heat the pump up to 100⁰C through LabVIEW using Heater 8. The tank
can be heated up by means of a rheostat and heating tapes already located in the plant. Wait
for a couple of hours to allow all the oil to be heated up. ATTENTION: Always start
heating the oil pump with V-33 open to avoid overpressure in the pump, especially if there
is already liquids inside it.
157
5. Proceed to select “Refill” in either the LabVIEW program for pumps or manually in the
pumps controller. Preferable, select a low flowrate up to 300 ml/h to avoid the formation
of bubbles inside the pump.
6. Once the pumps have been filled up, they must be purged:
-For P-2, select the run mode for the pump and wait until the liquid comes out. Then, stop
the pump and proceed to refill it again. Repeat this step until it pumps liquid right after
asking it to. (Attention: make sure V-31 is still in filling mode before running the pump to
avoid overpressures)
-In the case of P-1, it is necessary to close V-33 and open V-32 to proceed to run the pump.
As with P-2, stop the pump when the liquid comes out and refill it again by opening V-33
and closing V-32.
7. During the purge process, the pumps can be evaluated to assess if they are well calibrated
and sending the right flowrate. In order to do that, just collect and measure the amount of
liquid pumped in a specific range of time.
8. Once the pumps are filled and purged, align the valve V-31 to the process line, close V-33
and V-32.
9. To finish, open V-3, V-5 and V-7 accordingly.
5.2. PLANT OPERATION
5.2.1. Pressurization and depressurization
During the operation of the CTU-1, it is often required to pressurize the plant to reach the operating
pressure. In order to do that, it is necessary to check that all the drainage valves are closed. The
nitrogen mass flow controller (MFC-1) allows the user to feed the plant with nitrogen until

158
reaching the desired pressure. However, due to the low volumetric capacity of this instrument, a
needle valve controls the bypass line to this instrument and allows the user to increases the pressure
manually in a faster way. Once the desired pressure is reached, the MFC-1 bypass valve should be
closed. To pressurize the whole plant, it is required to align the two three-way valve before and
after the reactor to either “reactor mode” or to the “bypass mode”. The pressure in the system can
be controlled by either a backpressure valve or a pressure controller. Each one of those has a set
of two valves at the inlet and at the outlet that isolate the one not used. ATTENTION: it is
important to bear in mind that the back pressure valve operates up to 490 psi and the pressure
controller up to 270 psi. Overpressure can cause serious damage to the equipment, especially to
the pressure controller.
The safest way to carry out a depressurization of the system is by opening the back pressure located
at the exit of the plant. In order to do that, it is necessary to open both of the valves that isolate
the back pressure and then proceed to open it. If the pressure controller (PC-1) is working, it is
also possible to depressurize the system by setting a pressure equals to zero psi in the PC-1 in
LabVIEW and checking that both of the valves that isolate the PC-1 are open.
In the case that the bypass or the feed zone are isolated from the sampling zone during
depressurization, it will be necessary to align the two three-way valves before and after the reactor
to either “reactor mode” or “bypass mode”. The bypass can be also depressurized by means of the
drainage valve collocated in that section, but it will require collecting the liquid stored in the line.
5.2.2. Start-up
During the start-up and stabilization of the plant, some areas require to be heated using the heating
tapes. When carrying out this heating, the following temperature increase ramps shall be used:
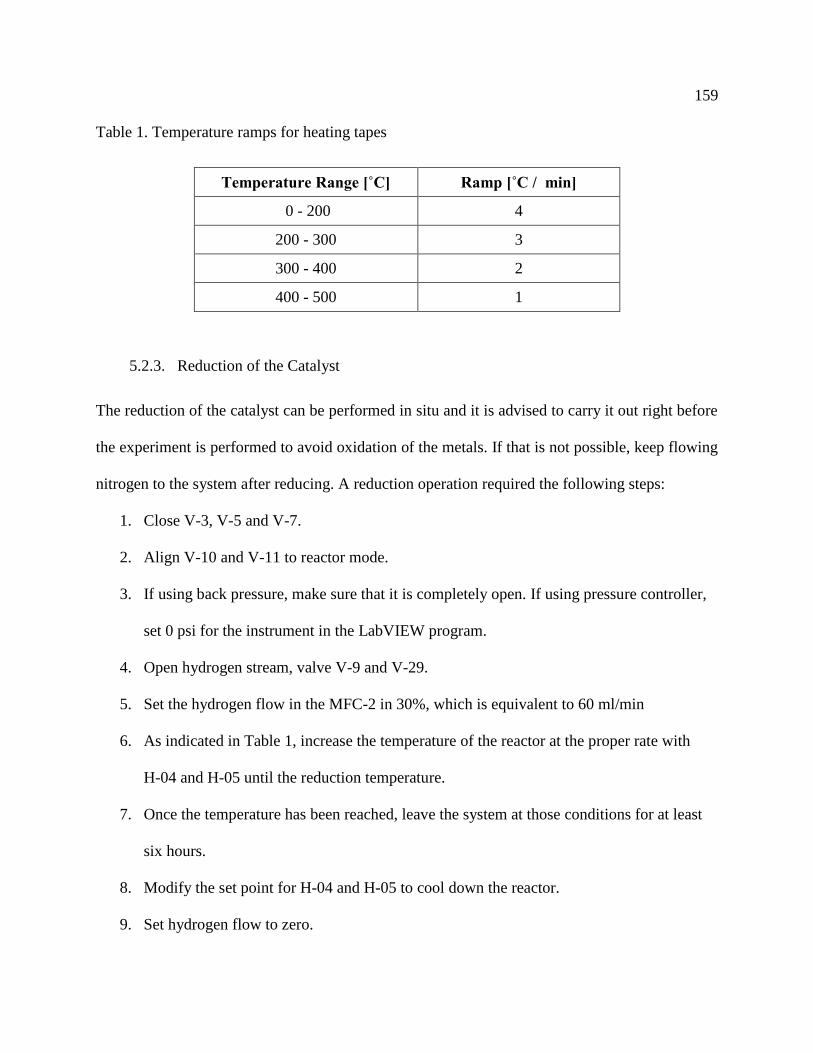
159
Table 1. Temperature ramps for heating tapes
Temperature Range [˚C] Ramp [˚C / min]
0 - 200 4
200 - 300 3
300 - 400 2
400 - 500 1
5.2.3. Reduction of the Catalyst
The reduction of the catalyst can be performed in situ and it is advised to carry it out right before
the experiment is performed to avoid oxidation of the metals. If that is not possible, keep flowing
nitrogen to the system after reducing. A reduction operation required the following steps:
1. Close V-3, V-5 and V-7.
2. Align V-10 and V-11 to reactor mode.
3. If using back pressure, make sure that it is completely open. If using pressure controller,
set 0 psi for the instrument in the LabVIEW program.
4. Open hydrogen stream, valve V-9 and V-29.
5. Set the hydrogen flow in the MFC-2 in 30%, which is equivalent to 60 ml/min
6. As indicated in Table 1, increase the temperature of the reactor at the proper rate with
H-04 and H-05 until the reduction temperature.
7. Once the temperature has been reached, leave the system at those conditions for at least
six hours.
8. Modify the set point for H-04 and H-05 to cool down the reactor.
9. Set hydrogen flow to zero.

160
10. Close V-29, V-9 and the hydrogen cylinder.
11. Set a flow rate to the MFC-1 of 50% (15 ml/min) and let the nitrogen flush the hydrogen
out of the plant.
5.2.4. Reaction
Once the catalyst has been reduced, the following step must be accomplished in order to
successfully perform the operation of the unit:
1. Make sure V-10 and V-11 are in reactor mode.
2. Leave back pressure or pressure controller fully open.
3. By opening V-17, V-18, V-19, V-14, and V-22 drain the hot separator; and by opening
V-15 and V-23, drain the cold separator.
4. Close all the valve involved in step 3 except for V-17 and V-18.
5. Set a nitrogen flow for MFC-1 of 13.5% (4.1 ml/min) and record the value measured by
the flowmeter (F-1) after stabilization of it (check on the charts for gas flow in the
LabVIEW program.)
6. With the ramps range for each temperature shown in the Table 2, reach the following set
point for the heating tapes:
Table 2. Initial heating tapes set points.
Heating Tape Temperature (oC)
H-01 210-250
H-02 210-250
H-03 210-250
H-04 (Top) Reaction temperature
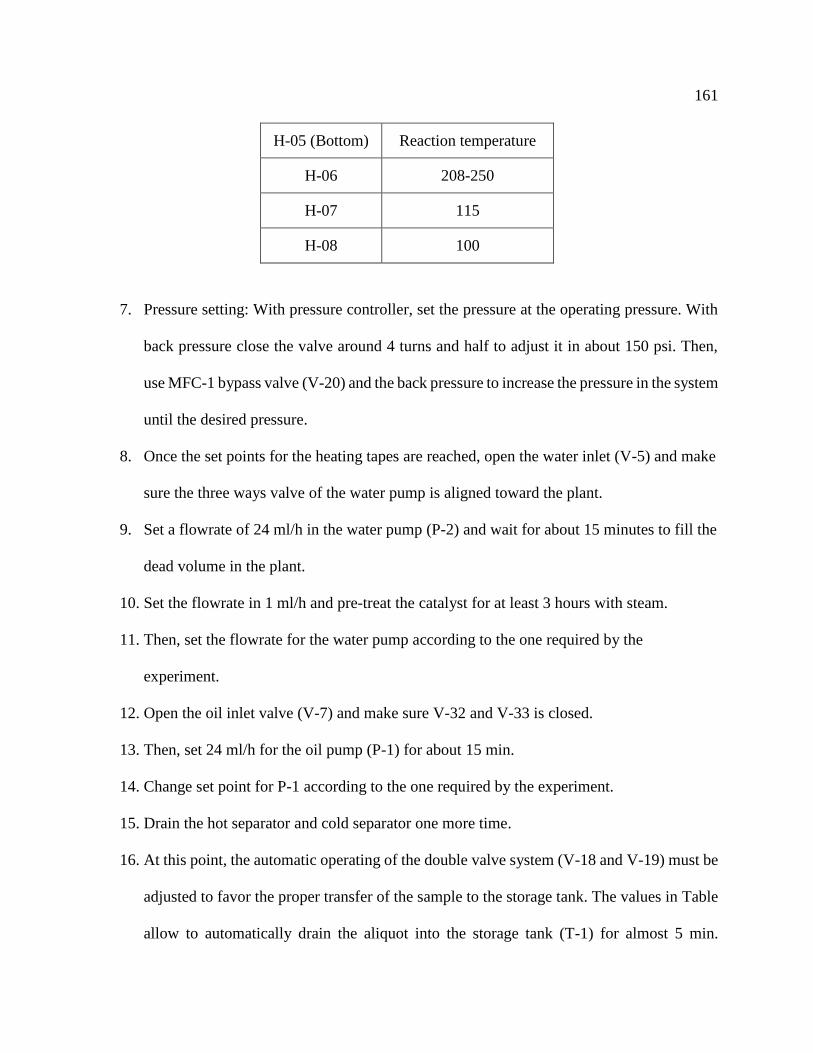
161
H-05 (Bottom) Reaction temperature
H-06 208-250
H-07 115
H-08 100
7. Pressure setting: With pressure controller, set the pressure at the operating pressure. With
back pressure close the valve around 4 turns and half to adjust it in about 150 psi. Then,
use MFC-1 bypass valve (V-20) and the back pressure to increase the pressure in the system
until the desired pressure.
8. Once the set points for the heating tapes are reached, open the water inlet (V-5) and make
sure the three ways valve of the water pump is aligned toward the plant.
9. Set a flowrate of 24 ml/h in the water pump (P-2) and wait for about 15 minutes to fill the
dead volume in the plant.
10. Set the flowrate in 1 ml/h and pre-treat the catalyst for at least 3 hours with steam.
11. Then, set the flowrate for the water pump according to the one required by the
experiment.
12. Open the oil inlet valve (V-7) and make sure V-32 and V-33 is closed.
13. Then, set 24 ml/h for the oil pump (P-1) for about 15 min.
14. Change set point for P-1 according to the one required by the experiment.
15. Drain the hot separator and cold separator one more time.
16. At this point, the automatic operating of the double valve system (V-18 and V-19) must be
adjusted to favor the proper transfer of the sample to the storage tank. The values in Table
allow to automatically drain the aliquot into the storage tank (T-1) for almost 5 min.

162
Therefore, if sampling is required e.g. every 90 min (5400 s), the value of X should be
5100 s.
Table 3. V-18 and V-19 automatic timing
Parameter Time, s
Repeat Time 5
V-18 open time x
Delay Time 5
V-19 Open time 290
17. When all the conditions (temperatures, pressure and flow) reach the desire set point, the
stabilization period is started. Wait the time established in the experimental plan (as a rule
of thumb, the time required will be the minimum time to pass 3.5 times WHSV).
1. During the stabilization period, change V-34 from Vent mode to GC mode, in order to send
the gases to the GC.
2. Make sure that the GC is on and working properly. Check the valve in RTU-1, as shown
in the Figure 6, is on CTU-1 mode to send gases to the GC located in either in RTU-1 or
RTU-2.
Figure 7. Valve located in RTU-1 to send gases to GC.
163
3. There are two three ways valve located each one in RTU-1 and RTU-2. Make sure that if
it is desired to use the GC in RTU-2, the valve in RTU-1 should be in RTU-2 mode and
the valve in RTU-2 should be in RTU-2 mode. In the case that the GC to be used is the one
located in RTU-1, the valve in RTU-2 should say RTU-2 and the valve in RTU-1 should
say RTU-1.
4. Once the valves for the gases are settled in the right position, measure the gas flow from
F-1 and from the flow meter attached to the GC. Then, run the GC.
The length of each mass balance is determined by the flowrate used for water and oil and the
amount of sample required for analysis. At the end of the mass balance, the heavy products should
rest in T-2 for about 30 min to allow the oil to reach the end of the tank and obtain better mass
balances. The sampling of lights is done right when the mass balance closes by operating V-15
and V-22 like the way V-18 and V-19 do.
5.3. SHUTDOWN
In order to shut the plant down during or at the end of an experiment, follow the next steps:
1. Set the oil pump (P-1) to 0 ml/h, close valve V-7 and open V-33
2. Leave water pump running for around 30 minutes to clean the system out.
3. After 30 min, set all the heating tapes to 0oC to cool down the system.
4. When all thermocouples indicate temperatures lower than 100 oC, proceed to depressurize
the system.
5. Set the water pump (P-2) to 0 ml/h.
6. Let the nitrogen to flow the system for at least 30 min at 50%.
7. Drain completely the hot separator (S-1), storage tank (T-1) and cold separator (S-2).
164
8. After draining, close the two valves at the exit of the T-1 and S-1.
9. Set the MFC-1 to 0 ml/h.
10. Make sure everything was recorded in the computer.
11. Stop the LabVIEW program and turn the electrical box off.
12. Let the system to cool down.
13. Once it is cold, dissemble the reactor as explained in 4.1.3 (reactor dissembling)
5.4. EMERGENCY SHUTDOWN
If any emergency situation is presented that is required to shut down the unit immediately, follow
the procedure below:
1. Decrease the whole plant temperature to room temperature (Turn heating tapes off).
2. Turn off the feed pump, water pump, and Hydrogen flow controller.
3. Depressurize the system.
4. If it is a high risk emergency, turn off the switch of the electrical enclosure located close to
the computer. It will de-energize all heating tapes and flow controllers. Switch off both
syringe pump.
5. Another way to de-energize the unit is disconnecting the plugs from the electrical enclosure
and the pumps.
6. Roles & Responsibilities
Key Personnel
Main operator and responsible of the system:
Luis Alejandro Coy - Eduardo García
165
Alternate operators: N/A
7. Training
It is recommended that a person to operate the CTU-1 be educated or pursuing studies in
the area of chemical or petroleum engineering and/or chemistry.
Any new operator of the RTU-1 has to follow an operational training conducted by either
the main operator or alternate operator. The operational training would be no shorter than
three whole experimental runs which include previous preparation of the unit, starting up,
stability condition, mass balances and shutting down of the plant.
As per the pre-requisites of entering the lab, The University of Calgary Generic WHIMS
course must be successfully completes.
8. Monitoring Requirements
Not applicable
9. Record Management
Each SOP shall be reviewed within 12 months of the date of issuance or date of last, review
to ensure the SOP is up-to-date.
This first SOP for the CTU-1 unit has been submitted on February 14, 2014
10. References
11. Definitions
Not applicable
12. Emergency:
Contact 911

166
University Emergency:
Immediately supervisor: Luis Alejandro Coy
Principal Investigator: Dr. Pedro Pereira-Almao
13. University Notification
Indicate if there are any concerns that EH&S should be made aware of prior to the start of a
particularly hazardous protocol, such as a disruption to a water source, loss of power, loss of gas
detection systems etc.
*Indicates elements which may be required for particularly hazardous substances or processes.
Signed: _________________________ Date: __________________________
Principal Investigator/Manager Signature
14. Appendix
Table 4. List of equipment
TAG Description
HE-1 Heat Exchanger after Reactor
M-1 Mixer in Feed Zone
P-1 Oil Pump
P-2 Water Pump
P-3 Spare Pump (Currently not available)
R-1 Reactor
S-1 Hot Separator
S-2 Cold Separator
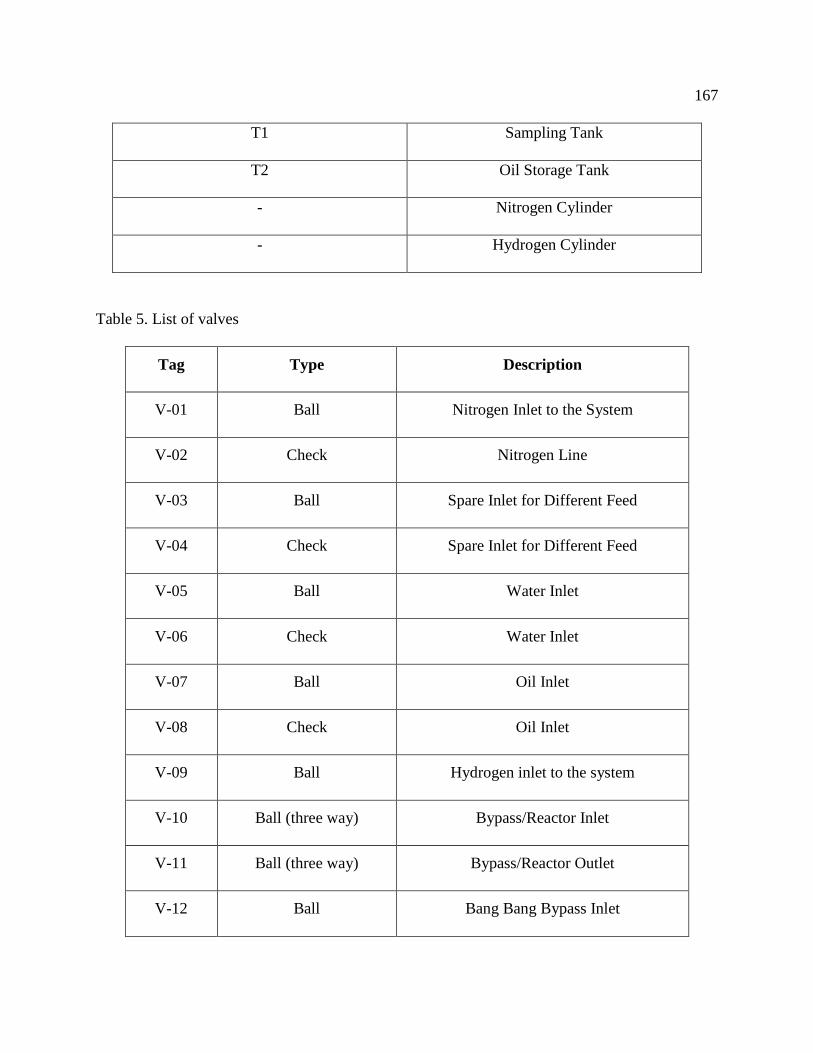
167
T1 Sampling Tank
T2 Oil Storage Tank
- Nitrogen Cylinder
- Hydrogen Cylinder
Table 5. List of valves
Tag Type Description
V-01 Ball Nitrogen Inlet to the System
V-02 Check Nitrogen Line
V-03 Ball Spare Inlet for Different Feed
V-04 Check Spare Inlet for Different Feed
V-05 Ball Water Inlet
V-06 Check Water Inlet
V-07 Ball Oil Inlet
V-08 Check Oil Inlet
V-09 Ball Hydrogen inlet to the system
V-10 Ball (three way) Bypass/Reactor Inlet
V-11 Ball (three way) Bypass/Reactor Outlet
V-12 Ball Bang Bang Bypass Inlet

168
V-13 Ball Bang Bang Bypass Outlet
V-14 Needle Storage Tank (T-1) Outlet
V-15 Needle Cold Separator (S-2) Outlet
V-16 Back Pressure Back Pressure
V-17 Ball Bang Bang Enable
V-18 Ball/ Electrical Actuator Bang Bang System Inlet
V-19 Ball/ Electrical Actuator Bang Bang System Outlet
V-20 Needle Bypass to the MFC1/ Pressurization valve
V-21 Spring/Relief Relief valve
V-22 Ball T-1 Safe Drainage
V-23 Ball S-1 Safe Drainage
V-24 Ball Back Pressure isolator
V-25 Ball Back Pressure isolator
V-26 Ball Pressure Controller isolator
V-27 Ball Pressure Controller isolator
V-28 Ball Bypass Drainage
V-29 Ball Hydrogen Line Isolator
V-30 Check Hydrogen Line

169
V-31 Ball/Three way Filling or Pumping Path for P-2
V-32 Needle Drainage for P-1
V-33 Ball Filling of P-1
V-34 Ball/Three Way To Send Gases to Either Gas
Chromatographer or to Vent
V-35 Check Protection Against Oil Back Flow
V-36 Needle Pressurization of T-2
V-37 Needle T-2 depressurization.
V-38 Ball/Three Way Used to Send Nitrogen to Either the
Reactor or Hot Separator.
V-39 Check Nitrogen Line
V-40 Needle Used for Better Cleaning of T-1
Table 6. List of instruments
Tag Description
MFC-1 Mass Flow Controller for Nitrogen
PC-1 Pressure Controller
MFC-2 Mass Flow Controller for Hydrogen
F-1 Flow Meter

170
Table 7. List of Thermocouples
TAG Description Function
TIC-001 Nitrogen and Mixer Controller
TIC-002 Steam Line Controller
TIC-003 Oil Line Controller
TI-004 Reactor-External Indicator
TIC-005 Reactor-Internal (Point 3) Controller
TIC-006 Bypass (Point 1) Controller
TI-007 Exit Reactor Indicator
TI-008 Exit Heat Exchanger Indicator
TIC-009 Hot Separator (S-1) Controller
TIC-010 Storage Tank (T-1) Controller
TIC-011 Oil Pump (P1) Controller
TI-012 Connection in spare Indicator
TI-013 Reactor Internal (Point 2) Indicator
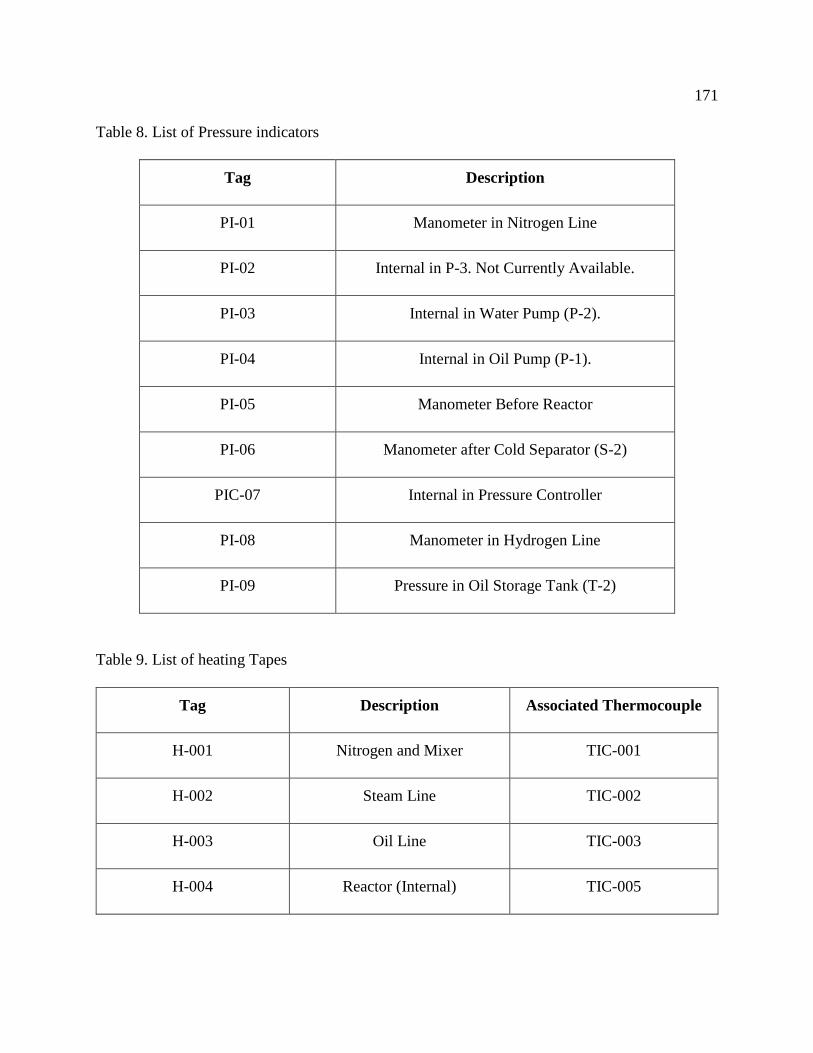
171
Table 8. List of Pressure indicators
Tag Description
PI-01 Manometer in Nitrogen Line
PI-02 Internal in P-3. Not Currently Available.
PI-03 Internal in Water Pump (P-2).
PI-04 Internal in Oil Pump (P-1).
PI-05 Manometer Before Reactor
PI-06 Manometer after Cold Separator (S-2)
PIC-07 Internal in Pressure Controller
PI-08 Manometer in Hydrogen Line
PI-09 Pressure in Oil Storage Tank (T-2)
Table 9. List of heating Tapes
Tag Description Associated Thermocouple
H-001 Nitrogen and Mixer TIC-001
H-002 Steam Line TIC-002
H-003 Oil Line TIC-003
H-004 Reactor (Internal) TIC-005

172
H-005 Reactor (Internal) TIC-006
H-006 Hot Separator (S1) TIC-009
H-007 Tank (T1) TIC-010
H-008 Oil Pump(P-1) TIC-011
*Proper connection must be done to align the heating tape with the corresponding thermocouple.
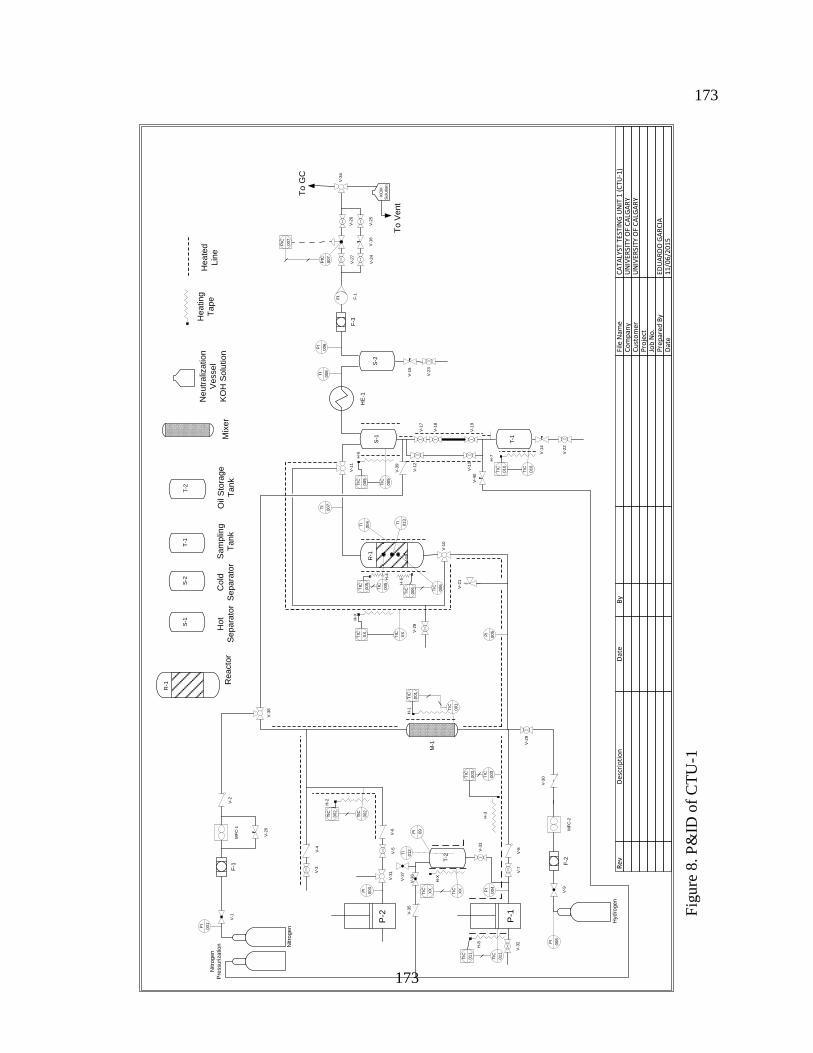
173
173
R-1
V-1
0
V-5
9
File
Nam
eC
om
pan
yC
ust
om
erP
roje
ctJo
b N
o.
Pre
par
ed B
yD
ate
CA
TALY
ST T
ESTI
NG
UN
IT 1
(C
TU-1
)U
NIV
ERSI
TY O
F C
ALG
AR
YU
NIV
ERSI
TY O
F C
ALG
AR
Y
EDU
AR
DO
GA
RC
IA1
1/0
6/2
01
5
Rev
Des
crip
tio
n
Dat
e
By
S-1
V-1
7
V-1
1
PIC
00
7
PIC
00
7
FI
F-1
V-1
9
T-1
V-1
4
P-1
V-8
V-7
V-1
6
V-1
8
P-2
Nitro
ge
n
F-1
MF
C-1
V-2
V-1
V-6
V-3
V-5V-4
HE
-1
Hyd
rog
en
F-2
MF
C-2
V-9
S-2
V-1
5
M-1
F-3
V-2
0
V-2
1
TIC
00
1
TIC
00
1
TIC
00
3
TIC
00
3
TIC
01
1
TIC
01
1
TIC
XX
TIC
XX
TIC
00
5
TIC
00
5
TI
00
4
TIC
01
0
TIC
01
0
TIC
00
9
TIC
00
9
V-2
2
V-2
3
V-2
4V
-25
V-2
6V
-27
TI
00
8
V-2
8
V-3
3
S-1
S-2
T-1
R-1 R
ea
cto
rH
ot
Se
pa
rato
r
Co
ld
Se
pa
rato
r
Sa
mp
ling
Ta
nk
Mix
er
He
atin
g
Ta
pe
He
ate
d
Lin
e
V-2
9
V-3
0
V-3
1
V-3
2
H-1
H-2
H-3
H-4
H-X
H-6
H-7
H-8
PI
00
3
TI
00
7
PI
00
4
PI
00
8
TIC
00
2
TIC
00
2
PI
00
5
PI
00
6
PI
00
1
V-3
4
To
GC
To
Ve
nt
T-2
PI
09
TIC
XX
TIC
XX
H-X
TI
01
2
T-2
Oil
Sto
rag
e
Ta
nk
Ne
utr
aliz
atio
n
Ve
sse
l
KO
H S
olu
tio
n
V-3
6
TIC
00
6
TIC
00
6
TI
01
3H
-5
KO
H
So
lutio
n
V-3
8
Nitro
ge
n
Pre
ssu
riza
tio
n
V-3
5
V-1
2
V-1
3
V-4
0
V-3
9
V-3
7
Fig
ure
8. P
&ID
of
CT
U-1

174
174
Appendix B: Catalyst Characterization Data
This appendix contains information about the characterization of the catalysts.
Figure B.1. Isotherm and pore distribution charts for Cat 1
Figure B.2. Isotherm and pore distribution charts for Cat 1

175
175
Figure B.3. Isotherm and pore distribution charts for Cat 3
Figure B.4. Isotherm and pore distribution charts for Cat 4
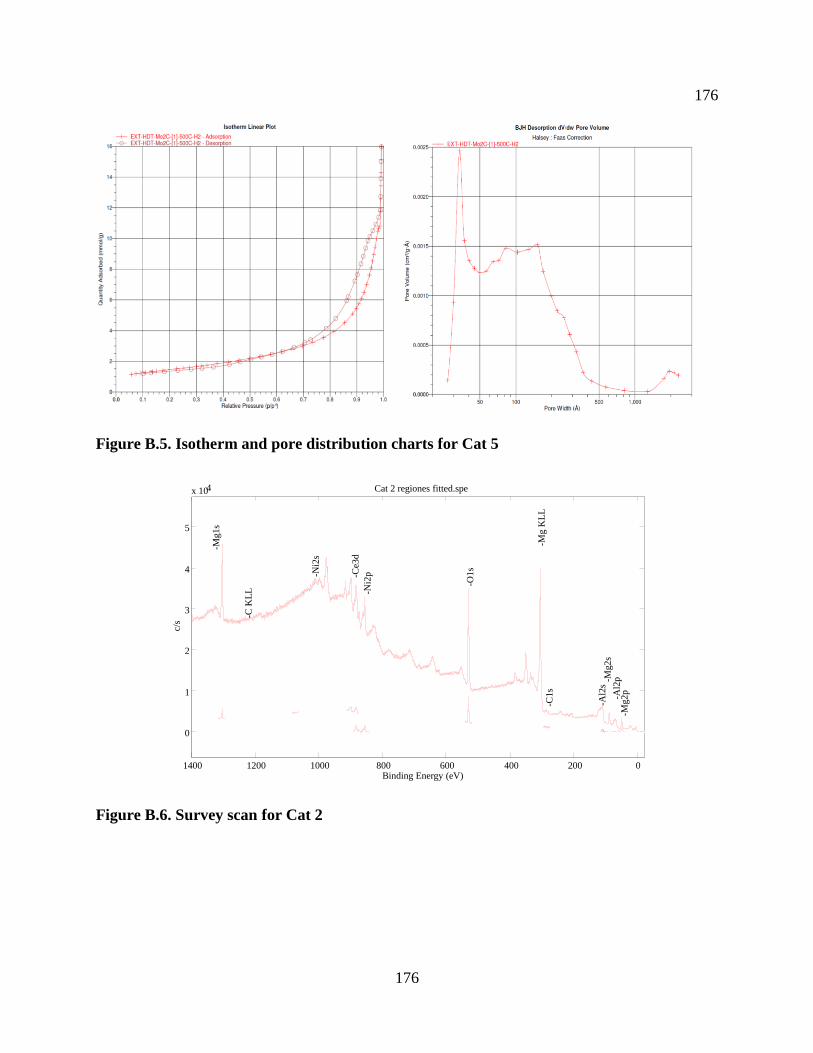
176
176
Figure B.5. Isotherm and pore distribution charts for Cat 5
Figure B.6. Survey scan for Cat 2
0200400600800100012001400
0
1
2
3
4
5
x 104 Cat 2 regiones fitted.spe
Binding Energy (eV)
c/s
-Mg2
s
-Mg2
p
-Mg1
s
-Ni2
p
-Al2
s
-Al2
p
-Ce3
d
-C1
s
-O1
s
-Ni2
s
-C K
LL
-Mg K
LL

177
177
Figure B.7. Survey scan for Cat 3
Figure B.8. Survey scan for Cat 4
0200400600800100012000
1000
2000
3000
4000
5000
6000
7000Cat 3 survey.spe
Binding Energy (eV)
c/s
Atomic %Si2p 95.5Fe2p3 2.9Zr3d 0.6Ce3d5 0.6Ni2p3 0.3
-Si2
s -Si2
p
-Fe3
p
-Fe2
p
-C1
s
-O K
LL
-Na
KL
L
-Ni2
p-C
e3d
-Fe
LM
M
-O1
s
-Zr4
p-Zr3
d
-Ni2
s
0200400600800100012000
1000
2000
3000
4000
5000
6000
7000Cat 4 survey analysed.spe
Binding Energy (eV)
c/s
-Al2
s
-Al2
p
-Ni2
s
-Ni2
p-C
e3d
Atomic %Si2p 78.5Al2p 18.9Ni2p3 2.3Ce3d5 0.3
-C1
s
-O K
LL
-O2
s
-Si2
s
-Si2
p
-C K
LL
-O1
s
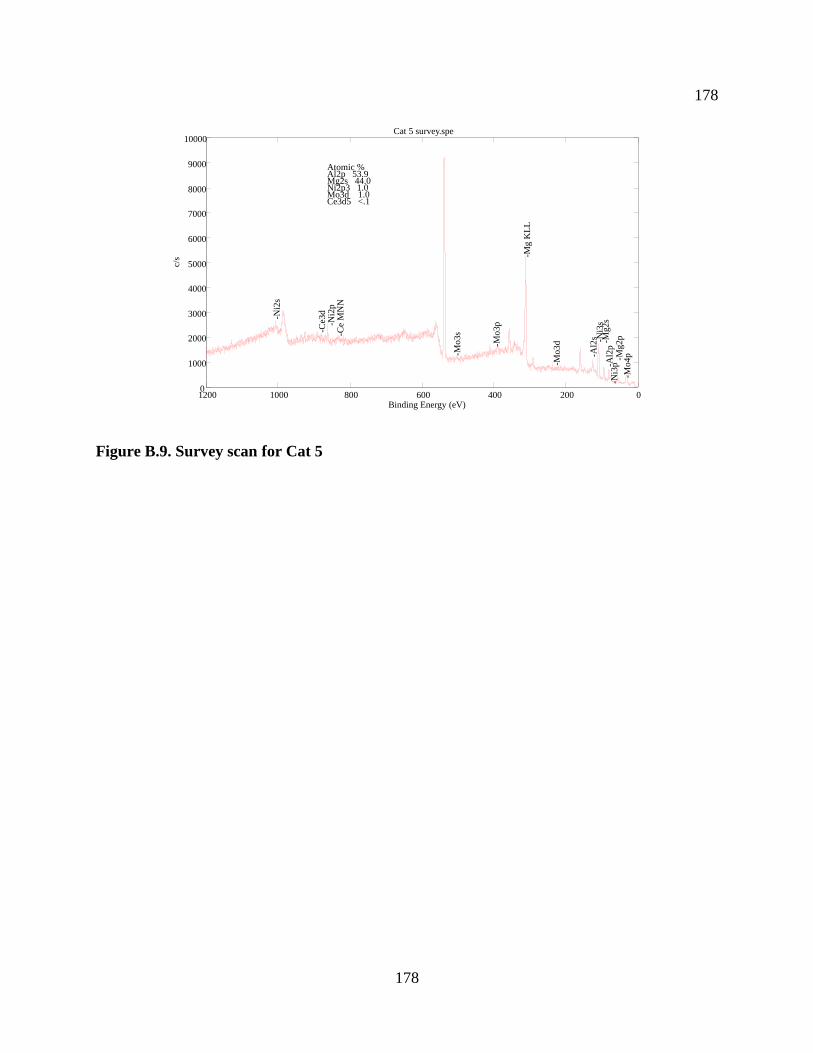
178
178
Figure B.9. Survey scan for Cat 5
0200400600800100012000
1000
2000
3000
4000
5000
6000
7000
8000
9000
10000Cat 5 survey.spe
Binding Energy (eV)
c/s
Atomic %Al2p 53.9Mg2s 44.0Ni2p3 1.0Mo3d 1.0Ce3d5 <.1
-Al2
s
-Al2
p-N
i3p
-Ni2
p
-Mg2s
-Mg2p
-Ce3
d
-Mo3p
-Mo3d -N
i3s
-Ni2
s
-Mg K
LL
-Ce
MN
N
-Mo4p-M
o3s