catastrophe assessment: actuarial sops and model validation cas seminar on catastrophe issues new...
TRANSCRIPT
Catastrophe Assessment:Actuarial SOPs and Model Validation
CAS Seminar on Catastrophe Issues
New Orleans – October 22, 1998
Session 12 Panel:
Douglas J. CollinsKaren F. TerryPatrick B. Woods
Model Validation and Uncertainty
Session 12 Panel:
Presentation by Douglas J. Collins
3
Outline of presentationCatastrophe model validation and uncertainty
How catastrophe models work
Hurricane model validation types of validation validation data
Model uncertainty
4
ScienceScience
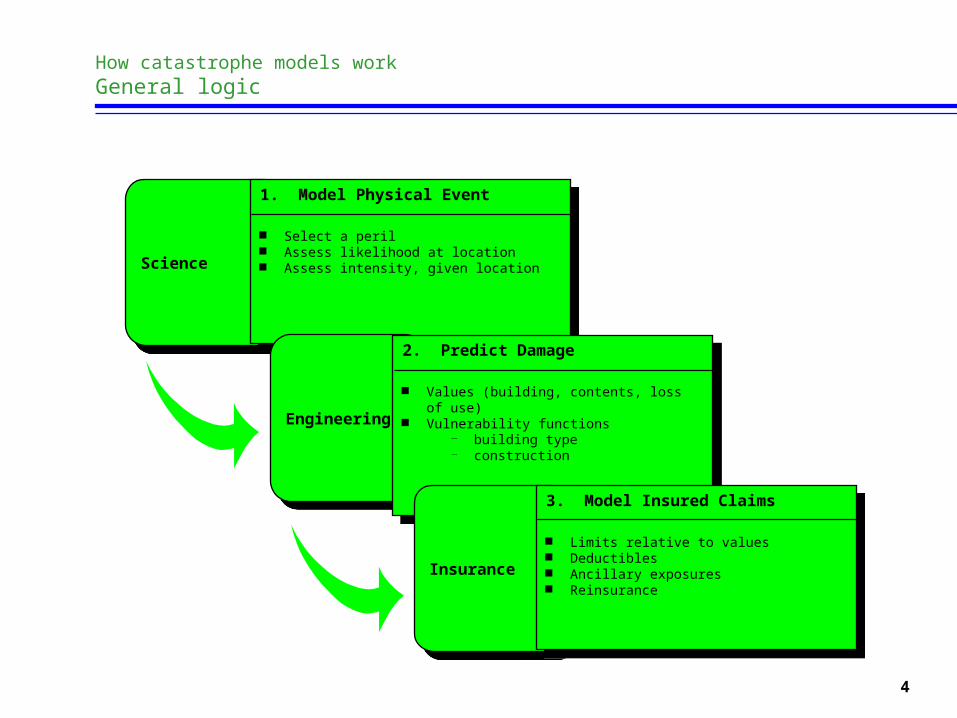
1. Model Physical Event
Select a peril Assess likelihood at location Assess intensity, given location
1. Model Physical Event
Select a peril Assess likelihood at location Assess intensity, given location
EngineeringEngineering
2. Predict Damage
Values (building, contents, loss of use) Vulnerability functions
building type construction
2. Predict Damage
Values (building, contents, loss of use) Vulnerability functions
building type construction
InsuranceInsurance
3. Model Insured Claims
Limits relative to values Deductibles Ancillary exposures Reinsurance
3. Model Insured Claims
Limits relative to values Deductibles Ancillary exposures Reinsurance
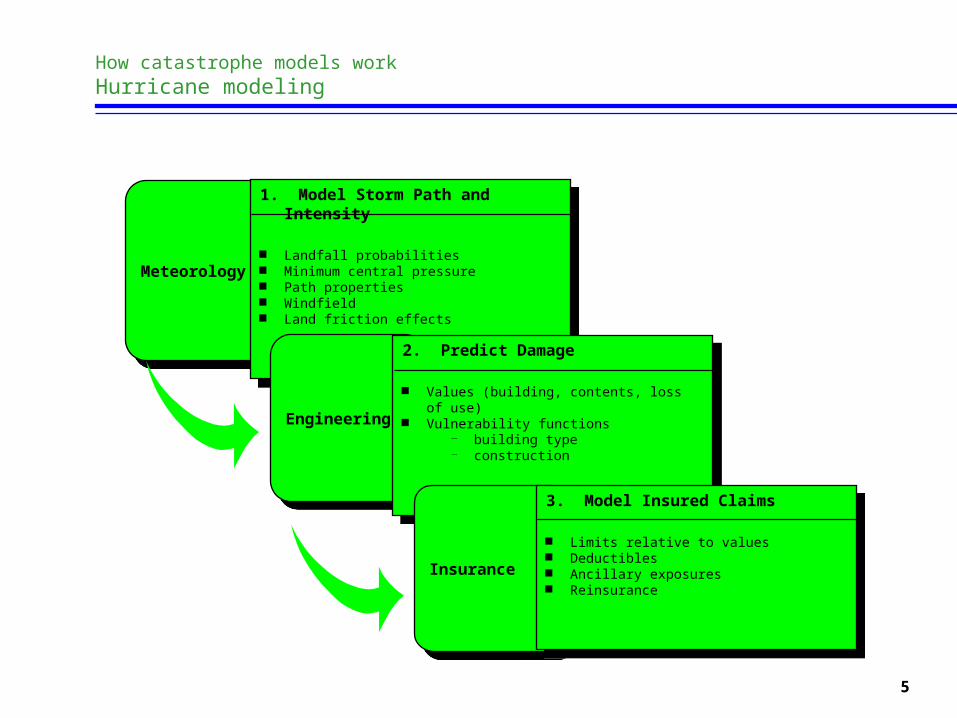
How catastrophe models workGeneral logic
5
MeteorologyMeteorology
1. Model Storm Path and Intensity
Landfall probabilities Minimum central pressure Path properties Windfield Land friction effects
1. Model Storm Path and Intensity
Landfall probabilities Minimum central pressure Path properties Windfield Land friction effects
EngineeringEngineering
2. Predict Damage
Values (building, contents, loss of use) Vulnerability functions
building type construction
2. Predict Damage
Values (building, contents, loss of use) Vulnerability functions
building type construction
InsuranceInsurance
3. Model Insured Claims
Limits relative to values Deductibles Ancillary exposures Reinsurance
3. Model Insured Claims
Limits relative to values Deductibles Ancillary exposures Reinsurance
How catastrophe models workHurricane modeling
6
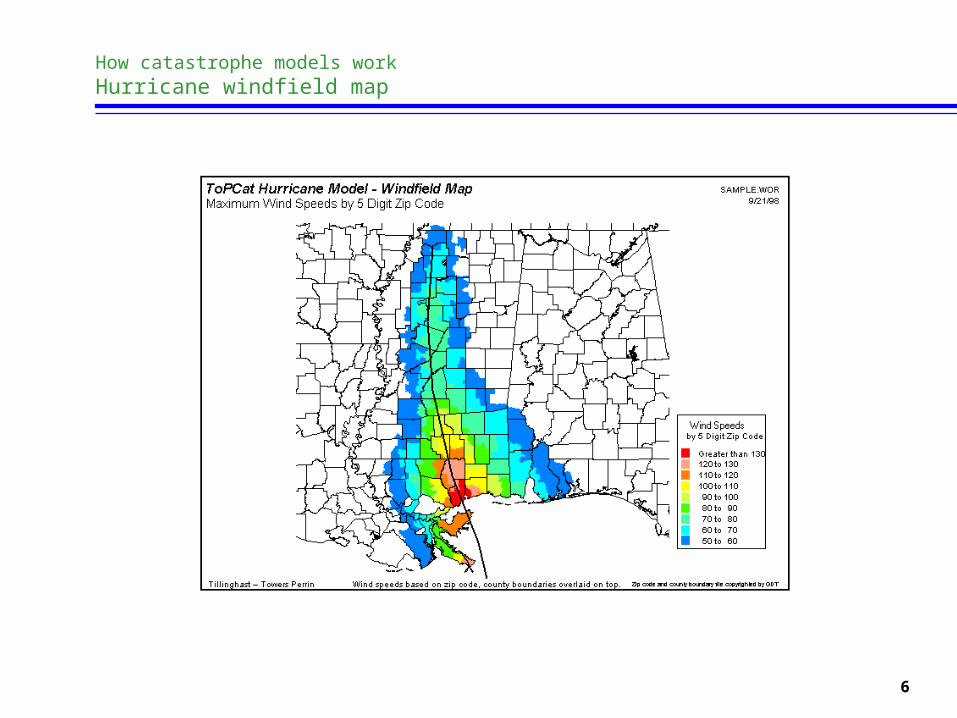
How catastrophe models workHurricane windfield map
7
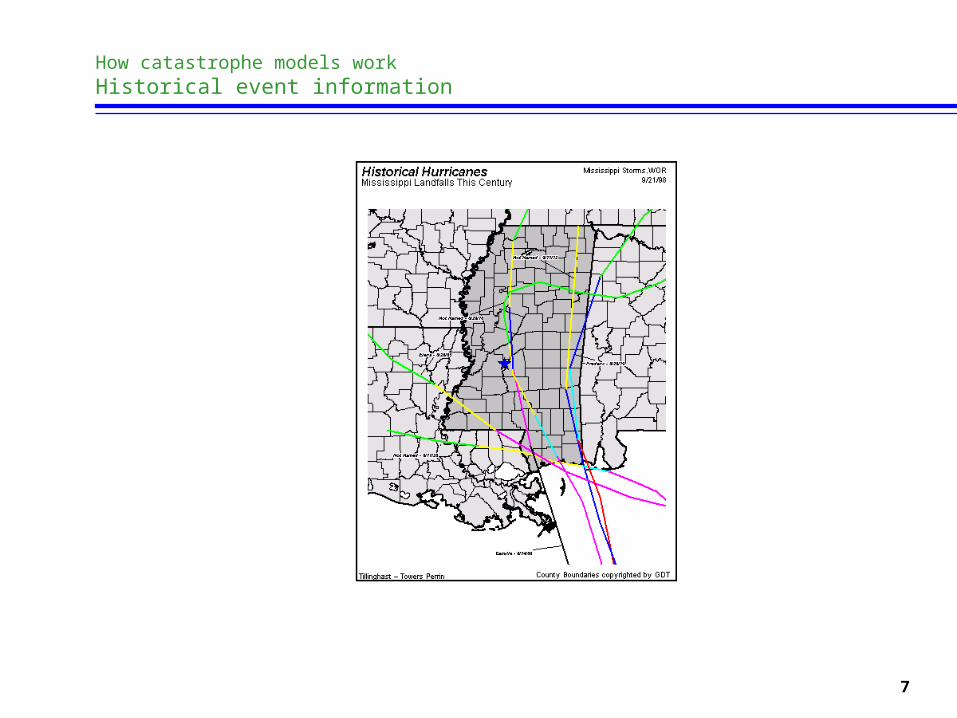
How catastrophe models workHistorical event information
8
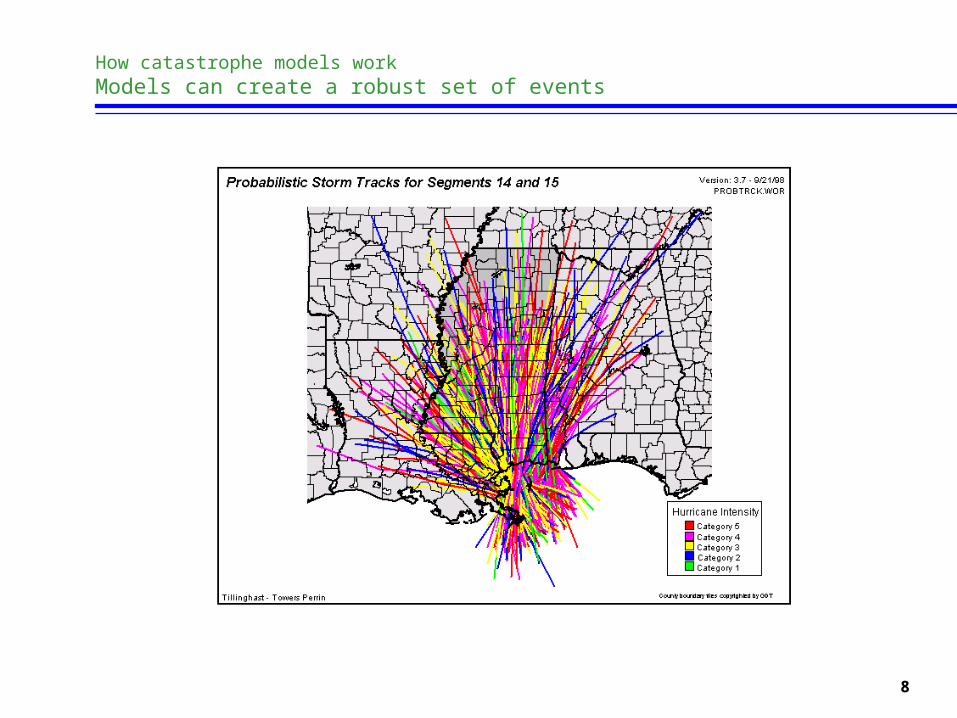
How catastrophe models workModels can create a robust set of events
9
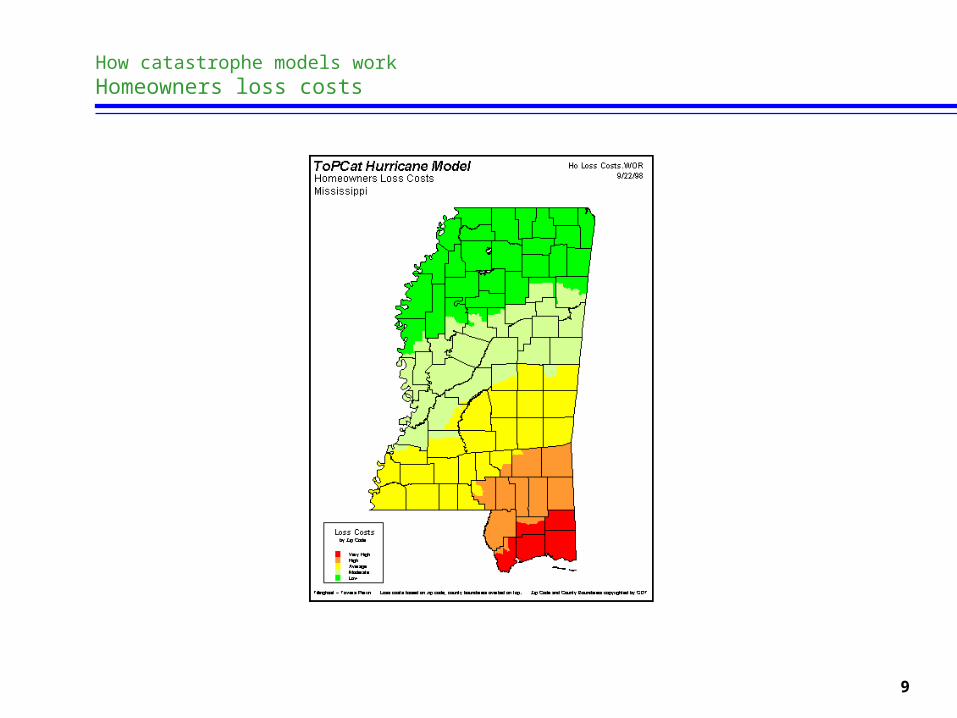
How catastrophe models workHomeowners loss costs
10
Component validation probabilistic parameters (e.g., landfall probability) wind speeds vulnerability functions
Micro validation compare modeled versus actual company losses
individual claim detail various levels of aggregation
Macro validation compare modeled versus actual industry losses by event compare probabilistic and historical size-of-loss distributions and loss
costs
Hurricane model validationTypes of validation
11
Probabilistic parameters landfall probability minimum central pressure radius
Wind validation – comparisons with anemometer readings National Hurricane Center reports 100-year winds
Vulnerability function validation compare damage ratios by zip/coverage and wind speed with insurer claim
data input from engineers
Validation of model changes component changes logical software testing procedures
Hurricane model validationComponent validation
12
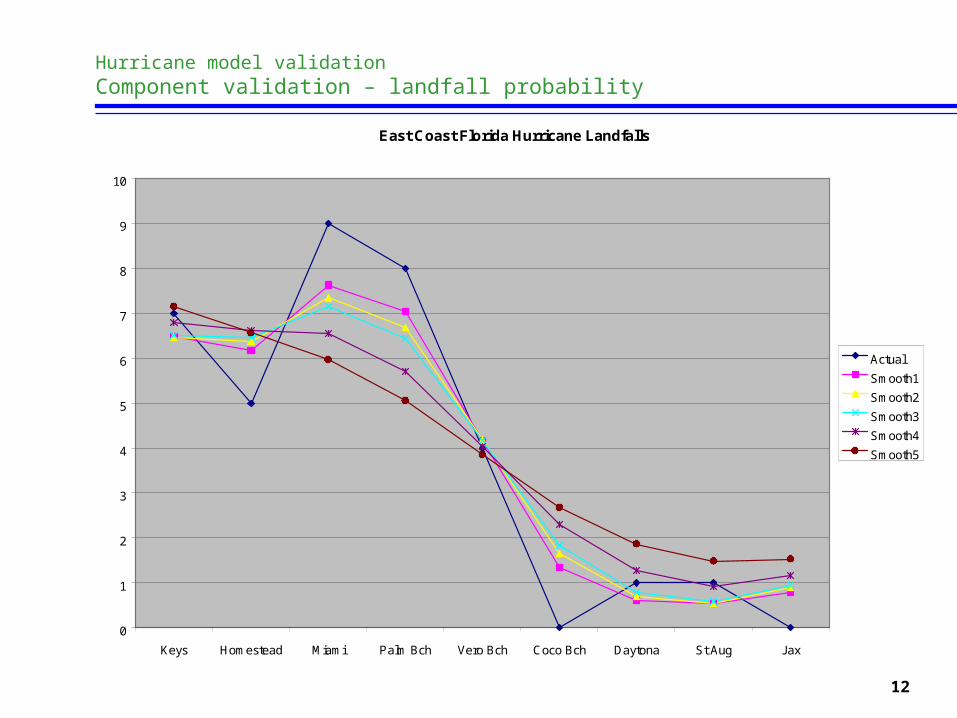
Hurricane model validationComponent validation – landfall probability
East Coast Florida Hurricane Landfalls
0
1
2
3
4
5
6
7
8
9
10
Keys Homestead Miami Palm Bch Vero Bch Coco Bch Daytona St Aug Jax
Actual
Smooth1
Smooth2
Smooth3
Smooth4
Smooth5
13
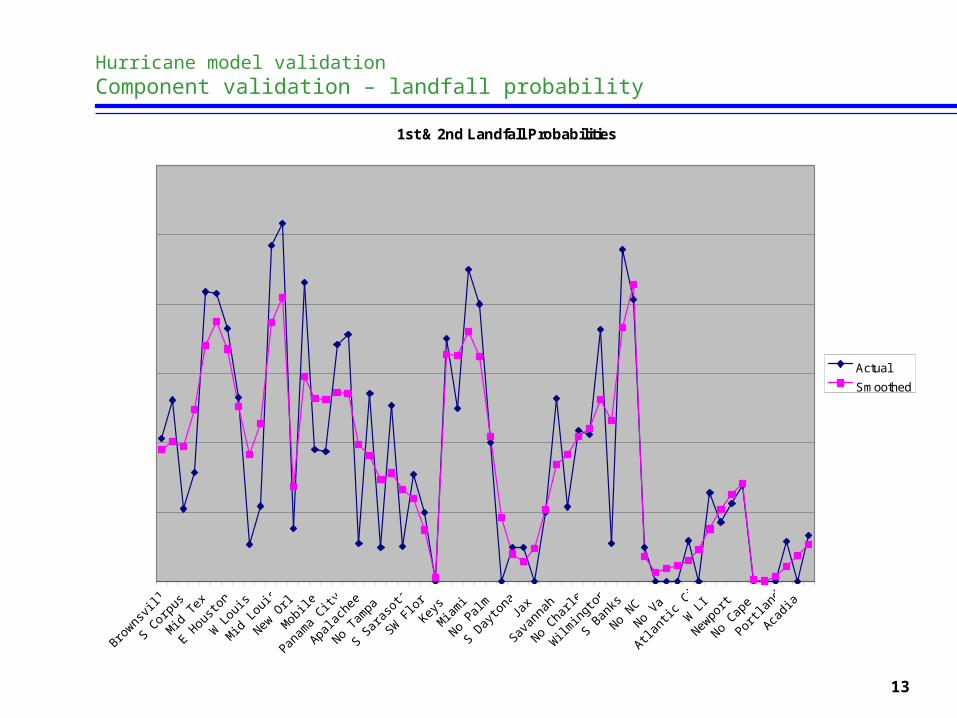
Hurricane model validationComponent validation – landfall probability
1st & 2nd Landfall Probabilities
Browns
ville
S Cor
pus
Mid
Tex
E Hou
ston
W L
ouis
Mid
Louis
New O
rl
Mob
ile
Panam
a City
Apalac
hee
No Ta
mpa
S Sar
asot
a
SW F
lorKey
s
Miam
i
No Palm
S Day
tona Ja
x
Savan
nah
No Cha
rle
Wilm
ingto
n
S Ban
ks
No NC
No Va
Atlant
ic City
W L
I
Newpo
rt
No Cap
e
Portla
nd
Acadia
Actual
Smoothed
14
Aggregated company data by lob, coverage by county, zip by construction type, quality
Individual claim detail distributions of damage ratios deductible effects local land friction and land use effects
Hurricane model validation Micro validation – modeled versus actual losses
15
Compare modeled versus actual industry losses by event requires estimate of industry exposures requires historical loss dataset tests for overall bias, consistency
Compare probabilistic and historical loss distributions and loss costs size-of-loss distributions by state
actual and modeled historical versus probabilistic return periods from 10 years to 100 years
loss costs by state and county
Hurricane model validationMacro validation
16
Hurricane model validationConstructing a macro validation dataset
Data sources NWS total economic impact PCS insured losses Insurers and reinsurers special studies (AIRAC, Andrew)
Methodology select best estimate of industry loss allocate to state and county trending
inflation (implicit price deflator) current inventory of properties and values (real net stock of FRTW,
housing units) current insurance system (PCS versus NWS)
17
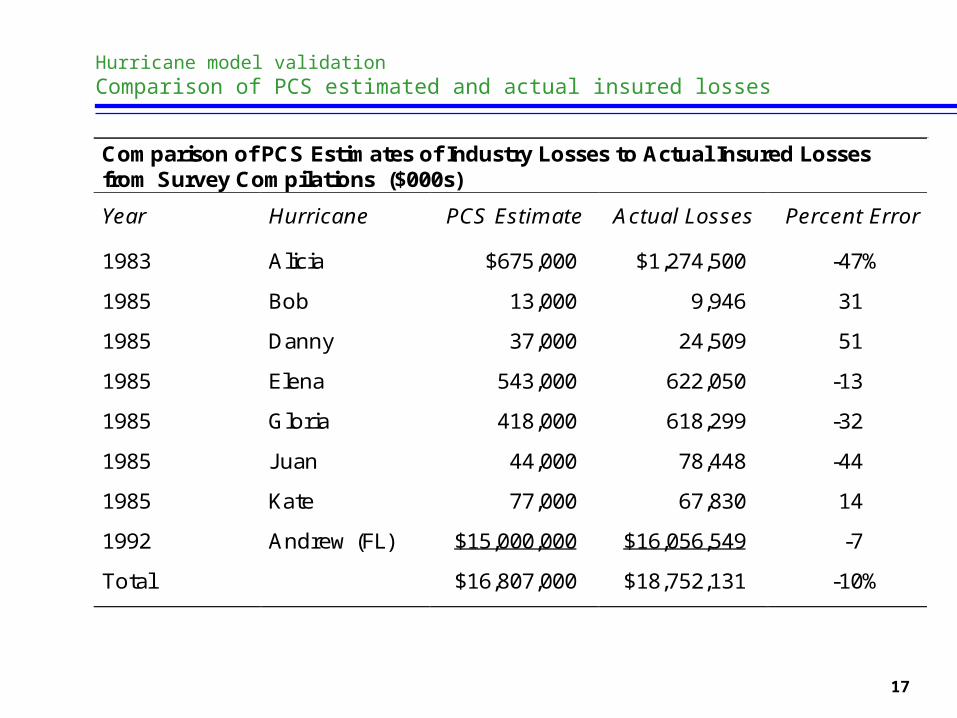
Hurricane model validationComparison of PCS estimated and actual insured losses
Comparison of PCS Estimates of Industry Losses to Actual Insured Lossesfrom Survey Compilations ($000s)
Year Hurricane PCS Estimate Actual Losses Percent Error
1983 Alicia $675,000 $1,274,500 -47%
1985 Bob 13,000 9,946 31
1985 Danny 37,000 24,509 51
1985 Elena 543,000 622,050 -13
1985 Gloria 418,000 618,299 -32
1985 J uan 44,000 78,448 -44
1985 Kate 77,000 67,830 14
1992 Andrew (FL) $15,000,000 $16,056,549 -7
Total $16,807,000 $18,752,131 -10%
18
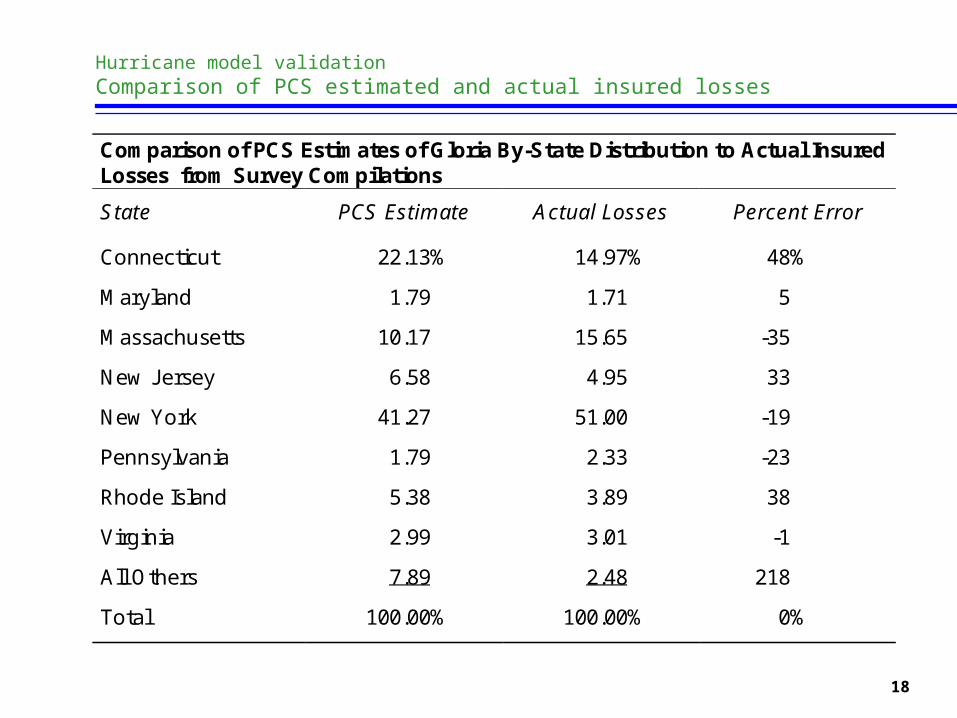
Hurricane model validationComparison of PCS estimated and actual insured losses
Comparison of PCS Estimates of Gloria By-State Distribution to Actual InsuredLosses from Survey Compilations
State PCS Estimate Actual Losses Percent Error
Connecticut 22.13% 14.97% 48%
Maryland 1.79 1.71 5
Massachusetts 10.17 15.65 -35
New J ersey 6.58 4.95 33
New York 41.27 51.00 -19
Pennsylvania 1.79 2.33 -23
Rhode Island 5.38 3.89 38
Virginia 2.99 3.01 -1
All Others 7.89 2.48 218
Total 100.00% 100.00% 0%

19
How catastrophe models workMacro validation dataset
Actual Annual PCS Hurricane Losses (Billions)
0
5
10
15
20
50 53 56 59 62 65 68 71 74 77 80 83 86 89 92 95 98
20
How catastrophe models workMacro validation dataset
Normalized Annual PCS Hurricane Losses (Billions)
0
5
10
15
20
25
50 53 56 59 62 65 68 71 74 77 80 83 86 89 92 95 98
21
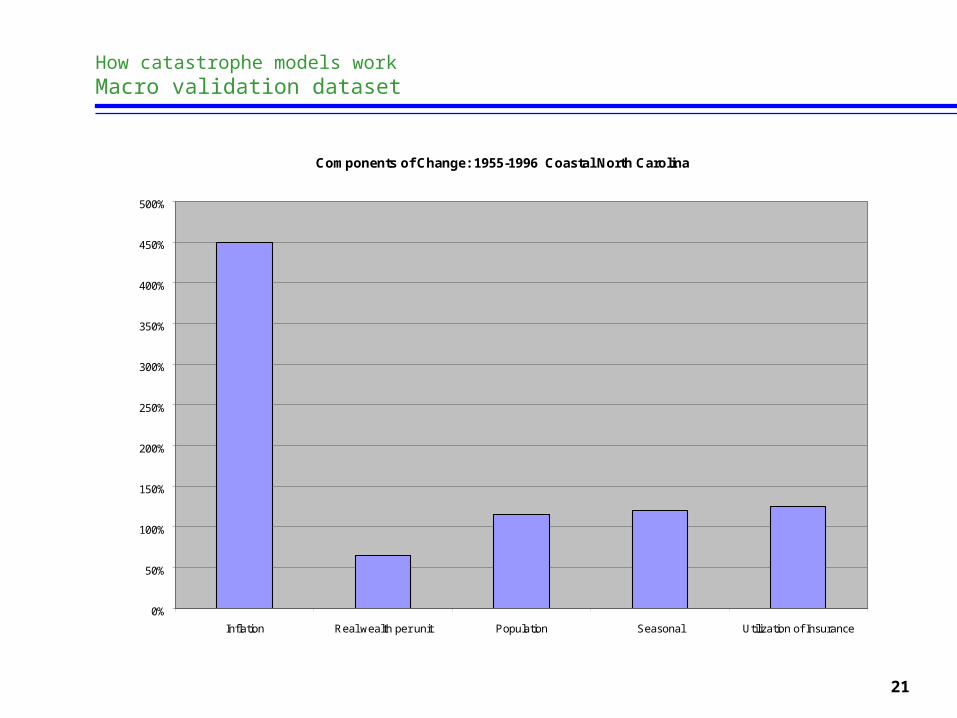
How catastrophe models workMacro validation dataset
Components of Change: 1955-1996 Coastal North Carolina
0%
50%
100%
150%
200%
250%
300%
350%
400%
450%
500%
Inflation Real wealth per unit Population Seasonal Utilization of Insurance
22
Model uncertaintyWhy do different hurricane models produce different results?
There is considerable uncertainty in estimating probabilities of rare events meteorological records (100-150 years) paleo proxy studies (500-5,000 years)
Hurricanes are complex systems the effect of landfall is not fully understood each storm has unique characteristics
microbursts, tornados, rainfall demand surge
There is considerable uncertainty in estimating damage at a given location
Uncertainty depends on use of model PMLs versus loss costs
23
Model uncertaintyHow credible are the models?
Average hurricane loss costs by county vary significantly between modelers in some counties in Florida this should not be surprising
Models are continually being improved due to: growth in modeler resources growth in information opening the black boxes greater computer power
There is no better alternative robust handling of nearly all possible scenarios historical insurance experience alone is insufficient use of multiple models is growing