catch basin inlet cleaning pilot study: final report · i catch basin inlet cleaning pilot study...
TRANSCRIPT
i
Catch Basin Inlet Cleaning Pilot StudyFinal Report
Catch Basin Inlet Cleaning Pilot Study:Final Report
Submitted to:
The City of San Diego9370 Chesapeake Drive, Suite 100, MS 1900San Diego, CA 92123
Submitted by:
Tetra Tech9444 Balboa Ave, Suite 215San Diego, CA 92123
DRAFTJune 9, 2012
Contract H084445, Task Order No. 38

ii
(This page intentionally left blank)
iii
Table of Contents
1 Introduction ................................................................................................................................................. 12 Study Methodology...................................................................................................................................... 43 Results....................................................................................................................................................... 15
3.1 Material Characterization ................................................................................................................... 163.2 General Chemistry.............................................................................................................................. 213.3 Nutrients ............................................................................................................................................ 233.4 Metals ................................................................................................................................................ 263.5 Microbiology ..................................................................................................................................... 293.6 Organic Pollutants .............................................................................................................................. 31
4 Summary ................................................................................................................................................... 354.1 Pollutants ........................................................................................................................................... 354.2 Location, Frequency and Timing of Clean-Outs.................................................................................. 364.3 Methods and Costs ............................................................................................................................. 36
5 References ................................................................................................................................................. 38
Appendix A. Monitoring Plan
Appendix B. Laboratory Data
iv
Catch Basin Inlet Cleaning Pilot StudyFinal Report
List of Figures
Figure 1. Study area locations. ............................................................................................................................. 5Figure 2. Scripps - Poway Parkway drainage area and associated catch basins...................................................... 6Figure 3. Tecolote drainage area and associated catch basins................................................................................ 8Figure 4. Downtown drainage area and associated catch basins. ........................................................................... 9Figure 5. San Ysidro drainage area and associated catch basins. ......................................................................... 10Figure 6. Manual clean-out by Ron’s Maintenance in the Tecolote and San Ysidro areas.................................... 11Figure 7. Vactor clean-out by Downstream Services, Inc. in the Downtown and Poway areas............................. 12Figure 8. Delivery of materials to the containment berms for storing and drying before sampling and analysis. .. 13Figure 9. Timeline of catch basin clean-out (CO1-CO4), sampling, and rain events............................................ 15Figure 10. Weight of materials removed from all catch basins in four clean-out periods and within the four areas........................................................................................................................................................................... 17Figure 11. Weight of materials removed from all catch basins and per inlet within the four areas and in foursampling periods. Diagram shows minimum, maximum, quartile, and median values......................................... 18Figure 12. Percentages of sediment, trash, and organic material in the material removed in each area (by visualinspection). Diagram shows minimum, maximum, quartile, and median values. ................................................. 19Figure 13. Percentage sediment particle sizes by area......................................................................................... 20Figure 14. Percentage sediment particle sizes by clean-out event, including four areas. ...................................... 20Figure 15. Weight of sediment particle sizes by cleanout event, including four areas. ......................................... 21Figure 16. Percent solids in each location, by clean-out number. ........................................................................ 22Figure 17. pH in each location, by clean-out number.......................................................................................... 22Figure 18. Total Organic Carbon (mg/Kg) concentrations in each location, by clean-out number........................ 23Figure 19. Total Nitrogen concentrations in each location, by clean-out event. ................................................... 24Figure 20. Total Phosphorus concentrations in each location, by clean-out event. ............................................... 24Figure 21. Nitrogen load removed for each location and clean-out event (standardized to a 30-day period and 10acres)................................................................................................................................................................. 25Figure 22. Phosphorus load removed for each location and clean-out event (standardized to a 30-day period and10 acres). ........................................................................................................................................................... 25Figure 23. Copper concentrations in each area for each clean-out event.............................................................. 26Figure 24. Lead concentrations in each area for each clean-out event. ................................................................ 27Figure 25. Zinc concentrations in each area for each clean-out event. ................................................................. 27Figure 26. Fecal coliform colonies in each location for each clean-out. .............................................................. 29Figure 27. Total coliform colonies in each location for each clean-out................................................................ 30Figure 28. Enterococcus colonies in each location for each clean-out. ................................................................ 30Figure 29. Catch basin interiors, showing deep and shallow sumps in Tecolote and San Ysidro.......................... 37

v
List of Tables
Table 1. Analytical Parameters and Methods - Sediment .................................................................................... 14Table 2. Cleanout and sampling dates. ............................................................................................................... 16Table 3. Average mass of nutrients removed in each study area.......................................................................... 23Table 4. Total metal load removed in each area and clean-out event................................................................... 28Table 5. The Lowest Effect Level (LEL) and Probable Effect Level (PEL) values recommended as screeninglevels for freshwater sediments (NOAA Screening Quick Reference Tablesa). ................................................... 29Table 6. Bacterial colonies removed in each area and clean-out event, standardized to 30 day accumulation and 10acre drainage area. ............................................................................................................................................. 31Table 7. Organic analyte concentrations in sediment samples from the Downtown basins in each of four clean-outperiods (CO1 – 4). ............................................................................................................................................. 32

1
1 Introduction
The maintenance and management of the nearly 40,000 catch basin inlets in the City of San Diego represents oneof the most time- and resource-intensive of the City’s many efforts to prevent pollutants from reaching the City’swaterways and beaches. Catch basins1 may trap many different types of solids and chemicals that wash off thelandscape, from fine particulates and leaves to gross pollutants, floatables and trash. Many of the pollutants ofconcern in San Diego, including nutrients, metals, and chemical pollutants, are bound up in these sediments, andbacteria growth can occur when leaves and other organic material accumulate in catch basins. If not removedprior to storm events, all of these pollutants can wash out of catch basins into the municipal separate storm sewersystem (MS4) and ultimately into surface waters, making effective and timely cleaning (particularly in light ofSan Diego’s dry and wet season cycles) an important operation and maintenance function to meet water qualityobjectives.
Catch basin cleaning frequencies and methods represent both an important area of pollution prevention and amajor investment of municipal labor and financial resources. The City cleans each catch basin at least once peryear, some manually and some with a vactor truck, with some areas receiving additional cleaning andmaintenance visits. Given differences in land use types, drainage system ages and conditions, and the sensitivityof receiving waters, observations long have suggested that the pollution prevention impact of cleaning must varyamong different land use areas, arguing for cleaning regimens that were tailored to these local conditions. Whilethe San Diego County MS4 permit previously dictated the minimum cleaning frequencies the City observed,upcoming changes to the permit may provide more flexibility in designing an optimized cleaning program. TheCity’s literature review and draft workplan development project in 2011 (Tetra Tech 2011) highlighted some ofthe nuances of catch basin cleaning methods and frequencies that can affect pollutant removal and municipalcosts. There is evidence from the literature survey that optimizing catch basin cleaning, both by using the mosteffective and efficient cleaning techniques and by tailoring frequencies to different drainage areas, can maximizethe return on investment in terms of both pollutant reduction, and municipal labor and funds. Data collection andGIS analysis, which the City improved substantially in 2011 on a city-wide basis by establishing a uniqueidentifier for each inlet, are vital to this type of optimization.
With the diversity of land use types, neighborhoods, and drainage system ages and conditions found throughoutthe City of San Diego, developing a more specific or tailored plan for catch basin cleaning frequency andtechniques requires some understanding of how accumulation rates and pollutant concentrations in catch basinmaterials differ among land use types and settings. Identifying land use settings or areas with rapid rates ofpollutant accumulation – and potential mobilization – as well as areas with high concentrations of pollutants ofconcern, may be used to suggest the most efficient and effective timing, frequency, and method of catch basincleaning. Land use settings or areas where pollutants accumulate slowly, with minimal mobilization, or lowconcentrations of pollutants of concern for a particular watershed, would suggest different maintenance schedulesto achieve the same water quality results.
1 For purposes of this report, “catch basin” refers to the structures into which storm drainage flows after entering drainageinlet openings (principally in curbs along streets). It is recognized, and discussed in this report, that some of these structuresfeature a sump between the bottom of the structure and the drain pipe outlet into which water and accumulated material flow;other structures do not have a sump and are essentially a “flow-through” point in the drainage network. The differences infunction between these two structural designs, and the importance of identifying structures with and without sumps for futureefforts, is noted in the report.
2
Catch basin cleaning in San Diego also must be addressed in light of the region’s weather pattern, typified by along dry season from roughly May through October during which catch basin materials are expected toaccumulate without mobilization into the MS4, followed by a wet weather season with sporadic but occasionallyvery significant rain events (i.e. greater than one inch of precipitation in a 24-hour period). While this Pilot Studydid not begin until December 2011, which was after substantial precipitation had fallen, the information basenonetheless will be useful, particularly if and when the City is able to complete an end of season cleaning beforerain events begin. Sampling prior to intensive rainfall may have yielded different results, possibly greaterconcentrations of analytes that accumulate over time and are not easily re-suspended (such as metals).Microbiology samples might also be different during the dry season, especially if incubation is dependent on wetsumps.
This report presents findings from the City of San Diego Catch Basin Inlet Cleaning Pilot Study, includingcharacterization and analysis of sediments removed and assessment of the effectiveness of manual and vactorcleaning methods in different land use settings – Downtown San Diego (classified as downtown-high densitymixed use), a recently-developed single-family residential area in San Ysidro, a residential area near MesaCollege and Tecolote Creek, and a mixed commercial and office/retail area off of Scripps Poway Parkway and I-15 - from four clean-outs during the winter season of 2011 to 2012. It provides information for optimizing catchbasin cleaning methods, locations and frequencies with observations on accumulation and pollutant removal indifferent land use settings, and based on different risks to waterways. The study focused on characterizingaccumulation rates and pollutants in four land use settings that are broadly representative of large areas of SanDiego, enabling as much transferability from the pilot study to general operations as possible.
The Management Questions posed in the original work plan are listed below. Due to changes in the work planand limitations on the number of clean-out events, not all of the management questions were able to be answeredin full by this scope of work. This Report and the information gathered does point to many possible directions foraddressing these management questions, and poses additional considerations that can help future efforts andassessments do a more complete job of addressing these questions. On the whole, the management questionspoint to the essential importance of improving the City’s base of information on the physical dimensions,conditions, and functions of catch basin inlets within the City’s drainage network.
To what extent do changes in catch basin cleaning frequency affect the amount of pollutants (pounds orother units) collected on an annual basis?At what catch basin cleaning frequency is pollutant capture optimized relative to the level of effortexpended?Does the optimal cleaning frequency differ from one pilot area to the next? If so, what site-specific factorsaffect optimal cleaning frequency?Does increased catch basin cleaning frequency reduce the incidence of catch basin or storm drain pipeclogging or other maintenance problems on an annual basis?What is the annual calculated load reduction based on pilot scale data collection with catch basin inletcleaning?Which cleaning method, manual versus mechanical, is the most cost effective method for removingsediment from catch basins?
The analysis conducted in the pilot study has provided insights for answering several key issues that can be usedto help answer the management questions, and to further support optimization of the City’s catch basin cleaningprogram:
Accumulation rates by land use settings and specific areaPollutant presence and concentration in different land use settings and specific areasObservations regarding the storage capacity of catch basins with different sumps
4
2 Study Methodology
The catch basin cleaning study project methodology included development of a monitoring program and QualityAssurance Project Plan (Mactec/Amec 2011; Appendix A); identification of the four project study areas and catchbasins to be cleaned; and a comparison of cleaning methods. The monitoring program was outlined in the PilotStudy Work Plan (Tetra Tech 2011) and further detailed in the Monitoring Plan. The work plan identified thecatch basin areas, schedule for clean-outs, and general methods for collecting and analyzing clean-out samples.The following section describes the same elements of the monitoring program, as they have changed somewhatfrom the work plan. The intent of the methods was to assess the impact of catch basin cleanings using differentmethods, in four locations, over time. With respect to frequencies, the study evaluated accumulation rates and thepollutant loads associated with each clean-out after each period of time, enabling some inferences regardingoptimal frequencies in different land use settings and for different pollutants. With respect to method, the studymade observations as to the costs, equipment, and operational considerations involved with each method.
Monitoring PlanA monitoring plan to guide data collection during the project was developed. The monitoring plan covered bothfield and laboratory operations and consisted of the following elements: project overview and description;monitoring sites; analytical constituents; data quality objectives; field equipment maintenance; monitoringpreparation and logistics; sample collection, preservation, and delivery; quality assurance/quality control;laboratory sample preparation and analytical methods; data management and reporting procedures; clean samplingtechniques and equipment cleaning protocols; and a health and safety plan.
An initial September 2011 field reconnaissance was conducted to determine the specific sites and drainage areasto be monitored. The potential drainages in each of the four study areas were reviewed with City staff and a draftmonitoring plan was submitted. Efforts were made to relate each area to the City’s condition assessment todetermine if any damaged infrastructure (especially pipes) were present in each drainage area; however, no areasof damaged infrastructure were identified in any of the study areas. Field reconnaissance, including identificationand supplemental mapping of the storm drainage networks and storm water treatment facilities in the four studyareas, was performed to confirm the location of each catch basin shown in the City’s SAP system.
Study AreasFour study areas within the City were identified through mapping and site visits (Figure 1). These areas includedthe Scripps/Poway Parkway Area (Figure 2); an area near Mesa College in the Tecolote Creek watershed (Figure3); a segment of the Downtown drainage area (Figure 4); and a residential neighborhood in San Ysidro (Figure 5).The drainage areas for each of these catch basin systems were estimated using GIS coverages and aerialphotographs. Although each area has a unique character, they were classified by predominant land use types.
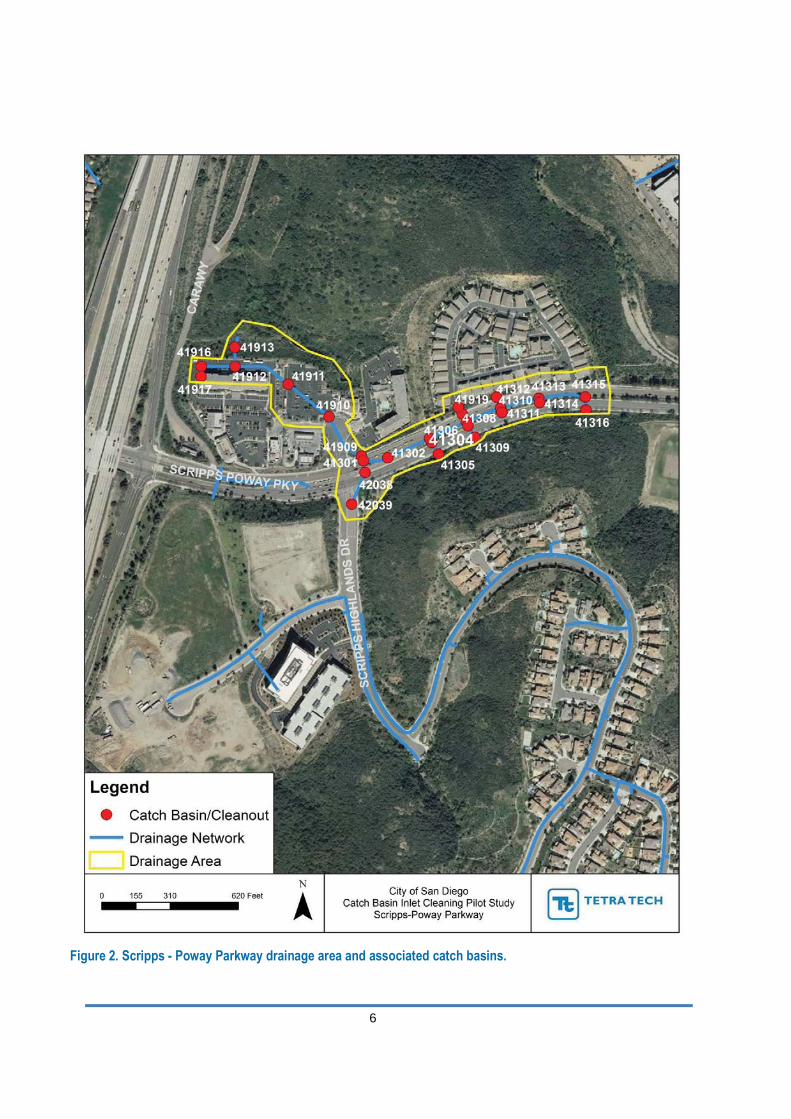
The Scripps Poway Parkway and Tecolote Creek/Mesa College areas were classified as mixed residential andcommercial use areas. The 29 catch basins in the Scripps Poway Parkway area are along the parkway and in theparking lots around the commercial buildings (Figure 2). The Scripps/Poway Parkway area drains approximately11.2 acres of surfaces, predominantly asphalt, though roof drainage and some vegetation along the road shoulders,medians, and parking islands are present. This area was constructed relatively recently (roughly in the late 1980sthrough the late 1990s) and as such observation suggests there is little infrastructure deterioration. This area wasselected for vactor cleaning, in part because of the depth and large size of the catch basins which make manualcleaning especially difficult.

5
Figure 1. Study area locations.
6
Figure 2. Scripps - Poway Parkway drainage area and associated catch basins.
7
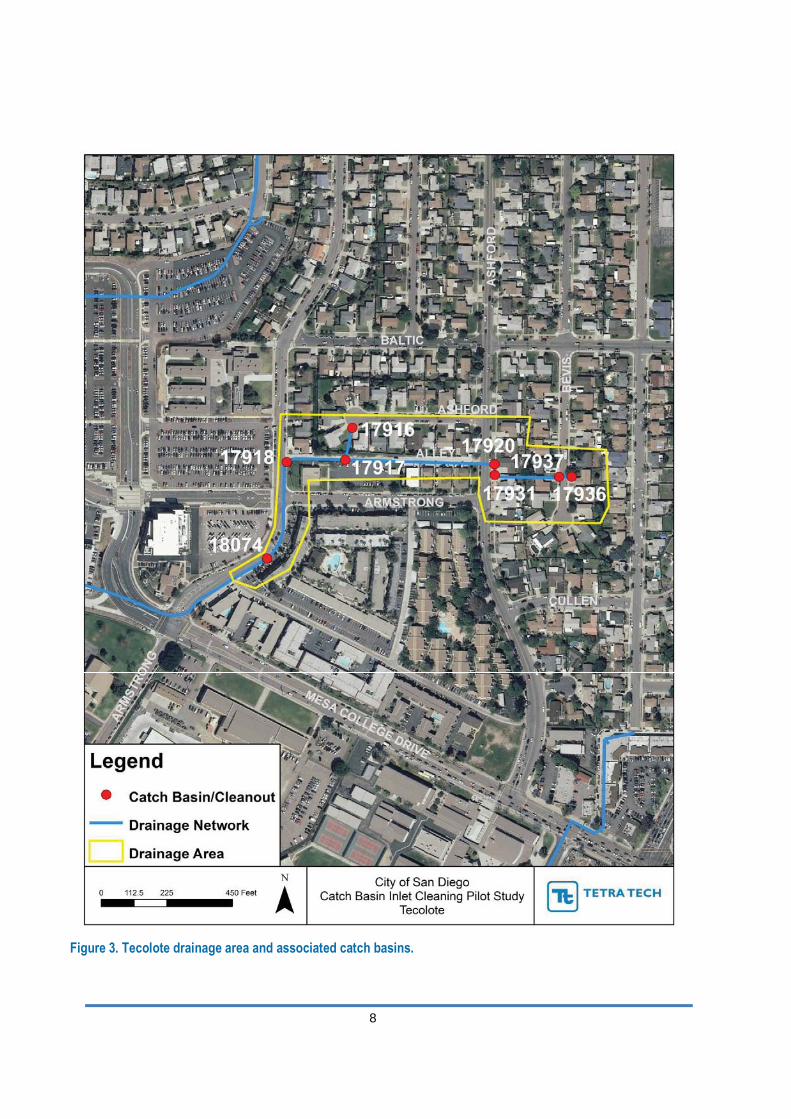
The roughly 7 acre Tecolote Creek/Mesa College area is more residential than commercial, with 8 catch basinsalong residential feeder roads and the collector Armstrong Street (Figure 3). The surfaces include paved roads,driveways, sidewalks, and parking lots, as well as vegetated lawns. In contrast to the Scripps/Poway Parkwayarea, the residential areas around Mesa College that drain into the catch basin network appear to have beendeveloped in the 1960s to 1970s, and as such, greater deterioration is expected though no significant problemswere observed. Manual cleaning was used in this area, since all catch basins were regularly sized and none wasexcessively deep.
The Downtown area was classified as high density downtown mixed use. Eight catch basins along Ash Street andside streets collect runoff from an estimated 9.5 acres of roads, sidewalks, and parking lots (Figure 4). Roof areais substantial, though roof drainage to the surface or catchment basins is unconfirmed. Trees are only present inisolated planting beds along the sidewalks. Vactor cleaning was used in the downtown, since this area generally iscleaned by City crews using a vactor truck.
San Ysidro was classified as residential. It includes 16.6 acres of high density single family house sites, roads anda two-acre park (Figure 5). Like Scripps/Poway Parkway, the area was developed within the past 20 years andlittle deterioration was observed. Materials were removed from 25 cleanout structures. The inlets are locatedalong the collector roads. The surfaces over which rainfall and runoff flow are predominantly lawns, roads, androofs, and parking and play areas.
This space intentionally left blank
8
Figure 3. Tecolote drainage area and associated catch basins.

9
Figure 4. Downtown drainage area and associated catch basins.

10
Figure 5. San Ysidro drainage area and associated catch basins.

11
Method Comparison
Originally, one objective of the pilot study was to evaluate the effectiveness of vactor versus manual cleaning incomparable land use settings. The vactor method uses a vacuum truck and hose to suck sediment, debris andwater from the catch basin sumps. The manual method requires entering the catch basin and using a shovel,broom, and dustpan to collect the materials. Ultimately, a comparison of the two methods in the same land usearea was not pursued; instead, the vactor method was used in the Downtown and Scripps Poway Parkway areasand the manual method was used in the Tecolote and San Ysidro areas. While a comparison of the effectivenessof the two approaches in the same areas is thus not possible from the results of this study, a number oftransferable observations have been made about the appropriateness and use of each technique in differentsettings, and the cost considerations.
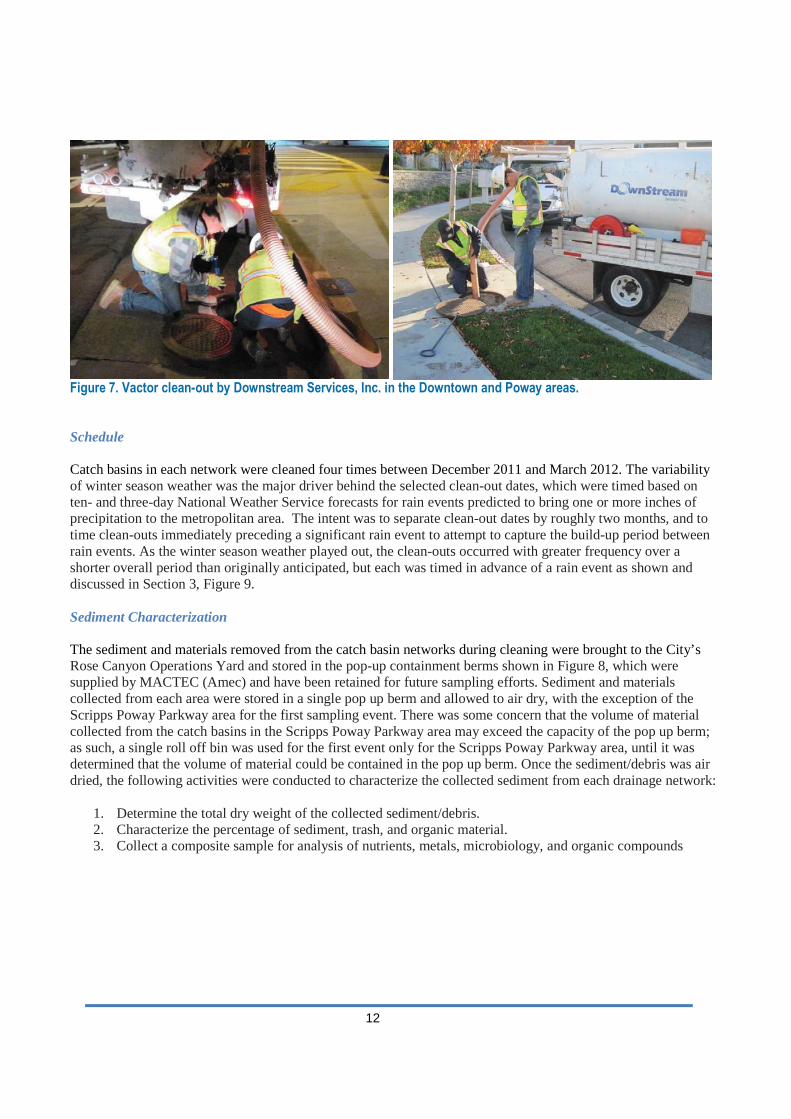
For the study work, two private contractors were engaged to complete the catch basin cleanings in the four studyareas, to deliver the materials to containment berms that they set up at the Rose Canyon Operations Yard, and todispose of the catch basin materials after sampling was completed. These contractors were Ron’s Maintenanceusing the manual method shown in Figure 6. Manual clean-out by Ron’s Maintenance in the Tecolote and SanYsidro areas.Figure 6 and Downstream Services, Inc. using the vactor method shown in Figure 7. DownstreamServices used its Truck #71, a 2001 Isuzu MiniVac (shown in Figure 7), with a capacity of 750 gallons. Thistruck is used by Downstream Services for routine inlet cleaning; a larger vactor is used only in the event that alarge mechanical separator or an impacted/collapsed area is to be cleaned.
Figure 6. Manual clean-out by Ron’s Maintenance in the Tecolote and San Ysidro areas.
12
Figure 7. Vactor clean-out by Downstream Services, Inc. in the Downtown and Poway areas.
Schedule
Catch basins in each network were cleaned four times between December 2011 and March 2012. The variabilityof winter season weather was the major driver behind the selected clean-out dates, which were timed based onten- and three-day National Weather Service forecasts for rain events predicted to bring one or more inches ofprecipitation to the metropolitan area. The intent was to separate clean-out dates by roughly two months, and totime clean-outs immediately preceding a significant rain event to attempt to capture the build-up period betweenrain events. As the winter season weather played out, the clean-outs occurred with greater frequency over ashorter overall period than originally anticipated, but each was timed in advance of a rain event as shown anddiscussed in Section 3, Figure 9.
Sediment Characterization
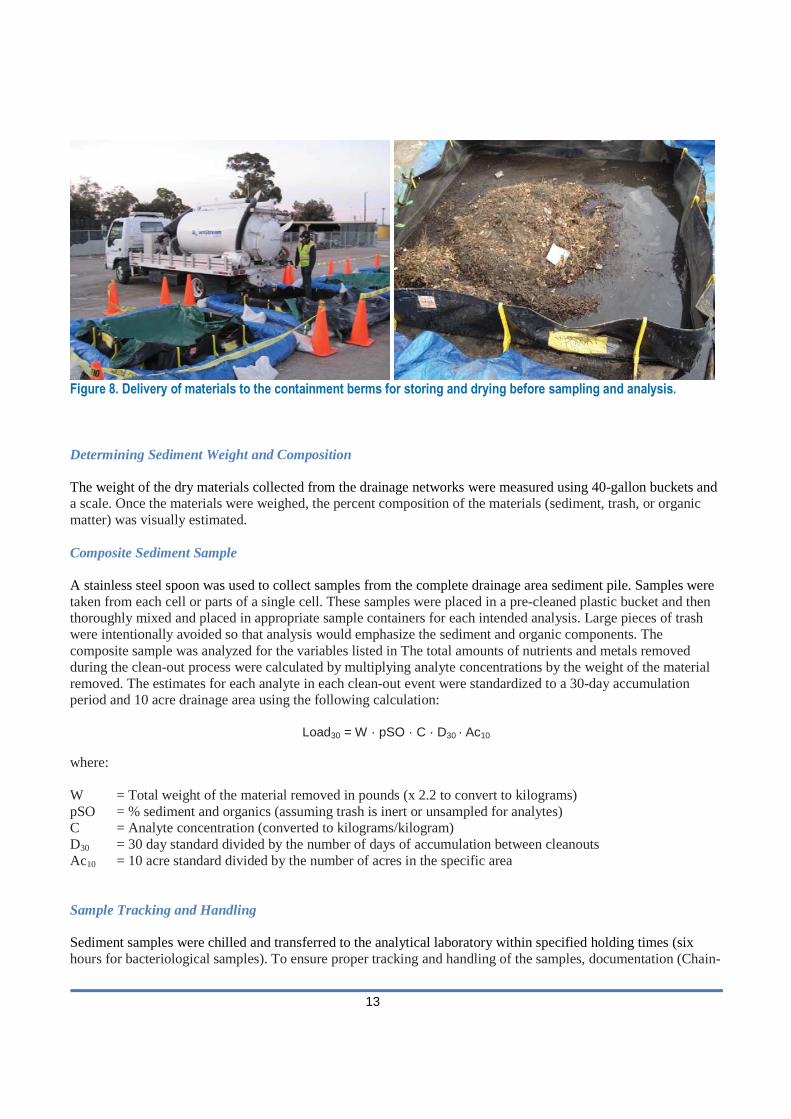
The sediment and materials removed from the catch basin networks during cleaning were brought to the City’sRose Canyon Operations Yard and stored in the pop-up containment berms shown in Figure 8, which weresupplied by MACTEC (Amec) and have been retained for future sampling efforts. Sediment and materialscollected from each area were stored in a single pop up berm and allowed to air dry, with the exception of theScripps Poway Parkway area for the first sampling event. There was some concern that the volume of materialcollected from the catch basins in the Scripps Poway Parkway area may exceed the capacity of the pop up berm;as such, a single roll off bin was used for the first event only for the Scripps Poway Parkway area, until it wasdetermined that the volume of material could be contained in the pop up berm. Once the sediment/debris was airdried, the following activities were conducted to characterize the collected sediment from each drainage network:
1. Determine the total dry weight of the collected sediment/debris.2. Characterize the percentage of sediment, trash, and organic material.3. Collect a composite sample for analysis of nutrients, metals, microbiology, and organic compounds
13
Figure 8. Delivery of materials to the containment berms for storing and drying before sampling and analysis.
Determining Sediment Weight and Composition
The weight of the dry materials collected from the drainage networks were measured using 40-gallon buckets anda scale. Once the materials were weighed, the percent composition of the materials (sediment, trash, or organicmatter) was visually estimated.
Composite Sediment Sample
A stainless steel spoon was used to collect samples from the complete drainage area sediment pile. Samples weretaken from each cell or parts of a single cell. These samples were placed in a pre-cleaned plastic bucket and thenthoroughly mixed and placed in appropriate sample containers for each intended analysis. Large pieces of trashwere intentionally avoided so that analysis would emphasize the sediment and organic components. Thecomposite sample was analyzed for the variables listed in The total amounts of nutrients and metals removedduring the clean-out process were calculated by multiplying analyte concentrations by the weight of the materialremoved. The estimates for each analyte in each clean-out event were standardized to a 30-day accumulationperiod and 10 acre drainage area using the following calculation:
Load30 = W · pSO · C · D30 · Ac10
where:
W = Total weight of the material removed in pounds (x 2.2 to convert to kilograms)pSO = % sediment and organics (assuming trash is inert or unsampled for analytes)C = Analyte concentration (converted to kilograms/kilogram)D30 = 30 day standard divided by the number of days of accumulation between cleanoutsAc10 = 10 acre standard divided by the number of acres in the specific area
Sample Tracking and Handling
Sediment samples were chilled and transferred to the analytical laboratory within specified holding times (sixhours for bacteriological samples). To ensure proper tracking and handling of the samples, documentation (Chain-
14
of-Custody [COC] Forms) accompanied the samples from the initial pickup to the final extraction and analysis.All samples collected, including the composite containers, were labeled with information regarding Project name,Date, Time, Sampling location name and number, Preservative, Collector’s initials, Sample I.D. number, andAnalytes to be quantified.
Table 1. Equipment used for sampling was cleaned using a standard three-step cleaning process with Alconox andde-ionized water. The equipment was cleaned between the sampling of each drainage network to prevent cross-contamination.
The total amounts of nutrients and metals removed during the clean-out process were calculated by multiplyinganalyte concentrations by the weight of the material removed. The estimates for each analyte in each clean-outevent were standardized to a 30-day accumulation period and 10 acre drainage area using the followingcalculation:
Load30 = W · pSO · C · D30 · Ac10
where:
W = Total weight of the material removed in pounds (x 2.2 to convert to kilograms)pSO = % sediment and organics (assuming trash is inert or unsampled for analytes)C = Analyte concentration (converted to kilograms/kilogram)D30 = 30 day standard divided by the number of days of accumulation between cleanoutsAc10 = 10 acre standard divided by the number of acres in the specific area
Sample Tracking and Handling
Sediment samples were chilled and transferred to the analytical laboratory within specified holding times (sixhours for bacteriological samples). To ensure proper tracking and handling of the samples, documentation (Chain-of-Custody [COC] Forms) accompanied the samples from the initial pickup to the final extraction and analysis.All samples collected, including the composite containers, were labeled with information regarding Project name,Date, Time, Sampling location name and number, Preservative, Collector’s initials, Sample I.D. number, andAnalytes to be quantified.
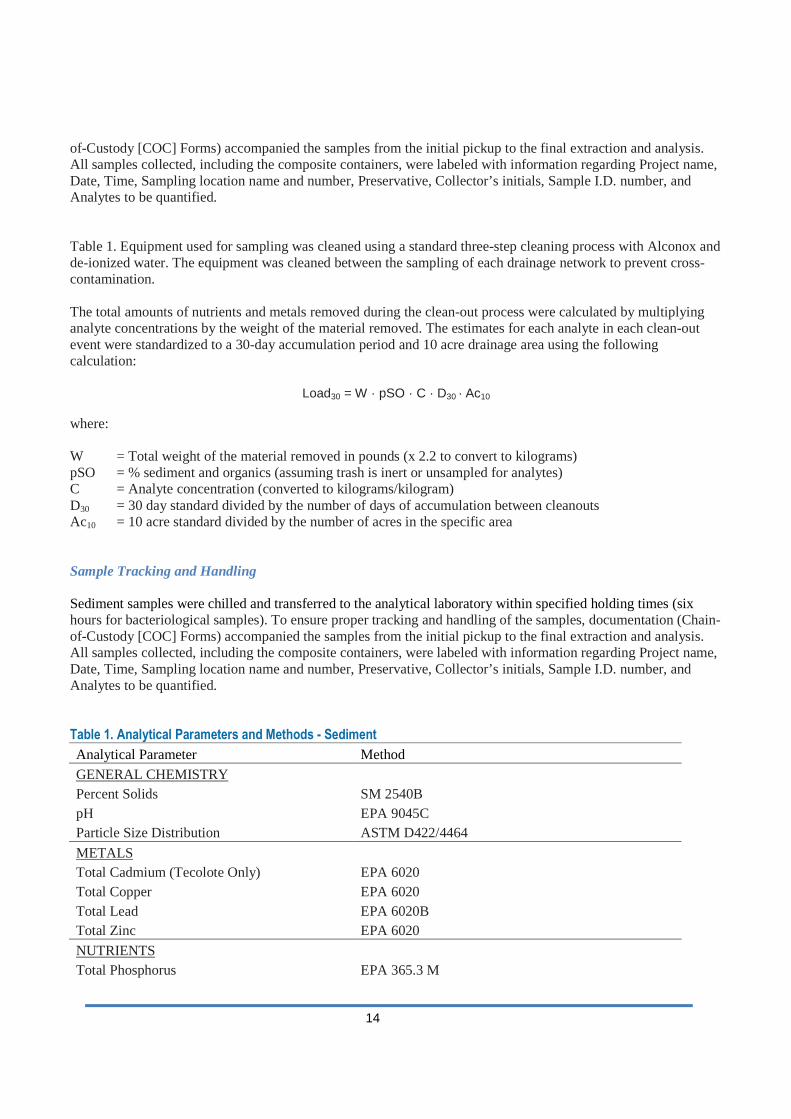
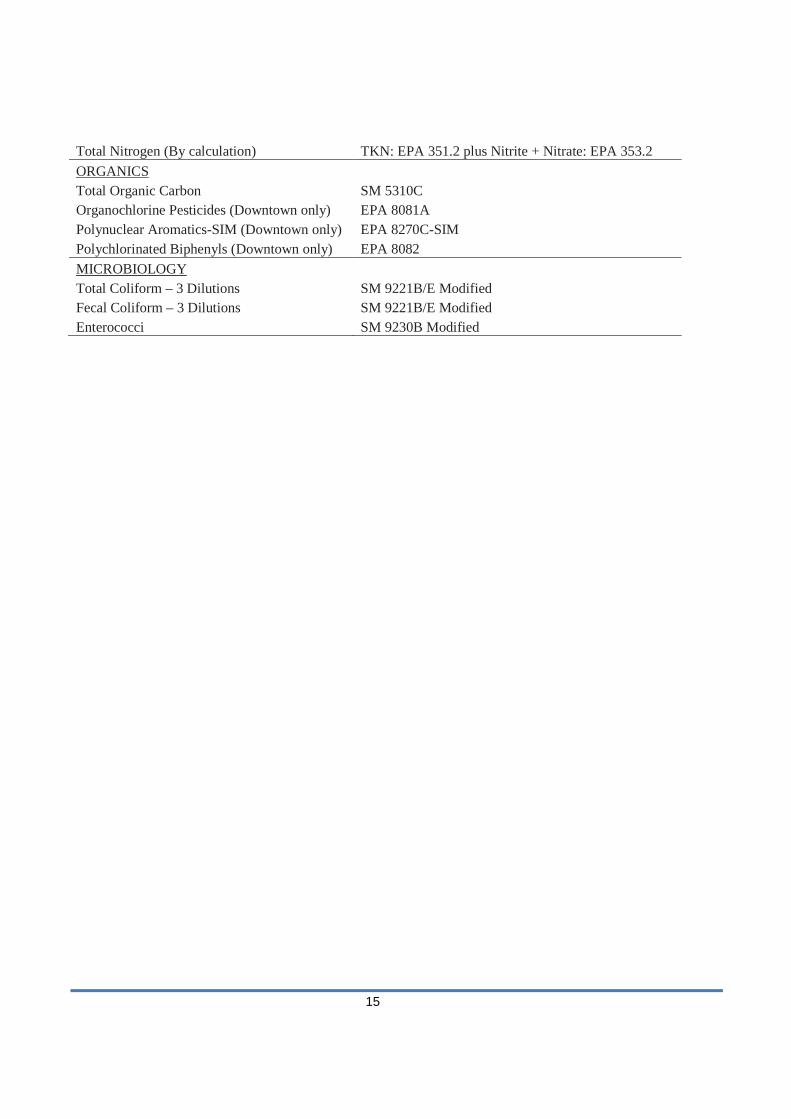
Table 1. Analytical Parameters and Methods - SedimentAnalytical Parameter MethodGENERAL CHEMISTRYPercent Solids SM 2540BpH EPA 9045CParticle Size Distribution ASTM D422/4464METALSTotal Cadmium (Tecolote Only) EPA 6020Total Copper EPA 6020Total Lead EPA 6020BTotal Zinc EPA 6020NUTRIENTSTotal Phosphorus EPA 365.3 M
15
Total Nitrogen (By calculation) TKN: EPA 351.2 plus Nitrite + Nitrate: EPA 353.2ORGANICSTotal Organic Carbon SM 5310COrganochlorine Pesticides (Downtown only) EPA 8081APolynuclear Aromatics-SIM (Downtown only) EPA 8270C-SIMPolychlorinated Biphenyls (Downtown only) EPA 8082MICROBIOLOGYTotal Coliform – 3 Dilutions SM 9221B/E ModifiedFecal Coliform – 3 Dilutions SM 9221B/E ModifiedEnterococci SM 9230B Modified

16
3 Results
This section presents the results of the analysis of the catch basin materials removed in the four clean-outs. Thetiming of the catch-basin clean-outs started somewhat later than originally planned, and were then spaced atintervals of 42, 19, and 38 days, with rain events intervening. Figure 9 and Error! Reference source not found.illustrate the timing of the catch basin cleanings and the material sampling. For two of the clean-out events in thepilot study, the interim period between cleanings was similar (42 and 38 days for CO2 and CO4, respectively).The number of rainfall events was also similar during these two periods, though the amounts of rain per eventwere somewhat different. In CO2, one larger rainfall event occurred at the beginning of the period and thesubsequent events were much smaller. In CO4, all of the events were of a moderate amount and mostly during thefirst half of the period. The interim period for CO3 was 19 days, about half the time of CO2 and CO4. Only twodays had measureable rain during that period with small and moderate amounts of precipitation. For the initialcleaning (CO1), information was not available about previous clean-out events. In some analyses, 90 days wasassumed, though the amount could be much higher (as much as one year). Two large rainfall events occurred inthe month before the initial clean-out.
Figure 9. Timeline of catch basin clean-out (CO1-CO4), sampling, and rain events.
17
The sediments removed during clean-outs were allowed to dry adequately, though one sample (Poway in CO3)was analyzed a day after a rain event. The drying time was between 1 to 3 weeks depending on the amount ofsediment. The cleanout dates were: December 8, 2011; January 19, 2012; February 7, 2012; and March 15 (earlyAM) to 16, 2012. Data were collected in the field during sample collection, at the time of sampling, and in theanalytical laboratories. To facilitate analysis, these data were transcribed from field and laboratory data sheets intospreadsheets (Appendix B).
Table 2. Cleanout and sampling dates.Activity Date CommentCO1 Initial Clean-out 12/8/2011CO1 Sample 12/27/2011 7 days after last rain dayCO2 Clean-out 1/19/2012 42 days (10 with measureable rain) since CO1CO2 Sample 2/2/2012 10 days after last rain dayCO3 Clean-out 2/7/2012 19 days (2 with measureable rain) since CO2CO3 Sample (PO site only) 2/29/2012 1 day after last rain dayCO3 Sample (DO, TE, SY Sites) 3/5/2012 6 days after last rain dayCO4 Clean-out 3/16/2012 38 days (7 with measureable rain) since CO3CO4 Sample 4/14/2012 3 days after last rain day
There was one incidence of inadvertently mixed sediments, which is not believed to have affected these results.Macetc (Amec) field technicians determined that the error was inconsequential and that the sediment sample wastruly representative of the materials removed from the catch basins (email communications, Kristina Schneider,AMEC, 3/22/2012). After the CO3 sampling event, the containment berms were used to temporarily hold debrisremoved from the Memorial Park hydrodynamic separator. Though those Memorial Park materials should havebeen removed before the CO4 clean-out, a rain event occurred much sooner than expected and Memorial Parksediment was still present in one of the two vactor containment berms (Scripps Poway Parkway) when CO4 wasscheduled. The CO4 materials were delivered a day earlier than expected (3/15 instead of 3/16) and the ScrippsPoway Parkway materials were placed directly on top of the Memorial Park materials (Figure 8Figure 8, rightphoto).
The sediment from Memorial Park was a thin layer of fine sediment on the bottom of the containment berm. TheScripps Poway Parkway materials were placed in a large pile in the bin on top of the Memorial Park materials.The containment berm was covered with a new tarp before a large rain event and no rainfall entered thecontainment berm. The top layer of the Scripps Poway Parkway materials did not appear to contact the MemorialPark materials and rainfall did not appear to have entered the containment berm. Therefore, a representativesample of the Scripps Poway Parkway materials was obtained by taking the Scripps Poway Parkway sample fromthe top few inches of the materials pile. The remaining Scripps Poway Parkway materials were characterized (%organic, trash, sediment, etc.) per standard project practices since they were distinct from the Memorial Parkmaterials.
3.1 Material Characterization
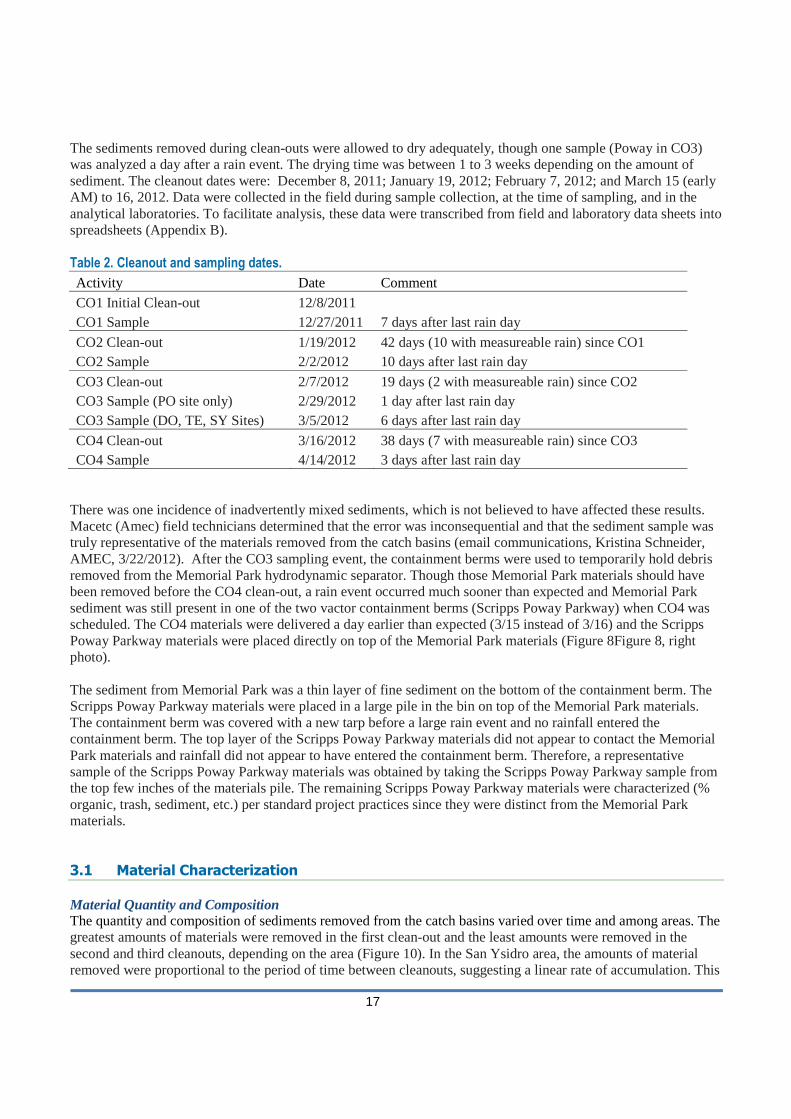
Material Quantity and CompositionThe quantity and composition of sediments removed from the catch basins varied over time and among areas. Thegreatest amounts of materials were removed in the first clean-out and the least amounts were removed in thesecond and third cleanouts, depending on the area (Figure 10). In the San Ysidro area, the amounts of materialremoved were proportional to the period of time between cleanouts, suggesting a linear rate of accumulation. This
18
pattern was somewhat similar in the Tecolote area but was not observed in the Scripps Poway Parkway andDowntown areas, which had more material removed in the short CO3 period than in CO2 or 4.
Figure 10. Weight of materials removed from all catch basins in four clean-out periods and within the four areas.
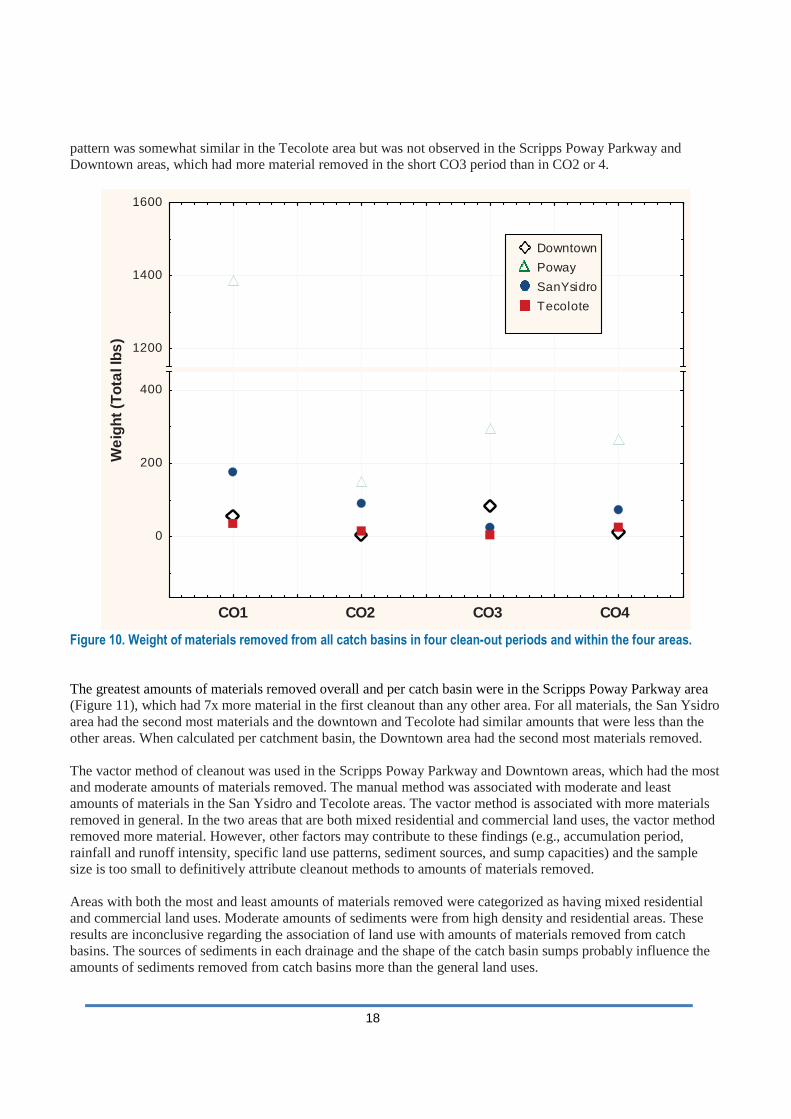
The greatest amounts of materials removed overall and per catch basin were in the Scripps Poway Parkway area(Figure 11), which had 7x more material in the first cleanout than any other area. For all materials, the San Ysidroarea had the second most materials and the downtown and Tecolote had similar amounts that were less than theother areas. When calculated per catchment basin, the Downtown area had the second most materials removed.
The vactor method of cleanout was used in the Scripps Poway Parkway and Downtown areas, which had the mostand moderate amounts of materials removed. The manual method was associated with moderate and leastamounts of materials in the San Ysidro and Tecolote areas. The vactor method is associated with more materialsremoved in general. In the two areas that are both mixed residential and commercial land uses, the vactor methodremoved more material. However, other factors may contribute to these findings (e.g., accumulation period,rainfall and runoff intensity, specific land use patterns, sediment sources, and sump capacities) and the samplesize is too small to definitively attribute cleanout methods to amounts of materials removed.
Areas with both the most and least amounts of materials removed were categorized as having mixed residentialand commercial land uses. Moderate amounts of sediments were from high density and residential areas. Theseresults are inconclusive regarding the association of land use with amounts of materials removed from catchbasins. The sources of sediments in each drainage and the shape of the catch basin sumps probably influence theamounts of sediments removed from catch basins more than the general land uses.
CO1 CO2 CO3 CO4
0
200
400
1200
1400
1600
Wei
ght(
Tota
llbs
)
DowntownPowaySanYsidroTecolote
19
Figure 11. Weight of materials removed from all catch basins and per inlet within the four areas and in four samplingperiods. Diagram shows minimum, maximum, quartile, and median values.
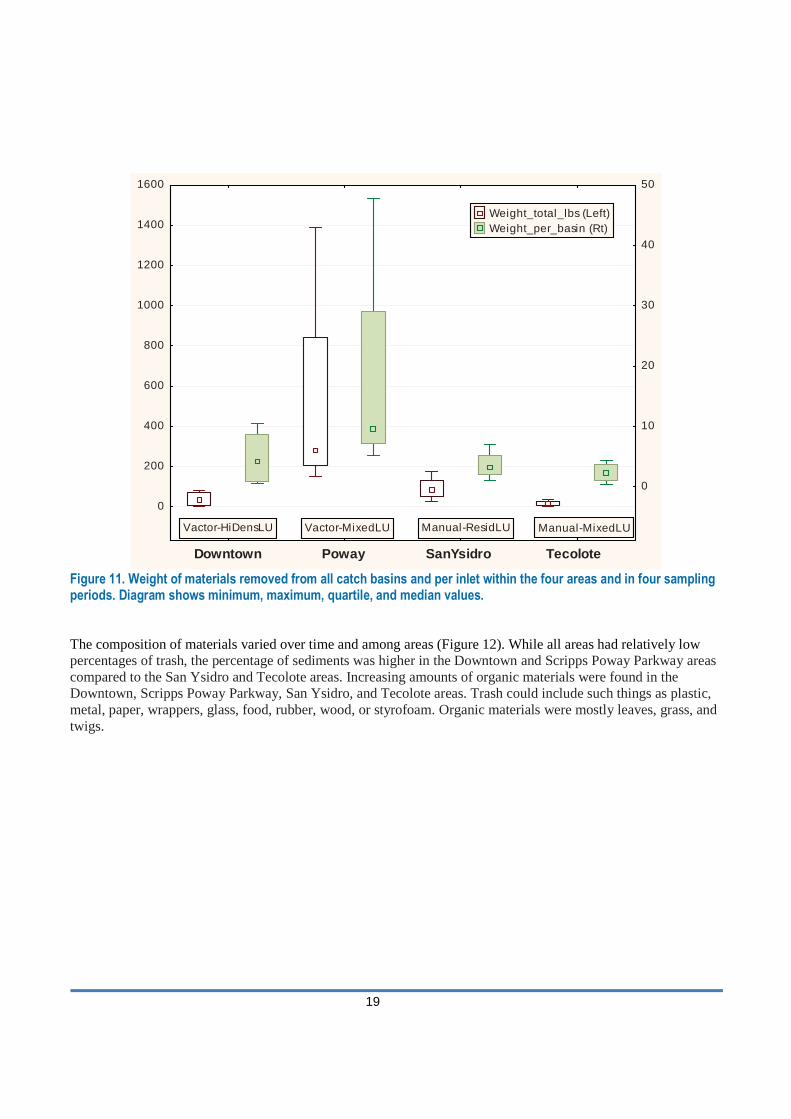
The composition of materials varied over time and among areas (Figure 12). While all areas had relatively lowpercentages of trash, the percentage of sediments was higher in the Downtown and Scripps Poway Parkway areascompared to the San Ysidro and Tecolote areas. Increasing amounts of organic materials were found in theDowntown, Scripps Poway Parkway, San Ysidro, and Tecolote areas. Trash could include such things as plastic,metal, paper, wrappers, glass, food, rubber, wood, or styrofoam. Organic materials were mostly leaves, grass, andtwigs.
Downtown Poway SanYsidro Tecolote
0
200
400
600
800
1000
1200
1400
1600
0
10
20
30
40
50
Weight_total_lbs (Left)Weight_per_basin (Rt)
Manual-ResidLUVactor-MixedLUVactor-HiDensLU Manual-MixedLU
20
Figure 12. Percentages of sediment, trash, and organic material in the material removed in each area (by visualinspection). Diagram shows minimum, maximum, quartile, and median values.
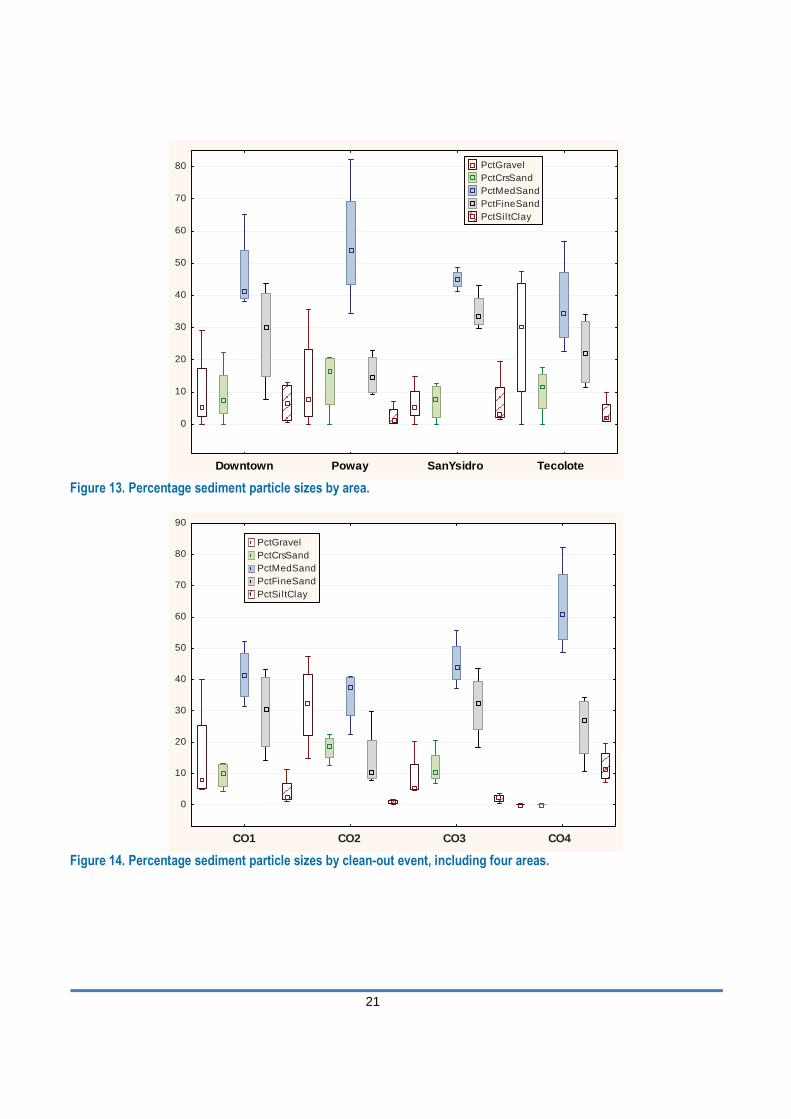
The sediment component of the samples were analyzed for pollutants, including nutrients, heavy metals,microbiology, and organic compounds. The sediments were also characterized by particle size (Figure 13). In eacharea, medium sand particles were most common in the sediment, especially during the last cleanout event (Figure14). Gravels, which were predominant in the Tecolote area and in earlier samples, were completely absent in the finalcleanout event. The reduction in gravel and coarse sand sized particles in each successive cleanout event can beseen when the percentages of particle sizes are converted to total weights (Figure 15). Gravels may accumulate over longer periods of time or with storm events with sufficient flows tocarry the larger particles.
Downtown Poway San Ysidro Tecolate
0
10
20
30
40
50
60
70
80
90
pctSedimentpctTrashpctOrganics
21
Figure 13. Percentage sediment particle sizes by area.
Figure 14. Percentage sediment particle sizes by clean-out event, including four areas.
Downtown Poway SanYsidro Tecolote
0
10
20
30
40
50
60
70
80 PctGravelPctCrsSandPctMedSandPctFineSandPctSiltClay
CO1 CO2 CO3 CO4
0
10
20
30
40
50
60
70
80
90
PctGravelPctCrsSandPctMedSandPctFineSandPctSi ltClay
22
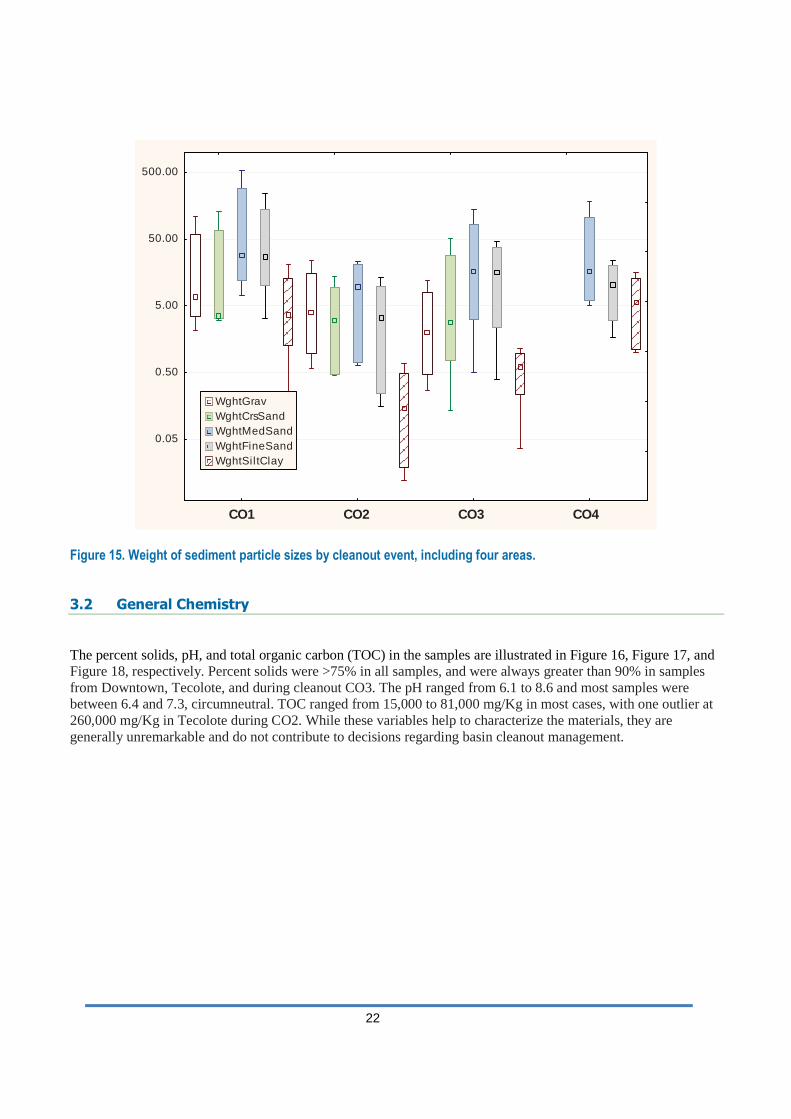
Figure 15. Weight of sediment particle sizes by cleanout event, including four areas.
3.2 General Chemistry
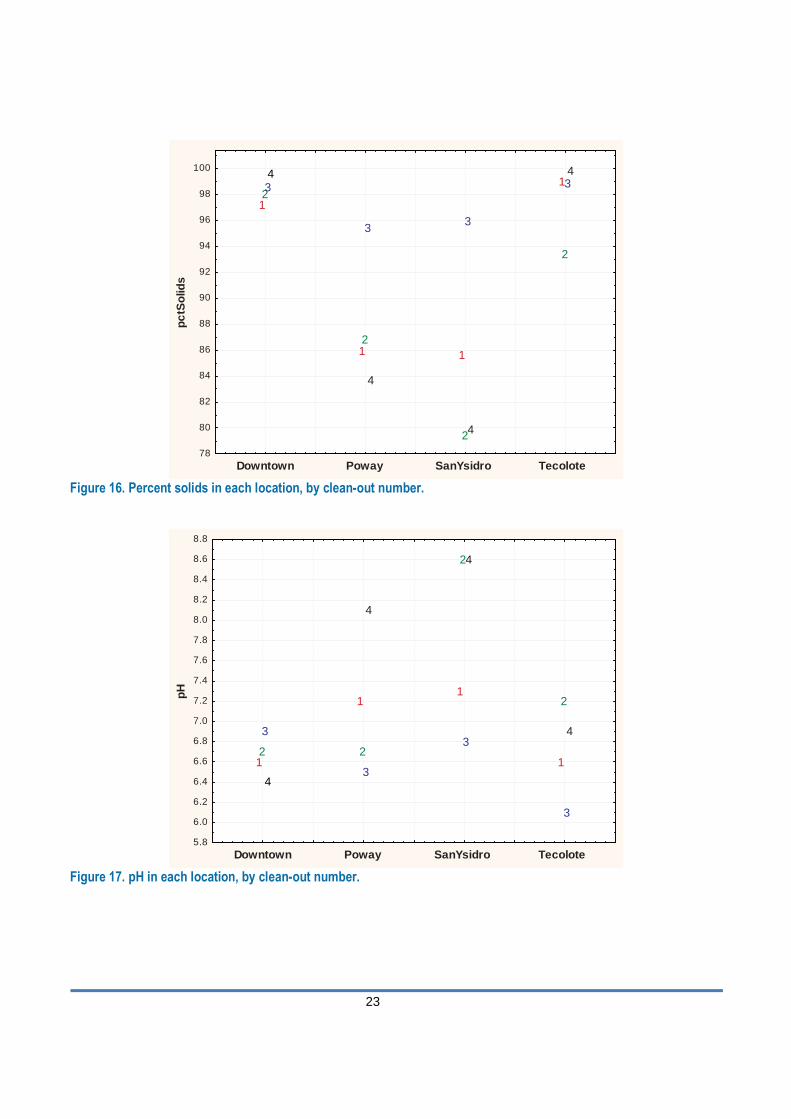
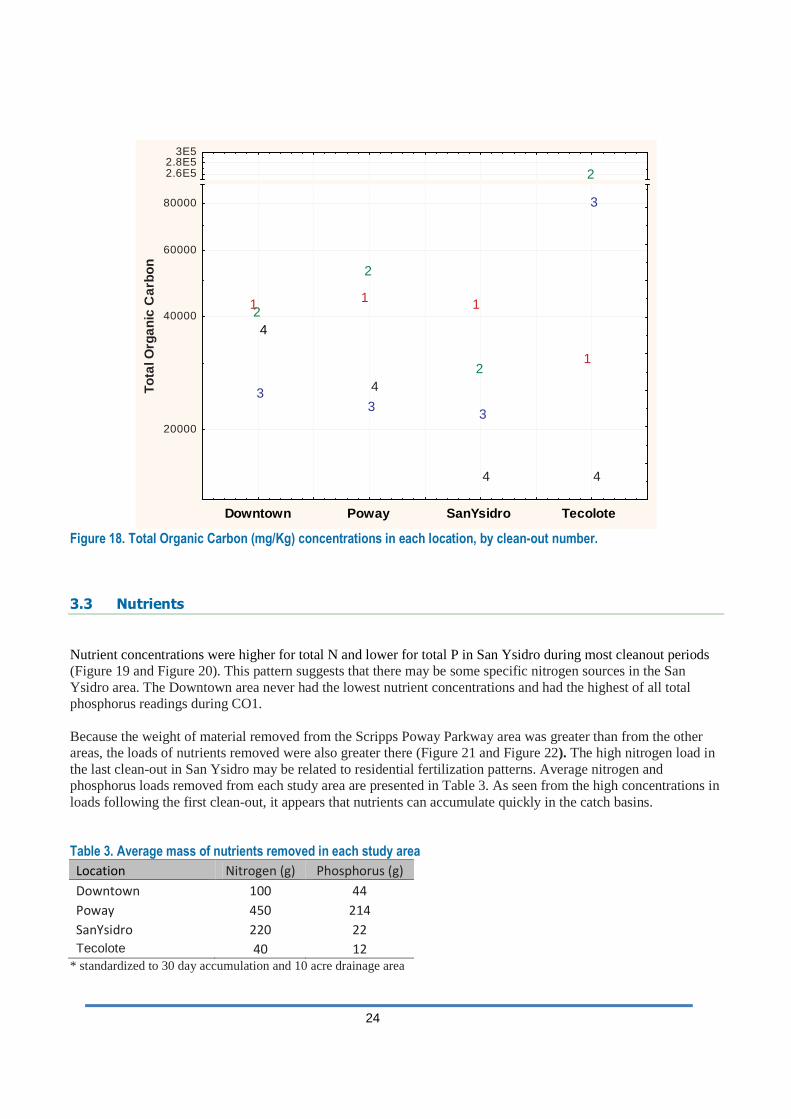
The percent solids, pH, and total organic carbon (TOC) in the samples are illustrated in Figure 16, Figure 17, andFigure 18, respectively. Percent solids were >75% in all samples, and were always greater than 90% in samplesfrom Downtown, Tecolote, and during cleanout CO3. The pH ranged from 6.1 to 8.6 and most samples werebetween 6.4 and 7.3, circumneutral. TOC ranged from 15,000 to 81,000 mg/Kg in most cases, with one outlier at260,000 mg/Kg in Tecolote during CO2. While these variables help to characterize the materials, they aregenerally unremarkable and do not contribute to decisions regarding basin cleanout management.
CO1 CO2 CO3 CO4
0.05
0.50
5.00
50.00
500.00
WghtGravWghtCrsSandWghtMedSandWghtFineSandWghtSiltClay
23
Figure 16. Percent solids in each location, by clean-out number.
Figure 17. pH in each location, by clean-out number.
1
1 1
12
2
2
2
3
3 3
34
4
4
4
Downtown Poway SanYsidro Tecolote78
80
82
84
86
88
90
92
94
96
98
100pc
tSol
ids
1
11
12 2
2
2
3
3
3
3
4
4
4
4
Downtown Poway SanYsidro Tecolote5.8
6.0
6.2
6.4
6.6
6.8
7.0
7.2
7.4
7.6
7.8
8.0
8.2
8.4
8.6
8.8
pH
24
Figure 18. Total Organic Carbon (mg/Kg) concentrations in each location, by clean-out number.
3.3 Nutrients
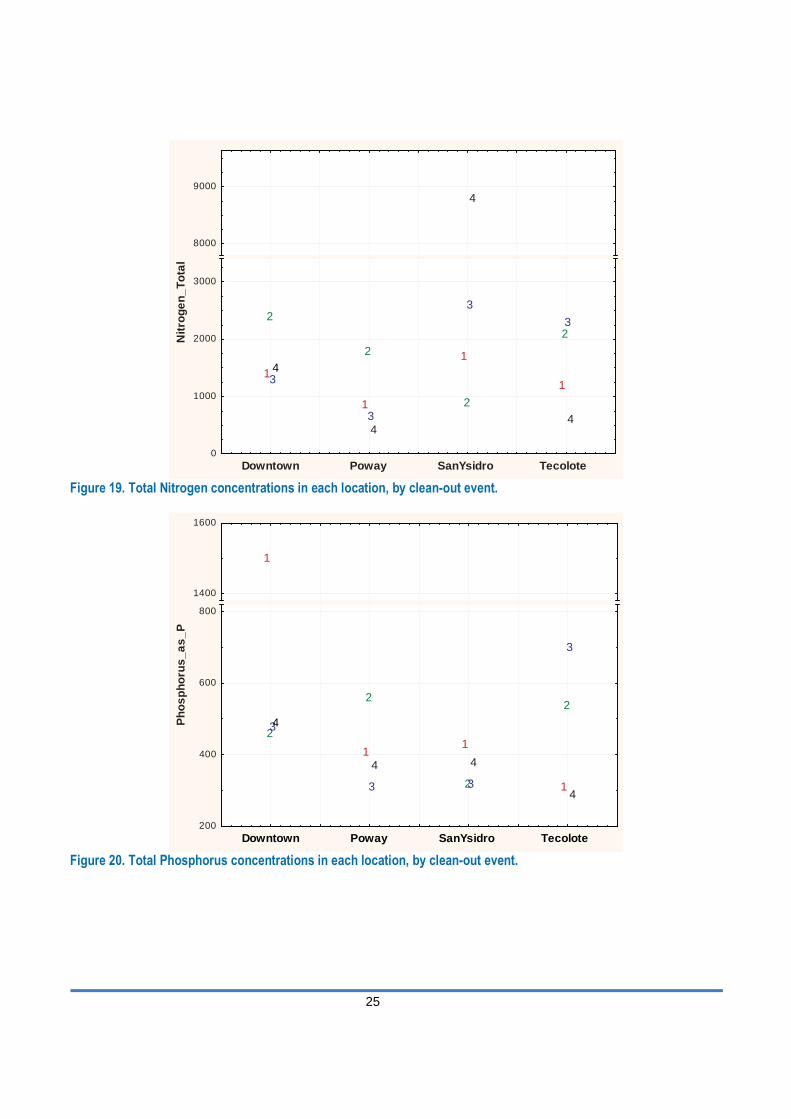
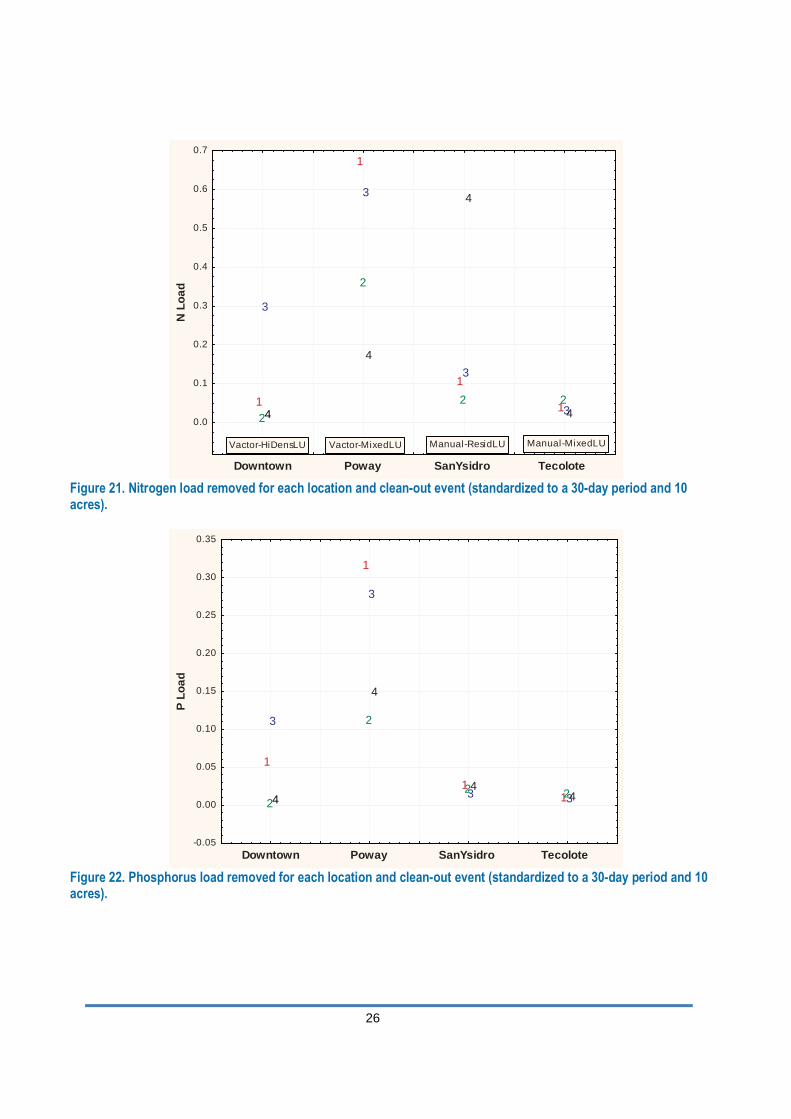
Nutrient concentrations were higher for total N and lower for total P in San Ysidro during most cleanout periods(Figure 19 and Figure 20). This pattern suggests that there may be some specific nitrogen sources in the SanYsidro area. The Downtown area never had the lowest nutrient concentrations and had the highest of all totalphosphorus readings during CO1.
Because the weight of material removed from the Scripps Poway Parkway area was greater than from the otherareas, the loads of nutrients removed were also greater there (Figure 21 and Figure 22). The high nitrogen load inthe last clean-out in San Ysidro may be related to residential fertilization patterns. Average nitrogen andphosphorus loads removed from each study area are presented in Table 3. As seen from the high concentrations inloads following the first clean-out, it appears that nutrients can accumulate quickly in the catch basins.
Table 3. Average mass of nutrients removed in each study areaLocation Nitrogen (g) Phosphorus (g)Downtown 100 44Poway 450 214SanYsidro 220 22Tecolote 40 12
* standardized to 30 day accumulation and 10 acre drainage area
1 1 1
1
2
2
2
33 3
3
4
4
4 4
2
Downtown Poway SanYsidro Tecolote
20000
40000
60000
80000
2.6E52.8E5
3E5To
talO
rgan
icC
arbo
n
25
Figure 19. Total Nitrogen concentrations in each location, by clean-out event.
Figure 20. Total Phosphorus concentrations in each location, by clean-out event.
1
1
1
1
2
2
2
2
3
3
33
4
44
4
Downtown Poway SanYsidro Tecolote0
1000
2000
3000
8000
9000N
itrog
en_T
otal
11
1
2
2
2
2
3
3 3
3
4
4 4
4
1
Downtown Poway SanYsidro Tecolote200
400
600
800
1400
1600
Phos
phor
us_a
s_P
26
Figure 21. Nitrogen load removed for each location and clean-out event (standardized to a 30-day period and 10acres).
Figure 22. Phosphorus load removed for each location and clean-out event (standardized to a 30-day period and 10acres).
1
1
1
12
2
2 2
3
3
3
34
4
4
4
Downtown Poway SanYsidro Tecolote
0.0
0.1
0.2
0.3
0.4
0.5
0.6
0.7
NLo
ad
Vactor-HiDensLU Vactor-MixedLU Manual-ResidLU Manual-MixedLU
1
1
112
2
2 2
3
3
3 34
4
44
Downtown Poway SanYsidro Tecolote-0.05
0.00
0.05
0.10
0.15
0.20
0.25
0.30
0.35
PLo
ad

27
3.4 Metals
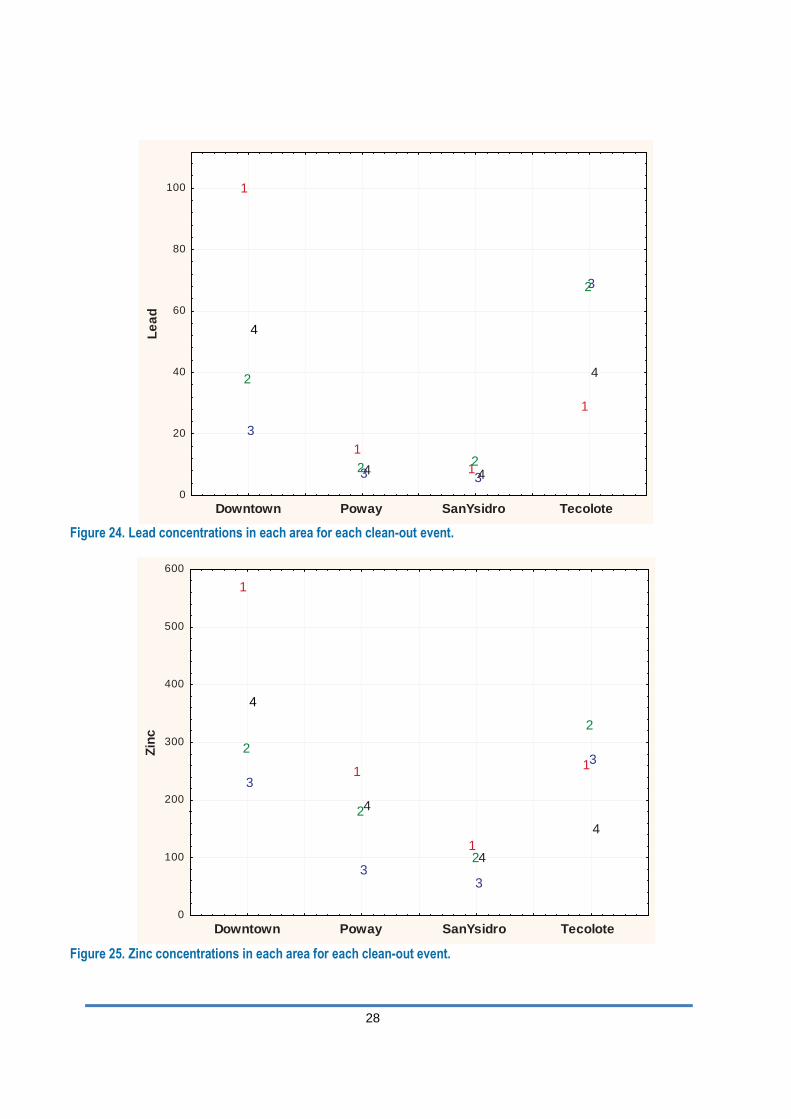
Copper, lead, and zinc were sampled in each area for each sampling event. The highest concentrations of thesethree metals were observed in the Downtown area during the first cleanout event (Figure 23, Figure 24, andFigure 25). During other sampling events, higher conceFigure 25. Zinc concentrations in each area for each clean-out event.ntrations were observed in the Downtown and Tecolote areas. Concentrations were higher in CO1 andCO4 in the Downtown area and in CO2 and CO3 in the Tecolote area. The lowest concentrations overall wereconsistently in the San Ysidro residential area. For all but the Tecolote area, the lowest concentrations wereobserved in CO3, which also had the shortest accumulation period. Except for the anomaly in the Tecolote area,this suggests that metals accumulate linearly over time. The total amounts of metals removed in the catch basinclean-out process are summarized in Table 4 standardized to a 30 day accumulation and a 10 acre drainage area.Sampling prior to intensive rainfall may have yielded different results, possibly greater concentrations of metals.
Cadmium was only of concern in the Tecolote area, in which it was not detected in the sediments collected duringthe first three cleanout events. The detection limit was 0.40 mg/Kg. In CO4, cadmium was detected at aconcentration of 1.3 mg/Kg.
Figure 23. Copper concentrations in each area for each clean-out event.
1
1
11
2
2
2
23
3
3
3
4
4
4
4
Downtown Poway SanYsidro Tecolote0
20
40
60
80
100
120
140
160
180
200
Cop
per
28
Figure 24. Lead concentrations in each area for each clean-out event.
Figure 25. Zinc concentrations in each area for each clean-out event.
1
11
1
2
2 2
2
3
3 3
3
4
4 4
4
Downtown Poway SanYsidro Tecolote0
20
40
60
80
100
Lead
1
1
1
12
2
2
2
3
33
3
4
4
4
4
Downtown Poway SanYsidro Tecolote0
100
200
300
400
500
600
Zinc
29
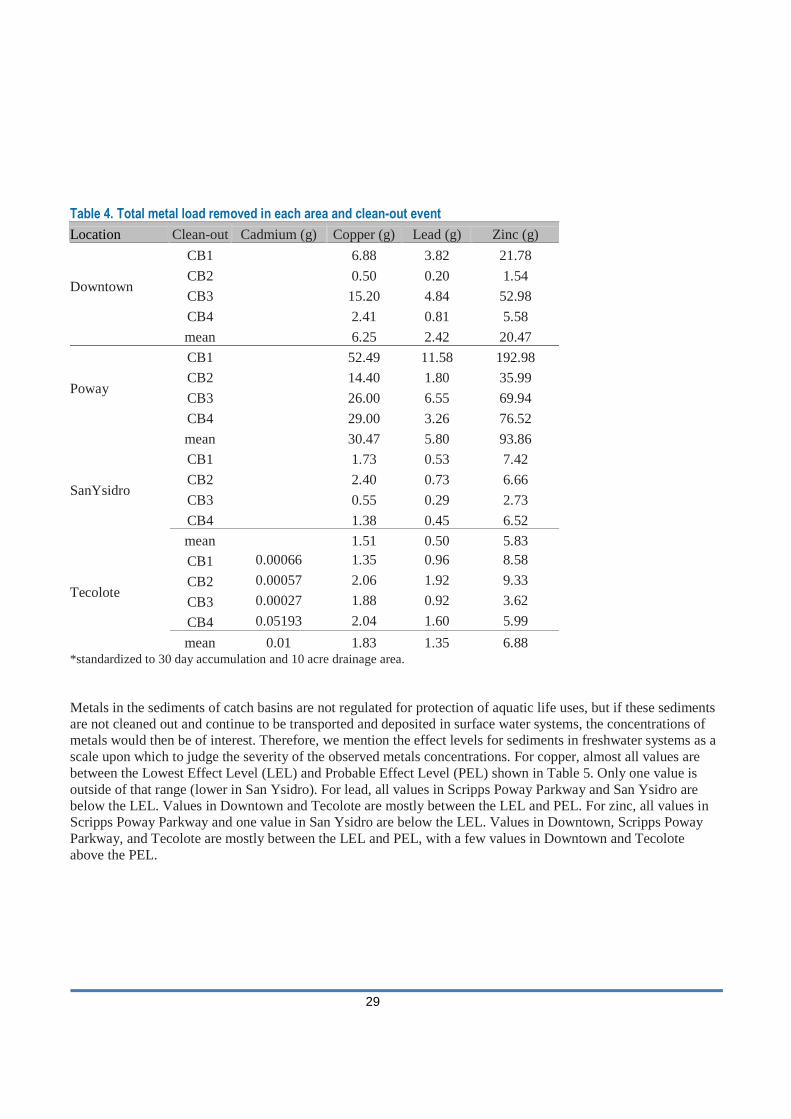
Table 4. Total metal load removed in each area and clean-out eventLocation Clean-out Cadmium (g) Copper (g) Lead (g) Zinc (g)
Downtown
CB1 6.88 3.82 21.78CB2 0.50 0.20 1.54CB3 15.20 4.84 52.98CB4 2.41 0.81 5.58mean 6.25 2.42 20.47
Poway
CB1 52.49 11.58 192.98CB2 14.40 1.80 35.99CB3 26.00 6.55 69.94CB4 29.00 3.26 76.52mean 30.47 5.80 93.86
SanYsidro
CB1 1.73 0.53 7.42CB2 2.40 0.73 6.66CB3 0.55 0.29 2.73CB4 1.38 0.45 6.52mean 1.51 0.50 5.83
Tecolote
CB1 0.00066 1.35 0.96 8.58CB2 0.00057 2.06 1.92 9.33CB3 0.00027 1.88 0.92 3.62CB4 0.05193 2.04 1.60 5.99mean 0.01 1.83 1.35 6.88
*standardized to 30 day accumulation and 10 acre drainage area.
Metals in the sediments of catch basins are not regulated for protection of aquatic life uses, but if these sedimentsare not cleaned out and continue to be transported and deposited in surface water systems, the concentrations ofmetals would then be of interest. Therefore, we mention the effect levels for sediments in freshwater systems as ascale upon which to judge the severity of the observed metals concentrations. For copper, almost all values arebetween the Lowest Effect Level (LEL) and Probable Effect Level (PEL) shown in Table 5. Only one value isoutside of that range (lower in San Ysidro). For lead, all values in Scripps Poway Parkway and San Ysidro arebelow the LEL. Values in Downtown and Tecolote are mostly between the LEL and PEL. For zinc, all values inScripps Poway Parkway and one value in San Ysidro are below the LEL. Values in Downtown, Scripps PowayParkway, and Tecolote are mostly between the LEL and PEL, with a few values in Downtown and Tecoloteabove the PEL.
30
Table 5. The Lowest Effect Level (LEL) and Probable Effect Level (PEL) values recommended as screening levels forfreshwater sediments (NOAA Screening Quick Reference Tablesa).
Metals (ppm, dry wt)Analyte LEL PELCadmium 0.6 3.53Copper 16 197Lead 31 91.3Zinc 120 315
a: http://response.restoration.noaa.gov/sites/default/files/SQuiRTs.pdf
3.5 Microbiology
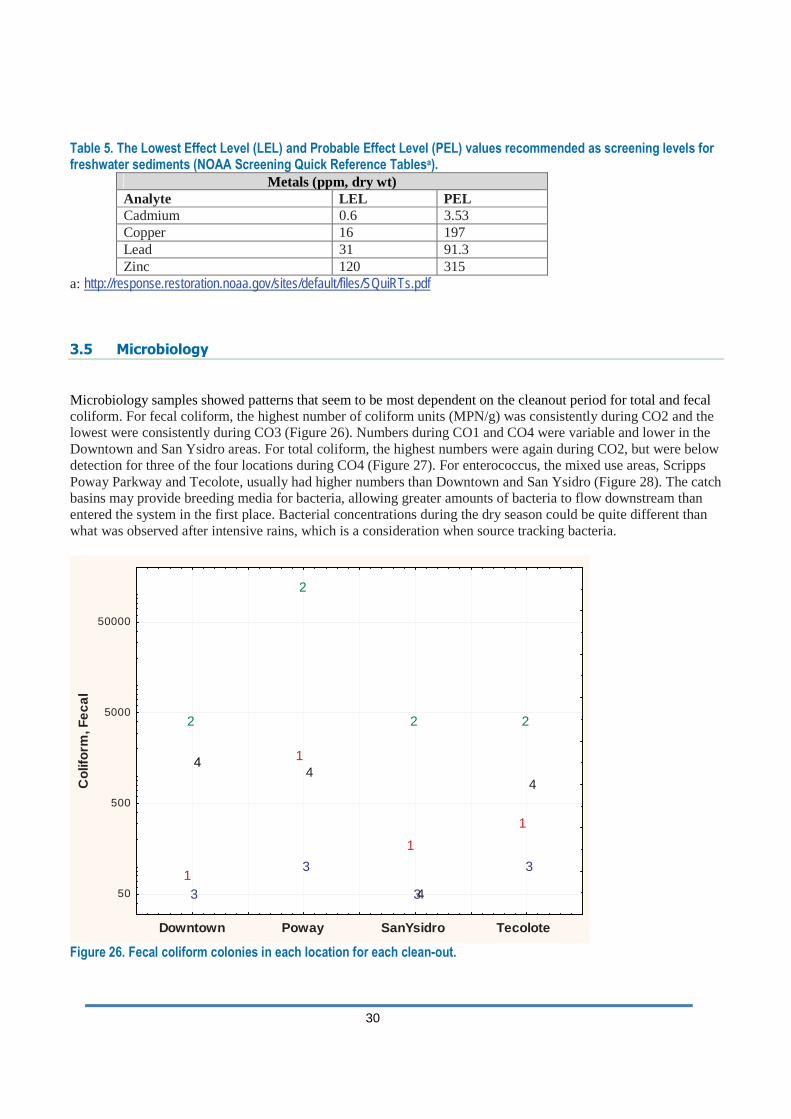
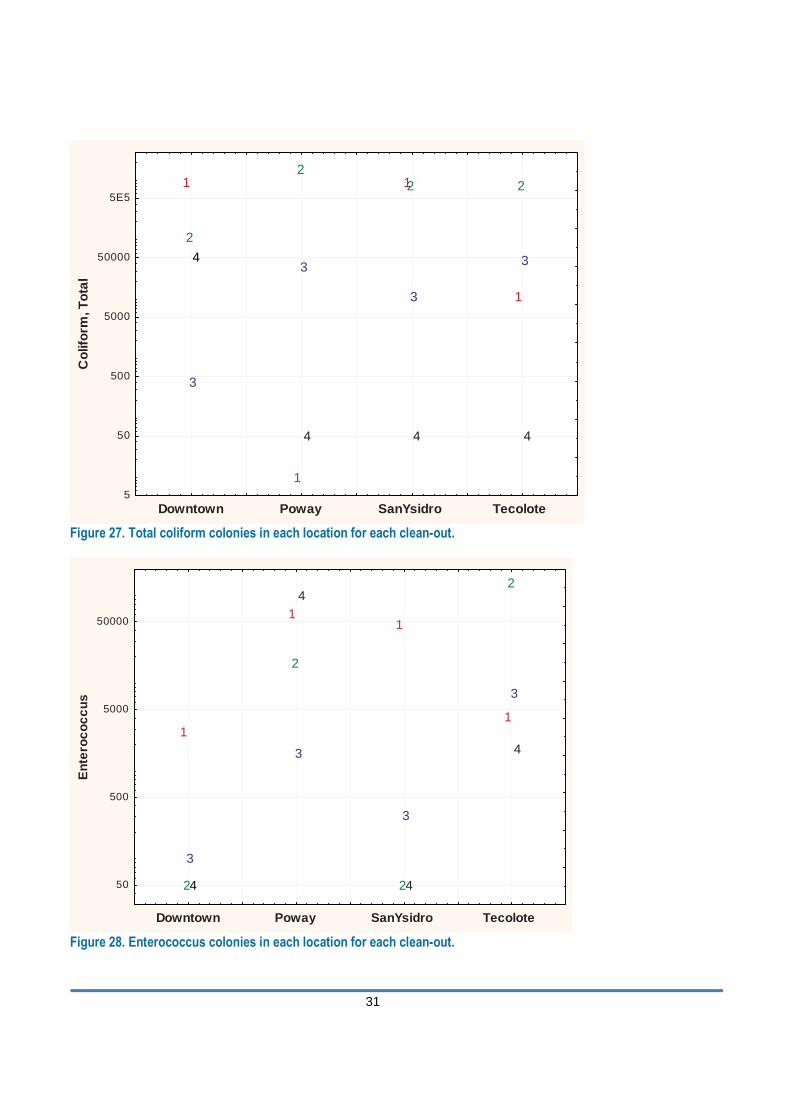
Microbiology samples showed patterns that seem to be most dependent on the cleanout period for total and fecalcoliform. For fecal coliform, the highest number of coliform units (MPN/g) was consistently during CO2 and thelowest were consistently during CO3 (Figure 26). Numbers during CO1 and CO4 were variable and lower in theDowntown and San Ysidro areas. For total coliform, the highest numbers were again during CO2, but were belowdetection for three of the four locations during CO4 (Figure 27). For enterococcus, the mixed use areas, ScrippsPoway Parkway and Tecolote, usually had higher numbers than Downtown and San Ysidro (Figure 28). The catchbasins may provide breeding media for bacteria, allowing greater amounts of bacteria to flow downstream thanentered the system in the first place. Bacterial concentrations during the dry season could be quite different thanwhat was observed after intensive rains, which is a consideration when source tracking bacteria.
Figure 26. Fecal coliform colonies in each location for each clean-out.
1
1
1
1
2
2
2 2
3
3
3
3
44
4
4
Downtown Poway SanYsidro Tecolote
50
500
5000
50000
Col
iform
,Fec
al
31
Figure 27. Total coliform colonies in each location for each clean-out.
Figure 28. Enterococcus colonies in each location for each clean-out.
1
1
1
1
2
22 2
3
3
3
34
4 4 4
Downtown Poway SanYsidro Tecolote5
50
500
5000
50000
5E5
Col
iform
,Tot
al
1
11
1
2
2
2
2
3
3
3
3
4
4
4
4
Downtown Poway SanYsidro Tecolote
50
500
5000
50000
Ente
roco
ccus
32
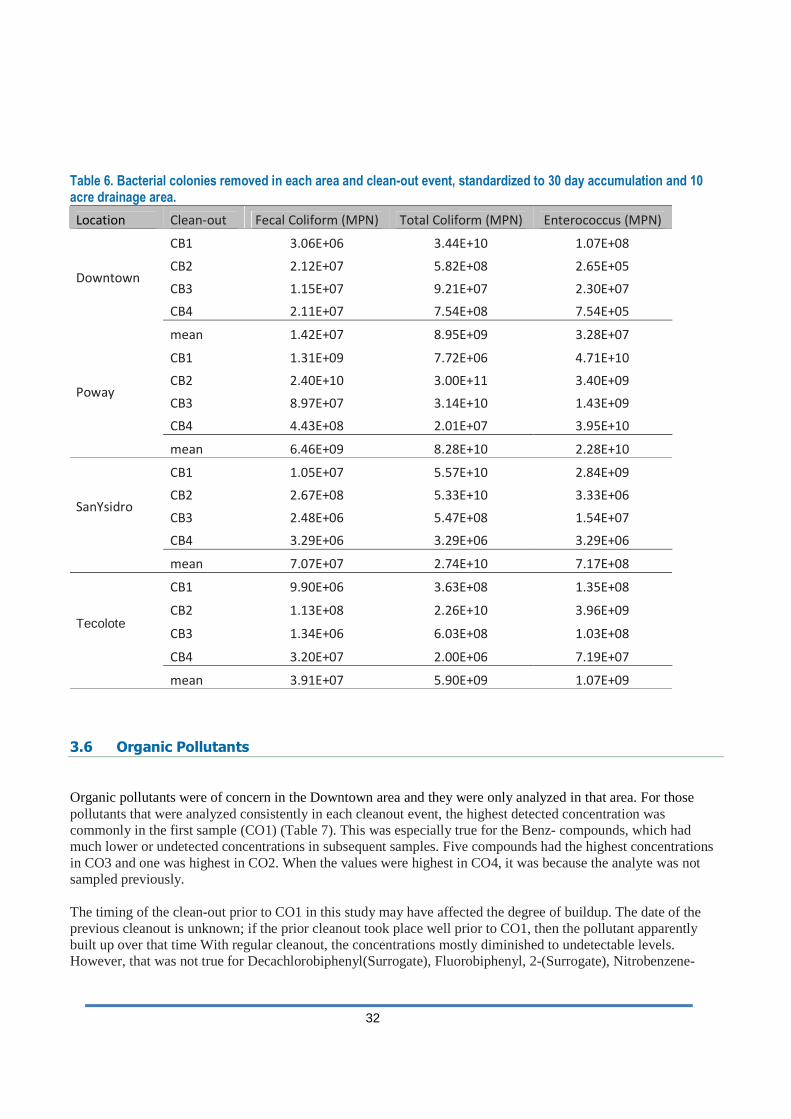
Table 6. Bacterial colonies removed in each area and clean-out event, standardized to 30 day accumulation and 10acre drainage area.Location Clean-out Fecal Coliform (MPN) Total Coliform (MPN) Enterococcus (MPN)
Downtown
CB1 3.06E+06 3.44E+10 1.07E+08
CB2 2.12E+07 5.82E+08 2.65E+05CB3 1.15E+07 9.21E+07 2.30E+07CB4 2.11E+07 7.54E+08 7.54E+05
mean 1.42E+07 8.95E+09 3.28E+07
Poway
CB1 1.31E+09 7.72E+06 4.71E+10CB2 2.40E+10 3.00E+11 3.40E+09CB3 8.97E+07 3.14E+10 1.43E+09CB4 4.43E+08 2.01E+07 3.95E+10
mean 6.46E+09 8.28E+10 2.28E+10
SanYsidro
CB1 1.05E+07 5.57E+10 2.84E+09CB2 2.67E+08 5.33E+10 3.33E+06CB3 2.48E+06 5.47E+08 1.54E+07CB4 3.29E+06 3.29E+06 3.29E+06
mean 7.07E+07 2.74E+10 7.17E+08
Tecolote
CB1 9.90E+06 3.63E+08 1.35E+08
CB2 1.13E+08 2.26E+10 3.96E+09
CB3 1.34E+06 6.03E+08 1.03E+08
CB4 3.20E+07 2.00E+06 7.19E+07
mean 3.91E+07 5.90E+09 1.07E+09
3.6 Organic Pollutants
Organic pollutants were of concern in the Downtown area and they were only analyzed in that area. For thosepollutants that were analyzed consistently in each cleanout event, the highest detected concentration wascommonly in the first sample (CO1) (Table 7). This was especially true for the Benz- compounds, which hadmuch lower or undetected concentrations in subsequent samples. Five compounds had the highest concentrationsin CO3 and one was highest in CO2. When the values were highest in CO4, it was because the analyte was notsampled previously.
The timing of the clean-out prior to CO1 in this study may have affected the degree of buildup. The date of theprevious cleanout is unknown; if the prior cleanout took place well prior to CO1, then the pollutant apparentlybuilt up over that time With regular cleanout, the concentrations mostly diminished to undetectable levels.However, that was not true for Decachlorobiphenyl(Surrogate), Fluorobiphenyl, 2-(Surrogate), Nitrobenzene-
33
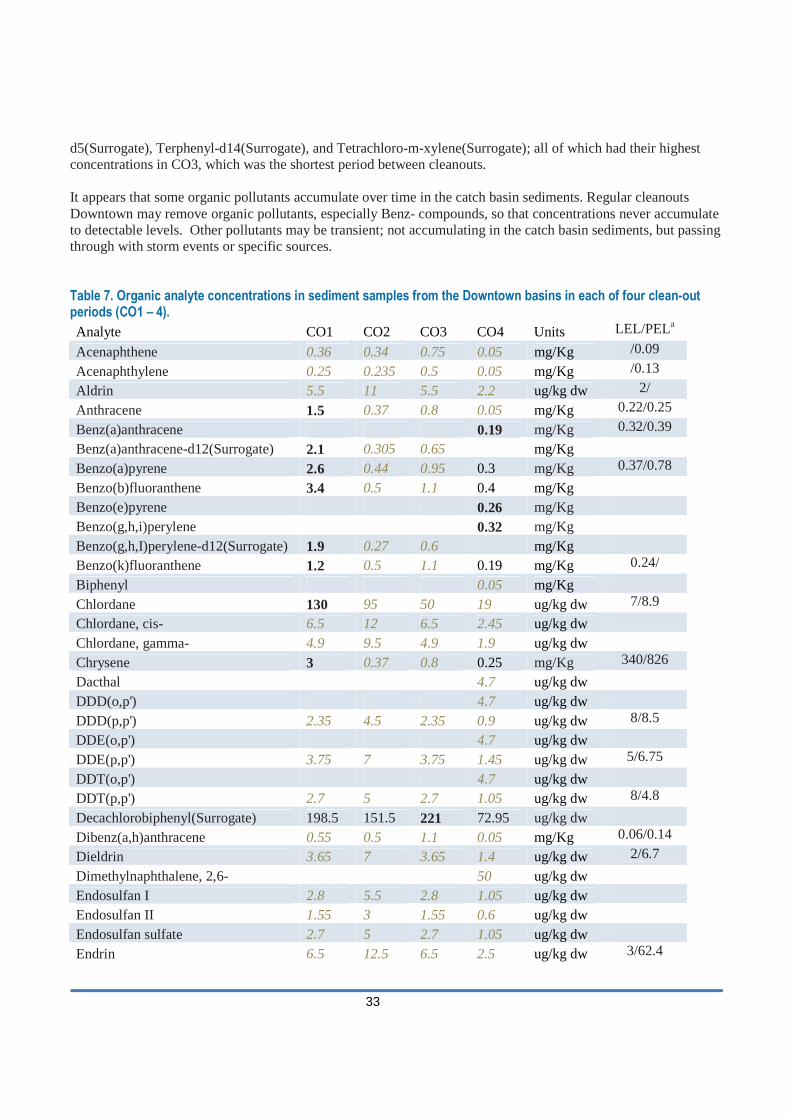
d5(Surrogate), Terphenyl-d14(Surrogate), and Tetrachloro-m-xylene(Surrogate); all of which had their highestconcentrations in CO3, which was the shortest period between cleanouts.
It appears that some organic pollutants accumulate over time in the catch basin sediments. Regular cleanoutsDowntown may remove organic pollutants, especially Benz- compounds, so that concentrations never accumulateto detectable levels. Other pollutants may be transient; not accumulating in the catch basin sediments, but passingthrough with storm events or specific sources.
Table 7. Organic analyte concentrations in sediment samples from the Downtown basins in each of four clean-outperiods (CO1 – 4).Analyte CO1 CO2 CO3 CO4 Units LEL/PELa
Acenaphthene 0.36 0.34 0.75 0.05 mg/Kg /0.09Acenaphthylene 0.25 0.235 0.5 0.05 mg/Kg /0.13Aldrin 5.5 11 5.5 2.2 ug/kg dw 2/Anthracene 1.5 0.37 0.8 0.05 mg/Kg 0.22/0.25Benz(a)anthracene 0.19 mg/Kg 0.32/0.39Benz(a)anthracene-d12(Surrogate) 2.1 0.305 0.65 mg/KgBenzo(a)pyrene 2.6 0.44 0.95 0.3 mg/Kg 0.37/0.78Benzo(b)fluoranthene 3.4 0.5 1.1 0.4 mg/KgBenzo(e)pyrene 0.26 mg/KgBenzo(g,h,i)perylene 0.32 mg/KgBenzo(g,h,I)perylene-d12(Surrogate) 1.9 0.27 0.6 mg/KgBenzo(k)fluoranthene 1.2 0.5 1.1 0.19 mg/Kg 0.24/Biphenyl 0.05 mg/KgChlordane 130 95 50 19 ug/kg dw 7/8.9Chlordane, cis- 6.5 12 6.5 2.45 ug/kg dwChlordane, gamma- 4.9 9.5 4.9 1.9 ug/kg dwChrysene 3 0.37 0.8 0.25 mg/Kg 340/826Dacthal 4.7 ug/kg dwDDD(o,p') 4.7 ug/kg dwDDD(p,p') 2.35 4.5 2.35 0.9 ug/kg dw 8/8.5DDE(o,p') 4.7 ug/kg dwDDE(p,p') 3.75 7 3.75 1.45 ug/kg dw 5/6.75DDT(o,p') 4.7 ug/kg dwDDT(p,p') 2.7 5 2.7 1.05 ug/kg dw 8/4.8Decachlorobiphenyl(Surrogate) 198.5 151.5 221 72.95 ug/kg dwDibenz(a,h)anthracene 0.55 0.5 1.1 0.05 mg/Kg 0.06/0.14Dieldrin 3.65 7 3.65 1.4 ug/kg dw 2/6.7Dimethylnaphthalene, 2,6- 50 ug/kg dwEndosulfan I 2.8 5.5 2.8 1.05 ug/kg dwEndosulfan II 1.55 3 1.55 0.6 ug/kg dwEndosulfan sulfate 2.7 5 2.7 1.05 ug/kg dwEndrin 6.5 12.5 6.5 2.5 ug/kg dw 3/62.4

34
Analyte CO1 CO2 CO3 CO4 Units LEL/PELa
Endrin Aldehyde 3.4 6.5 3.4 1.3 ug/kg dwEndrin Ketone 0.85 ug/kg dwFluoranthene 7 0.475 1.05 0.38 mg/KgFluorene 1.3 0.135 0.295 0.05 mg/Kg 0.75/2.4Fluorobiphenyl, 2-(Surrogate) 1.3 0.586 1.82 0.206 mg/KgHCH, alpha 7 13.5 7 2.75 ug/kg dwHCH, beta 3.85 7.5 3.85 1.5 ug/kg dwHCH, delta 2.8 5.5 2.8 1.05 ug/kg dwHCH, gamma 6.5 12.5 6.5 2.45 ug/kg dwHeptachlor 6.5 12.5 6.5 2.55 ug/kg dwHeptachlor epoxide 4.45 8.5 4.45 1.7 ug/kg dwIndeno(1,2,3-c,d)pyrene 1.9 0.75 1.65 0.29 mg/Kg 0.2/Kepone 41.5 ug/Kg dwMethoxychlor 2.7 5 2.7 1.05 ug/kg dwMethylnaphthalene, 1- 50 ug/Kg dwMethylnaphthalene, 2- 50 ug/Kg dwMethylphenanthrene, 1- 50 ug/Kg dwMirex 1.45 ug/Kg dw 7/Naphthalene 0.36 0.34 0.75 0.05 mg/Kg /0.39Nitrobenzene-d5(Surrogate) 1.23 0.541 1.68 0.2 mg/KgNonachlor, cis- 4.7 ug/kg dwNonachlor, trans- 4.7 ug/kg dwOxychlordane 4.7 ug/kg dwPCB AROCLOR 1016 405 80 85 32 ug/kgPCB AROCLOR 1221 700 140 145 55 ug/kgPCB AROCLOR 1232 500 95 100 39.5 ug/kgPCB AROCLOR 1242 550 110 115 45 ug/kgPCB AROCLOR 1248 900 175 185 70 ug/kgPCB AROCLOR 1254 600 120 125 49 ug/kgPCB AROCLOR 1260 100 70 44 8 ug/kg 60/340Perylene 50 ug/kg dwPhenanthrene 8.1 0.55 1.2 0.15 mg/Kg 0.56/0.52Pyrene 5 0.34 0.75 0.31 mg/Kg 0.49/0.88Terphenyl-d14(Surrogate) 1.35 0.721 2.07 0.169 mg/KgTetrachloro-m-xylene(Surrogate) 139 179.5 243.5 59.35 ug/kg dwToxaphene 42 80 42 16 ug/kg dw
a: Lowest Effect Level (LEL) and Probable Effect Level (PEL) values recommended as screening levels for freshwater sediments (NOAAScreening Quick Reference Tables) http://response.restoration.noaa.gov/sites/default/files/SQuiRTs.pdf*Values below the minimum detection limit (MDL) were estimated as half the detection limit and shown in italics. Thegreatest detected value for each analyte is shown in bold type.

35
The effect levels of organic compounds for sediments in freshwater systems is a scale upon which to judge theseverity of the observed organic compound concentrations. Of the 68 compound tested, eight were detected atlevels that exceed the screening LEL or PEL (or both). These included Benzo(a)pyrene, Benzo(k)fluoranthene,Chlordane, Fluorene, Indeno(1,2,3-c,d)pyrene, PCB AROCLOR 1260, Phenanthrene, and Pyrene. Several othercompounds were not detected above the LEL or PEL or the freshwater effect levels were not readily available.

36
4 Summary
Results of the monitoring efforts for catch basin cleaning in four areas with different land use patterns, catch basinconfigurations, and cleaning methods show variations in amounts of materials and concentrations of analytescollected in each area and over time. The observations suggest overarching patterns and provide baselineinformation for ongoing monitoring and analysis. Because the samples were not sufficiently replicated, it is notpossible to attribute statistical significance to any of the observed differences among treatments (area, timing,frequency, method, or catch basin configuration).
4.1 Pollutants
The general patterns observed may be summarized as follows:
Material quantitiesThe greatest quantities of materials were removed during the first clean-out (CO1).The vactor method in the Scripps Poway Parkway area yielded the most material, but the catch basinconfigurations or sediment sources may be more influential than the method in determining the amountsof materials cleanedOrganic materials (leaves, twigs) were most prevalent in the Tecolote area.Trash was most prevalent Downtown.Medium-sized sand was the most common sediment particle size in all areas.With successive clean-outs, larger gravels became less common.
General ChemistryPercent solids, pH, and total organic carbon patterns were unremarkable.
NutrientsNutrient concentrations were higher for total N and lower for total P in San Ysidro during most cleanoutperiods.The Downtown area never had the lowest nutrient concentrations.It appears that nutrients can accumulate quickly in the catch basins.
MetalsThe highest concentrations of copper, lead, and zinc were observed in the Downtown area, during the firstcleanout event.The lowest concentrations overall were consistently in the San Ysidro residential area.Except for one anomaly in the Tecolote area, metals appear to accumulate linearly over time.Cadmium was only tested in the Tecolote area, where it was only detected in the last clean-out event.
MicrobiologyMicrobiology patterns were variable, with some patterns possibly associated with clean-out event.The patterns may be dependent on unmeasured factors related to sources or incubation in the catch basin.
Organic PollutantsOrganic pollutants were of concern in the Downtown area and they were only analyzed in that area.
37
For certain compounds, the highest detected concentrations were in the first clean-out event.It appears that some organic pollutants accumulate over time in the catch basin sediments, while othersare more transient.
4.2 Location, Frequency and Timing of Clean-Outs
From these observations and ongoing monitoring, it may be possible to approach catch basin cleaning frequenciesand timing by (1) impairment (especially metals and nutrients), (2) likely buildup from erosiveness or pollutantsources in the drainage area, and (3) presence or availability of in-system storage (i.e. catch basin structures withsumps) before the point where the system discharges to the surface water network (i.e. the last catch basin in line,and preferably with a sump). While greater frequency of clean-out would result in greater removal of somepollutants, the costs associated with frequent clean-outs would need to be weighed against the benefits, so that themost practical schedule and method can be recommended for each area, pollutant, climatic period, and catch basinconfiguration. An assessment of appropriate schedules based on the limited information from this pilot studywould be conjecture, though it does provide the basis for continued evaluation especially as data collection isimproved.
In establishing the frequency and timing of clean-outs, it does appear that it would be especially valuable toidentify the storage capacity of each catch basin network prior to the discharge point to surface waters. Thestorage capacity of each catch basin network is based on the size of catch basin sumps, and the position of largersumps relative to the drainage network and discharge to receiving waters. Sites at the bottom of a network withouta sump or storage might be noted as opportunities for possible capital improvements to create some storage in thesystem, especially in watersheds where nutrient, organic and metal pollutants are of greatest concern. As anexample of how this information may be used with respect to timing and frequency, in a catch basin network witha sump and ample capacity at the end of the network, the final catch basin may be targeted for more frequentclean-outs, while the upstream inlets could receive periodic inspection and less frequent clean-outs.
4.3 Methods and Costs
As the City uses both its own crews and contracted services to accomplish its catch basin cleaning schedules, theexperience with the contracted manual and vactor cleaning crews in this study provides some findings withrespect to costs, equipment, and crew size required to accomplish the various clean-outs, and on the applicabilityof each cleaning approach in different settings.
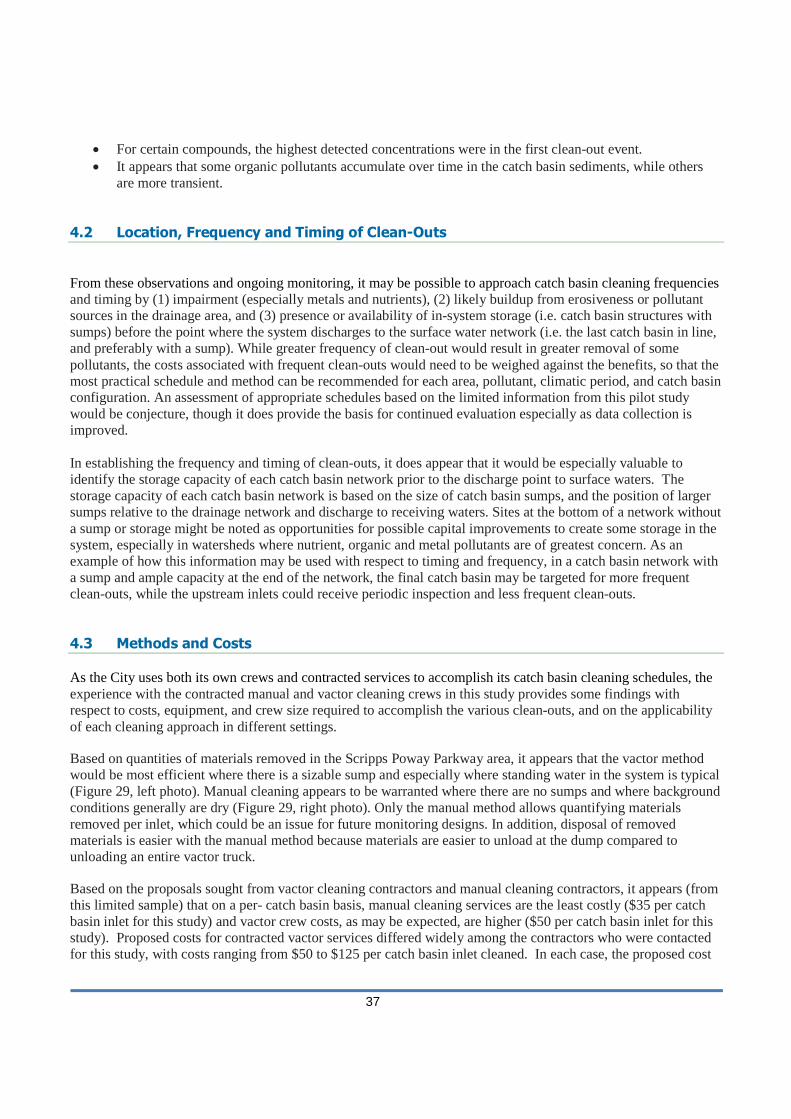
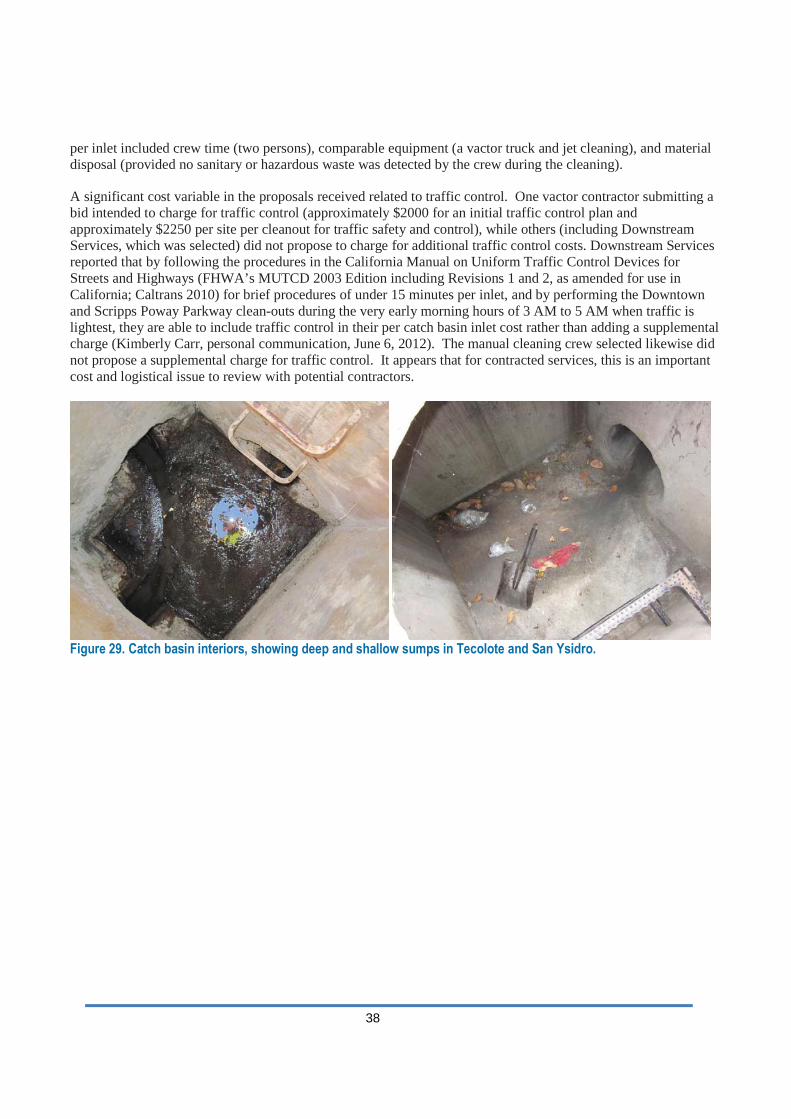
Based on quantities of materials removed in the Scripps Poway Parkway area, it appears that the vactor methodwould be most efficient where there is a sizable sump and especially where standing water in the system is typical(Figure 29, left photo). Manual cleaning appears to be warranted where there are no sumps and where backgroundconditions generally are dry (Figure 29, right photo). Only the manual method allows quantifying materialsremoved per inlet, which could be an issue for future monitoring designs. In addition, disposal of removedmaterials is easier with the manual method because materials are easier to unload at the dump compared tounloading an entire vactor truck.
Based on the proposals sought from vactor cleaning contractors and manual cleaning contractors, it appears (fromthis limited sample) that on a per- catch basin basis, manual cleaning services are the least costly ($35 per catchbasin inlet for this study) and vactor crew costs, as may be expected, are higher ($50 per catch basin inlet for thisstudy). Proposed costs for contracted vactor services differed widely among the contractors who were contactedfor this study, with costs ranging from $50 to $125 per catch basin inlet cleaned. In each case, the proposed cost
38
per inlet included crew time (two persons), comparable equipment (a vactor truck and jet cleaning), and materialdisposal (provided no sanitary or hazardous waste was detected by the crew during the cleaning).
A significant cost variable in the proposals received related to traffic control. One vactor contractor submitting abid intended to charge for traffic control (approximately $2000 for an initial traffic control plan andapproximately $2250 per site per cleanout for traffic safety and control), while others (including DownstreamServices, which was selected) did not propose to charge for additional traffic control costs. Downstream Servicesreported that by following the procedures in the California Manual on Uniform Traffic Control Devices forStreets and Highways (FHWA’s MUTCD 2003 Edition including Revisions 1 and 2, as amended for use inCalifornia; Caltrans 2010) for brief procedures of under 15 minutes per inlet, and by performing the Downtownand Scripps Poway Parkway clean-outs during the very early morning hours of 3 AM to 5 AM when traffic islightest, they are able to include traffic control in their per catch basin inlet cost rather than adding a supplementalcharge (Kimberly Carr, personal communication, June 6, 2012). The manual cleaning crew selected likewise didnot propose a supplemental charge for traffic control. It appears that for contracted services, this is an importantcost and logistical issue to review with potential contractors.
Figure 29. Catch basin interiors, showing deep and shallow sumps in Tecolote and San Ysidro.
39
5 References
Amec (Mactec). 2011. Quality Assurance Project Plan for the Catch Basin Inlet Cleaning Pilot Study. Preparedfor the City of San Diego.
Amec (Mactec). 2011. Final Monitoring Plan for the Catch Basin Inlet Cleaning Pilot Study. Prepared for theCity of San Diego.
Caltrans. 2010. California Manual on Uniform Traffic Control Devices for Streets and Highways (FHWA’sMUTCD 2003 Edition including Revisions 1 and 2, as amended for use in California).
Carr, Kimberly. Personal Communication with Juli Beth Hinds, Tetra Tech. Inc., regarding traffic control costsand procedures for cost estimating. June 6, 2012.
Tetra Tech, Inc. 2011. Catch Basin Inlet Cleaning Pilot Study: Work Plan. Prepared for the City of San Diego.
Catch Basin Inlet CleaningPilot StudyM it i PlMonitoring PlanNovember 2011
City of San Diego
Prepared by:AMEC E&I, Inc. Project No. 5013-11-0023
IMPORTANT NOTICE
This report was prepared exclusively for the City of San Diego by AMEC E&I, Inc. (AMEC). The quality of information, conclusions and estimates contained herein is consistent with the level of effort involved in AMEC’s services and based on: i) information available at the time of preparation, ii) data supplied by outside sources and iii) the assumptions, conditions and qualifications set forth in this report. This report is intended to be used by only, subject to the terms and conditions of its contract with AMEC. Any other use of, or reliance on, this report by any third party is at that party’s sole risk.
City of San DiegoCatch Basin Inlet Cleaning Pilot StudyMonitoring Plan
Project No.: 5013-11-0023 TOC iNovember 4, 2011
C O N T E N T S
1.0 PROJECT DESCRIPTION, ORGANIZATION, AND RESPONSIBILITIES ................... 1-1 1.1 PURPOSE ....................................................................................................... 1-1 1.2 DESCRIPTION OF CATCH BASIN INLET SYSTEMS ..................................... 1-2 1.3 MONITORING ACTIVITIES.............................................................................. 1-4 1.4 PROJECT ORGANIZATION AND RESPONSIBILITIES................................... 1-6
2.0 DESCRIPTION OF OPERATIONS YARD ................................................................... 2-1
3.0 ANALYSES.................................................................................................................. 3-1
4.0 DATA QUALITY OBJECTIVES.................................................................................... 4-1 4.1 COMPOSITE SAMPLES REPRESENTATIVENESS ....................................... 4-1 4.2 REPORTING LIMITS, ACCURACY, PRECISION, AND COMPLETENESS..... 4-1
5.0 PREPARATION AND LOGISTICS............................................................................... 5-1 5.1 MOBILIZATION AND STAFFING..................................................................... 5-1
5.1.1 Communication Channels..................................................................... 5-1 5.1.2 Equipment Mobilization......................................................................... 5-1
5.2 OPERATIONS YARD PREPARATION ............................................................ 5-2 5.2.1 General Inspection ............................................................................... 5-2 5.2.2 Iced Sample Bottles.............................................................................. 5-2 5.2.3 Documentation ..................................................................................... 5-3 5.2.4 Training ................................................................................................ 5-3
6.0 SAMPLING, LABORATORY PREPARATION, AND ANALYTICAL METHODS ........... 6-1 6.1 CATCH BASIN DEBRIS REMOVAL................................................................. 6-1 6.2 CATCH BASIN DEBRIS SAMPLING AND ANALYSIS..................................... 6-1 6.3 LABORATORY SELECTION............................................................................ 6-5 6.4 HOLDING TIMES, SAMPLE VOLUMES, AND PRESERVATION
REQUIREMENTS ............................................................................................ 6-5 6.5 SAMPLE LABELING ........................................................................................ 6-7 6.6 LABORATORY DATA PACKAGE DELIVERABLES......................................... 6-8
7.0 QUALITY ASSURANCE/QUALITY CONTROL............................................................ 7-1 7.1 FIELD QUALITY ASSURANCE/QUALITY CONTROL ..................................... 7-1 7.2 LABORATORY QUALITY ASSURANCE/QUALITY CONTROL ....................... 7-1 7.3 CORRECTIVE ACTION ................................................................................... 7-3
8.0 DATA MANAGEMENT AND REPORTING PROCEDURES ........................................ 8-1 8.1 DATA MANAGEMENT..................................................................................... 8-1 8.2 REPORTING PROCEDURES.......................................................................... 8-1
9.0 REFERENCES ............................................................................................................ 9-1
City of San DiegoCatch Basin Inlet Cleaning Pilot StudyMonitoring Plan
Project No.: 5013-11-0023 TOC iiNovember 4, 2011
T A B L E S
TABLE 3-1: ANALYTICAL PARAMETERS AND METHODS – CATCH BASIN DEBRIS......... 3-1
TABLE 4-1: DATA QUALITY OBJECTIVES ............................................................................ 4-2
TABLE 5-1: FIELD KIT EQUIPMENT AND MOBILIZATION LIST ........................................... 5-2
TABLE 6-1: SOIL MOISTURE INTERPRETATION CHART .................................................... 6-2
TABLE 6-2: HOLDING TIMES, SAMPLE VOLUMES, CONTAINERS, AND PRESERVATION RECOMMENDATIONS................................................................... 6-6
TABLE 6-3: EXAMPLE SAMPLE IDENTIFICATION NUMBERS............................................. 6-8
TABLE 7-1: FIELD QUALITY CONTROL SAMPLE FREQUENCY.......................................... 7-1
TABLE 7-2: LABORATORY QUALITY CONTROL SAMPLE FREQUENCY............................ 7-2
F I G U R E S
FIGURE 1-1: CATCH BASIN SYSTEMS LOCATION.............................................................. 1-3
FIGURE 1-2: ROSE CANYON OPERATIONS YARD LOCATION .......................................... 1-5
FIGURE 1-3: PROJECT TEAM ORGANIZATION ................................................................... 1-7
FIGURE 2-1: SCHEMATIC PLAN VIEW OF CONTAINMENT BERM SETUP AT OPERATIONS YARD .................................................................................................. 2-2
FIGURE 2-2: SCHEMATIC PROFILE VIEW OF CONTAINMENT BERM SETUP AT OPERATIONS YARD .................................................................................................. 2-3
FIGURE 2-3: EMPTY SNAP-UP BERM .................................................................................. 2-4
FIGURE 6-1: CONTAINMENT UNIT QUADRANTS AND SUB-SAMPLE LOCATIONS........... 6-4
A P P E N D I C E S
A Product Specification SheetsB Data Quality Objectives for EPA 8081A, 8270C-SIM, and 8082 C Health and Safety Plan (HASP)D Field Forms
City of San DiegoCatch Basin Inlet Cleaning Pilot StudyMonitoring Plan
Project No.: 5013-11-0023 1-1November 4, 2011
1.0 PROJECT DESCRIPTION, ORGANIZATION, AND RESPONSIBILITIES
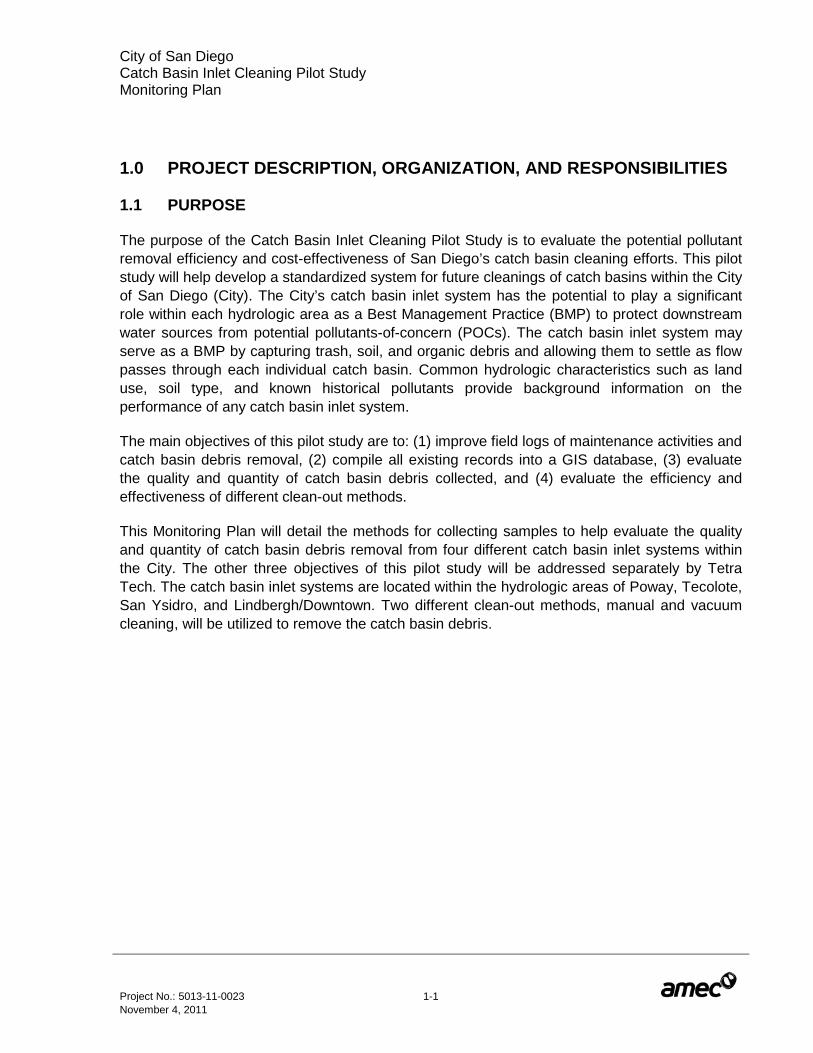
1.1 PURPOSE
The purpose of the Catch Basin Inlet Cleaning Pilot Study is to evaluate the potential pollutant removal efficiency and cost-effectiveness of San Diego’s catch basin cleaning efforts. This pilot study will help develop a standardized system for future cleanings of catch basins within the City of San Diego (City). The City’s catch basin inlet system has the potential to play a significant role within each hydrologic area as a Best Management Practice (BMP) to protect downstream water sources from potential pollutants-of-concern (POCs). The catch basin inlet system may serve as a BMP by capturing trash, soil, and organic debris and allowing them to settle as flow passes through each individual catch basin. Common hydrologic characteristics such as land use, soil type, and known historical pollutants provide background information on the performance of any catch basin inlet system.
The main objectives of this pilot study are to: (1) improve field logs of maintenance activities and catch basin debris removal, (2) compile all existing records into a GIS database, (3) evaluate the quality and quantity of catch basin debris collected, and (4) evaluate the efficiency and effectiveness of different clean-out methods.
This Monitoring Plan will detail the methods for collecting samples to help evaluate the quality and quantity of catch basin debris removal from four different catch basin inlet systems within the City. The other three objectives of this pilot study will be addressed separately by Tetra Tech. The catch basin inlet systems are located within the hydrologic areas of Poway, Tecolote, San Ysidro, and Lindbergh/Downtown. Two different clean-out methods, manual and vacuum cleaning, will be utilized to remove the catch basin debris.
City of San DiegoCatch Basin Inlet Cleaning Pilot StudyMonitoring Plan
Project No.: 5013-11-0023 1-2November 4, 2011
1.2 DESCRIPTION OF CATCH BASIN INLET SYSTEMS
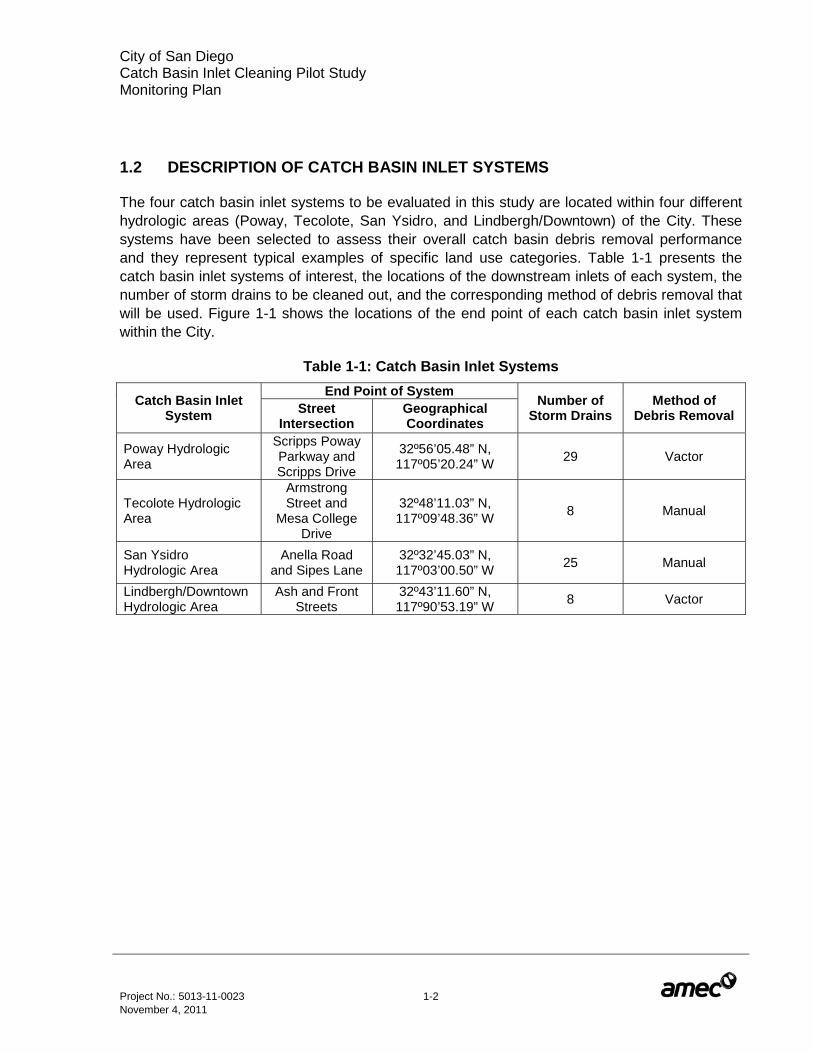
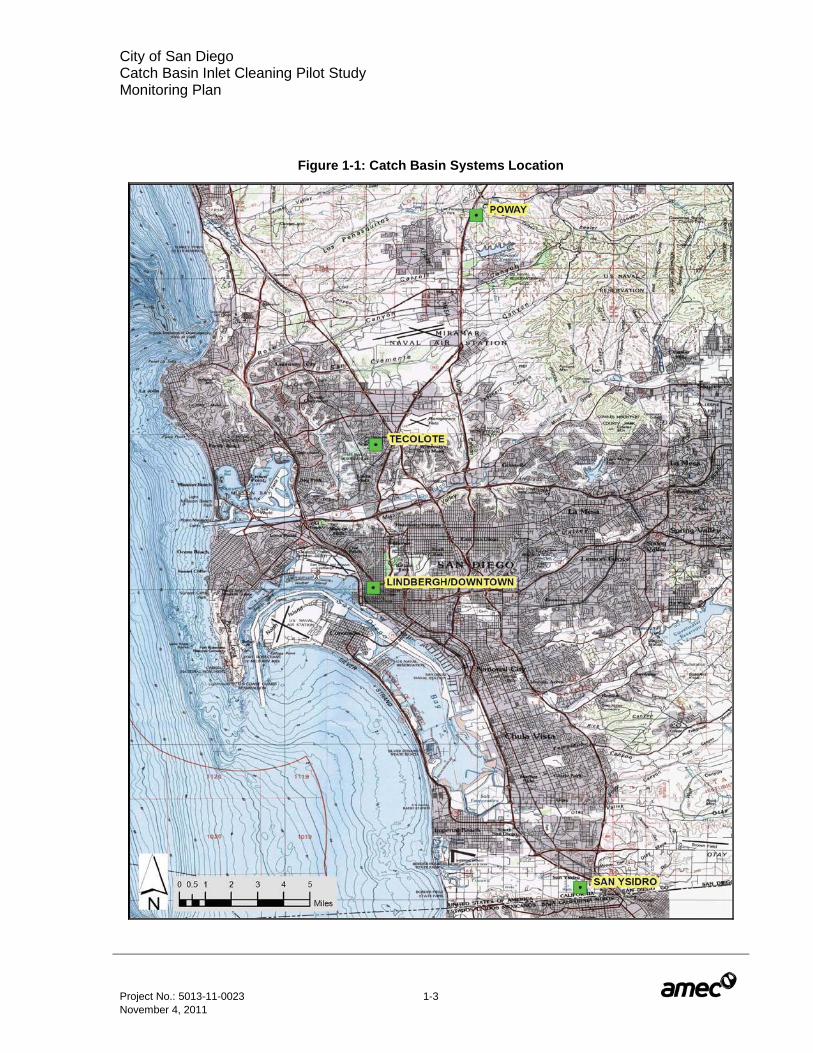
The four catch basin inlet systems to be evaluated in this study are located within four different hydrologic areas (Poway, Tecolote, San Ysidro, and Lindbergh/Downtown) of the City. These systems have been selected to assess their overall catch basin debris removal performanceand they represent typical examples of specific land use categories. Table 1-1 presents the catch basin inlet systems of interest, the locations of the downstream inlets of each system, the number of storm drains to be cleaned out, and the corresponding method of debris removal that will be used. Figure 1-1 shows the locations of the end point of each catch basin inlet system within the City.
Table 1-1: Catch Basin Inlet Systems
Catch Basin Inlet System
End Point of SystemNumber of
Storm DrainsMethod of
Debris RemovalStreet Intersection
Geographical Coordinates
Poway Hydrologic Area
Scripps Poway Parkway and Scripps Drive
32º56’05.48” N, 117º05’20.24” W 29 Vactor
Tecolote Hydrologic Area
Armstrong Street and
Mesa College Drive
32º48’11.03” N, 117º09’48.36” W 8 Manual
San Ysidro Hydrologic Area
Anella Road and Sipes Lane
32º32’45.03” N, 117º03’00.50” W 25 Manual
Lindbergh/Downtown Hydrologic Area
Ash and Front Streets
32º43’11.60” N, 117º90’53.19” W 8 Vactor
City of San DiegoCatch Basin Inlet Cleaning Pilot StudyMonitoring Plan
Project No.: 5013-11-0023 1-3November 4, 2011
Figure 1-1: Catch Basin Systems Location
City of San DiegoCatch Basin Inlet Cleaning Pilot StudyMonitoring Plan
Project No.: 5013-11-0023 1-4November 4, 2011
1.3 MONITORING ACTIVITIES
Monitoring activities will occur during the 2011-2012 wet season, starting on October 1, 2011,and will continue through May 2012. This monitoring program will be comprised of catch basin debris removal and characterization. Catch basin debris removal will occur at the four different hydrologic areas (Table 1-1) after two significant storm events during the wet season and one event late in the wet season to allow for greater buildup of material. Each catch basin inletsystem will have one method of debris removal. The debris removal methods are: (1) manual and (2) vacuum cleaning with a vactor truck. The manual debris removal method will be performed by Ron’s Maintenance, while the vactor debris removal method will be performed by Downstream Services, Inc. (Downstream).
Catch basin debris will be transported to and deposited at the Rose Canyon Operations Yard(Rose Canyon). AMEC staff will be available to observe that the catch basin debris is properly placed into the primary containment unit on site, where the debris will be allowed to dry prior to sampling. Catch basin debris will be taken to Rose Canyon, located at 3775 Morena Blvd, San Diego, CA 92117. Figure 1-2 shows a general vicinity map of Rose Canyon.
Once the catch basin debris has dried, a full characterization of the debris will be performed. The characterization will consist of: (1) volume and weight determination, along with visual observation of the debris content; and (2) collection of sub-samples to generate a composite sample. The characterization of the catch basin debris will be documented through field forms and pictures. A composite sample will be collected and sent to a laboratory for analytical analysis. Analytical results will provide a better understanding of the potential POCs within each hydrologic area.

City of San DiegoCatch Basin Inlet Cleaning Pilot StudyMonitoring Plan
Project No.: 5013-11-0023 1-5November 4, 2011
Figure 1-2: Rose Canyon Operations Yard Location
City of San DiegoCatch Basin Inlet Cleaning Pilot StudyMonitoring Plan
Project No.: 5013-11-0023 1-6November 4, 2011
1.4 PROJECT ORGANIZATION AND RESPONSIBILITIES
The City of San Diego is the municipal government overseeing this study. Stephanie Bracci, anAssociate Planner from the Storm Water Division, will have the responsibility for program oversight.
The Tetra Tech Project Team will be comprised of personnel from Tetra Tech and AMEC E&I,Inc. (AMEC). The Tetra Tech Project Team organization is summarized on Figure 1-3. Tetra Tech will be responsible for the oversight of the project and the reporting of results. Julie Beth Hinds is the Project Manager and will be responsible for managing the contract. Jason Wright is the Water Resources Engineer and will be the technical lead. AMEC will be responsible for the development and implementation of the monitoring program.
AMEC will coordinate sample collection, laboratory analysis, data management, data analysis, and reporting. Kristina Schneider is the AMEC Project Manager and will be responsible for project coordination, scheduling, budget management, and oversight of project plans and deliverables. Anna Wernet is the AMEC Sampling Manager and will be responsible for developing the monitoring approach, preparing and implementing the monitoring activities,coordination with the laboratories, and for developing and maintaining project data. John Brandt is the AMEC Quality Assurance Officer and will be responsible for the project quality assurance and quality control procedures implemented during sampling, laboratory analysis, data management, and data analysis. Jesse Davis is the AMEC Health and Safety Officer and will beresponsible for overseeing the Health and Safety Plan and its practices.
Weck Laboratories, located in the City of Industry, California, will be responsible for the analysis of sediment samples. Leo Raab is the Weck Laboratories Manager. He will ensure that samples are analyzed in accordance with the methods and quality assurance requirements outlined in this Monitoring Plan.
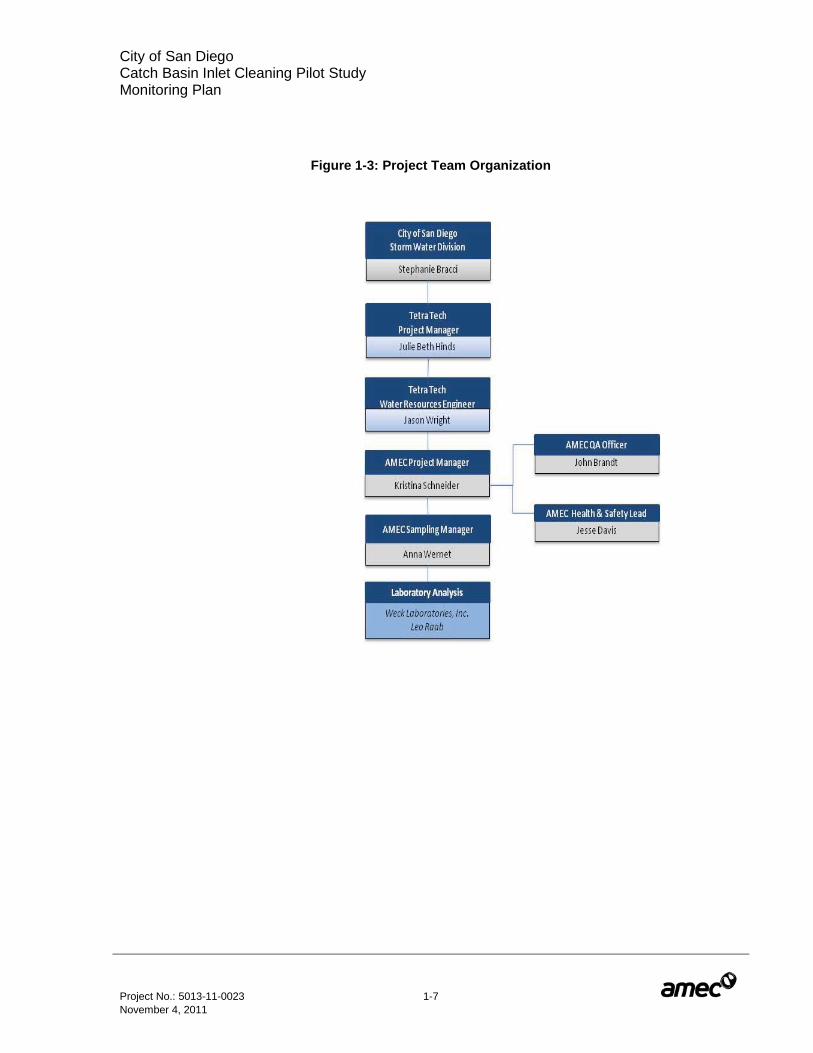
City of San DiegoCatch Basin Inlet Cleaning Pilot StudyMonitoring Plan
Project No.: 5013-11-0023 1-7November 4, 2011
Figure 1-3: Project Team Organization
City of San DiegoCatch Basin Inlet Cleaning Pilot StudyMonitoring Plan
Project No.: 5013-11-0023 2-1November 4, 2011
2.0 DESCRIPTION OF OPERATIONS YARD
Material collected from each catch basin inlet system, via manual or vactor method, will be transported to and deposited at the Rose Canyon Operations Yard located at 3775 Morena Boulevard, San Diego, CA 92117. This Operations Yard was selected as the sample storage site since security gates will be closed during non-operational hours. All containment berms will be placed in an area that will not interfere with other daily activities performed on site.
Each containment berm system will include a primary and secondary containment unit. These units will utilize the following materials: containment berm, ground mats, underlying geotextile, straw wattle perimeter, caution tape, cones, and signs. A schematic plan and profile view of the containment berm system is shown in Figures 2-1 and 2-2. Prior to deploying the containment berms, selected installation areas will be manually swept to remove any rocks or debris that could potentially cause a tear or puncture the containment material.
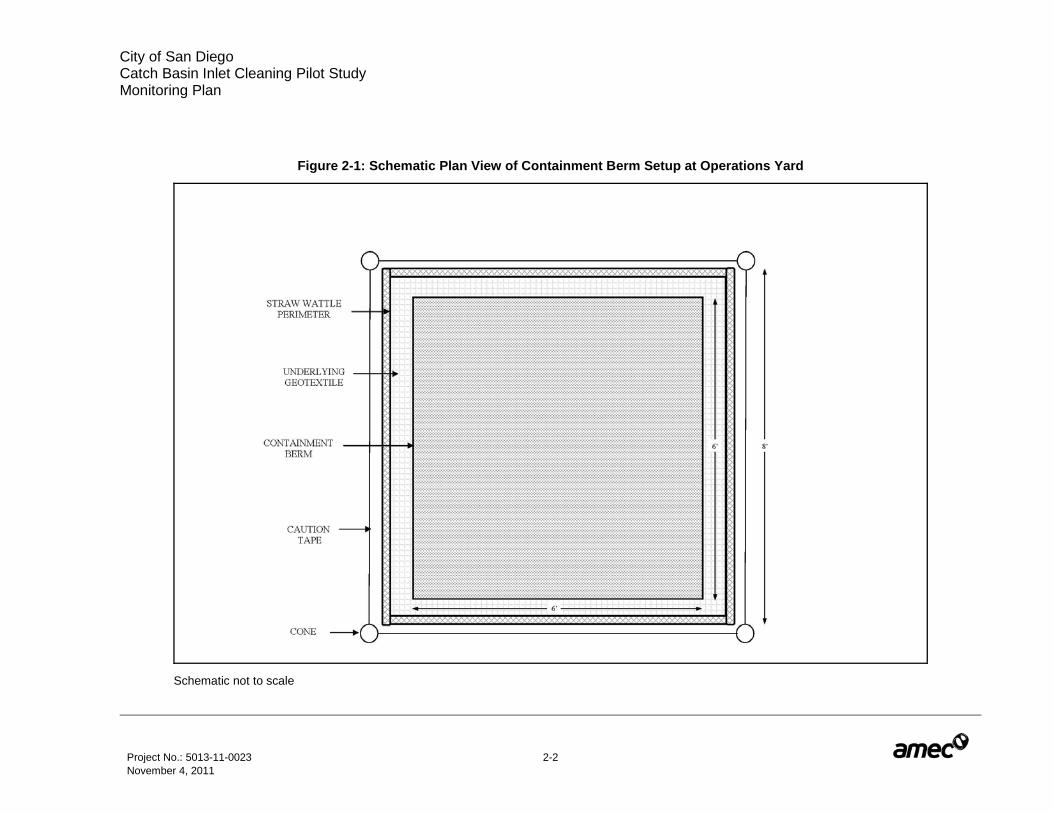
City of San DiegoCatch Basin Inlet Cleaning Pilot StudyMonitoring Plan
Project No.: 5013-11-0023 2-2November 4, 2011
Figure 2-1: Schematic Plan View of Containment Berm Setup at Operations Yard
Schematic not to scale
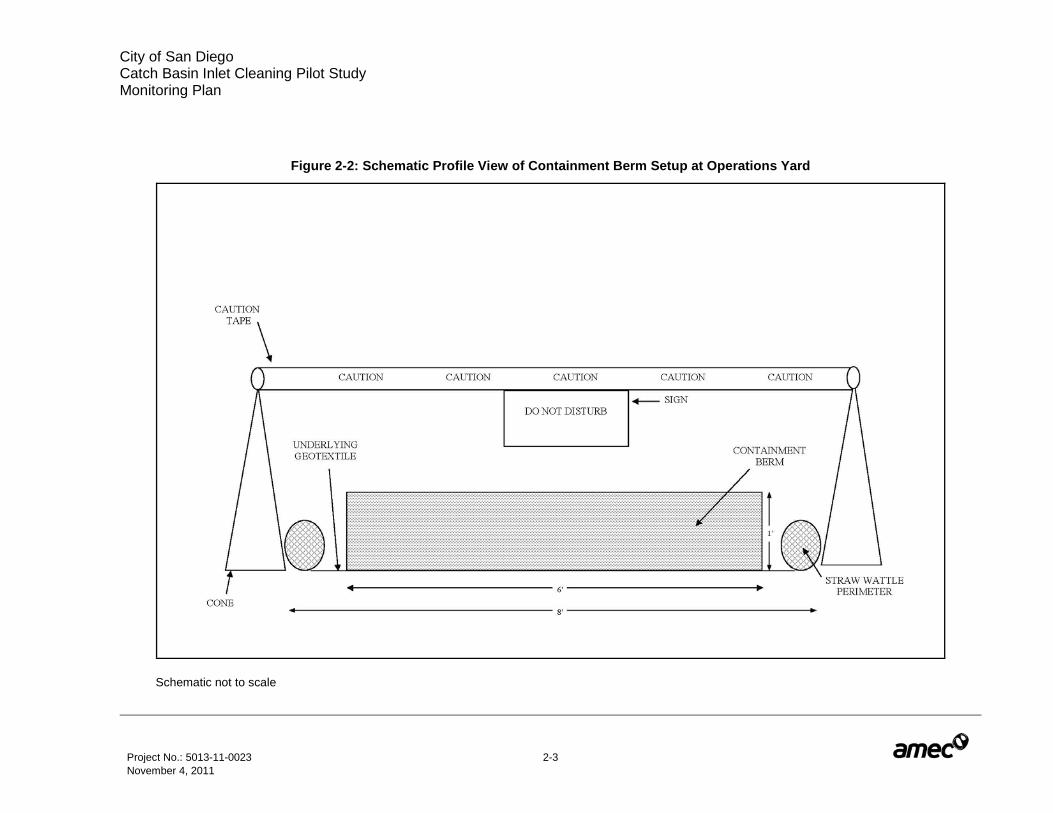
City of San DiegoCatch Basin Inlet Cleaning Pilot StudyMonitoring Plan
Project No.: 5013-11-0023 2-3November 4, 2011
Figure 2-2: Schematic Profile View of Containment Berm Setup at Operations Yard
Schematic not to scale
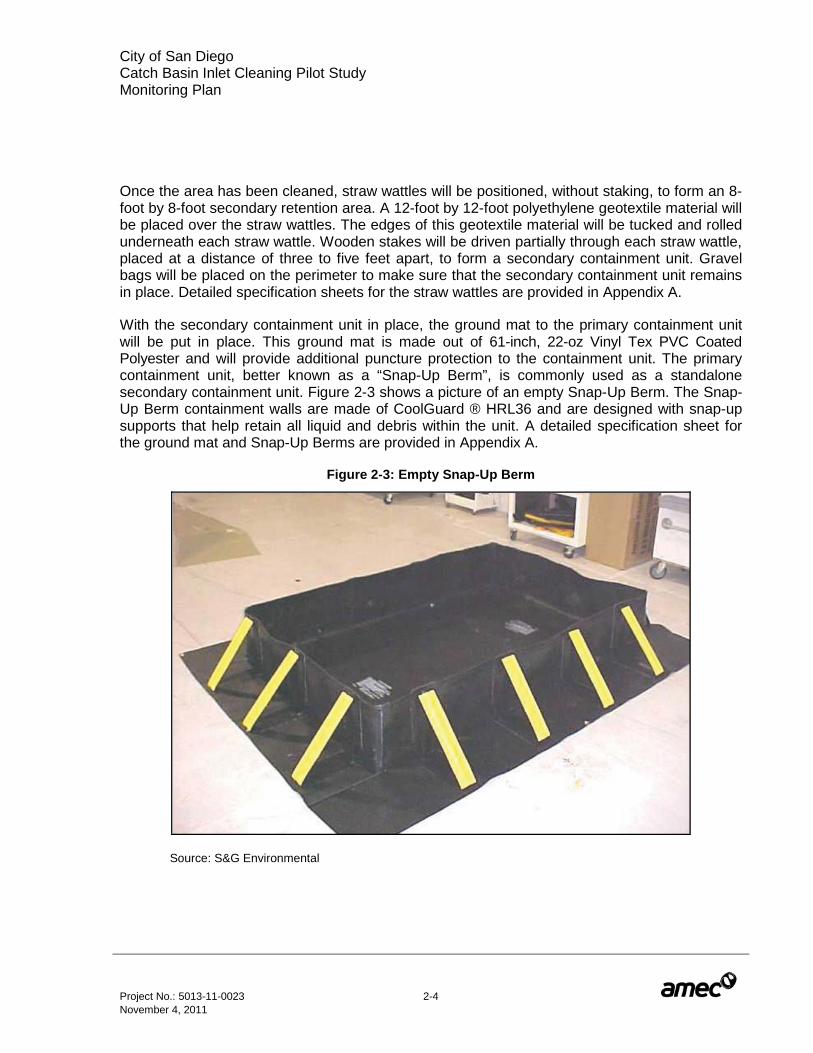
City of San DiegoCatch Basin Inlet Cleaning Pilot StudyMonitoring Plan
Project No.: 5013-11-0023 2-4November 4, 2011
Once the area has been cleaned, straw wattles will be positioned, without staking, to form an 8-foot by 8-foot secondary retention area. A 12-foot by 12-foot polyethylene geotextile material will be placed over the straw wattles. The edges of this geotextile material will be tucked and rolled underneath each straw wattle. Wooden stakes will be driven partially through each straw wattle, placed at a distance of three to five feet apart, to form a secondary containment unit. Gravel bags will be placed on the perimeter to make sure that the secondary containment unit remains in place. Detailed specification sheets for the straw wattles are provided in Appendix A.
With the secondary containment unit in place, the ground mat to the primary containment unit will be put in place. This ground mat is made out of 61-inch, 22-oz Vinyl Tex PVC Coated Polyester and will provide additional puncture protection to the containment unit. The primary containment unit, better known as a “Snap-Up Berm”, is commonly used as a standalone secondary containment unit. Figure 2-3 shows a picture of an empty Snap-Up Berm. The Snap-Up Berm containment walls are made of CoolGuard ® HRL36 and are designed with snap-up supports that help retain all liquid and debris within the unit. A detailed specification sheet for the ground mat and Snap-Up Berms are provided in Appendix A.
Figure 2-3: Empty Snap-Up Berm
Source: S&G Environmental
City of San DiegoCatch Basin Inlet Cleaning Pilot StudyMonitoring Plan
Project No.: 5013-11-0023 2-5November 4, 2011
In addition, four cones, caution tape, and signs will be placed around the perimeter of the containment berms to limit disturbance. Signs will provide contact information if there are questions regarding the project. All catch basin debris will be stored within the primary containment unit and will be covered at the end of each business day to avoid the release of any catch basin debris.
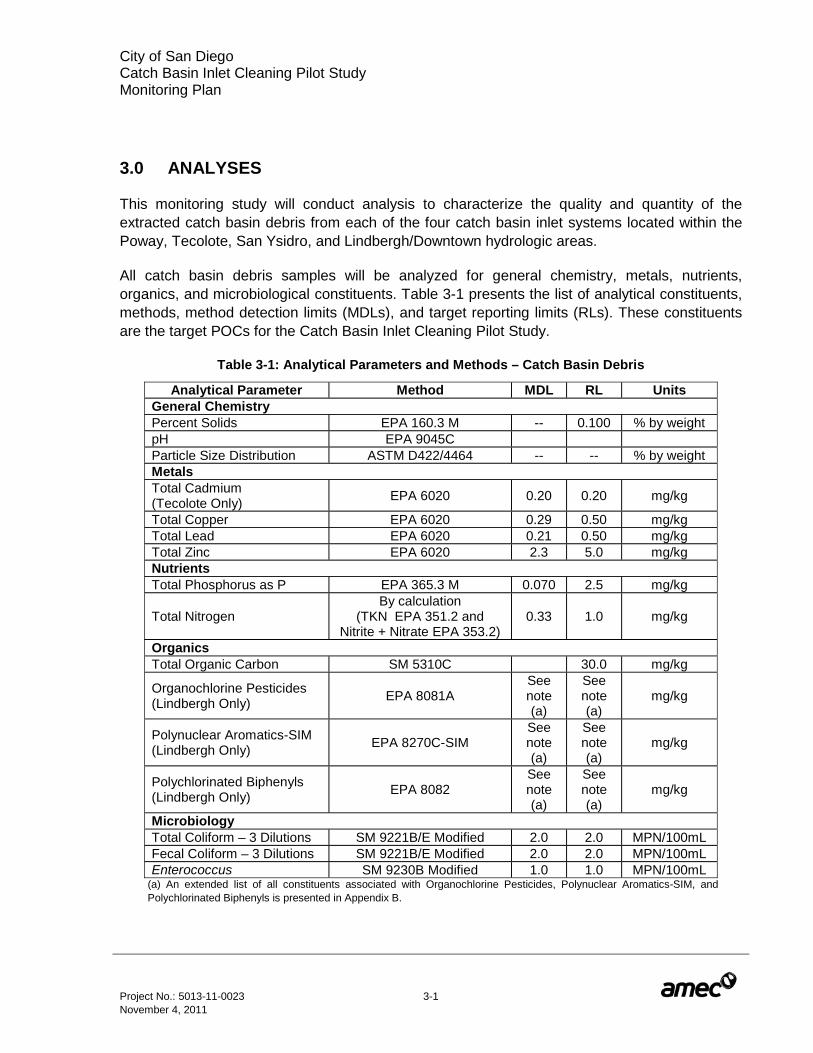
City of San DiegoCatch Basin Inlet Cleaning Pilot StudyMonitoring Plan
Project No.: 5013-11-0023 3-1November 4, 2011
3.0 ANALYSES
This monitoring study will conduct analysis to characterize the quality and quantity of the extracted catch basin debris from each of the four catch basin inlet systems located within the Poway, Tecolote, San Ysidro, and Lindbergh/Downtown hydrologic areas.
All catch basin debris samples will be analyzed for general chemistry, metals, nutrients, organics, and microbiological constituents. Table 3-1 presents the list of analytical constituents, methods, method detection limits (MDLs), and target reporting limits (RLs). These constituents are the target POCs for the Catch Basin Inlet Cleaning Pilot Study.
Table 3-1: Analytical Parameters and Methods – Catch Basin Debris
Analytical Parameter Method MDL RL UnitsGeneral ChemistryPercent Solids EPA 160.3 M -- 0.100 % by weightpH EPA 9045CParticle Size Distribution ASTM D422/4464 -- -- % by weightMetalsTotal Cadmium(Tecolote Only) EPA 6020 0.20 0.20 mg/kg
Total Copper EPA 6020 0.29 0.50 mg/kgTotal Lead EPA 6020 0.21 0.50 mg/kgTotal Zinc EPA 6020 2.3 5.0 mg/kgNutrientsTotal Phosphorus as P EPA 365.3 M 0.070 2.5 mg/kg
Total NitrogenBy calculation
(TKN EPA 351.2 andNitrite + Nitrate EPA 353.2)
0.33 1.0 mg/kg
OrganicsTotal Organic Carbon SM 5310C 30.0 mg/kg
Organochlorine Pesticides(Lindbergh Only) EPA 8081A
See note (a)
See note (a)
mg/kg
Polynuclear Aromatics-SIM(Lindbergh Only) EPA 8270C-SIM
See note (a)
See note (a)
mg/kg
Polychlorinated Biphenyls (Lindbergh Only) EPA 8082
See note (a)
See note (a)
mg/kg
MicrobiologyTotal Coliform – 3 Dilutions SM 9221B/E Modified 2.0 2.0 MPN/100mLFecal Coliform – 3 Dilutions SM 9221B/E Modified 2.0 2.0 MPN/100mLEnterococcus SM 9230B Modified 1.0 1.0 MPN/100mL
(a) An extended list of all constituents associated with Organochlorine Pesticides, Polynuclear Aromatics-SIM, and Polychlorinated Biphenyls is presented in Appendix B.
City of San DiegoCatch Basin Inlet Cleaning Pilot StudyMonitoring Plan
Project No.: 5013-11-0023 4-1November 4, 2011
4.0 DATA QUALITY OBJECTIVES
Data quality objectives (DQOs) are quantitative and qualitative statements that define project objectives and specify the acceptable ranges of laboratory performance. Numerical DQOs for the constituents being analyzed are listed in Table 4-1.
4.1 COMPOSITE SAMPLES REPRESENTATIVENESS
A catch basin debris composite sample will consist of a mixture of sub-samples collected from the study area of interest. The representativeness of any catch basin debris composite sample is dependent upon many factors, but is most heavily dependent upon: (1) the equivalent volume collected from each sub-sample, and (2) homogenized samples that effectively represent collected sub-samples.
4.2 REPORTING LIMITS, ACCURACY, PRECISION, AND COMPLETENESS
Analytical method numerical DQOs for constituent reporting limits, accuracy, precision, and completeness are summarized in Table 4-1.

City of San DiegoCatch Basin Inlet Cleaning Pilot StudyMonitoring Plan
Project No.: 5013-11-0023 4-2November 4, 2011
Table 4-1: Data Quality Objectives
Analytical Parameter RL Units Accuracy (Recovery) Precision (% RPD) Completeness Hold Time
General ChemistryPercent Solids 0.100 % by weight -- 20 90% 7 dayspH 0.01 pH units -- -- 90%Particle Size Distribution -- % by weight -- -- 90% 180 daysMetalsTotal Cadmium(Tecolote Only) 0.20 mg/kg 87-115 20 90% 180 days
Total Copper 0.50 mg/kg 62-135 20 90% 180 daysTotal Lead 0.50 mg/kg 85-114 20 90% 180 daysTotal Zinc 5.0 mg/kg -- -- 90% 180 daysNutrientsTotal Phosphorus as P 2.5 mg/kg 70-130 20 90% 28 daysTotal Nitrogen 1.0 mg/kg 90-110 20 90% 28 daysOrganicsTotal Organic Carbon 30.0 mg/kg -- -- 90% 28 daysOrganochlorine Pesticides(Lindbergh Only)* 2.5 mg/kg See note (a) See note (a) 90% 14 days
Polynuclear Aromatics-SIM(Lindbergh Only)* 0.025 mg/kg See note (a) See note (a) 90% 14 days
Polychlorinated Biphenyls (Lindbergh Only)* 50 mg/kg See note (a) See note (a) 90% 14 days
MicrobiologyTotal Coliform – 3 Dilutions 2.0 MPN/100Ml -- -- 90% 8 hoursFecal Coliform – 3 Dilutions 2.0 MPN/100Ml -- -- 90% 8 hoursEnterococcus 1.0 MPN/100Ml -- -- 90% 8 hours(a) An extended list of all constituents associated with Organochlorine Pesticides, Polynuclear Aromatics-SIM, and Polychlorinated Biphenyls is presented in Appendix B.
City of San DiegoCatch Basin Inlet Cleaning Pilot StudyMonitoring Plan
Project No.: 5013-11-0023 5-1November 4, 2011
5.0 PREPARATION AND LOGISTICS
5.1 MOBILIZATION AND STAFFING
Monitoring for catch basin inlet systems requires planning prior to actual sampling. Each catch basin inlet system sampling event will require extensive coordination between the City of San Diego Storm Water Division, maintenance crews (Downstream and Ron’s Maintenance), Tetra Tech, and AMEC.
Catch basin inlet system sampling events will not be scheduled during or near certain holidays if either the mobilization or the laboratory analysis is projected to continue through that holiday. This includes the following holidays and dates:
Thanksgiving: November 24 and 25, 2011Christmas: December 24 and 25, 2011New Year’s: December 31, 2011, and January 1, 2012
Couriers may be needed to deliver bacteria samples to the analytical laboratory in order to meet the short holding times for those analyses.
5.1.1 Communication Channels
The City of San Diego Storm Water Division will coordinate first with Tetra Tech and AMEC to determine a schedule to clean out each catch basin inlet system. Once dates have been scheduled, the City of San Diego will direct maintenance crews to perform clean outs at thelocations of catch basin systems provided by Tetra Tech. Tetra Tech personnel will accompany maintenance crews for the initial catch basin debris clean out activities. AMEC personnel will be present at the Rose Canyon Operations Yard to receive all catch basin debris collected.
Communication channels will be established between Tetra Tech, AMEC, the City of San Diego, maintenance crews, and Weck Laboratories for appropriate communication before and during each event. To aid in communication, the project field notebook will include a phone list with work numbers of the maintenance crews, the City of San Diego, AMEC personnel, and Weck Laboratories.
5.1.2 Equipment Mobilization
Equipment needed for catch basin debris sampling includes: sampling equipment and containers, personal protective equipment (PPE), field kits, and vehicles equipped with mobile communication and safety equipment (See Table 5-1). The necessary equipment should beinspected and loaded into an appropriate vehicle a day prior to the sampling event. During the
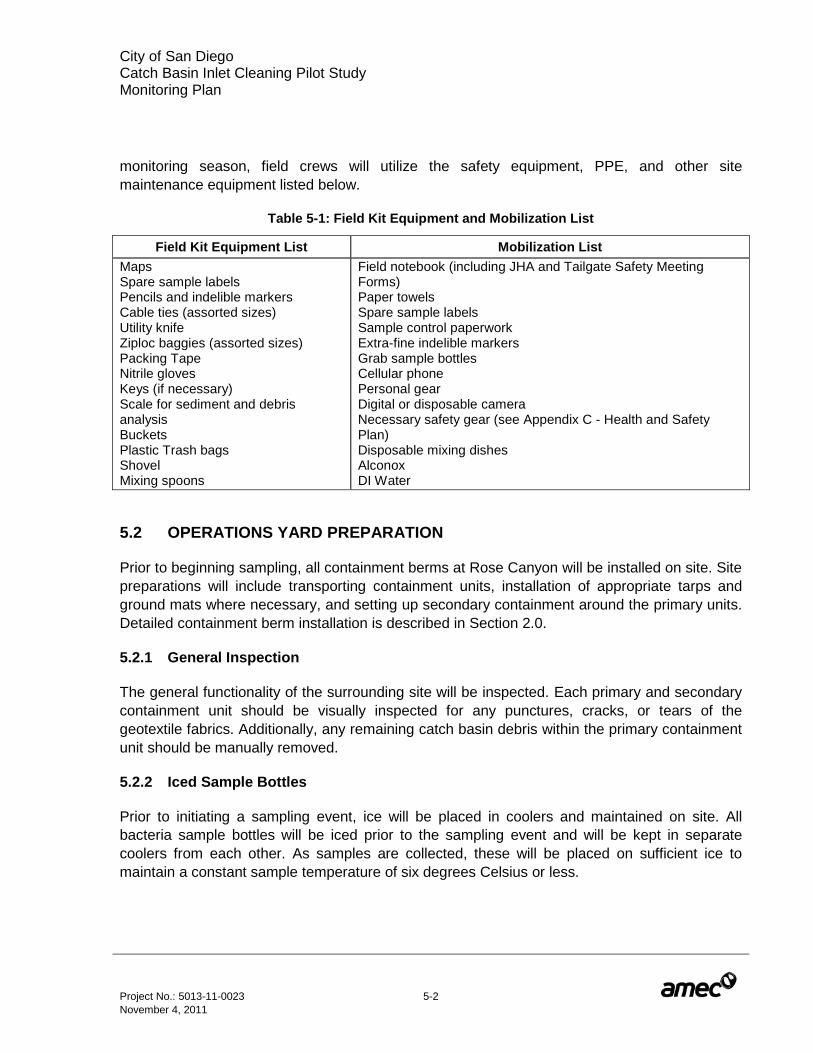
City of San DiegoCatch Basin Inlet Cleaning Pilot StudyMonitoring Plan
Project No.: 5013-11-0023 5-2November 4, 2011
monitoring season, field crews will utilize the safety equipment, PPE, and other site maintenance equipment listed below.
Table 5-1: Field Kit Equipment and Mobilization List
Field Kit Equipment List Mobilization ListMaps Spare sample labelsPencils and indelible markersCable ties (assorted sizes)Utility knifeZiploc baggies (assorted sizes)Packing TapeNitrile glovesKeys (if necessary)Scale for sediment and debris analysisBucketsPlastic Trash bagsShovelMixing spoons
Field notebook (including JHA and Tailgate Safety Meeting Forms)Paper towelsSpare sample labelsSample control paperworkExtra-fine indelible markersGrab sample bottlesCellular phonePersonal gearDigital or disposable cameraNecessary safety gear (see Appendix C - Health and Safety Plan)Disposable mixing dishesAlconoxDI Water
5.2 OPERATIONS YARD PREPARATION
Prior to beginning sampling, all containment berms at Rose Canyon will be installed on site. Site preparations will include transporting containment units, installation of appropriate tarps and ground mats where necessary, and setting up secondary containment around the primary units.Detailed containment berm installation is described in Section 2.0.
5.2.1 General Inspection
The general functionality of the surrounding site will be inspected. Each primary and secondary containment unit should be visually inspected for any punctures, cracks, or tears of the geotextile fabrics. Additionally, any remaining catch basin debris within the primary containment unit should be manually removed.
5.2.2 Iced Sample Bottles
Prior to initiating a sampling event, ice will be placed in coolers and maintained on site. All bacteria sample bottles will be iced prior to the sampling event and will be kept in separate coolers from each other. As samples are collected, these will be placed on sufficient ice to maintain a constant sample temperature of six degrees Celsius or less.
City of San DiegoCatch Basin Inlet Cleaning Pilot StudyMonitoring Plan
Project No.: 5013-11-0023 5-3November 4, 2011
5.2.3 Documentation
Each time a catch basin inlet system is visited a record of the visit will be made. The field data log sheets in Appendix D are a guide for the exact data that needs to be recorded during every field visit.
The following general information should be entered during each catch basin inlet system visit:
Alphanumeric Site IDDateTimeMonitoring Program
Field TeamField MeasurementsWeather ConditionsEquipment ConditionMiscellaneous Comments
5.2.4 Training
Field personnel will be properly trained in the use of the monitoring equipment and clean sample handling techniques, along with all appropriate health and safety protocols (Appendix C). Specifically, the following elements will be included in the training of all field personnel:
Review of Health and Safety PlanField equipment training
Each field team member will review the Health and Safety Plan and consult with the Sampling Manager if they have any questions before mobilization. The Sampling Manager will train field personnel in sampling protocols and procedures in accordance with the Monitoring Plan.
City of San DiegoCatch Basin Inlet Cleaning Pilot StudyMonitoring Plan
Project No.: 5013-11-0023 6-1November 4, 2011
6.0 SAMPLING, LABORATORY PREPARATION, AND ANALYTICAL METHODS
6.1 CATCH BASIN DEBRIS REMOVAL
Catch basin debris will be removed by either Ron’s Maintenance or Downstream crews. Tetra Tech will provide maps and catch basin identifiers to the crews to direct removal teams to the appropriate locations. It is expected that Tetra Tech personnel will accompany removal teams during the first clean out event before the beginning of the wet season.
Ron’s Maintenance removal teams will use a manual method to remove catch basin debris. The manual cleaning method is performed by bailing the water from the catch basin and using a shovel or other hand tool to remove the accumulated solids. Downstream removal teams will utilize a vactor truck to remove the catch basin debris. Vacuum cleaning uses an air blower to generate negative pressures that draw the waste material in. The air is allowed to release to the atmosphere while the waste solids and storm water are captured. Large debris will typically pass through a vacuum cleaning unit. (Lager et al. 1977)
The collected catch basin debris will then be transported to the Rose Canyon Operations Yardfor sample processing.
6.2 CATCH BASIN DEBRIS SAMPLING AND ANALYSIS
AMEC personnel will be on site to direct crews on the placement of the catch basin debris intothe appropriate containers for sample processing, and to ensure that the debris is evenly distributed into the primary containment unit. Catch basin debris will be placed within theprimary containment unit of the containment berm, which will store the catch basin debris as the sediment dries. The goal is to collect a dry weight catch basin debris sample, which may requirea one- to two-week drying period depending on the moisture content of the collected catch basin debris. The primary containment unit will be covered by a tarp and marked with required signage to prevent tampering with the sample as it dries.
After the appropriate drying period, staff will inspect the deposited catch basin debris to determine if it is dry enough to be processed. Moisture content of catch basin debris must be less than or equal to 25 percent in order to collect and process samples for analysis. A ball squeeze test will be performed to determine the moisture content of the debris. This test will besubject to the best professional judgment of field personnel. Field staff will take a handful of debris, squeeze it tightly with one hand, and use Table 6-1 to interpret observed debris conditions to determine initial debris moisture content (Miles, et al. 1998). Field crews will also take photographs of squeezed debris to document the test. This will be done with handfuls from four locations throughout the containment unit to ensure that samples are drying evenly. If the
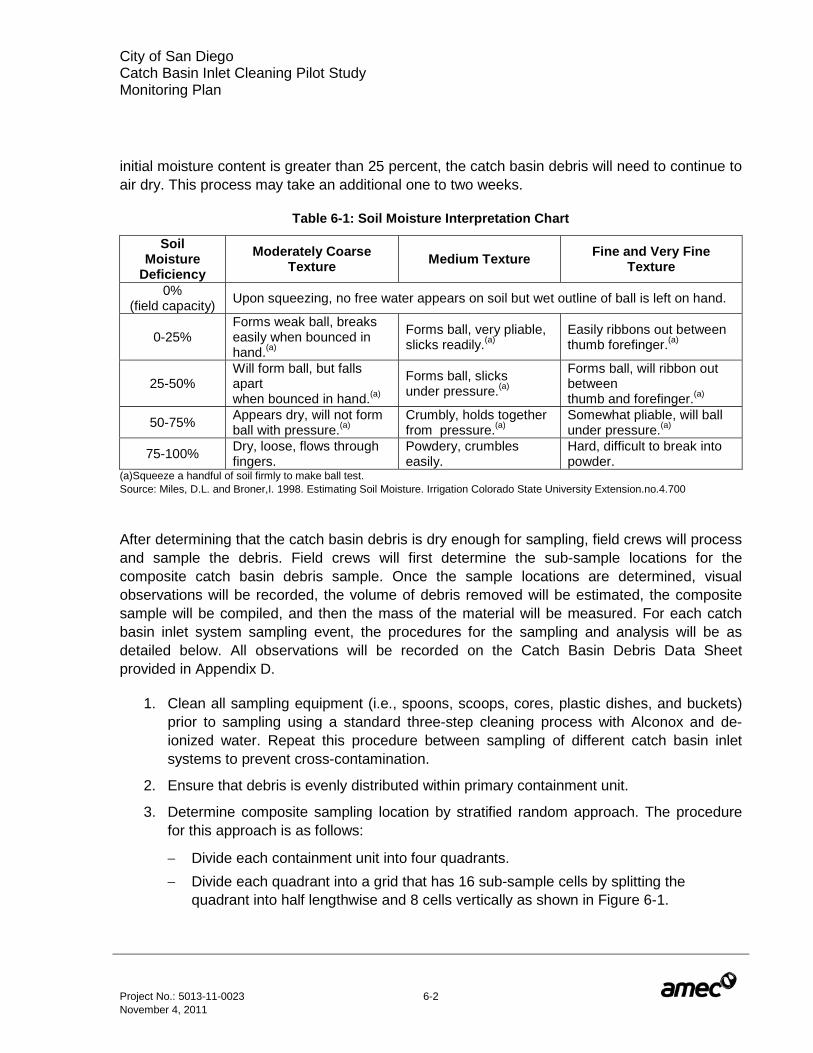
City of San DiegoCatch Basin Inlet Cleaning Pilot StudyMonitoring Plan
Project No.: 5013-11-0023 6-2November 4, 2011
initial moisture content is greater than 25 percent, the catch basin debris will need to continue to air dry. This process may take an additional one to two weeks.
Table 6-1: Soil Moisture Interpretation Chart
SoilMoisture
DeficiencyModerately Coarse
Texture Medium Texture Fine and Very Fine Texture
0%(field capacity) Upon squeezing, no free water appears on soil but wet outline of ball is left on hand.
0-25%Forms weak ball, breakseasily when bounced in hand.(a)
Forms ball, very pliable,slicks readily.(a)
Easily ribbons out betweenthumb forefinger.(a)
25-50%Will form ball, but falls apartwhen bounced in hand.(a)
Forms ball, slicksunder pressure.(a)
Forms ball, will ribbon out betweenthumb and forefinger.(a)
50-75% Appears dry, will not formball with pressure.(a)
Crumbly, holds togetherfrom pressure.(a)
Somewhat pliable, will ballunder pressure.(a)
75-100% Dry, loose, flows through fingers.
Powdery, crumbles easily.
Hard, difficult to break into powder.
(a)Squeeze a handful of soil firmly to make ball test.Source: Miles, D.L. and Broner,I. 1998. Estimating Soil Moisture. Irrigation Colorado State University Extension.no.4.700
After determining that the catch basin debris is dry enough for sampling, field crews will process and sample the debris. Field crews will first determine the sub-sample locations for the composite catch basin debris sample. Once the sample locations are determined, visual observations will be recorded, the volume of debris removed will be estimated, the composite sample will be compiled, and then the mass of the material will be measured. For each catch basin inlet system sampling event, the procedures for the sampling and analysis will be as detailed below. All observations will be recorded on the Catch Basin Debris Data Sheet provided in Appendix D.
1. Clean all sampling equipment (i.e., spoons, scoops, cores, plastic dishes, and buckets) prior to sampling using a standard three-step cleaning process with Alconox and de-ionized water. Repeat this procedure between sampling of different catch basin inlet systems to prevent cross-contamination.
2. Ensure that debris is evenly distributed within primary containment unit.
3. Determine composite sampling location by stratified random approach. The procedure for this approach is as follows:
Divide each containment unit into four quadrants.Divide each quadrant into a grid that has 16 sub-sample cells by splitting the quadrant into half lengthwise and 8 cells vertically as shown in Figure 6-1.

City of San DiegoCatch Basin Inlet Cleaning Pilot StudyMonitoring Plan
Project No.: 5013-11-0023 6-3November 4, 2011
Each sub-sample cell will be given a number based on the quadrant.o Quadrant I Values = 1 – 16o Quadrant II Values = 17 – 32o Quadrant III Values = 33 – 48o Quadrant IV Values = 49 – 64Eight sub-samples will be taken during each sample event to create the composite samples.The random function within Microsoft Excel will be used to determine the sub-sample locations to be taken during each sample event before going to the field. For example, after running the random function the following were determined: 4, 14, 18, 36, 48, 51, 56, and 61. Figure 6-1 shows a schematic of the selected sub-samplelocations within the four quadrants.
4. Before the sub-samples are taken, visually characterize the composition of the catch basin debris within each quadrant. Record percent of sediment, trash, and organic matter observed. Take pictures of each quadrant and the full containment unit. A minimum of eight (8) pictures is required.
5. Estimate volume of catch basin debris by taking depth, width, and length measurements within each quadrant.
6. Collect sub-samples for the composite sample. It is important that the sub-samples are of equal volume.
Depending on the depth of debris a stainless steel core, scoop, or spoon will be used to ensure that equal volume sub-samples are taken. Place sub-samples in a pre-cleaned plastic dish. Take pictures of sub-samples per quadrant before compositing. Place sub-samples in a larger disposable dish and mix to make one composite sample. Take a final picture of composited sample.Weigh the composited sample and record. Fill samples bottles provided by the laboratory with composited catch basin debris and place the sample bottles on ice.
7. Determine total catch basin debris weight by weighing the remaining catch basin debris by quadrant. Use a pre-cleaned, weighed, and labeled five-gallon bucket to collect debris. Weigh bucket with debris and record on field forms. Determine the total weight of the debris collected.
8. Properly dispose of all catch basin debris.

City of San DiegoCatch Basin Inlet Cleaning Pilot StudyMonitoring Plan
Project No.: 5013-11-0023 6-4November 4, 2011
Figure 6-1: Containment Unit Quadrants and Sub-Sample Locations
Quadrant I Quadrant II
1 9 17 25
2 10 18 26
3 11 19 27
4 12 20 28
5 13 21 29
6 14 22 30
7 15 23 31
8 16 24 32
Quadrant III Quadrant IV
33 41 49 57
34 42 50 58
35 43 51 59
36 44 52 60
37 45 53 61
38 46 54 62
39 47 55 63
40 48 56 64
City of San DiegoCatch Basin Inlet Cleaning Pilot StudyMonitoring Plan
Project No.: 5013-11-0023 6-5November 4, 2011
6.3 LABORATORY SELECTION
Weck Laboratories, Inc., located in City of Industry, California, will be providing laboratory services for this project, including analytical testing for all constituents:
Weck Laboratories, Inc.14859 East Clark AvenueCity of Industry, CA 91745Phone: (626)336-2139Fax: (626) 336-2634
6.4 HOLDING TIMES, SAMPLE VOLUMES, AND PRESERVATION REQUIREMENTS
All sample containers and preservation methods have been confirmed with the laboratory and are presented in Table 6-2. The laboratory will provide appropriate sample containers and preservatives for the microbiology grab samples.
Chains-of-Custody (COCs) will be pre-printed along with the bottle labels. The COCs will contain the same data as the labels, and will be completed in the field with dates, times, and sample team names. COCs will be cross-checked with the bottle labels to make sure they match.
When the complete composite sample has been collected, the label will be filled out, and the bottles will be immediately placed on ice in a cooler for transportation to the laboratory. The start of the holding time, for all samples, is considered to be the time that the last sub-sample was collected. Microbiology has a hold time requirement of eight (8) hours, which allows for six (6) hours between time of collection and delivery to the laboratory, and two (2) hours for laboratory processing. This will require close coordination between the laboratory and AMEC to make sure microbiology tests are started within holding times.
Transport of the samples will be coordinated by the Sampling Manager to make sure samples are processed and analyzed within the proper holding times. The COCs will be reviewed by personnel at the receiving laboratory to verify that all samples are accounted for and received within the holding times.
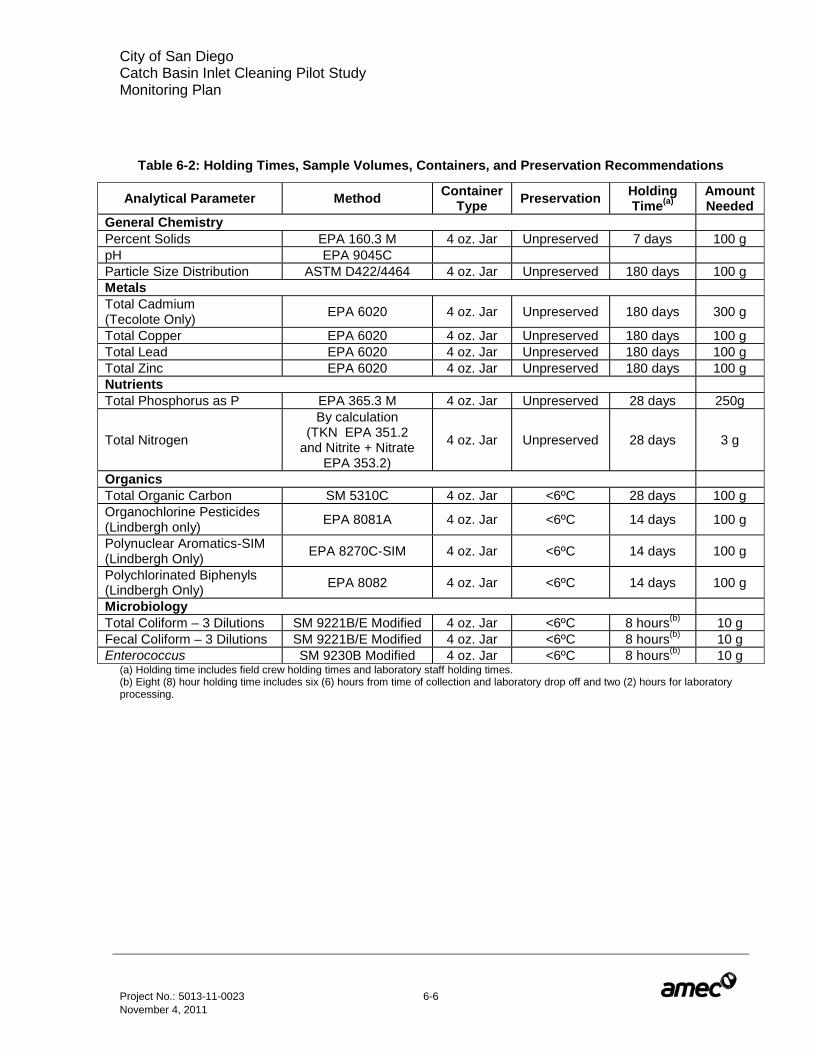
City of San DiegoCatch Basin Inlet Cleaning Pilot StudyMonitoring Plan
Project No.: 5013-11-0023 6-6November 4, 2011
Table 6-2: Holding Times, Sample Volumes, Containers, and Preservation Recommendations
Analytical Parameter Method ContainerType Preservation Holding
Time(a)AmountNeeded
General ChemistryPercent Solids EPA 160.3 M 4 oz. Jar Unpreserved 7 days 100 gpH EPA 9045CParticle Size Distribution ASTM D422/4464 4 oz. Jar Unpreserved 180 days 100 gMetalsTotal Cadmium(Tecolote Only) EPA 6020 4 oz. Jar Unpreserved 180 days 300 g
Total Copper EPA 6020 4 oz. Jar Unpreserved 180 days 100 gTotal Lead EPA 6020 4 oz. Jar Unpreserved 180 days 100 gTotal Zinc EPA 6020 4 oz. Jar Unpreserved 180 days 100 gNutrientsTotal Phosphorus as P EPA 365.3 M 4 oz. Jar Unpreserved 28 days 250g
Total Nitrogen
By calculation(TKN EPA 351.2
and Nitrite + NitrateEPA 353.2)
4 oz. Jar Unpreserved 28 days 3 g
OrganicsTotal Organic Carbon SM 5310C 4 oz. Jar <6ºC 28 days 100 gOrganochlorine Pesticides(Lindbergh only) EPA 8081A 4 oz. Jar <6ºC 14 days 100 g
Polynuclear Aromatics-SIM(Lindbergh Only) EPA 8270C-SIM 4 oz. Jar <6ºC 14 days 100 g
Polychlorinated Biphenyls(Lindbergh Only) EPA 8082 4 oz. Jar <6ºC 14 days 100 g
MicrobiologyTotal Coliform – 3 Dilutions SM 9221B/E Modified 4 oz. Jar <6ºC 8 hours(b) 10 gFecal Coliform – 3 Dilutions SM 9221B/E Modified 4 oz. Jar <6ºC 8 hours(b) 10 gEnterococcus SM 9230B Modified 4 oz. Jar <6ºC 8 hours(b) 10 g
(a) Holding time includes field crew holding times and laboratory staff holding times.(b) Eight (8) hour holding time includes six (6) hours from time of collection and laboratory drop off and two (2) hours for laboratory processing.
City of San DiegoCatch Basin Inlet Cleaning Pilot StudyMonitoring Plan
Project No.: 5013-11-0023 6-7November 4, 2011
6.5 SAMPLE LABELING
Sediment and gross solids quality sample bottles will be pre-labeled, to the extent possible, before each monitoring event. Pre-labeling bottles simplifies field activities and leaves only date, time, sample ID, and sampling personnel names to be filled out in the field. Each sample collected will be labeled with the following information:
Project NameEvent NumberDate and TimeSite ID NumberBottle __ of __ (for multi-bottle samples)Collected byAnalysis
Field samples, field blanks, and field duplicate samples will be labeled as described below. These samples will be labeled, recorded on the COC form, and then transported to the analytical laboratory.
Each catch basin debris sample will receive a unique alphanumeric code (Sample I.D. Number) for tracking. This code will be standardized for all samples and contain information as it relates to the site, event, and type of sample. The required sample identification numbers, applicable to all samples, are listed below. Example identification numbers are shown in Table 6-3:
Event NumberCB1 = Catch Basin Event 1 CB2 = Catch Basin Event 2 Etc.
Site ID PO = PowayTE = TecoloteLI = LindberghSY = San Ysidro
Sample CodeG = Grab sample
Sample Type 01 = Primary sample 02 = Field duplicate
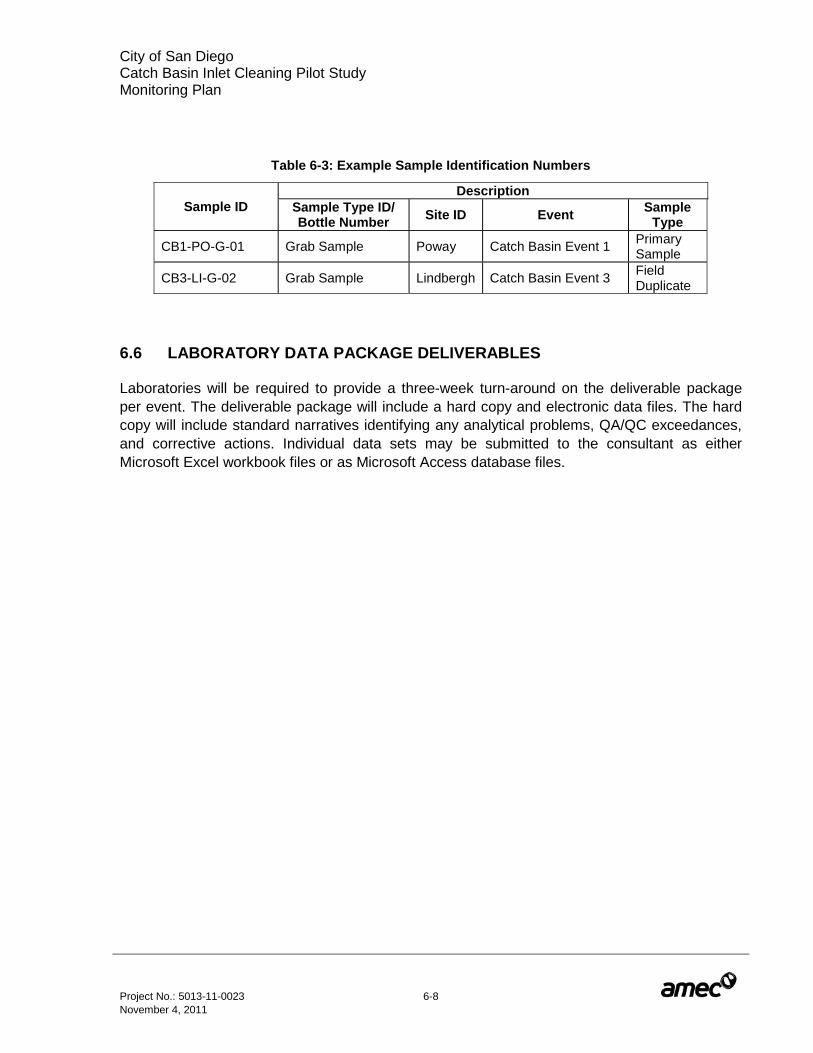
City of San DiegoCatch Basin Inlet Cleaning Pilot StudyMonitoring Plan
Project No.: 5013-11-0023 6-8November 4, 2011
Table 6-3: Example Sample Identification Numbers
Sample IDDescription
Sample Type ID/Bottle Number Site ID Event Sample
Type
CB1-PO-G-01 Grab Sample Poway Catch Basin Event 1 PrimarySample
CB3-LI-G-02 Grab Sample Lindbergh Catch Basin Event 3 FieldDuplicate
6.6 LABORATORY DATA PACKAGE DELIVERABLES
Laboratories will be required to provide a three-week turn-around on the deliverable package per event. The deliverable package will include a hard copy and electronic data files. The hard copy will include standard narratives identifying any analytical problems, QA/QC exceedances, and corrective actions. Individual data sets may be submitted to the consultant as either Microsoft Excel workbook files or as Microsoft Access database files.
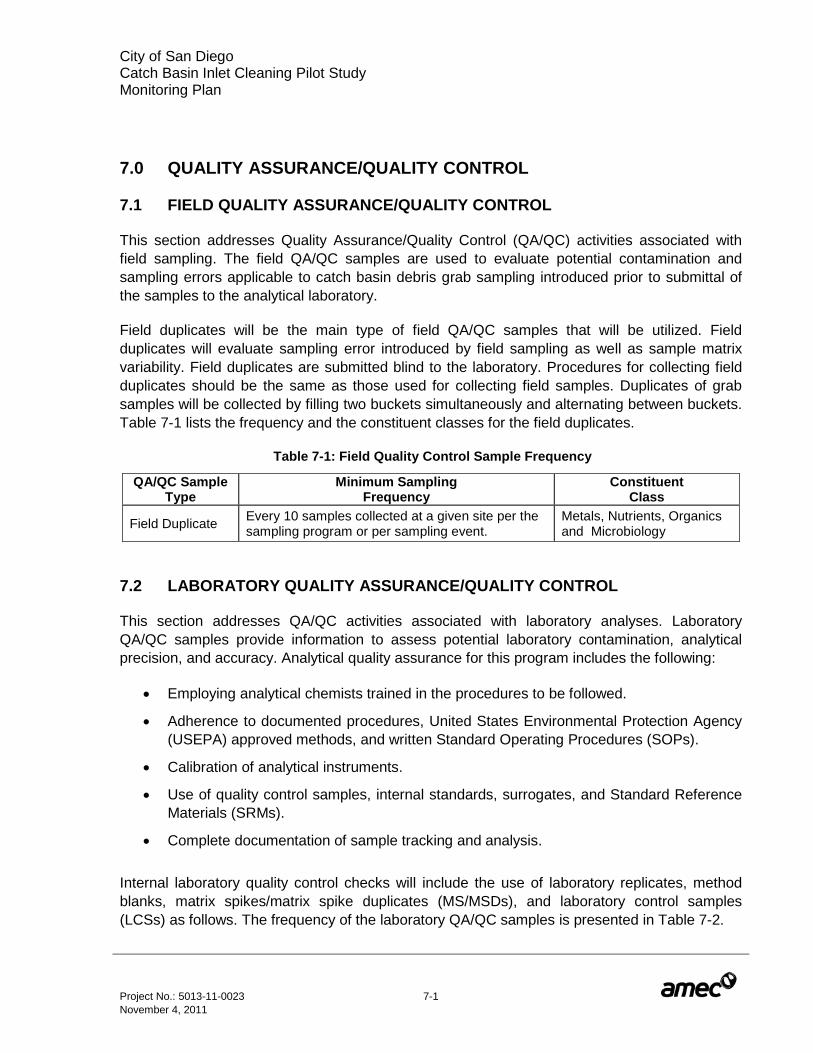
City of San DiegoCatch Basin Inlet Cleaning Pilot StudyMonitoring Plan
Project No.: 5013-11-0023 7-1November 4, 2011
7.0 QUALITY ASSURANCE/QUALITY CONTROL
7.1 FIELD QUALITY ASSURANCE/QUALITY CONTROL
This section addresses Quality Assurance/Quality Control (QA/QC) activities associated with field sampling. The field QA/QC samples are used to evaluate potential contamination and sampling errors applicable to catch basin debris grab sampling introduced prior to submittal of the samples to the analytical laboratory.
Field duplicates will be the main type of field QA/QC samples that will be utilized. Field duplicates will evaluate sampling error introduced by field sampling as well as sample matrix variability. Field duplicates are submitted blind to the laboratory. Procedures for collecting field duplicates should be the same as those used for collecting field samples. Duplicates of grab samples will be collected by filling two buckets simultaneously and alternating between buckets.Table 7-1 lists the frequency and the constituent classes for the field duplicates.
Table 7-1: Field Quality Control Sample Frequency
QA/QC SampleType
Minimum SamplingFrequency
ConstituentClass
Field Duplicate Every 10 samples collected at a given site per thesampling program or per sampling event.
Metals, Nutrients, Organics and Microbiology
7.2 LABORATORY QUALITY ASSURANCE/QUALITY CONTROL
This section addresses QA/QC activities associated with laboratory analyses. Laboratory QA/QC samples provide information to assess potential laboratory contamination, analytical precision, and accuracy. Analytical quality assurance for this program includes the following:
Employing analytical chemists trained in the procedures to be followed.
Adherence to documented procedures, United States Environmental Protection Agency (USEPA) approved methods, and written Standard Operating Procedures (SOPs).
Calibration of analytical instruments.
Use of quality control samples, internal standards, surrogates, and Standard Reference Materials (SRMs).
Complete documentation of sample tracking and analysis.
Internal laboratory quality control checks will include the use of laboratory replicates, method blanks, matrix spikes/matrix spike duplicates (MS/MSDs), and laboratory control samples(LCSs) as follows. The frequency of the laboratory QA/QC samples is presented in Table 7-2.

City of San DiegoCatch Basin Inlet Cleaning Pilot StudyMonitoring Plan
Project No.: 5013-11-0023 7-2November 4, 2011
Laboratory Replicate/Split – A sample is split by the laboratory into two portions and each portion is analyzed. Once analyzed, the results are evaluated by calculating the relative percent difference (RPD) between the two sets of results. This serves as a measure of the reproducibility, or precision, of the sample analysis. Typically, replicate results should fall within an accepted RPD range, depending upon the analysis.
Method Blanks – A method blank is an analysis of a known clean sample matrix that has been subjected to the same complete analytical procedure as the field sample to determine if potential contamination has been introduced during processing. Blank analysis results are evaluated by checking against reporting limits for that analyte. Results obtained should be less than the reporting limit for each analyte.
Matrix Spike and Matrix Spike Duplicates (MS/MSDs) – Matrix spikes and matrix spike duplicates involve adding a known amount of the analyte(s) of interest to one of the actual samples being analyzed. One sample is split into three separate portions. One portion is analyzed to determine the concentration of the analyte in question in an un-spiked state. The other two portions are spiked with a known concentration of the analytes of interest. The recovery of the spike, after accounting for the concentration of the analyte in the original sample, is a measure of the accuracy of the analysis. An additional precision measure is made by calculating the RPD of the duplicate spike recoveries. Both the RPD values and spike recoveries are compared against accepted and known method dependent acceptance limits. Results outside these limits are subject to corrective action.
Laboratory Control Sample (LCS) – The laboratory control sample procedure involves spiking known amounts of the analyte of interest into a known, clean, sample matrix to assess the possible matrix effects on spike recoveries. High or low recoveries of the analytes in the matrix spikes may be caused by interferences in the sample. Laboratory control samples assess these possible matrix effects since the LCS is known to be free from interferences.
Table 7-2: Laboratory Quality Control Sample Frequency
QA/QC Sample Type Minimum Sampling FrequencyLaboratory Replicate/Split One per batch or per 20 samples (5%) per sampling event.Method Blank One per batch or per 20 samples (5%) per sampling event.Matrix Spike/MatrixSpike Duplicate (MS/MSD) One per batch or per 20 samples (5%) per sampling event.
Laboratory ControlSample (LCS) One per batch or per 20 samples (5%) per sampling event.
City of San DiegoCatch Basin Inlet Cleaning Pilot StudyMonitoring Plan
Project No.: 5013-11-0023 7-3November 4, 2011
7.3 CORRECTIVE ACTION
Corrective action is taken when an analysis is deemed suspect for some reason. The reasons include exceedances of the RPD ranges, spike recoveries, and blanks. The corrective action varies somewhat from analysis to analysis, but typically involves the following:
Check of procedure Review of documents and calculations to identify any possible error Error correctionRe-analysis of the sample extract, if available, to see if results can be improved Complete reprocessing and re-analysis of additional sample material, if it is available.
Any failures (e.g., instrument failures) that occur during data collection and laboratory analyses will be the responsibility of the field crew or laboratory conducting the work, respectively. In the case of field instruments, problems will be addressed through instrument cleaning, repair, or replacement of parts or the entire instrument, as warranted. Field crews will carry basic spare parts and consumables with them, and will have access to spare parts to be stored at the office. Records of all repairs or replacements of field instruments will be maintained at AMEC. The laboratories have procedures in place to follow when failures occur, and will identify individuals responsible for corrective action and develop appropriate documentation.
City of San DiegoCatch Basin Inlet Cleaning Pilot StudyMonitoring Plan
Project No.: 5013-11-0023 8-1November 4, 2011
8.0 DATA MANAGEMENT AND REPORTING PROCEDURES
8.1 DATA MANAGEMENT
The responsibility for laboratory data management will be lead by the Project Manager. The laboratory will be requested to provide data in both hard copy and electronic formats.
The Reporting and Laboratory Coordinator will be responsible for tracking the analytical process to make sure that laboratories are meeting the required turnaround times and are providing a complete deliverable package. The Reporting and Laboratory Coordinator receives the original hard copy from the laboratory, verifies completeness, and logs the date of receipt. The hard copy originals are then transferred to the Project Manager and filed with all other original project documentation in order to maintain complete project records.
Laboratory data will be maintained and managed with Microsoft Excel by the Sample Manager. Data from the monitoring site will also be stored in the same format and linked to the laboratory file.
8.2 REPORTING PROCEDURES
AMEC will complete one EDD (Electronic Data Deliverable) following the last monitored event.Copies of the EDD will be submitted to the City of San Diego and Tetra Tech. Each EDD will contain the following:
Laboratory resultsField formsPhotographs
The laboratory results will be submitted in Microsoft Excel format. The field form will include the completed Field Data Log Sheets in PDF format. The Tetra Tech team will prepare a draft and final summary project report and submit to the City of San Diego. The report will provide a review and analysis of the data provided in the EDD.

City of San DiegoCatch Basin Inlet Cleaning Pilot StudyMonitoring Plan
Project No.: 5013-11-0023 9-1November 4, 2011
9.0 REFERENCES
Lager, J.A., W.G. Smith, and G. Tchobanoglous. 1977. “Catchbasin Technology Overview and Assessment.” USEPA 60012-77-051. Cincinnati, OH. May 1977.
Miles, D.L. and Broner,I. 1998. “Estimating Soil Moisture”. Irrigation Colorado State University Extension.No.4.700
Tetra Tech. 2011. “Catch Basin Inlet Cleaning Pilot Study: Final Work Plan.” Prepared for the City of San Diego.
AP P E N D I X A
P R O D U C T S P E C I F I C A T I O N S H E E T S
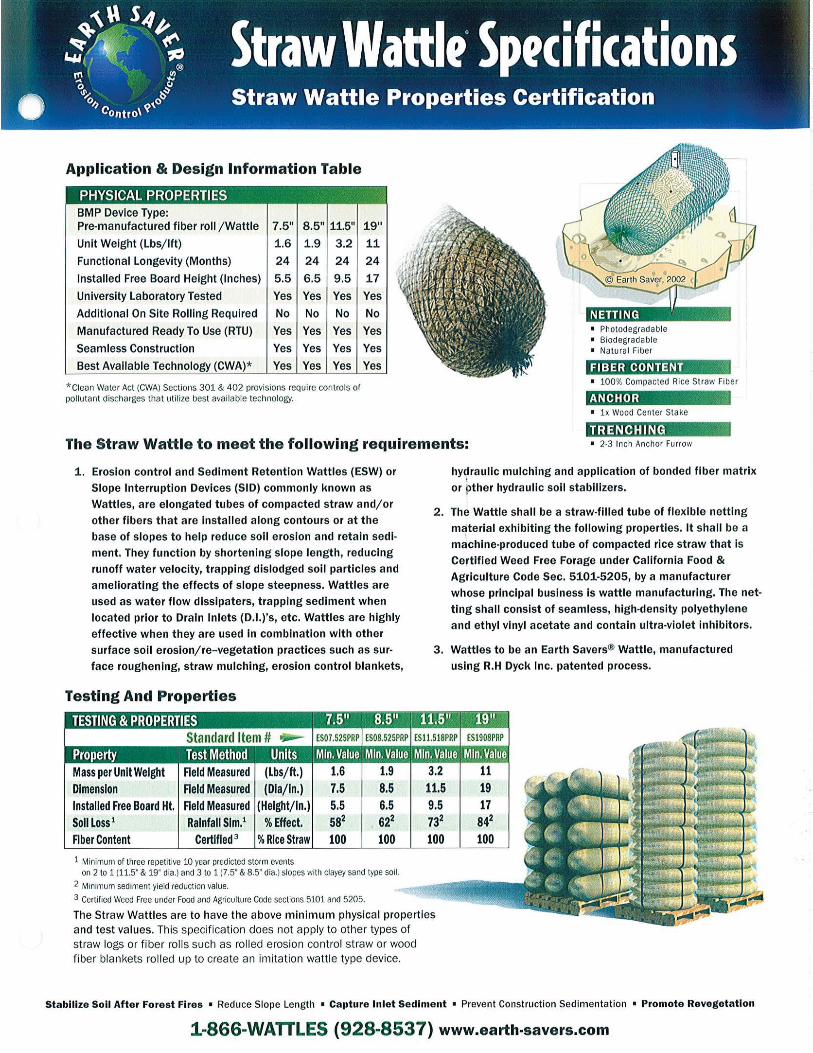
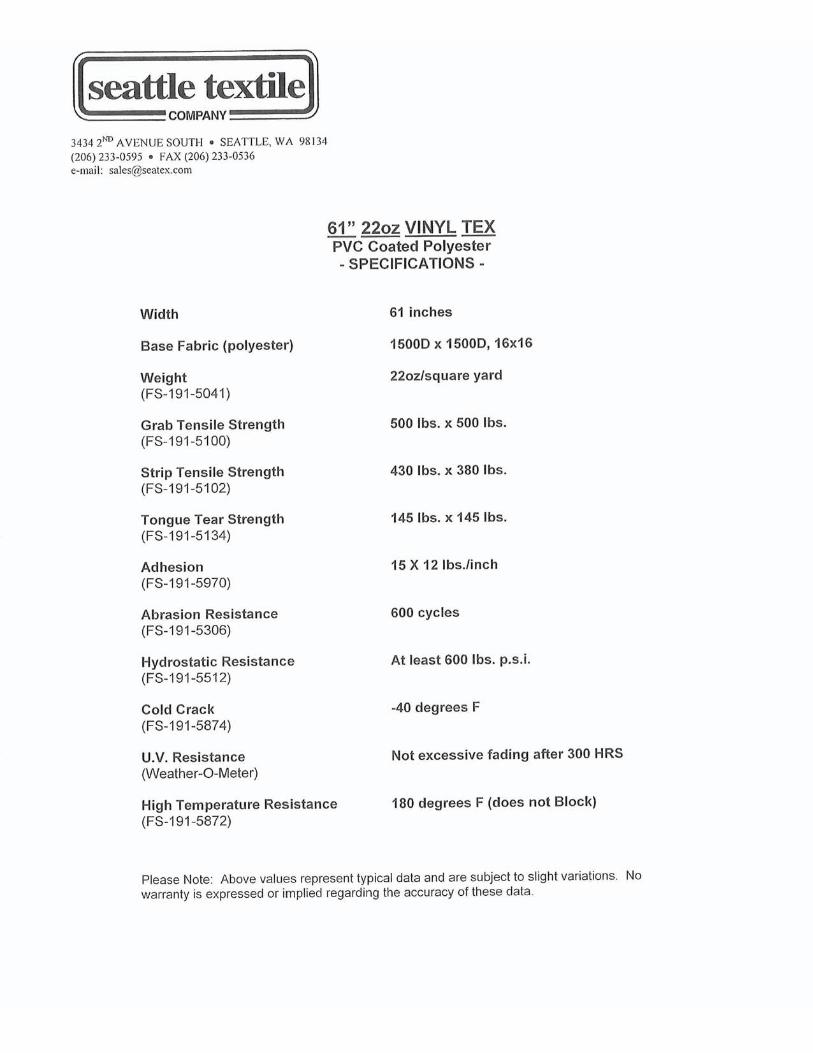
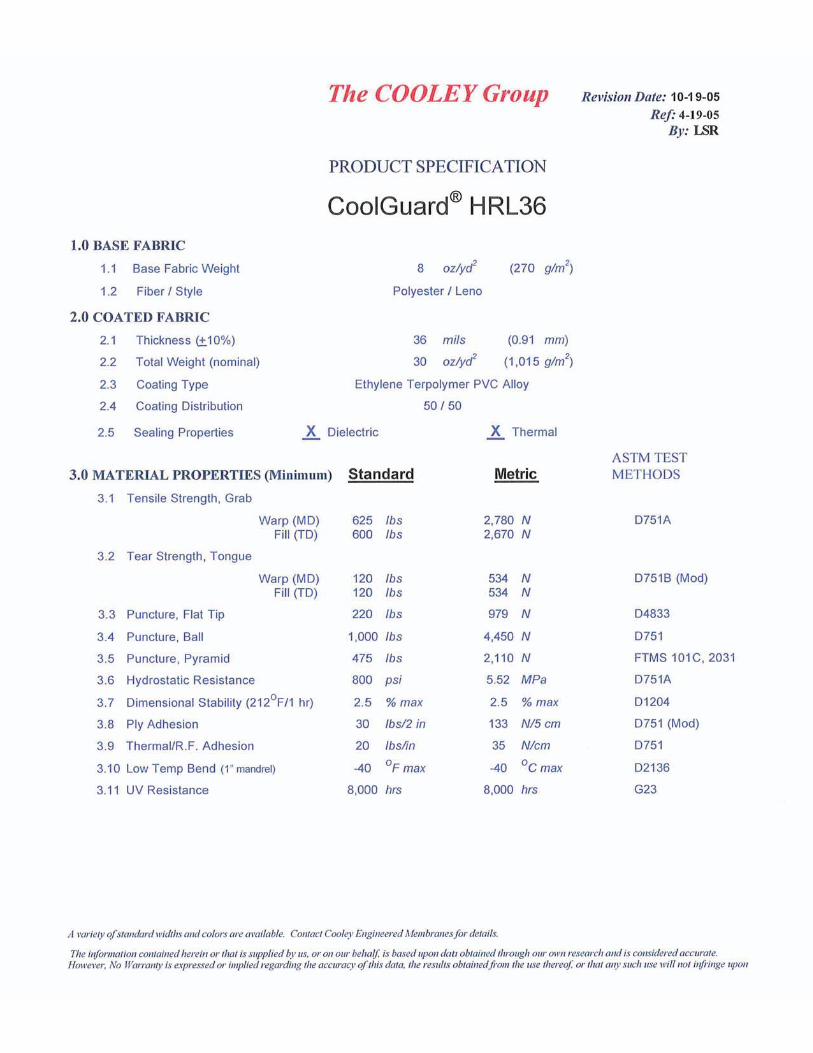
A P P E N D I X B
D A T A Q U A L I T Y O B J E C T I V E S F O R
E P A 8 0 8 1 A , E P A 8 2 7 0 C - S I M & E P A 8 0 8 2
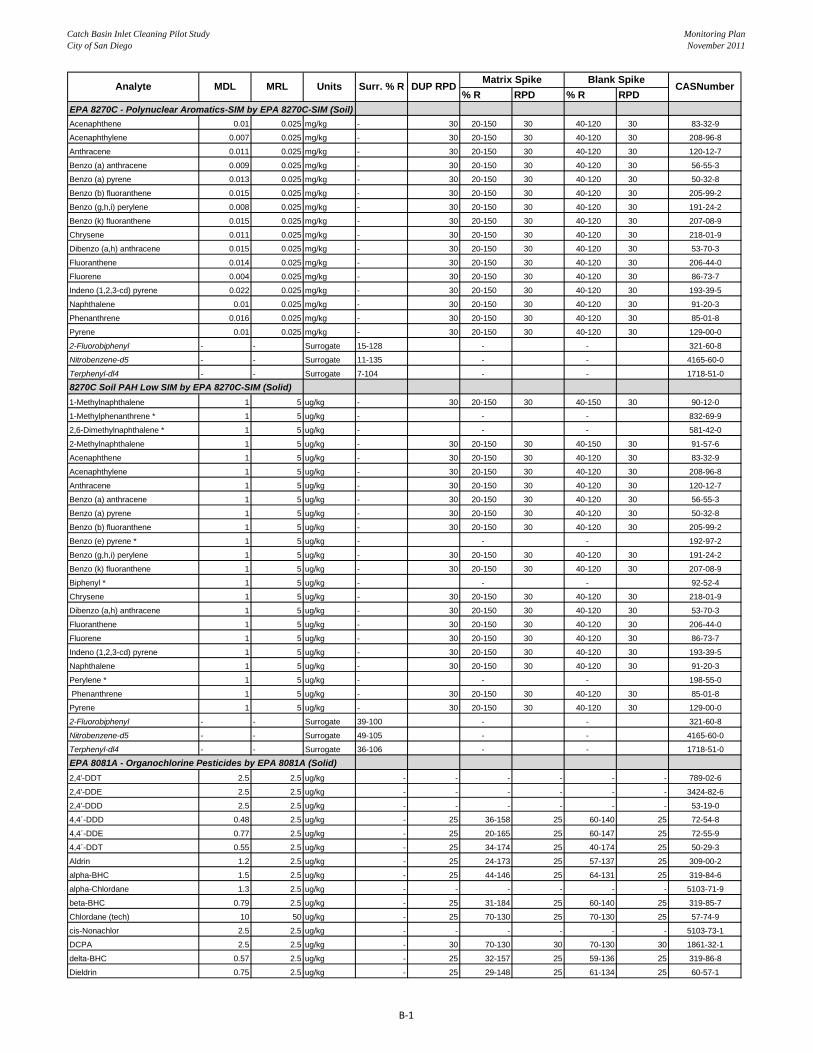
Catch Basin Inlet Cleaning Pilot StudyCity of San Diego
Monitoring PlanNovember 2011
B-1
% R RPD % R RPDEPA 8270C - Polynuclear Aromatics-SIM by EPA 8270C-SIM (Soil)Acenaphthene 0.01 0.025 mg/kg - 30 20-150 30 40-120 30 83-32-9
Acenaphthylene 0.007 0.025 mg/kg - 30 20-150 30 40-120 30 208-96-8
Anthracene 0.011 0.025 mg/kg - 30 20-150 30 40-120 30 120-12-7
Benzo (a) anthracene 0.009 0.025 mg/kg - 30 20-150 30 40-120 30 56-55-3
Benzo (a) pyrene 0.013 0.025 mg/kg - 30 20-150 30 40-120 30 50-32-8
Benzo (b) fluoranthene 0.015 0.025 mg/kg - 30 20-150 30 40-120 30 205-99-2
Benzo (g,h,i) perylene 0.008 0.025 mg/kg - 30 20-150 30 40-120 30 191-24-2
Benzo (k) fluoranthene 0.015 0.025 mg/kg - 30 20-150 30 40-120 30 207-08-9
Chrysene 0.011 0.025 mg/kg - 30 20-150 30 40-120 30 218-01-9
Dibenzo (a,h) anthracene 0.015 0.025 mg/kg - 30 20-150 30 40-120 30 53-70-3
Fluoranthene 0.014 0.025 mg/kg - 30 20-150 30 40-120 30 206-44-0
Fluorene 0.004 0.025 mg/kg - 30 20-150 30 40-120 30 86-73-7
Indeno (1,2,3-cd) pyrene 0.022 0.025 mg/kg - 30 20-150 30 40-120 30 193-39-5
Naphthalene 0.01 0.025 mg/kg - 30 20-150 30 40-120 30 91-20-3
Phenanthrene 0.016 0.025 mg/kg - 30 20-150 30 40-120 30 85-01-8
Pyrene 0.01 0.025 mg/kg - 30 20-150 30 40-120 30 129-00-0
2-Fluorobiphenyl - - Surrogate 15-128 - - 321-60-8
Nitrobenzene-d5 - - Surrogate 11-135 - - 4165-60-0
Terphenyl-dl4 - - Surrogate 7-104 - - 1718-51-0
8270C Soil PAH Low SIM by EPA 8270C-SIM (Solid)1-Methylnaphthalene 1 5 ug/kg - 30 20-150 30 40-150 30 90-12-0
1-Methylphenanthrene * 1 5 ug/kg - - - 832-69-9
2,6-Dimethylnaphthalene * 1 5 ug/kg - - - 581-42-0
2-Methylnaphthalene 1 5 ug/kg - 30 20-150 30 40-150 30 91-57-6
Acenaphthene 1 5 ug/kg - 30 20-150 30 40-120 30 83-32-9
Acenaphthylene 1 5 ug/kg - 30 20-150 30 40-120 30 208-96-8
Anthracene 1 5 ug/kg - 30 20-150 30 40-120 30 120-12-7
Benzo (a) anthracene 1 5 ug/kg - 30 20-150 30 40-120 30 56-55-3
Benzo (a) pyrene 1 5 ug/kg - 30 20-150 30 40-120 30 50-32-8
Benzo (b) fluoranthene 1 5 ug/kg - 30 20-150 30 40-120 30 205-99-2
Benzo (e) pyrene * 1 5 ug/kg - - - 192-97-2
Benzo (g,h,i) perylene 1 5 ug/kg - 30 20-150 30 40-120 30 191-24-2
Benzo (k) fluoranthene 1 5 ug/kg - 30 20-150 30 40-120 30 207-08-9
Biphenyl * 1 5 ug/kg - - - 92-52-4
Chrysene 1 5 ug/kg - 30 20-150 30 40-120 30 218-01-9
Dibenzo (a,h) anthracene 1 5 ug/kg - 30 20-150 30 40-120 30 53-70-3
Fluoranthene 1 5 ug/kg - 30 20-150 30 40-120 30 206-44-0
Fluorene 1 5 ug/kg - 30 20-150 30 40-120 30 86-73-7
Indeno (1,2,3-cd) pyrene 1 5 ug/kg - 30 20-150 30 40-120 30 193-39-5
Naphthalene 1 5 ug/kg - 30 20-150 30 40-120 30 91-20-3
Perylene * 1 5 ug/kg - - - 198-55-0
Phenanthrene 1 5 ug/kg - 30 20-150 30 40-120 30 85-01-8
Pyrene 1 5 ug/kg - 30 20-150 30 40-120 30 129-00-0
2-Fluorobiphenyl - - Surrogate 39-100 - - 321-60-8
Nitrobenzene-d5 - - Surrogate 49-105 - - 4165-60-0
Terphenyl-dl4 - - Surrogate 36-106 - - 1718-51-0
EPA 8081A - Organochlorine Pesticides by EPA 8081A (Solid)2,4'-DDT 2.5 2.5 ug/kg - - - - - - 789-02-6
2,4'-DDE 2.5 2.5 ug/kg - - - - - - 3424-82-6
2,4'-DDD 2.5 2.5 ug/kg - - - - - - 53-19-0
4,4´-DDD 0.48 2.5 ug/kg - 25 36-158 25 60-140 25 72-54-8
4,4´-DDE 0.77 2.5 ug/kg - 25 20-165 25 60-147 25 72-55-9
4,4´-DDT 0.55 2.5 ug/kg - 25 34-174 25 40-174 25 50-29-3
Aldrin 1.2 2.5 ug/kg - 25 24-173 25 57-137 25 309-00-2
alpha-BHC 1.5 2.5 ug/kg - 25 44-146 25 64-131 25 319-84-6
alpha-Chlordane 1.3 2.5 ug/kg - - - - - - 5103-71-9
beta-BHC 0.79 2.5 ug/kg - 25 31-184 25 60-140 25 319-85-7
Chlordane (tech) 10 50 ug/kg - 25 70-130 25 70-130 25 57-74-9
cis-Nonachlor 2.5 2.5 ug/kg - - - - - - 5103-73-1
DCPA 2.5 2.5 ug/kg - 30 70-130 30 70-130 30 1861-32-1
delta-BHC 0.57 2.5 ug/kg - 25 32-157 25 59-136 25 319-86-8
Dieldrin 0.75 2.5 ug/kg - 25 29-148 25 61-134 25 60-57-1
CASNumberMatrix Spike Blank SpikeAnalyte MDL MRL Units Surr. % R DUP RPD
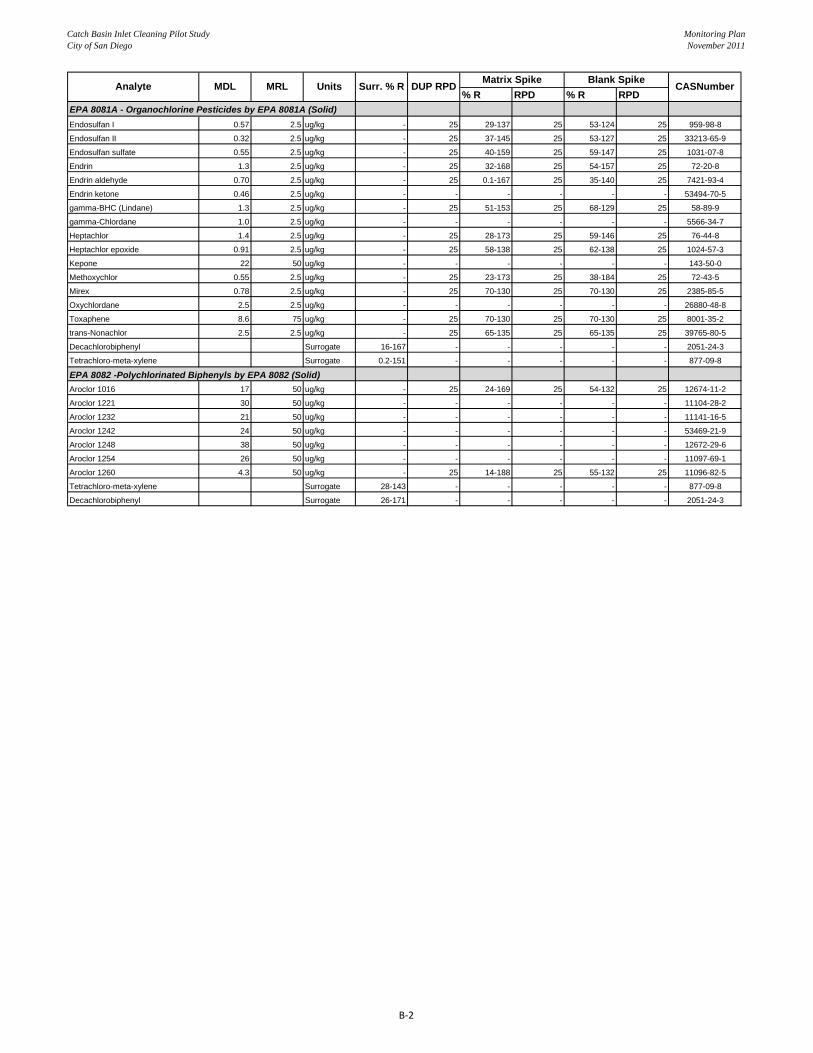
Catch Basin Inlet Cleaning Pilot StudyCity of San Diego
Monitoring PlanNovember 2011
B-2
% R RPD % R RPDCASNumberMatrix Spike Blank SpikeAnalyte MDL MRL Units Surr. % R DUP RPD
EPA 8081A - Organochlorine Pesticides by EPA 8081A (Solid)Endosulfan I 0.57 2.5 ug/kg - 25 29-137 25 53-124 25 959-98-8
Endosulfan II 0.32 2.5 ug/kg - 25 37-145 25 53-127 25 33213-65-9
Endosulfan sulfate 0.55 2.5 ug/kg - 25 40-159 25 59-147 25 1031-07-8
Endrin 1.3 2.5 ug/kg - 25 32-168 25 54-157 25 72-20-8
Endrin aldehyde 0.70 2.5 ug/kg - 25 0.1-167 25 35-140 25 7421-93-4
Endrin ketone 0.46 2.5 ug/kg - - - - - - 53494-70-5
gamma-BHC (Lindane) 1.3 2.5 ug/kg - 25 51-153 25 68-129 25 58-89-9
gamma-Chlordane 1.0 2.5 ug/kg - - - - - - 5566-34-7
Heptachlor 1.4 2.5 ug/kg - 25 28-173 25 59-146 25 76-44-8
Heptachlor epoxide 0.91 2.5 ug/kg - 25 58-138 25 62-138 25 1024-57-3
Kepone 22 50 ug/kg - - - - - - 143-50-0
Methoxychlor 0.55 2.5 ug/kg - 25 23-173 25 38-184 25 72-43-5
Mirex 0.78 2.5 ug/kg - 25 70-130 25 70-130 25 2385-85-5
Oxychlordane 2.5 2.5 ug/kg - - - - - - 26880-48-8
Toxaphene 8.6 75 ug/kg - 25 70-130 25 70-130 25 8001-35-2
trans-Nonachlor 2.5 2.5 ug/kg - 25 65-135 25 65-135 25 39765-80-5
Decachlorobiphenyl Surrogate 16-167 - - - - - 2051-24-3
Tetrachloro-meta-xylene Surrogate 0.2-151 - - - - - 877-09-8
EPA 8082 -Polychlorinated Biphenyls by EPA 8082 (Solid)Aroclor 1016 17 50 ug/kg - 25 24-169 25 54-132 25 12674-11-2
Aroclor 1221 30 50 ug/kg - - - - - - 11104-28-2
Aroclor 1232 21 50 ug/kg - - - - - - 11141-16-5
Aroclor 1242 24 50 ug/kg - - - - - - 53469-21-9
Aroclor 1248 38 50 ug/kg - - - - - - 12672-29-6
Aroclor 1254 26 50 ug/kg - - - - - - 11097-69-1
Aroclor 1260 4.3 50 ug/kg - 25 14-188 25 55-132 25 11096-82-5
Tetrachloro-meta-xylene Surrogate 28-143 - - - - - 877-09-8
Decachlorobiphenyl Surrogate 26-171 - - - - - 2051-24-3
A P P E N D I X C
H E A L T H A N D S A F E T Y P L A N ( H A S P )
H E A L T H A N D S A F E T Y P L A N
F O R
C A T C H B A S I N I N L E T C L E A N I N G P I L O T S T U D Y
S E P T E M B E R 2 0 1 1
AMEC E&I, Inc. 9177 Sky Park Court San Diego, CA 92123
City of San Diego Catch Basin Inlet Cleaning Pilot Study Health and Safety Plan
Project No.: 5013-11-0023 TOC i 4 November 2011
C O N T E N T S
1.0 INTRODUCTION ............................................................................................................... 11.1 FIELD ACTIVITIES ................................................................................................ 1
1.1.1 Travel ......................................................................................................... 11.1.2 Removal and Replacement of Sample Containers .................................... 1
1.2 GENERAL SAFETY .............................................................................................. 1
2.0 SITE-SPECIFIC SAFETY CONCERNS ............................................................................ 42.1 SITE SPECIFIC SAFETY CONCERNS ................................................................ 4
2.1.1 Physical Hazards ....................................................................................... 42.1.2 Biological Hazards ..................................................................................... 42.1.3 Heat Stress ................................................................................................ 42.1.4 Cold Exposure ........................................................................................... 5
2.2 WORKER SAFETY ............................................................................................... 62.2.1 Personal Protective Equipment (PPE) ....................................................... 62.2.2 Special Circumstances .............................................................................. 7
2.3 INSTALLATION SAFETY ...................................................................................... 72.4 EMERGENCY PROCEDURES ............................................................................. 7
2.4.1 Medical Emergencies ................................................................................ 72.5 HAZARDOUS SPILLS ........................................................................................... 92.6 TAILGATE SAFETY TRAINING .......................................................................... 10
T A B L E S
TABLE 2-1: STANDARD PPE FOR NON-HAZARDOUS WORK ZONES .................................... 6
TABLE 2-2: EMERGENCY CONTACTS ....................................................................................... 7
TABLE 2-3: DRIVING DIRECTIONS TO HOSPITAL .................................................................... 8
F I G U R E S
FIGURE 2-1: HOSPITAL MAP ROSE CANYON YARD ............................................................... 8
FIGURE 2-2: TAILGATE SAFETY MEETING FORM ................................................................. 11
City of San Diego Catch Basin Inlet Cleaning Pilot Study Health and Safety Plan
Project No.: 5013-11-0023 C-1 4 November 2011
1.0 INTRODUCTION
This Health and Safety Plan (HASP) is intended to address the health and safety concerns that relate to the field work associated with the Catch Basin Inlet Cleaning Pilot Study. Field team members and the subcontractor’s field teams must be familiar with the contents of this document and site-specific safety concerns.
The project Health and Safety Officer (HSO) will be responsible for assuring that all members of the field team are familiar with the requirements of the HASP and have received appropriate training for their specific roles. The field crew will be responsible for enforcing and following site-specific health and safety protocols. Site-specific health and safety protocols include emergency response/contingency plans. The Project Manager and individual employees have authority to suspend work, if necessary, due to health and safety concerns.
1.1 FIELD ACTIVITIES
Field activities associated with the Catch Basin Inlet Cleaning Pilot Study will be performed by AMEC employees. Such activities will include:
1.1.1 Travel
Travel to and from the selected monitoring sites will occur for continuous flow monitoring activities, maintenance activities, and storm event monitoring. Although travel during the storm events will be minimized by use of automated equipment, some access is typically necessary during storm events and often at night to document observations, replace composite sample containers, and repair any malfunctioning equipment. Efforts will be made to locate equipment in safe work zones, far from high-traffic and high-use areas.
1.1.2 Removal and Replacement of Sample Containers
Composite sample containers will need to be removed and replaced immediately after each storm/dry event and, perhaps, during storm/dry events.
1.2 GENERAL SAFETY
In addition to traffic hazards, field teams may face a variety of potential dangers while maintaining the facilities, installing equipment, and performing environmental monitoring. Some of these dangers include:
Slippery conditions Lightning Unstable earth
City of San Diego Catch Basin Inlet Cleaning Pilot Study Health and Safety Plan
Project No.: 5013-11-0023 C-2 4 November 2011
Poor visibility Lifting heavy objects Transients Muggers and other criminals Elevated places Sharp edges and broken glass Overhead dangers Dogs and other biological hazards Electrical hazards posed by equipment malfunctions
In the event of a spill from an accident occurs:
Back away from the area in the upwind direction. Deny entry to the area. Allow emergency personnel to handle the situation.
Always be aware of these dangers and all other hazards. Here are some tips that will help increase your safety and the safety of others while working in the field:
Stay six feet away from the edge of a fast moving body of water. These edges are usually slippery and unstable during rainy conditions.
If sampling is required at the edge of a fast moving body of water, use a lifeline and a personal flotation device (PFD). Have on hand a grabbing device when possible.
Never work alone at night, and avoid working alone during the day. At a minimum, two people are required during each site visit.
Avoid leaving materials, tools, and equipment lying around where someone can trip over them.
Maximize lighting at all times, especially at night.
Always keep a charged cellular phone or other means of communication nearby.
Do not use your back to lift heavy objects. Get help.
Never use drugs or alcohol while working.
Always wear an orange reflective vest, appropriate shoes, and a hard hat when overhead dangers exist.
Do not use power tools and heavy equipment unless trained in the proper use and care of the specific power tools.
City of San Diego Catch Basin Inlet Cleaning Pilot Study Health and Safety Plan
Project No.: 5013-11-0023 C-3 4 November 2011
Always wear eye protection when working with tools or chemicals.
Never leave open holes unattended or not barricaded.
Do not sample during a lightning storm.
Clean up the work area before leaving.
Always carry drinking water with you.
Be aware of the nearest toilet and hand washing facilities.
Workers will complete the following personal hygiene procedures:
Personal protective equipment (PPE) shall be kept clean and in good repair. Safety devices, including protective clothing worn by the employee, shall not be interchanged among the employees until properly cleaned.
All equipment leaving the site will be free of gross hazardous and non-hazardous waste (i.e., mud and/or soil).
City of San Diego Catch Basin Inlet Cleaning Pilot Study Health and Safety Plan
Project No.: 5013-11-0023 C-4 4 November 2011
2.0 SITE-SPECIFIC SAFETY CONCERNS
This section provides information on unique hazards and necessary precautions for the types of sites that will be monitored during this study. Appropriate emergency response numbers and routes to the nearest medical emergency facilities can be found at the end of this appendix. Field personnel will be responsible for adhering to the requirements of this plan for installation, maintenance, and storm monitoring. If additional measures are necessary due to unforeseen or temporary changes to the work environment, the on-site team leader will make the final judgment for any safety procedure changes.
2.1 SITE SPECIFIC SAFETY CONCERNS
2.1.1 Physical Hazards
Always be alert and use adequate protection to safeguard against the physical hazards associated with working at these sites. The most common hazard encountered is falling or tripping. The following are some other common hazards:
Falling objects Sharp objects Electrical shock Grinding Chipping Moving vehicles and heavy equipment operation Mechanical energy
2.1.2 Biological Hazards
Beware of poison ivy, poison oak, and other plants that cause allergic reactions. Also, use protection against bacteria and other microbiota that could be present in the water and sediment. Be aware that mosquitoes are a common vector for human diseases.
2.1.3 Heat Stress
Heat stress is a major hazard, especially for workers wearing protective clothing. The same protective materials that shield the body from chemical exposure also limit the dissipation of body heat and moisture. In its early stages, heat stress can cause rashes, cramps, discomfort, and drowsiness, resulting in impaired functional ability that threatens the safety of both the individual and coworkers. Continued heat stress can lead to heat stroke and death. Avoiding overprotection; careful training and frequent monitoring of personnel who wear protective
City of San Diego Catch Basin Inlet Cleaning Pilot Study Health and Safety Plan
Project No.: 5013-11-0023 C-5 4 November 2011
clothing, judicious scheduling of work and rest periods, and frequent replacement of fluids can protect against this hazard.
Heat stress is a possibility on this project. Breaks in a shaded area will be taken if any worker exhibits symptoms of heat stress such as excessive sweating, muscle spasms, thirst, dizziness, rapid/weak pulse, flushed skin, loss of consciousness, or convulsions. The breaks will last until symptoms are relieved and/or the pulse of the worker is less than 110 beats per minute. As a preventive measure, workers will be instructed to drink fluids to keep hydrated. For severe heat stress, workers will be examined by a health-care professional as soon as possible.
Additionally, during periods of hot weather or other potential heat stress conditions the following safe work practices must apply:
Be on the alert to signs and symptoms of heat illness during periods of abnormally high heat.
Know the symptoms of heat illness to watch for, including excessive sweating, headaches, poor concentration, muscle pain, cramping, dizziness, irritability, loss of coordination, vomiting, blurry vision, confusion, lack of sweating, fainting, or seizures.
Drink plenty of water throughout the day. Employees working in the heat need to drink 4 eight-ounce glasses of water per hour, including at the start of the shift to replace the water lost to sweat.
Dress for conditions. Wear lightweight, light-colored, loose clothing. Wear a wide-brimmed hat if possible.
Wear sunscreen and sunglasses.
Use cool compresses to stay cool.
Take scheduled rest periods and spend them in the shade.
Tell your supervisor immediately if you feel you may be getting sick from the heat.
Know the locations of your closest drinking water supplies.
Keep track of your coworkers. You all need to look out for each other.
Know how to contact emergency services in the event of heat illness and how to effectively report the work location to 911.
2.1.4 Cold Exposure
Winter conditions can bring unusual cold weather to the area. Cold injury (frostbite and hypothermia) and impaired ability to work are dangers at low temperatures and wet conditions. To guard against this hazard, workers should wear appropriate clothing, have warm shelter
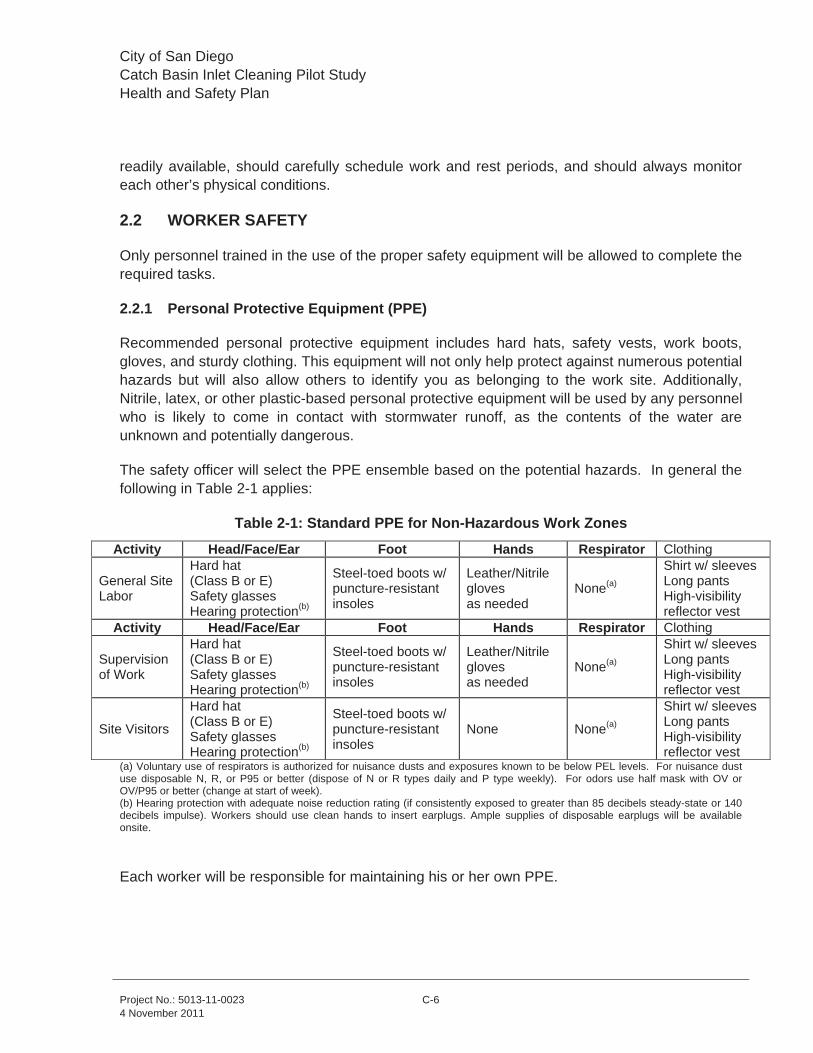
City of San Diego Catch Basin Inlet Cleaning Pilot Study Health and Safety Plan
Project No.: 5013-11-0023 C-6 4 November 2011
readily available, should carefully schedule work and rest periods, and should always monitor each other’s physical conditions.
2.2 WORKER SAFETY
Only personnel trained in the use of the proper safety equipment will be allowed to complete the required tasks.
2.2.1 Personal Protective Equipment (PPE)
Recommended personal protective equipment includes hard hats, safety vests, work boots, gloves, and sturdy clothing. This equipment will not only help protect against numerous potential hazards but will also allow others to identify you as belonging to the work site. Additionally, Nitrile, latex, or other plastic-based personal protective equipment will be used by any personnel who is likely to come in contact with stormwater runoff, as the contents of the water are unknown and potentially dangerous.
The safety officer will select the PPE ensemble based on the potential hazards. In general the following in Table 2-1 applies:
Table 2-1: Standard PPE for Non-Hazardous Work Zones
Activity Head/Face/Ear Foot Hands Respirator Clothing
General Site Labor
Hard hat (Class B or E) Safety glasses Hearing protection(b)
Steel-toed boots w/ puncture-resistant insoles
Leather/Nitrile glovesas needed
None(a)
Shirt w/ sleeves Long pants High-visibility reflector vest
Activity Head/Face/Ear Foot Hands Respirator Clothing
Supervision of Work
Hard hat (Class B or E) Safety glasses Hearing protection(b)
Steel-toed boots w/ puncture-resistant insoles
Leather/Nitrile glovesas needed
None(a)
Shirt w/ sleeves Long pants High-visibility reflector vest
Site Visitors
Hard hat (Class B or E) Safety glasses Hearing protection(b)
Steel-toed boots w/ puncture-resistant insoles
None None(a)
Shirt w/ sleeves Long pants High-visibility reflector vest
(a) Voluntary use of respirators is authorized for nuisance dusts and exposures known to be below PEL levels. For nuisance dustuse disposable N, R, or P95 or better (dispose of N or R types daily and P type weekly). For odors use half mask with OV or OV/P95 or better (change at start of week). (b) Hearing protection with adequate noise reduction rating (if consistently exposed to greater than 85 decibels steady-state or 140 decibels impulse). Workers should use clean hands to insert earplugs. Ample supplies of disposable earplugs will be available onsite.
Each worker will be responsible for maintaining his or her own PPE.

City of San Diego Catch Basin Inlet Cleaning Pilot Study Health and Safety Plan
Project No.: 5013-11-0023 C-7 4 November 2011
2.2.2 Special Circumstances
Extreme caution will be used when maintaining pole-mounted equipment. Qualified individuals will perform this task with proper equipment due to the danger of potential falls.
2.3 INSTALLATION SAFETY
The following precautions will be taken while installing containment berms and sampling:
Always wear protective gloves, a reflective vest, as described above, and a hard hat when overhead dangers exist.
Do not eat or smoke while on the job site.
Use proper lifting techniques and get assistance when moving coolers and large sample composite containers or other equipment.
2.4 EMERGENCY PROCEDURES
2.4.1 Medical Emergencies
Even with full safety awareness and compliance by field teams, medical emergencies can and do occur. To handle minor injuries, field teams will have a basic first aid kit on-site at all times. Table 2-2 is a list of site-specific emergency contacts. Driving directions to the hospital nearest each site are presented in Table 2-3. Maps showing driving routes are presented on Figure 2-1.
Table 2-2: Emergency Contacts
Site Name Phone Comments
All San Diego Police Department 911 From cell phone
All Kristina Schneider Project Manager 619-889-7752 From cell phone
Document all information related to the accident or incident that resulted in injury or damage and report it to the Health and Safety Manager.
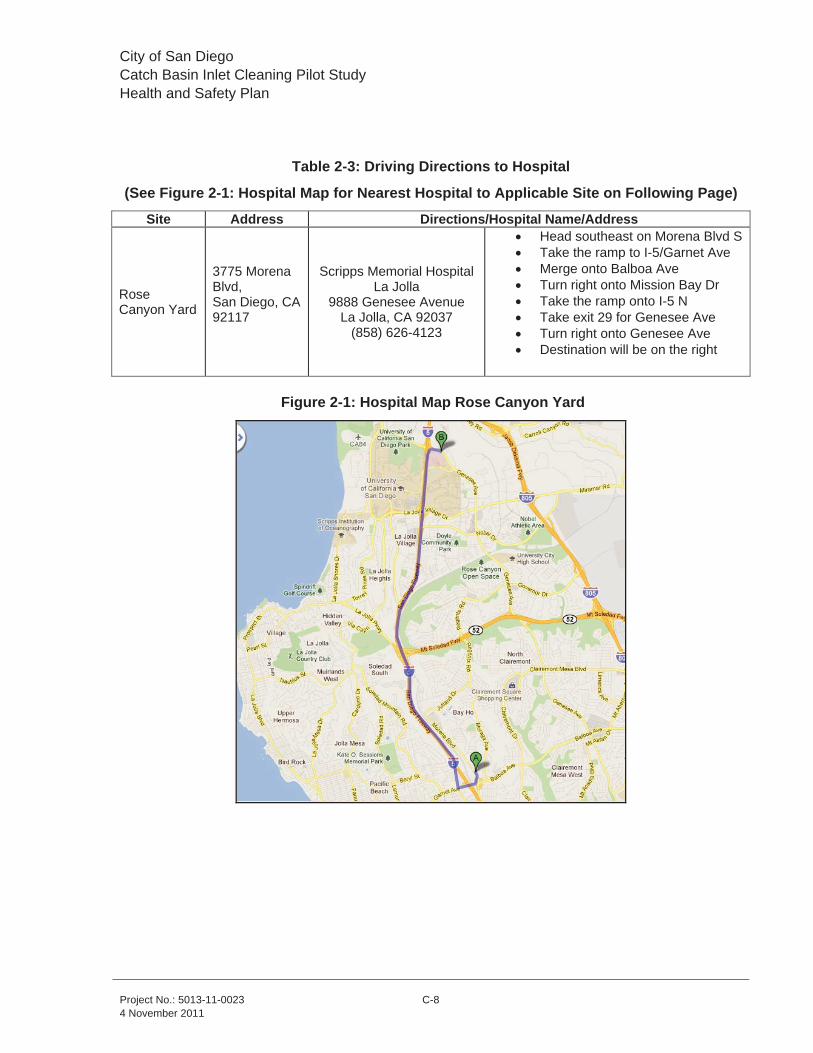
City of San Diego Catch Basin Inlet Cleaning Pilot Study Health and Safety Plan
Project No.: 5013-11-0023 C-8 4 November 2011
Table 2-3: Driving Directions to Hospital
(See Figure 2-1: Hospital Map for Nearest Hospital to Applicable Site on Following Page)
Site Address Directions/Hospital Name/Address
Rose Canyon Yard
3775 Morena Blvd, San Diego, CA 92117
Scripps Memorial Hospital La Jolla
9888 Genesee Avenue La Jolla, CA 92037
(858) 626-4123
Head southeast on Morena Blvd S Take the ramp to I-5/Garnet Ave Merge onto Balboa Ave Turn right onto Mission Bay Dr Take the ramp onto I-5 N Take exit 29 for Genesee Ave Turn right onto Genesee Ave Destination will be on the right
Figure 2-1: Hospital Map Rose Canyon Yard
City of San Diego Catch Basin Inlet Cleaning Pilot Study Health and Safety Plan
Project No.: 5013-11-0023 C-9 4 November 2011
2.5 HAZARDOUS SPILLS
Hazardous substances may be used for various purposes at and around the site. When working with hazardous substances, leaks and spills are always a concern. With the close proximity of the site to the roadway or operation yard activities, the probability also exists of potential hazardous spills originating from traveling vehicles.
A spill may present a number of hazards. The specific hazards depend on the substance(s) involved. Among the possibilities are:
Fire Explosion Contamination of individuals who come in contact with the spilled substance Hazardous substances entering the water supply
Spill response procedures are designed to minimize the risk of any of these things occurring as a result of a spill or, at the very least, reducing the degree of hazard. The primary concern of spill contamination is to stop or retard the spill before it becomes serious.
Field teams working with potentially hazardous materials will be trained in the use of proper personal protective equipment, the safe usage or handling of the substances, and contingency plans for spills and leaks. In the event of a hazardous material spill, follow the procedures listed in Section 1.3 of this HASP. The hazards posed by a spill of a particular substance are detailed on the Material Safety Data Sheet (MSDS) for that substance. In the event of a hazardous material spill originating from an external source such as an accident on the roadway, follow the procedures listed in Section 1.3 of this HASP.
City of San Diego Catch Basin Inlet Cleaning Pilot Study Health and Safety Plan
Project No.: 5013-11-0023 C-10 4 November 2011
2.6 TAILGATE SAFETY TRAINING
The HSO or another designated Safety Officer will conduct tailgate safety training sessions regularly. These meetings will be held on-site prior to work operations. New personnel working on site will be required to attend a tailgate meeting prior to work operations. The purpose of the safety-training meeting is to ensure that field team members understand and will abide by all safety and potential emergency response measures that may be necessary for the well being of the field team.
The following items will be discussed at each safety meeting:
Traffic safety Safe entering and exiting of the site Use of personal protective clothing and equipment Potential chemical and physical hazards and how to deal with them Nearest hospital information Emergency response procedures Any other site-specific safety issues
Field team members must sign the tailgate safety training meeting form in acknowledgment of understanding all issues discussed. An example of a tailgate meeting form is included as Figure 2-5.
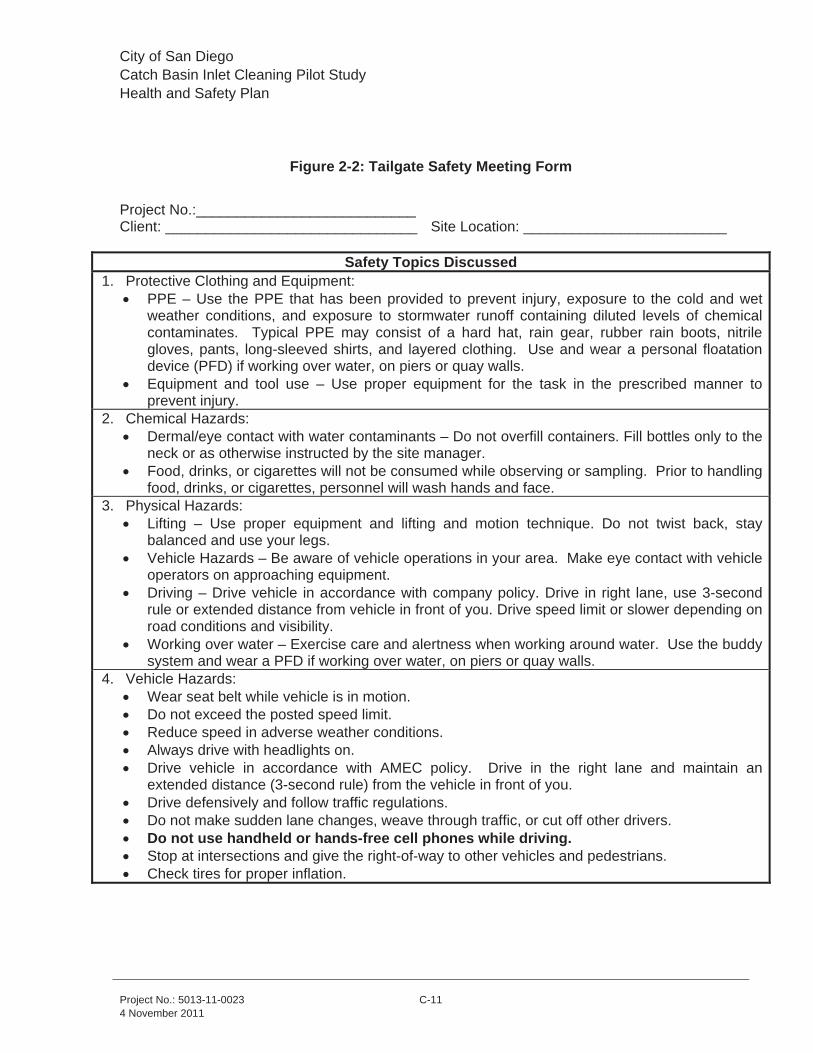
City of San Diego Catch Basin Inlet Cleaning Pilot Study Health and Safety Plan
Project No.: 5013-11-0023 C-11 4 November 2011
Figure 2-2: Tailgate Safety Meeting Form
Project No.:___________________________ Client: _______________________________ Site Location: _________________________
Safety Topics Discussed 1. Protective Clothing and Equipment:
PPE – Use the PPE that has been provided to prevent injury, exposure to the cold and wet weather conditions, and exposure to stormwater runoff containing diluted levels of chemical contaminates. Typical PPE may consist of a hard hat, rain gear, rubber rain boots, nitrile gloves, pants, long-sleeved shirts, and layered clothing. Use and wear a personal floatation device (PFD) if working over water, on piers or quay walls.
Equipment and tool use – Use proper equipment for the task in the prescribed manner to prevent injury.
2. Chemical Hazards: Dermal/eye contact with water contaminants – Do not overfill containers. Fill bottles only to the
neck or as otherwise instructed by the site manager. Food, drinks, or cigarettes will not be consumed while observing or sampling. Prior to handling
food, drinks, or cigarettes, personnel will wash hands and face. 3. Physical Hazards:
Lifting – Use proper equipment and lifting and motion technique. Do not twist back, stay balanced and use your legs.
Vehicle Hazards – Be aware of vehicle operations in your area. Make eye contact with vehicle operators on approaching equipment.
Driving – Drive vehicle in accordance with company policy. Drive in right lane, use 3-second rule or extended distance from vehicle in front of you. Drive speed limit or slower depending on road conditions and visibility.
Working over water – Exercise care and alertness when working around water. Use the buddy system and wear a PFD if working over water, on piers or quay walls.
4. Vehicle Hazards: Wear seat belt while vehicle is in motion. Do not exceed the posted speed limit. Reduce speed in adverse weather conditions. Always drive with headlights on. Drive vehicle in accordance with AMEC policy. Drive in the right lane and maintain an
extended distance (3-second rule) from the vehicle in front of you. Drive defensively and follow traffic regulations. Do not make sudden lane changes, weave through traffic, or cut off other drivers.
Do not use handheld or hands-free cell phones while driving. Stop at intersections and give the right-of-way to other vehicles and pedestrians. Check tires for proper inflation.

City of San Diego Catch Basin Inlet Cleaning Pilot Study Health and Safety Plan
Project No.: 5013-11-0023 C-12 4 November 2011
5. Traffic Hazards: Be aware of vehicles in your area. Make eye contact with approaching vehicle operators. In dry weather, a reflective vest should be worn for maximum visibility in high-traffic areas. Use traffic cones around the work zone in high-traffic areas. At least two persons must be present to perform any work in high-traffic areas. One of these
persons must monitor approaching traffic for any potential hazards. Watch out for moving vehicles and equipment and equipment.
6. Environmental and Biohazards: Dangerous animals and insect bites and stings – Be aware of your surroundings and watch for
dangerous animals and insects such as spiders and snakes. Wear appropriate clothing such as pants, long sleeved shirts, and steel toe boots.
Watch for Poison Oak. 7. Equipment Hazards:
Pinch Points – Use proper equipment in the prescribed manner in conjunction with proper lifting techniques to avoid pinch points.
Wear leather or canvas gloves - to protect the hands when performing manual labor, such as moving manhole covers
8. Decontamination Procedures: If an exposure or eye contact occurs, respond with appropriate first aid and immediately notify
the supervisor. 9. Other:
The supervisor will review any other significant safety matters specific to sampling and observation activities at this base.
10. Review of Emergency Procedures: In case of emergency, immediately dial 911.

City of San Diego Catch Basin Inlet Cleaning Pilot Study Health and Safety Plan
Project No.: 5013-11-0023 C-13 4 November 2011
AttendeesDate Site Activity Topic Discussed Printed Name Signature
Meeting Conducted by:
Name: ___________________________ Title: ___________________________
Signature: ________________________ Date: ___________________________

A P P E N D I X D
F I E L D F O R M S

Catch Basin Inlet Cleaning Pilot StudyCity of San Diego
Monitoring PlanNovember 2011
D-1
Catch Basin System: Date Time
Determine Moisture content (MC). Must be less than 25% to collect samples.
MC Sample 0% 0-25% 25-50% 50-75% 75-100%
1 ___ ____ ____ ____ ____
2 ___ ____ ____ ____ ____
3 ___ ____ ____ ____ ____ Select Predominante Range =4 ___ ____ ____ ____ ____ %5 ___ ____ ____ ____ ____ 6 ___ ____ ____ ____ ____
VISUAL OBSERVATIONS
TRASHType
(Circle all that apply)
ORGANICSType(Circle all that apply)
ESTIMATE THE PERCENTAGE OF EACH COMPONENT:
% Total Sediment % Total Trash % Total Organics
% Others Describe:
Field Crew
Catch Basin Debris Data Sheet
Operations Yard
Plastic Metals Paper Products Glass Food Scraps Rubber Wood Styrofoam Food Wrappers Other:
Leaves Grass Twigs Other______________________________________________________
(a)Squeeze a handful of soil firmly to make ball test.Source: Miles, D.L. and Broner,I. 1998. Estimating Soil Moisture. Irrigation Colorado State University Extension.no.4.700
Soil Moisture Interpretation ChartSoil
MoistureDeficiency
Moderately Coarse Texture Medium Texture Fine and Very Fine Texture
0%(field
capacity)Upon squeezing, no free water appears on soil but wet outline of ball is left on hand.
0-25%Forms weak ball, breakseasily when bounced in hand.(a)
Forms ball, very pliable,slicks readily.(a)
Easily ribbons out betweenthumb forefinger.(a)
25-50% Will form ball, but falls apartwhen bounced in hand.(a)
Forms ball, slicksunder pressure.(a)
Forms ball, will ribbon out betweenthumb and forefinger.(a)
50-75% Appears dry, will not formball with pressure.(a)
Crumbly, holds togetherfrom pressure.(a)
Somewhat pliable, will ballunder pressure.(a)
75-100% Dry, loose, flows through fingers.
Powdery, crumbles easily.
Hard, difficult to break into powder.
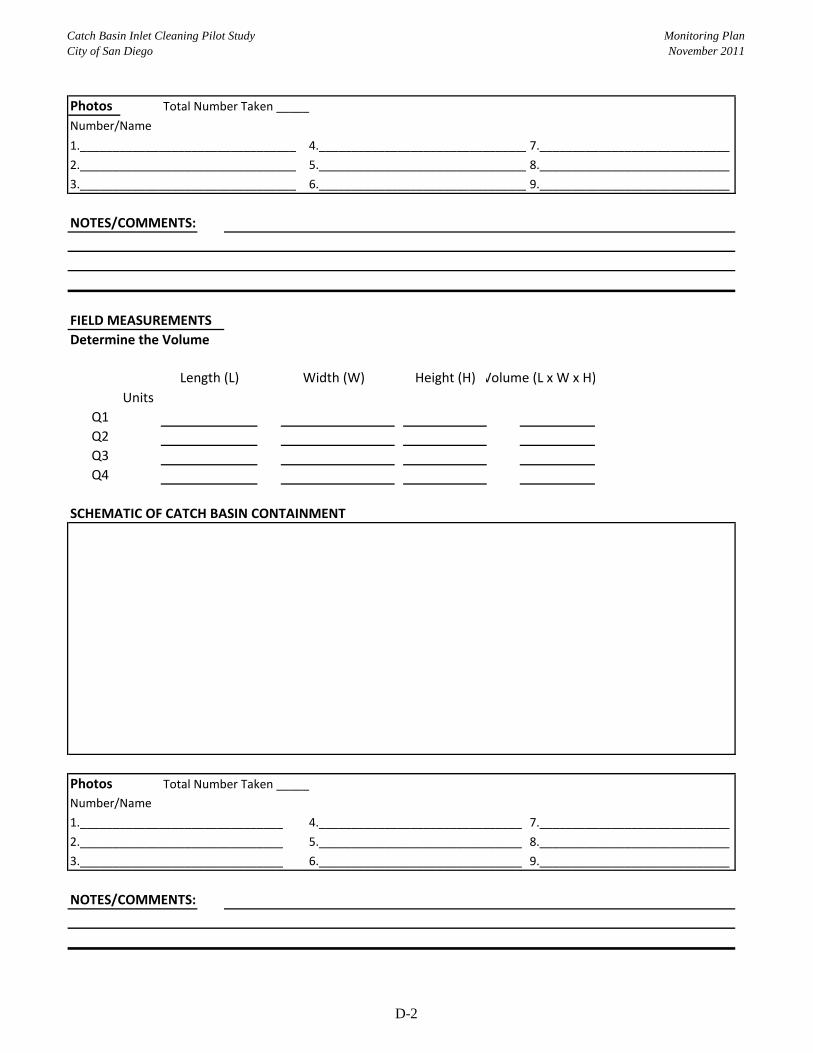
Catch Basin Inlet Cleaning Pilot StudyCity of San Diego
Monitoring PlanNovember 2011
D-2
Photos Total Number Taken _____
Number/Name
1._________________________________ 4.________________________________7._____________________________
2._________________________________ 5.________________________________8._____________________________
3._________________________________ 6.________________________________9._____________________________
NOTES/COMMENTS:
FIELD MEASUREMENTSDetermine the Volume
UnitsQ1Q2Q3Q4
SCHEMATIC OF CATCH BASIN CONTAINMENT
Photos Total Number Taken _____
Number/Name
1._______________________________ 4._______________________________ 7._____________________________
2._______________________________ 5._______________________________ 8._____________________________
3._______________________________ 6._______________________________ 9._____________________________
NOTES/COMMENTS:
Width (W)Length (L) Volume (L x W x H)Height (H)
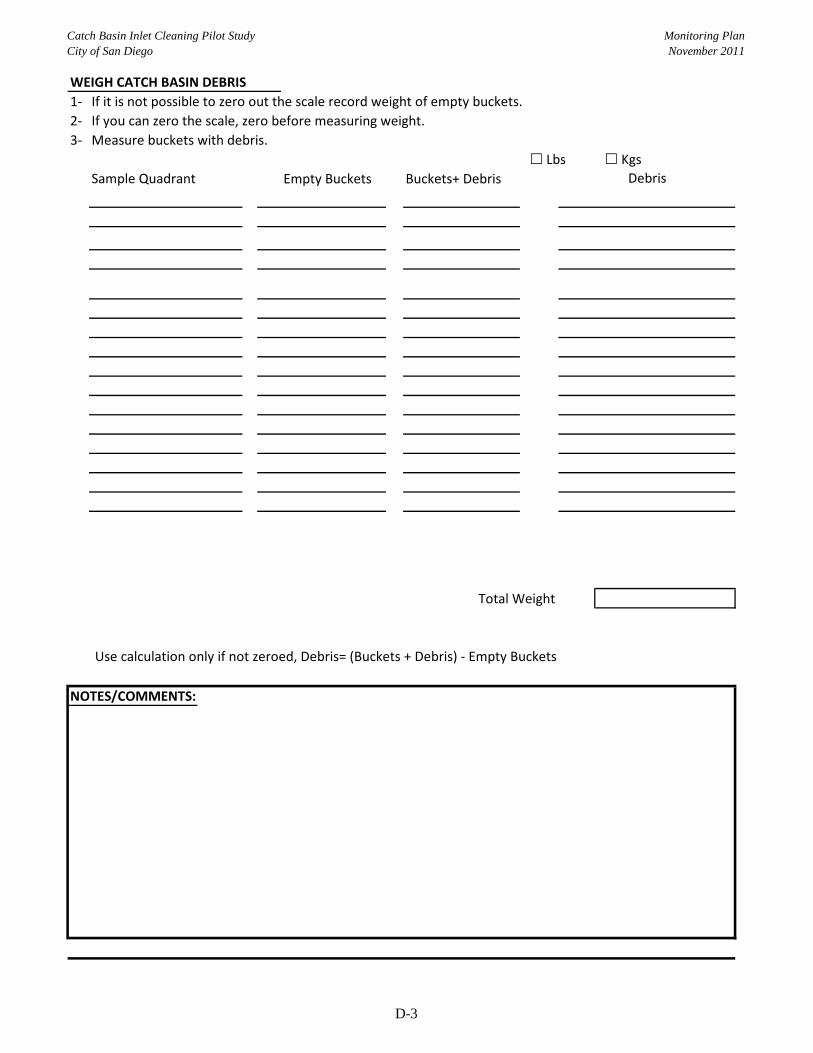
Catch Basin Inlet Cleaning Pilot StudyCity of San Diego
Monitoring PlanNovember 2011
D-3
WEIGH CATCH BASIN DEBRIS1-2-3-
Lbs KgsSample Quadrant Empty Buckets Buckets+ Debris
Total Weight
Use calculation only if not zeroed, Debris= (Buckets + Debris) - Empty Buckets
NOTES/COMMENTS:
Debris
If it is not possible to zero out the scale record weight of empty buckets. If you can zero the scale, zero before measuring weight.Measure buckets with debris.
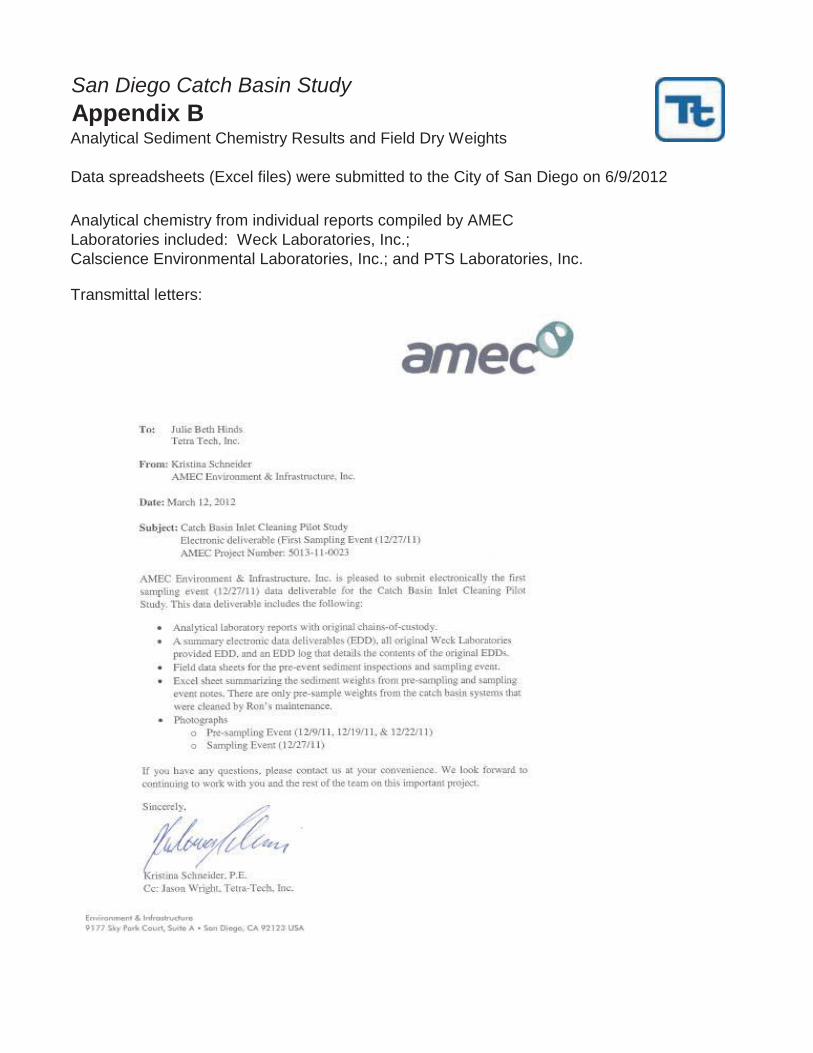
San Diego Catch Basin StudyAppendix BAnalytical Sediment Chemistry Results and Field Dry Weights
Data spreadsheets (Excel files) were submitted to the City of San Diego on 6/9/2012
Analytical chemistry from individual reports compiled by AMEC Laboratories included: Weck Laboratories, Inc.; Calscience Environmental Laboratories, Inc.; and PTS Laboratories, Inc.
Transmittal letters: