catchment area treatment (cat) - forests …forestsclearance.nic.in/writereaddata/addinfo/0_0...2 1....
TRANSCRIPT

1
GOVERNMENT OF ODISHA DEPARTMENT OF WATER RESOURCES
CATCHMENT AREA TREATMENT (CAT)
FOR UPPER LANTH MEDIUM IRRIGATION PROJECT UNDER BELPARA AND KHAPRAKHOL BLOCK
IN THE BOLANGIR DISTRICT, ODISHA
ASST. EXECUTIVE ENGINEER EXECUTIVE ENGINEER PADAMPUR INV. SUB- DIVISION – (IV) PADAMPUR INVESTIGATION DIVISION PADAMPUR, BARGARH PADAMPUR, BARGARH
2
1. Introduction: The Catchment Area Treatment (CAT) of Upper Lanth Medium Irrigation Project targets overall improvement in the environmental conditions of the region. All the activities are aimed at treating the degraded and potential areas of severe soil erosion. The plan provides benefits due to biological and engineering measures. This Plan would cover the following aspects: ● Identification of free draining catchment ● Assessment of Land Use, Soil, Slope in the Upper Lanth catchment based on Remote
Sensing (RS)/Geographical Information System (GIS) and validation through field survey.
● Erosion levels the watershed and prioritization of watersheds will be done by
appropriate methods. ● As per the requirement of Ministry of Environment & Forests and Climate
Change,(MoEF & CC) Government of India, the treatment measures will be proposed for the area falling higher priority erosion categories. Both Engineering measures as well as Biological treatment measures will be proposed in the CAT plan.
● The cost of the administrative set up and mitigative measures will include
recommendation from State Forest Department for all forest lands and from the Soil Conservation Department for non-forest land.
2. Need: Reservoirs formed by dams on rivers are subject to sedimentation. The process of sedimentation embodies the sequential processes of erosion, entertainment, transportation, deposition and compaction of sediment. The study of erosion and sediment yield from catchments is of utmost importance as the deposition of sediment in reservoir reduces its capacity and thus affecting the water availability for the designated use. The eroded sediment from catchment when deposited on streambeds and banks causes threading of river reach. The removal of top fertile soil form catchment adversely affects the agricultural production. Thus a well-designed catchment area treatment plan is essential to ameliorate the above-mentioned adverse process of soil erosion. The Catchment Area Treatment (CAT) plan highlights the management techniques to control erosion in the catchment area of a water resource project. The life span of a reservoir is
3
greatly reduced due to erosion in the catchment area. Adequate preventive measures are thus needed for the treatment of catchment for its stabilization against future erosion. Quantifying soil erosion and reservoir sedimentation is necessary for prioritizing catchments for treatment and development of a suitable treatment mix. It is therefore, also required that the effect of various treatments on controlling soil erosion are quantitatively known. River gauging data are the best information source for undertaking the above activities. As such data are not available for this catchment, so estimation procedure is adopted. At the present level of data availability and also based on the past experience, Sedimentation (Slit) Yield Index (SYI) appears to be an acceptable parameter for use in catchment prioritization work. SYI is calculated using an empirical formula. Based on the numerical value of SYI, catchments are categorised into five priority classes from very high (SYI>1300) priority to very low (SYI<1000) priority. The method was proposed by All India Soil Survey and Land Use Planning (AISSLUP) currently known as Soil and Land Use Survey of India (SLUSI) based on several studies. The method has been used to prioritize catchments in India totalling in area of millions of hectares. It is reported that, the SYI procedure is fairly reliable for determining priority watersheds. The empiricism in this method is manifest in the selection of unit area (mapping unit) and assigning an appropriate value of delivery ratio to it. SYI method is widely used because of the fact that it is easy to use and lesser data requirement. Moreover, it can applied to larger areas like sub watersheds etc. 3. Methodology Adopted: Database on natural resources, terrain conditions, soil type of the catchment area is a pre-requisite to prepare CAT Plan. Various thematic maps were prepared and used in preparation of the CAT plan, in Geographic Information System (GIS) platform. The methodology adopted for development of CAT plan for the project is as under: ● Catchment boundary delineation from Survey of India Topo sheets.
Watershed boundary from watershed Atlas of India and website of Soil and Land Use Survey of India(SLUSI) and the micro watershed boundary collected from Watershed Mission of Odisha.
Land Use/Land Cover map preparation from recent 5.8m resolution LISS-IV Multi Spectral Satellite Image.
● Contour digitization from Survey of India OSM topo sheet and generation of slope
map.
● Soil Map preparation from National Bureau of Soil Survey and Land Use Planning (NBSS & LUP)
4
● Assigning weight age value of mapping units based on slope land use and soil texture and Delivery ratio based on distance from nearest stream.
● Estimation of Soil Loss using Silt Yield Index. ● Selection of locations of treatment and CAT plan.
● Cost Estimate
Thematic data integration and erosion index modelling was done using relevant map layers in GIS. Silt Yield Index (SYI) of various micro watersheds within the free catchment was estimated. Watershed management approach were proposed for optimal use of soil and water resources within the catchment with the broad objective of
● Increasing infiltration into soil
● Control excessive run off
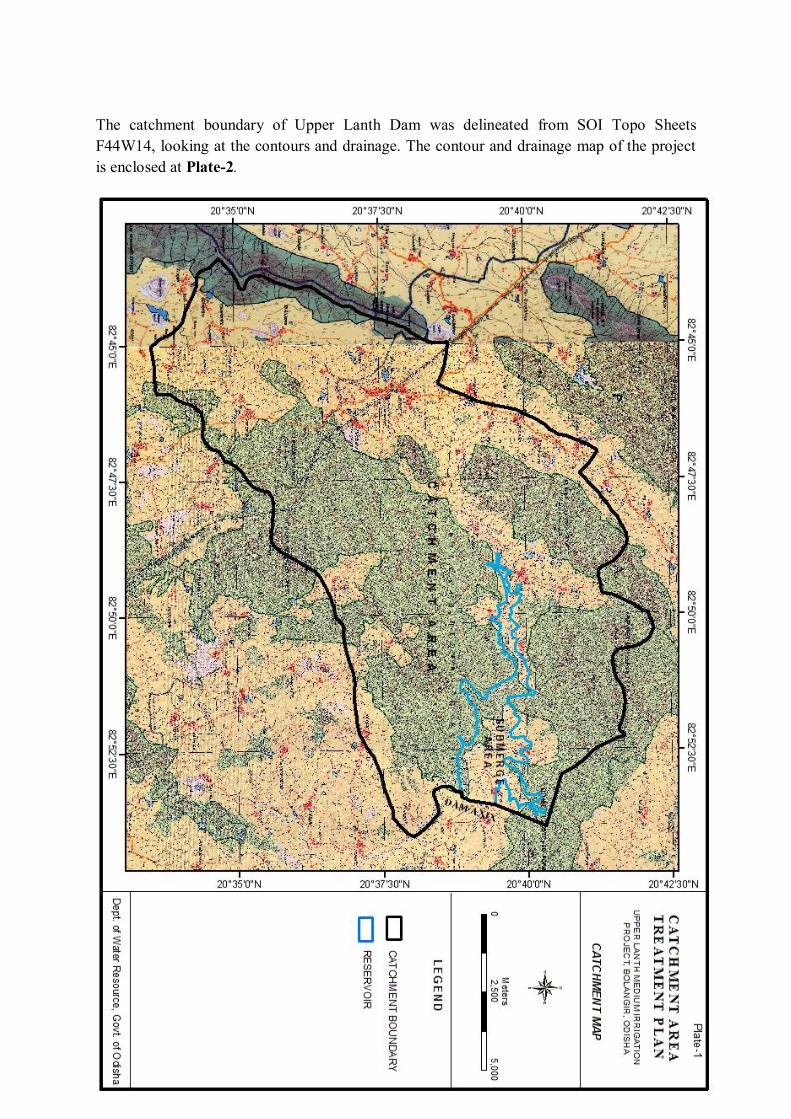
● Manage & utilize run off for useful purpose 4. Salient features of Upper Lanth Dam Catchments: Lanth River is a tributary to Tel River which is a major river system of Odisha.The River originates in Manguri Paharah and enters Khaprakhol Block near village Bender and joins Tel on right about 119.851km downstream of Bolangir. The total length of the stream from the origin to confluence with Tel River is about 99.405 km. Upper Lanth Dam intercepts the river at RD 12 km. The total catchment area of the proposed project at dam site is 150.31 km2 .The catchment map of Upper Lanth Dam project is enclosed at Plate-I. 5. Thematic Map Generation As mentioned in the methodology, various thematic layers like catchment, watershed, drainage, contour, slope, Land use, soil were prepared in Geographical Information System (GIS) platform using satellite image, OSM Sol Topo Sheet and other secondary source data. For Seamless integration of different thematic layers and interactive spatial analysis, the themes were generated UTM (Universal Transverse Mercator) projection system. This projection system is used in the recent publication Open Series Map (OSM) of SOI and is also suggested in National map Policy. Datum used for the projection in WGS 1984 and Zone is UTM 44 North. 5.1. Catchment Map
5
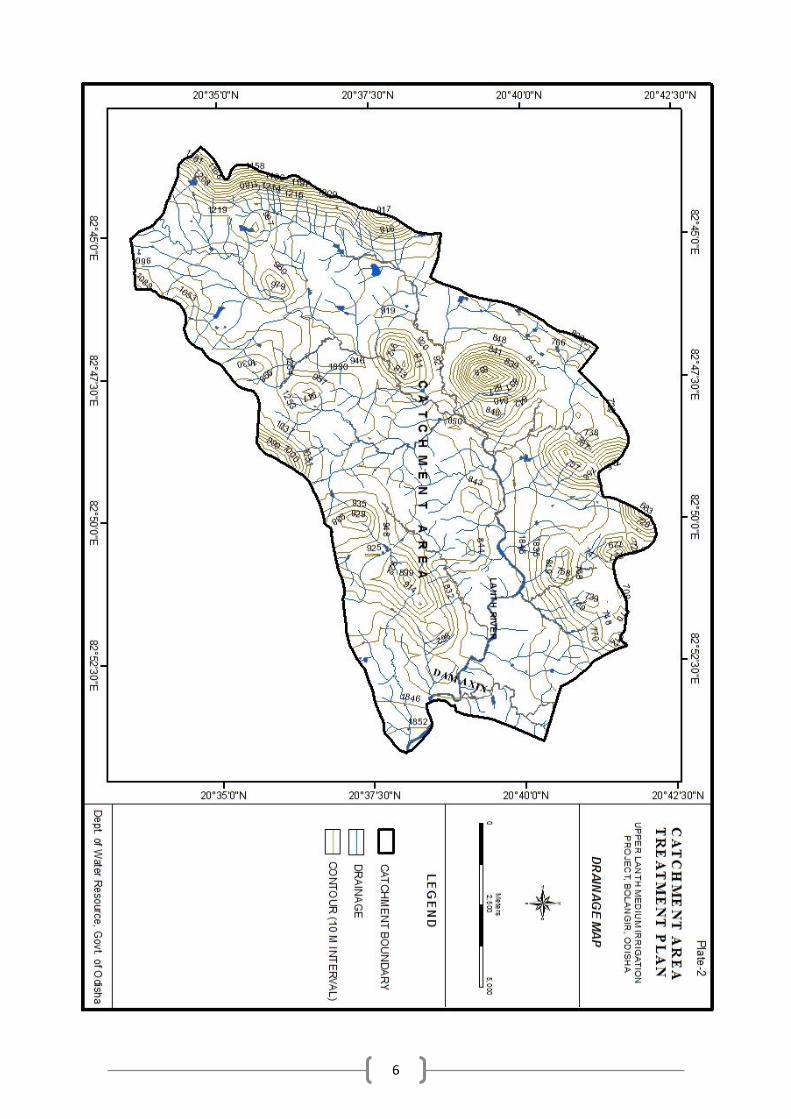
The catchment boundary of Upper Lanth Dam was delineated from SOI Topo Sheets F44W14, looking at the contours and drainage. The contour and drainage map of the project is enclosed at Plate-2.
6
7
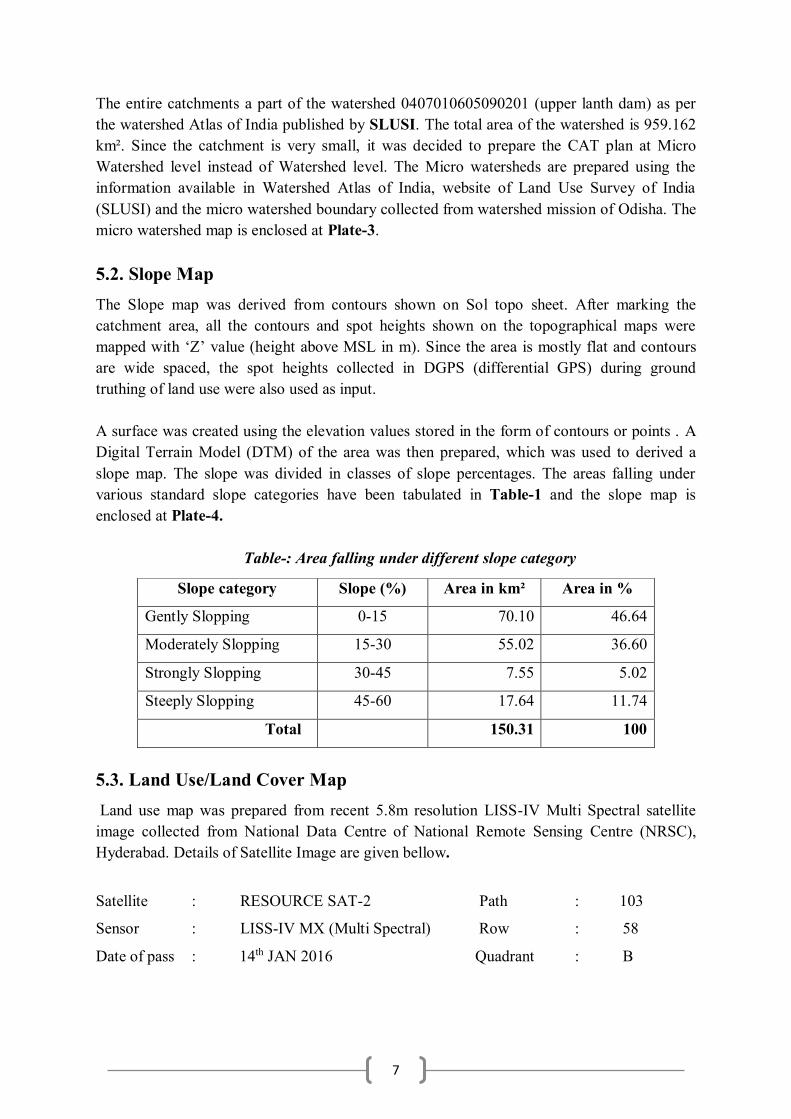
The entire catchments a part of the watershed 0407010605090201 (upper lanth dam) as per the watershed Atlas of India published by SLUSI. The total area of the watershed is 959.162 km². Since the catchment is very small, it was decided to prepare the CAT plan at Micro Watershed level instead of Watershed level. The Micro watersheds are prepared using the information available in Watershed Atlas of India, website of Land Use Survey of India (SLUSI) and the micro watershed boundary collected from watershed mission of Odisha. The micro watershed map is enclosed at Plate-3. 5.2. Slope Map The Slope map was derived from contours shown on Sol topo sheet. After marking the catchment area, all the contours and spot heights shown on the topographical maps were mapped with ‘Z’ value (height above MSL in m). Since the area is mostly flat and contours are wide spaced, the spot heights collected in DGPS (differential GPS) during ground truthing of land use were also used as input. A surface was created using the elevation values stored in the form of contours or points . A Digital Terrain Model (DTM) of the area was then prepared, which was used to derived a slope map. The slope was divided in classes of slope percentages. The areas falling under various standard slope categories have been tabulated in Table-1 and the slope map is enclosed at Plate-4. Table-: Area falling under different slope category
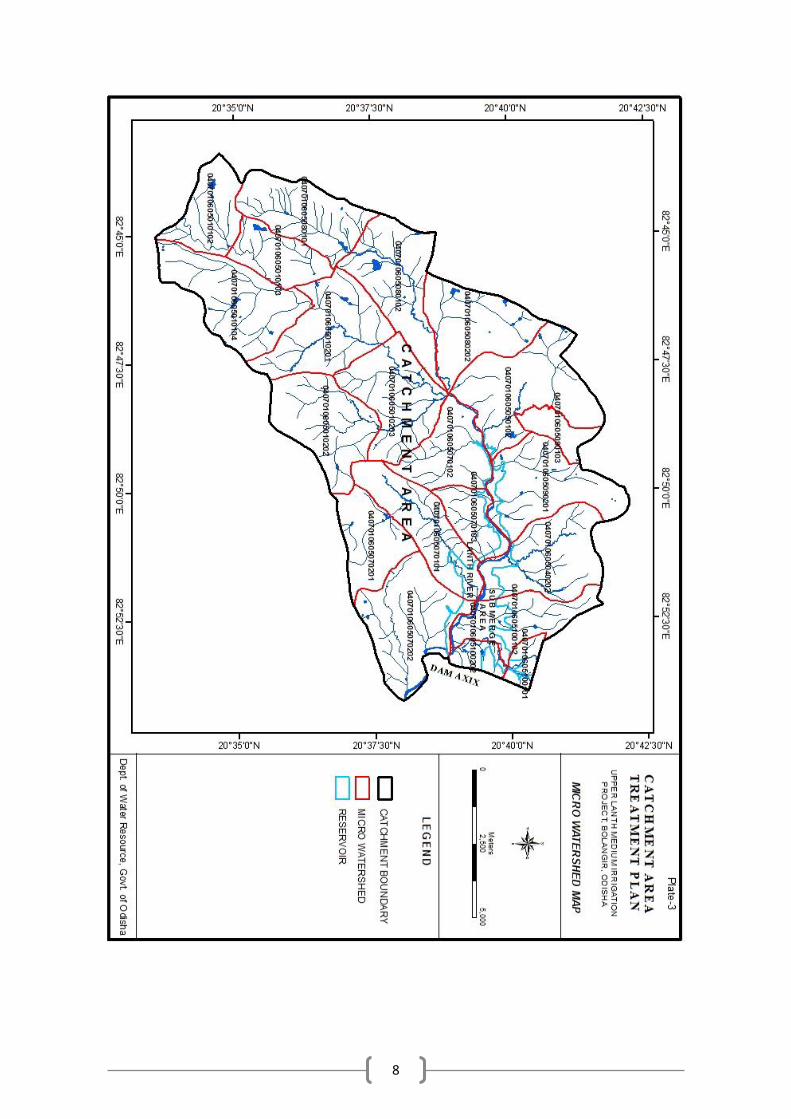
5.3. Land Use/Land Cover Map Land use map was prepared from recent 5.8m resolution LISS-IV Multi Spectral satellite image collected from National Data Centre of National Remote Sensing Centre (NRSC), Hyderabad. Details of Satellite Image are given bellow.
Satellite : RESOURCE SAT-2 Path : 103
Sensor : LISS-IV MX (Multi Spectral) Row : 58
Date of pass : 14th JAN 2016 Quadrant : B
Slope category Slope (%) Area in km² Area in %
Gently Slopping 0-15 70.10 46.64
Moderately Slopping 15-30 55.02 36.60
Strongly Slopping 30-45 7.55 5.02
Steeply Slopping 45-60 17.64 11.74
Total 150.31 100
8

9

10
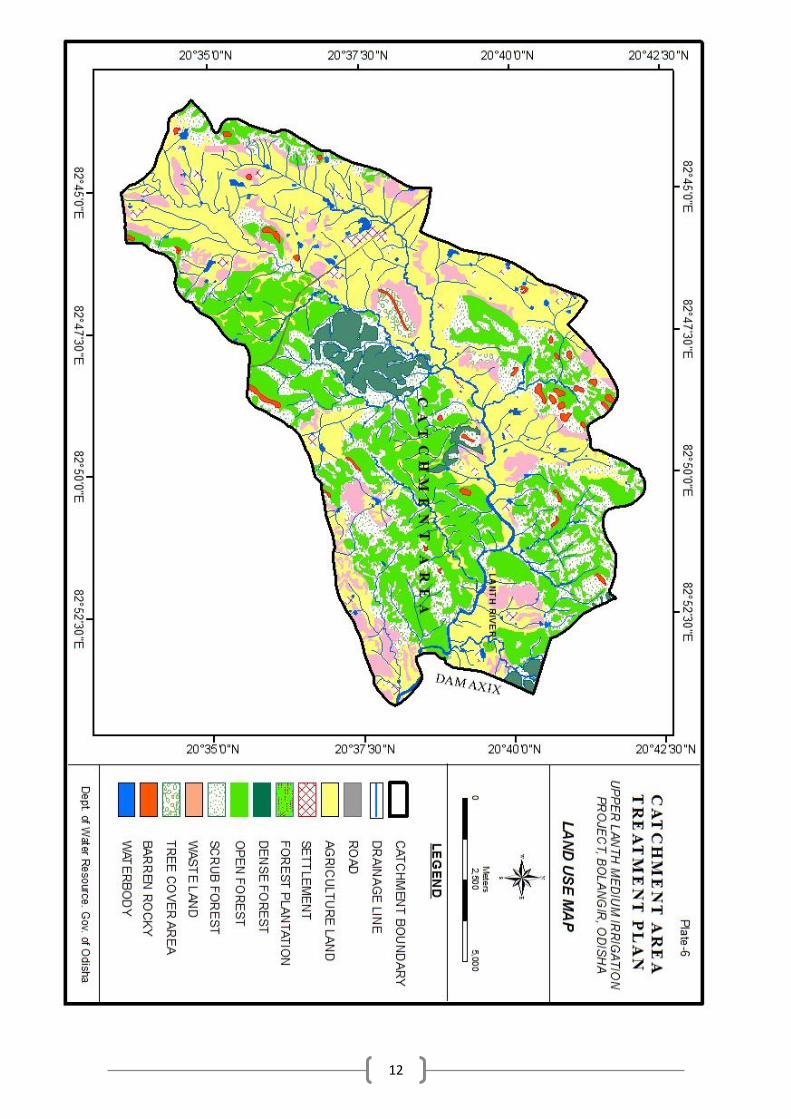
The image was geo-referenced using the common Ground Control Points (GCP) of Survey of India topographical sheets and satellite image with the help of feature registration techniques in standard image processing software. The satellite image map is enclosed at Plate-5. As the catchment area is very small, visual interpretation of the geo-referenced satellite data was done by qualified professionals using standard enhancement techniques followed by detail ground truthing to enhance the quality of image interpretation. The classified land use map of the catchment area is depicted in Table-2 and the map is enclosed at Plate-6. Table-2: Area falling under different Land Use
Description Area in Km2 Area in % Settlement 1.72 1.21
Road 0.16 0.11
Agriculture 55.06 36.54
Dense Forest 4.88 3.31
Open Forest 42.12 27.96
Scrub Forest 28.12 18.70
Tree cover area 3.06 2.10
Waste Land 12.72 8.44 Forest Plantation 0.09 0.06
Barren Rocky 1.32 0.87
Water body 1.06 0.70
Total 150.31 100.00
5.4. Soil map Soil map was prepared by digitalizing the soil map collected from National Bureau of Soil Survey and Land Use Planning (NBSS & LUP) for Odisha and undivided Madhya Pradesh. The soil map is depicted at Plate-7 and catchment area coming under different soil category is depicted in Table-3.
11
12

13

14
Table-3: Area falling under different soil category
Land Capability Class
Land Category Soil Depth Slope Class Soil Texture
Area in Km2
Area in %
I Agricultural Land Deep Nearly Level / Gently Slope
Clay 25.76 17.09
II Agricultural Land Deep Moderate Loamy Sandy
3.70 2.45
IV Cultivable Land Moderate to poor
Moderate Sandy Clay 52.19 34.64
V Cultivable Waste Land/ Fallow Land
Moderate to poor
Moderate Strong
Sandy Loamy
66.52 44.15
VI Waste Land Poor Strongly Slope
Clay 25.76 17.09
VIII Barren Rocky/Water Logged Area
Present in different
Slope
Present in different
Slope
Loamy Sandy
3.70 2.45
TOTAL 177.63 117.87
6. Estimate of Soil Intensity Using Silt Yield Index (SYI) method The sedimentation (silt) Yield Index Model (SYI), considering sedimentation as product of erosivity, erodibility and arial extent was conceptualized in the AISLUS , as early as 1969 and has been in operational use since then to meet the requirements of prioritization of smaller hydrologic units. The erosivity determinants are the climatic factors and soil and land attributes that have direct or reciprocal bearing on the unit of the detached soil material.
The Silt Yield Index (SYI) is defined as the Yield per unit area and SYI value for hydrologic unit is obtained by taking the weighted arithmetic mean over the entire area of the hydrologic unit by using suitable empirical equation.
In SYI methodology, each Erosion Intensity Unit (EIU) is assigned a weightage value. When considered collectively, the weightage value represents approximately the relative comparative erosion intensity. The slope, soil and land use theme of the catchment were combined using union tool in GIS and EIU were formed using different combination of soil, slope and land use categories.
SYI was calculated using following empirical formula:
SYI = ∑ (Ai×Wi) × Di ×100 [ Where i = 1 to n ( n is the No. (EIU)]
Aw
Ai= Area of ith unit (EIU) Di = delivery Ratio of the ith unit EIU
Wi = Weightage value of the ith unit EIU Aw = Total area of Micro- Watershed
15
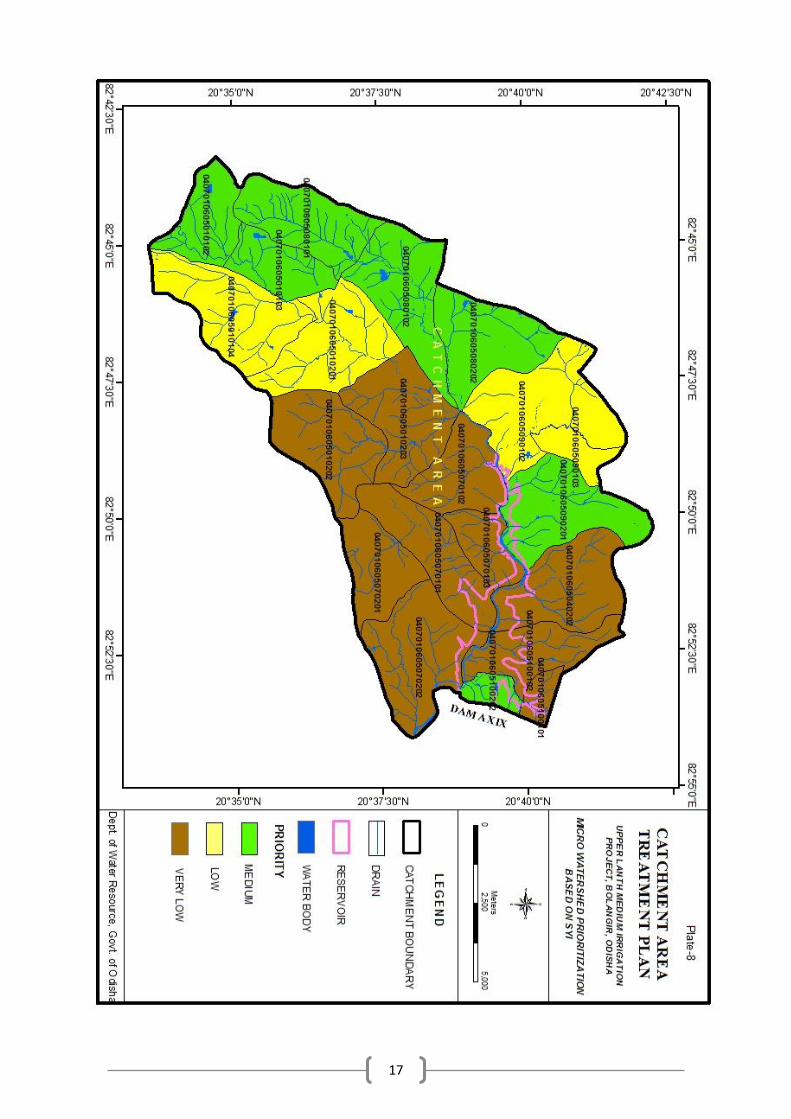
Weightage Value (W)
Weightage Value is a combination of two factors K and X. A basic Factor of K =10 was used in determining the weightage values. The value of 10 indicates a static condition of equilibrium between erosion and deposition. Any addition to the factor of K= (10+X) is suggestive of erosion in ascending order whereas subtraction, i.e. (10-X) is indicative of deposition possibilities.
Delivery Ratio (D)
Delivery ratios were assigned for each of the erosion intensity unit. The delivery ratio suggests the percentage of eroded material that finally finds entry into reservoir. Area of each EUI in each micro watershed was then estimated.
Delivery ratios were assigned to all erosion intensity units depending upon their distance from the nearest stream. The criteria adopted for assigning the delivery ratio are as follows:
Nearest stream Delivery Ratio 0– 0.9 1.00 1.0-2.0 0.95 2.1-5.0 0.90
5.1-15.0 0.80 15.1-30.0 0.70
1.0km, 2.0 km, 5.0 km, 15.0 km and 30.0 km buffers were created around the main stream and reservoir using GIS .EIUs falling in different buffer zone were assigned the delivery ratio of the respective buffer zone.
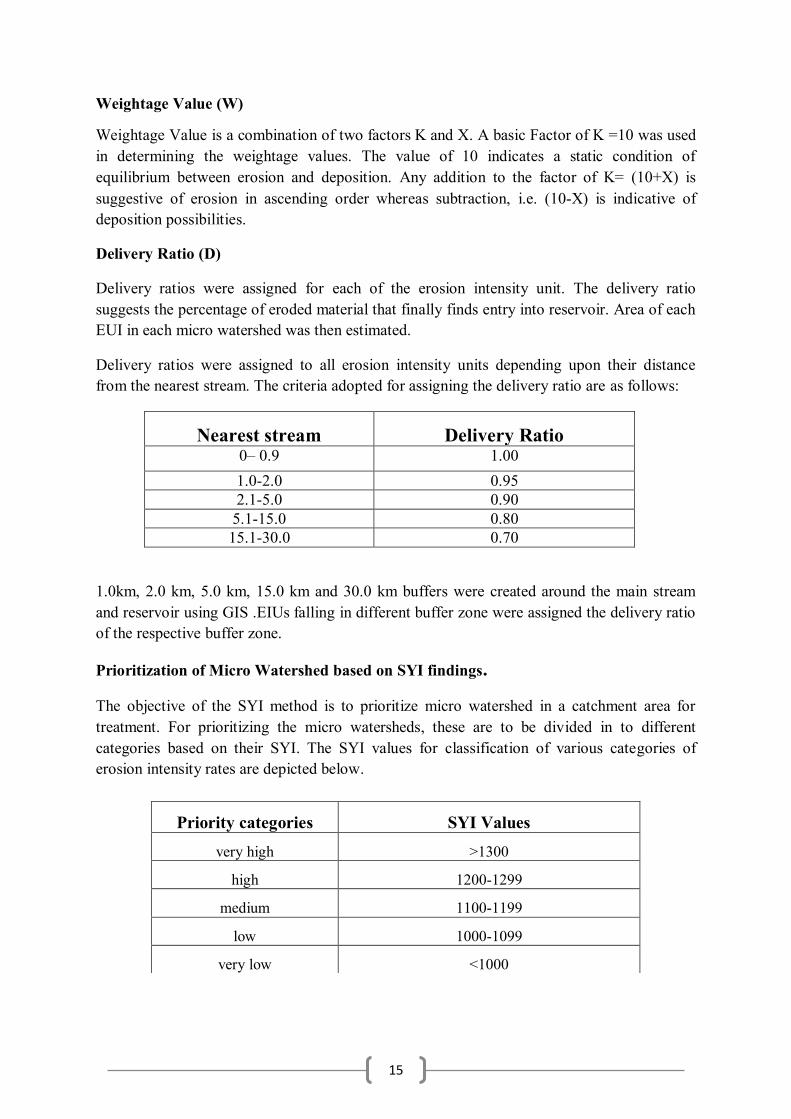
Prioritization of Micro Watershed based on SYI findings.
The objective of the SYI method is to prioritize micro watershed in a catchment area for treatment. For prioritizing the micro watersheds, these are to be divided in to different categories based on their SYI. The SYI values for classification of various categories of erosion intensity rates are depicted below.
Priority categories SYI Values very high >1300
high 1200-1299
medium 1100-1199
low 1000-1099
very low <1000

16
The micro watershed wise SYI and category of erosion is depicted in Table-4 and Plate-8.
Table-4: Soil Erosion Priority Category of Micro Watersheds
SL MWS code Priority SYI 1 0407010605010102 MEDIUM 1193 2 0407010605010103 MEDIUM 1195 3 0407010605080101 MEDIUM 1191 4 0407010605080102 MEDIUM 1191 5 0407010605080202 MEDIUM 1190 6 0407010605090201 MEDIUM 1192 7 0407010605100202 MEDIUM 1197 8 0407010605010104 LOW 1083 9 0407010605010201 LOW 1082
10 0407010605090102 LOW 1085 11 0407010605090103 LOW 1079 12 0407010605010202 VERY LOW 981 13 0407010605010203 VERY LOW 979 14 0407010605040202 VERY LOW 981 15 0407010605070101 VERY LOW 981 16 0407010605070102 VERY LOW 980 17 0407010605070103 VERY LOW 979 18 0407010605070201 VERY LOW 980 19 0407010605070202 VERY LOW 981 20 0407010605100101 VERY LOW 980 21 0407010605100102 VERY LOW 980
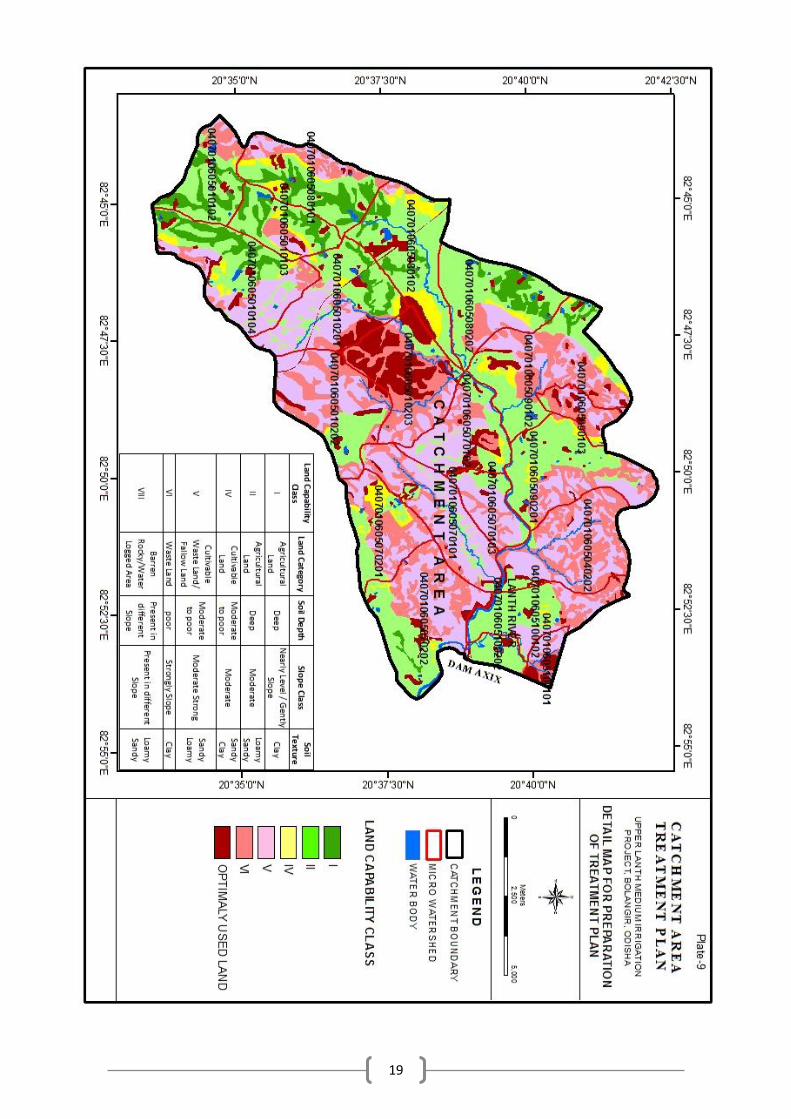
Area under very high categories is proposed to be treated at the project proponent’s cost. A
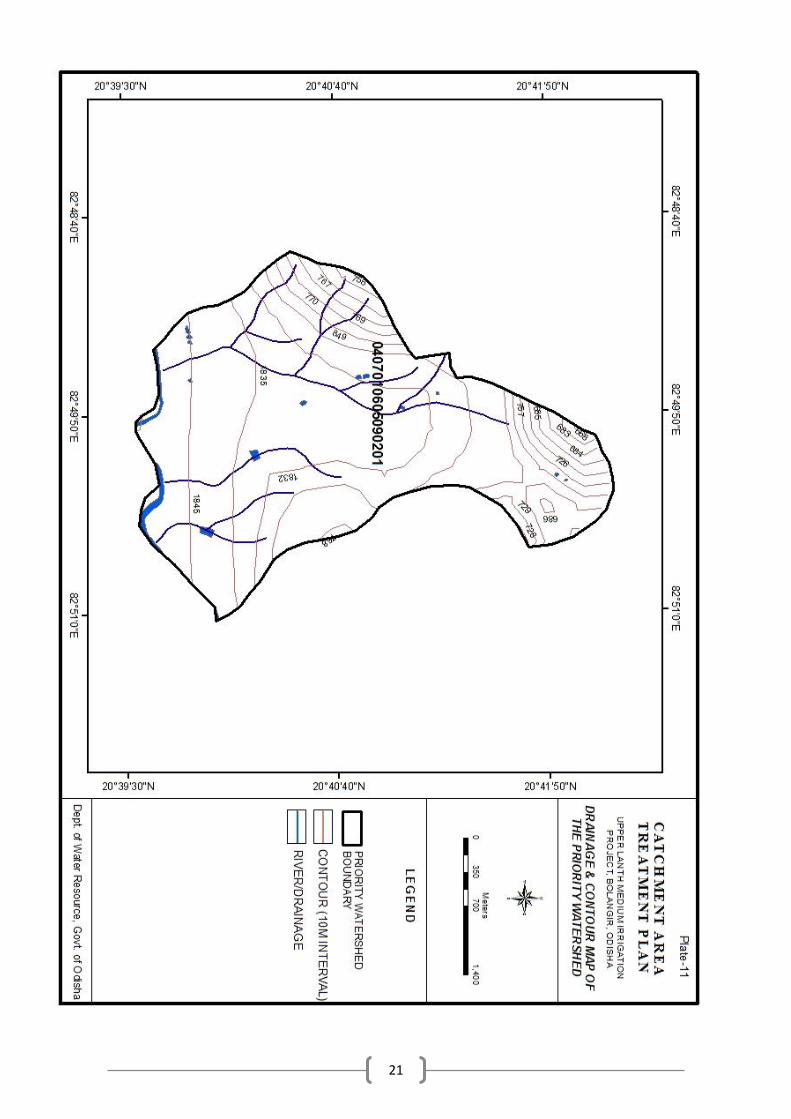
base map showing land use, reserve forest boundary, slope, major drains and priority watershed is enclosed at Plate-9 for micro planning of the catchment area treatment plan as the steep areas are more prone to soil erosion, looking at the land use and topography 0407010605090201 micro watershed (area 959.162 Ha) was finally selected for catchment area treatment plan which is directly draining to the Lanth river .The topographic map, drainage and contour map and land use and slope map of the sub watershed is enclosed at Plate-10, 11, and 12 respectively.
6.1. Demography of the watershed
Village Total Population
Male Female SC ST Literate Total Worker
Bender 1220 613 607 128 353 198 477 Bhaluchuan 162 76 86 0 96 76 79 Badimal 254 126 128 67 136 142 123 Bharuamunda 2220 1095 1125 294 703 1150 1145
17
18
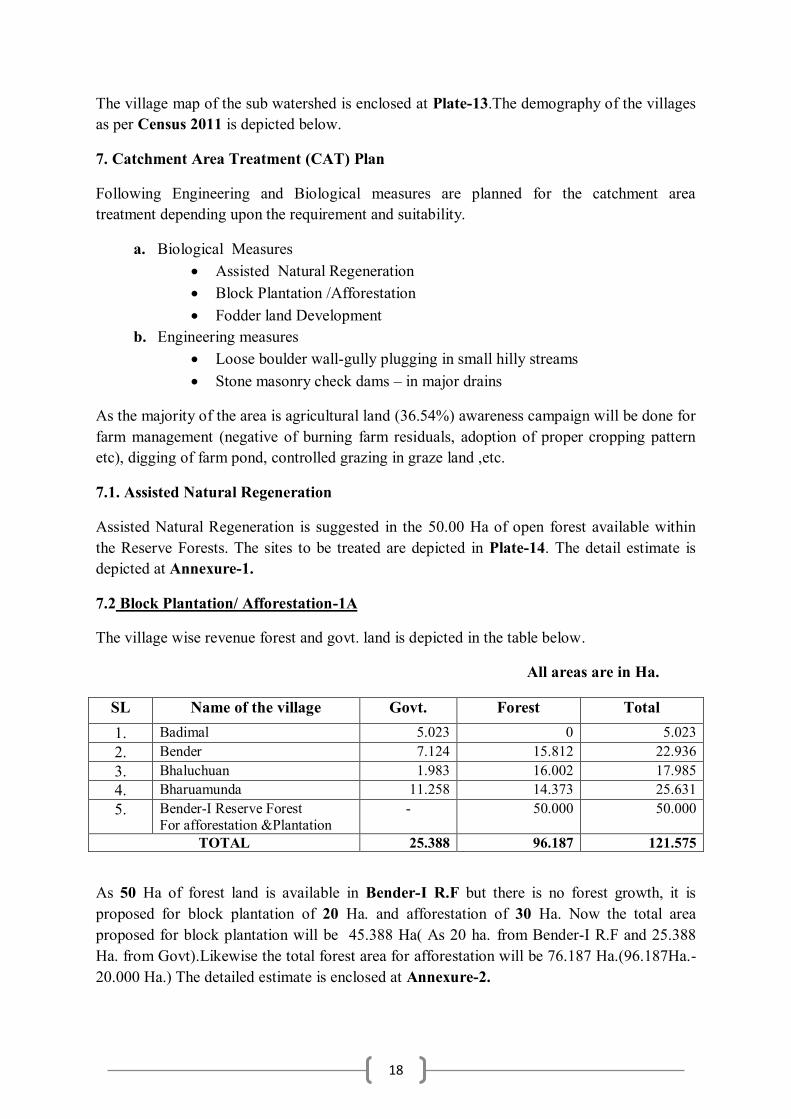
The village map of the sub watershed is enclosed at Plate-13.The demography of the villages as per Census 2011 is depicted below.
7. Catchment Area Treatment (CAT) Plan
Following Engineering and Biological measures are planned for the catchment area treatment depending upon the requirement and suitability.
a. Biological Measures Assisted Natural Regeneration Block Plantation /Afforestation Fodder land Development
b. Engineering measures Loose boulder wall-gully plugging in small hilly streams Stone masonry check dams – in major drains
As the majority of the area is agricultural land (36.54%) awareness campaign will be done for farm management (negative of burning farm residuals, adoption of proper cropping pattern etc), digging of farm pond, controlled grazing in graze land ,etc.
7.1. Assisted Natural Regeneration
Assisted Natural Regeneration is suggested in the 50.00 Ha of open forest available within the Reserve Forests. The sites to be treated are depicted in Plate-14. The detail estimate is depicted at Annexure-1.
7.2 Block Plantation/ Afforestation-1A
The village wise revenue forest and govt. land is depicted in the table below.
All areas are in Ha.
SL Name of the village Govt. Forest Total 1. Badimal 5.023 0 5.023 2. Bender 7.124 15.812 22.936 3. Bhaluchuan 1.983 16.002 17.985 4. Bharuamunda 11.258 14.373 25.631 5. Bender-I Reserve Forest
For afforestation &Plantation - 50.000 50.000
TOTAL 25.388 96.187 121.575
As 50 Ha of forest land is available in Bender-I R.F but there is no forest growth, it is proposed for block plantation of 20 Ha. and afforestation of 30 Ha. Now the total area proposed for block plantation will be 45.388 Ha( As 20 ha. from Bender-I R.F and 25.388 Ha. from Govt).Likewise the total forest area for afforestation will be 76.187 Ha.(96.187Ha.-20.000 Ha.) The detailed estimate is enclosed at Annexure-2.
19

20
21

22

23

24

25
7.3. Fodder land development
To minimize the pressure on forest for grazing, it is suggested to develop fodder land in the Watershed. All areas are in Ha
Sl No Villages No of Patches
Gochara Population
1. Badimal 0 0 254 2. Bender 33 31.650 1220 3. Bhaluchuan 23 17.639 162 4. Bharuamunda 9 10.276 2220
59.565
Looking at the availability of Gochar land and population, it is proposed to develop 15 Ha. of Gochar land for fodder development in Badimal, Bender, Bhaluchuan, and Bharuamunda. The detail estimate is given at Annexure-3.
7.4 Loose Boulder Wall-gully plugging In Small Hilly Streams
Gully Erosion, including ephemeral gully erosion, refers to the cutting of narrow channels resulting from concentration of sheet and rill flow of runoff water. Ephemeral gullies are small channels of approximately 3 to 12 inches deep. Gullies may be one to several feet deep. Gully erosion occurs when rill erosion is neglected. The tiny grooves develop into wider and deeper channels, which may assume a huge size. This state is called ‘gully’ erosion. Gullies
are the most widen with every heavy rainfall.
Gully plugging work is required for reduction of runoff velocities within permissible limits and for controlling gully erosion of micro-watershed.
Appropriate gully plugging work would be selected from bush/wood check dam, Pall-siding works, gabion, structure, sunken pits etc.
A provision is kept for three numbers of gully plugging in the hilly streams. Estimate at Annexure-4.
7.5 Stone masonry check dams – in major drains
Check dams range in size, shape and cost. It is possible to build them out of easily available materials and even at a very little cost. Decision of building such a dam depends on its location. Essentially a check dam has an earthen dam and masonry spillway.
It cuts the velocity and reduces erosive activity. The stored water improves soil moisture of the adjoining area and allows percolation to recharge the aquifers Spacing between the check dams should be such that water spread of one should be beyond the water spread of the other Height depends on the bank height, varies from 1 meter to 3 meter and length varies from less than 3m to 10 m. A provision of 4 no. Stone masonry checks dams.

26
The typical Estimate of earthen of earthen check dam with concrete core is depicted at Annexure-5
The location of proposals for all treatments other than ANR activities are depicted in Plate-15. The detail year wise cash flow estimate is depicted at Annexure-6.
Cost Estimate:
SL Item Rate in Rs.
Unit Physical Financial (Rs. In Lakhs)
Biological Measure 1 Afforestation including
maintenance 85,824 Ha 76
(As per cl. no. 7.2)
65.23
2 Enrichment of plantation / Re-densification
29,170 Ha 45 (As per cl.
no. 7.2)
13.13
3 Fodder land development 1,50,500 (As per
Anx. no. 3)
Ha 15
22.57
Engineering Measure 4 Loose Boulder wall gully plugging 3318 No 03
(As per cl. no. 7.4)
0.10
5 Masonry stone Check Dam 2,14,650 No 04 (As per cl.
no. 7.4)
8.59
Total 109.62
Total cost of Biological, Engineering measure an site observation at site = Rs. 109.62 Lakhs
Micro Planning Cost @ 5% = Rs. 5.48 Lakhs
Sub Total = Rs. 115.10 Lakhs
Contingency cost @ 5% = Rs. 5.76 Lakhs
Sub Total = Rs. 120.86 Lakhs
Administrative Expenditure @ 12% = Rs . 14.50 Lakhs
Total = Rs. 135.36 Lakhs

27
Annexure-1
COST NORM FOR AIDED NATURAL REGENERATION (ANR) @ 200 PLANTS PER HECTRE
WAGE RATE Rs.200/-PER DAY SL NO
Items of work Person days
Labour (Rs.)
Material (Rs.)
Total (Rs.)
1 2 3 4 5 6 0th YEAR 1 Survey, Demarcation & Pillar posting ,GPS
reading with mapping 2 400 0 400
2 Site preparation 2 400 0 400 3 Silvicultural Operation including clearance
of weed, climber cutting, high stump cutting, singling of shoots etc.
5 1000 0 1000
4 Nursery cost(6 months old seedling)part @ Rs.9.45/- seedling (Rs. 6.67 in 0th year + Rs.2.78 in 1st year) for 220 seedlings(200+20)
5.5 1100 367 1467
5 Contingency and Unforeseen Expenditures 0 0 133 133
TOTAL 14.5 2900 500 3400 1st YEAR OPERATION
1 Nursery cost(6 month old seedling)Balance @ Rs.2.78 for 220 seedlings
2.5 500 112 612
2 Pitting 30 cm cube size 6 1200 0 1200
3 Carriage & Planting including Casualty Replacement
5 1000 0 1000
4 Complete weeding, Soil working, Manuring 6 1200 0 1200
5 Cost of vermin compost@ 200gms/plant @Rs.20/-per Kg= Rs. 800.00 and Granular Insecticide 5 gms/Plant @ Rs.80/-per Kg=Rs.80.00
0 0 880 880
6 Cost of Chemical Fertilizer (a) Urea 70 gms/plant in two
subsequent doses @Rs. 6/-per Kg= Rs.84.00
(b) NPK @ 50 gms/plant as basal dose @ Rs.24/kg =24 x 10 = Rs 240/-
0 0 324 324
7 Silvicultural Operation involving clearance of weeds, climber cutting, singling of shoots etc.
15 3000 0 3000
8 Soil Conservation Measures (Staggered Trenches of Dimension 2m× 0.5 m ×0.5 m @60 nos per ha)or its equivalent.
20 4000 0 4000
9 Fire line Tracing & Inspection Path 3 600 0 600
10 Watch & ward 7 1400 0 1400
11 Contingeency ad Unforeseen Exp. 0 0 304 304 TOTAL 64.5 12900 1620 14520
28
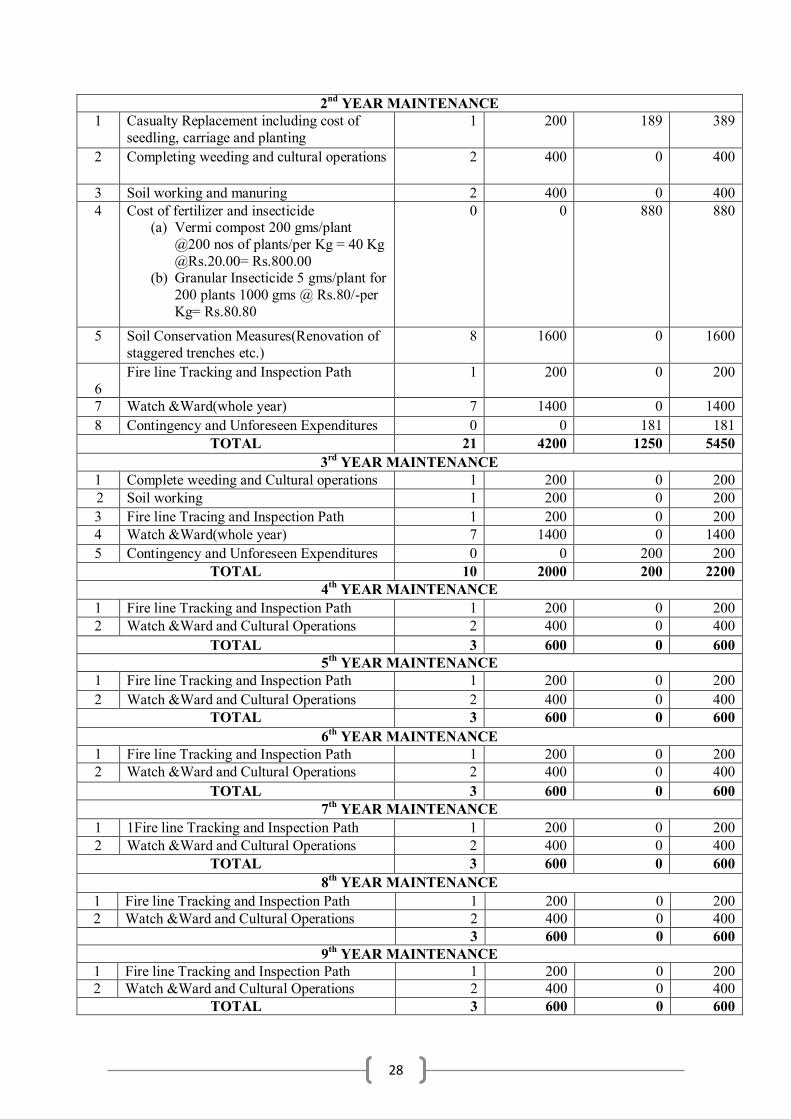
2nd YEAR MAINTENANCE 1 Casualty Replacement including cost of
seedling, carriage and planting 1 200 189 389
2 Completing weeding and cultural operations 2 400 0 400
3 Soil working and manuring 2 400 0 400 4 Cost of fertilizer and insecticide
(a) Vermi compost 200 gms/plant @200 nos of plants/per Kg = 40 Kg @Rs.20.00= Rs.800.00
(b) Granular Insecticide 5 gms/plant for 200 plants 1000 gms @ Rs.80/-per Kg= Rs.80.80
0 0 880 880
5 Soil Conservation Measures(Renovation of staggered trenches etc.)
8 1600 0 1600
6
Fire line Tracking and Inspection Path 1 200 0 200
7 Watch &Ward(whole year) 7 1400 0 1400 8 Contingency and Unforeseen Expenditures 0 0 181 181
TOTAL 21 4200 1250 5450 3rd YEAR MAINTENANCE
1 Complete weeding and Cultural operations 1 200 0 200 2 Soil working 1 200 0 200 3 Fire line Tracing and Inspection Path 1 200 0 200 4 Watch &Ward(whole year) 7 1400 0 1400 5 Contingency and Unforeseen Expenditures 0 0 200 200
TOTAL 10 2000 200 2200 4th YEAR MAINTENANCE
1 Fire line Tracking and Inspection Path 1 200 0 200 2 Watch &Ward and Cultural Operations 2 400 0 400
TOTAL 3 600 0 600 5th YEAR MAINTENANCE
1 Fire line Tracking and Inspection Path 1 200 0 200 2 Watch &Ward and Cultural Operations 2 400 0 400
TOTAL 3 600 0 600 6th YEAR MAINTENANCE
1 Fire line Tracking and Inspection Path 1 200 0 200 2 Watch &Ward and Cultural Operations 2 400 0 400
TOTAL 3 600 0 600 7th YEAR MAINTENANCE
1 1Fire line Tracking and Inspection Path 1 200 0 200 2 Watch &Ward and Cultural Operations 2 400 0 400
TOTAL 3 600 0 600 8th YEAR MAINTENANCE
1 Fire line Tracking and Inspection Path 1 200 0 200 2 Watch &Ward and Cultural Operations 2 400 0 400
3 600 0 600 9th YEAR MAINTENANCE
1 Fire line Tracking and Inspection Path 1 200 0 200 2 Watch &Ward and Cultural Operations 2 400 0 400
TOTAL 3 600 0 600
29
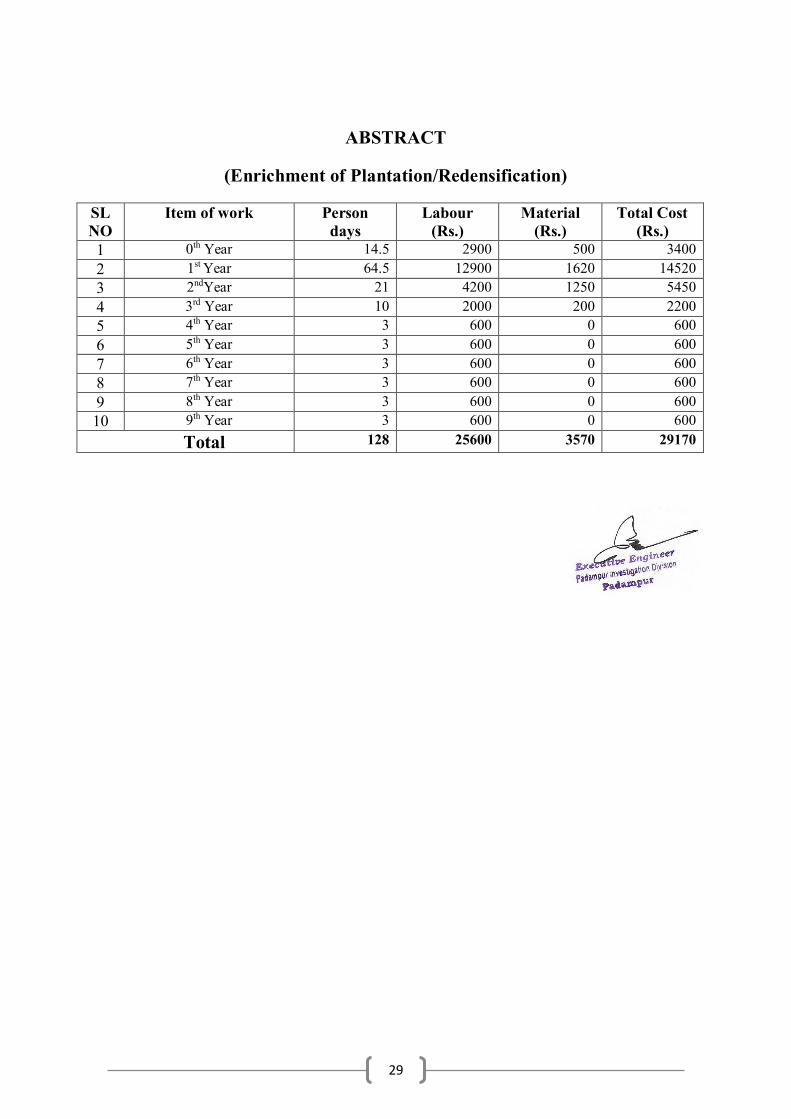
ABSTRACT
(Enrichment of Plantation/Redensification)
SL NO
Item of work Person days
Labour (Rs.)
Material (Rs.)
Total Cost (Rs.)
1 0th Year 14.5 2900 500 3400 2 1st Year 64.5 12900 1620 14520 3 2ndYear 21 4200 1250 5450 4 3rd Year 10 2000 200 2200 5 4th Year 3 600 0 600 6 5th Year 3 600 0 600 7 6th Year 3 600 0 600 8 7th Year 3 600 0 600 9 8th Year 3 600 0 600 10 9th Year 3 600 0 600
Total 128 25600 3570 29170

30
Annexure-2
COST NORM FOR BLOCK PLANTATION@1600 PLANTS PER HECTRE WAGE RATE Rs.200/-PER DAY
SL NO
Items of work Person days
Labour (Rs.)
Material (Rs.)
Total (Rs.)
1 2 3 4 5 6 0th YEAR(advance work)PRE-PLANTING OPERATION
1 Survey, Demarcation & Pillar posting 2 400 0 400 2 Site preparation 8 1600 0 1600 3 Alignment & Stacking of pits 2 400 0 400 4 Digging of pits(30 cm cube) 40 8000 0 8000 5 Nursery cost(6 month old seedling)part
@Rs.9.45/-seedling (Rs.6.67 in 0th year +Rs.2.78 in 1St year) for 1760 seedlings(1600+160)
44 8800 2939 11739
TOTAL 96 19200 2939 22139
1st YEAR OPERATION
6 Nursery cost(6 month old seedling)Balance @ Rs.2.78 for 1260 seedlings
21.5 4300 593 4893
7 Carriage & Planting including Casualty Replacement and application of insecticide, manure etc.
21 4200 0 4200
8 Cost of insecticide & fertilizer (a) NPK @ 50 gms/plant as basal dose =
80 Kg @ Rs. 24/-per Kg= Rs. 1920.00
(b) Ureas @ 70 gms/plant in two subsequent doses @ Rs. 6/-per Kg= Rs. 672.00
(c) Granular insecticide (Themet, foeate etc.)@ 5 gms/plant @ Rs. 80/-per Kg= Rs.640
0 0 3232 3232
9 1st weeding (complete weeding) 7 1400 0 1400
10 manuring Urea 35 gms 5 1000 0 1000
11 2nd weeding (complete weeding) 5 1000 0 1000
12 Soil working (50 cms. Radius around plants) & manuring Urea 35 gms per plant
7 1400 0 1400
13 Soil Conservation Measures in the form of Staggered Trenches of size 2m× 0.5 m ×0.5 m @30 nos per ha
10 2000 0 2000
14 Fire line Tracing & Inspection Path 3 600 0 600
15 Watch & ward 7 1400 0 1400
TOTAL 86.5 17300 3825 21125
31
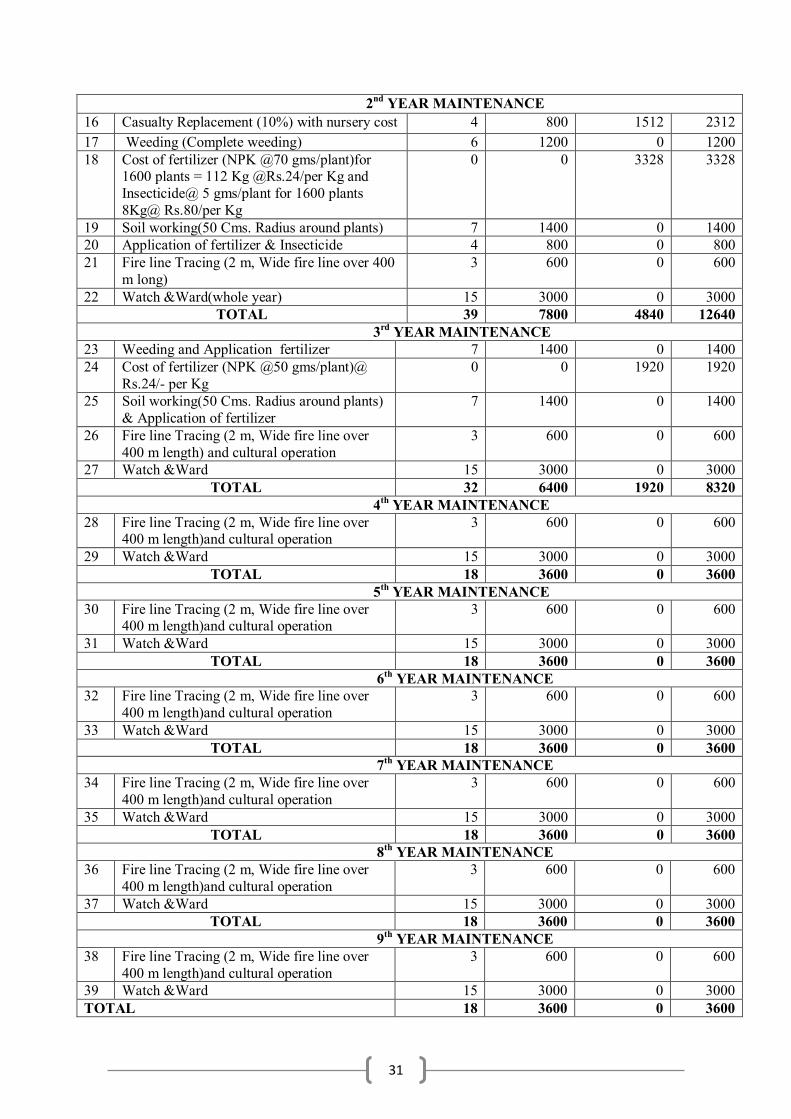
2nd YEAR MAINTENANCE 16 Casualty Replacement (10%) with nursery cost 4 800 1512 2312 17 Weeding (Complete weeding) 6 1200 0 1200 18 Cost of fertilizer (NPK @70 gms/plant)for
1600 plants = 112 Kg @Rs.24/per Kg and Insecticide@ 5 gms/plant for 1600 plants 8Kg@ Rs.80/per Kg
0 0 3328 3328
19 Soil working(50 Cms. Radius around plants) 7 1400 0 1400 20 Application of fertilizer & Insecticide 4 800 0 800 21 Fire line Tracing (2 m, Wide fire line over 400
m long) 3 600 0 600
22 Watch &Ward(whole year) 15 3000 0 3000 TOTAL 39 7800 4840 12640
3rd YEAR MAINTENANCE 23 Weeding and Application fertilizer 7 1400 0 1400 24 Cost of fertilizer (NPK @50 gms/plant)@
Rs.24/- per Kg 0 0 1920 1920
25 Soil working(50 Cms. Radius around plants) & Application of fertilizer
7 1400 0 1400
26 Fire line Tracing (2 m, Wide fire line over 400 m length) and cultural operation
3 600 0 600
27 Watch &Ward 15 3000 0 3000 TOTAL 32 6400 1920 8320
4th YEAR MAINTENANCE 28 Fire line Tracing (2 m, Wide fire line over
400 m length)and cultural operation 3 600 0 600
29 Watch &Ward 15 3000 0 3000 TOTAL 18 3600 0 3600
5th YEAR MAINTENANCE 30 Fire line Tracing (2 m, Wide fire line over
400 m length)and cultural operation 3 600 0 600
31 Watch &Ward 15 3000 0 3000 TOTAL 18 3600 0 3600
6th YEAR MAINTENANCE 32 Fire line Tracing (2 m, Wide fire line over
400 m length)and cultural operation 3 600 0 600
33 Watch &Ward 15 3000 0 3000 TOTAL 18 3600 0 3600
7th YEAR MAINTENANCE 34 Fire line Tracing (2 m, Wide fire line over
400 m length)and cultural operation 3 600 0 600
35 Watch &Ward 15 3000 0 3000 TOTAL 18 3600 0 3600
8th YEAR MAINTENANCE 36 Fire line Tracing (2 m, Wide fire line over
400 m length)and cultural operation 3 600 0 600
37 Watch &Ward 15 3000 0 3000 TOTAL 18 3600 0 3600
9th YEAR MAINTENANCE 38 Fire line Tracing (2 m, Wide fire line over
400 m length)and cultural operation 3 600 0 600
39 Watch &Ward 15 3000 0 3000 TOTAL 18 3600 0 3600

32
ABSTRACT
(Afforestation including maintenance)
SL NO
Year Person days Labour Cost @ Rs.200/-
per Day
Material Cost Rs.)
Total Cost (Rs.)
1 0th Year 96 19200 2939 22139 2 1st Year 86.5 17300 3825 21125 3 2ndYear 39 7800 4840 12640 4 3rd Year 32 6400 1920 8320 5 4th Year 18 3600 0 3600 6 5th Year 18 3600 0 3600 7 6th Year 18 3600 0 3600 8 7th Year 18 3600 0 3600 9 8th Year 18 3600 0 3600 10 9th Year 18 3600 0 3600 Total 361.5 72300 13524 85824
33
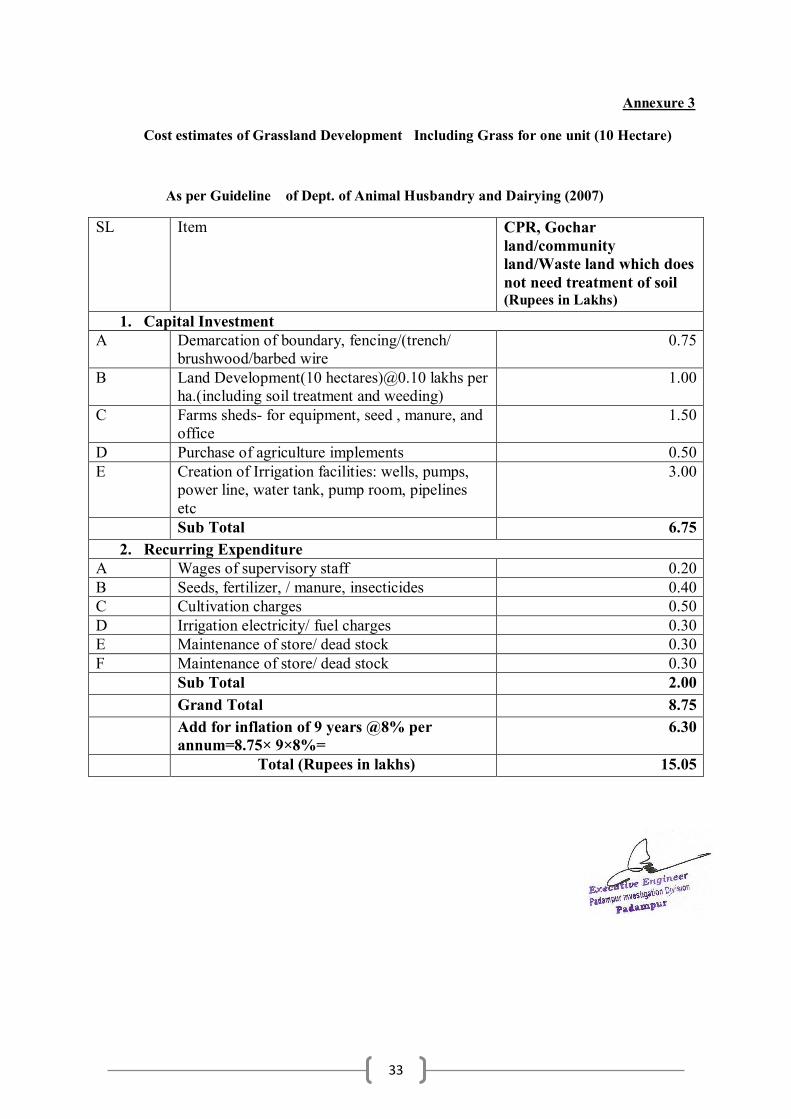
Annexure 3
Cost estimates of Grassland Development Including Grass for one unit (10 Hectare)
As per Guideline of Dept. of Animal Husbandry and Dairying (2007)
SL Item CPR, Gochar land/community land/Waste land which does not need treatment of soil (Rupees in Lakhs)
1. Capital Investment A Demarcation of boundary, fencing/(trench/
brushwood/barbed wire 0.75
B Land Development(10 hectares)@0.10 lakhs per ha.(including soil treatment and weeding)
1.00
C Farms sheds- for equipment, seed , manure, and office
1.50
D Purchase of agriculture implements 0.50 E Creation of Irrigation facilities: wells, pumps,
power line, water tank, pump room, pipelines etc
3.00
Sub Total 6.75 2. Recurring Expenditure
A Wages of supervisory staff 0.20 B Seeds, fertilizer, / manure, insecticides 0.40 C Cultivation charges 0.50 D Irrigation electricity/ fuel charges 0.30 E Maintenance of store/ dead stock 0.30 F Maintenance of store/ dead stock 0.30 Sub Total 2.00 Grand Total 8.75 Add for inflation of 9 years @8% per
annum=8.75× 9×8%= 6.30
Total (Rupees in lakhs) 15.05
34
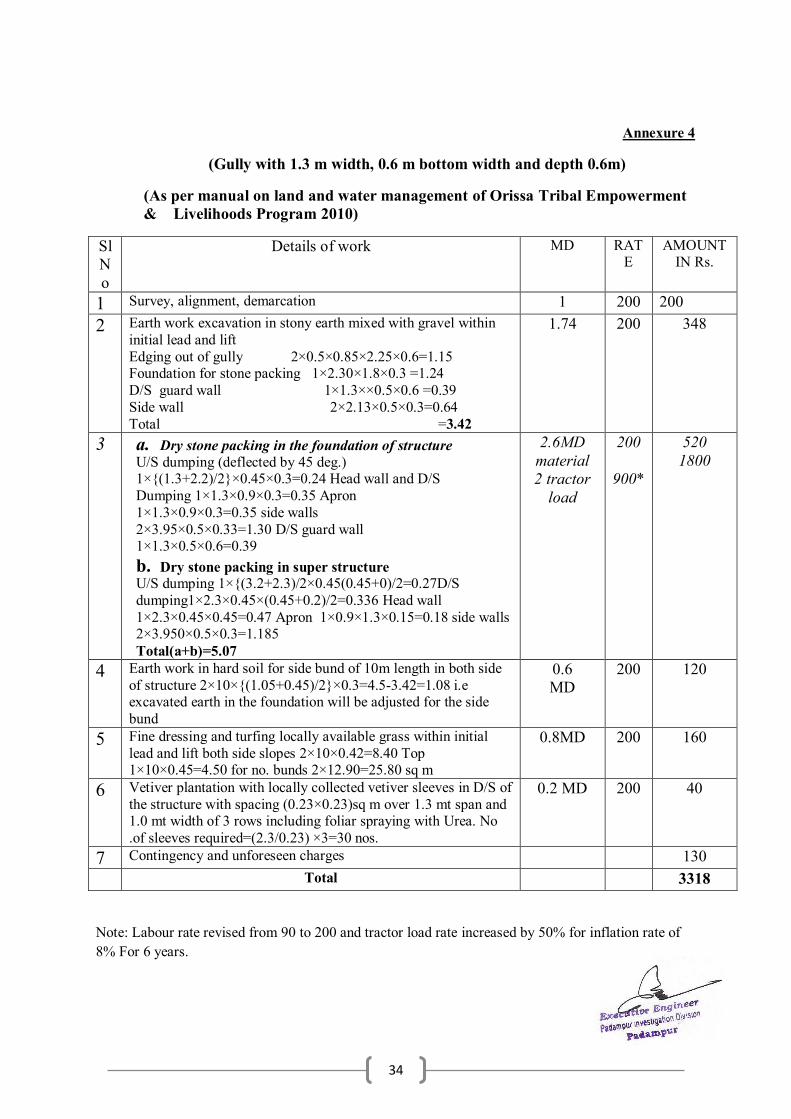
Annexure 4
(Gully with 1.3 m width, 0.6 m bottom width and depth 0.6m)
(As per manual on land and water management of Orissa Tribal Empowerment & Livelihoods Program 2010)
Sl No
Details of work MD RATE
AMOUNT IN Rs.
1 Survey, alignment, demarcation 1 200 200 2 Earth work excavation in stony earth mixed with gravel within
initial lead and lift Edging out of gully 2×0.5×0.85×2.25×0.6=1.15 Foundation for stone packing 1×2.30×1.8×0.3 =1.24 D/S guard wall 1×1.3××0.5×0.6 =0.39 Side wall 2×2.13×0.5×0.3=0.64 Total =3.42
1.74 200 348
3 a. Dry stone packing in the foundation of structure U/S dumping (deflected by 45 deg.) 1×{(1.3+2.2)/2}×0.45×0.3=0.24 Head wall and D/S Dumping 1×1.3×0.9×0.3=0.35 Apron 1×1.3×0.9×0.3=0.35 side walls 2×3.95×0.5×0.33=1.30 D/S guard wall 1×1.3×0.5×0.6=0.39 b. Dry stone packing in super structure U/S dumping 1×{(3.2+2.3)/2×0.45(0.45+0)/2=0.27D/S dumping1×2.3×0.45×(0.45+0.2)/2=0.336 Head wall 1×2.3×0.45×0.45=0.47 Apron 1×0.9×1.3×0.15=0.18 side walls 2×3.950×0.5×0.3=1.185 Total(a+b)=5.07
2.6MD material 2 tractor
load
200
900*
520 1800
4 Earth work in hard soil for side bund of 10m length in both side of structure 2×10×{(1.05+0.45)/2}×0.3=4.5-3.42=1.08 i.e excavated earth in the foundation will be adjusted for the side bund
0.6 MD
200 120
5 Fine dressing and turfing locally available grass within initial lead and lift both side slopes 2×10×0.42=8.40 Top 1×10×0.45=4.50 for no. bunds 2×12.90=25.80 sq m
0.8MD 200 160
6 Vetiver plantation with locally collected vetiver sleeves in D/S of the structure with spacing (0.23×0.23)sq m over 1.3 mt span and 1.0 mt width of 3 rows including foliar spraying with Urea. No .of sleeves required=(2.3/0.23) ×3=30 nos.
0.2 MD 200 40
7 Contingency and unforeseen charges 130 Total 3318
Note: Labour rate revised from 90 to 200 and tractor load rate increased by 50% for inflation rate of 8% For 6 years.
35
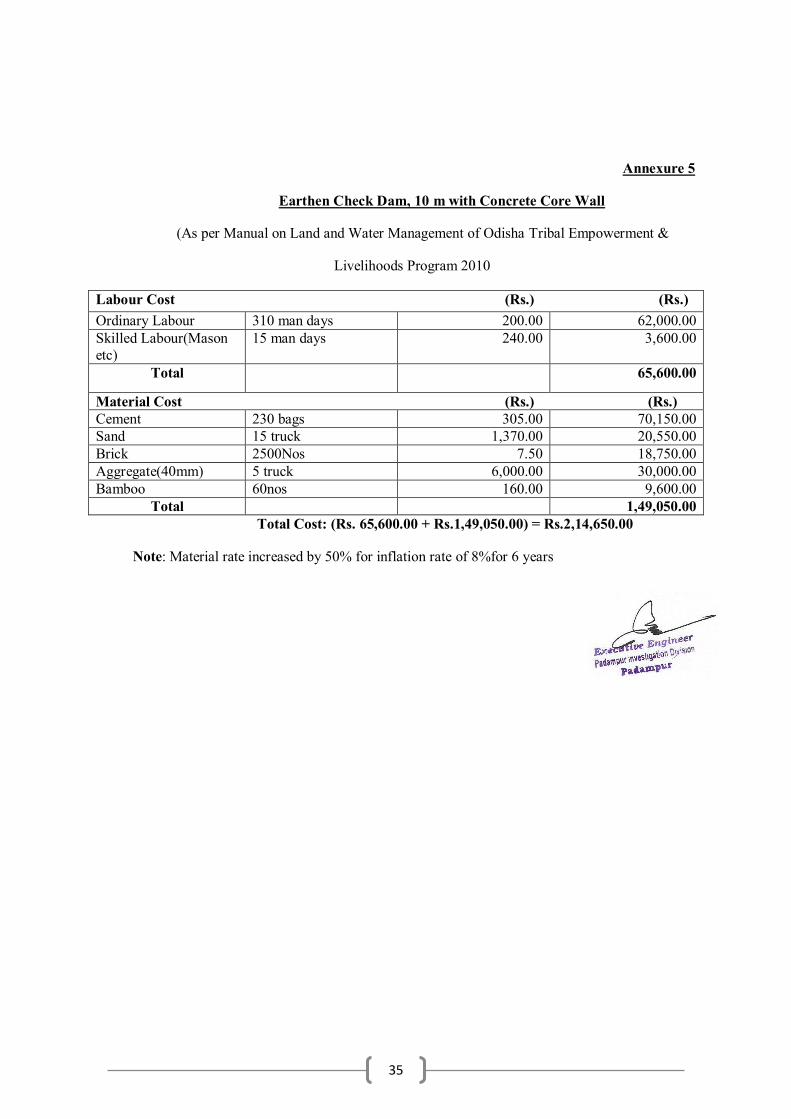
Annexure 5
Earthen Check Dam, 10 m with Concrete Core Wall
(As per Manual on Land and Water Management of Odisha Tribal Empowerment &
Livelihoods Program 2010
Labour Cost (Rs.) (Rs.) Ordinary Labour 310 man days 200.00 62,000.00 Skilled Labour(Mason etc)
15 man days 240.00 3,600.00
Total 65,600.00
Material Cost (Rs.) (Rs.) Cement 230 bags 305.00 70,150.00 Sand 15 truck 1,370.00 20,550.00 Brick 2500Nos 7.50 18,750.00 Aggregate(40mm) 5 truck 6,000.00 30,000.00 Bamboo 60nos 160.00 9,600.00 Total 1,49,050.00 Total Cost: (Rs. 65,600.00 + Rs.1,49,050.00) = Rs.2,14,650.00
Note: Material rate increased by 50% for inflation rate of 8%for 6 years

36
Annexure 6
Year wise Cash Flow
Item 0th year
1st year 2nd year
3rd year
4th year
5th year
6th year
7th year
8th year
9th year
Total
Afforestation Including maintenance
11.07 10.56 6.32 4.16 1.80 1.80 1.80 1.80 1.80 1.80 42.91
Enrichment of Plantation/Re-densification
1.70 7.26 2.73 1.10 0.30 0.30 0.30 0.30 0.30 0.30 14.59
Fodder land development
15.05 15.05 15.05 15.05 60.20
Loose boulder wall gully plugging
0.17 0.17
Masony Stone Check Dam
10.73 10.73
Total cost of Biological, Engineering measures
27.82 32.87 35.00 20.31 2.10 2.10 2.10 2.10 2.10 2.10 128.60
Micro Planning Cost @5%
1.39 1.64 1.75 1.02 0.11 0.11 0.11 0.11 0.11 0.11 6.46
Sub Total 29.21 34.51 36.75 21.33 2.21 2.21 2.21 2.21 2.21 2.21 135.06 Contingency cost@5 1.46 1.73 1.84 1.07 0.11 0.11 0.11 0.11 0.11 0.11 6.76 Sub Total 30.67 36.24 38.59 22.40 2.32 2.32 2.32 2.32 2.32 2.32 141.78 Administrative Expenditure @12%
3.68 4.35 4.63 2.69 0.28 0.28 0.28 0.28 0.28 0.28 17.01
Total 34.35 40.59 43.22 25.09 2.60 2.60 2.59 2.59 2.59 2.59 158.79