catchment assessment and planning for watershed management ii-annexes... · vi catchment assessment...
TRANSCRIPT


Catchment Assessment and Planning for
Volume II - AnnexesJune 2015
Watershed ManageMent
A J James | M Dinesh Kumar | James Batchelor | Charles Batchelor | Nitin Bassi Jitendra Choudhary | David Gandhi | Geoff Syme | Grant Milne | Priti Kumar

© 2015 The International Bank for Reconstruction and Development/The World Bank Group1818 H Street NWWashington DC 20433Telephone: 202-473-1000Internet: www.worldbank.org
All rights reserved
1 2 3 4 14 13 12 11
This volume is a product of the staff of the International Bank for Reconstruction and Development/The World Bank. The findings, interpretations, and conclusions expressed in this volume do not necessarily reflect the views of the Executive Directors of The World Bank or the governments they represent. The World Bank does not guarantee the accuracy of the data included in this work. The boundaries, colors, denominations, and other information shown on any map in this work do not imply any judgment on the part of The World Bank concerning the legal status of any territory or the endorsement or acceptance of such boundaries.
rights and PermissionsThe material in this publication is copyrighted. Copying and/or transmitting portions or all of this work without permission may be a violation of applicable law. The International Bank for Reconstruction and Development/ The World Bank encourages dissemination of its work and will normally grant permission to reproduce portions of the work promptly.
Cover Photo: Cover image courtesy of James Batchelor
design & Print: Macro Graphics Pvt. Ltd., www.macrographics.com

Contents iii
Contents
Acknowledgements v
Abbreviations and Acronyms vii
annex 1: Study Terms of Reference 1
annex 2: Detailed Study Time line 3
annex 3: Catchment Assessment and Planning: A Strategic Review for India 7
annex 4: First workshop, Delhi, May 2014 59
annex 5: Second workshop, Delhi, September 2014 63
annex 6: Technical Meeting, Delhi, November 2014 67
annex 7: Final workshop, Delhi, December 2014 69
annex 8: Technical Note on SWAT Modeling 73
annex 9: Sample village plan for Kevdi 107
References 115


Acknowledgements v
aCknoWledgeMents
This Report, in two volumes (Main Report and Annexes), presents the findings of a Catchment Assessment and Management Planning Study, which is a major step by the World Bank toward improving the understanding of hydrology issues in watershed management in India, based on a detailed assessment of the Government of India’s Integrated Watershed Management Program. The Report’s findings will contribute to the design of new World Bank supported watershed programs in India as well as the IWMP and the newly-announced PMKSY. Further, the lessons learned in this report can guide hydrological assessments in watershed program development in other regions.
This work was funded by the Program on Forests (PROFOR), a multi-donor partnership managed by a core team at the World Bank. PROFOR finances forest-related analysis and processes that support the following goals: improving people’s livelihoods through better management of forests and trees; enhancing forest governance and law enforcement; financing sustainable forest management; and coordinating forest policy across sectors. In 2013, PROFOR’s donors included the European Commission, Finland, Germany, Italy, Japan, the Netherlands, Switzerland, the United Kingdom and the World Bank. Learn more at www.profor.info.
The Study Team wishes to thank the villagers of Kevdi, Dholisamel, Dungarbhint, Kundal and Ghata in Chhota Udeypur district of Gujarat and those of Bharu, Uddawas and Ismailpur in Jhunjhunu district in Rajasthan for sparing their time to provide information, attend meetings, discuss their water-related development problems and share their insights about their local water resources. This study would not have been possible without their cooperation.
We also owe a debt of gratitude to Mr. Shyamal Tikadar, former CEO of the Gujarat State Watershed Management Agency, Government of Gujarat, who provided unstinting support to the our efforts to work in the state of Gujarat, and his teams at Gandhinagar and at Chhota Udeypur.
We would also like to express our thanks to all the participants at the workshops, in May 2014 and December 2014, and especially to the technical experts who contributed their suggestions and comments freely: Professor Ashwin Gosain of IIT Delhi, Dr. V. C. Goyal of the National Institute of Hydrology, Roorkee, Dr. P.G. Diwakar and Dr. Durga Rao of the National Remote Sensing Centre, Hyderabad, Dr. Sandeep Goyal of the Madhya Pradesh Centre for Science and Technology, Bhopal and Dr. William Young and Dr. Anju Gaur of the World Bank office in New Delhi.

Catchment Assessment and Planning for Watershed ManageMent: Volume II - Annexesvi
Our sincere thanks to Dr. Sandeep Dave, Joint Secretary, Department of Land Resources, Ministry of Rural Development and his team at DoLR, including Mr. Amit Kumar, Mr. Vijay Kumar and Mr. Vaishakh Palsodkar, who made helpful suggestions to keep the study grounded and on track.
Finally, we thank Dr. John Kerr (Professor and Associate Department Chair) in the Department of Community Sustainability, Michigan State University, for excellent peer review comments.
A J JamesCharles BatchelorM. Dinesh KumarGeoff SymeJames BatchelorNitin BassiJitendra ChoudharyDavid GandhiGrant MilnePriti Kumar
New Delhi25 June 2015

Abbreviations and Acronyms vii
ADB Asian Development Bank
BISAG Bhaskarcharya Institute for Space Applications and Geoinformatics
BRGF Backward Regions Grant Fund
CDO Central Design Organization
CEO Chief Executive Officer
CFSR Climate Forecast System
CGWB Central Ground Water Board
CMA Catchment Management Agency
CMP Catchment Management Plan
CSWCRTI Central Soil and Water Conservation Research and Training Institute
CWC Central Water Commission
DDP Desert Development Programme
DEM Digital Elevation Model
DoLR Department of Land Resources
DPAP Drought-Prone Areas Programme
DPR Detailed Project Report
DST Decision Support Tool
DWDU District Watershed Development Unit
EPA Environment Protection Agency of the United States Government
ET Evapo-transpiration
FAO Food and Agriculture Organization
FD Forest Department
GGRC Gujarat Green Revolution Company
GIS Geographical Information System
GoI Government of India
GP Gram Panchayat
abbreviations and aCronyMs

Catchment Assessment and Planning for Watershed ManageMent: Volume II - Annexesviii
GPS Geographical Positioning System
HRU Hydrological Response Units
IAMWARM Irrigated Agricultural Modernization and Waterbodies Restoration and Management
ICM Integrated Catchment Management
IMD Indian Meteorological Department
IRAP Institute for Resource Analysis and Policy
ISRO Indian Space Research Organization
IT Information Technology
IWMP Integrated Watershed Management Programme
LULC Land Use Land Cover
MCM Million Cubic Meters
MDB Murray-Darling Basin
MNREGS Mahatma Gandhi National Rural Employment Generation Scheme
MoA Ministry of Agriculture
MODFLOW Modular (finite difference) Flow Model
MODIS Moderate Resolution Imaging Spectroradiometer
MoEF Ministry of Environment and Forests
MoRD Ministry of Rural Development
MWSWAT Map/Window interface for SWAT
NBSSLUP National Bureau of Soil Survey and Land Use Planning
NRAA National Rainfed Areas Authority
NRSC National Remote Sensing Centre
NSE Nash-Sutcliffe Efficiency (statistic)
NWDP National Watershed Development Programme
PET Potential Evapo-Transpiration
PIA Project Implementing Agency
PMKSY Pradhan Manthri’s Krishi Sinchayee Yojana
QGIS Quantum Geographical Information System
RKVY Rashtriya Krishi Vikas Yojana
RWH Rain Water Harvesting
SC Scheduled Caste

Abbreviations and Acronyms ix
SHG Self Help Group
SLNA State Level Nodal Agency
SoI Survey of India
SRI System of Rice Intensification
ST Scheduled Tribe
SWAT Soil and Water Assessment Tool
SWDC State Water Data Centre
UG User Group
WARIS Water Resources Information System (of the Ministry of Water Resources, GoI)
WC Watershed Committee
WCDC Watershed Cell cum Data Centre
WDM Water Demand Management
WEAP Water Evaluation and Planning System


ANNEX 1: Study Terms of Reference 1
study terMs of referenCe
ProJeCt baCkground and obJeCtives
The Bank’s PROFOR program is supporting India in the development of a methodology for landscape level catchment assessment/planning for watershed management. The draft methodology (laid out in manuals, interactive web pages and hand books) will be relevant and flexible to different agro-ecological conditions in India, and guide improved planning for watershed development. The methodology will include the choice of scale for assessment and planning, criteria for selection of watersheds, processes to be followed for better stakeholder participation, key data requirements and possible tools to support the process, etc.
Through the forthcoming Neeranchal project, DoLR (assisted by relevant technical partners) would support state SLNAs in piloting this assessment/planning methodology in selected sites. This would include training and hand holding, linkages with new decision-support models and other tools being developed in the project, etc. Mid-way through Neeranchal implementation, these pilots would be reviewed and the methodologies revised as needed. Ultimately a tried and tested, and flexible assessment/planning methodology would be available for DoLR to incorporate into the National Common Guidelines for Watershed Management.
sCoPe of Work
The consultant is the team leader for the task. The Consultant will lead a small team of experts to
anneX 1
undertake a desk review of the catchment management planning aspects of watershed management (1) across major international programmes and products and (2) in India – especially the ‘Integrated Watershed Management Programme’ (IWMP) of the Ministry of Rural Development, Government of India, but also ‘best practice’ watershed management projects supported by other donors and NGOs – the paper will serve as a background for the brainstorming workshop planned in September 2013. The remaining work to December2014 includes organizing and executing the second national stakeholder workshop in Delhi (September 2014); leading hands-on training sessions for state officials involved in watershed management; and drafting a final report.
deliverables/sPeCifiC outPuts eXPeCted froM Consultant
The consultant will have the following deliverables by December 31, 2014:1
A background paper on catchment assessment ��
and planning aspects of watershed management in India by August 23, 2014.
With support from the Bank team and client, plan ��
and execute a second national stakeholder workshop in Delhi, likely around September 10, 2014.
Based on a final ok from the client, plan and ��
execute regional hands on training for state level staff involved in implementing the national IWMP (likely September through October 2014).
1 This was later extended till 30 June 2015.

Catchment Assessment and Planning for Watershed ManageMent: Volume II - Annexes2
Draft a final report for the Bank, describing in detail, ��
the stakeholder driven process used in developing the landscape level catchment assessment/planning methodology; and laying out the detailed methodology, drawing on material from the two national workshops, references, etc.
sPeCifiC inPuts to be Presented by the Client
The client will assist the consultant (and his team) liaise with the Department of Land Resources (Ministry of Rural Development) as required.

ANNEX 2: Detailed Study Time line 3
detailed study tiMe lineanneX 2
date activity
June 2013 Study started with the commissioning of the Background PaperSeptember 2013 Final version of the background paper, incorporating peer review commentsMay 2014 23-24 May
Brainstorming workshop organized by the Department of Land Resources, Ministry of Rural Development in New Delhi, attended by 28 participants (see Annex 3 for details)
25 MayTeam planning meeting
June 2014 Draft Planning Note prepared on state-level pilotsJuly 2014 Revised study Concept Note to DoLR, MoRDAugust 2014 Discussions with DoLR and change of strategy:
Instead of state-level pilots, team to demonstrate the approach and methodology in one catchment ��
and present findings, after which DoLR will decide next stepsGujarat selected as the state for the piloting��
Second workshop planned for September 2014 in New Delhi to be only an internal planning meeting, ��
without state-level participantsFinal workshop to present study findings to be held in December 2014 in New Delhi��
September 2014 11-14 septemberInternal team meeting to plan demonstration in Gujarat (see Annex 4 for details)��
Tentative selection of the Dhadhar catchment in eastern Gujarat��
Team travels to Ahmedabad, Gujarat��
15-23 septemberPresentations made to the State Level Nodal Agency in Gujarat (called the Gujarat State Watershed ��
Management Agency) on the study objectives, approach and expected outputsChange of catchment to the Upper Sukhi catchment, based on GSWMA information that no IWMP ��
projects were being implemented in Dhadhar while several under implementation in the Upper Sukhi Catchment, in Chhota Udeypur district Initial visit to the Upper Sukhi Catchment, including the Sukhi dam, the weather station at Dhandhodi ��
and discussions with the District Watershed Development Unit (DWDU) at Chhota Udeypur and with villagers in TejgadhFinalization of SWAT as the hydrological model to be used��
Secondary data requirements compiled and visits made to various state government agencies to ��
collect dataPrimary data collection formats drafted and circulated to the team for comments ��

Catchment Assessment and Planning for Watershed ManageMent: Volume II - Annexes4
date activity
28-29 septemberMeetings with the National Remote Sensing Centre (NRSC) in Hyderabad to discuss their possible ��
participation in the study and access to high-quality remotely-sensed dataOctober 2014 Primary data collection formats finalized and data collection started ��
Secondary data collection from state government offices in Gandhinagar, district government ��
offices in Chhota Udeypur and Sukhi damHydrological (simulation) model setting up��
Processing of secondary information for input into the SWAT model��
November 2014 7 novemberPresentation of the SWAT modeling approach to Prof. Ashwin Gosain of IIT Delhi��
8-14 novemberTeam meetings in Hyderabad��
Presentation of the SWAT modeling approach to Dr. Durga Rao of NRSC, Hyderabad��
Manual processing of data as SWAT inputs (solar radiation and evapo-transpiration)��
15 novemberPresentation and discussion of SWAT modeling approach to technical experts (see Annex 5 ��
for details)
16-30 novemberRequest to GSWMA to officially procure remotely sensed data from NRSC, Hyderabad; and ��
‘shape files’ and soil data from the Bhaskarcharya Institute for Spatial Geoinformatics (BISAG), Gandhinagar, GujaratLand use/land cover data from NRSC received��
Primary survey information complete and processed for inputting into SWAT��
SWAT modeling using new data and initial scenarios generated��
Village-level stakeholder interactions and multi-stakeholder meeting held with five selected villages ��
in the catchment (Kevdi, Dholisamel, Dungarbhint, Kundal and Ghata)December 2014 1-2 december
Workshop attended by 18 participants to present and discuss study findings on SWAT modeling ��
and scenarios, stakeholder interactions and village-level planning (see Annex 6 for details)
15 decemberPresentation of main study findings to DoLR team ��
Request from DoLR to pilot the village-level planning approach (using community information, ��
traditional knowledge and newer technological options, to create a 3-5 year village plan to be owned by the village community and used to direct different government programmes to create the required infrastructure and to manage village-level water resources)
20 decemberStudy extended to June 2015 to complete the village-level planning approach and additional ��
resources found to support a limited teamJanuary 2015 Visit to Rajasthan to examine the possibility of piloting the village-level approach there, given the
presence of progressive villages and a water accounting study done in October - December 2013 for the Luni Basin
Site visits and team discussions confirmed that even with the water accounting study findings, it would take more time to set up and run the SWAT model for the Luni Basin and create scenarios to support the interactive village-level planning process
February 2015 Visit to Rajasthan to see if the village-level planning process could be piloted in Jhunhunu district (with three identified progressive villages, Bharu, Uddawas and Ismailpur) without support from the hydrological model

ANNEX 2: Detailed Study Time line 5
date activity
Gram Panchayat elections in the state, the marriage season delayed the start of the planning process
Two rounds of meetings held in Bharu village and the planning process was underway but a local dispute (over the elections) precluded further discussions
Village-level planning process re-started in the five villages in Chhota Udeypur in Gujarat March 2015 Visit to the District Collector, Chhota Udeypur, to ask him to help support the planning process initiated
in these five villages. Support assured, but the condition was that the Village Plans should be submitted through the DWDU of the GSWMA
Change of CEO, GSWMA, without a replacement and, without his support, it was difficult to generate interest in supporting these five village plans, over and above their regular work
Regular meetings still held in the five villages and area-wise scrutiny of issues carried outApril 2015 Innovative inclusive planning approach using Google Earth used to generate interest of Kevdi villagers
and a transect with villagers produced a village-level plan for RWH structures
Due to shortage of time, the Kevdi plan was extrapolated to the other four villages, and used to create detailed scenarios for the five villages using SWAT
Final scenarios created using SWAT and outputs documented


ANNEX 3: Catchment Assessment and Planning: A Strategic Review for India 7
CatChMent assessMent and Planning: a strategiC revieW for india
anneX 3
introduCtion
Watershed development is an approach to raise agricultural productivity, conserve natural resources and improve rural livelihoods in the regions suffering land degradation, which are often characterized by high levels of food insecurity and income poverty (Hope, 2007; Farrington et al., 1999).Watershed development has emerged as an important policy instrument for rural development in many developing countries, including India (Hope, 2007). Since the 1970s, India has invested significantly in watershed development as a driver of rural development (Joshi et al., 2005), partly in an attempt to scale up successes from a handful of well-known village-level watershed projects, such as Pani Panchayat, Ralegaon Siddhi and Sukhomajri (Turton et al., 1997). But, the focus of watershed development in India has evolved over the last 25 years from soil conservation to water conservation to now include a more participatory planning approach (Hope, 2007). In fact, the importance of institutions of collective action for implementing and managing watershed programmes was recognized in the GOI guidelines formulated in 1994–95 (Reddy et al., 2004).
A principal assumption underlying watershed development and management project is that there is sufficient amount of un-utilized water flowing out of the agricultural watersheds (Kumar et al., 2006 and 2008), which, if captured during the wet season, may be made available in dry periods offering several potential benefits—increasing soil moisture for rain-fed agriculture, augmenting groundwater recharge and
capturing run-off for storage for multiple productive uses or direct consumption2 (Farrington et al., 1999). Socio-economic benefits commonly associated with watershed development include improved agricultural yields and farmer returns, increased access to domestic water and new employment opportunities (Kerr et al., 2002). However, these benefits will vary for different resource user groups located across watersheds. However, emerging global evidence suggests that there are limits and trade-offs to modifying watersheds due to complex interactions within and between hydrological and social systems (Calder, 2005). This is partly because watershed development interventions modify land use impacts on water resources, which in turn may alter downstream water access, while augmenting upstream water supplies (Batchelor et al., 2003; Gosain et al., 2006) 3.
Dramatic changes in the hydrology of many dry areas of India are evident in recent years as a result of increased groundwater-based irrigation, watershed development, water harvesting and land use change. Although current
2 In typical rural settings, the productive uses include water for irrigation, and consumptive uses include water for all domestic uses (drinking, washing, cleaning and personal hygiene and livestock drinking).
3 Many watershed development activities are designed to harvest water and increase consumptive water use either directly through improving moisture storage for rain-fed farming systems or indirectly through augmented recharge and intensive use of groundwater for irrigation. By the Law of Conservation of Mass, a net increase in consumptive water use in one part of a basin to be balanced by reduced availability elsewhere in the basin or mining of local groundwater to meet the deficit (Batchelor et al., 2003).
M. dinesh kumar, C.h. batchelor and a. J. James

Catchment Assessment and Planning for Watershed ManageMent: Volume II - Annexes8
watershed development programmes bring a range of benefits, they may also change the temporal and spatial pattern of water availability and use at the scale of large catchment in which these watersheds fall (Batchelor et al., 2003; Calder, 2005; Kumar et al., 2008). This can result in significant negative trade-offs such as more unreliable lean season flows, particularly during low rainfall or drought years, drying up of tanks and large reservoirs, and damage to riverine ecology.
But, the political preference for watershed development remains high in India, generally for supply side interventions. Given the fact that nearly Rs. 2200 crore (US$340 million) per year is allocated to watershed projects in India at present (Reddy, 2012), there is a need to ensure enhanced performance of the watersheds from social, economic and environmental perspectives and to identify and mitigate perverse outcomes and negative externalities (Batchelor et al., 2003; Calder et al., 2008). There is increasing recognition among scholars of the need to take a look at the hydrology and land use in the larger catchment, in order to decide on the degree/scale of agricultural intensification and rainwater harvesting in order to avoid undesirable effects of watershed management (Calder et al., 2008). But, while doing this, water managers should recognise that hydrological characteristics of catchment are not necessarily static, and instead are constantly altered by changes in regional land use and hydrological structures (Moench and Dixit, 2004).
The purpose of this paper is to provide a ‘state of the art’ review of catchment assessment and planning in watershed management, that are practiced under: international programmes and projects; the catchment/watershed management programmes undertaken by different countries of the world; and, the integrated watershed management programme of the Ministry of Rural Development of GoI, and other donor-supported projects which are acclaimed as the best practice projects in the country.
What is Watershed ManageMent?
Watershed development generally refers to land based treatment works, using the ‘ridge to valley’ approach, for rehabilitation of degraded lands (farm land, forests
and pastures), which contribute either directly to rain-fed production or indirectly increase domestic and productive uses of water through augmented surface water storage or groundwater recharge.
Watershed management is the process of creating and implementing plans, programmes, and projects to sustain and enhance functions of a watershed that affect the plant, animal, and human communities within a watershed boundary. The watershed functions generally include: preservation of the top soils in the catchment, including that in the agricultural land, for sustaining the primary productivity of land; conservation of moisture in the soil profile for supporting biomass production and combating drought; regulation of the runoff generated in the catchment to moderate the floods; preservation of wetland ecosystems within and outside the boundaries of the watersheds, to which the watershed contributes in the form of stream-flows and micro nutrients; and natural recharge to the groundwater system, with its upper limits decided by the geo-hydrological conditions of the watershed.
A malfunctioning or a degraded watershed is characterized by excessive soil erosion from the slopes, fast siltation and poor carrying capacity of the stream channels, high intensity runoffs with peak flows even from not so high intensity rainfall, and pollution of the runoff water. Socio-economically, a clear manifestation of a degraded watershed is poorer biomass production capacity (ton/ha of land) than what the agro-ecology permits in the natural condition. In a typical agricultural watershed, common contributors to water pollution are nutrients and sediment load, which typically enter stream systems after the surface runoff generated from rainfall washes them off poorly managed agricultural fields, washes them out of the soil through leaching. These types of pollutants are considered nonpoint source pollution because the exact point where the pollutant originated cannot be identified.
Features of a watershed that agencies seek to manage include water supply, water quality, drainage, storm water runoff, water rights, and the overall planning and utilization of watersheds. Generally, the scale of intervention in watershed management programme is a micro watershed, which has both advantages and disadvantages (see box 1).

ANNEX 3: Catchment Assessment and Planning: A Strategic Review for India 9
boX 1 SCALE OF INTERVENTIONS IN WATERSHED MANAGEMENT & ITS EFFECTS
Watershed management programmes generally adopt a micro-watershed as the basic unit for planning and management (Darghouth et al., 2008; Sakthivadivel and Scott, 2005). One reason for this was that it allows the integration of land, water, and infrastructure development and the inclusion of all stakeholders in a participatory process. As noted by Kerr (2004), this scale enables a program to respond to human needs and natural resource problems at the local level (Kerr 2004). It is also arguably both ecologically and institutionally sustainable, and capable (under the right conditions) of empowering weaker sections of the population (Farrington et al., 1999). According to Darghouth et al. (2008), a micro-watershed has also proved to be a flexible and practical unit for project implementation and has reduced costs.
Using a micro-watershed as the unit for planning and execution of watershed management, however, creates some difficulties when it comes to scaling up: It does not necessarily capture upstream-downstream interactions (Darghouth et al., 2008; Kumar et al., 2006 and 2008). A patchwork of upstream interventions would have a significant positive impact downstream only if they are prioritized and planned within the larger catchment, and with an understanding of the hydrological links between soil and water conservation measures and land use changes (afforestation, increased cropping intensity) in the upper catchment on the one hand, and the stream flows and sediment transport downstream, on the other.The impacts can otherwise be negative (Talati et al., 2005). On the other hand, integration of watershed management activities beyond the micro-watershed requires higher level technical planning. Ideally, the planning should include an institutional mechanism where stakeholders have a voice and are able to agree on measures from the micro-watershed scale upward that can achieve both local and larger scale objectives, though given the different perspectives and likelihood of winners and losers especially in areas facing increasing water scarcity, such agreements may be hard to come by. The approach also involves institutional challenges of interagency collaboration and local-regional level coordination (Darghouth et al., 2008).
CatChMent assessMent and Planning for Watershed ManageMent: theoretiCal and ConCePtual asPeCts
Watershed management professionals generally view that increasing the thickness of vegetative cover in the upper catchments would reduce erosion and sediment load in the runoff and increase the base flows, irrespective of the agro-ecology. International agencies and scholars, aggressively promoting small scale rainwater harvesting in catchments, often view rainwater as separate from groundwater and surface water (COMMANS, 2005; SEI, 2009; Shah, 2007). Such views ignore the following:
How the type of catchment land use influences the ��
impact of increased vegetation cover on stream flows (including water quality), in different agro ecologies.
How the nature of vegetation (whether shallow ��
rooted grasses and shrubs or deep rooted trees) determines the impact of increased vegetation cover on the consumptive use of water from the soil profile and groundwater system of the catchment, and how these impacts can change across agro-ecologies.
The hydraulic inter-dependence between ��
groundwater and surface water in a catchment and therefore the impact of change in groundwater withdrawal on stream flows downstream.4
That rainwater (precipitation) is the source of ��
surface water, soil moisture and groundwater in the catchment.
4 In arid and semi-arid regions, the increase in area under rain-fed crops in the catchment would have a negative impact on stream flows as a good share of the runoff generated from precipitation could be captured by cultivated fields, which would in turn be taken from the soil profile by standing crops as ET. The reduction in runoff could be disproportionately higher than the increase in recharge which occurs as a result of increased soil infiltration owing to larger vegetation cover, depending on the ET requirement of the crops (Kumar, 2010). In contrast, the impacts of an increase in forest cover on stream flows could be far less, as it will not capture the runoff, and use only the moisture in the soil profile or the vadoze zone or shallow aquifer. An increase in tree cover would however have much bigger impact on groundwater as the deep rooted trees would suck water directly from the shallow aquifer or the vadoze zone for meeting transpirative demands, while its effect on soil infiltration of rainwater may not be significant (Leblanc et al., 2012). Grass cover could significantly increase infiltration of the incident rainfall without increasing the consumptive water use (ET) significantly. Further, not all trees are good in keeping the soils cohesive, in order to prevent erosion, and some can even increase the erosion due to the root system and foliage characteristics.
Catchment Assessment and Planning for Watershed ManageMent: Volume II - Annexes10
But, this knowledge is extremely important for catchment management measures. Often, the sources of sedimentation can often be quite localized such as newly constructed roads, stream-bank cultivation, and movement of livestock around, to or from a water point.
There is a need therefore to develop a clear understanding of the catchment characteristics (drainage pattern, drainage area, type of soils and the slope), current land use in the catchment and the hydrological regime) before interventions are planned for changing their hydrological regime. Of particular interest are the following:
The current stream flow regimes.��
The extent of groundwater contribution to the ��
stream flows (base flow component of the stream flow).
Geological and geo-hydrological environment of ��
the catchment, particularly the depth to water table and the thickness of the vadoze zone.
The area under natural forests, their condition, ��
type of forests.
The area under cultivation, type of crops, their ��
seasonality, and their geographical spread within the catchment.
Groundwater use in the catchment, its seasonality ��
and location of wells.
The amount of committed flows from the ��
catchment for downstream uses.
strengths and Weakness of the Current approach
Strengths
The current approach has a clear emphasis on improving the conditions of large majority of the people living in rain-fed areas who are dependent on land and water for their livelihoods, and the thrust is on implementing activities which can be done by the local communities with minimum outside support on technical matters (Farrington et al., 1999; Kerr, 2002; Hope, 2007). The thrust is also on taking up physical activities which will have immediate as well as medium and long-term
impacts. In that respect, local employment generation is also given sufficient emphasis.
Weaknesses
a lack of sufficient information for catchment ��
assessment and watershed planning since improvement in water use efficiency and equity in catchment-wide distribution of water are two key long term objectives of watershed management programmes. The management is based on micro watersheds as the unit for planning and operation of catchment (watershed) interventions. The area of the micro watershed is now 5000 ha, i.e., 50 sq. km and hydrological data of the catchment are difficult to obtain at that scale (particularly the magnitude of annual stream flows, the flow regime, groundwater recharge and flow gradients, base flows and withdrawal, and the un-committed flow from the catchment which can be harnessed). Many small basins in India are un-gauged and, even in many large basins, gauging is done only for large tributaries: flow measurements do not exist for small river basins, and smaller tributaries of large basins (Kumar et al., 2006). Also, information is not readily available to the PIAs on the characteristics of the catchment including the drainage area, drainage pattern, the slope, soil types.
Till recently, decisions to implement watershed ��
management programmes in a village were taken on the basis of limited data available from Survey of India toposheets. Also, information on cropping pattern and crop types although available at the village level with the revenue village officers, were not available on spatial reference and hence could not be transposed onto watershed boundaries. In the absence of such data, watershed planning as attempted by some NGOs purely on PRA approaches has not yielded required results. While good hydrologists with adequate technical skills might be able to generate data on land use/land cover and runoff for micro catchments using online database, such trained professionals are few in number in India and, even if available, may be unaffordable to PIAs.
unfounded assumptions underlying the ��
approach: The current approach to planning

ANNEX 3: Catchment Assessment and Planning: A Strategic Review for India 11
WSM interventions assumes that a large amount of runoff during the monsoon goes un-captured and eventually gets wasted as it joins the natural sink of sea, ocean or swamps. This leads to the conclusion that if comprehensive treatment is done, it would improve the water availability and or soil moisture regime within the micro watershed along with reducing soil erosion and that it can even increase the effective water availability for the downstream communities during the lean season. Since the geographical unit of planning is too small, the PIAs are not concerned with what happens to the runoff which flows out of the micro catchment prior to the intervention, and the different (social, economic and environmental) values it generated (Calder et al., 2008; Kumar et al., 2006 & 2008).
little consideration that there could be different ��
values and interests attached to water by communities within a large catchment: All are however legitimate and need to be recognized (Jakeman and Letcher, 2003; Mitchell and Hollick, 1993).
lack of attention to storage efficiency and ��
economic viability: The net result is that often there is over-doing of interventions within a watershed in terms of creating tree cover, and building vegetative barriers to reduce the speed of runoff water, reduce soil erosion and improve soil moisture conservation. Many small water bodies are built across the watershed to harvest monsoon runoff, with little consideration of storage efficiency.5 New crops are planned to utilize the augmented groundwater in the catchment, without due consideration of water use efficiency ($/m3) of the newly introduced crops. In hydrologically ‘closed’ catchments, this reduces the overall economic viability of the interventions, and efficiency of water use at the catchment scale as downstream uses are adversely affected (Kumar
5 Storage efficiency of water harvesting structures refers to the total amount of water stored for diversion to different uses against the total amount of water intercepted by the structure. As this increases with the number of fillings, the storage efficiency would be a function of the pattern of occurrence of rainfall and catchment characteristics.
and van Dam, 2013).6 While such practices are subject to criticism (Batchelor et al., 2002; Kumar et al., 2008), the current approach does not encourage proper assessment of changes in water use efficiency at the catchment scale.
little consideration of downstream impacts: ��
Under the current approach, certain treatment activities within the catchment are promoted on the premise that they do not take much water from the hydrological system, and therefore, economic losses due to their adverse impacts are not taken cognizance of in the planning decisions (Batchelor et al., 2003). Such activities include in situ soil moisture conservation measures such as construction of bunds and terraces in the farm land, and contour bunds and trenches in the common land covering forests, revenue wasteland and pastures. While increased soil moisture storage is in expected to increase the intensity of crop cultivation by farmers during the monsoon season and help protect new plantation in the common land, such decisions tend to lose sight of the fact that, within the same catchment, there are often downstream water systems like tanks and ponds which depend on this runoff for uses such as domestic needs, supplementary irrigation of crops and fisheries.
lack of recognition of the hydraulic inter-��
connectedness of aquifers and streams in the catchment: Groundwater recharge is promoted within the catchment under watershed management as a ‘positive value’ with the assumption that it would increase the base flows, thereby making streams flowing in the lower catchment perennial through base-flows during lean season. But, hardly any attention is paid to the fact that this activity is followed by indiscriminate drilling of wells by farmers in the area, which ultimately leads to increased draft, threatening even the existing natural discharge of
6 In ‘hydrologically open basins’, the watershed interventions could ideally increase the beneficial component of the water depleted in the catchment, to enhance biomass production and increase utilizable water resources for other productive uses, with some investment. But, in “closed basins”, not only that the beneficial component of the depleted water can hardly be increased, but also sometimes can be reduced due to increase in area under surface water impounding structures (Kumar et al., 2006).
Catchment Assessment and Planning for Watershed ManageMent: Volume II - Annexes12
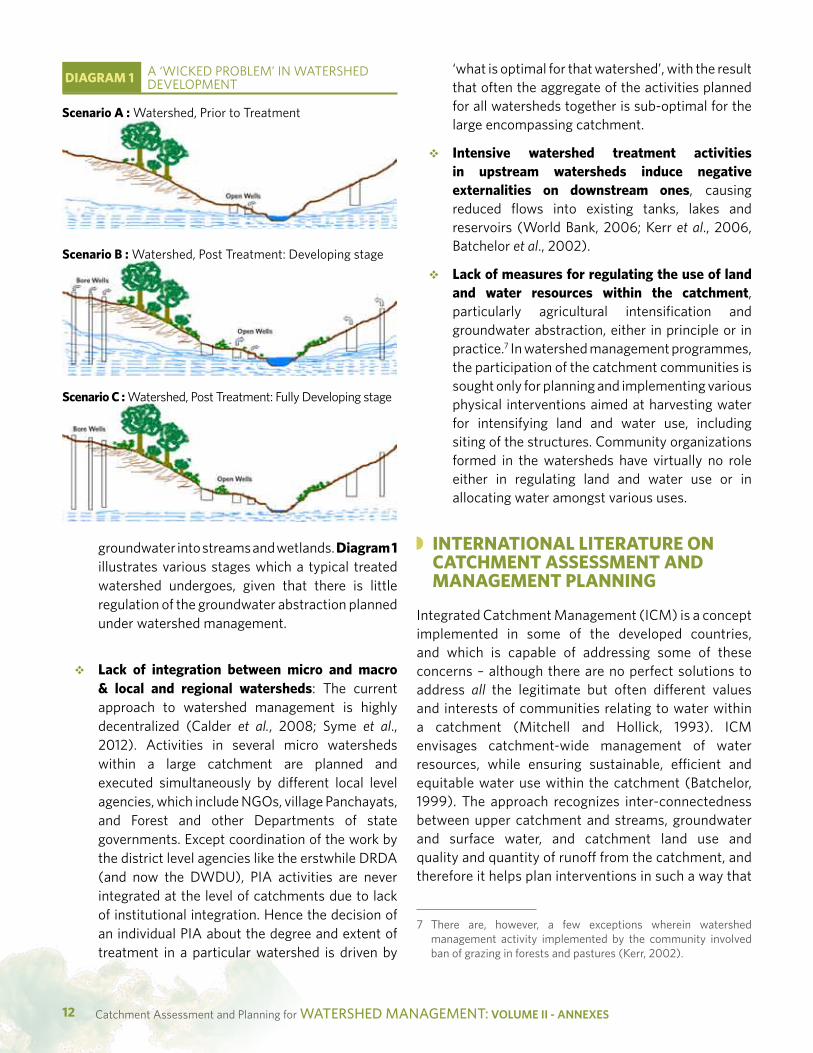
groundwater into streams and wetlands. diagram 1 illustrates various stages which a typical treated watershed undergoes, given that there is little regulation of the groundwater abstraction planned under watershed management.
lack of integration between micro and macro ��
& local and regional watersheds: The current approach to watershed management is highly decentralized (Calder et al., 2008; Syme et al., 2012). Activities in several micro watersheds within a large catchment are planned and executed simultaneously by different local level agencies, which include NGOs, village Panchayats, and Forest and other Departments of state governments. Except coordination of the work by the district level agencies like the erstwhile DRDA (and now the DWDU), PIA activities are never integrated at the level of catchments due to lack of institutional integration. Hence the decision of an individual PIA about the degree and extent of treatment in a particular watershed is driven by
‘what is optimal for that watershed’, with the result that often the aggregate of the activities planned for all watersheds together is sub-optimal for the large encompassing catchment.
intensive watershed treatment activities ��
in upstream watersheds induce negative externalities on downstream ones, causing reduced flows into existing tanks, lakes and reservoirs (World Bank, 2006; Kerr et al., 2006, Batchelor et al., 2002).
lack of measures for regulating the use of land ��
and water resources within the catchment, particularly agricultural intensification and groundwater abstraction, either in principle or in practice.7 In watershed management programmes, the participation of the catchment communities is sought only for planning and implementing various physical interventions aimed at harvesting water for intensifying land and water use, including siting of the structures. Community organizations formed in the watersheds have virtually no role either in regulating land and water use or in allocating water amongst various uses.
international literature on CatChMent assessMent and ManageMent Planning
Integrated Catchment Management (ICM) is a concept implemented in some of the developed countries, and which is capable of addressing some of these concerns – although there are no perfect solutions to address all the legitimate but often different values and interests of communities relating to water within a catchment (Mitchell and Hollick, 1993). ICM envisages catchment-wide management of water resources, while ensuring sustainable, efficient and equitable water use within the catchment (Batchelor, 1999). The approach recognizes inter-connectedness between upper catchment and streams, groundwater and surface water, and catchment land use and quality and quantity of runoff from the catchment, and therefore it helps plan interventions in such a way that
7 There are, however, a few exceptions wherein watershed management activity implemented by the community involved ban of grazing in forests and pastures (Kerr, 2002).
diagraM 1 A ‘WICKED PROBLEM’ IN WATERSHED DEVELOPMENT
scenario a : Watershed, Prior to Treatment
scenario b : Watershed, Post Treatment: Developing stage
scenario C : Watershed, Post Treatment: Fully Developing stage

ANNEX 3: Catchment Assessment and Planning: A Strategic Review for India 13
they protect the hydrological system integrity of the large catchment (Mitchell, 1990). It helps analyse the trade-offs in promoting one use in terms of its impacts on the values generated by the other uses. It takes cognizance of the fact that there are competing uses of water and land within the catchment and therefore water allocation is as important as augmenting water supplies or creating new sources of water, from the point of view of ensuring equity in water use. It also recognizes the fact that the efficiency with which water, including the moisture in the soil profile, is used is as important a concern as the amount of water available for utilization in the catchment.
Such an approach calls for participation of stakeholders in management (Batchelor, 1999) and goes far beyond typical bio-physical and structural interventions taken up to improve moisture regime in the soil profile, local water storage and water quality. This is because catchment management planning is not about intensifying the use of water and land within the catchment for enhancing biomass production or increasing other water needs, but, it is about regulating catchment land and water use in order to achieve overall enhancement of various functions which the catchment performs.
In order to achieve the goal of sustainable water use, the catchment planning process has to overcome resistance from the more established administrative and policy making interests at various levels, which are targeted at the former (Buller, 1996). The essential knowledge of hydrological and ecological processes for scientific management of the catchments are often lacking in their actions, as reflected for instance in the Indian 12th Five Year Plan document, which gives a thrust to local rainwater harvesting, and groundwater recharge and use as a solution of growing water scarcity, without taking cognizance of the catchment hydrology, especially the linkages between upstream and downstream and the groundwater-surface water interactions.
Institutional reforms and policies for Water Demand Management (WDM) are required to create an enabling environment for efficient use of water (Batchelor, 1999; Kumar and van Dam, 2013; Molle and Turral, 2004), and to effect inter-sectoral allocation of water. But, any move towards an integrated approach will include some
turbulent and difficult times and honest differences of opinion regarding the most appropriate way to proceed and to allocate scarce societal resources (Warner, 2006).
Despite these caveats, the major features of ICM programmes that have shown positive results include the following (Batchelor, 1999; Darghouth et al., 2008, Cornell, 2012):
An overall natural resource management strategy ��
that clearly defines the management objectives.
A range of delivery mechanisms that enable these ��
objectives to be achieved.
A monitoring schedule that evaluates programme ��
performance.
Decision-making and action take place at the ��
basin-wide, regional and local levels.
Involving local communities wherever possible, ��
both in decision making and in resulting activities.
Mechanisms and policies that enable long-��
term support to programmes of environmental recovery.
Catchment assessment
Changes in land use and land cover, catchment yield and soil erosion
The traditional perception that forests increase water resources has long been questioned by the results of scientific forest hydrology since the early 20th century (e.g. Calder, 2002). A large number of catchment experiments conducted all over the world clearly demonstrated that the deforestation of a catchment implies an increase of water yield from it and, conversely, the establishment of a forest cover implies a decrease of water yield (Sahin and Hall, 1996). The application of this knowledge to designing sustainable water management practices, although necessary in water stressed regions, has been largely delayed because of difficulties inherent to the change of any scientific paradigm, the limited experience on the hydrological consequences of land cover changes in large territories, and the disconnection between policy and science (Falkenmark et al., 2000; Calder, 2002).

Catchment Assessment and Planning for Watershed ManageMent: Volume II - Annexes14
Most of the micro catchment (watershed) management programmes in India are grounded on inadequate knowledge of the relationship between changes in land use/land cover and catchment yield and soil erosion, especially concerning:
The differential impacts of various specific ��
interventions on soil conservation and sediment control.
The differential impacts of grass buffer strips and ��
retention ponds on sediment control.
Impacts of replacing of crop land by tree cover.��
Clearance of native trees from forested catchments, ��
and replacing of forest cover by crops on seasonal and annual yield of catchments.
The impact of use of efficient irrigation technologies ��
on overall water use efficiency in the agricultural catchments and effective water availability for other uses in the catchment.
There are, often, wide misconceptions concerning their functions in different agro ecologies. Therefore, a sound scientific understanding of the relationship between catchment land use and land changes and hydrological and ecological processes, which is the bedrock of integrated catchment programmes, is essential for catchment planning.
Such scientific understanding has been developed elsewhere through scientific experimental field monitoring of data on soil erosion, sediment yield and catchment runoff, and the use of simulation models. Some of the more interesting ones include those available from modeling studies:
Relative effectiveness of field scale soil ��
conservation measures taken in reducing both soil loss and sediment yield over grass buffer strips and retention ponds (Verstraeten et al., 2002).
Negative impact of increase in forest cover in dry ��
areas of Spain on river flows in Spain (Gallart and Llorens, 2003).
Rising groundwater levels and increase in soil ��
salinity as a result of clearance of native vegetation for agricultural use in Murray Darling basin (Leblanc et al., 2012).
Effects of historical socio-economic developments ��
and land use changes on river water quality in Scotland (Pollard et al., 2001).
The importance of analyzing the spatial and ��
temporal patterns in rainfall and land use in the catchments over and above the aggregate scenarios, in explaining the spatial and temporal variations in runoff occurring in the catchment in North West England (Orr and Carling, 2006).
The negative impact of replacing paddy fields ��
by forests on catchment yield, with just an opposite impact from replacement of forests by crop land, and positive impact of irrigated paddy on watershed hydrology in terms of quantum of flow in Chi river basin of Thailand (Homdee et al., 2011).
The distinction between notional water saving ��
and real water saving through efficient irrigation technologies, and importance of scale’ in deciding the water saving impact of water use efficiency improvements in agriculture (Wallace and Batchelor, 1997; Kumar and van Dam, 2009).8
Knowledge Use in Catchment Management Decisions
The knowledge on the dynamics of interaction between a particular land use and land cover and water use in the upper parts of the catchment, and the hydrology and ecosystems of a given catchment can provide pointers on the way in which the former needs to be modified to produce social, economic and environmental outcomes that are widely acceptable among the catchment communities. But, which land use or land cover based intervention needs to be taken up and to what extent they need to be changed to achieve the optimum outcomes in terms of water yield, sediment load reduction, meeting water quality standards and reduction in soil loss etc. can only be assessed using complex mathematical models which simulate the hydrological and biophysical processes. Such models basically integrate those used for prediction of soil erosion from the catchment; crop growth; rainfall-runoff; sediment transport; and groundwater flow. What is important to note is that while changing land
8 See Annexure 1 for detailed description of specific study findings.
ANNEX 3: Catchment Assessment and Planning: A Strategic Review for India 15
use and land cover and construction of vegetative bunds in the upper parts of the catchment as part of the ICM approaches could change the catchment yield along with soil loss, in withdrawal of either surface water or groundwater in the catchment to affect such changes could also cause variations in water yield received in the lower parts of the catchment. This in turn can bring about drastic ecological changes in those areas in terms of changes in nature and extent of vegetation that the river plains support. Hence, these models have to be used in an integrated way to understand the cumulative effects.
As indicated by Verstraeten et al. (2002), when soil conservation measures such as changing the crop rotation sequence or terracing or contour bunds are taken up at catchment scale, the effect of sediment control measures such as grass buffer strips or retention ponds on sediment yield from the catchment would be less visible. Hence, there is an optimum level of treatment which needs to be carried out in the catchment beyond which intensifying the treatment would not produce additional benefits. In certain situations, such activities can also lead to negative social or environmental outcomes. Integrated catchment models could help identify the optimum level of various interventions to maximize the overall benefits9 in physical terms at catchment scale.
The knowledge about the difference between notional water saving and real water saving from efficient irrigation systems is crucial, while applying knowledge derived from farms to the catchments for planning. Sufficient insights into the likely impact of using efficient irrigation systems in terms of real water saving would help avoid un-intended consequences of depleting more water rather than freeing water from agriculture (box 2).
The fundamental question, however, is how this knowledge, which has been in existence for several decades in the public domain, is used for policy formulation. The key issue is with regard to the ability to convert this knowledge into ‘proper evidence’ to
9 The overall benefits in physical terms could be sum of the individual benefits of reduction in soil loss reduction and sediment yield, flood control, increased water availability of drinking, irrigation and other competitive uses, and water availability for ecological flows during lean season.
convince the policy makers, and counter the reductionist and misinformed view of ‘what constitutes evidence’ (Whitty and Dercon 2013).10
Main components of integrated catchment management in major international programmes/projects
Physical and technological Aspects
There is a wide range of technologies used in catchment management worldwide. One of the most important factors which determine the choice of technology is the agro-ecology. Ideally, the type of catchment management intervention should vary from humid, high rainfall regions to arid low rainfall regions; it should also vary from temperate climates to more tropical climates; the interventions for an area will mild slopes would be vastly different from those used in a hilly watershed. Some treatment technologies adopted worldwide in catchment management programmes are: terracing; contour bunding (for preventing erosion and soil & water conservation; contour trenching (for moisture conservation); grass plantation (soil conservation); gully plugs (preventing gully erosion due to runoff); gabien structures; check walls (for reducing erosive force of the runoff and to retain sediments); check dams (reducing erosive force of water and to impound some water); vegetative barriers on stream banks (preventing bank erosion); earthen dams (sediment control); sediment retention ponds; mulching (for moisture conservation); and afforestation (Buhl and Rahul, 2006). These aim to serve three different objectives viz., soil conservation, sediment control, water conservation and increasing vegetation cover. Diagram 2 gives a detailed account of treatment activities carried out on different types of non-arable land in a watershed, as proposed in the APRLP in Andhra Pradesh for areas with rainfall less than 600mm.
Over the last two decades, several new technologies and practices have been added to the watershed treatment technology package activities in India to address the local needs. Most notable among them is structures for artificial recharge of groundwater. Though these structures are not part of the
10 See Annexure 1A for a discussion on evidence based policy making.
Catchment Assessment and Planning for Watershed ManageMent: Volume II - Annexes16
conventional watershed treatment activities, they are adopted in view of the fact that groundwater depletion and degradation emerged as a major issue in many agricultural watersheds in the semi-arid and arid parts of the country. Many watershed treatment technologies are aimed at increasing and retaining soil moisture. This includes reducing rapid drainage that occurs when the precipitation rate exceeds the infiltration capacity of the top soil or when there is a localized or widespread saturation of the vadose layer. The recharge restructures, in contrast, try to create
the saturated conditions in the unsaturated zone whereby the hydraulic conductivity of the formation increases sharply. Most of them are aimed at augmenting groundwater resources in the watersheds. The most common among them include: construction of percolation tanks/ponds in the lower parts of the watershed; construction of check dams with recharge tube wells for direct injection of impounded water into the aquifers; construction of sub-surface dykes with or without recharge tube wells; and bore blasting with cement ceiling (COMMANS, 2005).
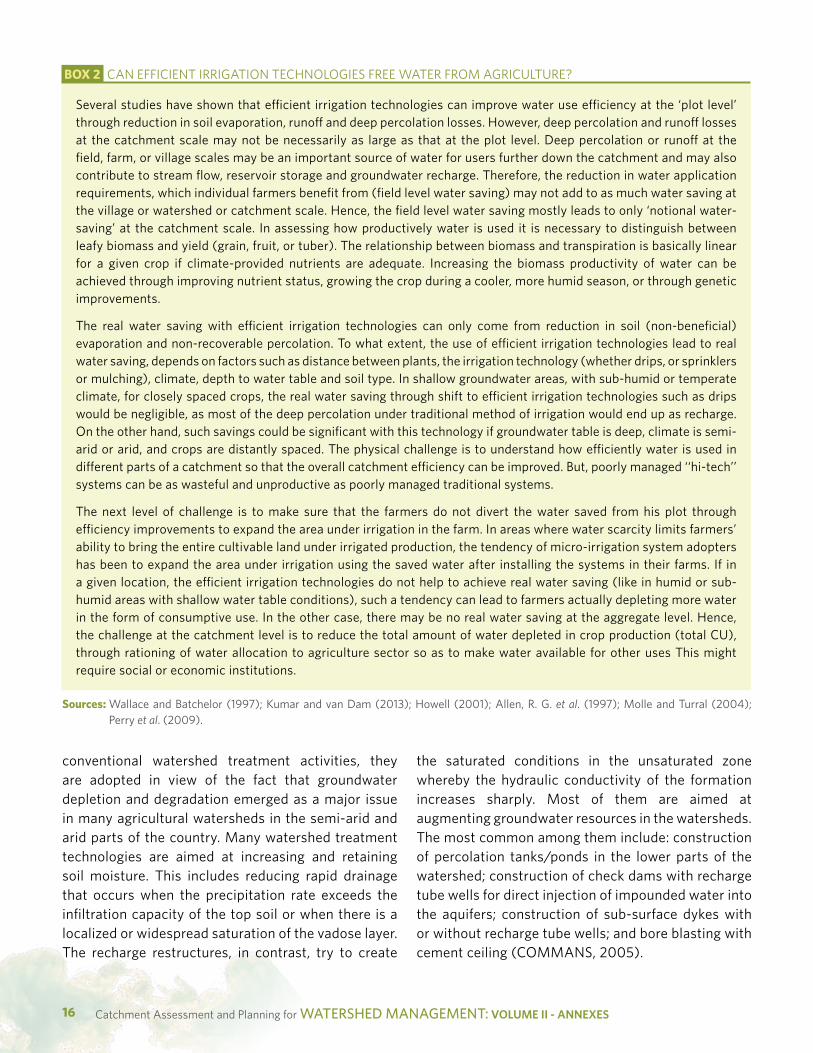
boX 2 CAN EFFICIENT IRRIGATION TECHNOLOGIES FREE WATER FROM AGRICULTURE?
Several studies have shown that efficient irrigation technologies can improve water use efficiency at the ‘plot level’ through reduction in soil evaporation, runoff and deep percolation losses. However, deep percolation and runoff losses at the catchment scale may not be necessarily as large as that at the plot level. Deep percolation or runoff at the field, farm, or village scales may be an important source of water for users further down the catchment and may also contribute to stream flow, reservoir storage and groundwater recharge. Therefore, the reduction in water application requirements, which individual farmers benefit from (field level water saving) may not add to as much water saving at the village or watershed or catchment scale. Hence, the field level water saving mostly leads to only ‘notional water-saving’ at the catchment scale. In assessing how productively water is used it is necessary to distinguish between leafy biomass and yield (grain, fruit, or tuber). The relationship between biomass and transpiration is basically linear for a given crop if climate-provided nutrients are adequate. Increasing the biomass productivity of water can be achieved through improving nutrient status, growing the crop during a cooler, more humid season, or through genetic improvements.
The real water saving with efficient irrigation technologies can only come from reduction in soil (non-beneficial) evaporation and non-recoverable percolation. To what extent, the use of efficient irrigation technologies lead to real water saving, depends on factors such as distance between plants, the irrigation technology (whether drips, or sprinklers or mulching), climate, depth to water table and soil type. In shallow groundwater areas, with sub-humid or temperate climate, for closely spaced crops, the real water saving through shift to efficient irrigation technologies such as drips would be negligible, as most of the deep percolation under traditional method of irrigation would end up as recharge. On the other hand, such savings could be significant with this technology if groundwater table is deep, climate is semi-arid or arid, and crops are distantly spaced. The physical challenge is to understand how efficiently water is used in different parts of a catchment so that the overall catchment efficiency can be improved. But, poorly managed ‘‘hi-tech’’ systems can be as wasteful and unproductive as poorly managed traditional systems.
The next level of challenge is to make sure that the farmers do not divert the water saved from his plot through efficiency improvements to expand the area under irrigation in the farm. In areas where water scarcity limits farmers’ ability to bring the entire cultivable land under irrigated production, the tendency of micro-irrigation system adopters has been to expand the area under irrigation using the saved water after installing the systems in their farms. If in a given location, the efficient irrigation technologies do not help to achieve real water saving (like in humid or sub-humid areas with shallow water table conditions), such a tendency can lead to farmers actually depleting more water in the form of consumptive use. In the other case, there may be no real water saving at the aggregate level. Hence, the challenge at the catchment level is to reduce the total amount of water depleted in crop production (total CU), through rationing of water allocation to agriculture sector so as to make water available for other uses This might require social or economic institutions.
sources: Wallace and Batchelor (1997); Kumar and van Dam (2013); Howell (2001); Allen, R. G. et al. (1997); Molle and Turral (2004); Perry et al. (2009).

ANNEX 3: Catchment Assessment and Planning: A Strategic Review for India 17
sources: Rao et al., (2003)
diagraM 2 WATERSHED TREATMENT ACTIVITIES
treatment of non-arable lands (rainfall < 600mm)
Hills (Slope >10%)
Construct trapezoidal diversion drain with 0.2-0.5% bed slope large enough to divert run-off from upstream area. Spoil on downslope side of drain. Run-off diverted to
recharge pond and used to establish a community irrigation scheme
Construct a diversion bund, 0.4-0.6m X 2 section. Vegetative protection required
Mounds, Slope: 5-10% Wastelands(Slope 0-5%) Gully lands
Exclude biotic influences (e.g. cattle) by establishing a social fence
Regulatory, Institutional and legal measures
There are several regulatory measures which can be used to bring about changes in the performance of the catchment (in terms of yield, runoff quality, condition of the wetlands etc), including the following:
Reducing the area under rain-fed crops – which ��
might help increase the runoff.
Reducing the area under irrigated cropland and ��
size of livestock – which might help reduce the nitrate load in the runoff, occurring as a result of leaching of fertilizers and organic waste from dairy farms in areas (McDonald et al., 1995). It can also prevent nitrate contamination of groundwater in humid high rainfall areas with shallow water table conditions (Kraft and Stites, 2003).
Contour trenches, 0.5 x 0.5 x 4m in
size. Trenches at 10m horizontal interval
planted with trees at 1m interval.
Catch pits between trenches,
0.5 x 0.5 x 0.5m in size. Trees planted in pits
Seed rest of area with Harmata, fodder
legumes etc.
Gradonis, 5-10m wide depending on the slope
Beds of Gradonis planted with
appropriate grasses and trees planted on
the benches
Apply 20-25 kg DAP/ha
•Silvi-pastoral systems
Contour trenches or crescent shaped pits,
4-10 m spacing
Plant trees in pits or trenches and suitable
grasses in between pits or trenches
Apply 20-25 kg DAP/ha
Ease the slide slopes and plant trees
Construct small earthen bunds across
the gully 1m wide and 0.15m high,
10-20m interval. Plant bunds with suitable
vegetation

Catchment Assessment and Planning for Watershed ManageMent: Volume II - Annexes18
Augmenting river flows during low flows and high ��
temperature - through increased release of water from reservoirs in the upper catchment - particularly for reducing algal growth, protecting birdlife and increasing fish breeding (Collins et al., 2007).
Successful implementation of ICM programmes requires institutional structures that facilitate the involvement of stakeholders in the development and implementation of appropriate natural resource management strategies and policies needs to be developed (Batchelor, 1999) – although there are some instances where developed countries have implemented integrated catchment management programmes through legal, institutional and policy approaches.
The fundamental change brought about in water management in these countries through the adoption of ICM approach has been organizing water resource management around hydrological boundaries. Examples are Australia, Britain, South Africa and France (based on Johnson et al., 1996; Bellamy et al., 2002; Buller, 1996; Batchelor, 1999; Cornell, 2012; EEB, 2010; Herrfahrdt-Pähle, 2010; Mitchell and Hollick, 1993; Schreiner and van Koppen, 2002).
However, many ICM strategies have not been able to bring about improvements in resource management at the catchment scale mainly due to lack of delivery mechanisms and enabling policies that generate the interest and trigger the participation of local institutions and communities (Batchelor, 1999). In certain cases, catchment management programmes were also implemented effectively without legislative support. But, in such cases, the success of the initiatives is very much dependent on involvement of community leaders and resource agencies (Johnson et al., 1996). Several institutional models for ICM have been tried around the world, with varying degrees of success, beginning in Europe (Britain and France in the early 90s), although the most common among the ones tried in developing countries is decentralized, community-based institutions for implementing watershed management programme at the level of micro catchment (Darghouth et al., 2008).
The nature and functions of these institutions vary from country to country and in a few instances from province to province. They range from: 1] the Catchment
Management Plans in Britain, which form the basis for the actions of its National River Authority (NRA) in the respective basins; 2] the two tier tradition of water management with SAGE (Schemas d aménagement et de gestion des eaux) and SADGE (Schémasdirecteurs d’aménagementet de gestion des eaux), implemented through local management commissions and a higher order River Committees, respectively, in France; 3] the River Basin Management Plans (BMPs) developed by the member states of European Union under its flagship legislation of European Water Framework Directive; 4] the Basin Plan, which provides a new management framework for a trans-boundary, river catchment level management of water resources in the Murray Darling Basin, encompassing four basin states, being implemented by the newly constituted MDB authority; 5] Integrated Catchment Management programme of western Australia, which enjoys, legislative, policy, administrative and financial support since the early 90s; and 6] Catchment Management Agencies (CMAs) in South Africa that are created for ensuring poor people’s access to water for domestic and productive purposes, being facilitated by DWAF under the National Water Act.
While the CMPs of Britain remain wholly consultative with respect to the planning process, with no binding force on land users, developers and local planning authorities, the NRA, which is the higher level institution, possesses a wide range of regulatory powers over the private and public bodies that directly impact on the water environment. While SDAGE has statutory obligations, SAGE is discretionary. With the passing of the European Water Framework Directive in 2000, more than ten years of planning and consultation went into development of River Basin Management Plans (RBMPs) by member countries. These plans are meant to be the main instruments for realising the environmental objectives of protection of water bodies from nutrient pollution. 14 out of the 27 member countries have come out with RBMPs for the basin districts in their respective countries. In Australia, the Basin Plan, which is legally enforceable, defines sustainable limits for groundwater and surface water; basin-wide environmental objectives; roles for a basin-wide water trading system; requirement of sub-plans for each one of the four states to implement the Basin Plan objectives; measures to improve the security of water entitlement holders. In South Africa, the process

ANNEX 3: Catchment Assessment and Planning: A Strategic Review for India 19
of establishment of Catchment Management Agencies began with the passing of the National Water Act in 1998, but only two out of the nine proposed CMAs are fully established and operational so far.
Table 1 summarizes the institutional arrangements for catchment management and the management instrument administered by then in selected countries worldwide.
Catchment Planning tools and Processes
Integrated Crop, Rainfall-runoff, Soil erosion and Economic models
Section 4.1.2 illustrated how various land-use changes in the catchment can influence the overall environmental condition of the catchment in terms of river water quality, sediment load in the runoff water, rate of soil erosion and soil loss and catchment yield, and also broadly how various management interventions could reverse these trends. It also discussed which interventions are most effective in achieving certain benefits. But, there are multiple social, economic and environmental objectives underlying catchment management approaches, and the interventions needed for achieving one of them could work at cross purposes with the other two.
As a result, the value of the marginal returns from ICM interventions owing to incremental benefits to some sectors may not be higher than the marginal costs, which will be the sum of the incremental cost of the interventions and the reduction in benefits to some other sectors, at every scale of intervention. The net marginal returns can become negative at some scale of a given management activity. It is therefore important to analyse the trade-offs (see box 3).
This would involve quantification of each one of the impacts from the selected ICM interventions, and assessment of the economic value of the net benefits accrued, for various scales of interventions, and choosing the one which gives highest overall benefits. Only such integrated assessments of resource use and resource management can provide good guidance to resource managers on decision making with respect to catchments.
Planning for catchment or watershed management in India, however, is not driven by considerations of the costs and benefits associated with the social and environmental outcomes along with those which are purely economic. This is partly because of the lack of scientific data defining the physical relationship between catchment interventions on land use and land cover, and their hydrological outcomes, and the economic imperatives (Kumar et al., 2006). Another reason is the drive to address the concerns of equity in distribution of benefits of agricultural productivity enhancement programmes to rain-fed areas where large number of poor people live (Kerr, 2002). Ultimately, what gets implemented as a catchment management plan has more to do with the current political economy rather than what is optimal from social, economic and environmental angles? Internationally, in many cases, water resource management projects have concentrated only on ‘physical control of water’. In other cases, economic aspects were attended to, but, environmental and social effects were at best given token consideration (Jakeman and Letcher, 2003).
The reason for this is that the decision on how much water is needed for meeting environmental flows demands answering questions like when, how often and
boX 3 CATCHMENT MANAGEMENT TRADE-OFFS
Improving the river water quality could be a social objective, as it would improve drinking water supply and human health outcomes. Getting adequate quantity of water for irrigation could be an economic objective, as it can help increase the income returns for the farmers in and outside the catchment who receive water from it for irrigation. While some of the land use interventions like reducing the intensity of agricultural land use or changing crop sequences in the catchment management could help meet the former, it can impact the latter adversely. Similarly increasing the forest cover in the catchment might help improve the catchment ecology with better soil cover, soil biota, improvements in micro climate and some benefits of reduction in occurrence of flash floods in situations of intense rainfall, it might lead to overall reduction in catchment yields thereby adversely forfeiting the social and economic benefits from the use of water flowing downstream.

Catchment Assessment and Planning for Watershed ManageMent: Volume II - Annexes20
for how long river flows are needed to protect various river ecosystem goods and services. But, the concepts, theories and methods of assessment of environmental flow and their practical applications are largely new in most developing countries. Moreover, environmental flow is a relatively new concept for the water sector and there is lack of awareness among the general public on the concept and its application (Japhet et al., 2005). Integrated assessment tools try to address these concerns by allowing efficient scenario generation for different catchment management choices, in particular assessment of the resultant trade-offs among indicators of environmental, economic and social outcomes (Jakeman and Letcher (2003). (Annexure 3 gives the details of application of this tool for three catchments.)
Planning Processes in Catchment Management
Catchment management is about managing the multiple perspectives and stakeholder interests, and the conflicts emerging out of it (Prato and Herath, 2007). But to begin with, planning for integrated catchment management requires scientific understanding of the interaction between the catchment flows (both surface water and groundwater) and the human systems which depend on it; and the catchment flows and water dependent ecosystems such as wetlands, swamps and biodiversity reserves. It is really important to understand two things: 1) The hydrological processes that determine flows and fluxes with respect to space and time; and, 2) how the hydrological gain in one location in the catchment would mean a loss for a downstream location. It is also important to base decisions on empirical evidence, rather than expert opinions and anecdotes (Whitty and Dercon, 2013). When such evidence does not exist in ample measure, it will have to be generated, sometimes through complex modeling tools, which are also referred to as Decision Support Tools (DST), which are used to decide on ICM interventions to enhance the catchment functions. As seen earlier, catchment-wide management of land and water resources has to be based on multiple objectives and criteria (Prato and Herath, 2007), and therefore involve trade-offs (Prato and Herath, 2007). For the trade-offs to be socially acceptable, multi-stakeholder dialogues is an essential component (Falkenmark, 2004; Warner, 2006).
Scholars have discussed a variety of tools and techniques for facilitating informed decision making for improved
catchment management, in situations of multiple values and objectives that exist among stakeholders. Annexure 4 gives brief account of the situations in which these tools were applied and the outcomes.
Besides the scientific and technical aspects of catchment planning process, there are other important aspects in the planning process, and which precede the former. They concern identifying community desires and objectives with respect to development of catchment; developing strategies to meet the objectives; and carrying out audits. This requires institutional platforms like the CMPs in England and Wales, SAGE in France, CMAs in Western Australia. Institutional development process, which is often long drawn, is integral to the planning process, as illustrated by the experience of setting up Catchment Management Agencies in South African river catchments (annexure 5).
Community participation in the management of river basin areas is explicitly stipulated in Article 14 of the European Water Framework Directive (EWFD) (European Union, 2000), which states that the general public should be consulted in the formulation of basin management plans. However, there are indications that the ‘Directive’ accepts public involvement which is reduced to mere ‘consultation’ and ‘information provision’ rather than meaningful participation. Again, if such consultation processes are dominated by powerful groups like the state water agencies, communities may not have much influence on the process (Mostertman, 2005). Communities can easily get frustrated into thinking that ‘nothing every changes’ and therefore will find the entire exercise meaningless. Since participation involves considerable opportunity cost for the stakeholder groups, the benefits have to outweigh these costs (Warner, 2006).
outcomes of implementing CM Plans: experience from select Countries
A few countries or territories have implemented the concept of ICM programmes and projects in terms of management instruments called ‘catchment management plans’, and also created institutional arrangements for their implementation. Australia has been a pioneer in implementing ICM, often basin-wide, using formal institutional structures or

ANNEX 3: Catchment Assessment and Planning: A Strategic Review for India 21
otherwise, covering large geographical areas. Many countries in the European Union had implemented ICM, sometimes within the country’s territories or at the scale of international river basins. But, studies that scientifically documented the outcomes and impacts of such initiatives on water resources are extremely limited. Limited evidence seems to suggest a mixed experience.
The United Kingdom had implemented environmental management policies and institutional structures for achieving the goals of ICM in early 1990s. But, as per the recent monitoring data across England and Wales, percentage of rivers that have nitrate levels exceeding 30mg per litre changed from 29.9% in 1995 to 28.3% in 2005 and the percentage of rivers with phosphate levels exceeding 0.1 mg per litre increased from 50.3% to 51.5%, during the same period. Such unexpected outcomes are the result of failure to apply ‘systems perspective’ while using the well-established scientific knowledge about physical processes in policy formulation. What this suggests is that catchment management requires natural and social scientists to work more closely, to provide robust analysis of water management outcomes of environmental policies that fully considers the biophysical, social, political and economic settings (Macleod et al., 2007).
But, there are notable positive experiences with catchment wide water trading and reallocation of water for environment in the case of Murray Darling Basin and integrated catchment management in New South Wales in Australia, even prior to the implementation of the National Water Act of 2007. Water trading has been progressively introduced in the southern MDB since the late 1980s, along with further reforms in the mid-1990s and again in the mid-2000s. It was based on the premise that trading provides economic benefits to buyers and sellers, and to society as a whole. Trading of water rights enabled increased water use efficiency in irrigated production, through the movement of water from low valued uses to high valued uses (NWI, 2010) (see Annexure 6 A for details of impacts of water trading in MDB).
Whereas in the NSW, the 13 catchment management authorities created under the ICMP have become effective mechanism for supporting land owners to voluntarily manage their land better for both public and
private benefits. It has given the regional communities a more direct say in the complex task of reconciling community needs with ecosystem health. The audits of the CMAs done, during the recent droughts, showed improvement in resource condition in half of the cases (see Annexure 6B for details).
CatChMent assessMent and Planning for Watershed ManageMent PrograMMes in india
status of knowledge about Catchment hydrology for WsM Programmes in india
In India, the current state of knowledge about the catchment processes, i.e., how land use and land cover changes in catchments influences its environmental conditions including the flow regimes, the quantum of flow, sol erosion, sediment load and water quality in different regions is extremely inadequate. One major issue is that the other key factors which determine the impact of land use and land cover on catchment hydrology, viz., rainfall regime, geohydrology, climate, soils and topography, vary remarkably from region to region, making it difficult to apply the limited knowledge available for select catchments from other parts of the world, for the hundreds of thousands of country’s catchments, which have varying environmental conditions (see box 4). This means, in the India context, such scientific data need to be generated for typical catchments.
A major lacuna arises from the lack of adequate scientific knowledge of catchment characteristics, hydrology, hydro-geology, stream-flows and groundwater-surface water interactions. To start with, hydrological data are not available for many catchments. Many small basins in India are un-gauged for stream-flows, and some do not even have adequate number of rain-gauges to capture the spatial variation in rainfall across the basin11. Also, the data from non-IMD stations such as those managed by agricultural
11 Examples are the west flowing basins in North of Tapi in Gujarat and South of Luni in Rajasthan, and the west flowing rivers in the Western Ghats. In addition to these rivers, there are many tributaries and sub-tributaries of large rivers, which are un-gauged (Kumar et al., 2006).

Catchment Assessment and Planning for Watershed ManageMent: Volume II - Annexes22
While in a semi-arid or arid region of India, the impact of deforestation (removal of natural forest cover) on groundwater regime would be positive, and in a humid region, it could be just the opposite, as in the latter the evapotranspiration loss of water from tree and grass cover would be very negligible while their contribution to improving recharge could be significant.
In a hilly region receiving high rainfall under humid climate, increased replacement of native vegetation by crop cultivation after terracing could increase the utilizable water availability in the basin through augmented recharge and base flows. Whereas the same type of land use change in a hot semi-arid region receiving low to medium rainfall would just be opposite. The land use change could reduce the water availability through increased crop ET and fast depletion of soil moisture. They key difference is in the type of natural vegetation which can occur under the two agro-ecologies.
universities, state irrigation department and forest department is of poor quality. While rainfall-runoff relationship can be established with known values of daily rainfall, data on soil type, land use and land cover, such datasets are also not available for small catchments on spatial scale. This makes it practically impossible to analyse how changes in land-use and land cover in the past had affected the catchment hydrology and the likely future changes in the same. Improved access to online terrestrial and data (on rainfall, soil moisture etc.) acquired using wireless sensors and properly calibrated, is making it a lot easier to understand catchment hydrology, especially rainfall-runoff relationships, when supported by field
evidence of catchment outflows and inflows into tanks and other wetlands (see box 5).
Groundwater-surface water interactions are important, but more significant for hilly and mountainous catchments, wherein groundwater outflows contribute to stream flows not only during monsoon but also during lean season. By their very nature, these hilly and mountainous become priority areas for catchment management initiatives. But water resource assessment, especially groundwater resource assessments, do not provide any separate data on groundwater outflows into surface streams (base flow) in such regions.
boX 4 DIFFERENTIAL IMPACT OF DEFORESTATION & CROP CULTIVATION (AFTER FOREST CLEARANCE) UNDER DIFFERENT AGRO-ECOLOGIES
Benefits of modern IT not only include information on available water to meet demands, but also information about the resources. There is an expanding frontier of wireless products affecting field data acquisition like wireless rain gauges, soil moisture probes, water level recorders. As their costs and size comes down, there will be more wireless sensors that will make it easier for field data acquisition--both for those using field PCs as well as those using stationary data loggers. The future use of wireless sensor Local Area Networks (LANs) will improve field measurements by allowing more flexibility for gauging sites and the number of sites monitored. Innovations in data loggers in recent years allow greater amounts of data storage, as well as more flexibility for network communications. More choices abound, both for those whose work demands more sophisticated onsite processing, as well as for those more interested in saving raw time series values for subsequent processing.
Field instrumentation for hydrological monitoring involves sensors (including wireless) to measure quantity (level, flow, precipitation, content) and quality (temperature, conductivity, turbidity, etc.) of water. A data logger with power supply and accessories are housed in a suitable enclosure. In addition to the data logger, a field PC with GPS are also required. The hydrographer can then enter manual readings with an integrated GPS data stream, and is also able to record boundary locations with area calculations. These notes and related data can subsequently be transferred to more sophisticated GIS databases and used in conjunction with digital elevation models and land use and land cover data generated for watersheds using remote sensing data for a wide range applications such as runoff estimation, slope stability mapping, flood risk mapping, water quality monitoring, pollution source detection and snow cover mapping.
boX 5 USING WIRELESS SENSORS, GPS AND COMPUTERS FOR STUDYING WATERSHED HYDROGRAPHY
sources: Government of Newfoundland and Labrador (2010).

ANNEX 3: Catchment Assessment and Planning: A Strategic Review for India 23
Planning for Catchment Management in the iWMP
The planning for watershed management activities in India under the IWMP is highly decentralized, while the funds for undertaking the programme is from the central plan allocation, administered by the Ministry of Rural Development, Government of India. The plan allocation is driven by the consideration of the number of districts and the total land area falling under rain-fed category in each state. The underlying premise is that areas that are rain-fed –areas where the total net irrigated area is less than 25% of the cultivable area – attract much less government investment in agriculture as compared to irrigated areas owing to limited water from public irrigation schemes, fertilizers and electricity from state utilities which are heavily subsidized, and therefore government needs to invest in raising agricultural productivity in these areas through watershed management programmes. Also, since most rain-fed areas in the semi-arid and arid parts of the country face problem of groundwater over-exploitation (Kumar, 2007), the programme is justified as a tool for arresting groundwater depletion through augmenting groundwater.
In developed countries, integrated catchment management programmes were initiated in recognition of the growing land use conflicts in the catchment, and need for improving the overall catchment performance to meet the multiple objectives of reducing fertilizer leaching from farm land for improving runoff quality, augmenting the downstream flows for fish breeding during certain parts of the year, augmenting lean season flows for the environment and making more release for recreation, navigation, etc. The primary concern therefore was of re-allocating water from agriculture to other sectors and to make agricultural land use more ecologically sustainable.
But, in India, the primary objective has been improving the productivity of agricultural land by making more water or soil moisture available to the farming communities, and arrest degradation of common land (Farrington et al., 1999; Kerr, 2002; Hope, 2007). The key concern is improving soil moisture regime in the agricultural and non-agriculture land and augmenting groundwater recharge. The unit for planning catchment management interventions is a micro watershed with area ranging
from 500-1,000 ha. Selection of such small units makes it difficult for communities within the watershed to foresee other potential uses of water which flows out of their catchments.
The central funds which are allocated to the states are routed through the district rural development agencies, which in turn allocate the funds to a wide range of agencies12, to finally reach the watershed communities. The Project Implementing Agencies (PIA), which receive the funds from against the proposals that specify the watersheds and the area to be treated, carry out watershed planning in their respective areas with the involvement of the stakeholder communities, through an institution of the communities which are promoted by them, called Village Watershed Committees (see Diagram 3 for details of flow funds).
Watershed planning in India under IWMP generally does not involve any scientific considerations of the catchment hydrology, including available runoff and un-committed runoff from the catchment (Batchelor et al., 2003). The programme focus is on soil and water conservation measures and water resources development. Since the unit for planning is very small, for which hydrological data are not available (except for experimental watersheds), hydrological planning is hardly attempted. The KAWAD project is a clear illustration of this poor planning (annexure 7).
It also does not consider the demand for water in the watershed (from irrigation, livestock drinking, domestic uses and water for environment) against the utilizable surface and groundwater. While water demand far exceeds the supplies in most semi-arid and arid regions of India (Biggs et al., 2007; Batchelor et al., 2003; Kumar et al., 2008), with increasing number of basins either closed or on the verge of ‘closure’ (Biggs et al., 2007; Kumar et al., 2008), the programme by design does not involve components which address demand management issues (Batchelor et al., 2003). Instead, the accent is on building more water harvesting structures, on the premise that it would increase the local water supplies, an idea supported by most researchers and
12 The agencies include NGOs, government departments such as State Land Development Corporation, State Forest Departments, and Agricultural Universities.

Catchment Assessment and Planning for Watershed ManageMent: Volume II - Annexes24
academicians. While environmental flow considerations are gaining greater acceptance in water resource decision making, this is hardly visible in watershed management programmes and policies in India (Hivji and Davis, 2009; Smakhtin and Anputhas, 2006).
While the approach is participatory planning at the micro watershed level,13 the Village Watershed
13 Participatory tools such as resource mapping, transect, role play etc. are employed in micro planning for watershed management by the implementing agencies, particularly the NGOs. As noted by James (2000) in the context of APRLP, in certain cases, the VWCs made use of remotely sensed data along with participatory assessment information.
Committees are not supported by any scientific data on the catchment slopes, soil types, the drainage lines, land use and land cover, which are very crucial for scientific planning for effectiveness from both physical and economic perspectives. Generally, the implementing agency does not have resources available for generating such information in the project funds. Nearly 85-90 per cent of the funds allocated for to be used for physical interventions. The remaining funds are used for covering the overheads of the PIA to support social engineering (travel, meetings, awareness programmes and trainings). The knowledge about how various land uses affect watershed (catchment) hydrology is very tentative and hence the impact of the proposed interventions.
diagraM 3 ‘PLANNING AND FUNDS FLOW FOR WATERSHED MANAGEMENT IN INDIA
Central funds for watershed management (dolr, Ministry of rural development
Fund allocation per ha of land (twice a year)
Action plan for watershed development
Village Watershed Committees, assisted
and supervised by Gram Panchayat
State Government (Department of Rural Development or State Level Nodal Agency)
Project Implementing Agencies (NGO’s and Government Departments (State Land Development Corporations, State Forest Departments, and Agricultural
District Watershed Development Units
Annual action plan
Technical Inputs from National Rainfed Area
Stakeholder Involvemen
Planning for watershed treatment
Assisted by District Planning Committee and Zilla
Parishad

ANNEX 3: Catchment Assessment and Planning: A Strategic Review for India 25
It is widely believed by the planners as well as PIAs that tree planting is very good for improving the flow regime of the catchment if not augmenting the flow itself, irrespective of the climate. The application of scientific knowledge of forest hydrology is hardly visible. Similarly, it is believed that adoption of micro irrigation technologies would eventually lead to reduction in water use in agriculture.
Also, in many watersheds, paddy is being targeted for reducing agricultural water use by suggesting alternate crops, without what fraction of the total amount of water applied to the field is consumed by the crop (ET). Contrary to what is widely perceived, in many areas, paddy fields are a major source of recharge to groundwater and in humid tropics can help regulate floods in the catchments by providing cushion for excessive runoff during high rainfall events (Homdee et al., 2011; Alansi et al., 2009). But, its overall impact on groundwater balance would depend on whether the crop is irrigated from the local groundwater sources or from imported surface water through canals.
boX 6 THE WATERSHED MYTHS
Very often, conflicting claims are made about the potential impact of the interventions. No doubt, a well-designed and executed watershed development intervention works in terms of improved recharge in the treated watershed and reduced soil erosion. But these benefits accrued often come at the cost of hydrological changes that may not be desirable like reduced stream-flows downstream. While one of the socio-economic indicators of success of IWMP has been increase in area under cultivation and irrigation in the treated watershed, which meant increased consumptive use of water in crop production, the claim of ‘increased base flow during lean season is also being used simultaneously to defend any opposition from the Irrigation Department to extensive water harvesting work carried out under the programme by the PIA. But, the point is that increased consumptive use of water in the watershed has to come with a reduction in runoff from the watershed or base flow or both.
Several misconceptions drive the choice of technologies and practices under watershed management (see box 6).
In India, the agro-ecology of the rain-fed area ranges from hot and arid tropical areas with very low rainfall and flat topography (as in western Rajasthan) to cold and humid sub-tropical areas with excessively high rainfall and mountainous topography (as found in the NE hilly region). Interestingly, rain-fed areas exist under both the conditions. While in the first case, the crops remain largely rain-fed due to lack of sufficient water for irrigation, whereas in the second case, the crops do not require irrigation water for most parts of the year due to excessive rainfall over long time periods and
soil moisture. The kind of issues relating to catchment management in the former would be drastically different from that in the latter. While in the former, the focus should be on introducing limits on water diversion for biomass production (from trees and agricultural crops) and improving the efficiency of use of the water allocated to that sector, in the latter plenty of scope for regulating the monsoon flows, reducing soil erosion, controlling sediment load in runoff and augmenting local surface water storage locally might exist, through increasing vegetation cover and making structural interventions.
Hence, the ICM interventions will have to change as we move from one agro ecology to another. But, the uniform guidelines for watershed management and the standard norms on financing based on area treated which do not consider the agro-ecology do not encourage development of innovative approaches that would make hydrological and economic sense. Hence, the strategy followed for watershed management is the same across agro-ecologies.
Watershed Management ‘best Practices’ in india
Watershed development pilot project was first implemented in the country in 1985 in the states of Andhra Pradesh, Orissa, Maharashtra and Karnataka with a World Bank aid (Planning Commission, 7th Five Year Plan, Vol 2). The objective was to develop dry land areas on watershed basis on the crop capability of the land and potential it offers for further optimum utilization. The main components of the program were soil and water conservation measures, production systems, and treatment of non-arable lands. National watershed development project for rain-fed areas (NWDPRA, 1991)

Catchment Assessment and Planning for Watershed ManageMent: Volume II - Annexes26
was launched in 7th plan period initially in 16 states spread over in 99 districts and was intensified in 8th plan. The Council for Advancement of People Action and Rural Technology (CAPART) also sponsored some projects on watershed conservation and area development in chronically drought affected areas.
By the late 1990s watershed development became a focal point for rural development in the country (Farrington et al., 1999). A wide variety of donors and development agencies, including the central government, several state governments, several bilateral assistance programs and assorted nongovernment organizations, started promoting watershed development (NGOs) (Kerr, 2002). The first large-scale projects took a highly technocratic, top-down approach that paid little attention to local technical and managerial knowledge, and showed disappointing performance. Then, there was a gradual move toward greater local participation and acceptance of local technologies, and better performance in terms of conservation and productivity (Farrington et al., 1999). But, best practices on watershed development and management, implemented on a considerably large-scale are not many: The Indo-German watershed programme is one of very few and even then, only in a few aspects (Annexure 8).
impacts of watershed management programmes in india
The focus of watershed development in India has modified over the last 25 years from soil conservation to water conservation to now include a more participatory planning approach, evaluation studies estimating the distribution or magnitude of social impacts from watershed development are often unclear or disputed (Hope, 2007; Kerr et al., 2002; World Bank, 2004).
Very few studies, based on catchment monitoring and research, are available to help evaluate the impact of catchment management interventions on their environmental conditions. They pertain to the following: the hydrological and bio-physical impacts of the interventions at the level of micro catchments in terms of changes in runoff collection efficiency; increase in vegetation cover; soil loss from the catchment (Panwar et al., 2012; Garg et al., 2012); and groundwater recharge (Garg et al., 2012). They all show positive impacts at the
local level (Panwar et al., 2012; Pathak et al., 2013; Garg and Wani, undated). But, these micro level studies are not representative of the hydrological conditions such as rainfall, slope, geohydrology, soil type, land use and land cover, of the large catchments they are part of. In nutshell, the impact assessments do not factor in the ‘scale effects’. In other words, the hydrological processes that matter for micro watersheds or the mathematical relationships representing the hydrological processes (say for instance, the rainfall-runoff relationship and catchment outflows) will not be same as that for the large catchment in which these micro watersheds fall14. This makes it difficult to draw useful inferences of catchment-wide interventions for the large catchment in question.
Several researchers have provided empirical evidence to illustrate the ‘scale effects’ in small water harvesting (Bachelor et al., 2002; Gupta, 2011; Kumar et al., 2008; Ray and Bijarnia, 2006; Talati et al., 2005) and watershed development (Batchelor et al., 2002; Syme et al., 2012). annexure 9 provides detailed account of such scale effects as show by empirical studies from India.
Economic valuation of watershed management programmes also suffers on many counts: they fail to link the measurable indicators of watershed impacts to planned interventions (Hope, 2007); and they are not able to capture the negative externalities (World Bank, 2007), which are very significant as shown by several empirical studies across the country Batchelor et al., 2003; Calder, 2005; Hope, 2007; Kumar et al., 2006 & 2008). Over and above, there is failure to capture the lasting effects of project interventions on the social and natural systems (Barron and Noel, 2011). Failure to quantify the hydrological gains from the structures to compute the economic value created from the use of the additional water stored in the catchment is another pressing problem (see annexure 10 for details). Findings of studies on socio-economic impact of watershed development programmes from different authors, particularly those relating to poverty impacts, often
14 For instance, in the catchment of Kabani River in Kerala, which is the uppermost catchment of Cauvery river basin, the rainfall runoff relationship suggests that more than 80% of the rainfall is converted into runoff (mimeo), with a runoff of around 2.40m. Whereas, the runoff estimated for the basin as a whole on the basis of dependable yield and the drainage basin area is only 0.216m (Kumar et al., 2008).

ANNEX 3: Catchment Assessment and Planning: A Strategic Review for India 27
contradict (source: based on Hope, 2007; Buhl, 2006; Kerr, 2003), while the skewed distribution of benefits from projects which achieved resource conservation productivity gains, towards large land holders is visible (Kerr, 2003). annexure 11 provides details of the findings from these studies.
sustainability of Watershed Management institutions at the Micro level
In countries where catchment wide management of land and water resources has been attempted, the need for the same was felt by the community groups living within the catchment. Such needs have arisen due to conflicts arising out of excessive diversion of water for agriculture or excessive use of nitrogenous fertilizers in the farm land or disposal of effluents in the rivers by users who constituted a small share of the watershed population. Such uses had impacted on several of the downstream users of water, including environmental uses, fisheries and recreation and quality of drinking water for a large section of the population (Prato and Herath, 2007; Collins et al., 2007).
The relationship between the nature of land-use and the resultant impact on the ecological and economic services provided by the catchment was quite visible. More importantly, the communities could value enhanced ecological services such as increased hot weather flows and reducing coastal salinity, high quality water for drinking water supplies and management of aquatic ecosystem including protection of rare species of fish, which could be derived from such initiatives (Collins et al., 2007; Cornell, 2012; Johnson et al., 1996; Prato and Herath, 2007). In certain other cases, it came out of the realization that there is high degree of fragmentation of water management institutions as found in Britain and France (Buller, 1996) or the policies and activities carried out by a various agencies in the catchments need to be coordinated and communities need to be involved in the programme as in Western Australia (Mitchell and Hollick, 1996), or as the aftermath of a legislation to ensure poor communities’ access to water for domestic and productive needs as in South Africa (Schreiner and van Koppen, 2002).
But, the situation in most of Indian watersheds which undergo watershed management activities differs
drastically from what is illustrated above. In general, the cost of participation outweighs the benefits. First: there are clear winners of an effectively implemented watershed programme, while there are losers (Johnson et al., 2001). Second: the opportunity cost of non-participation in the programme does not exist for the individual members of the communities, including those who are likely to be adversely affected. The reason is that the programme mostly produces non-tangible public goods and the newly created institutions do not perform any role for distribution of benefits accrued from enhanced watershed performance, either for improving poor the poor’s access to groundwater or ensuring sufficient water in the local aquifer for domestic uses during the lean season (Shiferaw et al., 2006). Third: the local institutions are not internally driven, but instead are driven by external support, and receive too little support for their own capacity building (Singh et al., 2012), fall in the capability trap, and ultimately collapse once the donor withdraws from an area (Sinha and Sinha, 1996). annexure 12 describes the range of factors which lead to poor sustainability of watershed institutions. The efficacy and sustainability of the structures built under the programme also leaves much to be desired (see box 7).
MaJor findings the science of catchment hydrology is well ��
developed internationally, with sufficient knowledge and understanding of the manner in which the hydrology changes in response to changes in land use and land cover in the catchment. But, there is sufficient evidence of delayed use of this knowledge in catchment management programmes, particularly in the developing countries like India. The impact of forest on yield of catchments and groundwater balance, and conversion of non-beneficial evaporation in some cases into beneficial ET can be at the cost of reduced runoff and groundwater are just two of them.
Modelling tools exist for simulating the complex ��
hydrological processes in catchments, which, if used correctly, have the potential to predict hydrological outcomes for projected changes in land use and land cover in terms of runoff, soil loss and sediment transport. They include ‘integrated

Catchment Assessment and Planning for Watershed ManageMent: Volume II - Annexes28
modeling tools which have built-in rainfall-runoff model, crop simulation model, soil erosion model and sediment transport model. Models which incorporate economic outcomes of catchment management interventions into the hydrological and bio-physical models also exist, which can act as Decision Support Tools (DST) for integrated catchment management.
Catchment management decisions will be based ��
on multiple objectives and criteria, which are social, economic, environmental and political, given the variety of uses and users of land and water in the catchments. Often, there could be strong trade-off between maximizing economic outcomes and meeting environmental and social goals, and vice versa. The utility functions for catchment management would be based on all these, and making the right management choice is about minimizing the trade- offs, but to what extent this trade off could be minimized depends
on which stakeholder has the political influence or is powerful. The challenge is to ascertain the weightage to be given to each one of the criteria, depending on the needs and concerns of various stakeholders in the catchment.
Catchment management plans should offer a ��
vision for the catchment and its communities for the future. Therefore, it is important that that they accept the rules and framework of actions broadly defined by such plans. Often, the communities are not really convinced about the influence of individual actions on catchment functions--goods and services provided by the catchments, like the impact of free grazing on natural regeneration of vegetation, catchment yield and quality of water or the agricultural practices on quality of water in streams.
Catchments cannot be managed merely on the ��
basis of scientific knowledge of hydrological and
The effectiveness of WHS in a catchment depends on three main factors: the efficiency of groundwater recharge; the storage capacity of the underlying aquifers; and the dynamic interactions between surface water and groundwater (Kumar et al., 2008). Even in areas that have poor groundwater recharge efficiency and low aquifer storage capacity, WHS, are being used as the main interventions and for every WHS built within a catchment the marginal benefit decreases to a point where building extra structures makes absolutely no difference to groundwater recharge rates (Glendenning and Vervoort, 2011). Because there is poor planning and coordination, it is often the case that there are many more WHS constructed than are needed within a catchment (Kumar et al., 2008).
For many years the negative impacts of WHS construction were either unaccounted for or ignored (Glendenning and Vervoort, 2010). Generally though neither the positive or negative impacts of Rainwater Harvesting (RWH) are evenly distributed; often one part of the catchment can benefit through increased groundwater availability while another suffers due to receiving less runoff. This means that the construction of WHS can actually increase inequalities within catchments (Ray and Bijarnia, 2006). The widespread construction of RWH structures in India has been a hasty reaction to the problem of water scarcity characterised by a lack of hydrological and economic planning (Kumar et al., 2006).
Despite the widespread belief in the benefits of constructing WHS, evidence to support their local benefits is relatively limited, partly because recharge rates are so difficult to measure (Glendenning et al., 2012). Evidence also suggests that even at local level the efficiency of WHS can be poor, especially in hard rock regions such as Andhra Pradesh because aquifers in these areas generally have low storage capacity and during the wet season are often fully replenished by natural recharge even in the absence of WHS (Kumar et al., 2008).
Apart from efficacy, an important issue is the duRability of the structures. For instance, in an attempt to increase the sustainability of groundwater a large amount of money has been invested in WHS in village Ungaranigundla (Dhone Mandal, AP). But, majority of these structures are either in need of repair or are completely defunct. In total, approximately US$ 55,000 has been spent constructing water harvesting structures within the revenue village (Ungaranigundla village, Dhone Mandal, AP). However despite this significant investment, more than half of the WHS in the catchment are either completely defunct or are in need of repair. It is clear that the life cycle of water supply infrastructure is relatively short and little money is being invested in operation and maintenance. Instead, infrastructure is being replaced relatively frequently by new constructions.
boX 7 EFFICACY AND SUSTAINABILITY OF WATER HARVESTING STRUCTURES

ANNEX 3: Catchment Assessment and Planning: A Strategic Review for India 29
ecological processes. There is a need to recognize the fact that individual actions of the community members are not governed by scientific practices that promote good catchment functioning, but other considerations. That only can foster the awareness of interdependencies between individual actions and catchment functioning and optimize the individual actions—for instance link between agricultural practices in the upper catchment and river water quality downstream. Facilitating the dialogue amongst the stakeholder groups in the catchment, the scientists and policy makers would help ‘social learnings’ wherein the experts and policy makers understand the rationale behind the individual actions like intensive use of fertilizers. Awareness of the interdependencies can be created through appropriate practical initiatives that provide a systemic awareness of the context in which the individual actions and catchment functions are positioned. That can help frame rational policies that ultimately work.
In countries where ICM practices are attempted, ��
the need for catchment-wide management of land and water resources had mostly arisen in response to the prevailing or perceived future conflicts over land and water use so as to ensure water for environmental flows to prevent coastal salinity, augmenting lean season flows for ecology, and preservation of aquatic life and protection of water quality for drinking. The objectives for catchment management varied across countries and situations though. While in the Murray-Darling Basin of Australia, the objective was to limit the water abstraction from the catchment to sustainable diversion limits, in South Africa the main objective was to ensure water access to the poor native communities for domestic and productive needs, as provided by the National Water Act of 1998. Britain has established a more unified water management structure in the form of the NRAs, and the CMPs have emanated largely from what is demanded from the NRA under the 1989 Water Act. In France, the approach to catchment management has largely been a state-led institutional response to the failures or inconsistencies of pre-existing management and regulatory structure. In Western Australia,
the objective was to coordinate the policies and activities of the existing agencies under the prevailing structure.
Catchment management planning is a process ��
and not a one-time activity, outcomes of which would be determined by who initiates and facilitates the process. Different countries follow different processes. While in the MDB of Australia, which has a long history of catchment management, the activities of various catchment management agencies are to be now regulated through a Basin Plan, which is a legally enforceable document. Within the framework of action provided by the Basin Plan, the four basin states are expected to come out with their own plans for water diversions for competing uses and the environment. In South Africa, under the National Water Act, the DWAF is to facilitate the process of setting up CMAs within each basin, statutory bodies for basin-wide management of water resources. The CMAs are expected to come out with their own technical proposals for managing their catchments with the larger goal of participatory basin management. But, till 2012, only two CMAs could become operational in the country.
international experience with integrated ��
Catchment Management varies. In Britain, the CMPs form the basis for the NRA’s actions within each catchment. The French SAGE and the SDAGE follow a two-tier tradition in catchment management. SDAGE is a forward planning document at the regional level, concerning major drainage basins, whereas SAGE is a more precise planning document at the local level for small local catchments (around 100-200 sq. km). In Western Australia, the Community Catchment Groups are formed to define the principles and rules for management of their own catchments, under political, administrative and financial support from the Office of Catchment Management.
in india, watershed management, the term ��
widely used for catchment management for micro catchments, as a policy instrument and programme has evolved as a participatory approach for managing both private and common degraded lands for enhancing agricultural

Catchment Assessment and Planning for Watershed ManageMent: Volume II - Annexes30
productivity in rain-fed areas using watershed as the unit for treatment of land, with the ‘ridge to valley’ concept. The entire focus is on soil and water conservation and water resources development at the micro catchment level. The unit of catchment planning being the micro watershed, ‘scale effects’ are not considered in the planning.
there is little evidence of hydrological ��
considerations in catchment planning. Given the fact that scientific data on stream-flows, groundwater resource availability, groundwater-surface water interactions in the catchment and the catchment characteristics are largely absent for micro watersheds chosen for implementation by PIAs, the tendency is to over-estimate the resource availability so as to enhance the scope for treatment water resource development interventions. The existing WH structures in the micro watersheds or in the large catchment to which these micro catchments feed are not taken into consideration in the planning.
There is growing criticism that in many areas ��
there is overdoing of watershed interventions in the form of water harvesting structures. Despite this, the 12th Five year plan document emphasises intensification of the watershed development programme through convergence of IWMP and NREGS (National Employment Guarantee Scheme), which ensures availability of sufficient funds to keep the programme going in the entire country.
the iWMP is implemented using a decentralized ��
approach, through village watershed committees formed by NGOs and other agencies. They are financially supported by the Ministry of Rural Development through the dept. of rural development of the respective states and their district level arms (i.e., DRDAs). The physical interventions are planned by the VWCs with the help of the PIAs, which are in turn supported by state level resource agencies. The monitoring and evaluation of the watershed activities are carried out by the State line departments. The DOLR undertakes periodic monitoring of the projects through quarterly progress reports furnished by the State departments in the online Management
Information System, mid-term evaluations, and special impact assessment studies.
the programme by design promotes resource ��
development and exploitation, and does not envisage any mechanism either for sharing the augmented resources equitably or for promoting sustainable and efficient use of water and land. Intensive water harvesting activities carried out under the programme, without due consideration to the catchment hydrology, compounded by groundwater over-exploitation help improve economic returns for the farmers. But, they also simultaneously cause negative effects downstream in terms of reduced flows into tanks and other wetlands, and drinking water shortage.
there is little evidence of involving local ��
stakeholders in designing management strategies, though there are multiple uses and users of water, biomass and land in the treated watersheds. The heavy emphasis on water harvesting means that the programme is primarily targeted at benefiting the agricultural communities in terms of improved land productivity and water access, while the cost being borne by the landless (herders, fodder and fuel-wood collectors), who are denied access to the forest land and pastures due to ban on grazing and tree cutting.
Watershed management programmes across ��
the country follow the same norms and guidelines vis-à-vis the technical strategy and the expenditure for treatment activities, despite the fact that these are being designed and implemented in different agro-ecologies. Despite the fact that the agro-ecology of rain-fed areas varies drastically from hot and arid semi-arid tropical climate in the plains to cold and humid, sub-tropical climate in the mountainous areas, the focus is on soil and water conservation and water resources development. While in the low-medium rainfall regions the problem is of excessive use of water for agriculture with resource depletion, in the high-very high rainfall regions with steep slopes the problem is of poor soils and excessive soil erosion and sediment load in water along with poor utilization of the available renewable water resources.

ANNEX 3: Catchment Assessment and Planning: A Strategic Review for India 31
There is some evidence available from scientific ��
research and monitoring on the positive hydrological impacts of watershed management interventions at the local level in terms of improved runoff collection efficiency, soil loss reduction, sediment control and augmentation of groundwater recharge, when interventions are designed on the basis of scientific data. But, the schemes do not appear to be economically viable at catchment scale. Scientific evidence available from studies in watersheds of Karnataka, Andhra Pradesh, Gujarat, and Madhya Pradesh shows negative impacts on areas outside the watersheds in terms of reduced inflows into reservoirs.
social impact assessment are fraught with many ��
methodological challenges, owing to the difficulty in establishing ideal ‘controls’, and the practical issues in nullifying the effect of larger socio-economic changes. Nevertheless, the available studies, which have used robust research designs and methodologies and which are independent, do not show very encouraging outcomes in terms of agricultural productivity growth, improvement in drinking water supply situation and reduction in rural poverty, though evaluation studies of some of the widely acclaimed watershed programmes do show some positive changes in terms of poverty reduction and environmental sustainability.
a skewed distribution of benefits towards ��
large landowners is apparent even in situations where projects were successful in achieving resource conservation and productivity enhancement objectives. In any case, there is no evidence whatsoever of watershed management programmes contributing towards addressing the concerns of inequity in access to water, particularly groundwater.
Projects that followed proper micro planning ��
procedures seem to be doing well in terms of realizing the intended outcomes and impacts. Such procedures include taking into consideration of the existing resource condition both for private land and common land, using scientific as well as participatory assessment tools. Also, such projects are also found to have made special provisions in their design for landless communities to derive benefits out of the project.
Ways forWard
The integrated watershed management programme being implemented in India is distinctly different from those initiated in other parts of the world, especially in the developed countries in terms of the objectives, the criteria for selection of watersheds and the operational scale, and hence straightforward comparisons are not possible. But, there isn’t much clarity of purpose visible in the way the programme is being implemented across different agro-ecologies, with remarkably different conditions vis-à-vis rainfall, climate, soils and topography. While the technical strategy remains more or less the same, the problems are different in different agro-ecologies. The watershed management policy of India requires a change, and the programme requires a complete re-structuring for it to serve the purpose of meeting the social, economic and environmental objectives of enhanced performance of watersheds in the country. Following are the suggestions:
the Watershed Management Planning approach
the paradigm for watershed management:�� The performance of watersheds is ‘scale dependent’ and therefore the criteria for their performance assessment need to considered while setting the rules and framework for micro watershed planning, and for designing the technical strategies for land and water management strategies within the micro watershed. The paradigm, therefore, has to change.
unit for planning watershed/catchment ��
management interventions: In addition to the planning for micro-watersheds which is done on a participatory mode, watershed plans could be developed at a higher scale. In that case, the criteria for watershed performance assessment, and therefore planning would be broader. The reason is it would bring in new stakeholders such as fishing communities, drinking water users, urban water users, lake and tank users and users of water in the downstream watersheds, and their needs could be integrated in the planning. More importantly, using such large hydrological units would enable integration of the potential impacts of micro watershed interventions on catchment hydrology into planning and monitoring. Planning for such

Catchment Assessment and Planning for Watershed ManageMent: Volume II - Annexes32
large-scale catchment could enable tapping the expertise of agricultural scientists, hydrologists and water resource engineers. Tentatively, the area of the catchment could be around 200-500 sq.km. depending on the region, which would cover nearly 20-50 villages/watersheds. The top-down and bottom-up approach would help reduce the negative externalities of watershed management projects.
from water resource development to water ��
management: For watersheds falling in semi-arid and arid regions with low to medium rainfall, with limited freshwater resources, the focus of watershed management planning has to shift from maximizing runoff collection and storage to water management through water use efficiency improvements in agriculture through interventions that result in real (wet) water saving. There are a whole range of interventions which would improve water use efficiency at catchment as well as farm level. They include technologies to reduce soil evaporation and non-recoverable deep percolation (Clemmens et al., 2008; Evans and Sadler, 2008; Kumar and van Dam, 2013) and agricultural strategies that focus on crop location changes, introduction of crops that yield higher return per unit of water depleted ($/m3) (Clemmens et al., 2008; Evans and Sadler, 2008; Kumar and van Dam, 2013) and drought resistant crops (Evans and Sadler, 2008). Nevertheless, in watersheds of high to very high rainfall regions in the hilly and mountainous areas, there could be still opportunities for improving runoff collection.
Watershed selection based on hydrological Characteristics
Several semi-arid and arid regions of India have limited surface water resources (GOI, 1999). These regions have already experienced intensive watershed development programmes. Though watershed development programmes were implemented extensively in these regions, with extensive well development with deep bore wells, promoted by free or subsidized electricity and in the absence of any effective regulations for checking water abstraction,
groundwater resources are also over-exploited in these regions. Such areas should be excluded from future watershed development interventions, as the value of overall gains (economic, social and environmental) from such interventions would be zero or even negative. There is another category of watersheds, which are ‘critically’ developed, and for which more detailed information of the hydrology and water use would be required for taking further investment decisions. The third category of watersheds is that which offers a lot of scope for carrying out treatment activities, mostly in the high rainfall regions with hilly or mountainous topography, with likely gains being large. Therefore, a rapid assessment of large watersheds in India to delineate those which are ‘over-developed’, ‘critically developed and ‘under-developed’ should be undertaken. The watersheds in the country can therefore be classified under these three distinct typologies.
technical options for improved Watershed Management
Efficient irrigation technologies and practices should be promoted in all watersheds where they are likely to enhance water productivity in real terms in terms kg/m3 and Rs./m3, and real water saving per unit of irrigated land. Ideally, they should be introduced in all semi- arid and arid regions with low to medium rainfalls, experiencing physical scarcity of water. This is because the welfare gains would be significant there. But, due consideration should be given to introducing crops for which they become best bet technologies, in terms of reducing consumptive use (per unit of land) and raising net income of farmers (Kumar et al., 2008). Here, it is important to note that not all micro irrigation technology + crop combination would be economically viable. Drip systems are generally viable for most row crops, and the viability improves for high value fruits and vegetables (Dhawan, 2000). But, a poorly managed ‘high tech’ system could be as wasteful as a poorly managed traditional system (Perry et al., 2009). Extension services on proper agronomic inputs and irrigation scheduling under the new technology regime would be extremely important. Plastic mulching could also be adopted for high value row crops to reduce soil evaporation from land, which is not covered by canopy. The possibility of restricting area under irrigation

ANNEX 3: Catchment Assessment and Planning: A Strategic Review for India 33
should be explored in such areas, as it has been found in most situations that with the adoption of the technology, farmers expand the area under irrigation. This would require the use of market instruments (see next section).
economic incentives for improving Water use efficiency
A major factor contributing to over-exploitation of groundwater is the lack of economic incentive for farmers to use water efficiently. This is due to the absence of marginal cost of pumping groundwater owing to free electricity or connected load based pricing of electricity supplied in the farm sector in most Indian states (Kumar et al., 2011; Saleth, 1997; Scott and Sharma, 2009). The other reason is lack of well-defined property rights in groundwater, wherein the landowners can pump out as much water underlying the piece of land owned.
Empirical studies show that introduction of pro rata tariff in electricity in the farm sector would encourage farmers to improve the physical efficiency of water use in crop production, optimize other inputs for crop production and choose cropping systems which are inherently water efficient and which also yield higher return per unit of land. In turn, they obtain higher return per unit of water and land along with reduced water use (Kumar, 2005; Kumar et al., 2011). Studies also showed that if water allocation is rationed along with pro rata pricing of electricity, the water use efficiency in crop production further improves (Kumar, 2005). One way to ration water use is through rationing of energy supply to farmers. Use of information technology and satellite communication now allows electricity utilities to restrict energy use by farmers through pre-paid meters. The farmers can start their pumps using activation codes obtained through mobile phones from the power supply company (Diagram 4, based on Zekri, 2008). To achieve sustainability in groundwater use, energy quota for each farmer can be decided on the basis of safe yield of the aquifer and the total cultivable land in the region and the individual holding size (Zekri, 2008; Kumar et al., 2011).
With the use of such market instruments, the farmers would have strong incentive to switch over to irrigation technologies that reduce water consumption and or
switch over to crops that are highly water efficient. Today, a lot of the adoption of micro-irrigation system happens only with subsidy support.
Capacity building at various levels
One of the key areas where institutional capacity of the central and state agencies for implementing watershed management programmes is through making available sufficient knowledge of catchment hydrology. The other area is enhancing the knowledge of the staff at all levels in the bureaucracy required for proper catchment assessment, planning of integrated catchment management projects, and monitoring the performance of ICM projects. Actions are required therefore on two fronts: 1] generating scientific data on catchment hydrology; and, 2] training of staff of institutions engaged in policy making, planning, financing, and monitoring and evaluation, and implementation of catchment management programmes.
generating scientific data on catchment ��
hydrology: Most of the data relating to catchment hydrology required for scientific planning of land use and water planning does not exist at the level of micro watersheds. This leaves us with very limited and often false understanding of the amount of amount of water resources (surface runoff, groundwater), how groundwater and surface water interact at catchment scale, characteristic of unsaturated zone, the variation in hydrological characteristics (rainfall, runoff within the catchment), etc. Hence there is a need to generate these data, scientifically, in order to have better understanding of how land use and land cover changes in the watersheds impacts on the surface storage, groundwater recharge, real water saving, quantum of water flowing out of the catchment, soil loss, sediment load, water quality etc.
Monitoring instrumentation can be installed ��
to assist in the evaluation of the following: precipitation, evaporation and groundwater recharge; definition of groundwater catchment boundaries, particularly in hard rock areas; runoff and water quality, including sediments; and, determination of the mechanisms of

Catchment Assessment and Planning for Watershed ManageMent: Volume II - Annexes34
groundwater–surface water interaction near discharge points. The existing networks can be augmented to achieve a minimum standard of baseline monitoring, by the installation of additional boreholes, rain gauges, stream-gauges, etc. This can be supported by remotely sensed data on land use and land cover. This can be used as inputs for planning using integrated catchment modeling tools, which can minimize the trade-offs.
Capacity building of institutions:�� watershed management works best when there is a supportive policy framework that facilitate decentralized and participatory development, institutional arrangement that allow and encourage public agencies at all levels to work together, and an approach to natural resource access that reflects local legislation and tenure practices and problems (Darghouth et al., 2008). The capacity building requirements would differ from the highest policy-making body (Dept. of Land Resources) to the lowest level implementing agency (like the District Rural
Development Agency officials and NGOs). The officials of policy making body at the central and state level would require orientation programmes on legal, institutional, financial and policy aspects of affecting implementation of ICM; and objectives and criteria for their evaluation. The state level resource agencies would require training on catchment assessment and planning for ICM, planning tools and tools for monitoring and evaluation of projects. The implementing agencies (PIAs) would require training on technical and institutional interventions required for integrated catchment management, planning tools and planning process.
identifying sound interventions for iCM
Currently, the tendency in watershed management projects is to replicate the interventions which were successful elsewhere. There is also too little of cost-benefit considerations in watershed planning, partly due to paucity of data on potential physical (hydrological) impact of various management
diagraM 4 ENERGY SUPPLY REGULATION TO AGRO PUMPS THROUGH THE USE OF PRE PAID METERS AND INFORMATION TECHNOLOGY
source: Based on Zekri, 2008.

ANNEX 3: Catchment Assessment and Planning: A Strategic Review for India 35
interventions and difficulty in doing economic valuation of the water augmented, or water saved. Also, there is too little consideration of wider political economy. There is a need for more applied research to address the hydrology and economics related questions. Since these impacts are a function of hydrological regime, topography, climate and socio-economic conditions, research needs to be undertaken in different agro-ecologies and under different socio-economic settings
in ‘experimental catchments’ through monitoring the performance and impacts of piloted interventions so as to identify the type of technical interventions that are technically feasible and cost effective. The information generated from such research can be used in integrated catchment (rainfall-runoff, crop growth, erosion, sediment load and water quality)-economic models to arrive at the nature of interventions and the scale at which they should be implemented.
name of institution
operations nature Characteristics objective functions outcomes
River Basin Organizations, France
1970-1992 Water financial investment institutions with no statutory powers
Intermediary institution between central and local government; and, between water consumers and water industry
Water resource management in major river basin, by promoting efficient water use and pollution reduction through financial incentives to local agencies and private players
i. Introduced charges for water abstraction and discharge, by various users in the basin, under the 1964 Water Act, and became financially powerful
ii. Effective in case of larger & identifiable point –polluters, but not for widespread non-point source pollution
iii. Unsuccessful in implementing “polluter pays principle”
Regional Water Authorities (RWA), England and Wales
19731-989 Regulatory and Management functions
Centralized body i. Flood Control
ii. Organized water supplies
iii. Water resources management
i. No active community participation in catchment management
ii. Distortion in catchment development pattern due to inconsistency between local land-use planning authorities and RWAs in their goals
iii. Had a dual role both in policing water pollution (regulatory function) and being polluters themselves
Integrated
Catchment Management Coordinating Group (ICMCG) and Community Catchment Groups (CCG), Western Australia
1987 ICMCG is to plan for ICM, its implementation and advice CCG
CCG is expected to participate in planning process
ICMCG is a centralized body with representation from various State government agencies responsible for land and water management
i. ICMCG provides forum for interagency coordination of policies and activities
ii. CCG was expected to involve local people in defining
i. ICMCG played a key role in developing a draft state wetlands policy and provided a platform to develop coordinated action on the Swan River coastal plain
ii. Reporting structure of ICMCG created resentment in some senior officers who thought it to be questioning their judgement and activities
table 1 INSTITUTIONS FOR CATCHMENT MANAGEMENT AND MANAGEMENT INSTRUMENTS

Catchment Assessment and Planning for Watershed ManageMent: Volume II - Annexes36
name of institution
operations nature Characteristics objective functions outcomes
CCG is a community-based institution formed under guidance of ICMCG
problems and developing strategies for catchment management
iii. Formation of ICMCG led to uncertainty about the role of other agencies such as the WA Water Resources Council and the Soil and Land Conservation Council, land care groups etc.
National Rivers Authority (NRA) and Catchment Management Plans (CMP), England and Wales
1989 NRA is a regulatory institution
CMP forms the basis for NRA action within each catchment
NRA is a centralized agency with range of regulatory powers on private and public bodies
CMPs are consultative with respect to the planning process, with no ability to enforce on land-users, developers or local planning authorities
i. Protection of water environment
ii. Establish management protocols and monitoring programmes
ii. Facilitate better coordination between land use and water policy makers
i. Highlighted the divergence between water management and land-use planning functions
ii. However, NRA did little to incorporate water management decisions in land-use planning as it had limited formal authority to restrict land use development
iii. CMP had no immediate impact on statutory authorities
Catchment Co-ordinating Groups (CCG) and Catchment Care Committees (CCC), Queensland, Northern Australia
1991 CCG and CCC were formed to provide forum for public discussion on catchment management
No legislative basis, voluntary involvement of stakeholders
i. Promote stakeholders participation in catchment management
ii. CCC identifies and prioritize natural resource issues; and develops, promotes and facilitates implementation of CM strategies
iii. CCG take part in local action and planning
i. ICM in Queensland has fostered co-ordination between landholders, community action groups and government agencies
ii. Under this institutional arrangement, ICM is dependent on the support of prominent community leaders and resource agencies
iii. ICM is not successful in solving the land use conflicts
iv. Financing remains a major issue for effective functioning of CCC
SAGE and SDAGE in France
1992 SAGE is a precise planning document for small local catchments
SDAGE is a forward planning document for major river basins
SDAGE has statutory obligation
SAGE is discretionary
Local Management Commission to implement SAGE
i. SAGE is to influence land-based activities that have direct impact on water resources and aquatic environment
i. A step towards involving all possible stakeholders in catchment management
ii. Spatial and institutional fragmentation of local water responsibility continue in France
ii. This institutional set up was driven more by political rather than environmental

ANNEX 3: Catchment Assessment and Planning: A Strategic Review for India 37
name of institution
operations nature Characteristics objective functions outcomes
Both draw on elaborate participation of water users, consumers, regulators and policy makers
and a higher level institution of River Committees to implement SDAGE
considerations, and is not suitable to achieve sustainable water management objectives
Catchment Management Agencies (CMA), South Africa
1998 Implementing National Water Act and management of water at local level
Participatory; but are statutory bodies
Governing Board of CMA to have representation from present and potential future water users, local and provincial government & environmental interest groups
i. Planning of WRM at catchment scale
ii. Registration of water users
iii. Water charges collection
iv. Water authorization and licensing
v. Ensure poor communities’ access to water for domestic and productive needs
i. Shift from a centralized management approach to a decentralized participatory approach based on equity
ii. Water users from poor communities got opportunity to discuss directly with the concerned agency on WRM
iii. Only two CMAs became fully operation in 12 years
iv. Delegation of water management functions to the CMAs has only been partially implemented
v. Poor cooperation between the CMAs and the water supply agencies, due to the misfit between catchment boundaries and local administrative boundaries
River Basin Management Plans (RBMPs) under the European Water Framework Directive
EWFD was adopted in 2000 by EU members States
EWFD is a legislative framework.
RBMPs are instruments for realising the new environmental objectives.
Preparation of RBMPs is a consultative process which each EU member State has to follow for realising the ecological objectives set under EWFD
i. Water quality protection (both surface and groundwater), especially to control nutrient pollution
ii. To assess environmental quality
iii. RBMPs is for water management based on river basins
i. Till 2010, only 14 member States had adopted RBMPs
ii. Lack of transparency and robustness in assessment of environmental quality by the member States
iii. Measures suggested in the RBMPs to restore specific water quality elements such as nutrient conditions were useless
iv. Only 1/3rd of water bodies were targeted for restoration in next few years
v. Limited progress in dealing with negative impacts of nutrient pollution on aquatic ecosystem

Catchment Assessment and Planning for Watershed ManageMent: Volume II - Annexes38
name of institution
operations nature Characteristics objective functions outcomes
Murray Darling Basin Authority (MDBA), Australia
2007 Authority for developing and implementing Basin Plans
Basin plan has legislative backing and is an enforceable document
Centralized body with community participation through basin community committee
i. To limit surface and groundwater diversions from the basin for environmental sustainability
ii. Ensure that sub-plans for each state are in line with the basin plan
iii. To promote water trading to maximize the social and economic benefits, while ensuring hydrological integrity of the basin
i MDBA replaced the existing institutional arrangements at the state level, which were unable to achieve environmental sustainability and resource security targets.
ii Shift in responsibility for high level policy making for basin management from the states to the national government
iii. Creation of environmental water holder at the basin level
iv. Provision of water entitlements for environment created resentment among irrigation stakeholders as it was bound to reduce the overall size of allocation for that sector
Catchment Management Authorities in New South Wales (NSW), Australia
2003 They replaced the existing Regional Catchment Coordination Committees & Catchment Management Boards, Trust and local land-care groups
Legal entities set up after the enactment of Native Vegetation Act-2003; Catchment Management Authorities Act-2003 and Natural Resource Commission Act-2003
13 CMAs exist in NSW
i. Responsible for implementing integrated approach to catchment management, with community participation
ii. Develops Catchment Action Plans
i. Effective mechanism for supporting land owners to voluntarily manage their land for public and private benefit
ii. Gives regional communities a direct say in the complex task of reconciling their needs with ecosystem health
iii. Very good, well designed projects were delivered throughout NSW; the activities had strong links with the expected outcomes; over 90% achieved expected short term outputs (as per the Audit carried out in 2010)
source: Based on Johnson et al. (1996), Bellamy et al. (2002), Buller (1996), Cornell (2012), EEB (2010), Herrfahrdt-Pähle (2010), Mitchell and Hollick (1993) Schreiner and van Koppen (2002).

ANNEX 3: Catchment Assessment and Planning: A Strategic Review for India 39
anneXure a1.1: understanding CatChMent land use-hydrology interaCtions
Several decades of research studies from across the world had consolidated the scientific knowledge of how land-use/land cover changes impact on water resource in terms of quantity and quality of runoff, groundwater recharge and soil moisture changes at catchment scale. Here, an effort is made to synthesize the findings from a few of them. Verstraeten et al. (2002) used a spatially distributed soil loss and sediment delivery model (WaTEM/SEDEM) to evaluate the effectiveness of a variety of soil conservation and sediment control measures at the catchment scale, which is based on the Universal Soil Loss equation. Scenario analysis was conducted for evaluating conservation measures in three catchments in the Belgian loess belt. The model was run with the actual land use and crop cover rotations to identify critical areas where conservation measures should be taken up. In total, 26 scenarios for integrated catchment management, plus the present-day situation were analysed. The model predicted long-term average annual soil loss and sediment delivery by using mean annual values for each input parameter.
The modeling study found that soil conservation measures taken at the field scale were relatively effective in reducing both soil loss and sediment yield. Sediment control measures, e.g. grass buffer strips or retention ponds, also reduced sediment yield, although by somewhat less. But, they did not decrease soil loss significantly. More interestingly, the combined effect of the various conservation and control measures is less than the sum of the individual effects. Thus, the important learning from the study is that in terms of reducing soil loss and sediment delivery, soil conservation measures are more effective sediment control measures and the latter should only serve a supplementary role in controlling the off-site impacts of soil erosion (Verstraeten et al., 2002).
Gallart and Llorens (2003), through an extensive review of the scientific literature summarized the state of the art on the relationships between land cover change and water yield from catchments in Spain, and examined how this knowledge might be used for a sustainable water management in that country. The study found that, the
forested area increased in relatively dry areas and was more stable in wetter ones, during the preceding 50 to 60 years. But, the mean annual flow in several of the main rivers in Spain decreased between 37 and 59% of mean annual flow during that period. Of the various driving forces, the extent of reduction in annual flows, which was attributed to the increase in forest cover, ranged between 17 and 46% of the mean flow. The most important finding from the study is that in a catchment where land cover changes are expected, a hypothesis of a temporal stationarity of water resource availability cannot be used for its management. Further, land use and cover planning should be integrated in the management of water resources in catchments, especially in water-scale environments (Gallart and Llorens, 2003).
Pollard et al (2001) studied the catchment of River Almond in Scotland to analyse the impact of socio-economic development in terms of changes in land use on river water quality, and assessed the impacts of management schemes that were initiated in response. The study found that though between 1950 and 1990, most of the oil shale mining and deep coal mining in the catchment of the river was stopped, abandoned mines and spoil heaps resulted in downgrading of 43.7 km of classified waters in the Almond catchment. An array of light industries, which succeeded the mining industries in the 1980s and 1990s, resulted in a multitude of new and complex synthetic chemicals being added to the traditional mix of heavy metals and phenols associated with discharges of large industries. Between 1961 and 1991, total population in the larger settlements of River Almond increased three-fold, mostly in the lowland parts of the catchment. Though pollution from agricultural activities reduced in the 1980s and 1990s, with the new emerging towns and other expanding settlements replacing good farm land, dilution offered by the river to the increasing effluent loads from population growth was inadequate, and water quality deteriorated. Urban run-off was the principal cause for downgrading of 11.5 km of classified waters. This has happened because of disconnect of the land-use decisions from river management objectives. Though various regulatory developments, including those aimed at managing the discharge of sewage treatment works, have yielded positive results, long delay in their formulation had permitted a substantial deterioration in river quality (Pollard et al., 2001).

Catchment Assessment and Planning for Watershed ManageMent: Volume II - Annexes40
A study of the impact of land cover change and climate on shallow groundwater in Murray Groundwater Basin of Australia was carried out by Leblanc and others (2012). The study involved the use of time series data on in situ groundwater levels, which showed that after clearance of the land of native vegetation for agricultural use, water table in the shallow aquifer in the basin rose from 1980-1997, causing dry-land salinity in the basin. This is indicative of increased groundwater recharge due to deforestation and reduced evapo-transpiration losses from the shallow water table aquifer. The study further found that with successive multi-year droughts since 1997, the long term trends in groundwater levels, which started with the early clearance of land by European settlers in 1800s, got reversed temporarily. While the native tree cover provided heavy evapo-transpiration of the shallow groundwater year round along with depleting the moisture in the soil profile, the agricultural crops transpired much less water, which also included the moisture in the soil profile.
But the development of the science of catchment management is fraught with many problems due to serious gaps in our understanding of how catchments behave in response to various management interventions, and they mainly occur due to the spatial heterogeneity in catchment characteristics and ‘scale effects.15’ Major catchment management research programmes that can
15 According to Bloschl and Sivapalan (1995), scale refers to a characteristic time or length of a process, observation, or model. When large-scale models are used to make small-scale predictions, or vice versa, problems may arise. These scale effects in hydrology become important as the mathematical relationships describing a physical phenomenon are scale dependent (Gupta et al., 1986).
fill these gaps, which involve study of catchments where ICM programmes were undertaken, are very limited. The LOCAR (the UK Lowland Catchment Research) catchment research programme in UK was one among the few. The major scientific aim of the LOCAR was to develop new inter-disciplinary science and improved modeling tools to meet the challenges of integrated catchment management.16
A review of LOCAR undertaken by Wheater & Peach (2004) found that the selected catchments had sufficient baseline data pertinent to surface water hydrology, groundwater or ecology. But there was a significant lack of knowledge on various aspects of catchment hydrology, geo-hydrology and ecology. Under LOCAR, hydrological monitoring stations were set up to evaluate spatial heterogeneity and scale effects. Though the breadth of interdisciplinary research carried out under LOCAR was significant, the funding constraints and limitations of the method of project selection have led to an imbalance in scientific distribution across and between the disciplines and the catchments (Wheater and Peach, 2004).
Orr and Carling (2006) explored hydro-climatic changes observed as part of a whole catchment study of the river Lune in North-West England, and explained spatial and temporal changes in runoff in terms of observed changes in climate and land-use. The study showed that observed changes in catchment hydrology cannot be interpreted using data on average rainfall, and
16 LOCAR is providing a major asset to the scientific community, wider environmental stakeholders, local stakeholders and ultimately to the public who want wholesome water supplies together with conserved biodiversity and sustainable management of land and water resources (Wheater and Peach, 2004).
figure a CATCHMENT OF MURRAY, WITH NATIVE TREE COVER
figure b CATCHMENT AFTER CUTTING OF NATIVE TREE COVER
ANNEX 3: Catchment Assessment and Planning: A Strategic Review for India 41
aggregate changes in land use, but spatial and temporal patterns are extremely important. The study found that found that although average annual rainfall in the North-West of England showed no clear trend over 100 years, rainfall in the higher altitudes showed increasing trend. Over the past 30 years changes in the seasonality of rainfall have been observed with greater proportion of annual rainfall occurring in the winter half-year. There was an increased frequency of wet-days which resulted in catchment-scale flooding. Higher rainfall in the upland, compounded by land-use changes resulted in rapid runoff. But, total annual runoff at the catchment outlet has declined in recent years.
Homdee et al. (2011) applied SWAT (Soil Water Air Temperature) model to investigate potential impacts of changes in land use and land cover on water budget of the Chi river basin in Thailand. They evaluated five scenarios of land use change, including an conversion of forested area into farm land, conversion of farmland into forest, switching of rice paddy fields to energy crops and two scenarios involving conversion of farmland to rice and sugarcane plantation. The results indicated different land use scenarios contributed to differential effects in annual and seasonal water Yield and Evapotranspiration (ET).
Conversion of forested area into farm land (10% reduction) showed 2.4% increase in stream-flows and 1.7% reduction in ET. On the other hand, conversion of paddy fields into forests (a 12% increase) led to 2.8% reduction in water yields and 1.4% increase in ET. Substitution of paddy fields by sugarcane plantation showed clearly reduced water flows and increased ET by almost 5.0% in dry season. But, with expansion of paddy fields by 25%, small changes occurred in annual flows and ET, but changes were more significant on seasonal flows. The results showed decrease in dry season ET by 11.9%, leading to increase of water yield by 5.1%. Finally, conversion of farmland to sugarcane plantation for biofuel production showed significant effect on seasonal ET, decreasing it in dry season by 4.5%, but with small changes in catchment yields (Homdee et al., 2011). Unlike what I generally perceived, the impact of irrigated paddy on watershed hydrology, in terms of quantity of flows, is positive, though the actual magnitude of impact would be determined by the characteristics of the unsaturated zone and climate (Homdee et al., 2011).
The impacts of water use efficiency improvement in agriculture, which should be an integral part of integrated catchment management policy, on water saving is scale dependent (Batchelor, 1999; Kijne et al., 2003; Molle and Turral, 2004). Several technologies help improve water use efficiency in crop production and water saving, including micro irrigation using drips and sprinkles. But, the distinction between ‘dry’ or notional water saving and ‘wet’ or real water saving is often not made in water management discourse. Though efficient irrigation technologies help reduce ‘losses’ in field water application in the form of percolation and runoff, in most instances this ‘lost’ water gets captured downstream by well irrigators and flow irrigators, and hence is not wasted (Seckler, 1996; Molle and Turral, 2004; Wallace and Batchelor, 1997). The real water saving comes from reduction in non-beneficial evaporation from the soil (which is not covered by canopy) and the reduction in non-recoverable deep percolation (Perry et al., 2009; Kumar and van Dam, 2013).
The extent to which use of these technologies can lead to wet (real) water saving per unit area of crop land depends on the physical environment, determined by crop type, type of micro-irrigation technology, soil type, geo-hydrological environment, and climate. In shallow water table areas, under arid climatic conditions, the real water saving will be more when micro-irrigation systems like drips are used for distantly spaced crops. Real water saving at the farm level per unit area would also lead to water saving at the catchment level, provided farmers do not expand the area under irrigation (Kumar and van Dam, 2013). Over and above these, how the farmer manages the system is extremely important. A poorly managed hi-tech system can result in as much wastage of water under poorly managed traditional method (Perry et al., 2009). Hence, the point is that in most instances, WUE improvements will not be sufficient to free up water from the system. Instead, the strategy should be to reallocate water from agriculture to other sectors including the environment, which in turn can promote WUE in agriculture (Molle and Turral, 2004; Kumar and van Dam, 2013). There are other technologies which improve water use efficiency in crop production such as mulching, zero tillage and wet seeding (for paddy).

Catchment Assessment and Planning for Watershed ManageMent: Volume II - Annexes42
anneXure a1.1a: evidenCe based PoliCy forMulation
There are large areas of international development where decision-makers are forced to make decisions purely on gut feeling and ideology not because they wish to, but because of lack of ‘proper evidence’. Evidence empowers the decision-maker to be able to make better choices. As noted by Whitty and Dercon (2013), in every discipline, in every country, where rigorous testing of expert solutions has started, many ways of doing things promoted by serious and intelligent people with years of experience have been shown not to work because of lack of sufficient evidence. Over and above, the communities we seek to assist are more vulnerable, denying the luxury of taking time to generate evidence.
One reason, according to them is the reductionist and misinformed view of evidence as purely ‘Technical’ or as being only about “What Works”. It is also about generating evidence and learning about why certain interventions and approaches may work, for which we collectively have the capacity. But, attempt is often not made. It is often argued that it is not worth trying to provide the best and most rigorous evidence to those who need to make difficult decisions because they will have other influences as well. They suggest that where evidence is clear-cut we should be making that plain to decision makers – and where it is not we should say that as well; be honest about what is there and try to get better evidence for the future. If the academic community is serious about trying to assist those working in the field to make the most informed possible decisions available for their own development, we should be putting our greatest efforts into supporting decision-makers to use the best evidence, and finding better methodologies in areas where we currently have very weak evidence. There are many, and this should be tackled as a matter of urgency.
anneXure a1.2: institutions for CatChMent ManageMent: international eXPerienCe
Several scholars have examined the drivers behind and institutional processes involved in developing catchment management institutions. An over-arching concern in all these interventions is to organize land and
water management in an integrated fashion and around hydrological boundaries. Buller (1996) examined the influence of the sub-national environmental policy and institutions on the development of sustainability agenda, by reviewing the changing form and scale of institutional structures for water management as part of ICM in Britain and France. In both the countries, the move towards a more holistic and sustainable water policy took the form of regionalization of water management structures in the early 1970s. In Britain, a series of changes introduced by various Acts since 1930 was to concentrate regulatory and management function for water into the hands of a fewer centralized bodies, which are built around large river basins as basic unit of water management, rather than individual sections of rivers. The concern was effective flood control, rationally organized water supplies for growing demand from urban and industrial areas and scientific water resources management.
The 10 British Regional Water Authorities created in 1973, and organized about10 major basins and associated smaller basins, embodied this approach. They represented a significant shift in management responsibilities from local governments to a more ‘technocratic’ and ‘supply fix’ management style.
In France, the institutional reforms in water management started with creation of new and supplementary regional tier to water management, called river basin organizations, which left the local water supply and sewage management initially unchanged. The RBOS (Agences financiéres de Bassin) built around the six principal river basins of the country. With no statutory powers, these agencies were financial investment institutions benefiting from the new fiscal regime established by the 1964 Water Act, which introduced mandatory changes for water abstraction and discharge stipulated by State regulators. The funds collected from these were reinvested in local authorities or private water management institutions which contribute to efficient use or pollution reduction. Though over a period of time, these institutions have become powerful, they also came under increasing public criticism. The RWAs were criticized for having a dual role both in policing water pollution and being polluters themselves. The French Agences, having no regulatory powers, have been most effective in negotiating a give and take game, with the larger, point source polluters.
ANNEX 3: Catchment Assessment and Planning: A Strategic Review for India 43
But, with shift in water policy agenda towards privatization, the focus has moved away from regulatory control of discharges and point sources towards the definition of ecological standards of water quality, protection of aquatic environment as a whole and integrated management of land and water uses, wherein the regional structure arguably proved ineffective in both the countries. As a result, the spatial emphasis once again shifted to local management bodies and mechanisms, but based upon river catchments (Buller, 1996).
The French SAGE (Schemas d aménagement et de gestion des eaux) and the broader water resource plan, SDAGE (Schémasdirecteurs d’aménagementet de gestion des eaux), established under the 1992 Water Act follow a two-tier tradition in catchment management. The latter is a large-sale forward planning document at the regional level, concerning major drainage basins of France. It identifies broad trends for integrated management of water resources over a 10-15 year periods and locates zones where pertinent investment or more detailed planning is required. Whereas, the SAGE is a more precise planning document at the local level for coherent local catchments--with drainage area ranging from 1000-2000 sq. km. Both draw on elaborate public participation exercise, bringing together water users, consumers, regulators and policy makers, through their institutional arms. Local management commissions are created for implementing SAGE and the SDAGE is implemented through River Committees. While SDAGE has statutory obligations, SAGE is discretionary. The SAGE’s mandate is to influence land-based activities that have direct impact on water resources and the aquatic environment. Both land use planning and water supply and treatment fall within the purview of the individual Communes and that Communes have a high representation in the composition of the local water commissions, the authorities of the communes (the smallest administrative units in France) get reinforced (Buller, 1996).
In Britain, the Catchment Management Plans (CMPs) have emanated largely from what is demanded by the National River Authority (NRA)’s mandate, as per 1989 Water Act. The CMPs form the basis for the NRA’s actions within each catchment. But, the introduction of CMPs had not changed the judicial regime within which management activities are undertaken. The
CMPs remain wholly consultative with respect to the planning process, with no binding force on land users, developers and local planning authorities. Though they appear to have no immediate impact upon other statutory authorities, the NRA, which is the higher level institution, possesses a wide range of regulatory powers over the private and public bodies that directly impact on the water environment. But, the CMPs introduce a more sustainable forward planning of land based activities founded on identification and assessment of catchment land uses, and scientific establishment of water quality and flow targets (Buller, 1996).
The catchment management planning in France is characterized by a strong centrality of its public policy making. The structures and institutions of water management have long displayed a high degree of fragmentation, leading to inconsistencies and jurisdictional and client distrusts at the central level. The French approach to catchment planning has largely been a state-led institutional response to the failures or inconsistencies of pre-existing management and regulatory structure. In contrast, Britain, with a more critical tradition with respect to central-state relation, has established a far more unified water management structure in the form of the National Rivers Authority (NRA). The British approach reflects more of a pragmatic response to specific issues of land and water use reconciliation (Buller, 1996).
The European Water Framework Directive (WFD), adopted in 2000 by EU, is flagship legislation on water quality protection. It established new requirements for integrated river basin planning in order to achieve ecological objectives. Ten years of planning and consultation across Europe went into development of River Basin Management Plans (RBMPs), which were meant to be the main vehicles for realising the new water management regime by setting the environmental objectives. But, by 2010, only 14 Member States had adopted RBMPs by 2010. Another four member states finalised consultations on draft plans and nine were consulting or have not yet started. The European Environmental Bureau (EEB) and its members have investigated RBMPs across Europe to get a quantitative comparison of environmental ambitions, focussing on nutrient pollution, and covered eight river basin districts, regions or countries.

Catchment Assessment and Planning for Watershed ManageMent: Volume II - Annexes44
The study covered only eight River Basin Districts, regions and countries. They are: England & Wales Regions in the UK (E&W-UK); Scotland River Basin District (Scotland), Austria, Scheldt River Basin District in Flanders Belgium (Scheldt Flanders); Loire-Bretagne RBD in France; Meuse River Basin District in the Netherlands(Meuse NL); Danube River Basin District in Slovenia (Danube SL); and Shannon River Basin District in Ireland (Shannon) (EEB, 2010).
The reason for focusing on nutrient pollution was that eutrophication remains one of the greatest environmental challenges in Europe; the science of nutrient pollution assessment is well developed and comparable across EU countries; nutrient conditions are important in establishing the success in achieving WFD objectives; and nutrient pollution control requires reforms in agriculture sector. The study found lack of transparency and robustness in assessment of environmental quality by the member states. For the purpose of checking the level of environmental goals and measures to restore specific water quality elements, like nutrient conditions, RBMPs as well as background documents were found to be useless. Specific assessments and data of water quality in terms of nutrients were not available. Only in six River Basin Districts (RBDs) and/or countries, the respective RBMPs provided objectives for restoring nutrient conditions of water bodies or where this information could be provided after considerable effort (EEB, 2010).
Five of these six RBDs and regions had the aim of restoring less than one third of the surface water bodies which suffers from excessive nutrients by 2015; the rest of the water bodies were to be restored some 10 years later. While there was no specific justification for this massive delay for individual countries, the study found that there were generic excuses stating high costs and lack of knowledge. While they were no legal reforms for controlling nutrient pollution of water bodies, there was evidence of some limited progress in tackling the negative impacts on aquatic ecosystem from physical changes, in particular dams and weirs (EEB, 2010).
Western Australia had a rather well-developed catchment management programme. Integrated Catchment Management was adopted by the government as a policy in 1988. It was decided by the government that ICM should be implemented by coordinating the policies
and activities of the existing agencies under existing structures, and a mechanism would be established to coordinate policies and activities. While no new legislation or agencies were established, the rationale was that desired cooperation and coordination could be obtained by working within the existing system. The coordination mechanism formed for implementing ICM was an inter-departmental committee, named, Integrated Catchment Management Policy Group (ICMPG),17 which involved senior officers of various state government agencies responsible for land and water management. Subsequently, Community Catchment Groups (CCGs) began to be established, under the aegis of the Office of Catchment Management (OCM), the secretariat for Integrated Catchment Management Coordination Group. In the initial years of its existence, the focus was on development of a philosophy and a process for ICM. But, it is only after several years of experience that the nature of the product expected from CCGs became clear. Community-developed principle or guidelines for a dynamic catchment management plan to meet the agreed objectives became the expected deliverable from the CCGs (Mitchell and Hollick, 1993).
The process to deliver the catchment management plan included: setting the boundaries of the catchment, including that of groundwater basins; identifying environmental limits for different parts of the catchment; identifying community desires and objectives with respect to development of catchment and comparing it with environmental limits; developing strategies to meet the objectives; encouraging community self-monitoring to measure changes; involving wider community as a resource for labour, money and expertize; and auditing progress at the local and state level (Mitchell and Hollick, 1993).
Consequent to a review of the ICM programmes in 1991,18 it was decided that the ICM as a state policy should be given legitimacy and credibility through explicit political,
17 Later on ICMPG was rechristened as Integrated Catchment Management Coordination Group, following protests from farmers on the idea of the committee taking policy decisions relating to land and water use in the catchment.
18 The review was conducted by Bruce Mitchell. The report of the review was examined by another consultant appointed by the Minister for Environment to address the disagreements on the points raised in the review and other matters emerged from the review.

ANNEX 3: Catchment Assessment and Planning: A Strategic Review for India 45
administrative and financial commitments. The decision placed OCM under the administrative direction of the Chief Executive Officer of the Waterways Commission (WC). The Waterways Commission is a well-established, but relatively small agency responsible for management of a number of estuaries in Western Australia. But, the OCM is not under the policy direction of the Waterways commission (Mitchell and Hollick, 1993). Since the management of estuaries depend primarily on the management of their catchments, the WC develops a cooperative approach and coordinating role in meeting the objectives of the OCM, and has a natural interest in ICM (Hamilton, 1990). The OCM became a permanent body under the protection of an established agency, thus minimizing the problems associated with its temporary status and vulneRability to budget cuts (Mitchell and Hollick, 1993).
ICM in the Johnston River Catchment (JRC) in Queensland, Australia, which had no legislative basis, has fostered co-ordination between landholders, community action groups and government agencies on catchment management issues. ICM strategy in Queensland was implemented primarily in coastal catchments that have issues such as water quality, land use conflict, habitat alienation and stream bank erosion. ICM in the JRC has fostered co-ordination between landholders, community action groups and government agencies on catchment management issues. It had identified and prioritized a wide range of concerns and then concentrated on key issues namely land, water, and riverine and habitat management. According to Johnson et al. (1996), the main inference which can be drawn from JRC experience is that facilitation of conflict resolution activities and future implementation of ICM strategy rely on both legitimacy and credibility. In that context, the authors suggested the future R&D to focus on developing a better understanding of the physical processes, including ways to integrate research from the plot or farm scale to the catchment scale. Improved processes to translate natural resources outcomes into statutory instruments in an ICM environment are required (Johnson et al., 1996).
The Murray Darling Basin (MDB) in Australia has a total drainage area of around one million sq. km, and has a population of two million people from the four states of New South Wales, South Australia, Victoria
and Queensland. The basin also supplies water to another one million people from South Australia, which encompasses areas of four states of the continent, is expected to have one of the most comprehensive catchment management plans ever attempted for water resources management. The on-going water reforms in Australia under the Commonwealth Water Act of 2007 enables development of a new policy and management framework for a trans-boundary, river catchment level management in the basin (Cornell, 2011). The newly envisaged MDB Authority, which will have legislative backing and would replace the existing MDB Commission, is charged with developing and implementing a comprehensive Basin Plan for water resources management. It would be a legally enforceable document. It attempts to replace the previously existed institutional arrangements at the state level for water allocation and use, which allowed extraction levels that were eroding environmental sustainability and resource security. With this, the responsibility for high level policy making for water management for the basin would shift from the states to the national government. It is also an attempt to make management sustainable from a basin-wide perspective (Cornell, 2012).
The Basin Plan defines: sustainable limits for groundwater and surface water; basin-wide environmental objectives; roles for a basin-wide water trading system; requirement of sub-plans for each one of the four states to implement the Basin Plan objectives; measures to improve the security of water entitlement holders. Central to the basin plan will be MDB-wide ‘sustainable diversion limit’ based on diversion limits for the sub-basins. At the basin level, there would be plans for environment, water quality and salinity. The Water Act 2007 enables creation of a critical body, called Environmental Water Holder. This agency is expected to use the water gained through purchases, and some of the water gained through the federally-funded infrastructure improvement projects, to achieve environmental objectives through a programme of active and targeted watering.
Within the overall framework and parameters set by the Basin Plan, the four basin states are expected to develop plans for their own parts of the MDB and the same will be subjected to accreditation for consistency with the Basin Plan by the federal Ministry.

Catchment Assessment and Planning for Watershed ManageMent: Volume II - Annexes46
In South Africa, as part of the process of implementation of the National Water Act of 1998,19 Catchment Management Agencies (CMAs) that stimulate poor people’s water use, for domestic and productive purposes, were required to be set up by the Department of Water and Forestry (DWAF). Three divergent modes of establishment of CMAs and public participation were observed from select pilot processes by Schreiner and van Koppen (2002) in Olifants basin and three water management areas in Kwa-zulu Natal province of South Africa. They were: i] formulation of a technical proposal for CMA establishment; ii] bottom-up reconnaissance for CMA establishment; and iii] decentralization of integrated water resources management for CMA establishment. In all the three modes, water users from poor communities, who were disempowered by the high volume water users in the catchments, discussed for the first time in history directly with the Department of Water Affairs (DWAF) about water resources management in their basin. However, the outcomes were different, with better participation of the poor and disadvantaged communities under the third mode.
Comparative analysis of the three modes of CMA building process (discussed in Section 4.3.2) showed that demographic representation needs to be well anchored in the structure of the CMA and its accountability mechanisms for poor communities to get access to water, and in that respect ‘who drives’ the process of establishment of CMAs and how it is driven are very important. Also, effective regulatory role by DWAF and the future CMAs vis-à-vis restricted water allocation for high volume water users, water demand management, and pollution prevention is crucial to contribute to poverty eradication (Schreiner and van Koppen, 2002).
But, the delegation of water management functions to the catchment management agencies has only been partially implemented since the promulgation of the National Water Act in 1998. In 2012, a total of nine Catchment Management Agencies (CMAs) were established in South Africa, reduced from an earlier proposal of having
19 The National Water Act of South Africa represents a fundamental legal reform in the country, which, in principle, shifted the locus of formal water control from riparian water title holders, largely consisting of the minority white community, to the new government as custodian of the nation’s water resources on behalf of all its citizens (Schreiner and van Koppen, 2002).
19 of them.20 The water management area boundaries still need to be formally amended through the second edition of the National Water Resources Strategy. Once the boundaries are formally gazetted, DWA will launch a national programme for the establishment of the remaining CMAs.
In the programme, the existing CMAs in the Inkomati and the Breede-Overberg water management areas will receive the first priority and be realigned into the Inkomati-Usuthu and the Breede-Gouritz CMAs respectively. This will be followed by the establishment of CMAs in the Limpopo, Vaal, and Phongola/Umzimkulu water management areas.
New South Wales in Australia has a very long history of catchment management (Bellamy et al., 2002). Following enactment of legislations, viz., Native Vegetation Act 2003, Catchment Management Authorities Act 2003 and the Natural Resources Commission Act 2003, enabled formation of 13 Catchment Management Authorities (CMAs) at the regional level in the State…” (Source: 2010 Progress Report of NSW Natural Resource Commission). According to the 2010 progress report, New South Wales now has institutional arrangements and maturing organizations that are capable of implementing an integrated approach to catchment management, where all components of the landscape are managed together in partnership with the community.
These CMAs formed in 2003 replaced the previously existing institutional structures namely the Regional Catchment Coordination Committees, Catchment Management Boards and Trusts (Source: based on 2010 Progress Report of NSW Natural Resource Commission, and Bellamy et al., 2002). In 1999, under a restructuring programme announced by the Minister for Land and Water Conservation, a total of 18 Catchment Management Boards replaced 43 Catchment Management Committees (CMCs) and five Regional Catchment Committees. The CMCs were responsible for preparing regional strategies and programmes for catchment management, and link with
20 The Minister decided to reduce the number of CMAs to nine from the original proposal of 19 CMAs. This is due to a number of reasons including the technical capacity required to staff CMAs, and the challenges such a large number of institutions poses to the Department of Water Affairs (DWA) in regulating their performance.

ANNEX 3: Catchment Assessment and Planning: A Strategic Review for India 47
local action groups with resources. They consisted of local government, business, urban/rural environmental interests, and senior regional staff of state agencies. These CMCs were under the State Catchment Management Coordination Committees, which used to provide ministerial advice on policies and programmes and state priorities. consisting of senior State level agency staff, and state-wide representatives of rural land users, environmental interests, local government and Catchment Management Committees (Bellamy et al., 2002).
anneXure a1.3: aPPliCation of integrated hydrologiCal –eConoMiC Models for CatChMent assessMent: three CatChMents
The use of integrated hydrologic-economic models for evolving viable approaches in catchment management is increasingly becoming popular. Such models should simulate physical relations that exist in the catchment between land and water and between water and biomass. They should also simulate the economic relationships. Jakeman and Letcher (2003) reviewed case studies on integrated modeling for catchment management developed as land use planning tool, which used crop model, rainfall-runoff model, sheet erosion model and economic model) for three catchments viz., Mae Chaem catchment in Northern Thailand; and Namoi Basin and the Yass catchment in Australia.
The aim of the project in Northern Thailand was to develop a methodology to assess the issues related to management of catchments to address the problems of competing water uses, soil erosion, water quality deterioration, groundwater depletion, bio-diversity depletion, and shift in distribution of economic and social well-being and equity, resulting from agricultural expansion, compounded by the problems of monsoonal river flows, increased demand for water during the dry season, and large scale regulation of water by reservoirs. The focus has been on working at the sub-catchment scale (100 km2) in the Mae Chaem catchment (4000 km2) to provide them with a land-use planning toolkit. The model components were a crop model, a rainfall- runoff model, a sheet erosion model and an economic model.
The Yass catchment project examined the effects of water resource policy and substantial changes in land use. Policies applied were: volumetric rationing of water withdrawal from unregulated rivers; introduction of capture limits by farm dams; expansion of farm forestry for salinity abatement; and expansion of viticulture on land previously used for grazing. Links between the hydrological and economic components occur in three ways: the impact of changed forest cover on runoff; the change in stream-flows due to farm dam capture of runoff for different supplementary irrigation scenarios; and, through direct extraction from the stream.
The Namoi project developed a tool for investigating the catchment scale trade-offs involved with various options for water allocation in the Namoi River catchment. The development of this tool was undertaken in response to needs expressed by stakeholder groups in the catchment, and it had incorporated stakeholder input at various stages of model development. A long-run, regional scale economic modeling approach was used to simulate decision making of farmers under a variety of water allocation scenarios. The trade-offs between economic outputs resulting from changes in farmer decisions and environmental outcomes resulting from changes in water allocation to agriculture were analyzed (Jakeman and Letcher, 2003).
They found that all the models integrated into the land use planning toolkit and Decision Support System in small catchments required some development to take into account data inadequacies, either in the form of inputs parameters to run the models or as outputs to assist in model calibration. Further, in a 100 km2
catchment (MaeChaem sub-catchments), relationships need to be modeled in more detail than in the large catchment of 40,000 km2 (Namoi). A crop and water balance model was used in the Northern Thailand case but only empirical relationships are applied to predict yields in the latter. Further, the way in which the economic component was treated in the three case studies differed depending on both the scale of the modeling and the issues being considered by the model. In the Namoi case study, farmers were given a relatively small number of possible crop rotations to choose from, but a broader range of capital investment choices. In the Yass case study a very broad range of farm types and land use choices were considered, but in a simpler short-run decision framework.
Catchment Assessment and Planning for Watershed ManageMent: Volume II - Annexes48
anneXure a1.4: Multi-Criteria deCision Making in CatChMent ManageMent
Prato and Gerath (2007) discussed the basic elements of Multiple-Criteria Decision Analysis (MCDA) and how the approach could be applied to agricultural catchments. To illustrate this, they analyzed five farming systems using an additive, multiple-criteria utility function for their suitability in improving catchment management. They included five economic and environmental criteria in the utility function, viz., 1] increasing Net Return (NR); 2] reducing economic risk (RI); 3] improving Drinking Water Quality (DW); 4] enhancing Aquatic Ecosystems (AE); and, 5] reducing Soil Erosion (SE)21. As per their study, average farmer in the study area, considers net return to be the most important criterion for selecting a farming system rather than the long term benefits from improvements in ecological conditions, erosion control and improvement in drinking water quality. Increasing net return (profit) is 1.3 times more important than reducing soil erosion, approximately twice as important as reducing economic risk and improving drinking water quality, and more than four times as important as enhancing aquatic ecosystems. This is quite understandable. Unlike a trader or business man, an ordinary farmer is not driven by the consideration of profits but other considerations such as immediate cash needs for education for children, medicare, marriage of his daughter, etc.22 Farming system comprising of corn–soybean rotation, reduced tillage, medium fertilizer application, and banded pesticide application is the top-ranked farming system based on the results of the MCDA.
21 Average criteria values were calculated using the simulated values of the criteria determined by Wu (1994). The weightage for the criteria were determined based on information obtained in a survey of 20 farmers in Goodwater Creek catchment in the United States (Prato and Herath, 2007).
22 Daniel Kahneman (2011) explains this irrationality in decision making by using the dual process model of the brain. According to him, we apprehend the World in two radically opposed ways, employing two fundamentally different modes of thought, viz., “System 1” and “System 2”. System 1 is fast; it’s intuitive, associative, metaphorical, automatic, impressionistic, and it can’t be switched off. Its operations involve no sense of intentional control, but it’s the “secret author of many of the choices and judgments you make”. System 2 is slow, deliberate and effortful. Its operations require attention. System 2 takes over, rather unwillingly, when things get difficult (Kahneman, 2011).
MCDA approach to integrated catchment management is superior to conventional economic approaches to evaluating land and water resource management systems, as compared to simple cost benefit analysis and contingent valuation methods, as they give results that reflect the respondents’ social attitudes toward the alternatives being compared. As is evident from the results, the top-ranked farming system in Goodwater Creek catchment is one which enhances the farmer income (Prato and Herath, 2007). But, once the views of multiple stakeholders in the catchment (say, drinking water users) are incorporated, the criterion for selection of farming systems would be subject to further changes. Obviously, the interventions which would be required for protection of drinking water sources would be different from the one which maximizes the farming returns for the agriculturists in the catchment.
Often, the catchment communities are not quite aware of how their individual actions and catchment functioning are inter-dependent, and therefore may have negative attitude towards any policies or actions that are aimed at reducing the scale of their activities.23 Collins et al. (2007) using case studies of three catchment management projects in the United Kingdom, illustrated on the extent to which a systemic approach to understanding multiple perspectives and stakeholder interests could improve policy and practice.
Among the three catchments studied, the concern in the first one, i.e., Ythan in UK was of applying a policy directive (EU Nitrate Directive) for reducing nitrate pollution of the estuary, occurring as a result of increased agricultural activities (crop cultivation and dairy farming) in the upper catchment and sewage discharge, which increased algal growth and affected birdlife. It meant, the agriculturists agreeing to reducing fertilizer application and spraying of manure, the designated Nitrate Vulnerable Zone. In the second catchment, i.e., River Tweed, the concern was of maintaining water levels in the river for fish breeding (trout, sea trout, salmon etc.) during certain months of the year, releasing water to augment low flows and mitigate algal growth during prolonged period of low rainfall and high temperature, in
23 Farmers in upper catchments are often unaware of how their land use practices (intensive livestock farming, for instance) affect nitrate leaching from land and therefore pollution of streams in the lower parts.

ANNEX 3: Catchment Assessment and Planning: A Strategic Review for India 49
the wake of growing demand for water from agriculture, and maintaining water levels for recreational purposes (Collins et al., 2007).
They noted that the awareness of interdependencies between individual actions and catchment functioning is neither fostered nor optimised by the agencies, as they do not recognize that the stakeholders view ecological and catchment functioning different from scientists. Valuing multiple interests and stakeholder interests in the catchment challenge the assumptions underlying the scientific claims to knowing how catchment should be managed. Therefore, managing catchments in situations of multiple stakes requires new practices for managing interactive processes between scientists, policy makers and stakeholders. Hence, a major shift is needed away from the notion that humans (including scientists!) are rational i.e. give them the facts and evidence and they will do the right thing. Awareness of interdependencies can be effectively developed through appropriate practical initiatives that provide a more systemic awareness of the context in which they are deployed (Collins et al., 2007).
Often decision support tools for planning catchment management interventions are also used to involve multiple stakeholders, planners/scientists, lay catchment water users and policy makers in the dialogue process aimed at catchment planning. Ewing et al. (2000) illustrated the potential of a decision support system called Adaptive Environmental Assessment and Management (AEAM) in facilitating Integrated Catchment Management (ICM) processes in the context of Western Australia, through a case study of Blackwood River Catchment. It involved model building and application of the model to a local catchment. They argue that AEAM process assisted in the development of shared understandings, and a common ‘‘language’’ with respect to catchment management. It encouraged collaborative mode of participation in ICM by putting the catchment community, alongside ‘‘experts,’’ not just as informants but as partners in negotiation. The framework explored the potential for integrating research outcomes into catchment planning process. But, as noted by Ewing and others, the use of such models requires an active and receptive community along with scientists who are prepared to engage with the community and provide their knowledge in a form usable by management (Ewing et al., 2000).
anneXure a1.5: institutional develoPMent ProCess for CatChMent ManageMent Planning
As per South Africa’s National Water Act-1998, the Catchment Management Agencies (CMAs) are statutory bodies to be established as per Chapter 7 of the Act. Schreiner and van Koppen (2002) discussed this process in the South African context. In South Africa, building of CMAs for participatory basin management and development of technical proposals for catchment management was seen to have followed three different approaches. They are: formulation of a technical proposal for CMA establishment; ii] bottom-up reconnaissance for CMA establishment; and iii] decentralization of integrated water resources management for CMA establishment (Schreiner and van Koppen, 2002).
In the first approach, the main purpose was to submit to the Minister a formal proposal for a CMA that includes the available technical data. (White) technical consultants with historic technical expertise in the basin were appointed by DWAF to play active part in the process of CMA establishment and proposal writing. The public participation processes built upon earlier public initiatives by large farmers, mines, tourist industry, electricity utility and industries. Two rounds of public meetings were organized throughout the basin at five different locations, in order to bring the historically disadvantaged groups on board for information and consultation. Some 600–700 people participated in each round. The public meetings consisted primarily of information provision on the concept of CMAs and basin level management with public participation, and, in the second round, on the structures that the consultants and DWAF proposed for the future of CMAs. The first round of public meetings was also used to invite volunteers from the historically disadvantaged communities to take seat in a Stakeholder Reference Group. This smaller group of some 80 people discussed the CMA proposal more in-depth. Within one year, the final draft proposal was compiled by the Consultants of DWAF and sent to the Stakeholder Reference Group for discussion and formal submission to DWAF (Schreiner and van Koppen, 2002).
The second approach aimed not only at informing historically disadvantaged communities about the new

Catchment Assessment and Planning for Watershed ManageMent: Volume II - Annexes50
CMA, but also at assessing their water-related needs and at soliciting suggestions for a governance structure that effectively represents their interests. It was initiated to complement the first approach because that approach was increasingly acknowledged to rely too strongly on those who were already well organized. The main implementer of the process was a (black) social facilitator-cum-community developer, who had a wide network of contacts throughout the basin. A total of nine daylong workshops in the local language with a total of 365 participants, generated overviews of the problems experienced with regard to water. This included drinking water, often as top priority, but also rain-fed and irrigated agriculture. Concrete suggestions to organize in multi-tiered small-scale water users’ forums for effective representation in the future CMA Governing Board and committees were made. The report of these workshops was included in the technical proposal (Schreiner and van Koppen, 2002).
In the third approach, the regional office of DWAF adopts a holistic and integrated long-term approach. First, it drives the process of establishing CMAs in water management areas with additional support of only a few hired social facilitators. The emphasis is on establishing CMAs that are to be governed by water users themselves. The process is characterized by extensive information provision in the local language regarding the new rights and responsibilities of water users envisaged under the CMAs. The Local Governments are seen as the key partners for discussion in a more articulated and structured way, and are expected to consult their constituencies and bring their views back to the plenary sessions. Local staff of DWAF and local staff of other government agencies are also more involved in the process. They play a complementary role in one-to-one interaction with poor communities for further information provision, problem diagnosis, and mediation in problem-solving. The formal proposal writing is gradual and shared among several local task forces. Second, in this approach, IWM through CMAs is not only being put in place at basin level, but also at local level. On the ground, DWAF’s own service delivery is further integrated. Local DWAF staff improves its services, first, by better co-ordinating DWAF’s internal departments such as water services, groundwater, or water quality, and, second, promoting co-operative
governance with other line departments. Costs and time are saved and goodwill is gained by attending local events rather than calling special meetings (Schreiner and van Koppen, 2002).
anneXure a1.6a: CatChMent-Wide Water trading in southern Murray darling basin
Water trading has been progressively introduced in the southern MDB since the early 1990s based on the premise that it is a mechanism that facilitates the reallocation of scarce water resources to higher valued uses, which provides economic benefits to individual buyers and sellers and to society as a whole. This idea gained particular prominence following the introduction of a basin-wide cap on water diversions in the mid-1990s. National Water Commission (2010) of Australia provided a comprehensive assessment of the economic, social and environmental impacts of water trading in the Southern MDB over the period from 1998–99 to 2008–09, which covered initial experiences with water trading in the decade preceding government entitlement purchases and in a period of severe and prolonged drought (NWC, 2010).
The assessment showed that different irrigation communities in the Southern MDB responded differently to the drivers of change, such as drought, low water allocations and low prices for milk and wine grapes. Moreover, it showed that the nature of the change in each region is strongly dependent on the region’s geography and history. The region’s mix of commodities, its relative dependence on agriculture, irrigation developments (including land parcel size, infrastructure and water endowments), and the institutional settings governing water resource management all play key roles in driving change (NWC, 2010).
The separation of water entitlements from land making water rights tradeable has unlocked the value of water and given individuals and firms more flexibility in their water-use and production decisions. The option to trade water helps individual irrigators increased their net worth and manage debt and risk. Consultations with irrigators indicated that individual irrigators are becoming increasingly sophisticated in the way they use water trading.

ANNEX 3: Catchment Assessment and Planning: A Strategic Review for India 51
Economic modeling using observed data and consultation across the Southern MDB found that these benefits to individuals led to aggregate benefits at the national and South MDB levels to the tune of S$ 220 million in a year. All states in the Southern MDB were net beneficiaries, as water trading helped to maintain productive capacity in the Southern MDB. Water trading provided benefits to urban water users and the environment as well (NWC, 2010). The unprecedented low rainfall, run-off and allocations during the past decade gave rise to trading patterns that saw water move downstream to support perennial crops. That movement stabilised sellers by providing much-needed income and benefited buyers by saving their long-lived plantations.
In South Africa, through the implementation of the NWA-1998, attempt was made to improve government and management of water resources by organizing them around hydrological boundaries (water management areas) under the institution called CMAs. But, several issues still need to be sorted out. Water related services (such as drinking water supply and industrial water supply) are being managed by Water Service Agencies which are within the administrative control of local governments such as municipalities. The Water Services Development Plans being developed by the WSAs within the local governments are based on information provided by the CMAs on water availability within the basin. But, these plans do not take into water demands in agriculture, and concern only water supply and sanitation and urban and industrial water supply (Herrfahrdt-Pähle, 2010).
There are problems of poor cooperation between the newly established CMAs and the WSAs, due to the misfit between catchment boundaries and administrative boundaries of local governments under which the line agencies of water supply work. There are also problems of lack of coordination within the DWA between the divisions dealing with water resources management and water related services, and between DWA and the water service agencies (Herrfahrdt-Pähle, 2010). There are currently no specified procedures and rules that guide cooperation between CMAs and the local governance institutions. Cooperation is based on capacity and levels of understanding of legislation and strategies by individuals within these institutions (Mazibuko and Pegram, 2006).
anneXure a1.6b: integrated CatChMent ManageMent initiatives in neW south Wales
The experience of New South Wales (NSW), one of the basin states of MDB, with integrated catchment management is illustrative of the positive outcomes, of the model followed in MDB, even prior to the implementation of the National Water Act of 2007. The main benefits that the NSW regional model for integrated catchment delivers are.24
The model for NRM – with CMAs and Catchment ��
Action Plans (CAPs) as their management instrument, is an effective mechanism for supporting land owners to voluntarily manage their land better for both public and private benefit. Giving regional communities a more direct say in the complex task of reconciling community needs with ecosystem health is succeeding where previous top-down approaches have failed.
The NRC’ audits verify that good projects are being ��
delivered across NSW. These projects are well designed and are likely to produce good results in the longer term. Over 90% of all audited projects had achieved their expected short-term outputs. Nearly 90% had strong, logical links between activities undertaken and expected outcomes. Significantly, even though the NRC audited CMAs during the recent drought, almost half of the audited projects showed observable resource condition improvement at the site scale.
The NRM institutions are well established and have ��
provided relative continuity over the last six years. CMAs have had time to build their own capacity and that of their communities. NSW is now seeing the benefits of sustained and relatively consistent efforts of encouraging private land holders to manage their land, water and soil resources more sustainably for their own and others’ long term benefit.
CMAs are maturing into credible, regional ��
organizations that are allowing adaptive
24 This is drawn from a report of the Commissioner, New South Wales Natural Resources Commission, Level 10/15 Castlereagh Street, Sydney, NSW 2000, Australia. [email protected].

Catchment Assessment and Planning for Watershed ManageMent: Volume II - Annexes52
management to work. This was exemplified by the results of Murray CMA’s second audit which shows significant improvement over a two year period.
There is a shift occurring in the way people think ��
about and manage natural resources. It is moving away from the conservation-based thinking to a growing recognition that landscapes are made up of human communities and biophysical processes that interact and shape each other and are subject to constant change. CMAs are trialling resilience thinking as a new frame for helping communities understand how their catchments are working and where and how they should intervene to keep landscape systems operating in harmony.
Six years of experience shows the value of giving ��
local communities a more direct say in how natural resources are managed. Environmental, social and economic challenges that frustrate national and international policy efforts are being addressed and solved at the local and regional scale. The lessons from these new methods can be shared to inform how we can design policy settings from the local through to the international level in ways that better harness the inherent creativity of citizens, land managers, non-government organizations industry and governments.
But, it is also equally intriguing to note that even after six years of experience with catchment management authorities and CAPs, only 2% of the total state funding for natural resource management (worth around 120 million dollars) was routed through CAPs in NSW.
anneXure a1.7: karnataka Watershed develoPMent (kaWad) ProJeCt
The Karnataka Watershed Development (KAWAD) project is one of the projects supported by the World Bank and widely acclaimed as highly successful in terms of improving agricultural productivity and rural livelihoods. A water audit carried out for the project showed that the runoff for the catchments selected for treatment was heavily over-estimated, for deciding on the scale of interventions. While the planning used 30-
40% of rainfall as runoff, the secondary data showed it to be in the range of 2-5 per cent (Batchelor et al., 2003). Also, the existing water harvesting structures were not taken into account; and no account of the combined impacts at different scales of water harvesting and increased groundwater exploitation on patterns of availability and access to water resources (Batchelor et al., 2003).
But, such evidence of un-intended impacts based firmly on ground-level realities is often rejected by project managers from donor agencies. The sanctioned discourse was that watershed development projects have no externalities, improve the livelihoods of all social groups etc. The watershed planning is not guided by any broader catchment plans or even rules framed either at the level of large catchments, sub-basins or basins in which the micro catchments fall, or at the local level. Since the districts are the unit for fund allocation, it is quite possible that in the same macro catchment, several agencies implement the programme. But, their activities are not coordinated to ensure optimum level of treatment of the macro catchment, or sub-basin or basin. The attempt by each PIA is to maximize the treated area to appropriate largest amount of funds, whereas the interest of the community institutions is to hydrological benefit within the micro watershed by improving the runoff collection efficiency so that minimum water flows out of the drainage outlet of the selected watershed.
anneXure a1.8: Watershed develoPMent ‘best PraCtiCes’?: the indo-gerMan Watershed PrograMMe
The Indo-German Watershed programme is proclaimed as the pioneer in participatory watershed development programme in India, was initiated by NGOs in Maharashtra, with the goal of rehabilitating watersheds for the regeneration of natural resources. The programme was formally launched in 1992 with the support of KfW. Using the lessons learned of IGWDP, NABARD constituted the Watershed Development Fund, and participatory watershed projects are now being implemented in 11 states covering 86 districts of

ANNEX 3: Catchment Assessment and Planning: A Strategic Review for India 53
the country. The IGWDP has been replicated with FC funding in the States of Andhra Pradesh, and Gujarat and is now in the process of being expanded into Rajasthan (also with the support of KfW). It aims at achieving the following: 1] developing micro-watersheds in a comprehensive manner so as to create adequate and sustainable livelihood opportunities for the inhabitants of the area; 2] catalysing the formation of village groups for mobilizing their degraded environment through participatory self-help initiatives; and, 3] facilitating the arising and unfolding of a people’s movement for sustainable economic development along watershed lines.
The programme is implemented through an elaborate institutional arrangement, consisting of funding institutions (BMZ, GTZ and KfW), institutions for programme approval, managing fund flows and monitoring and evaluation (GoI and State governments), institutions for capacity building, development of approaches and M & E (WOTR in Maharashtra, WASSAN in AP, BAIF in Gujarat and a few other resource agencies for other states), institutions for community mobilizing (NGOs/PIAs), institutions for planning, supervision and implementation of watershed development projects in the villages (Village Watershed Committees), and Gram Sabhas.
The watershed treatment measures follow a strict “ridge to valley approach”. The “net planning approach” followed demands a survey of each of the plots in the watershed and suggests appropriate technical measures for conservation and improvement in consultation with the farmer and his family. Efforts are made to encourage VWC to think of ways and means to involve the landless in project activities and design appropriate systems of sharing the benefits arising from common property resources with them (Buhl, 2006; Farrington and Lobo, 1997). But, the awareness campaigns in the watershed management programmes also focus on messages such as ‘capturing water where it falls’, ‘ban on grazing’, to promote soil and water conservation, which may not be in the interest of the landless, and might only exacerbate the already existing inequity in access to groundwater in the village.
An evaluation report of the Indo German Development Cooperation on the impact of IGWDP claimed the watershed development to have improved local
agriculture through an increase of the cropped area; adoption of better varieties of crop; improvements of crop yields; an increased area under irrigation, and the diversification of cropping with the introduction of horticultural crops. However, if development projects are being focussed on poor areas, even the better off households in such areas still face vulnerable livelihoods owing to degraded resources and climatic variability. Obviously, the programme benefited the rich land owners more than the small and marginal ones and the landless (Buhl, 2006).
Those whose land remained uncultivated before the start of watershed programme often brought such lands under cultivation for the first time because of watershed development. Livestock production is primarily affected by the ban on free grazing of goats and sheep, a practice followed before implementation of the programme (Buhl, 2006). As noted by Kerr (2002), this might harm poorer farmers and landless farmers’ livelihood much more than richer farmers’. On the other hand, dairying activity based on cross-breeds and improved varieties of cows were adopted on a large scale after the implementation of water and soil treatment, owing to improved fodder availability (Buhl, 2006). It is important to mention here that the 12th five year plan document emphasises on convergence of NREGS (national Rural Employment Guarantee Scheme) work with integrated watershed development programme, or in other words, many of the treatment activities which are undertaken under watershed development programme are now expected to be covered under the NREGA programme. This can be viewed as an attempt to find new sources of funding for continuing the work on IWMP and also for engaging the poor and the landless, unemployed people in the rural areas in creation of productive assets, while creating wage labour for them.
anneXure a1.9: sCale effeCts in Watershed ManageMent PrograMMes
There are two types of scale effects. The first one concerns the downstream impacts of upper catchment interventions. The second concerns the effect of changes in the catchment relationship (such as rainfall-runoff relationship) as one move from micro catchment to a macro watershed or basin.

Catchment Assessment and Planning for Watershed ManageMent: Volume II - Annexes54
As regards the first one, the water audits in watersheds of Karnataka and Andhra Pradesh under KAWAD and APRLP respectively, showed clearly that watershed development activities and increased groundwater extraction for irrigation had major impacts on the pattern of water use and access. The intensive treatment of drainage lines contributed to a major reduction in the utility of traditional tank systems. From the irrigation perspective, there were positive changes in the pattern of water use. However, if the non-irrigation uses of tanks are considered, the ‘irrigation’ benefits have come at a social and economic cost. During the last 10–20 years, the utility of many tanks has declined for activities such as washing, bathing, watering livestock and pisciculture. In extreme cases, reduced tank inflows are having a negative impact on domestic water supplies, especially where tanks are an important source of recharge of aquifers used for urban supply (Batchelor et al., 2003; Rama Mohan Rao et al., 2003).
Madhya Pradesh is also known for decentralized water harvesting and watershed management activities implemented by the government agencies and NGOs. The Narmada basin also witnessed its large scale implementation. Unfortunately, the planning of these schemes did not involve any hydrological or geo-hydrological considerations (Talati et al., 2005). Essentially, the total amount of water in the basins and the amount of un-committed flows were not studied. A study was carried out by Talati et al. (2005) involving primary data collected from two sub-basins of Narmada, viz., Hathni and Kundi and two micro watersheds in one of the basins, showed that after watershed treatment activities, the stream flows in the two sub-basins reduced significantly, while the recharge fraction, estimated as the ratio of the average water level fluctuation (during monsoon) and the annual rainfall, increased. Further, it was observed that the recharge fraction for the treated watershed was higher than that of untreated watershed in the same basin for higher magnitudes of rainfall (Talati et al., 2005).
As regards the reduction in stream flows, one could attribute it to the change in magnitude of rainfall. Therefore, in order to measure the real impact of watershed treatment on stream flow generation and the effect of water harvesting on downstream flows, a regression was run between rainfall and stream flow for
two time periods: pre water harvesting period (15 years) and time period including post WDP period (20 years). The results of the regression analysis showed lower value of coefficient for the period encompassing the post WDP period. This meant that the runoff corresponding to a unit rainfall reduced after the watershed treatments. Hence it confirmed the preliminary findings that runoff rate is reduced in post WDP period (Talati et al., 2005).
The importance of the second type of scale effect in watershed management planning was well demonstrated by the water audit undertaken for Andhra Pradesh Rural Livelihoods project. It showed how it is critical to revise (scale down) runoff rates when one moves from micro watershed to a large watershed or basin in terms of scale of operation. The analysis of runoff data for experimental watersheds carried out by the CSWCRTI in Bellary and by CRIDA in Anantapur showed that average annual runoff is typically 2% to 15% of average annual rainfall and highly dependent on such factors as: soil type, slope, land use and/or vegetative cover and presence of in-field soil and water conservation measures. The analysis of gauging data from the Central Water Commission (CWC) showed that annual surface runoff, at the macro-watershed or basin scale, the average annual runoff values are within the range 4-35 mm which is equivalent to between 0.8 and 7.5% of rainfall. The relatively low runoff coefficients estimated on the basis of the gauged stream-flows and rainfall for most gauging stations challenge the widespread assumption that runoff in this region is always in the range 30-40% of annual rainfall (Rama Mohan Rao et al., 2003). While the runoff for individual micro catchments is relatively high, it is the average runoff for the large catchment which matters, when watershed interventions are carried out at a large scale covering a macro watershed.
anneXure a1.10: issues in eConoMiC evaluation of Watershed ProJeCts
The available studies on economic impacts of watershed projects are either based on direct benefits from individual structures (such as contour bunds, water harvesting structures on stream channels, farm ponds etc.) or for individual watersheds. The former does not capture the average ‘incremental benefits’ that can be accrued from an individual structure at the level of micro

ANNEX 3: Catchment Assessment and Planning: A Strategic Review for India 55
watersheds when all structural interventions under watershed treatment are made. The latter does not capture the average ‘incremental benefit’ from a single watershed at the level of macro catchment, when all the watersheds of that catchment are treated. Instead, they use the direct benefits from individual structures (see Joshi et al., 2008). The methodologies adopted for these studies are not robust enough to capture the potential negative externalities induced by the structures in the upper catchment on the existing structures in the lower catchment due to hydraulic inter-dependencies (Barron and Noel, 2011; Kumar et al., 2008; World Bank, 2006).25
As noted by World Bank (2006), the reporting of externalities in watershed management programmes is very poor. For instance, how did the water flows change (or not) due to watershed interventions? Were there any other changes, social and/or natural that emerged due to the watershed intervention upstream? Often, the costs and benefits were evaluated at the end of the project. Lasting effects and/or changes due to the project implementation are often not revisited or accounted for. There was also a large gap in values incorporating changes in both natural and social capital for watershed management, as well as consistent methodologies to do systematic estimations of these changes (Barron and Noel, 2011).
But, this ‘externality’ is an important determinant in deciding the benefit-cost analysis in view of the fact that a large number of structures are being built in the same micro watershed over a period of time, cumulative impact of which would be in terms of ‘thinning effect’ on the benefits from the individual structures or significantly reducing the hydrological and economic benefits downstream reservoirs from wells or irrigation reservoirs (Batchelor et al., 2003; Calder, 2005; Hope, 2007). For instance, Ray and Bijarnia (2006) found that in Alwar, Rajasthan, the water harvesting structures built in the upper catchment village, while improving groundwater recharge and irrigated area of wells in the neighbourhood, led to reduction in the irrigated
25 For instance, intensive watershed treatment in the upper catchment can reduce the inflows into a reservoir downstream built under a different programme, say for irrigation or water supply, when the runoff is limited (Batchelor et al., 2003; Rama Mohan Rao et al., 2003). Estimating the ‘increment benefit’ from watershed treatment should mean that the reduction in inflow into the reservoir is factored in while estimating the hydrological gain or the value of the economic loss is considered in the cost part.
area of wells in the downstream villages. Similarly, Kumar et al. (2006) and (2008) demonstrated the negative impacts of intensive water harvesting on the inflows into a downstream reservoir in Ghelo basin of Saurashtra in Gujarat. Gupta (2011) found that intensive water harvesting and recharge works promoted by Tarun Bharat Sangh in Alwar district helped well off farmers as they could invest in water abstraction structures.
More importantly, the studies that show good B-C ratio for watershed interventions do not make any attempts either to quantify the hydrological gains from the structures that are subject to benefit-cost analysis, or to compute the economic value created from the use of the additional water stored in the catchment. Instead, they depend heavily on data collected from individual households either for pre watershed scenario from the sample watershed or from the control watersheds through respondent surveys, which also suffer from serious methodological issues. One important issue is of variability in rainfall and climate, the economic conditions and social status which can influence the socio-economic dynamics of the households (Hope, 2007). On the one hand, the spatial variability in rainfall and climate and their resultant impact on agricultural outputs makes it hard to establish ‘control watersheds’. On the other hand, temporal variability in rainfall compounded with changing economic conditions due to factors other than watershed interventions makes it difficult to attribute the changes in socio-economic dynamic between pre and post treatment scenarios entirely to the watershed treatment. A systems approach is required to solve such problems. Research endeavors wherein the economists work with natural scientists to solve inter-disciplinary problems in watershed management are hardly visible in India.
The limited analysis available at catchment scale, which quantified the hydrological gain from water harvesting structures and the economic value of the water use, does not show very encouraging results. For instance, in the case of Soan river catchment, a mountainous catchment in Himachal Pradesh various alternative plans for water management for different sizes (small, medium and large) and life (25 and 40 years) of water harvesting structures were analyzed, with benefit/cost ratios varying from 0.41 to 1.33. Total additional net annual income from crop production (wheat and maize) from

Catchment Assessment and Planning for Watershed ManageMent: Volume II - Annexes56
the different plans for the entire catchment varied from 1.18–3.86 million US$, whereas the total expenditure for storage of water in harvesting structures was expected to vary from 15.15–20.20 million US$ (Goel and Kumar, 2005). The benefit cost analysis favoured only large water storage structures with a life of 40 years, and not small and medium ones.
anneXure a1.11: soCial iMPaCts of Watershed PrograMMes in india
A review carried out on the socio-economic and poverty impact of the IGWDP, one of the most acclaimed watershed development programmes in India, by Buhl (2006) showed some reduction in poverty and hunger as a ‘medium term’ positive impact of the programme. Notably, on none of the attributes (seven MGD goals), the programme showed a ‘very positive’ impact. On environmental sustainability also, the programme showed a positive impact both on the ‘short-term’ and ‘medium term’. It’s impacts on reducing child mortality and improving maternal health has been nil (Buhl, 2006).
Findings of a study on the social impact of watershed development programme in MP state by Hope (2007), however, bring out a very contrasting picture. Hope (2007) found that majority of farmers planting Kharif crops are no better off after the project in income terms with no significant variation amongst social, income or land stratified groups. The smaller group of Rabi farmers fare even worse, on average, but significant variation is found across social groups and land ownership. However, the general lack of improvement in agricultural returns does not correspond well with own-project evaluations of an 84% increase in Kharif yield and a 60% increase in Rabi yield. Qualitative perceptions of project impacts suggest that positive impacts were short-term and mainly associated with project wage labour, and longer term improvements in water access are not identified, raising serious issues about the timing of impact evaluation.
A positive social impact was seen in terms of a significant reduction in domestic water collection times for households with the highest collection times. But, these households were still facing considerable collection costs (e.g., physical, opportunity, health) and
remained excluded from a basic level of domestic water access. But, the author finds it reasonable to argue that that the estimated lower level of domestic water access might be related to new upstream water conservation structures capturing more water, as planned, without fully understanding downstream water implications (Batchelor et al., 2003; Calder, 2005).
A study of watershed development projects in Maharashtra by Kerr (2003), which covered analysis of productivity, conservation and poverty alleviation impacts, looked into poverty alleviation trade-offs of achieving the former two objectives. The study suggested that the projects most successful in achieving conservation and productivity benefits had the strongest evidence of skewed distribution of benefits toward larger landholders. The satisfaction with watershed projects is positively correlated to land holding size, and many landless people strongly resent their loss of access to common lands. While watershed development often asks the poorest, most vulnerable people to provide a valuable environmental service to the wealthiest landowners, few projects have addressed sufficiently the poverty alleviation trade-offs. Most of them take a variety of indirect or partial approaches to the problem of uneven distribution of benefits and costs, and some avoid working in places where they anticipate poverty-alleviation trade-offs (Kerr, 2002).
A study titled “Comprehensive Assessment of Watersheds programmes in India” was assigned to ICRISAT, Hyderabad to assess the impact of various watershed development programmes in India. This study evaluated the impact of watershed programmes with the help of 636 micro-level studies including 311 studies included in the previous study to get more authentic and realistic results (Joshi et al., 2008).
anneXure a1.12: sustainability of Watershed institutions
A large majority of the land and water users in micro catchments are agriculturists. The watershed management programme was initiated to arrest degradation of natural resources, particularly land (Kerr, 2002; Pathak et al., 2013), and the thrust is on agricultural intensification and water harvesting (Calder et al., 2008). Whereas the population affected

ANNEX 3: Catchment Assessment and Planning: A Strategic Review for India 57
by watershed project implementation and agricultural intensification such as drinking water users (exclusive), cattle rearing communities and herders, fishing communities and those who value environmental flows in rivers and riverine ecosystem are a small fraction of the total watershed population. These communities are not quite aware of how the individual actions of land and water users in their watershed and catchment functioning are inter-dependent.
Hence, there is little appreciation among them of how the ecological functions being performed by the catchments get disturbed by inappropriate land use, and how ICM could bring benefits to them directly, if at all there is any. On the contrary, the watershed projects ask the poor people (cattle rearing communities and herders), who use upper catchments to stop ‘open grazing’, so as to provide environmental services to the wealthier farmers in the lower watershed, who benefit from water harvesting (Johnson et al., 2001). Hence, there are opportunity cost of participation for these communities. When the opportunity cost of participation appears to outweigh the perceived benefits of participation, there is a tendency to self-exclude (Warner, 2006; Mansuri and Rao, 2013).
On the contrary, there are many factors that keep the opportunity costs of non-participation low. They are: 1] many IWM interventions produce non-tangible public good, which are often difficult for individual community members to perceive; and 2] the distribution of IWM costs and benefits is determined by the stock of resource use rights and entitlements and the ability to exclude others. On top of this, there are different social groups (Shiferaw et al., 2006). The land and water use conflicts are not apparent in these micro catchments. On the contrary, conflicts arising out of intensive watershed treatment are now visible at least in a few large catchments in India (Kerr, 2002; Kumar, 2010).26
26 For instance, in the case of Aji basin in Rajkot district of Saurashtra, the urban water users have taken to rioting due to excessive impoundment of water through small water harvesting structures in the upper catchment, which resulted in drying up of Aji reservoir, a major source of water for Rajkot city; and Arawari basin in Alwar district of Rajasthan, large scale building of traditional water harvesting systems in the upper catchment of irrigation reservoirs had led to conflict between the community organization and the state irrigation bureaucracy (Kumar et al., 2008). In Maharashtra, ban on free grazing had adversely impacted on herder, who used to depend on the pasture land (Kerr, 2002).
As a result, the local village level and watershed level institutions being promoted by the PIAs for undertaking watershed management activities in India are neither self-initiated by the catchment communities, nor were borne out of the recognition of the need for having such institutions. Instead, they are created for delivering the catchment treatment activities at the local level, as mandated by the donor.
In most situations, the individual farmers are not able to perceive additional benefits of participating in the activities in terms of obtaining access to the resource, or the opportunity cost of not participating in terms of losing rights to use the water from wells and streams, because of the very nature of interventions.27 Larger institutional regime governing the access to and use of water are absent, owing to lack of well-defined rights in groundwater and surface water. Here, one should note that the activities are targeted at improving condition of groundwater in the catchment, and the ability to access the same depends on individual land owner’s technology and money power. Therefore, there is absence of economic incentive to sustain the functioning of these institutions among the various stakeholder communities. A review of six NGO initiated watershed projects in India supported by the Ford Foundation done as far back as 1996 concluded that, despite periods of NGO support to local communities ranging from seven to 12 years... the social organizations or community groups involved do not appear to have reached the stage yet where external support whether operational or institutional’ is no longer required’ (Sinha and Sinha, 1996: p 139).
The local level institutions do not serve as mechanisms for distributing the benefits of enhanced watershed performance, for improving poor farmers’ access to groundwater for irrigation or ensuring sufficient water in the local aquifer for domestic uses during the lean season. Neither the institutions nor the people, who are part of these institutions, have legitimacy. Also, the funds allocated to the PIAs are far less than adequate to continue working with these institutions to experiment
27 While the groundwater recharge benefits from the watershed structures are governed by the geo-hydrological features of the catchment, the ‘user group organizations’ are formed in the villages on the basis of identification of beneficiaries falling within the influence area decided tentatively using thump rules prior to the building of the structures, and not based on their actual influence area.

Catchment Assessment and Planning for Watershed ManageMent: Volume II - Annexes58
innovative ideas of resource sharing and management. Once the treatment activities are completed, the funding support for building the capacity of the institutions stops. Unlike in countries such as Australia, England and South Africa, neither there is legislative basis for these local institutions, nor is there any handholding by any separate agency mandated for catchment management. Watershed management is one of the several activities of the district rural development department, which does not have any qualified human resources for long term planning for catchment management and institutional capacity building.
The extent of training and technical support received by the local institutions to perform their tasks from the
project implementing agencies and the government and donors is too little, and for very short time durations. Also, they do not have any incentive to build their own capabilities due to the factors discussed above. In turn they fail in effectively implementing the programme. Pritchett et al. (2010) explained the mechanism of this persistent implementation failure happen by using the concept of ‘capability trap’, which according to them stem from the following: a] expectations of the external agencies which pass from a level of ‘optimism’ to ‘wishful thinking’; b] isomorphic mimicry, which is about adoption of the forms of other functional states and organizations, without even their functions; and, c] the practice of premature load bearing, which allows the failure to exist.

ANNEX 4: First workshop, Delhi, May 2014 59
first WorkshoP, delhi, May 2014anneX 4
The two-day Brainstorming Meeting of 23-24 May 2014 marked the formal inception of the study. The meeting had 28 participants including Dr. Sandeep Dave and seven others from DoLR, representatives from 6 SLNAs (Andhra Pradesh, Chhattisgarh, Gujarat, Karnataka, Madhya Pradesh, West Bengal), Dr. V. C. Goyal and two others from the National Institute of Hydrology (Roorkee), Prof. Ashwin Gosain from IIT Delhi, Dr. Chetan Pandit (retired Member of the Central Water Commission), Dr. William Young and Dr. Anju Goyal (Water Resources specialists from World Bank, New Delhi office) and four members of the Study Team.
The presentations and the discussions during the Brainstorming Meeting highlighted four core issues, viz., hydrological issues in the IWMP, hydrological aspects of catchment management, improved tools for hydrology assessments, and socio-economic and political aspects of catchment management, the main points from which are summarized below.28
hydrologiCal issues in the iWMPsignificant benefits but increased inequity as ��
well: While it was accepted that the programme had resulted in enormous benefits to local populations in terms of increased benefits of expanded irrigated agriculture as a result of water
28 While the Background Paper was also presented the main points from this have already been detailed in the previous chapter and hence are not repeated here. These points are drawn from the other presentations and discussions that took place at the Meeting.
harvesting and in terms of livelihood promotion activities, there was also recognition of the fact that inequity has increased.
huge investments in creating storage: �� Watershed development programmes had created a huge amount of storage, but it has also resulted in groundwater overdraft subsequently, as a result of private investment in pumping after the project.
Continued focus on surface water and supply ��
augmentation: Watershed development projects continued the narrow focus on sites for structures to augment surface water and did not consider water demand management, groundwater management or basin-level water resource planning and management. The mindset in project planning and implementation was on where to site rain water harvesting structures rather than whether or not to have structures.
limitations of jurisdiction:�� The national watershed management programme has a limited perspective on water resource management and can only consider its own project areas as catchment or basin level management is viewed as the jurisdiction and responsibility of the Ministry of Water Resources (MoWR). Also, within watershed project areas, the programme is limited by a single set of guidelines for the entire country, and with limited flexibility to state governments to plan and implement watershed development projects within the context of overall water resource management.

Catchment Assessment and Planning for Watershed ManageMent: Volume II - Annexes60
less emphasis on social and institutional ��
aspects: Social and institutional aspects of water resource management are large ignored or considered ‘beyond the scope of the project’ as are the water governance institutions and policies required to better manage these resources within catchments.
Paradigm shift needed: �� Especially in semi-arid regions, the focus of watershed management programmes has to shift from trying to maximize water harvesting and storage to better water management through water demand management (e.g., by improving water use efficiency in agriculture).
hydrologiCal asPeCts of CatChMent ManageMent
Water resources are integrated, dynamic and ��
contextual: Climatic, socio-economic and industrial change are constant and affect water resources in a basin. Such changes, therefore, have to be reflected in the management of these water resources. From catchment management perspective the following aspects of hydrology are crucial:
Water is a renewable resource. � Although highly variable is space and time, rainfall can be relied upon to replenish aquifers, reservoirs etc.
Water is in a continuous state of flux. � It moves continuously, for example, from soils to vegetation to the atmosphere along gradients negative water potential.
Hydrological systems are interconnected. �
Changes in land and water management in one part of a hydrological system (e.g. a headwater catchment) may have significant impacts elsewhere in the system.
Diluting and cleansing functions of river have �
limits: Hence pollution loads can increase beyond the assimilative capacity of water bodies like lakes and rivers.
Water balances (or budgets) are governed by �
the law of conservation of mass. Water is not created or destroyed in any of the natural processes of the hydrological cycle.
hydrological assessments need to capture the ��
local catchment dynamics: In order to be useful in predicting possible impacts from planned changes in the catchment, for instance from watershed management projects, models have to be reflect catchment dynamics accurately. The following examples illustrate this point:
Per capita water use in agriculture is highest in �
more arid regions compared to humid regions, despite greater water availability in the latter.
The large shift from paddy to coconut �
cultivation in Kerala increased groundwater problems, because of reduced recharge of groundwater from rice fields.
While several foresters continue to believe �
that planting more trees increases the recharge to groundwater aquifers, the actual relationship is context-specific: it depends on the species, the local climate and geology and in some cases deep-rooted tree species can reduce the amount of water recharging groundwater aquifers.
The extent of groundwater recharged by �
rainfall depends on the local land use and geo-hydrology: high rainfall on the western slopes of the western Ghats result in low recharge of groundwater aquifers and a large run off to the sea (because of the geology) while recharge is higher for the same amount of rainfall in a dry area like Kutchch in western Gujarat.
There has been a huge increase in the last two �
decades in private and public investment in (more and deeper) wells and pump sets and also in water harvesting structures in semi-arid India, which, along with the intensification of irrigated agriculture, has had significant impacts on the local hydrology.
Water resources are subject to the Jevons �
Paradox: technological progress that increases the efficiency with which a resource is used tends to increase (rather than decrease) the rate of consumption of that resource.
errors and omissions in hydrological ��
assessments: Even water balance analysis nad outputs published in international peer-reviewed

ANNEX 4: First workshop, Delhi, May 2014 61
journals are often incorrect for reasons that include the following:
Temporal and spatial boundaries are not �
defined.
The quality of input data is poor. �
Inappropriate extrapolation of field level �
information to a large scale and vice versa.
Use of intuition and guesswork rather than good �
quality information and specialist advice.
Storage terms are omitted from the water �
balance equation.
Empirical relationships used in simple �
methods of estimating runoff and groundwater recharge can no longer be trusted in areas where the hydrology has altered markedly, e.g. as a result of groundwater overdraft.
Double counting of water flows e.g. when �
return flows within a specified domain are added to flows exiting this domain.
Particular challenges in water budgeting include the need to recognize the following:
There are differences between consumptive and ��
non-consumptive water uses.
A water loss from, say, a farmer’s perspective ��
(e.g. drainage or deep percolation) may be a gain from the perspective of another users locally or downstream.
Local reuse of water within a specified domain ��
should not be included in a water budget calculation.
iMProved tools for hydrology assessMents
increasing availability of data and simple tools: ��
Hand-held GIS, freely-available open source software, hand-held GPSs and smartphones as well as global datasets are making hydrological data and its analysis much easier than earlier. NRSC has developed simple tools for site suitability analysis for water harvesting structures but for a zone as a whole and not specific locations within villages (for which information on socio-economic aspects
are needed). The NRSC has helped create the India Water Resources Information System (WARIS) for the MoWR and the Bhuvan portal for MoRD.
satellite data as a viable alternative data source: ��
NRSC has compared rainfall estimation based on satellite data to actual measurements by the existing network of rain gauges and weather stations of the Indian Meteorological Department; land use changes have been estimated and compared with secondary data; irrigation water utilization based on satellite data has been used where there are gaps in existing secondary data; evapo-transpiration estimation as well as reservoir and ground water budgeting have been done using remotely sensed data in cases where field data are unavailable or getting field data is difficult or dangerous.
remotely sensed data for water budgeting: �� A joint project of the National Remote Sensing Centre (NRSC) in Hyderabad and the Central Water Commission (CWC) of the MoWR combined remotely sensed data (e.g., on rainfall, potential and actual evapo-transpiration) and secondary data (e.g., on water use by irrigation, domestic and industrial sectors, discharge and runoff data) to work out water budgets for two river basins using a distributed model approach, with similar assessments planned for other basins by the River Coordination Committee of CWC using the same methods.
soCio-eConoMiC and PolitiCal asPeCts of CatChMent ManageMent
simple and basic tools also needed at village-��
level: While hydrological assessments need to use the best available technologies to accurately capture catchment dynamics, project staff (e.g., of IWMP) need simple tools to use to elicit participation and discussion from local communities while planning watershed management interventions.
Performance assessment criteria are needed: ��
In order to reflect a broad range of impacts, multiple criteria need to be used – and trade-offs assessed – for hydrological assessments

Catchment Assessment and Planning for Watershed ManageMent: Volume II - Annexes62
and predictions to be useful in planning water resources at the catchment and other levels.
Catchment Management strategies and ��
processes require iterations: Although ICM strategies and processes vary across countries, a common feature is that these are iterative and require time for discussion with stakeholders and re-analysis to produce the desired results. A key factor is that stakeholder and political interest and commitment tends to falls off sharply after initial high levels.
it is possible to start quickly and evolve on ��
the way: It is important to start, by bringing stakeholders and issues together at the same time to deal with the immediate issues, which may be hydrological, social, etc., and although the issues are complex, complexity can be addressed incrementally. However, as the Australian case illustrates, progress can be slow and painful, with reversals, but there is improvement at the end. Starting with Landcare groups, which later became community care groups (Communities of Common Concerns), there are now Regional Catchment Groups, some of which are very large (the size of Germany, but with a population of around 45,000 people). Also, although water was a state subject in Australia but in the 1980s, water became a regional issue with state and national governments working on public goods issues, equity, pollution, etc.
At the end of the Brainstorming Meeting, three key issues were discussed and finalized:
focus on creating simple and practical tools for ��
iWMP staff: While catchment level hydrology assessments and modeling may be necessary and useful, DoLR was keen that a set of simple and practical tools should be developed that could be applied with IWMP staff at the community level.
develop the methodology for the catchment ��
assessment: A detailed assessment methodology and tools for catchment hydrology are to be developed by September 2014, including step-by-step methods for estimating current water resource availability and use at catchment level, and for catchment management, with indicators and simulations of hydrological, socio-economic, industrial, climatic and other changes on the catchment. These would also describe how community choices of various watershed interventions could have impacts within the larger catchment and how to ‘iterate’ these to arrive at optimal and dynamic outcomes.
Carry out state-level pilots using the ��
methodology: SLNAs with hydrologists already appointed would use this methodology to start work in one catchment in each state. SLNAs would use the interim period (June – August 2014) to collate all the information required for the hydrological assessment, prepare an inventory of resource persons and institutions available for capacity building and also identify a potential catchment for the piloting of the methodology. The piloting from September to November 2014 would include using the models (after specification, calibration and validation) to create scenarios of potential local and downstream impacts of watershed development interventions and discussing assessment findings and potential scenarios with stakeholders in the local community.
The findings were to be reviewed in regional workshops in November and concluded at a national workshop in the first week of December 2014. A Drop Box for relevant literature on national and international and a e-Discussion Group were subsequently set up to facilitate communication and information sharing between workshop participants.

ANNEX 5: Second workshop, Delhi, September 2014 63
anneX 5
seCond WorkshoP, delhi, sePteMber 2014
The Study Team had a two-day meeting on 11-12 September in New Delhi where the plan for the demonstration in Gujarat was discussed in detail. Based on presentations on issues in basin planning, watershed planning, hydrological modeling, stakeholder involvement and risks and uncertainties, the Study Team discussed issues of modeling (options and cautions), the availability of new technologies, paradigm shifts in watershed management and risks and uncertainties. Some of these have been discussed in the previous chapter while the rest are summarized below:
Ways to mitigate risks and uncertainties in ��
watershed planning and management in water scarce areas include the following (ADB, 2013; EPA, 2008):
Identifying the main sources of risk and �
uncertainty (e.g. lack of good quality data, lack of understanding, prevalence of water-related myths) and take explicit steps to overcome or mitigate each of these sources.
Recognizing trade-offs between alternative �
political, economic, social and environmental objectives and between existing and potential future demands.Carrying out scenario-based analysis and �
planning to address uncertainty in future development and climate, by assessing alternative hydro-economic scenarios. Having cycles of adaptive planning and �
learning that update and improve plans as and when new information and evidence is produced by M&E systems.
Water accounting and water auditing as part of ��
an adaptive management process for watershed management (FAO, forthcoming) where:
Water accounting � is the systematic study of the current status and future trends in water supply, demand, accessibility and use within a specified domain.
Water auditing � places outcomes and findings from water accounting into a broader framework comprising of water governance, institutions, services delivery models, public and private expenditure, legislation, and the wider political economy.
Choice of model:�� Although other models (such as Water Evaluation And Planning System (WEAP) and Mike Basin) were discussed, the Soil and Water Assessment Tool (SWAT) appeared to be most suitable for a variety of reasons:
SWAT is based on the SCS model which has �
been use in India for over 30 years.
SWAT can be used at different scales (e.g., �
0.5 – 100 sq. km, 100 – 1000 sq. km and 1000 sq. km plus).
SWAT is in regular use in India. �
There is already a cadre of trained SWAT �
users in India.
SWAT has already attained a high-level of �
name-recognition, credibility and trust.
Open source and commercial versions of �
SWAT are readily available.

Catchment Assessment and Planning for Watershed ManageMent: Volume II - Annexes64
Online SWAT tutorials, chat-rooms, case �
studies etc are also readily available.
Planning and social processes in Watershed ��
development (Wsd): Some important questions to be asked and some suggested answers are the following:
Where should WSD be placed in a catchment? �
At the hydrological unit that is most suitable for the implementation of IWMP-type interventions. This should also be where appropriate local knowledge or community data collection may help.
Who should be involved in planning and �
implementing WSD and how? A systematic study of interest groups, local government officials, NGOs and community organizations that will be affected by water management projects needs to be undertaken. Preferences for modes of interaction between upstream, mid stream and downstream communities need to be established and some thinking should be initiated about property rights.
What are the appropriate interventions? � This should be decided through discussions that will encourage the sharing of knowledge in regard to water management from differing sites on the catchment and therefore lead to a greater knowledge of the most suitable interventions for the hydrological unit as a whole.
What are the current land uses and land capability �
with WSD? While there may be data bases the local stakeholders can provide knowledge as to the crops they grow, the reasons they grow them and experiences of successes and failures in addition to local knowledge of available skills and their ability to get various crops to market.
What system tools should be chosen to evaluate �
holistic outcomes? Options to choose from
include multi-criteria analysis, sustainable livelihoods approaches (the five capital approach of DFID) and Bayesian Networks.
Using the model for discussion: � Integrated processes provide a framework within which possible future planning and water management scenarios can be formulated and discussed in relation to potential water management futures; but this needs to be adapted to include all stakeholders.
How do we know if WSD/WCM has succeeded? �
Given adequate human and financial resources to conduct evaluations on a regular periodic basis, local communities, NGOs and local government officers will be vital in providing local knowledge and data for the evaluation and suggestions for improvement that can be assessed using the systems tool.
What can go wrong? � Given that these approaches (and system assessment tools) are heavily reliant on a participatory approach, which may work well, there are some who doubt that community based projects can persist in the long term. Also, the community are the key source of providing information as to the appropriate characteristics for institutions. While outside insight is helpful, if institutions do reflect something that seems fair to the community as a whole within the hydrological unit they are in a better position to avoid undue conflict. The community will also assist in resolving the inevitably increasing trade-offs which will have to be made for sustainable management of water resources in dryland areas.
Potential risks and their mitigation: �� The Team also analysed possible risks and how they may be mitigated (Table A4.1).

ANNEX 5: Second workshop, Delhi, September 2014 65
Based on these discussions, the Study Team took the following decisions:
Catchment selection: �� Select the catchment based on the following (draft) criteria:
Clear slope from ridge to valley. �
Adequate number of stream gauging and rain �
gauging data.
Relatively easy access by road. �
Relatively fewer dams and structures. �
Using Google Earth and maps available ��
on the internet, the Upper Dhadhar Catchment in the eastern part of the Vadodara district was provisionally selected. The
final choice was to be made after the field visit and ascertaining data availability and access:
the choice of model � : Take a final decision on the choice of model till after the field visit and an assessment of data availability.
begin interactions with stakeholders along �
with data collection: Create and pilot formats for primary data collection and stakeholder interactions simultaneously with (and independent of) the choice of catchment and model. Begin rapport building as soon as possible and collect local information as part of the hydrological assessment.
The study team left two days later, on 14 September ��
2014, to begin the field-level pilot in Gujarat.
sl. no. risks risk Mitigation
1 Late delivery of output as a result of limited time and resources
Careful planning (using a Gantt chart)Avoid ‘mission creep’Identify rate determining steps (e.g. give relatively more attention to “must have” data and “must have” reporting)Hold regular progress meetings (e.g. monthly skype call?)
2 Main clients are not happy with outputs or deliverables
Provide regular feedback Make mid-course corrections where necessary
3 Pilot study becomes the priority rather than the piloting of a methodology that can be adopted by the IWMP
All team members aware of main deliverablesOversight by Study Team leader
4 Methodology too heavy or too broad to be adopted and upscaled by IWMP (by Neeranchal)
Hold structured discussions aimed at identifying changes to IWMP processes that may or may not be acceptableConsider options for streamlining
5 This turns into a demo of a particular model (e.g., SWAT) rather than a modeling & improved planning demo
Make sure that the reporting is not too model centricEnsure reporting and deliverables have disciplinary balance
6 Selected basin proves not to be ideal Draft selection criteria before the field visitIf basin does not tick relevant boxes, make an early decision on switching to another one
7 Uncertainties in the approach are not given enough attention
Careful identification and tracking of uncertainties
8 Lack of inter-disciplinary credibility Make sure that reporting does not give the impression that the Study is promoting a new technocratic approach
9 Modelers and field teams do not work in tandem
Rapid feedback or communication regarding any changes in plans, any new requirements
table a4.1 STUDY RISKS AND THEIR MITIGATION


ANNEX 6: Technical Meeting, Delhi, November 2014 67
teChniCal Meeting, delhi, noveMber 2014anneX 6
A Technical Meeting, held at the World Bank New Delhi office on 15 November 2014, was attended by Dr. V.C. Goyal (National Institute of Hydrology, Roorkee), Prof. Ashwin Gosain (IIT Delhi), Mr. Shyamal Tikadar (CEO, GSWMA), Mr. Shyamakant Pradhan and Mr. Binov (Technical Experts, GSWMA) and Dr. William Young (Water Resources Specialist, World Bank, New Delhi office) besides the Study Team.
The discussion covered two basic issues, modeling in general and the findings presented from the SWAT model and possible improvements:
Modeling in generaluses of modeling: �� Modelling can be done in different ways to feed into a Decision Support System (DSS), with or without hydrological models. Modelling can be done either as a one-off modeling exercise of adaptive modeling – depending on the technical capability a government has (or can outsource).
good practice and tools: �� It is good practice to start with a conceptual (or perceptual) model and then move to a more detailed physical model. Use different tools depending on the data needs (for modeling) and the questions being asked - e.g., using a conceptual model of rainfall-runoff mass-balance using pen-and-paper calculations when data was scarce and when physical impacts of land use change were not required, and using a ‘physical model’ like SWAT when data were available and the impacts of land use change
are to be analyzed. It would be useful to create a ‘flow chart’ to know what tool to use under what circumstances. Several tools are available, e.g., Australia’s TEDI (Tools for Estimating Dam Impact) and CHEAT (Complete Hydrological Evaluation of Assumptions in TEDI).
Water efficiency and productivity: �� Since there is a supply side bias in modeling, look at productivity, water yield and efficiency as well as ways of improving that. Revisit the 20% efficiency assumption in some GOI documents.
risk: �� Assessments must take account of stakeholder attitudes towards risk.
Curve numbers: �� ICAR and CSWCRTI have generated a large body of information on (SCS) Curve Numbers (relating rainfall to runoff) for watersheds in India and would be useful to look at these for rough characterization of catchments based on their runoff potential for given rainfall.
discharge data�� : This is a critical input for modeling, but is is currently unreliable at watershed scale despite CWC having a national dataset of 2500 stream gauging stations.
sWatChoice of model: �� SWAT appears to be a satisfactory choice for the purpose at hand, especially given since it is freely available, people are familiar with it and that support is readily available.

Catchment Assessment and Planning for Watershed ManageMent: Volume II - Annexes68
goodness of fit: �� The improved fit of the SWAT model to observed values when replacing some global data sets with national and state-level data sets is good, but further improvements are possible.
treatment of groundwater: �� Groundwater is poorly modeled in SWAT but the size of the catchment selected is too small to use another model like MODFLOW (a specialized groundwater modeling software) which also requires a lot of data that may not be easily available. Perceptual modeling is hence useful addition.
Calibration and validation: �� The model must be calibrated using a part of the data set, and the rest of the data used to validate the model.
scenario generation: �� Do a ‘base case’, prior to any intervention, to see how much of the catchment hydrology has already been changed. Then create scenarios that can also look at future land use change, a feature that SWAT supports, but the time period of the scenarios is an important consideration.
land use changes: �� Use land use data for different years or else the modeling will assume that land use has not changed during the 20 year modeling period.
rWh structures: �� Aggregate smaller structures into a ‘reservoir’ to study their impacts in the model, but note that the location of the RWH structures can make a difference to the model outputs, (e.g., how many times a check dam will
‘fill and spill’) and also that the number of Water Harvesting Structures (WHS) may not increase monotonically, given that some structures are broken, neglected or fallen into disuse over time.
evaporation: �� Take into account the impact of evaporation as this could be large. A variation as large as 40% in evaporation rate can occur depending on whether the Hargreaves or Penmon-Montieth method is used. This can be checked using remotely sensed data.
reservoir levels:�� Small differences between estimated reservoir levels could explain the negative values obtained sometimes while using the formula to obtain reservoir outflows (given the uncertainty inherent in the estimation process).
uncertainty in the model: �� Although the model tries to maximize the ‘signal to noise ratio’, some assessment of uncertainty in the model is necessary; Sensitivity analysis can be done and there are different options to do this, such as Dynamic Risk Assessment which will generate a dependability curve of a coarse estimate of Sustainable Yield.
soil data: �� Soil series data will not help much, and instead soil profile data is needed. This is available with NBSSLUP, but it may not be easy to procure this data. Alternatively, look for locally-available data on soils, e.g., a district soil map, research done by Agricultural universities and Krishi Vigyan Kendras (KVKs) in the region.

ANNEX 7: Final workshop, Delhi, December 2014 69
final WorkshoP, delhi, deCeMber 2014anneX 7
The findings from the modeling and the stakeholder interactions were presented at the Delhi workshop of 1-2 December 2014. The workshop had 18 participants, including the Study Team, comprising Dr. Ashwin Gosain (IIT Delhi), Dr. V. C. Goyal (National Institute of Hydrology, Roorkee), Dr. Sandeep Goyal (Madhya Pradesh Centre for Science and Technology), Dr. Durga Rao (National Remote Sensing Centre, Hyderabad), Mr. Shyamal Tikadar (CEO, Gujarat State Watershed Management Agency), Mr. Shyamakant Pradhan (Technical Specialist, Gujarat State Watershed Management Agency), Mr. Yugandhar Mandavkar (consultant, watershed management), Mr. Vaishakh Palsodkar (Hydrologist, Department of Land Resources), Mr. Vijay Kumar (Monitoring and Evalation specialist, Department of Land Resources), Dr. William Young and Dr. Anju Gaur (Water Resources Specialists, World Bank, New Delhi office) and Mr. Ranjan Samantaray (Watershed Management specialist, the World Bank, New Delhi office).
The perceptual and simulation model findings were generally appreciated and several helpful suggestions were given to improve the modeling results, including varying irrigation use (to show wet and dry years) and adding other options for scenarios. The main issues discussed were the following:
data issues: �� The difficulties with obtaining the data required for modeling was a key issue and the following suggestions and experiences were shared:
Administrative boundaries: � Better to use the Tehsil or Taluk (defined by state government)
and not the block (defined by the GOI) as the administrative boundary.
Adding census data: � It is not normally possible to match census data with that collected by the Revenue Department, but the Madhya Pradesh Center for Science and Technology (MP COST) has created a methodology to do this.
Scale for mapping: � Maps on a 1:10,000 scale is better than the 1:25,000 scale used and this freely available for government institutions (but not for non-government organizations doing studies).
Yield data: � This is generally a problem but one option is to use forecasts of yield from a government programme called FASAL (earlier CAPE – Crop Area Production Estimate) which is available for each district (pre-harvest yield forecast). It has been checked at many levels, and has a 90% match with crop-cutting experiments.
Capturing RWH structures: � The Rajiv Gandhi Watershed Mission (RGWM) in Madhya Pradesh has made an Android-based mobile application that sends photographs taken by villagers using their mobile phones directly to the server, where it is updated periodically, thus giving the State Data Centre quick access to data updated periodically. However, the crucial issue is how this information is processed and used for hydrological planning.

Catchment Assessment and Planning for Watershed ManageMent: Volume II - Annexes70
Data portal: � The RGWM is collecting all available scientific data and will soon be making this available on an open access portal (after obtaining the required security clearances).
Need an institutional framework for the collection �
and sharing of data: Apart from coordination across national and state-level agencies responsible for collecting data, the district administration should drive the coordination of available government schemes for watershed-level development, while ‘information kiosk’ are necessary as well, for citizens to access this data.
hydrological Modeling: �� On the general issue of hydrological modeling, the participants’ views and suggestions were the following:
Hydrological modeling is needed � but a basket of models, preferably less data-hungry, starting with a perceptual model, and detailed process-based models may not be needed everywhere.
Start at basin level � and zoom in, using the best possible inputs from different sources to improve modeling accuracies.
The model used must have flexibility � to produce different components as outputs – e.g., ET from agricultural land, crop and forest land, soil erosion and soil moisture.
Hydrologists are needed � and given the relative paucity of hydrologists with field experience, there is a need to design a Training of Trainers for hydrologists to orient them in the right direction in this task, not only for modeling but to guide the overall planning, implementing and monitoring of watershed development projects.
improvements in iWMP: �� The Technical Specialist from GSWMA felt that the new approach will definitely help to do proper planning, as it will provide a scientific basis for deciding how much water is to be discharged downstream and to plan the number of structures, for optimal water storage. But he was also interested in sediment yield measurements, to set objectives for
preparing DPRs for proposed new structures and monitor these over time. In addition, the DoLR representatives outlined some of the new initiatives from DoLR, which include the following:
Geo-referencing of proposed RWH structures is �
now mandatory for the preparation of Detailed Project Reports (DPRs) for all additional infrastructure proposed under IWMP.
Existing structures on drainage lines are to be �
shown along with a status report detailing the condition of these structures.
A Convergence Matrix � has been prepared, and presented to states in the Bangalore Best Practices workshop of October 2014, and has now been sent it to states for their approval (e.g., for state specific schemes), detailing the various government schemes that can be converged with the IWMP at the field level. The state of Tamil Nadu is already doing this convergence, even on a public-private partnership mode.
refining the methodology: �� Suggestions to improve and refine the approach and methodology included the following:
Carry out pilot studies in other states: � While this pilot has been done in a relatively water-rich catchment, it would be good to repeat it in an arid/semi-arid catchment, where there could be different and more complicated problems. It would therefore be useful to carry out pilot studies in other states to demonstrate the approach and methodology, to analyze possible differences, and thus derive a comprehensive methodology to guide the preparation of watershed management plans for different states. Such a methodology cannot be a one-size fits all, but should account for the ’30 percent’ of variation from the ’70 percent’ that is likely to be common to all areas.
Data specification and quality: � The methodology should not only list major parameters to be considered for modeling in every agro-climatic zone, and specify the data sets needed for modeling (sources, scale and procedures to acquire these) but also set quality assurance standards for these datasets.

ANNEX 7: Final workshop, Delhi, December 2014 71
Suggest specific options: � After carrying out the modeling and preparing the Water Resource Management Plan and the Land Resource Management Plan, the approach should also suggest specific land and water management options.
Criteria for prioritization and selection of IMWP �
watersheds: The approach should also suggest hydrology-based criteria for selecting and prioritizing IWMP watersheds.
Monitoring over time: � While the additional information collected for the modeling exercise can be added to the existing M&E framework of the IWMP (baseline survey), the framework should be expanded into include monitoring of changes over time, in both the physical and socio-economic characteristics of the catchment.
Local stakeholders involvement: � The understanding and aspirations of local stakeholders should be included in catchment planning while their traditional knowledge and social organizations should be involved in the management of land and water resources in their catchment.
The workshop concluded by noting that this study was an opportunity and need for better science to inform planning processes and greater community ownership and participation in watershed management at different
scales – a combination of local scale and larger basin level analysis. Participants felt that the study findings could be shown to various Ministries and Departments to initiate a discussion on the inter-dependence of departments and the need for better coordination of different governance issues for managing water at different scales, which is a larger issue than this particular study.
eXtension of sCoPe
Since the Joint Secretary, DoLR, was busy with the winter session of Parliament they could not attend this meeting, and hence a special presentation was arranged for them on 15 December 2014. While this meeting did not dwell on hydrological modeling work, which was seen as an activity to be done by professional modelers, the key issue discussed was the preparation of the village water sub-plan. This aspect of the study was sought to be expanded through a piloting of the proposed decentralized village planning process. If successful, DoLR was prepared to formulate guidelines to mainstream the approach.
In recognition of the DoLR’s interest in pursuing this aspect, the study was extended till June 2015 in order to demonstrate the village planning process. This also provided an opportunity to work further on the creation of scenarios for the potential impacts of watershed interventions in the upper catchment, both locally and in downstream areas.


ANNEX 8: Technical Note on SWAT Modeling 73
teChniCal note on sWat ModelinganneX 8
introduCtion
Watershed development can have significant hydrological impacts both locally and downstream. The construction of soil and moisture conservation and Rain Water Harvesting (RWH) structures which capture and store runoff, will generally lead to a localized increase in groundwater recharge. This can improve the productivity of irrigated agriculture and the security of drinking water supplies to the benefit of local communities. Through the capture of runoff and a reduction of peak flows, RWH can also reduce the magnitude of downstream flooding. The effectiveness of soil and water conservation structures in reducing sedimentation of downstream reservoirs is also well documented.
Watershed development can also cause significant reductions in the quantity of water flowing downstream through increased water use and loss via Evapotranspiration (ET) (Bouma et al., 2011). In many watersheds, increased groundwater availability following the construction of water impounding and recharge structures, leads to some expansion in the irrigated area. The greater volume of water applied as irrigation to larger amount of crop land increases ET from the watershed (Adhikari et al., 2013). Additionally the high surface to volume ratio of RWH structures can lead to large direct evaporation losses, particularly if infiltration from the structure is low (Kumar et al., 2006; Glendenning and Vervoort, 2010). The resulting reductions in downstream flow are often more significant in dry years, amplifying the potential impacts on downstream communities (Kumar et al.,
2006 & 2008). Future climate change could potentially exacerbate these impacts.
Taking measurements to assess the performance of individual RWH structures is a difficult and time-consuming process (Mishra et al., 2007). The impact and effectiveness of structures is often highly variable even within small watersheds and a range of characteristics, including structure design and local soil, land use and geo-hydrological characteristics, influence recharge rates. Due to high variability, results from monitoring one structure or watershed may not be relevant to another. The spatial variability in and complex interactions of factors influencing the effectiveness of RWH structures even within small watersheds make it difficult to determine optimal locations and sizes of structures and to develop a comprehensive watershed plans (Sharda et al., 2006).
The challenges of planning and monitoring arising out of the high variable impacts of RWH structures have contributed to the increased popularity of hydrological models as a tool for exploring the potential impacts of various watershed management interventions. Models are a low-cost and less time-consuming method in comparison to physical monitoring. There are numerous models available, most of which are open-source and free to acquire. Many are distributed or semi-distributed allowing them to take advantage of the ever increasing quality and quantity of remotely sensed data, which can provide critical input into analysis in locations where data is scarce. Models have also become more user-friendly with many utilising GIS software as interfaces.
James batchelor, M. dinesh kumar and a.J. James

Catchment Assessment and Planning for Watershed ManageMent: Volume II - Annexes74
The support available to model users from sources such as online forums and user-groups has become more accessible and comprehensive, making it easier for non-experts to setup and use models.
Hydrological issues are still given relatively low importance for watershed development, partly because of a lack of suitable information. There is clear potential for hydrological models to help fill this gap and build on their popularity and successful use in academic studies. Numerous studies worldwide have utilised models to look at the potential hydrological impacts of watershed interventions at various scales (Glendenning and Vervoort, 2012). The ability to use them to develop scenarios and answer ‘what if’ questions regarding the impact of a range of land use changes including watershed development, can be particularly useful for projects such as IWMP.
In this study the Soil and Water Assessment Tool (SWAT), one of the more popular open-source hydrological models, is used to assess the impacts of watershed development on the Sukhi catchment in Eastern Gujarat. The project seeks to answer a number of important questions regarding the use of models:
Can the model be calibrated and validated with 1. sufficient accuracy using available data to raise the confidence level in the model’ ability to simulate the watershed hydrology for decision-making in programmes such as IWMP?
Can various scenarios of possible future changes 2. in land use be incorporated into the model in a way that is useful for looking at the impact of management interventions and other factors usually carried out under IWMP?
Is the model compatible to incorporate knowledge 3. and opinions from local communities?
What is the potential of employing this 4. methodology for IWMP projects in other locations?
Monitoring Watershed develoPMent
Quantifying the impact of watershed development on local and downstream hydrology is a challenging task.
There is no universal method for measuring recharge from individual structures. Most techniques are based on measurement of water levels in wells and bore wells close to the RWH structures and the development of a water balance equation (Sharda et al., 2006). In comparison with annual rainfall or ET, groundwater recharge rates are generally small and therefore accurate calculations can be tricky. Due to the scarcity of data it can also be difficult to construct a baseline against which to evaluate the impacts of watershed development. The collection of sufficient data to build a baseline prior to implementing watershed development is rarely feasible given the time needed, while the alternative of using a control catchment increases monitoring demands. As a result there have been few studies that have attempted to quantify the impacts of watershed development in specific locations and consequently the hydrological impacts of watershed development at the catchment scale in India are still not completely understood (Singh et al., 2014).
That said, the studies that have been carried out provide useful information for the setup and validation of models looking at the impact of watershed development. Applying the water balance method, Glendenning and Vervoort (2010) found that RWH structures recharged approximately 7% of annual rainfall in the Arvari catchment in Rajasthan. The water balance equation was developed by monitoring the water levels of seven WHS structures and the groundwater depth in 29 nearby dug wells, over a two year period. The study found that average potential daily recharge of structures varied from 12 to 52 mm/day while actual recharge ranged from 3 to 7 mm/day. Kumar et al. (2008) in their study of Ghelo river basin in Saurashtra in Gujarat found that after intensive water harvesting activities were initiated in 1997, the rainfall-runoff relationship of the basin altered, with lesser observed flows in the river for the same quantum of rainfall post water harvesting intervention. Adhikari et al. (2013) monitored two percolation tanks and two check dams in a 920 hectare watershed in Andhra Pradesh by measuring daily rainfall, evaporation and storage structure depth and developing a water balance equation. They found that a threshold value of 61 mm of rainfall was required to ensure 1 mm of potential recharge and that total recharge potential was only 3% of annual rainfall.

ANNEX 8: Technical Note on SWAT Modeling 75
Singh et al. (2014) investigated the impact of watershed development on an 850 hectare catchment in Madhya Pradesh using an adjacent watershed as a control. Water levels in the check dams were monitored daily while water levels for 116 wells in the treated watershed, 42 wells in the control watershed and 26 wells downstream were recorded every 15 days. Groundwater recharge for the watershed was estimated using the Water Table Fluctuation (WTF) method while recharge from each structure was estimated through the use of a water balance equation. ET in the watershed was found to be 64% of rainfall in comparison to 58% in the control watershed. Differences in groundwater recharge (11% vs 7%) and runoff (21% vs 34%) were also recorded was along with an increase in farmer income. Soil loss was 50% less than that of the control watershed. The storage capacity of the aquifer was found to be a limiting factor to the increase in recharge that RWH structures could provide.
Sharda et al. (2006) used both the water table fluctuation and chloride mass balance methods for measuring groundwater recharge from RWH for two small catchments in Madhya Pradesh. Results showed that 7.5% and 8.5% of annual rainfall was recharged respectively for the two methods and that a minimum of 104.3 mm of cumulative rainfall was required to generate 1 mm of recharge from the RWH structures. The study found that higher rainfall amounts did not result in proportionally high recharge as the structures had a limited capacity to induce recharge. Remotely sensed data provides an alternative method to the direct measurement of individual structures and allows monitoring to be carried out at lower cost and at a larger scale. Bhalla et al (2013) used NDVI derived from satellite remote sensing data to compared productivity in micro-watersheds where watershed development had taken place with adjacent untreated watersheds. They found little difference and argued that the rural development goals of watershed development need to have a stronger hydrological and ecological basis.
Prioritization of Watersheds
Although studies investigating the hydrological impacts of watershed development have been relatively few, there has been plenty of research carried out on the prioritization of watersheds using GIS (Bhalla et al., 2011).
GIS can be used to combine spatial datasets in multi-criteria analysis to determine the overall suitability of different sites. Datasets can be weighted depending on their importance and the overall goals of the project. This is the method applied by IWMP for the prioritization of watershed development.
Inclusion of hydrological datasets in GIS site suitability analysis can be challenging, due to the difficulty of acquiring and processing suitable datasets. A common solution is to derive runoff potential for the target area using various methods. Jasrotia et al (2009) calculated runoff potential, for a 372 km2 catchment in North West India, using the Thornthwaite Method (TM). The main advantages of the TM are its simplicity and the ease of acquisition of the data it requires, which is long term average monthly rainfall, long term average potential ET, and soil and vegetation characteristics. The resulting runoff potential map was combined with other datasets, including land use, soil and slope, using GIS to identify suitable locations of new RWH structures. Ramakrishnan et al. (2009) calculated runoff potential for the Kali catchment in Gujarat using the US Soil Conservation Service Curve Number (SCS-CN) method and used it as input to GIS site suitability analysis for RWH structures.
The IWMP guidelines for watershed development projects highlight the important role of GIS and remotely sensed data in prioritizing watersheds (GoI, 2011). Demographic, socio-economic and environmental datasets are combined using GIS and used to rank watersheds according to their development needs. In total thirteen parameters are used, each of which is weighted in terms of its importance. The methodology aims to identify contiguous watersheds to create a total project areas of 1000 to 5000 hectares. To support the GIS planning of watershed development, the National Remote Sensing Centre (NRSC) has developed an online mapping portal for IWMP (http://bhuvan.nrsc.gov.in/projects/iwmp/). An Android app was also developed so that photos, GPS coordinates, and related attributes could be uploaded directly from the field. The portal allows the field data to be edited and overlain of high-resolution images to assist in the development of watershed plans.
A common theme of the IWMP guidelines has been the lack of hydrological input in the methodology for

Catchment Assessment and Planning for Watershed ManageMent: Volume II - Annexes76
selecting watersheds with the primary focus being on reducing water stress, raising agricultural productivity and poverty alleviation (Bhalla et al., 2013). Selection parameters in the guidelines relating to water resource stress include acuteness of drinking water scarcity, extent of groundwater overexploitation, and moisture index but these do not capture the hydrological status of areas in much detail. The lack of focus on hydrology has been partly due to the lack of ability to obtain relevant hydrological datasets, and partly due to the greater importance placed on economic and social goals.
Modelling Watershed develoPMent
Due to the practical difficulty and high cost of directly measuring the impacts of RWH structures at the catchment scale, hydrological models have become a practical tool for assessing the wider scale impact of watershed developed (Glendenning et al., 2012; Singh et al., 2014). Models can be used to investigate hydrological processes and components of the water balance, that are difficult to directly measure due to their complexity, and to predict the impact of changes in land cover, climate, management and other factors. In the case of watershed development, models provide a method of extrapolating knowledge of individual structures to assess their impacts on catchments as a whole and on the different components of the water balance.
Models can provide similar outputs to the watershed studies discussed in section 2, for example, through scenario development it is possible to look at the changes in ET and groundwater recharge as a percentage of rainfall with and without watershed development. Scenarios can be used to vary the number of RWH structures to find the optimal development level while still considering downstream impacts. A widely accepted benefit of the scenario approach is that relative model accuracy (the absolute difference between scenarios and the baselines) is higher the absolute accuracy of the model compared to reality (Droogers et al., 2008). This means that model results can still be useful for management decisions even if there are issues with the underlying model. Although any model uncertainty in such a situation has to be carefully considered, this particular characteristic increases the utility of the model in data scarce areas, and where remotely sensed
data may not provide as accurate a representation of watershed characteristic as field data.
By providing estimates of the potential hydrological impacts and trade-offs of watershed development, models can fill an important gap in many existing planning methodologies such as the one used by IWMP. Model results can be used directly in the selection of project watersheds, for example by only selecting areas where the negative downstream impacts are predicted to be low at the desired level of watershed development. Projected future changes in climate and land use could also be incorporated. Models are also useful tools for stakeholder interaction and learning, especially if stakeholders are involved in the formulation of scenarios. This fits well with the overall philosophy of the IWMP guidelines which highlight the importance of participation.
Models that are suitable for studying the impacts of watershed development generally have a relatively large number of input parameters, as this allow soil and moisture conservation structures and land use interventions to be represented with a reasonable degree of accuracy, and allows variation in the parameters to simulate the changes in watershed configuration in accordance with the scenarios. The downside of highly parameterised models is that estimating all the parameters with reasonable level of accuracy can be difficult, especially in locations where field data is scarce. In many cases assumptions have to be made and expert knowledge and judgement used, alongside automated calibration and validation. The challenge of parameterization means that the ability to easily incorporate remotely sensed data is also a desirable model characteristic. This is mainly found with distributed or semi-distributed models which allow capturing of spatial variations in land use, topography, soil characteristics and other features. This characteristic also allows RWH structures to be place at specific locations within the study catchment and upstream/downstream relationships to be modeled.
There are an increasing number of examples of the application of hydrological models for predicating the impacts of watershed development. Glendenning and Vervoort (2011) applied a conceptual water balance model, with many similarities to SWAT, for modeling the impact of watershed development on the Arvari catchment in Rajasthan. They found that representing

ANNEX 8: Technical Note on SWAT Modeling 77
the shape of structures in the model was difficult without adding many new parameters and significantly increasing the complexity of the model. The model showed that RWH structures generally increased the sustainability of irrigated agriculture but that the marginal benefit of each additional RWH structure was less than the preceding one. This is in conformation of the arguments made and estimates offered by Kumar et al.. (2006 & 2008), which showed increasing unit cost of harvesting of water (Rs/m3 of water), at higher levels of development of the catchment. Above a certain limit additional structures did not increase groundwater recharge and only reduced downstream flows. Calder et al. (2008) used the HYLUC-Cascade model to look at the impact of RWH structures on 2 small catchments in Karnataka, India. Three scenarios were developed looking at the annual impact of flows from the catchment of different levels of watershed development. The model predicated a 14% increase in recharge as a result of the RWH structures but also an increase in evaporation from the watershed. Nune et al. (2012) analysed data for the Musi sub-basin in Andhra Pradesh using a simple rainfall-runoff regression model. Results showed a major decline in stream flow after implementation of watershed development.
aPPliCations of the sWat eXaMining the iMPaCt of ManageMent interventions
SWAT was identified as a suitable model to study the impact of watershed development in India (Mishra et al., 2007; Glendenning et al., 2012) due to a number of characteristics:
A large user-base that has grown substantially ��
over the last decade leading to frequent model improvements and updates.
A large number of successful applications both ��
in India and worldwide that give the model good credibility and provide a useful source of information (Gassman et al., 2007).
An active on-line community that can provide ��
useful support regarding all aspects of model use.
It is semi-distributed and can therefore account ��
for spatial variation in important catchment characteristics such as land use.
It is adept at using remote sensing data both as ��
inputs and for calibration and validation making it a good choice of model in locations where other sources of data are scarce.
The delineation of sub watersheds during model ��
setup is flexible allowing SWAT to be applied at any scale from the plot level up (e.g. Tripathi & Gosain, 2013) to the continental (e.g. Gosain et al., 2011).
It is open-source which allows users to access the ��
source code both to see how the model works and to make changes to the model so that it better suits their needs.
It can be easily linked with other models including ��
MODFLOW and WEAP.
It is computationally efficient which allows ��
detailed modeling of large catchments.
Simulation of crop growth and yields man that it ��
can be used to examine the economic outcomes of different scenarios.
Additional software, such as SWAT-CUP and ��
SWAT Check, help the modeling process and improve model outputs.
There are a number of interfaces available for ��
different GIS including ArcGIS, MapWindow and QGIS which allows users to choose one with which they are familiar.
The number of studies using SWAT for modeling the impact of watershed development both in India and worldwide is increasing rapidly. Mishra et al. (2007) used SWAT to study the role of check dams in controlling sediment in a 17 km2 catchment in Jharkhand. Scenarios were developed to examine whether the location of the three large check dams constructed had been optimal. Although the model tended to over-predict runoff in comparison to observed data, calibration and validation results were good, and the authors concluded that SWAT was a useful tool for studying the impact of RWH structures. Tripathi et al. (2003) applied SWAT to the 92 km2 Nagwan catchment in Bihar for the prioritization of watersheds, which were identified using sediment and nutrient loss predicted by the model.
Garg et al. (2012) used SWAT to assess the impact of watershed development on the 293 hectare Kothapally
Catchment Assessment and Planning for Watershed ManageMent: Volume II - Annexes78
watershed located within the Krishna basin in Andhra Pradesh. The watershed was intensively monitored allowing accurate and detailed parameterization of the model. Discharge, reservoir volume, sediment loads and crop yield were all calibrated using observed data. Scenarios were subsequently developed to look at the watershed with and without both in-situ and ex-situ soil and water conservation practices. Results showed that the construction these practices significantly increased groundwater recharge and ET resulting in a reduction of downstream flows, which fell to negligible levels in dry years. Overall downstream flows were reduced by more than 50% following watershed development although sediment loads were also predicted to fall by a significant amount. Garg et al. (2013) examined the impact of watershed developed on the entire 736 km2 Osman Sagar catchment, of which the Kothapally watershed is a part. The model was calibrated using observed monthly inflows into the Osman Sagar reservoir, located at the drainage outlet of the said catchment. Scenarios showed that RWH structures resulted in higher ET and groundwater recharge and reduced runoff. The scenario representing intensive watershed development in Osman Sagar catchment predicted a reduction in the inflows into the downstream reservoir of 30-60%, a significant finding given that it the reservoir is an important source of water for the city of Hyderabad.
The simulation of crop growth and yields in SWAT allows the model to be used to study the local economic impacts of watershed development. Karlberg et al. (2015) did such a simulation for Kothapally watershed building on Garg et al., 2012 & 2013. Farm incomes were estimated from crop yields for a number of different watershed development scenarios. Results showed that watershed development increased famer incomes by allowing increased cotton cultivation, providing more water for irrigation to bridge dry periods, and allowing an extra irrigated vegetable crop. An interesting finding was that the increase in income owing to watershed development over the pre watershed situation was higher in wet years than in dry years, in part because traditional cropping system, which predominated prior to watershed development, proved more resilient to drought than the irrigated crops adopted post watershed development. This essentially meant that watershed programme did not produce much economic benefit during drought years.
A number of studies in India have used datasets other than stream flows to calibrate SWAT in data scarce locations. This is encouraging and potentially increases the usefulness of SWAT to projects such as IWMP that operate in catchments for which discharge data are mostly not available. Lakshmanan et al (2011) validated SWAT for the Bhavani Basin in Tamil Nadu by comparing predicted rice yields to observed rice yields as observed discharge data was not available. The model simulated rice yields well for normal years but overestimated for the dry years. The increasing quality and quantity of data derived from remote sensing provides new options for the calibration and validation of hydrological models. Immerzeel et al. (2008) calibrated SWAT for the Upper Bhima catchment in Maharashtra using ET values estimated from remote sensing data using the SEBAL method. Generally the spatial patterns of ET simulated by SWAT agreed with the SEBAL results. Model validation using observed discharge showed that the model was accurately simulating hydrological processes in the catchment as a result of calibration. The study concluded that SWAT combined with remote sensing provided a method of improving understanding of the complete water balance in areas of data scarcity.
CatChMent desCriPtion
The Sukhi catchment is located within the Orsang sub basin of the Narmada basin. The majority of catchment is located in eastern Gujarat, with 79% of its area in Chhota Udepur district, 15% in Dahod district, 1% in Panchmahals district, and the remaining 5% in Jhabua district, Madhya Pradesh (Figure 1). The catchment has an area of 393 km2 and land use is dominated by agriculture and forest. A major feature of the catchment is the reservoir created by the Sukhi dam, completed in 1987. The reservoir has an effective storage capacity of 178.47 million cubic meters and a surface are of 29.04 km2 when full. Two irrigation canals flow downstream from the reservoir with a total command area of 31532 hectares. There are two smaller reservoir, Jamli and Jogpura, upstream of the Sukhi reservoir that provide local irrigation. A significant part of the catchment falls within the Ratanmahal wildlife sanctuary. Around 50 villages in the part of the catchment lying in Vadodara district have been selected by IWMP to undergo watershed development.
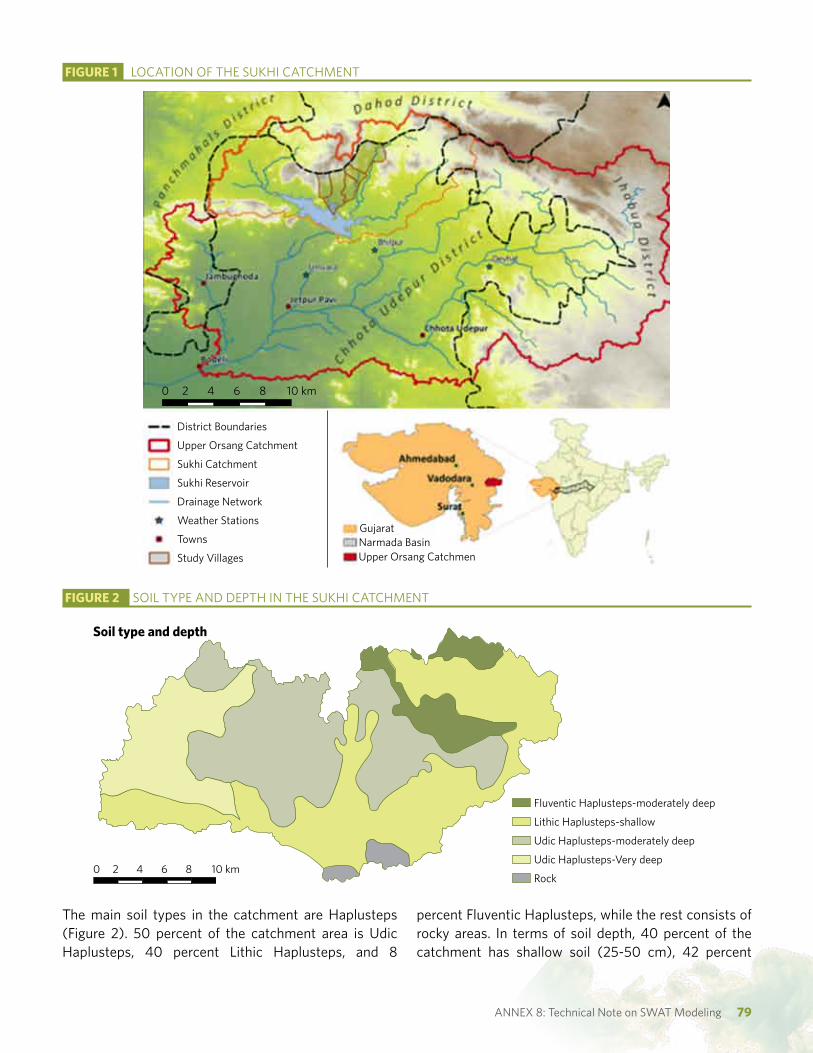
ANNEX 8: Technical Note on SWAT Modeling 79
figure 1 LOCATION OF THE SUKHI CATCHMENT
The main soil types in the catchment are Haplusteps (Figure 2). 50 percent of the catchment area is Udic Haplusteps, 40 percent Lithic Haplusteps, and 8
Soil type and depth
Fluventic Haplusteps-moderately deep
Lithic Haplusteps-shallow
Udic Haplusteps-moderately deep
Udic Haplusteps-Very deep
Rock0 2 4 6 8 10 km
figure 2 SOIL TYPE AND DEPTH IN THE SUKHI CATCHMENT
percent Fluventic Haplusteps, while the rest consists of rocky areas. In terms of soil depth, 40 percent of the catchment has shallow soil (25-50 cm), 42 percent
Gujarat
District Boundaries
Upper Orsang Catchment
Sukhi Catchment
Sukhi Reservoir
Drainage Network
Weather Stations
Towns
Study VillagesNarmada BasinUpper Orsang Catchmen
0 2 4 6 8 10 km

Catchment Assessment and Planning for Watershed ManageMent: Volume II - Annexes80
figure 3 SLOPE IN THE SUKHI CATCHMENT
figure 4 ANNUAL RAINFALL
moderately deep soil (75-100 cm), and 15 percent very deep soils (150+ cm).
Elevation ranges from 82 to 460 meters. The highest areas are located in the center, south-west and north-west of the catchment. Large parts of the catchment have steep topography (Figure 3). 20 percent of the catchment area has slopes of greater than 10% and 25 percent of the area has slopes between 5 and 10%.
Average annual rainfall for the study period (1999-2013) was 1062 mm with a standard deviation of 386. Nearly all the rainfall falls during the monsoon during the months of June, July, August and September. The
majority rainfall occurs on days with more than 25 mm of rain (Figure 4). On average 62% of rain occurs on days with rainfall of more than 25 mm while only 14% of rainfall occurs on days with between 0.1 and 10 mm of rain. This has large consequences for runoff, erosion and the effectiveness of RWH structures.
village survey: Methodology and results
To understand in more detail the status and impacts of watershed development at a local level, a survey was undertaken for five villages in the Sukhi catchment that
2000
1500
1000
500
1999
Annual rainfall classified by daily amounts
2000
0-10 mm 10-25 mm 25+ mm Average
2001 2002 2003 2004 2005 2006 2007 2008 2009 2010 2011 20120
slope (%)
0-1.5
1.5-5
5-10
10+0 2 4 6 8 10 km

ANNEX 8: Technical Note on SWAT Modeling 81
are undergoing treatment under the IWMP programme. In total around 50 villages in the catchment were selected by IWMP for treatment, between 2009 and 2013, all located within Chhota Udaipur district (Figure 1). The five villages– Ghata, Kundal, Dungarbhint, Dholisimel and Kevdi – are situated towards the center of the Sukhi catchment and are contiguous (Table 1). Box 1 displays a range of information for each village. The villages are characterized by large
elevation ranges and steep topography. All five lie on the boundary of the wildlife reserve, and can be divided into flatter areas where agriculture is the dominate land use and steeper areas that are mainly covered by forest and the wildlife reserve.
Figure 5 shows the proportion of each village covered by a selection of different land uses, for the years 04/05,
figure 5 BAR CHART SHOWING CHANGE IN SURVEY VILLAGE LAND USE OVER TIME
table 1 STUDY VILLAGE INFORMATION
ghata kundal dungarbhint dholisimel kevdi
area (km2) 5.33 10.52 5.17 3.73 12.87
Population (2010) 390 1723 1326 956 1136
Minimum elevation (meters) 90 84 91 104 114
Maximum elevation (meters) 321 279 202 275 292
Percentage of village area with slope between 0 - 5° 34.6 55.1 61.7 49.0 50.4
Percentage of village area with slope between 5 - 10° 25.1 25.0 21.2 30.9 26.0
Percentage of village area with slope greater than 10° 40.3 19.9 17.1 19.9 23.6
Ghata Kundal Dungarbhint Dholisimel Kevadi
Double Crop50
40
30
20
10
0
50
40
30
20
10
0
50
40
30
20
10
0
04/05
08/09
12/13
Perc
enta
ge o
f vill
age
area
Kharif only Forest Degarded forest

Catchment Assessment and Planning for Watershed ManageMent: Volume II - Annexes82
08/09, and 12/13. This land use information was extracted from 250k LULC GIS datasets acquired from NRSC. Forest and degraded forest are the dominant land cover in all the village. Kundal has the highest proportion of forest, at over 40 percent of the village arae, while in Dungarbhint the area of degraded forest is larger than the area of forest. The areas of both forest and degraded forest stay relatively stable through the study period. In 04/05 the majority of agricultural land is ‘Kharif only’ for all the village apart from Ghata, where the areas of double crop and ‘Kharif only’ agriculture are relatively similar. For 08/09 and 12/13 all the villages see a large shift from ‘Kharif only’ to double crop agriculture. This shift is most evident for the two village, Ghata and Kundal, closest to the reservoir, where nearly all the agricultural land is double cropped in 08/09. For Dholisimel and Kevdi, further upstream, the proportion of agricultural land that is ‘Kharif only’ is still relatively large in 08/09.
The main part of the village survey focused on recording the location of all RWHs and wells in the five villages. For each one a range of attributes were collected including type, date of construction, condition, funding
source, and cost. Figure 6 shows the type and status of all the wells located in the five villages. In total there are 402 wells of which 70 percent are dug wells and 30 percent borewells. This works out to a well density of roughly 10 per km2 for the village areas, however the wells are heavily concentrated along the drainage channels and very few located in the forested areas. The highest concentrations are in the villages of Dholisimel and Dungarbhint. 54 percent of the wells have year round water availability and 41 percent have seasonal availability. Areas closest to the Sukhi reservoir have the highest proportion of wells with year round availability, a probable reason why the proportion of agriculture that is double cropped is higher in that area than further upstream.
Figure 7 shows the number of wells in the five study village in 4 different years and illustrates the increase over time. In 1990 there were 77 wells, in 2000 178 wells, in 2007 265 wells and in 2014 402 wells. The more than doubling of wells between 2000 and 2014 is certainly related to the increases seen in the area of double crop agriculture.
figure 6 MAP SHOWING WELL TYPE AND STATUS MAP FOR THE SURVEY VILLAGES
Wells-Type and satatus Forest
Village areas
Dug well-year round supply
Dug well-seasonal supply
Dug well-dry
Dug well-unknown status
Borewell-year round supply
Borewell-seasonal supply
Borewell-dry
Borewell-unknown status

ANNEX 8: Technical Note on SWAT Modeling 83
Figure 8 shows the distribution of the different types of RWH structures across the five villages and the whether they were funded by IWMP. The density of structures is similar in all the villages apart from Dungarbhint where, only a few structures have be constructed by IWMP. Many of the structures are located along, or close to, the edge of the forest. For example, in Ghata nearly all the streams and gullies that flow from the forest have been blocked by check walls (Figure 9.) or gully plugs (Figure
10). No structures have been built within the forest itself due to a lack of permission from the Forest Department. In total, the survey mapped 251 RWH structures in the five villages, of which (only) 77 were funded IWMP. Only 9 check dams, from a total of 72, were funded by IWMP, as the most optimal locations had already been used by the time the project started in 2009. Many of the larger check dam were funded by the state Irrigation Department.
figure 7 MAP SHOWING INCREASE IN WELLS OVER TIME
figure 8 MAP SHOWING LOCATION AND FUNDING PROGRAMME OF RWH STRUCTURES
RWH structures-type and funding Forest
Village areas
Check Dam IWMP
Check Dam (Other Project)
Check Dam (IWMP)
Check Wall (Other Project)
Contor Bund (IWMP)
Contour Bund (Other Project)
Gully Plug (IWMP)
Farm Pond (Other Project)
2014200720001990
Wells

Catchment Assessment and Planning for Watershed ManageMent: Volume II - Annexes84
The majority of RWH structures funded by IWMP in the five villages were built in 2012 and 2013. Prior to this the number of structures built on an annual basis was relatively low in comparison. However the annual average number of structures built from 2007 to 2011 was 10.2 compared to an average of 5.3 between 2001 and 2006. This increase in the number of structures being built is
clearly related to the parallel increases seen in double cropped area and the number of wells, and indicates that watershed development was occurring in the area prior to significant investment by IWMP.
However Figure 9 probably omits some structures that were built earlier in the period but subsequently
table 2 NUMBER OF BUILT OF DIFFERENT RWH STRUCTURES
figure 9 CHECK WALL IN GHATA VILLAGE figure 10 GULLY PLUG IN GHATA VILLAGE
type of structure total number iWMP other projectsCheck Dam 72 9 63Check wall 72 40 32Contour bund 71 11 60Gully plug 17 17 0Farm pond 11 0 11Other 8 0 8total 251 77 174
figure 10 BAR CHART SHOWING THE NUMBER IF RWH STRUCTURES CONSTRUCTED IN EACH YEAR FROM 2000
Number of RWH structures constructed in each year
Unk
now
n
Befo
re 2
001
2001
2002
2003
2004
2005
2006
2007
2008
2009
2010
2011
2012
2013
2014
Other projects IWMP
80706050403020100

ANNEX 8: Technical Note on SWAT Modeling 85
completely destroyed by floods. In total 55 percent of the structures are in good condition, 23 percent are damaged but still working, and 22 percent are defunct (Figure 10). Kevdi village (at the top of the cascade of villages) has the highest proportion of damaged and destroyed structures. The local community identified high runoff from steep slopes during large rainfall events as the cause. The number of large rainfall events (Figure 4) and the steep topography of the villages (Table 1) support this conclusion.
Model Methodologythe sWat model
SWAT is a physically-based semi-distributed watershed model that operates on a daily time step. It was developed by the United States Department of Agriculture (USDA) for assessing the impact of management and climate on water supplies, sediment, and biomass and nutrient yields. SWAT divides a
watershed into sub watersheds which are further subdivided into Hydrological Response Units (HRUs), which are areas of homogenous land use, soil type and slope. HRUs represent a percentage of the sub watershed area but are not spatially defined within the sub-watershed in which they are located. The primary datasets needed for the delineation of sub watersheds and the creation of HRUs are a Digital Elevation Model (DEM), land use data, and soil type data.
SWAT is driven by a water balance equation and most hydrological processes, including surface runoff, lateral subsurface flow, ET, infiltration, percolation, and sediment loss, are simulated at the HRU level. SWAT gives the option of using either the Soil Conservation Service Curve Number (SCS-CN) method or the Green-Ampt equation for calculating runoff. Runoff for all the HRUs within a sub watershed is summed and then routed through the stream network. For routing flow SWAT uses either the Muskingum method or the variable storage coefficient method, both of which are
figure 11 MAP SHOWING CONDITION OF RWH STRUCTURES
RWH structures - Condition
Good Condition
Damaged but still working
Defunct
Forest
Village Areas

Catchment Assessment and Planning for Watershed ManageMent: Volume II - Annexes86
approximations of the kinematic wave model. Stream velocity is used to calculate sediment transport in a river power equation that also considers channel length and the channel cross-section to determine whether erosion or deposition will occur at a given flow.
The primary climatic data inputs to SWAT are daily precipitation, minimum and maximum temperatures, solar radiation, relative humidity and average wind speed. Potential Evapotranspiration can be calculated either by the Penman-Monteith, Hargreaves or the Priestly-Taylor methods. Plant growth is calculated using the generic crop growth model from the EPIC (Erosion Productivity Impact Calculator) model, which first calculates growth under optimum conditions and then accounts for stress caused by water, temperature, nitrogen and phosphorous deficiencies. The Modified Universal Soil Loss Equation (MUSLE) is used by SWAT to calculate erosion and sediment yield. MUSLE uses runoff and slope length and steepness, which are derived from the input DEM, to calculate erosion.
SWAT allows representation of crop rotations, irrigation, fertilizer and pesticide application, tillage operations, dams, wetlands and ponds, all of which can be modified to represent different management scenarios. Model outputs are available for each sub watershed, HRU, reach and reservoir at daily, monthly and annual time-steps. Full details on the model are available in Arnold et al., 2012.
Model setup
The SWAT model was applied to the Sukhi catchment for the period 1999 – 2012. These years were chosen due to the availability of data to setup, calibrate and validate the model. The first two years of the period (1999-2000) were used as warm-up years to allow the different storages in the catchment to reach equilibrium. Rainfall data was available from three stations close to the catchment but no data was available from within it (Figure 2). Minimum and Maximum temperature, relative humidity, wind speed and solar radiation was available for one station which allowed the use of Penman-Monteith method to calculate ET. The method is considered to be more accurate than the
Hargreaves or Priestley-Taylor methods which only use temperature data in their calculations. The SCS-CN method was used to calculate runoff was chosen due to its widespread and successful use in India, rather than the alternative Green-Ampt method.
Sub watershed Delineation
Sub watersheds in SWAT are created using the input DEM. Their size is dependent on a user specified stream delineation threshold which represents the area of land that needs to drain into a certain point for a stream channel to be delineated. Each sub watershed is created containing a single stream segment and therefore the larger the delineation threshold the larger the size of the sub watersheds. Sub watershed outlets are placed at the confluences of stream segments.
deM: Carto DEM from NRSC with 30 meter resolution.
lulC: NRSC 250k LULC for the years 04/05, 08/09, and 12/13.
soil: NBSLUP data
Climate: Rainfall was acquired for 3 local weather stations and Minimum/maximum temperature, wind speed, solar radiation and relative humidity from one.
discharge: Acquired on a monthly basis from the Sukhi reservoir.
boX 1 MAIN DATASETS
SWAT sub watersheds for the Sukhi catchment were delineated so that they were of similar size to the government micro watersheds and, as far as possible, had the same boundaries. Through trial and error a channel initiation threshold of 4 km2 was found to be best for achieving this, although in many places there were still large differences. This is probably due to differences in the methods and datasets used to delineate the watersheds. The delineation resulted in the creation of 66 sub-watersheds with an average size of 5.95 km2 (Figure 12).
Creation of Hydrological Response Units
HRUs are created for each sub watershed and consist of unique combinations of land use, soil type and slope. Slope classes of 0-10% and 10+% were specified to delineate relatively flat and steep and steep areas of the

ANNEX 8: Technical Note on SWAT Modeling 87
catchment. Three 250 k resolution land use datasets were acquired from NRSC showing land use in that catchment for the years 04/05, 08/09 and 12/13. The 04/05 datasets was use as the primary land use input as this was closest to the start of the modeling period in 1999. The 08/09 was used to implement land use change during the model run which is described in a latter section. The land use classes in the NRSC datasets were reclassified to match SWAT land use classes and the double crop class split into rice, maize and cotton crops to allow different crop rotations to be specified (see next section). Soil data were acquired from the National Bureau of Soil Survey and Land Use Planning (NBSSLUP). The spatial data classes were matched with attributes for similar soil types in the NBSSLUP soil handbook for Gujarat. These attributes were used to create an Access database table which was then added to the SWAT project database.
A minimum threshold percentage can be defined during HRU creation for land use, soil type and slope classes. Any class that fall below the threshold is excluded from the calculations to created HRUs, with its area being divided proportionally among the remaining classes.
Specifying thresholds reduces the number of HRUs and therefore the running time of the model. A 20% threshold was applied for soil and a 20% threshold for slope, however none was applied to land use as this inhibited the implementation of land use change in the model. This is because HRUs can only be created during the model setup, and therefore if any land use classes were removed from a sub watershed there was no way of adding them at a later point, if they are needed to represent land use change. For example many sub watersheds had only a small area of double crop in the 04/05 land use dataset which even a threshold of 1% would have removed. The 08/09 dataset then shows a large increase in double crop area that can only be represented in a sub watershed if double cropped HRUs already exist. Therefore no threshold was specified so that all double cropped HRUs were retained. In total 1361 HRUs were created.
Crop rotations
Double crop, Kharif only and Rabi only classes in the NRSC LULC dataset were split into different crop rotations at the HRU creation stage. This was done
figure 12 SWAT SUB WATERSHEDS
0 2 4 6 8 10 km

Catchment Assessment and Planning for Watershed ManageMent: Volume II - Annexes88
proportionally based on the main crops grown in the catchment for each land use class. In this way the model represented the agriculture of the catchment reasonably well but without the undue complexity of trying to include all the crops grown in the catchment. The area of each crop rotation was based on the discussions with farmers in the catchment. For the double cropped LULC class 60% of the area was set to grow rice in the Kharif seasons followed by maize in the Rabi season, 39% to grow maize in both the Kharif and Rabi seasons, and 1% to grow a single crop of cotton planted at the beginning of the Kharif season. Farmers indicated that from 2007 onwards the area under cotton increased rapidly. Therefore the area under cotton was increased to 10% of the double cropped area in 2007 with proportional decreases in the areas of the other crop rotations. The Kharif only land use class was set to grow a single crop of maize in the Kharif season and the Rabi only land use class a single crop of maize in the Rabi season. The sowing and harvesting dates were set based on discussion with local farmers. Figure 12 summarises the crop rotations.
The auto-irrigation function in SWAT was used to apply irrigation to the crops. This function applied when the water stress of the crops, as calculated by the model, reaches a specified threshold. This threshold can range from 0 to 1, where 1 represents no water stress and 0 represent a state where there is no plant growth due to water stress. The threshold was set to 0.95 for double cropped areas and 0.5 for ‘Kharif only’ and ‘Rabi only’ areas. The maximum amount of water applied during
each irrigation application was set to 100 mm for the double cropped areas and 50 mm for the Kharif only and Rabi only areas. The difference in threshold values and irrigation amounts was specified on the assumption that double crop areas would be in locations with greater access to water and hence be more heavily irrigated. It is also likely that a large part of the area classified as Kharif only is purely rain-fed with no irrigation. The low threshold of 0.5 was set to reflect the fact that some irrigation was probably occurring in Kharif only and Rabi only areas but that it was likely limited. The source of irrigation was specified as the shallow aquifer for all the sub watersheds except for those immediately downstream of Jamli and Jogpura reservoirs for which the two reservoirs were specified as the source.
The auto-fertilisation function was used for all the crops. This applies fertilizer based on plant nitrogen deficiency as calculated by the model. The function requires a threshold value ranging from 0 to 1, where 0 indicates no crop growth due to nitrogen deficiency and 1 indicate no reduction in growth due to nitrogen deficiency. The threshold was set at 0.9 for all crops in all sub watersheds as there was no information available on how fertilizer use varied across the catchment or between the different crop types. The HRUs with rice crops were designated as potholes in SWAT. These are local depressions where rainfall and irrigation does not flow directly to the stream channel but is stored in the HRU on the soil surface. Water is impounded in these potholes at the beginning of the Kharif season prior to the planting of the rice crop.
figure 13 CROP ROTATIONS USED IN THE SWAT MODEL
Landuse
MainCrop
DoubleCrop
KharifCrop
Rice/Maize
Maize
Cotton
60
39
Maize 100
Rabionly
Maize Rice Cotton
Maize 100
1
Percentageof land use Jan Feb Mar Apr JunMay Jul Aug Sep Oct Nov Dec

ANNEX 8: Technical Note on SWAT Modeling 89
Land use change
Three land use datasets, for the years 04/05, 08/09, and 12/13 were acquired from NRSC. The 04/05 dataset was used as the primary model input as it was the most representative of the first part of the modeling period. To represent the changes in land use between the 04/05 dataset and the 08/09 dataset the land use update function in SWAT was used. This function updates, for each HRU, the HRU_FR parameter, the fraction of the sub watershed that each HRU covers. The function does not allow the creation of new HRUs so a land use class must already be present in the sub watershed if it is to be changed. The land use changes were analysed using GIS and are shown in Figure 13. The main trend revealed was a large shift from Kharif only to double crop. The double cropped area increased from 9% of the catchment area in 04/05 to 33.6% of the catchment area in 08/09 before subsequently
falling to 29.8% in 12/13. The other significant change is the increase in scrubland from 6.7% of the catchment area to 12.2% of the catchment area. This increase is accounted for both by the reduction in the ‘area sown only once’ (i.e., during Kharif), and by a reduction in the area of grassland/fallow land. The areas under other land use classes such as deciduous forest and degraded forest stay relatively stable while the changes in the areas of the water (bodies) and Rabi only land use classes seems to depend on the level of annual rainfall.
To explore further the land use change between 04/05 and 08/09 the percentage change of each land use class within each SWAT sub-watershed was calculated using GIS. The results, shown in Figure 6, reveal that the shift from Kharif only to double crop occurred across the whole catchment. Reduction in the area of grassland occurred mainly in the center and west of the catchment while increases in the area of scrubland occurred mainly
figure 14 SUKHI LAND USE CHANGE
0.0 5.0 10.0 15.0 20.0 25.0Percentage of catchment
DoubleCrop
Kharif only
Rabi only
Fallow/Grassland
DegradedForest
Scrubland
DeciduousForest
Water
Wasteland0.40.50.2
5.06.7
6.225.825.525.5
12.112.2
6.714.214.514.6
2.51.3
3.93.3
0.62.2
6.95.2
31.729.8
9.033.6
30.0 35.0 40.0
2012-13 2008-09 2004-05
2012-13
2008-09
2004-05
Double CropKharif OnlyRabi OnlyFallow/Grassland
Degraded forestScrublandDeciduous forestWater bodiesScrubland
0 2 4 6 8 10 km

Catchment Assessment and Planning for Watershed ManageMent: Volume II - Annexes90
in the center and east of the catchment. Rather than covert Kharif only to double crop by the same proportion for the whole catchment, the shift was analysed for each sub watershed individually. This analysis was used to calculate the percentage of Kharif only that was converted to double crop for each sub watershed in the model (Figure 15). In total the land use change in the model see an increase in the double crop area to 31% of the catchment in 2007. This figure is around halfway between the double crop areas for the 08/09 and 12/13 datasets. This difference appears to be partly due to the fact that the datasets represent wet and dry years respectively. Therefore 31% provides a relatively good estimate of the average double crop area for the 2007-12 period. The land use change implementation also reflects, to some extent, the spatial variations seen in the land use data.
Reservoir and WHS representation
In SWAT configuration, it is possible to add a reservoir, pond and wetland to each sub watershed. Conceptually, the reservoir is located on the stream channel at the outlet of the sub watershed. All runoff generated from
the HRUs within a sub watershed is routed first through the stream network, along with water and sediment from any upstream sub watersheds, before entering the reservoir. Ponds differ from reservoirs in the sense that they are not connected to the stream network, collecting water only from the HRUs within the sub watershed in which they are located. The fraction of the sub watershed draining into the pond can be specified by the user.
Reservoir outflow can be modeled in a number of ways; uncontrolled outflow allows any water in the reservoir above the outflow level to flow immediately downstream, measured outflow uses observed reservoir outflow data to specify the amount of water released downstream, and simulated outflow uses a number of input parameters to calculate how much to released downstream. The Sukhi reservoir was set to measure outflows using observed monthly reservoir mass balance data obtained from the sub-division of the State Water Resources Department (earlier the Irrigation Department), which is responsible for reservoir operations. Jamli and Jogpura reservoirs were set to simulated outflows as measured outflow data was not available. The NDTARG parameter, which is the number of days needed for reservoir to fall to
figure 15 SUB WATERSHED LAND USE CHANGE
Percentage change of land use classes in sWAT subwatershed between 04/05 and 08/09Deciduous woodland Grassland
Degraded woodland
Scrubland
-50 or greater -50 to -10 -10 to 0 no change 0 to 10 10 to 50 50 to 100 100 or greater
Water Rabi only
Wasteland Kharif only
Double crop

ANNEX 8: Technical Note on SWAT Modeling 91
primary outflow level when the water level exceeds it, was included in calibration to improve the simulation of outflow from the reservoirs.
RWHSs are represented in the model by adding a reservoir to each sub watershed with the summed dimensions of all the RWH structures thought to be located within the sub watershed. This is a methodology that has be applied by a number of studies to represent RWH structures within SWAT (e.g. Glendenning & Vervoort, 2011; Garg et al., 2013). These reservoirs were modeled using uncontrolled outflows as it was assumed that any water exceeding their capacity would flow immediately downstream. Ponds were also added to the sub watershed to represent those structures, such as infiltration pits and farm ponds, that are not connected to the stream network. Reservoirs were added to all sub watersheds apart from those that consisted of more than 90% deciduous forest as these watersheds were located largely in Ratanmahal wildlife sanctuary and contained only a few small structures. 90% of the estimated capacity of RWHs was designated as a reservoir with remaining 10% designated as a ponds in each sub watershed. This split was chosen due to the difference in the size of the structures located on the stream channel, such as check dams, and those that are
not, such as infiltration pits. 10% of the runoff in each sub watershed was chosen arbitrarily to flow into the ponds.
No comprehensive record of the number and location of all the RWH structures in the Sukhi catchment was available. Therefore the total capacity of structures in each sub watershed was estimated based on analysis of data collected in the five study village and through a review of the available literature (Glendenning & Vervoort, 2010; Garg et al., 2013; Garg et al., 2013). Survey data on the year of construction of the structures shows that their number increased significantly during the modeling period. However, because reservoir size cannot be changed in SWAT during the model run, representing the trend was difficult. As an alternative, the years that reservoirs are established in different sub watersheds, during the modeling period, were varied. Years were calculated based of the area under double cropping that each sub watershed contained. The assumption was that those sub watersheds with a large double crop area in 04/05 would have a larger structure capacity due to irrigation demand and therefore reservoirs were established in these sub watersheds first. The years of that reservoirs are established in each sub watershed are indicated in Figure 16. This pattern captures, as far
figure 16 LAND USE CHANGE FROM KHARIf ONLY TO DOUBLE CROP FOR EACH SUB WATERSHED
Percentage of Kharif only converted to double cropNo Change 40 60 80 95
0 2 4 6 8 10 km

Catchment Assessment and Planning for Watershed ManageMent: Volume II - Annexes92
as possible, the increase in RWH structure capacity through the modeling period.
Garg et al (2012) calculated RWH structure capacity in the Kothapally watershed, which had undergone relatively intensive watershed development, at 40 m3/ha. For a small watershed in Madhya Pradesh, where watershed development had been implemented, Singh et al (2014) also estimated the storage capacity at 40 m3/ha. In comparison to these examples, RWH in the Sukhi catchment during the model period would appear to be less intensive, especially prior to the large increase in double crop area. Figure 17 shows that many of the structures in the 5 study villages were built between 2012 and 2014, at the end or after the modeling period. The 5 study villages plus 16 other villages in the Sukhi catchment are 2009-10 IWMP project villages. All the other IWMP project villages (~45) in the catchment were part of the 10/11, 11/12 or 12/13 project years which suggests that IWMP structures in these villages have only recently been built or are still being planned. For the five study villages the structures recorded as being built early in the modeling period are mainly large structures, such as check dams, built by other projects and organizations including the Irrigation Department. These are generally located on higher order stream channels limiting the potential locations for new structures. Consequently
many of the structures built towards the end of the modeling period and afterwards, by IWMP and others, are smaller structures, such as check walls and gully plugs, built on lower order streams.
Discussions in the study villages revealed that many structures, especially smaller ones, are frequently damaged and destroyed during monsoon floods. It is therefore likely that the structures recorded in the village survey as having been constructed in the early part of the modeling period are only the ones that were strong and/or large enough to have survived multiple monsoons. As a result it is probable that more structures were present in the villages during the modeling period than shown by the survey data.
The five study villages can be seen as representative of most of the Sukhi catchment, which has similar topography and mix of land uses. The one area that is clearly different is the east of the catchment which is flatter and has a higher concentration of agricultural land. As a result it probably also had a higher concentration of RWH that the rest of the catchment during the modeling period.
Taking all this into account a figure of 15 m3/ha was used in calculating the capacity of reservoirs. This gives the
figure 17 YEAR OF RESERVOIR IMPLEMENTATION
Year of implementation for reservoirs/WHs
No Change Only in scenarios 1999 2004 2007
0 2 4 6 8 10 km
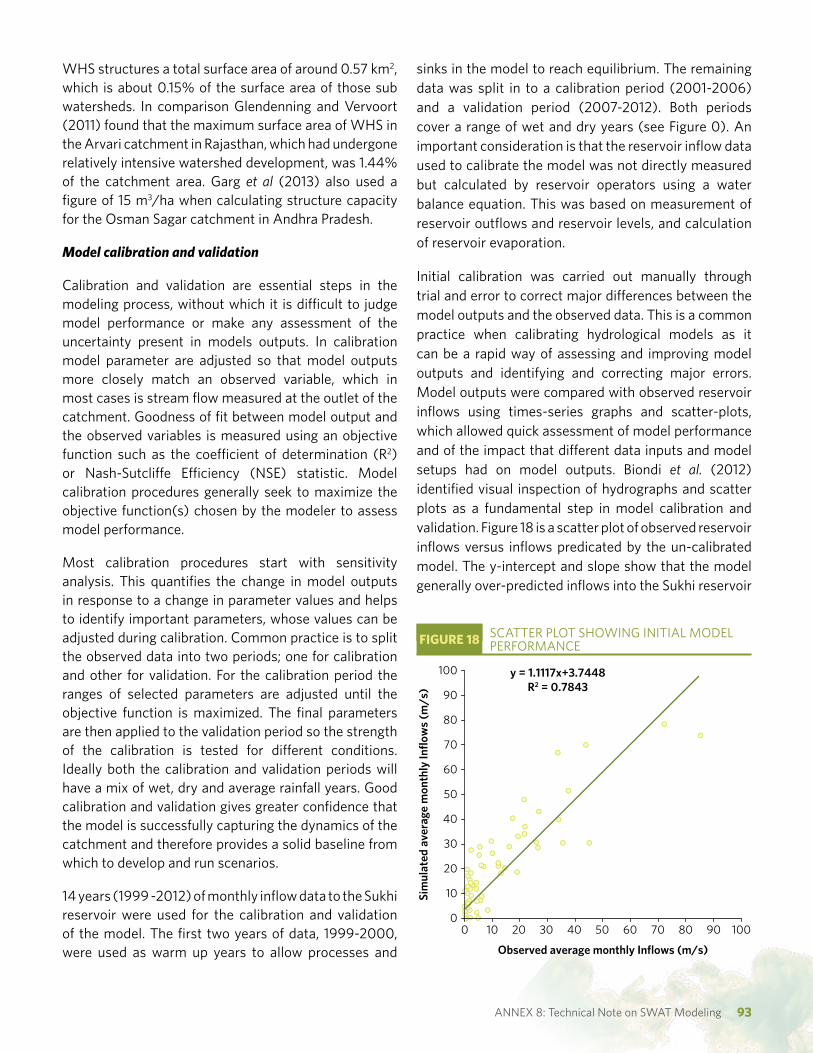
ANNEX 8: Technical Note on SWAT Modeling 93
WHS structures a total surface area of around 0.57 km2, which is about 0.15% of the surface area of those sub watersheds. In comparison Glendenning and Vervoort (2011) found that the maximum surface area of WHS in the Arvari catchment in Rajasthan, which had undergone relatively intensive watershed development, was 1.44% of the catchment area. Garg et al (2013) also used a figure of 15 m3/ha when calculating structure capacity for the Osman Sagar catchment in Andhra Pradesh.
Model calibration and validation
Calibration and validation are essential steps in the modeling process, without which it is difficult to judge model performance or make any assessment of the uncertainty present in models outputs. In calibration model parameter are adjusted so that model outputs more closely match an observed variable, which in most cases is stream flow measured at the outlet of the catchment. Goodness of fit between model output and the observed variables is measured using an objective function such as the coefficient of determination (R2) or Nash-Sutcliffe Efficiency (NSE) statistic. Model calibration procedures generally seek to maximize the objective function(s) chosen by the modeler to assess model performance.
Most calibration procedures start with sensitivity analysis. This quantifies the change in model outputs in response to a change in parameter values and helps to identify important parameters, whose values can be adjusted during calibration. Common practice is to split the observed data into two periods; one for calibration and other for validation. For the calibration period the ranges of selected parameters are adjusted until the objective function is maximized. The final parameters are then applied to the validation period so the strength of the calibration is tested for different conditions. Ideally both the calibration and validation periods will have a mix of wet, dry and average rainfall years. Good calibration and validation gives greater confidence that the model is successfully capturing the dynamics of the catchment and therefore provides a solid baseline from which to develop and run scenarios.
14 years (1999 -2012) of monthly inflow data to the Sukhi reservoir were used for the calibration and validation of the model. The first two years of data, 1999-2000, were used as warm up years to allow processes and
sinks in the model to reach equilibrium. The remaining data was split in to a calibration period (2001-2006) and a validation period (2007-2012). Both periods cover a range of wet and dry years (see Figure 0). An important consideration is that the reservoir inflow data used to calibrate the model was not directly measured but calculated by reservoir operators using a water balance equation. This was based on measurement of reservoir outflows and reservoir levels, and calculation of reservoir evaporation.
Initial calibration was carried out manually through trial and error to correct major differences between the model outputs and the observed data. This is a common practice when calibrating hydrological models as it can be a rapid way of assessing and improving model outputs and identifying and correcting major errors. Model outputs were compared with observed reservoir inflows using times-series graphs and scatter-plots, which allowed quick assessment of model performance and of the impact that different data inputs and model setups had on model outputs. Biondi et al. (2012) identified visual inspection of hydrographs and scatter plots as a fundamental step in model calibration and validation. Figure 18 is a scatter plot of observed reservoir inflows versus inflows predicated by the un-calibrated model. The y-intercept and slope show that the model generally over-predicted inflows into the Sukhi reservoir
figure 18 SCATTER PLOT SHOWING INITIAL MODEL PERFORMANCE
100
90
80
70
y = 1.1117x+3.7448R2 = 0.7843
Observed average monthly Inflows (m/s)
Sim
ulat
ed a
vera
ge m
onth
ly In
flow
s (m
/s)
60
50
40
30
20
10
00 10 20 30 40 50 60 70 80 90 100

Catchment Assessment and Planning for Watershed ManageMent: Volume II - Annexes94
which enabled a number of parameters to be manually adjusted to reduce runoff.
Auto-calibration and validation was carried out using SWAT-CUP, which is a freely available interface for SWAT that contains a number of different procedures (http://www.neprashtechnology.ca/Default.aspx). The SUFI-2 (Sequential Uncertainty Fitting – Version 2) procedure was chosen due to its wider use and effectiveness in calibrating SWAT and its ability to provide good estimates of the uncertainty of model outputs. It also requires relatively few model runs in comparison to other techniques (Yang et al., 2008), an important characteristic given the complexity of the model.
The first step in calibration was to identify sensitive parameters, which was done both by reviewing the model literature to identify parameters commonly calibrated to reduce runoff and within SWAT-CUP by running global sensitivity analysis on a large number of parameters.
In SUFI-2 there is the option for using a number of different objective functions including R2, NSE, RSR and PBIAS. Choice of objective function is important as different choices lead to different parameter sets being found in calibration. This is a result on the non-uniqueness of parameter sets and the possibly for many, often very different, combinations of parameters to lead to equally good model results. Non-uniqueness, also called equifinality, has to be considered during the calibration of any hydrological model and also when interpreting model outputs. NSE was chosen as it is one of the most widely used objective functions for the calibration of hydrological models and is considered to give a good fit for the entire hydrograph.
For calibration simulations SUFI-2 selects parameter values, from within user specified ranges, using Latin Hypercube sampling. Discarding the worst 5% of the simulations SUFI-2 calculates the 95% prediction uncertainty (95PPU) which is the cumulative distribution of the remaining simulations. The percentage of the observed data bracketed by the 95PPU is quantified by the p-factor, which ranges from 0 to 1. A measure called the r-factor is also calculated which quantifies the average width of the 95PPU. This can range from 0 to infinity where 0 means that the model output exactly matches the observed data. Ideally for calibration the
p-factor will be close to 1 and the r-factor close to 0. In most cases there is a trade of between the two measures as increasing parameter ranges will lead to a higher p-factor but will also increase the r-factor. Both the degree to which the model cannot account for the observed data by bracketing it with the 95PPU and the width of the 95PPU itself, quantified by the r-factor, helps to quantify uncertainty and model error and the strength of the calibration. In this way, SUFI-2 represents uncertainty from all sources through parameter uncertainty.
After each iteration (calibration run) SUFI-2 suggests new, smaller ranges for the parameters being calibrated, centered on the best simulation from the previous run (i.e. the simulation with the best objective function). To start, a 500 simulation iteration was run using relatively wide ranges for the parameters identified by the initial sensitivity analysis. Using the new smaller parameter ranges suggested by SUFI-2 further iterations of 300 and 200 simulations were carried out using the new parameter ranges suggested by SUFI-2. Table 3 lists the parameter that were calibrated, their ranges, and the value for the best simulation. The parameter ranges used for the last calibration iteration were then applied to the validation period for an identical number of simulations. The final result for calibration and validation can be seen in Figure 11. The NSE and R2 values indicate very good performance for both the calibration and validation period (Moriasi et al., 2007). The lower values seen are seen for validation in the majority of cases due to model divergence.
The p-factors for both calibration and the validation periods are low indicating that a significant part of the observed data is not bracketed by the 95PPU. This suggests a relatively high amount of uncertainty and error in the model outputs for which there are two obvious sources. The first is the rainfall data which is a common source of error in many hydrological models due to the difficulty of extrapolating point measures at rain gauges to areal estimates of rainfall. In this case the errors may be even higher as the rainfall data comes from gauging sites outside of the catchment and at lower elevations. The second potential major source of error is in the observed reservoir inflow data used for calibration. This data was not measure directly but calculated using a water balance equation and is therefore likely to be less accurate than discharge data

ANNEX 8: Technical Note on SWAT Modeling 95
recorded at a control structure. Outflows from the Sukhi reservoir occur not just over the spillway of the dam, but also through two irrigation canals, which makes the accurate measurement of total outflows more difficult. Calculation of evaporation from the reservoir could also introduce errors into the water balance equation especially because of the need to account for large and rapid changes in the surface area of the reservoir. Finally, neither the seepage from the reservoir nor pumping of water from the reservoir by the surrounding villages was accounted for in the water balance equation. The r-factor is also relatively low which indicates that the models is not that sensitive to the parameter changes within realistic ranges and that rainfall is the main driver of reservoir inflows.
Overall the calibration and validation results indicate that the model captures relatively well the dynamics of the catchment as indicated both by excellent NSE and R2 values for the calibration and validation periods
and visual comparison of the observed and simulated reservoir inflows. The uncertainty shown by the relatively low p-factor can be attributed with some certainty to errors in the rainfall and reservoir inflow data. Lack of calibration using other variables limits the utility of the model to look in detail at other important processes such as erosion and sedimentation. The model predicts high rates of erosion and of reservoir sedimentation in the catchment but without calibration of the model using observed sediment data, the uncertainty of these outputs is too high to warrant more in-depth investigation. An additional improvement would be to calibrate the model at other locations in the catchment to account for likely spatial variation in parameter values but this was not possible due to the lack of relevant data. It is also worth noting that the model was calibrated only using monthly data. If daily data had been available it would have allowed a more detailed examination of model performance and perhaps more effective calibration.
table 3 SWAT CALIBRATION PARAMETERS
sWat name Parameter description Calibration change* final range best simulation
CN2 The initial SCS runoff curve number for soil moisture condition II set for each HRU.
relative -0.2 – 0.2 0.051
GWQMN Threshold depth of water in the shallow aquifer required for return flow to occur.
value 500 – 3000 2118
ESCO Soil evaporation compensation factor value 0.78 – 0.94 0.81
GW_REVAP Groundwater ‘revap’ coefficient value 0.16 – 0.2 0.19
ALPHA_BF Baseflow alpha factor value 0.4 – 0.7 0.59
GW_DELAY Groundwater delay time value 20 – 350 25
SOL_AWC Available water capacity of the soil relative -0.1 – 0.2 0.06
SOL_K Saturated hydraulic conductivity of the soil relative -0.2 – 0.1 -0.17
SOL_BD Moist bulk density of the soil relative -0.15 – 0.15 0.003
REVAPMN Threshold depth of water required in the shallow aquifer for ‘revap’ or percolation to the deep aquifer to occur
value 0 – 350 41
RCHRG_DP Deep aquifer percolation fraction value 0 – 0.2 0.04
NDTARGR Number of days to reach target storage from current reservoir storage
value 0 – 10 3
CH_N2 Manning’s “n” value for the main channel relative -0.04 – 0.01 -0.01
CH_K2 Effective hydraulic conductivity of the main channel alluvium
value 0 - 1 0.36
SURLAG Surface runoff lag coefficient value 1 – 10 6.74* value means that the existing parameter is replace by the calibrated parameter whereas relative means that the existing parameters
is multiplied by the calibrated value plus one.

Catchment Assessment and Planning for Watershed ManageMent: Volume II - Annexes96
Scenario development
Development of model scenarios allows users to look at the potential impacts that management decisions and other factors like changes in climatic variables may have on the hydrology and water resources of the study area. In this way it is possible to explore the trade-offs involved in decision-making, for example, at what level of watershed developed does the reduction in downstream flows become too significant that it starts affecting downstream benefits such as irrigation and drinking water supplies? Scenario development is a stage at which all stakeholders can provide their input based on their vision of the future of the watershed. Scenarios should provide as far as possible a realistic vision of the future conditions of the study area and can include a range of factors such as proposed water and land management interventions, environmental change, and economic development. Normally two or three factors are chosen. These should be important, in that they are predicted to have relatively large impacts, but also have relative uncertainty, in that the potential impacts are not entirely predictable in either their effects or magnitude. A final useful characteristic
of scenarios is that their relative accuracy is often greater than that of the underlying model is compared to observed values. Therefore model scenarios can still provide useful outputs for watershed planning even if there is some uncertainty regarding baseline model performance (Kauffman et al., 2014).
The development of scenarios for the Sukhi catchment focused on two main factors; changes in the level of RWH in the catchment and changes in cropping intensity, in particular the expansion in area under double cropping. These two factors are likely to have a big impact on the catchment in the future given the investments being made in watershed development by IWMP and other programmes and the expansion in the double cropped area driven by population growth and the micro economic needs of the agriculturally dependent communities. Though the expected impact of increased RWH and expansion of double cropped area would be greater water use within the catchment, there is significant uncertainty on the magnitude of this increase and the impact on downstream flows. Consequently model scenarios can provide useful information for planning watershed development in the
figure 19 CALIBRATION AND VALIDATION RESULTS
R�=0.93 p-factor=0.46NS=0.93 r-factor=0.37
R�=0.80 p-factor=0.38NS=0.80 r-factor=0.47
2001 2002 2003 2004 2005 2006 2007 2008 2009 2010 2011 2012
95 PPU
Calibration Validation
Observed Best simulation
Ave
rage
mon
thly
rese
rvoi
r infl
ows
(M/s
)
100
90
80
70
60
50
40
30
20
10
0

ANNEX 8: Technical Note on SWAT Modeling 97
Sukhi catchment and allow consideration of the impacts it may have downstream.
Two main scenarios, summarized in Table 4, were developed to look at the impacts of land use change and watershed developed on the hydrology of the Sukhi catchment. Scenario 1 models the catchment in the absence of the watershed development and the intensification of agriculture that has occurred over the last two decades. In other words, the catchment as it was prior to the start of the modeling period, when the majority of the agricultural land was Kharif only and there were very few large RWH structures. Although it is difficult to envisage a return to the pre 1999 situation in the catchment, scenario 1 helps to illustrate the impact that agriculture and watershed development has already had on the hydrology of the catchment. Scenario 2 models the opposite situation and represents a significant intensification of agriculture and watershed development from current levels. This is the most plausible future for the catchment given the investment by IWMP and other programmes in watershed development and the increasing demand placed on agriculture to produce more food and improve local livelihoods.
Both scenarios 1 and 2 are disaggregated into 3 parts; parts (a) models the combined impacts of changes in watershed development and land use, while parts (b) and (c) model the impacts of changes in watershed development and land use change separately. It should be noted that the intensification of watershed development in scenarios 2a and 2b is represented not just by an increase in the sizes of the reservoirs that represent large RWH structures, but also by a reduction of the CN2, HRU_SLP, and SLSUBBSN parameters. The reduction of these parameters has been identified by other studies as an appropriate way of representing smaller and more localized soil and water conservation measures, such as bunds and terraces, in SWAT (ARabi et al., 2006; Mishra et al., 2007).
The best simulation from the calibration (Table 3) was used as the baseline and the scenarios evaluated for the period 2007 to 2012. This period was chosen because it follows the significant land use change seen in Figure 13 and incorporated into the model from 2007, and therefore provides a stable baseline from which to evaluate the impacts of the scenarios. If the whole modeling period had been used then land use change
table 4 DESCRIPTION OF MODEL SCENARIOS
scenarios descriptionscenario 1 a. no development This scenario models the catchment as if no watershed development or
increase or intensification of agriculture had occurred. This is represented by the removal of all reservoirs, apart from Sukhi, Jamli and Jogpura, and by using the 04/05 land use dataset for the entire modeling period.
b. no watershed development
Removal of all reservoirs apart from Sukhi, Jamli and Jogpura.
c. no land use change Use of 04/05 LULC for the entire modeling period.scenario 2 a. intensification This scenario represents the more likely future for the catchment that sees
and intensification of agriculture and watershed development. Represented by an increase in RWH structure capacity to 40 m3/ha and implementation of reservoirs in forested catchments. A reduction of CN2 (SCS runoff curve number) by 3 points, a 5% Reduction in HR_SLP (Average slope steepness for the HRU) and SLSUBBSN (average slope length) for all. Increase in double crop area from 30 to 40% of catchment area but no change in reservoir capacity.
b. intensification of Watershed development
Increase in RWH structure capacity to 40 m3/ha and implementation of reservoirs in forested catchments. A reduction of CN2 (SCS runoff curve number) by 3 points, a 5% Reduction in HR_SLP (Average slope steepness for the HRU) and SLSUBBSN (average slope length) for all.
c. intensification of agriculture
Increase in double crop area from 30% to 40% of catchment area but no change in reservoir capacity.

Catchment Assessment and Planning for Watershed ManageMent: Volume II - Annexes98
would have had to be considered when evaluating scenario outputs.
results and analysisbaseline
The annual amount of water lost as ET for the sub watersheds upstream of the Sukhi reservoir averaged 37.3% of rainfall for the 2001–2012 period, with a high of 89.6% in 2009, the driest year of the modeling period, and a low of 25.3 % in 2006, the wettest year. Inflows to the Sukhi reservoir averaged 40.2% of rainfall with a low of 19.3% in 2009 and a high of 50.3% in 2006. Groundwater recharge measurements are more difficult to extract from SWAT outputs. The parameter available as output at the sub watershed level that is most closely related to groundwater recharge is groundwater percolation, which is the total amount of water that leaves the bottom of the root zone during the time-step. Over long time periods percolation should equal groundwater recharge. However the amount includes water that moves back from the shallow aquifer to soil profile in periods of soil water deficit, as well as water extracted from the shallow aquifer for irrigation that subsequently re-percolates. Percolation for the modeling period averages 40.4% of annual rainfall and ranges from 26.6% in 2004 to 48.3% percent in 2011. Significant variation is seen in water balance components between wet, dry and normal years.
scenarios
The impacts of scenarios are evaluated for the years 2007 to 2012. The annual inflows to the Sukhi reservoir for the scenarios and the baseline are shown in Figure 19 and the percentage change in inflows for the scenarios, relative to the baseline, in Table 6. The overall impacts of the scenarios are as would be expected; scenarios 1a, 1b and 1c, result in increases in inflow into the Sukhi reservoir while scenarios 2a, 2b and 2c result in decreases.
Removal of reservoirs for scenario 1b results in a small increase in inflows while the decrease in double cropped area (relative to the baseline) for scenario 1c results in a comparatively much larger increase in inflows. The combined impact of the two factors in scenario 1a results in the largest increase in reservoir inflows. The intensification of watershed development in scenario 2b results in a large decrease in inflows while the increase in double cropped area for scenario 2c results in a comparatively smaller increase. The combined influence of the two factors for scenario 6 results in the largest decrease in inflows.
It is interesting that a decrease in double cropped area, with no change in the level of watershed development, in scenario 1c causes such a large increase in inflows, while an increase in double cropped area also with no change in the level of watershed development in scenario 2c, results in a comparatively smaller decrease
figure 20 ANNUAL INFLOWS INTO THE SUKHI RESERVOIR FOR THE SCENARIOS
rese
voir
inflo
ws
(mcu
m)
300
2007 2008 2009 2010 2011 2012
250
200
150
100
50
0
Baseline 1 a 1 b 1 c 2 a 2 b 2 c

ANNEX 8: Technical Note on SWAT Modeling 99
in inflows. This is partly due to the magnitude of land use change; for scenario 2, the double crop area is reduced from 30% of the catchment area to 9%, while for scenario 4 it is increased from 30% to 40%. Another potential factor is that an increase in the double cropped area without a parallel intensification of watershed development means that insufficient water is available to irrigate the entire double cropped area sufficiently.
The relative impacts of the scenarios are greatest in 2009, the driest year. Inflows increase by 24% for scenario 1a and decrease by 18.7% for scenario 2a. This indicates that the impact of watershed development on downstream flows is greatest in dry years.
Table 7 summarizes ET, groundwater percolation, groundwater recharge from RWH structures, and reservoir inflows for the baseline and scenarios as a percentage of rainfall for 2009, the driest year, 2011, the wettest year, and as an average for 2007-2012. Changes in the double cropped area have the largest impact on the amount of water lost as ET from the catchment with the impacts largest in 2009. In this year ET for Scenarios 2a and 2c, in which the double cropped area is increased to 40% of the catchment area, is close to 100 % of rainfall, around 10% more than for the baseline. This is because a large amount of water is removed from the shallow aquifer for irrigation and is subsequently lost as ET. The water stored in the shallow aquifer is nearly exhausted in 2009 so it
table 5 PERCENTAGE CHANGE IN INFLOWS TO THE SUKHI RESERVOIR FOR THE SCENARIOS COMPARED TO THE BASELINE
scenarios
1a 1b 1c 2a 2b 2c
2007 6.9 0.3 6.6 -6.3 -4.5 -1.8
2008 12.4 0.7 11.9 -9.7 -6.4 -2.7
2009 24.0 3.9 21.0 -16.9 -15.1 0.5
2010 13.0 0.7 12.4 -10.0 -8.3 -1.1
2011 7.3 0.2 7.1 -8.9 -5.0 -3.3
2012 8.5 0.5 8.1 -9.6 -5.4 -3.4
Average 9.5 0.5 9.0 -8.9 -5.9 -2.4
scenarios baseline1a 1b 1c 2a 2b 2c
Dry Year (2009)
ET 77.4 89.4 77.6 98.7 89.8 98.3 89.6Percolation 38.1 37.7 37.3 42.6 42.2 38.7 38.6RWH recharge 0.0 0.0 0.8 2.5 2.3 0.9 0.9Reservoir Inflows 23.9 20.0 23.3 16.0 16.4 19.4 19.3
Wet Year (2011)
ET 26.4 30.1 26.5 32.9 30.2 32.8 30.2Percolation 45.9 48.3 46.1 51.7 52.0 47.4 48.5RWH recharge 0.0 0.0 0.2 0.8 0.7 0.3 0.2Reservoir Inflows 48.4 45.2 48.3 41.1 42.9 43.7 45.1
Average (07-12)
ET 35.7 40.3 35.8 43.6 40.4 43.4 40.2Percolation 40.0 42.2 40.2 45.8 46.0 42.2 42.5RWH recharge 0.0 0.0 0.3 1.1 1.0 0.4 0.4Reservoir Inflows 43.8 40.2 43.6 36.4 37.6 39.0 40.0
table 6 WATER BALANCE COMPONENTS FOR THE SCENARIOS AND BASELINE AS A PERCENTAGE OF RAINFALL

Catchment Assessment and Planning for Watershed ManageMent: Volume II - Annexes100
would be interesting to see the impact of two or more consecutive low rainfall years. For scenarios 1a and 1c, in which the double cropped area is reduced to 9% of the catchment area, ET in 2009 is reduced to 77.4% of rainfall, more than 10% lower than the baseline figure. The impact of the scenarios on ET in 2011, the wettest year, is far less as a percentage of rainfall, although the absolute difference is similar.
Differences in groundwater percolation between the scenarios are mainly a result of recharge from RWH structures, which more than doubles from an average of 0.4% of rainfall for the baseline, to 1.1% for scenario 1a. This is in line with the increase in RWH structure capacity from 15 m3 ha to 40 m3 ha for scenario 1a and an expansion of structures into the mainly forested sub-watersheds. Recharge from RWH structures in 2009 is double the average recharge as a percentage of rainfall.
village level results and analysis
Data availability defined the scale at which the model could be set up, as inflow data for the Sukhi reservoir was the only reliable dataset that could be used for the calibration and validation of a model that covered IWMP’s work in the upper Orsang sub-basin. This situation, where the availability of data for calibration and validation requires the modeling of a catchment much larger than the area of interest, is likely to found for other areas where IWMP watersheds are located, as many are found in headwater areas, a long way upstream of any gauging point that could provide reliable data for calibration and validation.
One of the advantages of SWAT is that the sub watersheds can be delineation at a user-specified resolution which allows results to be analysed for local levels, even for large catchments. A trade-off is that models of large catchments with many sub-watersheds can substantially increase model runtime and make processing model outputs a time-consuming process. One solution, used by Notter et al., 2012, is to vary the resolution of sub-watersheds across the catchment so that areas of interest are defined in more detail.
The process of extracting model outputs for areas of interest from within a larger model is demonstrated here by analysing model outputs for the five survey villages. During model setup, the sub-watersheds were defined so that they were of similar size to the village areas used by IWMP for watershed development to allow model outputs to be more closely associated with each village. However it was not possible to match the boundaries exactly as neither the village boundaries nor the boundaries of the government delineated micro-watersheds followed the hydrological boundaries as defined by the DEM. Although watershed development under IWMP is meant to be planned for the government delineated micro-watersheds it appears that in the Sukhi catchment most of the planning was done using the village areas.
Figure 20 shows the SWAT sub-watersheds overlain onto the areas of the five survey villages. The village areas cover parts of a number of different sub-watersheds but the majority of the areas are covered by the nine numbered sub-watersheds in Figure 21. These nine sub-watersheds can be divided into 4 sub
figure 21 SWAT SUB CATCHMENTS COVERING THE FIVE SURVEY VILLAGES
ForestDholisimelDungarbhint
GhataKevdiKundal
Sukhi ReservoirSWATSubwatersheds

ANNEX 8: Technical Note on SWAT Modeling 101
catchments, shown in Figure 22, all of which drain directly into the Sukhi Reservoir, making them a useful unit of analysis. The only large area of the five villages that falls outside of the 9 sub-watersheds is the eastern half of Kevdi village, which covers a small part
of a much larger sub-catchment. This illustrates the difficulties of using administrative units, such as village areas, when analyzing and planning hydrological interventions.
The sub-watersheds shown in Figure 20 can be divided into 3 distinct groups based on their dominant land uses; sub-watersheds 13, 36, and 39 are nearly completely forested, sub-watersheds 22, 25, 51 and 55 are split between forest and agricultural land, and sub-watersheds 43 and 53 have a mix of agricultural land, grassland, and degraded forest. The land use of each sub-watershed has a large impact on its hydrology and therefore on the impact of the scenarios.
Extracting the data on the water balance components for the nine sub-watersheds (Table 7) reveals differences to the Sukhi catchment as a whole, due to the differences in the proportions of the different land uses, topography and soils. ET is generally lower than for the catchment as a whole; for scenario 2a in 2009 it 92.5% of rainfall compared to 98.7% for the whole catchment, while for scenario 1a it is 69.4% compared to 77.4% for the whole catchment. This is due to the large areas of forest in these nine sub-watersheds, which have lower ET than double cropped areas. Average reservoir inflows for the nine sub-watersheds are similar to those of the whole catchment for the baseline and the scenarios. However the variations in inflows in 2009 and 2011, the driest and wettest years, are more extreme. For example reservoir
figure 22 MICRO-CATCHMENTS COVERING THE FIVE SURVEY VILLAGES
table 7 AVERAGE WATER BALANCE COMPONENTS OF THE NINE SUB-WATERSHEDS COVERING THE SURVEYED VILLAGES AS A PERCENTAGE OF RAINFALL
scenarios baseline1a 1b 1c 2a 2b 2c
Dry Year (2009) ET 69.4 75.0 69.5 92.5 75.6 91.6 75.1Pecolation 27.8 27.9 28.7 34.0 32.6 29.5 28.9RWH recharge 0.0 0.0 0.9 3.7 3.2 1.0 1.0Runoff 15.6 14.8 15.6 14.9 13.5 16.4 14.8
Wet Year (2011) ET 20.3 21.6 20.4 25.3 21.7 25.2 21.7Percolation 47.0 47.9 47.2 50.8 51.7 47.1 48.1RWH recharge 0.0 0.0 0.2 0.8 0.7 0.2 0.2Runoff 48.2 47.4 48.3 42.8 45.7 45.0 47.6
Average (07-12) ET 29.0 30.8 29.1 35.8 30.9 35.7 30.8Percolation 41.2 42.0 41.5 45.5 46.1 41.6 42.4RWH recharge 0.0 0.0 0.3 1.3 1.2 0.3 0.3Runoff 41.2 40.4 41.3 37.1 38.6 39.1 40.5
Villages boundaries
Subcatchment 1
Subcatchment 2
Subcatchment 3
Subcatchment 4

Catchment Assessment and Planning for Watershed ManageMent: Volume II - Annexes102
inflows in 2009 for the baseline is only 14.8% of rainfall compared to 19.3 % for the whole catchment while for scenario 1a it is only 15.6% compared to 23.9% for the whole catchment. Groundwater recharge from RWH structures for scenarios 2a and 2b is higher for the nine sub-watersheds in 2009 than it is for the whole catchment. For scenario 2 in 2009 it reaches 3.7% of rainfall in the nine sub-watersheds which highlights the significant impact that RWH structures may have at a local scale.
The average rice yield in the nine sub-watersheds for the period 2007 and 2012 was 2112 kg/ha for the baseline. This is close to the average yield of 2193 kg/ha reported by the village for the same period. The average yield of maize grown in the Kharif season was 3796.2 kg/ha for the baseline, much higher than the 2087 kg/ha reported by the villages, while the average yield of maize grown in the Rabi season was 1886 kg/ha for the baseline compared to 2181 kg/ha reported by the villages.
Figure 22 shows how the crop yields vary across the different sub-watersheds. They generally are highest for sub-watersheds 55 and 51 which cover Ghata and Kundal villages, and lowest sub-watersheds 43 and 52. The low yields in sub-watersheds 43 and 52 can be partly to the shallow lithic Haplusteps soils that cover the majority of the sub-watersheds. In comparison the soil
in the other sub-watersheds is mainly moderately deep udic Haplusteps. Some of the variation in crop yields between sub-watersheds, and perhaps the differences between the model crop yields and those reported by the villages, can also be attributed to inconsistencies in the auto-irrigation function used in SWAT. In some HRUs with low yields, insufficient irrigation is applied, even when there is water available in the shallow aquifer. Developing manual irrigation schedules using data gathered from the villages would improve the model in this area.
There is little variation in crop yields between the scenarios because in all of them there is sufficient water available for irrigation in nearly all the sub-watersheds. Only in 2009 does the water in the shallow aquifer come close to being completely depleted which limits irrigation for some HRUs in the following year. The deficit in irrigation is largest in scenario 2c, in which the area of double cropped agriculture is expanded but the intensity of RWHs is not increased. In terms of groundwater the model may not accurately reflect reality as farmers in the villages reported that in many years there is not enough water left for irrigation at the end of the Rabi season. Consequently the model may be over predicting groundwater availability. Groundwater in the area is shallow and flows relatively quickly into the reservoir, in comparison groundwater in SWAT
figure 23 CROP YIELDS FOR THE SUB-WATERSHEDS COVERING THE SURVEY VILLAGES
Average Rice Yield 2007-2012 (kg/ha)
Average Kharif maize Yield 2007-2012 (kg/ha)
Average Rabi maize Yield 2007-2012 (kg/ha)
No crop No crop No crop2000-2100 2000-3000 1800-18502100-2200 3000-4000 1850-19002200-2300 4000-5075 1900-1950

ANNEX 8: Technical Note on SWAT Modeling 103
1a
ET
Groundwater percolation
RWH structure recharge
Runoff
-10.00- -5.00
-5.00- -2.50
-2.50- -1.00
-1.00- -0.00
No Change
0.00- 1.00
1.00- 2.50
2.50- 5.00
5.00- 10.00
1b 1c 2a 2b 2c
is treated as a static sink that makes relatively small contribution to streamflow. Groundwater representation is acknowledged as a weakness of the SWAT model, which is why in many studies where groundwater plays an important role it is coupled with MODFLOW, which allows groundwater to be modeled in far greater detail (Kim et al., 2008).
Figure 23 shows how ET, groundwater percolation, groundwater recharge from RWH structures, and runoff vary across the nine sub-watersheds for the scenarios in comparison to the baseline, and therefore illustrates the relative magnitude of the impacts that the different scenarios have on the water balance components. For example it can be seen clearly that Scenario 1b, in which RWH structures were completely removed, has a relatively small impact in comparison to the other scenarios. In
scenario 1c, ET and groundwater percolation are both slightly reduced but there is also a small reduction in runoff from some of the sub-watersheds, the reason for which is not clear. In comparison, scenario 1c, in which the doubled cropped area is substantially reduced, results in much larger reductions in ET and groundwater percolation and as a consequence an increase in runoff for all the sub watersheds. The largest impacts are seen in the southern sub watersheds closest to the Sukhi reservoir. As the upstream sub watersheds are mainly covered by forest, the reduction in double cropped area has little impact on them. Scenario 1a, which combines scenarios 1b and 1c, has very similar impact to scenario 1b due to the small overall impacts of scenario 1c.
Scenario 2c, in which the double crop area is increased from 30% to 40% of the catchment area, results in a
figure 24 IMPACT OF SCENARIOS ON WATER BALANCE COMPONENTS FOR THE SUB WATERSHEDS COVERING THE SURVEY VILLAGES
Change in water balance components for scenarios from the baseline as a percentage of annual average rainfall

Catchment Assessment and Planning for Watershed ManageMent: Volume II - Annexes104
large increase in ET and a reduction in groundwater percolation and reservoir inflows. Scenario 2b, which models a substantial intensification but with no parallel increase in agricultural intensity, shows a large increase in groundwater percolation, a small increase in ET, and a decrease in reservoir inflows. In reality, the groundwater characteristics of the area mean that this water will likely flow into the reservoir as groundwater flow. Scenario 2a, a combination of scenarios 2b and 2c, shows large increases in both ET and groundwater percolation and large decrease in runoff for most of the sub-watersheds. The reason why sub-watersheds 51 and 55 see a small increase in runoff is not clear although it is potentially caused by increased runoff from irrigation.
disCussionthe modeling process
This study has shown that a combination of field data and secondary data can be used as input to a hydrological model to investigate the impacts of watershed development and land use change with a reasonable degree of accuracy. However adapting the modeling process used in this study to create a standardised stepwise methodology that could be applied by IWMP is a challenge due to the time-consuming, complex and iterative nature of the modeling process. Voinov and Bousquet (2010) proposed a number of steps that should be taken during a successful participatory modeling process (Box 2). Although the sequence of the steps is logical, the authors state that the order can and should vary greatly between different studies, and may
incorporate various iterations of different combinations of steps, as well as complete changes of direction, such as a switch to a different model. During this study for example, calibration and validation was repeated multiple times to test different setups and data inputs. Due to the high resolution of the model and the large number of HRUs, the calibration and validation process took multiple days, and when repeated multiple times it became a very time consuming process.
Different catchments with contrasting hydrological characteristics will require different solutions to overcome problems encountered in the modeling process. This can effect both the order in which it is best to complete the different steps of the modeling processes, the number of iterations needed, and the amount of time needed to complete them. Datasets used in the modeling process will differ in quality and reliability in different locations, which will lead to variation in how well the models can simulate catchment hydrology. This in turn will influence the utility of the model as input to watershed planning and management decisions. If a model has high uncertainty then greater care has to be taken in the use of model results, which should not be utilized in decision making to the same extent as results from a model that simulates the hydrology of a catchment with less uncertainty.
One issue that would be a particular challenge for the wider application of hydrological models by IWMP is the various scales at which models would have to be applied due to data availability. A primary reason why the Sukhi catchment was chosen for this study was the availibility of data to calibrate and validate the model. However in many areas where IWMP work such data is not availble nearby, which could lead to the use of data from gauging stations far downstream from IMWP watersheds and the modeling of catchments that cover thosands of square kilometers. Although this study has shown that data can be extracted for areas of intrests from within a model of a larger area, for much larger catchments this is unlikely to be practical, given small size of IWMP watersheds. Models of much larger catchments would still provide useful outputs for IWMP, and it would be possible to model the potential impacts of watershed development in a similar way to this study, but the scale of application would make it impractical to examine the impacts at the local scale at which IWMP’s work is carried out, and
1. Identify project goals
2. Identify and invite stakeholders
3. Choose modelling tools
4. Collect and process data
5. Discuss system, build conceptual model
6. Run model, discuss results
7. Discuss and refine results
8. Analyse model, discuss improvements
9. Present results to other stakeholder and decision makers.
boX 2 THE PARTICIPATORY MODELLING PROCESS (ADAPTED FROM VOINOV & BOUSQUET (2010)

ANNEX 8: Technical Note on SWAT Modeling 105
would result in more generalised outputs. An obvious solution would be increased collection of hydro-climatic data, although the increasing quality and quantity of remotely-sensed data can also play an important role in allowing the wider application of hydrological models at local scales.
use of model results
In this study the SWAT model simulates the hydrology of the Sukhi catchment reasonably well when judged using common metrics such as R2 and NSE, although calibration and validation reveals some uncertainty in model outputs, as indicated by the p and r factors. The initial scenarios run at the catchment scale predict significant impacts as a result of watershed development and land use change on both the local water balance and downstream flows. In normal and wet rainfall years the downstream impact are small, however in 2009, the driest year, reservoir inflows decrease from 35 million cubic meters (mcum), for the baseline, to 29 mcum for scenario 2a. This is a significant decrease at a time when water from the Sukhi reservoir would be most needed downstream in the reservoir command area. The impacts during multiple year droughts would be even larger and are likely to be exacerbated by climate change. An important question that needs to be consider by IWMP in light of these finding is whether the local economic benefits of these changes are worth the potential negative downstream impacts. Further model development could help in this regard, in particular, improving the representation of groundwater would lead to a more realistic prediction of the impact of the scenarios on crop yield and allow the calculation of farm incomes similar to the study of Karlberg et al. (2015).
In addition to the scenarios that examined the impacts of watershed development at the catchment level, scenarios were also developed to examine the impacts of specific watershed development plans at a village level. This exercise demonstrated the potential utility of the SWAT model to IWMP as a tool to examine the impacts of watershed development at the local level. The results showed that the impacts of watershed development for the five villages are different to those of the Sukhi catchment as a whole, due to differences in land use, soil characteristics, and topography. Even within the five villages the scenarios resulted indifferent response.
For the IWMP planning process, outputs from the model can be useful. As many of the outputs are spatial they can easily be integrated into the multi-criteria GIS analysis used to selected project watersheds. For example, it would be possible to create GIS layers looking at the potential changes in runoff, recharge and groundwater percolation resulting from watershed development (e.g. Figure 23). For locations that have already been selected the model could be used to find the optimum level of watershed development, at which the impact on downstream flow during dry years is not too great. There is also the possibility of using the new IWMP mapping portal developed by NRSC to share model outputs with stakeholders. The feasibility of sharing model results online with stakeholders has been previously demonstrated by Patil and Gosain (2013), who uploaded SWAT outputs for the Indus River, in North India onto a mapping portal.
Potential model improvements
In terms of the modeling process the model has reach the point at which can be useful as a planning tool; both because it gives an indication of the potential downstream impacts of watershed development and because it allows investigation of the local hydrological impacts of watershed development and how they vary within the catchment. However there is much more work that could be done to improve the model and explore the impacts of watershed development and land use change. For example, more scenarios could be developed to look as specific visions of future - for example, what would be the impact if the intensity of watershed development was varied across the catchment? This kind of planning has been demonstrated to some extent through the analysis of model outputs for the five study villages. With further fieldwork the model could be used to study how various distributions of water harvesting and agricultural intensity across the catchment could minimize downstream impacts, while maximizing local benefits. Another direction of future model development that could hold particular value would be to investigate the potential impacts of climate change, and the hypothesis that they could exacerbate the negative downstream impacts of watershed development. The potential of using SWAT to model the impacts of climate change has been demonstrated in India (e.g. Gosain et al., 2011; Mitra & Mishra, 2014).

Catchment Assessment and Planning for Watershed ManageMent: Volume II - Annexes106
There are a number of additional improvements that could be made to the model developed in this study to increase its utility for planning watershed development. Better modeling of groundwater has already been mentioned, but other improvements such as more detailed representation of land use change could also improve the accuracy of model outputs. One way to achieve this would be to classify of land use from raw satellite data to create a dataset of higher resolution than the NRSC datasets used in this study. Although the NRSC datasets provides a relatively accurate picture of catchment-wide land use and how it varied through the modeling period, at a village level there were some obvious errors, such as the overrepresentation of degraded forest. Land use change could be implemented more accurately in the model through the use of a tool such as the one developed by Pai & Saraswat (2009), which calculates updated HRU_FR parameters for all HRUs and therefore allows a more complete representation of the land use change than the method used in this study. Model accuracy is also reduced by the number of parameters that were estimated or set to arbitrary values during model setup, for example, the parameter that controls the amount of irrigation that immediately becomes runoff was set arbitrarily to 10%. Further research and field work could provide better estimates for these parameters and improve model performance.
Calibration and validation of the model was done only for one point in the catchment and at a monthly time setup. Confidence in model outputs could be increased through calibration for more points and at a daily time step but this was not possible due to lack of data. In such a situation, which is likely to be common in other
catchments where IWMP watersheds are located, the importance of model validation using local knowledge and fieldwork is heightened.
The model presented in this study should not be seen as a finished product. In fact it can be argued that no hydrological model is truly complete as there always ways in which they can be improved. For example, there is no real identifiable point at which it can be said that calibration and validation is complete, rather the modeler simply decides when, based on certain measures, model performance is good enough for the purpose for which the model will be used. If the model in this study was being used by IWMP for the planning of watershed development in the Sukhi catchment then further development iterations and improvements would be recommended to deal with the issues discussed above.
ConClusion
Overall the model developed for this study provides a wealth of hydrological information for a catchment for which a limited amount was previously available. The results provide a quantitative estimate of the downstream impacts of watershed development and land use changes as well as information regarding their local impacts on different components of the water balance and how these impacts vary across the catchment. This information could be used by IWMP in a number of ways, including as input into the methodology to select watersheds and for planning the level of development in the watersheds selected. The study also demonstrated how the spatial nature of SWAT allows scenarios to be developed for specific areas within the catchment which enables local level planning.

ANNEX 9: Sample village plan for Kevdi 107
saMPle village Plan for kevdianneX 9
figure a9.1 GOOGLE EARTH 3-D IMAGE OF A TYPICAL LAND-USE PROFILE OF KEVDI VILLAGE
Kevdi village is part of Chhota Udaipur tehsil, Chhota Udaipur district, Gujarat state. The village lies north of Chhota Udaipur and is connected by state highway no 62.
Physical Characteristics: The village is located in the upper catchment of the Sukhi reservoir. The area of the village is approximately 1225 ha. There are two small streams flowing through the area in a north-south
direction and draining into the Sukhi reservoir. The area is hilly and under forest cover with small level areas along the river banks under cultivation. Forested lands are under ownership of the Forest Department while most of the cultivated fields are privately owned.
Main crops grown are rainfed maize on the fields immediately below the forest boundary and irrigated maize, ground-nut on the fields closer to the river.

Catchment Assessment and Planning for Watershed ManageMent: Volume II - Annexes108
Irrigation water is lifted by means of diesel pumps from dug wells and applied by flood irrigation to the fields.
Climate: The Chhota Udaipur area has a tropical climate and receives an average annual rainfall of 1083 mm. Most of the precipitation occurs between the June-October months. The temperatures are highest on average in May, at around 33.4 °C. The lowest average temperatures in the year occur in January, when it is around 20.7 °C (http://en.climate-data.org/location/963387/).
demography: As per the 2011 census, there are 258 families living in the village, all of whom belong to
figure a9.2 GOOGLE EARTH MAP SHOWING KEVDI VILLAGE BOUNDARY IN ORANGE AND DRAINAGES IN BLUE
the Schedule Tribe category. The families are distributed among 5 hamlets or faliyas. The main occupation of the people is agriculture either on own land or as agriculture labor. Many youth have migrated to urban areas for employment especially in the dry months.
Main issues ConCerning Water and agriCulture
forest lands: The forest areas enjoy good tree cover but are vulnerable to erosion as a result of high intensity rainfall and sloping terrain. The run-off water flows down

ANNEX 9: Sample village plan for Kevdi 109
the slopes with a high velocity carving out deep gullies. This leaves the fields located below the forest boundary exposed to gully erosion.
The Forest Department has constructed a number of masonry check dams, check walls and earthen bunds along the gullies. However since the upper slopes have not been treated with soil conservation measures, the structures along the gullies have limited effectiveness in reducing velocity of run-off and increasing infiltration. Cattle Protection Trenches (CPT) along with few Water Absorption Trenches (WAT) have been excavated along the forest boundary. While the CPTs serve to divert the water away from the fields below, the WATs are effective as a water conservation measure.
Cultivated lands: These comprise level fields clustered in between the forest boundary and the river. These lands are dissected by gullies which originate in the forest lands above and flow into the river below.
earthen bunds: A number of earthen bunds have been constructed along these gullies for the purpose of harvesting the run-off. Most of these bunds have been breached. The gully section immediately upstream of the bunds have been leveled and converted into fields. Standing water causes damage to the crops and hence the bunds have been breached in order to allow the water to escape. Therefore the earthen bunds have not been effective in harvesting water.
table a9.1 EXISTING WATER HARVESTING STRUCTURES (WHS) AND WELLS IN KEVDI VILLAGE
rainwater harvestingstructures
number remarks
Check Dams (CD) 15 Masonry Structures constructed in larger gullies. Most are on Forest Lands. Seasonal storage. High siltation due to lack of soil conservation measures in upper catchment.
Check Walls (CW) 34 Masonry Walls constructed in smaller gullies. High siltation due to lack of soil conservation measures in upper catchment.
Earthen Bunds (EB) 28 Earthen Bunds in smaller gullies constructed to harvest seasonal flows. Most have been breached. Farmers are cultivating crops above many of these.
Tank Bund (TB/Tank) 01 Small Percolation Tank Located in Patel Faliya. Embankment is breached and storage area silted-up.
Water Harvesting Trenches (WHT)
To be surveyed
WATs have been constructed by the Forest Department in some areas along the forest boundary. Each WAT has a cross-section of around 1 sqm. However, in other areas Cattle Protection Trenches (CPT) have been constructed which do not serve as WHS.
Wells 50 Dug wells along river banks and also in level fields below the forest lands. Shallow to deep. Seasonal storage, shallow wells run dry by Feb, while deeper wells only have water for drinking in summer.
Wells: There are around 50 wells in the village. The depth of these wells ranges from 30–70 feet and hence they tap the sub-surface ground water flows. Most of the wells are dry by February/March with few of the deeper wells having sufficient water for domestic purposes during summer months.
ProPosed Water harvesting strategy for kevdi village
A large number of WHS have been constructed in Kevdi village. However, these have not been very effective in harvesting surface water or recharging the wells as evident from the fact that March onwards there is
figure a9.3
PHOTO SHOWING CHECK DAM (CD 13) CONSTRUCTED ALONG THE FOREST BOUNDARY

Catchment Assessment and Planning for Watershed ManageMent: Volume II - Annexes110
figure a9.4 GOOGLE EARTH MAP SHOWING DISTRIBUTION OF WELLS AND WHS IN KEVDI VILLAGE, APRIL 2015
figure a9.5 BREACHED EMBANKMENT WITH CULTIVATED AREA UPSTREAM
figure a9.6 DEEP WELL ALMOST DRY IN APRIL
no surface water available and the most of the wells have also dried up. Farmers are unable to provide supplementary irrigation to the Rabi crop during February and March.
There are two main reasons for the existing WHS being rendered less effective. The major land area is hilly and belonging to the forest department and is untreated with soil conservation activities. The entire runoff is
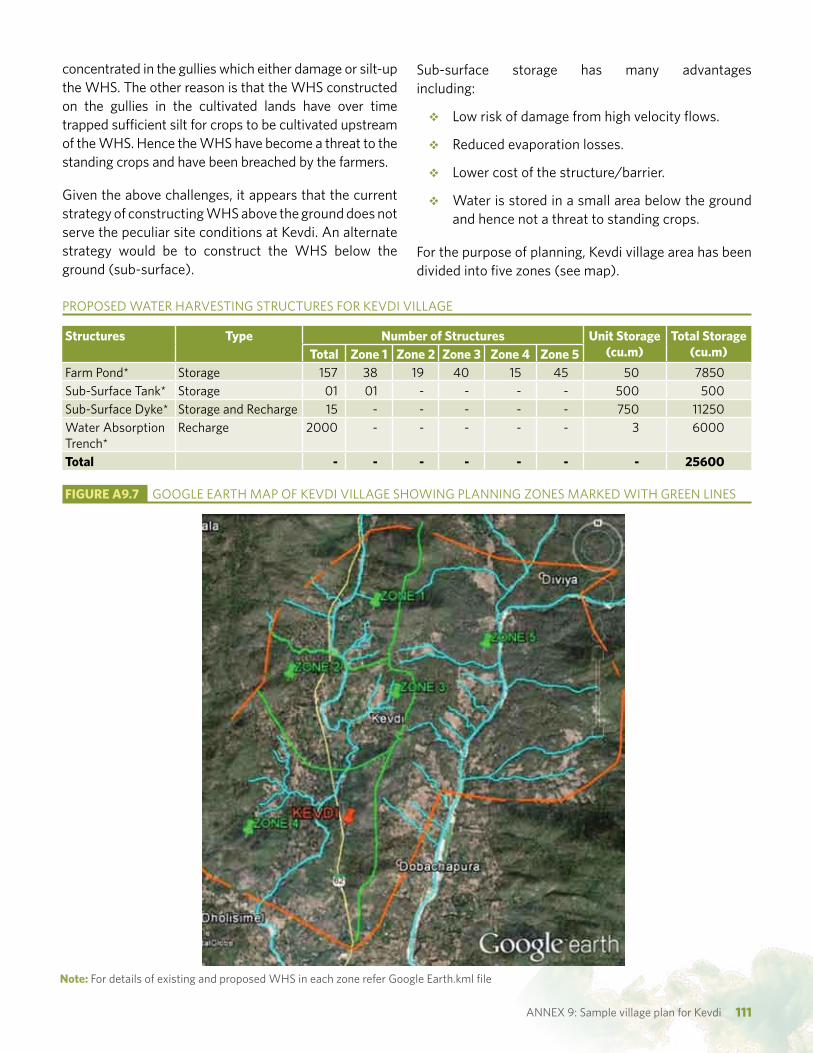
ANNEX 9: Sample village plan for Kevdi 111
concentrated in the gullies which either damage or silt-up the WHS. The other reason is that the WHS constructed on the gullies in the cultivated lands have over time trapped sufficient silt for crops to be cultivated upstream of the WHS. Hence the WHS have become a threat to the standing crops and have been breached by the farmers.
Given the above challenges, it appears that the current strategy of constructing WHS above the ground does not serve the peculiar site conditions at Kevdi. An alternate strategy would be to construct the WHS below the ground (sub-surface).
Sub-surface storage has many advantages including:
Low risk of damage from high velocity flows.��
Reduced evaporation losses.��
Lower cost of the structure/barrier.��
Water is stored in a small area below the ground ��
and hence not a threat to standing crops.
For the purpose of planning, Kevdi village area has been divided into five zones (see map).
structures type number of structures unit storage(cu.m)
total storage (cu.m)total zone 1 zone 2 zone 3 zone 4 zone 5
Farm Pond* Storage 157 38 19 40 15 45 50 7850Sub-Surface Tank* Storage 01 01 - - - - 500 500Sub-Surface Dyke* Storage and Recharge 15 - - - - - 750 11250Water Absorption Trench*
Recharge 2000 - - - - - 3 6000
total - - - - - - - 25600
PROPOSED WATER HARVESTING STRUCTURES FOR KEVDI VILLAGE
figure a9.7 GOOGLE EARTH MAP OF KEVDI VILLAGE SHOWING PLANNING ZONES MARKED WITH GREEN LINES
note: For details of existing and proposed WHS in each zone refer Google Earth.kml file

Catchment Assessment and Planning for Watershed ManageMent: Volume II - Annexes112
anneXure 9.1: desCriPtion of ProPosed Water harvesting struCtures
1. farM Pond: This is a subsurface storage structure constructed either along the sides of gullies or along the rills in cultivated fields. The purpose is to divert surface flows into the structure during the rainy months and use the water for protective irrigation during periods of water stress.
estimation of dimensions of farm Pond (lined)
A 1000 sq.m field of maize or ground-nut would require around 25 cu.m of water for a single supplementary irrigation using flood method. Hence if a single irrigation is to be provided, then the FP should be able to store at least 25 cu.m of water for which dimensions of 3 m x 3 m x 3 m would be sufficient. For two irrigations, storage of at least 50 cu.m would be needed for which either two FPs of 25 cum each of one large FP of 50 cu.m (4 m x 4 m x 3.5 m) should be constructed.
figure a9.1.1 DISTRIBUTION OF EXISTING AND PROPOSED WHS IN RAINFED AREAS OF ZONE 1
Challenges solutions
Deposition of silt. This can be prevented by constructing a loose stone wall on the upstream side.
Need for lining the structure to prevent water loss due to seepage or percolation.
Good quality plastic can be used to line the barrier or storage area.
Need for lifting-device to lift water for irrigation. Most farmers have pumps to lift water from their wells.Excavation at lower depths is difficult due to hard strata.
Heavy machinery would be needed to excavate in hard strata. Farmers already are using this technology for excavating their wells.
FARM PONDS: CHALLENGES AND SOLUTIONS

ANNEX 9: Sample village plan for Kevdi 113
The average annual rainfall of the Chhota Udaipur region is around 1000 mm or 1 m. For a field of 1000 sq.m area, the average precipitation received would be 1000 cu.m. Even allowing for losses due to run-off, evaporation, infiltration etc., it should not be a problem to channel 50 cu.m of surface flow into the FP over the period of rainy months.
Hence, it is proposed to construct one FP of 50 cu.m capacity for each rainfed field of 1000 sq.m area in Kevdi village. The actual size and location for each FP should be decided in consultation with the farmer keeping in mind the needs of the crop, site conditions and other local circumstances.
2. sub-surfaCe tank: The existing percolation tank in Patel Faliya which is currently defunct due to breach of embankment and siltation can be
figure a9.8
EXISTING WATER HARVESTING TANK (PATEL FALIYA) TO BE CONVERTED INTO SUB-SURFACE STORAGE
figure a9.9 TENTATIVE LOCATIONS OF SUB-SURFACE DYKES

Catchment Assessment and Planning for Watershed ManageMent: Volume II - Annexes114
converted into a large sub-surface storage tank. It is proposed to excavate an area of 10 m x 10 m x 5 m within the storage area and line it with heavy-duty plastic. This structure will be able to store 500 cu.m of water sufficient for single irrigation to 20 hectares of rainfed fields. Short-term pisci-culture can also be taken up in this tank as supplementary mutrition or income generation activity.
Low wall of loose stones (1 m high x 1.5 m wide) is to be constructed across the upstream inlet of the tank so as to reduce the velocity and trap the soil in order to prevent siltation of the reservoir. Additional storage space can be created by constructing a similar loose stone wall across the breach in the embankment.
3. sub-surfaCe dykes: These structures are proposed to be constructed at strategic points across the two small rivers flowing through Kevdi village. The structures themselves would be buried in the sand of the stream bed so allow surface water to flow uninterrupted downstream while preventing sub-surface stream flows from flowing down-stream. If some amount of water is to be allowed to flow down-stream then the barrier should be perforated accordingly. The dyke barrier may be constructed of brick masonry or heavy duty plastic.
The purpose of the Dyke is to allow recharge of the dug-wells fed by the sub-surface stream flows. Currently the sub-surface stream flows run dry by November or December and hence the wells along the banks also run dry. Storing the sub-surface flows behind the
figure a9.10 EXISTING WATS ALONG THE FOREST BOUNDARY
figure a9.11 TYPICAL LAND-USE PROFILE OF VILLAGE KEVDI
dykes will allow the farmers to utilize the well water for supplementary irrigation during Rabi months.
The location and design of the Dykes will need to be done in consultation with the Irrigation Department.
For estimation purposes the typical Dyke is assumed to have a length of 15 m, height of 1 m and upstream storage of 50 m.
4. Water absorPtion trenChes: WATS have been constructed by the Forest Department along the boundary of the forest land. They are typically 3 m long, 1 m wide and 1 m deep. A thin earthen section (Tie) separates one WAT from the next along the same line. Run-off water from the slopes collects in the WATs and infiltrate into the soil thus improving the soil moisture and recharging wells. This recharge occurs during each rainfall event. In order to serve the purpose of water harvesting, the earthen bund should be constructed on the down-slope side of the excavated area and not on the up-slope side as in the existing WATs (Figure A9.10).
In most cases the Forest Department has constructed Cattle Protection Trenches along the boundary with the village lands so as to prevent cattle from entering forest lands for grazing. CPTs differ from WATs as they are excavated in a continuous section without being divided into sections by Ties. Hence the runoff water enters the CPT and flows within it towards the nearest gully. While CPTs do not serve the purpose of water harvesting, they can easily be converted into WATs by creating Ties (50 cm wide) using loose stones.

115References
referenCes
Adhikari, R.N., Singh, A.K., Math, A.K.N., Raizada, A., Mishra, P.K. and Reddy, K.K. (2013). Augmentation of groundwater recharge and water quality improvements by water harvesting structures in the semi-arid Deccan. Current Science. 104(11): pp. 1534-1542.
Alansi, A., Amin, M., Halim, G., Shafri, H. and Aimrun. W. (2009). Validation of swat model for stream flow simulation and forecasting in upper bernam humid tropical river basin, Malaysia, Hydrology and Earth System Sciences Discussions, vol. 6, pp. 7581–7609.
Arnold, J.G., Kiniry, J.R., Srinivasan, R., Williams, J.R., Haney, E.B. and Neitsch, S.L. (2012). Soil & water assessment tool: input/output documentation version 2012. Texas Water Resources Institute.
Batchelor, C. (1999). Improving water use efficiency as part of integrated catchment management. Agricultural Water Management, 40(1999): pp. 249-263.
Batchelor, C.H. Reddy, V.R., Linstead, C., Dhar, M., Roy, S. and May, R. (2014) Do water-saving technologies improve environmental flows? Journal of Hydrology. 518A (Part A). pp. 140-149.
Batchelor, C.H., A. Singh, Rao, M.S.R. and J. Butterworth (2002), Mitigating the unintended impacts of water harvesting. Paper presented at the IWRA International Regional Symposium on ‘Water for Human Survival’, 26-29 November 2002, Hotel Taj Palace, New Delhi.
Batchelor, C.H., Rao, M.S.R. and Rao, S.M. (2003). Watershed Development: A solution to water shortages
in semi-arid India or part of the problem? Land Use and Water Resources Research, 3 (2003): pp. 1-10.
Bellamy, J., Ross, H., Ewing, S. and Meppem, T. (2002). Integrated Catchment Management: Learnings from the Australian Experience for the Murray Darling Basin, Final Report, January 2002.
Bhalla, R.S., Pelkey, N.W. and Prasad, K.V.D. (2011). Application of GIS for evaluation and design of watershed guidelines. Water Resources Management. 25: pp. 113-140.
Bhalla, R.S., Prasad, K.V.D. and Pelkey, N.W. (2013). Impact of India’s watershed development programs on biomass productivity. Water Resources Research. 49(3): pp. 1568-1580.
Biggs, T.W. Gaur, A., Scott, C.A., Thenkabail, P., Rao, P.G., Gumma, M.K., Acharya, S. and Turral, H.(2007). Closing of the Krishna Basin: Irrigation, Stream flow Depletion and Macro scale Hydrology, Research Report 111, Colombo: International Water Management Institute.
Biondi, D., Freni, G., Icobellis, V., Mascaro, G. and Montanari, A. (2012). Validation of hydrological models: conceptual basis, methodological approaches and a proposal for a code of practice. Physics and Chemistry of the Earth. 42-44: pp. 70-76.
Bloschl, G. and Sivapalan, M. (1995) Scale issues in hydrological modeling: A review. In Kalma, J.D. and Sivapalan, M. (eds.) Scale Issues in Hydrological Modelling. Chichester: John Wiley & Sons. pp. 9-48.

Catchment Assessment and Planning for Watershed ManageMent: Volume II - Annexes116
Bouma, J.A., Biggs, T.W. and Bouwer, L.M. (2011). The downstream externalities of harvesting rainwater in semi-arid watersheds: An Indian case study. Agricultural Water Management. 98: pp. 1162-1170.
Buhl, S. and Sen, R. (2006). A Preliminary Poverty Impact Assessment. New Delhi: Indo-German Development Cooperation, Natural Resource Management.
Buller, H. (1996). Towards sustainable water management Catchment planning in France and Britain. Land Use Policy, 13(4): pp. 289-302.
Calder, I. R. (2002). Forest Valuation and Water; the need to reconcile public and science perceptions, in Verweij, PA (ed.) Understanding and Capturing the Multiple Values of Tropical forests, Tropenbos Proceedings, Wageningen: Tropenbos International, pp. 49-62.
Calder, I. R. (2005). The Blue Revolution, Integrated Land and Water Resources Management. London: Earthscan Publications.
Calder, I., Gosain, A.K., Rao, M.S.R., Batchelor C.H., Garratt, J. and Bishop, E. (2008). Watershed development in India. 2 New approaches for managing externalities and meeting sustainability requirements, Environment, Development and Sustainability, 10(4): pp. 427-440.
Clemmens, R. G. Allen, and Burt C.M. (2008) Technical concepts related to conservation of irrigation and rainwater in agricultural systems. Water Resources Research. 44, W00E03, DOI: 10.1029/2007WR006095, 2008.
Collins, K., Blackmore, C., Morris, D. and Watson, D. (2007). A systemic approach to managing multiple perspectives and stake holding in water catchments: some findings from three UK case studies. Environmental Science & Policy, 10(2007): pp. 564-574.
COMMANS (2005) Managing Groundwater Resources in Rural India: Communities and Beyond. British Geological Survey Commissioned Report. CR/05/36N.
Darghouth, S., Ward, C., Gambarelli, G., Styger, E. and Roux, J. (2008). Watershed Management Approaches, Policies and Operations: Lessons for Scaling Up, Water Sector Board Discussion Paper Series, paper No. 11, Washington D. C.: The World Bank.
DoLR (2008) Common Guidelines for Watershed Development Projects. [pdf]. New Delhi: Department of Land Resources, Ministry of Rural Development, Government of India. Available at http://dolr.nic.in/dolr/downloads/pdfs/CommonGuidelines2008.pdf.
DoLR (2011) Common Guidelines for Watershed Development Projects 2008 Revised Edition 2011. [pdf]. New Delhi: Department of Land Resources, Ministry of Rural Development, Government of India. Available at http://dolr.nic.in/dolr/downloads/pdfs/Common%20Guidelines_2011[1].pdf.
DoLR (2015) Integrated Watershed Management Programme. [online]. New Delhi: Department of Land Resources, Ministry of Rural Development, Government of India. Available at http://dolr.nic.in/dolr/iwmp_ main.asp.
Droogers, P., Van Loon, A. and Immerzeel, W.W. (2008). Quantifying the impact of model inaccuracy in climate change impact assessment studies using an agro-hydrological model. Hydrology and Earth System Sciences. 12: pp. 669-678.
European Environmental Bureau (2010). 10 Years of Water framework Directive: A Toothless Tiger? Snapshot Assessment of EU Environmental Ambitions, European Environmental Bureau, July 2010.
Evans, R.G. and Sadler, E.J. (2008). Methods and technologies to improve efficiency of water use. Water Resources Research. 44,W00E04, DOI: !0.1029/2007WP,006200,2008
Ewing, S.A., Grayson, R.B. and Argent, R.M. (2000). Science, Citizens, and Catchments: Decision Support for Catchment Planning in Australia. Society & Natural Resources: An International Journal, 13(5): pp. 443-459.
Falkenmark, M. (2004). Towards integrated catchment management: opening the paradigm locks between hydrology, ecology and policy making. International Journal of Water Resources Development, 20(3): pp. 275-281.
Farrington, J. and Lobo, C. (1997). Scaling Up Participatory Watershed Development In India: Lessons from The Indo-German Watershed Development Programme. ODI Natural Resource Perspectives, Number 17.

117
Farrington, J., Turton, C. and James, A. J. (1999). Participatory Watershed Development: Challenges for the Twenty-first Century. New Delhi: Oxford University Press.
Gallart, F. and Llorens, P. (2003). Catchment Management under Environmental Change: Impact of Land Cover Change on Water Resources. Water International, 28(3): pp. 334-340.
Garg, K.K., Karlberg, L. Barron, J., Wani, S.P. and Rockstrom, J. (2012). Assessing impacts of agricultural water interventions in the Kothapally watershed, Southern India. Hydrological Processes. 26: pp. 387-404.
Garg, K.K., Wani, S.P., Barron, J., Karlberg, L., and Rockstrom, J. (2013). Up-scaling potential impacts on water flows from agricultural water interventions: opportunities and trade-offs in the Osman Sagar catchment, Musi sub-basin, India. Hydrological Processes. 27(26): pp. 3905-3921.
Gassman, P.W., Reyes, M.R., Green, G.H. and Arnold, J.G. (2007). The Soil and Water Assessment Tool: Historical development, applications, and future research directions. Transactions of the American Society of Agricultural and Biological Engineers. 50(4): pp. 1211-1250.
Glendenning, C.J and Vervoort, R.W. 2011. Hydrological impacts of rainwater harvesting (RWH) in a case study catchment: The Arvari River, Rajasthan, India. Part 2: Catchment-scale impacts. Agricultural Water Management. 98: pp. 715-730.
Glendenning, C.J. and Vervoort, R.W. 2010. Hydrological impacts of rainwater harvesting (RWH) in a case study catchment: The Arvari River, Rajasthan, India. Part 1: Field-scale impacts. Agricultural Water Management. 98: pp. 331-342.
Glendenning, C.J., van Ogtrop, F.F., Mishra, A.K. and Vervoort, R.W. 2012. Balancing watershed and local scale impacts of rainwater harvesting in India – a review. Agricultural Water Management. 107: pp.1-13.
Goel, A. K. and Kumar, R. (2005).Economic analysis of water harvesting in a mountainous watershed in India. Agriculture Water Management, 71, pp. 257-266.
Gosain, A.K., Rao, S. and Arora, A. (2011). Climate change impact assessment of water resources in India, Current Science, 101(3): pp. 356-371.
Government of Newfoundland and Labrador (2010). Application of Earth Observation Technology to Improve Water Resource Management in Newfoundland and Labrador, Newfoundland: Hydrologic Modelling Section Water Resources Management Division Department of Environment and Conservation.
GSWMA (2011a) Operational Guidelines: Integrated Watershed Development Programme. [pdf]. Gandhinagar: Gujarat State Watershed Management Agency, Government of Gujarat. Available at http://gswma.gujarat.gov.in/pfile/Policies/Operational%20Guidelines.pdf.
GSWMA (2011b). Technical Manual: Integrated Watershed Development Programme. [pdf]. Gandhinagar: Gujarat State Watershed Management Agency, Government of Gujarat. Available at http://gswma.gujarat.gov.in/pfile/Policies/Technical%20Manual%2018-06-2011.pdf.
Gupta, S. (2011). Demystifying ‘Tradition’: The Politics of Rainwater Harvesting in Rural Rajasthan. Water Alternatives. 4(3): 347-364.
Gupta, V.K., Rodriguez-Iturbe, I. and Wood, E.F. (1986). Scale Problems in Hydrology. Dordrecht: D. Reidel Publishing Company. pp. vii-viii.
Hamilton, B. (1990). A personal view. Land and Water Research News, 6: 3–4.
Herrfahrdt-Pähle, E. (2010). Introducing Catchment Management: The Case of South Africa, Discussion Paper 3/2010, Bonn: German Development Institute.
Hivji, R. and Davis, R. (2009). Environmental flows in Water Resource Policies, and Projects, findings and Recommendations, Washington: The World Bank.
Homdee, T., Pongput, K. and Kanae, S. (2011). Impacts of Land Cover Changes on Hydrological Responses: A case study of Chi River Basin, Thailand. Annual Journal of Hydraulic Engineering, JSCE, Vol. 55.
References

Catchment Assessment and Planning for Watershed ManageMent: Volume II - Annexes118
Hope, R.A. (2007). Evaluating Social Impacts of Watershed Development in India. World Development, Vol. 35 (8): pp. 1436-1499
Howell, T. (2001). Enhancing Water Use Efficiency in Irrigated Agriculture, Agronomy Journal (93): 281-289.
Immerzeel, W.W., Gaur, A. and Zwart, S.J. (2008). Integrating remote sensing and a process-based hydrological model to evaluate water use and productivity in a south India catchment. Agricultural Water Management. 95: pp. 11-24.
Jakeman, A.J. and Letcher, R.A. (2003). Integrated assessment and modeling: features, principles and examples for catchment management. Environmental Modelling & Software, 18(2003): pp. 491–501.
Jasrotia, A.S., Majhi, A. and Singh, S. 2009. Water balance approach for rainwater harvesting using remote sensing and GIS techniques, Jammu Himalaya, India. Water Resources Management. 23: pp. 3035-3055.
Johnson, A.K.L., Shrubsole, D. and Merrin, M. (1996). Integrated Catchment Management in northern Australia: From concept to implementation. Land Use Policy, 13(4): pp. 303-316.
Johnson, N., White, A., and Perrot-Maître, D. (2001).financial incentives for watershed management: issues and lessons for innovators. Washington, DC: World Resources Institute.
Joshi, P.K., Jha, A.K., Wani, S.P., Joshi, L. and Shiyani, R.L. (2005). Meta-Analysis to Assess Impact of Watershed Program and People’s Participation. Comprehensive Assessment Research Report 8. Sri Lanka: Comprehensive Assessment Secretariat.
Joshi, P.K., Jha, A.K., Wani, S.P., Sreedevi, T.K. and Shaheen, F.A. (2008). Impact of watershed program and conditions for success: A meta-analysis approach. Global Theme on Agro-ecosystems. Report No. 46. Hyderabad: International Crops Research Institute for the Semi-Arid Tropics.
Kahneman, D. (2011) Thinking, fast and Slow. Penguin Books.
Karlberg, L., Garg, K.K., Barron, J. and Wani, S.P. (2015). Impacts of agricultural interventions on farm income: An example from the Kothapally watershed, India. Agricultural Systems. 136: pp. 30-38.
Kauffman, S., Droogers, P., Hunink, J., Mwaniki, B., Muchena, F., Gicheru, P., Brindraban, P., Onduru, D., Cleveringa, R. and Bouma, J. (2014). Green Water Credits – exploring potential to enhance ecosystem services by reducing soil erosion in the upper Tana Basin, Kenya. International Journal of Biodiversity Science, Ecosystem Services & Management. 10(2): pp. 133-143.
Kerr, J. (2002). Watershed Development, Environmental Services, and Poverty Alleviation in India. World Development 30(8): pp. 1387–1400.
Kerr, J. (2003). Price Policy, Irreversible Investment, and the Scale of Agricultural Mechanization in Egypt. In Lofgren, H., Ed. Research in Middle East Economics, Volume 5: food, Agriculture and Economic Policy in the Middle East and North Africa. Pp. 161-185. Oxford, UK: JAI Press.
Kerr, J. (2004) Trip Report: Property Rights, Environmental Services and Poverty in Indonesia.
Kerr, J., Milne G., Chhotray V., Baumann P. and James A. J. (2006). Managing Watershed Externalities in India: Theory and Practice. [pdf]. Available at http://www2.gsu.edu/~wwwcec/docs/doc%20updates/New%20Folder%20%282%29/published%20version%20of%20Kerr%20et%20al.%20Externalit ies%20article%20in%20EDS%20%28jkerr%20v1%29.pdf.
Kerr, J., Pangare, G. and Pangare, V. L. (2002). Watershed development projects in India—An evaluation. Research Report 127, Washington, DC: International Food Policy Research Institute.
Kijne, J., Barker, R. and Molden, D. (2003). Improving Water Productivity in Agriculture: Editors’ Overview, in Jacob Kijne and others (Eds.) Water Productivity in Agriculture: Limits and Opportunities for Improvement, Comprehensive Assessment of Water Management in Agriculture. London: CABI Publishing in Association with International Water Management Institute.
Kim, N.W., Chung, I.M., Won, Y.S. and Arnold, J.G. (2008). Development and application of the integrated SWAT-MODFLOW model. Journal of Hydrology. 356: pp. 1-16.

119
Kraft, G.J. and Stites, W. (2003). Nitrate impact on groundwater from irrigated-vegetable systems in a humid north-central US sand plain, Agriculture, Ecosystems and Environment, 100(1): pp. 63-74.
Kumar, M.D., Ghosh, S., Patel, A., Singh, O.P. and Ravindranath, R. (2006). Rainwater Harvesting in India: Some Critical Issues for Basin Planning and Research. Land Use and Water Resources Research, 6(1): pp. 1-17.
Kumar, M.D. and van Dam, J. (2009). Improving Water productivity in agriculture in India: Beyond more crop per drop. In M.D. Kumar & U.A. Amarasinghe (Eds.), Water productivity improvements in Indian agriculture: Potentials, constraints and prospects. Strategic Analysis of River Linking Project (NRLP) of India series 4. Colombo: International Water Management Institute.
Kumar, M.D. and van Dam, J. (2013). Drivers of change in agricultural water productivity and its improvement at basin scale in developing economies, Water International, DOI: 10.1080/02508060.2013.793572.
Kumar, M.D., (2005). Impact of Electricity Prices and Volumetric Water Allocation on Energy and Groundwater Demand Management: Analysis from Western India. Energy Policy. 33(1): 39-51.
Kumar, M.D., (2007). Groundwater Management in India: Physical, Institutional and Policy Alternatives, New Delhi: Sage Publications.
Kumar, M.D., (2010). Managing Water in River Basins: Hydrology, Economics and Institutions. New Delhi: Oxford University Press.
Kumar, M.D., Scott, C.A. and Singh, O.P. (2011). Inducing the Shift from Flat-Rate or Free Agricultural Power to Metered Supply: Implications for Groundwater Depletion and Power Sector Viability in India, Journal of Hydrology, 409(1-2): pp. 382-394.
Kumar, M.D., Ghosh, S., Patel, A., Singh, O.P. and Ravindranath, R. (2006). Rainwater harvesting in India: some critical issues for basin planning and research. Land Use and Water Resources Research. 6: pp. 1-17.
Kumar, M.D., Patel, A., Ravindranath, R. and Singh, O.P. (2008). Chasing a mirage: water harvesting and artificial
recharge in naturally water scarce regions. Economic and Political Weekly. 43(35): pp. 61-71.
Lakshmanan, A., Geethalakshmi, V., Rajalakshmi, D., Bhuvaneswari, K., Srinivasan, R., Sridhar, G., Sehkhar, N.U. and Annamalai, H. (2011). Climate change adaptation strategies in the Bhavani Basin using the SWAT model. Applied Engineering in Agriculture. 27(6): pp. 887-893.
Macleod, C.J.A., Scholefield, D. and Haygarth, P.M. (2007).Integration for sustainable catchment management. Science of the Total Environment, 373(2007): pp. 591–602.
Mansuri, G. and Rao, V. (2013). Localizing Development: Does Participation Work? A World Bank Policy Research Report, Washington D.C.: The World Bank.
Mazibuko, G. and Pegram, G. (2006): Evaluation of the opportunities for cooperative governance between catchment management agencies and local government, Gezina: Water Research Commission.
McDonald, P., Edwards R.A., Greenhalgh J.F. and C.A. Morgan, (1995). Animal Nutrition. 5th Ed. London: Addison Wesley Longman.
Mishra, A., Froebrich, J. and Gassman, P.W. (2007). Evaluation of the SWAT model for assessing sediment control structures in a small watershed in India. Transactions of the American Society of Agricultural and Biological Engineers. 50(2): pp. 469-477.
Mitchell, B. (ed.). 1990. Integrated water management: International experiences and perspectives. London: Belhaven Press.
Mitchell, B. and Hollick, M. (1993). Integrated Catchment Management in Western Australia: Transition from Concept to Implementation. Environmental Management, 17(6): pp. 735-743.
Moench, M.H. and Dixit, A. (eds.) (2004). Adaptive Capacity and Livelihood Resilience: Adaptive Strategies for Responding to floods and Droughts in South Asia. Boulder: Institute for Social and Environmental Transition, International and Nepal: Institute for Social and Environmental Transition.
Molle, F. and Turral, H. (2004). Demand Management in a Basin Perspective: Is the Potential for Water Saving
References
Catchment Assessment and Planning for Watershed ManageMent: Volume II - Annexes120
Over-estimated? Paper prepared for the International Water Demand Management Conference, June2004, Dead Sea, Jordan.
Moriasi, D.N. Arnold, J.G. Van Liew, M.W. Bingner, R.L. Harmel, R.D. and Veith, T.L. (2007). Model evaluation guidelines for systematic quantification of accuracy in watershed simulations. Transactions of the American Society of Agricultural and Biological Engineers, 50(3): pp. 885-900.
National Water Commission (2010). The impacts of water trading in the southern Murray–Darling Basin: an economic, social and environmental assessment, NWC, Canberra.
Notter, B., Hurni, H. Wiesmann, U. and Abbaspour, K.C. (2012). Modelling water provision as an ecosystem service in a large East African river basin. Hydrology and Earth System Science. 16: pp.69-86.
Nune, B., George, B.A., Teluguntla, P. and Western, A.W., (2012). Relating trends in stream flow to anthropogenic influences: a case study of the Himayat Sagar catchment, India. Hydrology and Earth System Sciences Discussions. 9: pp. 9295-9336.
NWDPRA. (1991). Watershed Areas Rainfed Agricultural Systems Approach (WARASA) Guidelines. New Delhi: National Watershed Development Programme (Rainfed Areas), Ministry of Agriculture, Department of Agriculture and Cooperation, Government of India.
Orr, H.G. and Carling, P.A. (2006). Hydro-Climatic and Land Use Changes in the River Lune Catchment, North West England, Implications for Catchment Management. River Research and Applications, 22(2006): pp. 239–255.
Panwar, P., Sharmistha, P., Bhatt, V.K. and Tiwari, A.K. (2012). Impact of conservation measures on hydrological behavior of small watersheds in the lower Shivaliks, Indian Journal of Soil Conservation, 40(3): 257-262.
Pathak, P., Kumar, A.C., Wani, S,P. and Sudi, R. (2013). Multiple impact of integrated watershed management in low rainfall semi-arid region: A case study from eastern Rajasthan, India. Journal of Water Resources and Protection, 5: pp. 27-36.
Patil, N.S. and Gosain, A.K. (2013). Geographical Information System (GIS) for water resources management. International Journal of Research in Engineering and Technology: pp. 417-422.
Perry, C., Steduto, P., Allen, R.G. and Burt, C.M. (2009). Increasing productivity in irrigated agriculture: agronomic constraints and hydrological realities. Agricultural Water Management, 96: 1517-1524.
Pollard, P., Devlin, M. and Holloway, D. (2001).Managing a complex river catchment: a case study on the River Almond. The Science of the Total Environment, 265(2001): pp. 343-357.
Prato, T. and Herath, G. (2007). Multiple-criteria decision analysis for integrated catchment management. Ecological Economics, 63(2007): pp.627-632.
Rama Mohan Rao, M.S., Batchelor, C. H., James, A. J., Nagaraja, R., Seeley, J. and Butterworth, J.A., (2003). Andhra Pradesh Rural Livelihoods Programme Water Audit Report. APRLP, Rajendranagar, Hyderabad, 500 030, India.
Ramakrishnan, D., Bandyopadhyay, A. and Kusuma, K.N. (2009). SCS-CN and GIS-based approach for identifying potential water harvesting sites in the Kali watershed, Mahi River Basin, India. Journal of Earth System Science. 118(4): pp. 355-368.
Rao, M.S.R., Batchelor, C.H., James, A.J., Nagaraja, R., Seeley, J. and Butterworth, J.A., (2003). Andhra Pradesh Rural Livelihoods Programme Water Audit Report. Hyderabad: Andhra Pradesh Rural Livelihoods Programme.
Ray, S. and Bijarnia, M. (2006). ‘Upstream vs. downstream: groundwater management and rainwater harvesting. Economic and Political Weekly. 10 July.
Reddy, V. R. (2012). Environment and Employment in Rural India: Moving Towards ‘Win-Win’ Strategies. Indian Journal of Labour Economics. 55(1): pp. 201-215.
Reddy, V. R., Reddy, Y.V.M. and Soussan, J. (2004). Water and Poverty: A Case of Watershed Development in Andhra Pradesh. Water Nepal. Vol. 11, No.1, August. 2003–Jan 2004.

121
Sahin, V. and Hall, M.J. (1996).The effects of afforestation and deforestation on water yields. Journal of Hydrology, 178: pp. 293-309.
Schreiner, B. and Van Koppen, B. (2002).Catchment Management Agencies for poverty eradication in South Africa. Physics and Chemistry of the Earth, 27(2002): pp. 969–976.
Seckler, D. (1996). The New Era of Water Resources Management: from “Dry” to “Wet” Water Savings, Research Report 1, pp. 6 and 16. International Water Management Institute.
Shah, T. (2007). Is irrigation water free? A reality check in the Indo-Gangetic Basin. World Development, 37(2): pp. 422-434.
Sharda, V.N. Kurothe, R.S., Sena, D.R., Pande, V.C. and Tiwari, S.P. (2006). Estimation of groundwater recharge from water storage structures in a semi-arid climate of India. Journal of Hydrology. 329: pp. 224-243.
Shiferaw, B., Bantilan, C., Wani, S. Sreedevi, T.K. and Rao, G.D.N. (2006). Collective Action for Integrated Community Watershed Management in Semi-Arid India: Analysis of Multiple Livelihood Impacts and the Drivers of Change, paper presented at the International Association of Agricultural Economists Conference, Gold Coast, Australia, August 16-18, 2006.
Singh, A.K., Ramamohan Rao, M.S., Batchelor, C.H. and Mukherjee, K. (2004). Impact of watershed development on traditional tank systems: A Case Study. Journal of Rural Development, 23(1): pp. 59-81.
Singh, R., Garg, K.K., Wani, S.P., Tewari, R.K. and Dhyani, S.K. (2014). Impact of water management interventions on hydrology and ecosystem service in Garhkundar-Dabar watershed of Bundelkhand region, Central India. Journal of Hydrology. 509: pp. 132-149.
Singh, S., James, A.J., Reddy, V. R., Marothia, D.K. and Gardener, J. (2012). IWRM and Local Level Planning in Rajasthan, Special Studies Series, Rajasthan Study 2, European Union State Partnership Programme, The European Union.
Singh, S., Reddy, V.R., Batchelor, C.H., Marothia, D.K., James, A.J. and Rathore, M.S. (2012) Regulating
Water Demand and Use in Rajasthan, Joint Review Mission Special Study (EuropeAid/125441/C/SER/IN). Delhi: European Union; London: ICF-GHK; Jaipur: Institute of Development Studies; Delhi: Infrastructure Professionals Enterprise Pvt. Ltd.
Sinha, F. and Sinha, S. (eds.). (1996). from indifference to active participation: six case studies of natural resource development through social organization. Gurgaon: EDA Rural Systems.
Smakhtin, V and Anputhas, M. (2006). An assessment of environmental flow requirements of Indian river basins. IWMI Research Report 107. Colombo: International Water management Institute 42p.
Syme, G., Reddy, V. R., Pavelik, P., Croke, B. and Ranjan, R. (2012). Confronting Scale in Watershed Development in India. Hydrogeology Journal. 20 (5): pp. 985-993.
Talati, J., Kumar, M. D. and Ravindranath, R. (2005). Local and Sub-Basin Level Impacts of Local Watershed Development Projects: Hydrological and Socio-economic Analysis of Two Sub-Basins of Narmada, Water Policy Research Highlight 15, IWMI-Tata Water Policy Research Program, Anand, Gujarat, India.
Tripathi, C.N. and Gosain, A.K. (2013). A comparative study on the performance of SWAT and the APEX model for simulating water yield in Dudhi micro watershed in Madhya Pradesh, India. International Journal of Recent Scientific Research. 4(4): pp. 371-375.
Tripathi, M.P., Panda, R.K. and Raghuwanshi, N.S. (2003). Identification and prioritisation of critical sub-watersheds for soil conservation management using the SWAT model. Biosystems Engineering. 84(3): pp. 365-379.
Turton, C., Birardar, N., Ramamurthy, V., Singh, J.P. and Misra, A.K. (1997). Opportunities and constraints for fodder development in rainfed areas of India. Developing linkages with smallholder farmers. Jhansi: Indian Grassland and Fodder Research Institute and London: Overseas Development Institute.
Verstraeten, G., Van Oost, K., Van Rompaey, A., Poesen, J. and Govers, G. (2002). Evaluating an integrated approach to catchment management to reduce soil loss and sediment pollution through modeling. Soil Use and Management, 19(2002): pp. 386-394.
References

Catchment Assessment and Planning for Watershed ManageMent: Volume II - Annexes122
Voinov, A. and Bousquet, F. (2010). Modelling with stakeholders. Environmental Modelling & Software. 25: pp. 1268-1281.
Wallace, J.S. and Batchelor, C.H. (1997) Managing Water Resources for Crop Production, Philosophical Transactions of the Royal Society, London. 352: pp. 937-947.
Warner, J.F. (2006). More Sustainable Participation? Multi-Stakeholder Platforms for Integrated Catchment Management. International Journal of Water Resources Development, 22(1): pp. 15-35.
Wheater, H.S. and Peach, D. (2004). Developing interdisciplinary science for integrated catchment management: the UK Lowland Catchment Research (LOCAR) programme. International Journal of Water Resources Development, 20(3): pp. 369-385.
Whitty, C. and Dercon, S. (2013). The Evidence Debate Continues: Chris Whitty and Stefan
Dercon Respond from DFID. People, Spaces, Deliberation. Available at http://blogs.worldbank.org/publicsphere
World Bank (2006). Managing Watershed Externalities in India. [pdf]. World Bank: Washington DC. Agriculture and Rural Development Sector Unit, South Asia Region, Discussion Paper Series, Report No. 1. Available at http://documents.worldbank.org/curated/en/2006/04/7047191/managing-watershed-externalities-india.
Yang, J., Reichert, P., Abbaspour, K.C., Xia, J. and Yang, H. (2008). Comparing uncertainty analysis techniques for a SWAT application to the Choahe Basin in China. Journal of Hydrology. 358: pp. 1-23.
Zekri, S. (2008). Using Economic Incentives and Regulations to reduce Seawater Intrusion in the Batinah Coastal area of Oman, Agricultural Water Management. 95(3), March.

