categories: the needs of coastal habitat and its restoration
TRANSCRIPT

APPLICATION OF TIDAL DATUMS AND HIGH WATER ANALYSES TO MARSH RESTORATION
Kristen A. Tronvig
Stephen K. Gill
Abstract Coastal engineers rely upon accurate tidal datum elevations to successfully restore marshes. The tidal datum elevations are determined relative to the present and future marsh surfaces by establishing a tide station with local benchmarks and referencing them to geodetic datums. Datum elevations are then referenced to the topographic and digital elevation models (DEMs) of the marsh. Analyses are performed on the high water distributions of frequency and duration of inundation. Long-term sea level variations are critical to understanding the long-term marsh stability especially in areas, such as Galveston Bay, where relative sea level rise is occurring at significant rates. These analyses assist with the proper engineering and design of the marshes as well as contribute to assessments on flora and fauna successes and/or failures.
Introduction
Coastal wetland loss is occurring at incredible rates and is caused by a combination of the consequences of climate and sea level change, as well as the pressures of increases in human population growth and development of the coasts (NOAA, 2000 and Douglas et al, 2001). It is essential that restoration projects be properly designed to consider critical factors such as the necessary requirements for successful vegetation growth, an environment that allows the target species to flourish, long-term stability of the habitat, and preservation of surrounding properties from significant events with adverse consequences. Applications of tidal datums beyond their traditional navigation purposes (Tidal Datums and Their Applications, 2001) have been explored and utilized, including the restoration of coastal habitats. Tidal datum elevations are determined relative to present and future marsh surfaces by establishing a water level station (for one year to capture seasonal effects) with local bench marks. The tidal datums are then referenced to specific 19-year National Tidal Datum Epochs (NTDEs) and are further linked to a geodetic benchmark network thus referencing them to geodetic datums (such as North American Vertical Datum of 1988 (NAVD88)). Digital Elevation Models (DEMs) of the different datum elevation relationships are produced. DEMs of tidal and geodetic datum (specifically, MHW and NAVD88, respectively) relationships are important for successful engineering and design of marsh restoration because they provide baseline information for mapping the marsh topography relative to the frequency and duration of inundation of the water level.

This paper will use the Qwuloolt marsh, WA as an example to illustrate the importance of tidal datums and high water analyses to marsh restoration.
Datums and Analyses
The tidal datum, Mean High Water (MHW) represents the average elevation of the high waters relative to the land. Therefore, it is important to know this reference elevation for the success of vegetation over time, for a target species to thrive, and for protection of surrounding properties from engineering changes. The Qwuloolt marsh site currently has three different critical elevations: 4 feet, 8 feet, and 12 feet, all relative to NAVD88. The present surface of the marsh is approximated at 4 feet; the existing levees are at 12 feet; and developments exist between the 8 foot and 12 foot elevations as well as just beyond the levees. The preliminary tidal datum, MHW, was calculated from four months of data (December 2000 - March 2001), based on the 1980 - 1998 epoch, to be 8.3 feet relative to NAVD88 which is higher than both the 4 foot and 8 foot elevations of the existing marsh site. Thus, if the existing levees are breached, at MHW, the existing marsh surface will be a pond, and some of the developments will be flooded. The estimated highest tide, based on high water comparisons with the Seattle tide station (the nearby long-term National Water Level Observation Network (NWLON) station), is 12.3 feet. The variations in relative mean sea level at Seattle, WA can be seen in Figure 1. The spike of high sea level in the early 1980's represents the 1983 el NiZo event, which was the event of the century. During such an extreme event, the water levels will rise above the existing levees and flood the surrounding properties. The U.S. Army Corps of Engineers (USACE) used this information in their �Qwuloolt/Poortinga Technical Report� (2001) to determine that the levees must be extended in upper reaches of the marsh to prevent flooding the neighboring developments. There are several high water analyses that are important for the engineering and design of marsh restoration. Because marsh vegetation is elevation sensitive, it is necessary to plan for the frequency of inundation, or the occurrence of high waters for different elevations above the marsh surface. A histogram of the observed high water elevations relative to NAVD88 can be seen in Figure 2. During the four months of data, the high tide reached 9.5 feet relative to NAVD88 about 60 times, and cumulatively, 80% of the high tides were 9.5 feet or less. All of the high tides were greater than 4 feet, and 50% were equal to or higher than 8 feet. Marsh restoration requires knowledge of tide variations beyond the time period of a one-year tide station deployment at a particular marsh. Thus, simultaneous comparisons of the distributions of high waters between short-term (in the marsh) and nearby long-term stations are performed to determine if long-term variations can be extended into the analyses at the local marsh (NOAA, 2001).

The characterization of seasonal variations as well as long-term sea level variations can be performed in this manner.
Figure 1. Relative sea level variations at Seattle, WA. The spike in the early 1980�s represents the 1983 el NiZo event. A comparison of the higher high water distributions between Seattle and Qwuloolt in Figure 3 shows that the distributions from the two stations are well correlated, suggesting that Seattle can be used to control Qwuloolt and that the longer data series from Seattle can be extrapolated to Qwuloolt. For example, Figure 4 shows a comparison of the distributions of higher high tides at Seattle broken down by season for 20 years (1980 - 2000). In this example, there is considerable difference in the distributions between the fall/winter months and the spring/summer months. Thus, seasonal variations at Qwuloolt can be expected to be similar to those at Seattle. USACE utilized the seasonal data analyses to input into their hydraulics model portion of the �Qwuloolt/Poortinga Technical Report� (2001).
Conclusion
The Qwuloolt marsh is an example of a site with surrounding levees that may be breached in several locations or removed entirely. The National Oceanic and Atmospheric Administration (NOAA) is also working on other types of marsh restoration projects such as Barren Island, which is a subsiding island in Chesapeake Bay that contains no levees or surrounding properties. Dredged

Figure 2. Frequency of high water inundation at Qwuloolt relative to NAVD88.
Figure 3. Simultaneous comparison of higher high waters from December 1, 2000 through March 31, 2001 between Qwuloolt and Seattle.
Comparison of Higher High Water Distributions
0
5
10
15
20
25
30
7
7.2
7.4
7.6
7.8 8
8.2
8.4
8.6
8.8 9
9.2
9.4
9.6
9.8 10
10.2
10.4
10.6
10.8 11
Elevation Relative to NAVD88 (feet)
Freq
uenc
y (c
ount
)
qwuloolt seattle

Figure 4. Seasonal analyses for higher high tides at Seattle from 1980 � 2000.
material from the channel is helping to stabilize it, active planting is occurring, and geotubes are in place to reduce coastal erosion. Due to the hydrodynamics of the location, wave and current data will be collected and analyzed along with tide data to assist with proper restoration of the island. A suite of additional analyses still needs to be developed, such as the impact of relative sea level rise. The average rate of global sea level rise is estimated at 1.6 to 2.1 mm/yr, yet local rates of sea level change is variable and is affected by the local rate of vertical land movement. For example, the trend is +7.2 mm/yr at Galveston, TX (Zervas, 2001). The long-term survival of coastal marshes is dependent upon the ability to maintain vertical accretion and sedimentation rates close to the local rates of relative mean sea level change (Lynch et al, 1989 and Bricker-Urso et al, 1989). Duration of inundation analyses are also important because flooding and drying cycles control the overall marsh ecosystem. Marsh stability relates to the tolerance of specific plant species and the complexity of the tidal hydrodynamics in relationship to the marsh surface and channels (Malamud-Roam, 2000). The frequency and duration of inundation during a major seasonal flood also affect the stability of a marsh. This paper has described a methodology for obtaining and analyzing vertical water level and geodetic information that should be performed when restoring coastal habitats. These emerging efforts within the National Ocean Service (NOS), along with internal and external partners, will assist in making a national
Comparison of Distributions by Season - for Seattle - Higher High Tides - 1980-2000
0
50
100
150
200
250
Bin
6.2
6.6 7
7.4
7.8
8.2
8.6 9
9.4
9.8
10.2
10.6
Elevation Relative to NAVD88(feet)
Freq
uenc
y (c
ount
)
january thru marchapril thru junejuly thru sepoctober thru dec

program in marsh restoration a reality, resulting in well planned and sustainable coastal habitats.
References Bricker-Urso, S., S.W. Nixon, J.K.Cochran, D.J.Hirschberg, and C. Hunt (1989). Accretion Rates and Sediment Accumulation in Rhode Island Salt Marshes. Estuaries, Vol. 12, No. 4, p. 300-317, December 1989. Douglas, B.C., M.S. Kearney, and S.P. Leatherman (2001). Sea Level Rise, History and Consequences. Academic Press. San Diego, CA-USA, pp 181-220. Lynch, J.C., J.R. Meriwether, B.A. McKee, F. Vera-Herrera, and R. R. Twilley (1989). Recent Accretion in Mangrove Ecosystems Based on 137Cs and 210Pb, Estuaries, Vol. 12. No. 4, p. 284-289, December 1989. Malamud-Roam, K.P. (2000). Tidal Regimes and Tide Marsh Hydroperiod in the San Francisco Estuary: Theory and Implications for Ecological Restoration., Ph.D. Dissertation, University of California, Berkeley, CA, p. 87-237, Fall 2000. NOAA (2000). The Potential Consequences of Climate Variability and Change on Coastal Areas and Marine Resources. NOAA�s Coastal Ocean Program Decision Analysis Series Number #21. National Oceanic and Atmospheric Administration, Silver Spring, MD-USA. NOAA (2001). Tidal Datums and Their Applications. Special Publication No. CO-OPS 1. National Oceanic and Atmospheric Administration, Silver Spring, MD - USA. U.S. Army Corps of Engineers (2001). Qwuloolt/Portinga Technical Report. Prepared for Tulalip Tribes of Washington. Draft Document December 7, 2001. U.S. Army Corps of Engineers Seattle District, Seattle, WA-USA. Zervas, C. (2001). Sea Level Variations of the United States 1854-1999, NOAA Technical Report NOS CO-OPS 36, National Oceanic and Atmospheric Administration, National Ocean Service, Silver Spring, MD, July 2001, 185p. Kristen A. Tronvig NOAA/National Ocean Service Center for Operational Oceanographic Products and Services 1305 East West Highway � N/OPS, Stn 6643 Silver Spring, MD 20910, USA Ph: (301) 713-2981 ext. 200 Fax: (301) 713-4392 Email: [email protected]
SAN FRANCISCO BAY HABITAT RESTORATION: THE ROLE OF SCIENCE IN PUBLIC POLICY
Katie M. Wood
The need for a strong linkage between science and public policy in aiding coastal management decisions is profound. This need is especially critical in decisions pertaining to where and how habitats should be restored. In San Fran-cisco Bay (Bay) nearly 80% of historic tidal marsh habitat has been lost due to diking and filling. Currently, much public and private support exists to reverse the trend and restore the Bay�s habitats. Recognizing the need for a collaborative decision-making structure pertaining to where, what kind and how much habitat restoration should occur in the wetlands and related habitats surrounding San Francisco Bay, the Habitat Goals Project was initiated in 1995 and involved more than 100 participants representing local, state, and federal agencies, aca-demia and the private sector. In 1999 the results of the four year collaborative process, the �Baylands Ecosystem Habitat Goals report� (Habitat Goals Report), was released in an effort to recommend the kinds, amounts and distribution of wetlands and related habitats that are needed to sustain diverse and healthy communities of fish and wildlife resources in the San Francisco Bay Area. In other words, the Habitat Goals Report provides a scientifically-founded vision and template for habitat restoration around San Francisco Bay. Region-wide, the Habitat Goals Report outlines seven major habitat changes necessary to restore a healthy Bay-ecosystem. They include: (1) many large patches of tidal marsh connected by corridors to enable the movement of small mammals and marsh-dependent birds; (2) several large complexes of salt ponds managed for shorebirds and waterfowl; (3) extensive areas of managed seasonal ponds; (4) large expanses of managed marsh; (5) continuous corridors of ripar-ian vegetation along the Bay�s tributary streams; (6) restored beaches, natural salt ponds, and other unique habitats; and (7) intact patches of adjacent habitats, including grasslands, seasonal wetlands, and forests.
As a participant in the Habitat Goals Project, the San Francisco Bay Conserva-tion and Development Commission (a California coastal zone management agency established in 1965 to prevent unnecessary filling of San Francisco Bay) has embraced the value of science in guiding restoration decisions in the coastal zone. For example, the update of three San Francisco Bay Plan (Bay Plan) pol-icy sections, currently underway, which pertain to: (1) fish, other aquatic organ-isms and wildlife; (2) tidal marshes and tidal flats; and (3) a new policy section on subtidal areas, require both coordination with many of the resource agencies which participated in the Habitat Goals Project, as well as the requirement that the Commission be guided by the restoration recommendations outlined in the Habitat Goals Report.

Furthermore, scientific insight has played a particularly significant role in help-ing to shape a new Bay Plan policy section on subtidal areas of the Bay. To date, no section has existed in the Bay Plan. However, with the aid of a team of scien-tists with expertise on San Francisco Bay subtidal habitat (open water and ben-thic communities), brought together by Commission staff for a one-day forum to discuss subtidal areas, a set of new policies was crafted for consideration by the Commission in spring 2002.
Commission staff also incorporated scientific knowledge about the Bay into its policy update process by inviting scientists to discuss Bay-related topics with the Commission early-on in the public hearing process. In this way Commis-sioners learned about the Bay�s habitats and its associated fish, other aquatic organisms and wildlife, and had an opportunity to ask questions of the scientists, prior to considering proposed Bay Plan policy language changes at upcoming meetings.
Lessons learned regarding the integration of science and public policy in an ef-fort to better understand habitat complexities and the need for restoration in-clude:
(1) Science is absolutely necessary to the formulation of sound public pol-icy regarding habitat characterization and possible restoration;
(2) Collaboration amongst scientists and regulators creates unforeseen and creative conclusions;
(3) Longer lasting and more credible policies come from the integration of science with public policy;
(4) Coastal zone management agencies play an important role in fostering scientific understanding of coastal resources;
(5) Inviting scientists to speak before decision-making bodies, such as the Commission, creates greater support and understanding when the time comes to consider policy changes; and
(6) There is always room to learn more and continue to update plans based on new scientific understanding.
Katie M. Wood San Francisco Bay Conservation and Development Commission 50 California Street, Suite 2600 San Francisco, CA 94111, USA Ph: (415) 352-3642 Fax: (415) 352-3606 Email: [email protected]

BALANCING COASTAL PUBLIC ACCESS AND WILDLIFE HABITAT NEEDS
Caitlin Sweeney, San Francisco Bay Conservation and Development
Commission The increase in human demand for water-oriented experiences and shoreline development, concurrent with shrinking wildlife habitat area, raises the potential for interaction between the public and wildlife along the shoreline. Several issues arise when balancing these two needs. Does public access adversely affect wildlife and, if so, how? Which types of access affect which species? Can public access be provided near habitats of sensitive species? If so, how should access should be sited, designed, constructed, and managed to avoid or minimize habitat degradation and impacts on the species? While these issues are often raised to resource managers and coastal regulatory agencies during the deliberation process, the information may not be readily available. Moreover, as more state and local governments and special districts (park, recreation and open space districts) require public access as part of their shoreline projects and planning permit authority, better information is needed to guide public policy decisions regarding human interaction with wildlife. The San Francisco Bay Conservation and Development Commission (BCDC) has a twofold mission: to protect the Bay and its wildlife resources, and to provide maximum feasible public access to and along the Bay. Over the last 30 years, BCDC’s policies on public access have evolved from the fundamental goal of creating and expanding public access, to the development of more complex policies that attempt to balance public access needs with wildlife and habitat protection and enhancement. However, in the many years since BCDC’s policies were created, available information on the effects of public access on wildlife has increased and concern over this issue has grown. To address these concerns, the BCDC embarked upon an in-depth two-year research and policy development process called the Public Access and Wildlife Compatibility Policy Development Project. The Project encompassed various components including a survey of natural resource area and park and recreation managers. The goals of the survey were to gather observational information on recreational effects on wildlife, and to document the use of specific siting, design and management strategies to avoid or minimize potential adverse effects on wildlife. The selected survey participants manage local, state, and federal reserves, parks, refuges, open spaces, recreation areas, and wildlife management areas in Great Lakes and coastal states nationwide. To ensure public participation, a broadly representative Policy Advisory Committee was formed. The Policy Advisory Committee provided a forum for public input and debate and helped facilitate consensus among regional public

agencies and non-profit organizations on policy recommendations. The Committee was comprised of individuals representing a wide range of professional fields, geographic areas and public interests, including biologists (consultant, academic and agency), resource managers, regional park district employees, environmental planners, landscape architects, and non-governmental organization activists, including both recreation and wildlife protection advocates. The Committee met over the course of one year and was instrumental in contributing, analyzing and assessing information from various sources, and formulating conclusions and policy recommendations. Overall conclusions from the Public Access and Wildlife Compatibility project included: • Access to the Bay allows the public to discover, experience and appreciate
the Bay’s natural resources and can foster public support for Bay resource protection.
• Studies indicate that public access may have immediate effects on wildlife (including flushing, increased stress, interrupted foraging, or nest abandonment) and may result in adverse long-term population and species effects.
• Different kinds of disturbances have different effects on different species – effects are context dependent. Accurate characterization of site, habitat and wildlife conditions, and of likely human activities, provides information critical to understanding potential effects on wildlife.
• Potential adverse effects from public access may be avoided or minimized through the employment of siting, design and management strategies, such as education and outreach programs, activity type and user behavior restrictions, buffers, and periodic public access closures.
• Providing diverse and satisfying public access opportunities can reduce the creation of informal access routes, which will decrease interaction between humans and wildlife, habitat fragmentation, and vegetation trampling and erosion. Formal public access also provides for more predictable human actions, which may increase the ability of wildlife to adjust to human use.
• There is a need for more scientific studies on the types and severity of effects of specific human activities on wildlife. More studies are also needed on the effects of siting, design and management strategies on the type and severity of impacts of human activities on wildlife.
The Public Access and Wildlife Compatibility Project culminated in the revision and adoption of the BCDC’s San Francisco Bay Plan public access findings and policies. The revised findings and policies better reflect current knowledge on the interactions of public access and wildlife and provide more detailed policy guidance on providing maximum feasible public access while protecting wildlife from significant adverse effects. As a component of the revised findings and policies, BCDC staff is currently updating its advisory, Public Access Design Guidelines to include information on specific siting, design and management strategies to avoid or minimize adverse effects of public access on wildlife.

Caitlin Sweeney San Francisco Bay Conservation and Development Commission 50 California Street, Suite 2600 San Francisco, CA 94111 Ph: (415) 352-3643 Fax: (415) 352-3606 Email: [email protected]

ANOMALOUS TRENDS IN A META-ANALYSIS OF THE HYTOPLANKTON-BASED FOOD WEBS OF GALVESTON BAY By L. James Lester and Lisa A. Gonzalez The integrity of biological communities and the abundance of indicator species are measures of the environmental health of water bodies. Communities can be represented as food webs with abundance or biomass partitioned into trophic levels and species. Two categories of major food webs exist in Galveston Bay, differentiated by whether they are based on living microalgae or on detritus. Phytoplankton-based food webs are more associated with open water habitats and less with fringing emergent marshes. The top predators of open-water food webs are spotted seatrout and piscivorous birds. Monitoring data has been collected for at least 25 years on the biomass of phytoplankton (measured as chlorophyll-a), the abundance of fish throughout the year, and the abundance of nesting colonial water birds. Over the period of the dataset, concentrations of nutrients and chlorophyll-a have declined. Conversely, the abundance of spotted seatrout and prey fish species has risen. The number of open water feeding-birds counted in nesting colonies has increased. There is no long-term dataset on zooplankton abundance in Galveston Bay to connect primary production to higher trophic levels. We conclude that energy flow through all the trophic levels of this food web has increased to support greater abundance of predators. The trend in community health, based on indicator species and the integrity of higher trophic levels, appears to be uncoupled from the decline in chlorophyll-a and nutrients. Introduction Estuarine ecosystems provide many valuable services including food production, wildlife habitat, storm and flood buffering, and pollution assimilation. These valuable services are threatened by increasing human population density, industrial development, and contamination transported from inland watersheds by tributaries. Galveston Bay is particularly vulnerable with its very large human population, more than 100 petrochemical facilities, large commercial fleets of shrimp trawlers and oyster luggers, many recreational fishers and boaters, and many commercial ships and barges.
Environmental management of the Galveston Bay system is accomplished by at least four state agencies: the Texas Natural Resource Conservation Commission (TNRCC), the Texas Parks and Wildlife Department (TPWD), the Texas Department of Health (TDH) and the Texas General Land Office (GLO). These agencies employ monitoring programs to assess the status and trends of resources or contaminants they are charged to manage. The regular collection and maintenance of water and sediment quality monitoring data began in the late 1960�s while the systematic monitoring of fisheries resources started in the 1970�s. These datasets form the basis of many management decisions

relating to the Galveston Bay estuary. We have studied these datasets to estimate the health of the bay ecosystems. This subtropical bay system has two fundamental energy input pathways. Sunlight and carbon dioxide enter the system�s food web through photosynthesis while detritus enters via terrestrial and wetland ecosystems located within the watershed. Sheridan et al. (1989) estimated that phytoplankton in Galveston Bay produce an amount of organic material on the same order of magnitude as brackish marsh. Highly productive submerged aquatic vegetation produce considerably less organic matter due to their relatively low aerial coverage resulting from habitat loss over the past 40 years. Similarly it is estimated that 30% of the estuarine marsh in Galveston Bay has been lost in the same time period. Sheridan et al. (1989) found that there are at least 132 species of phytoplankton in Upper Galveston and Trinity Bays. They further concluded that many of these species of phytoplankton enter into Galveston Bay through river inputs. Since the beginning of water quality monitoring, chlorophyll-a concentrations measured in Galveston Bay and its tributaries have declined significantly. The concomitant declines of seagrass, phytoplankton and brackish marsh suggest that energy flows to and standing crops of higher trophic level animals should decline. In this paper, we investigate the relationships among chlorophyll-a as a measure of algal standing crop, potentially limiting nutrients and the abundance of higher trophic level animals that could be dependent on these primary producers. Phytoplankton density and plant growth are usually limited by the availability of nitrogen, phosphorus or sunlight. In most coastal estuaries, nitrogen is limiting and, in most freshwater ecosystems, phosphorus is limiting (Howarth, 1988). In a Massachusetts estuary the shift from phosphorus to nitrogen limitation occurred at about 10 ppt (Tomasky and Valiela, 1995). In some cases, levels of suspended solids and changes in light attenuation have been the primary causal factor in changes of chlorophyll-a concentration (Stanley, 1993; Cabecadas et al., 1999; Caraco et al., 1997). The productivity of phytoplankton and the other primary producers can exhibit negative correlations as a result of nutrient or turbidity changes. In some estuaries, increasing nitrogen enhances growth of fringing marsh, which in turn decreases chlorophyll-a concentrations in water (Callaway et al., 1995). In other systems, increasing nitrogen loading increases algal growth and decreases seagrass growth (Lyons et al., 1995). There can also be negative correlations in abundance between primary producers and herbivores. Several studies have reported declines in chlorophyll-a concentrations as a result of increased density of zebra mussels or Asian clams (Caraco et al., 1997; Bastviken, 1998). The decline in chlorophyll-a in Galveston Bay was documented in 1992 (GBNEP, 1994; Ward and Armstrong, 1992). A comprehensive survey of oyster abundance in the bay suggested a significant increase in the number and size of reefs over 20 years (Powell et al. 1994). Powell (1993) predicted that the decline in chlorophyll-a was a harbinger for collapse of the phytoplankton food web. He attributed the decline in phytoplankton to a reduction in nutrient input as a result

of dams and reservoirs on the Trinity River and better water treatment. Others have suggested that chlorophyll-a is returning to pre-pollution/pre-settlement values as result of improved water treatment. The phytoplankton-dependent food web in Galveston Bay contains various species of planktivorous fish. We will employ the abundance of menhaden and striped mullet as representative of this trophic level. Data is used for one representative of piscivorous fish that would prey on these herbivores, the spotted seatrout. Also, data on the abundance of piscivorous birds is employed because several species are very dependent on small planktivorous fish or zooplankton. Terns and skimmers feed on small planktivorous fish in open water. We will examine the relationships between chlorophyll a and nutrients, total suspended solids, herbivore abundance and predator abundance using data collected by environmental agencies for monitoring. There are two questions applied to this data. Does the available monitoring data on nutrients provide a necessary and sufficient explanation for the decline in chlorophyll-a concentrations? Is there compelling evidence that this decline in chlorophyll-a has impacted the abundance of animals at higher trophic levels in the food web? Methods
Data for analysis of water quality parameters was obtained from the TNRCC Surface Water Quality Program. Data was selected for five storet codes corresponding to chlorophyll-a (32211), total phosphorus (00665), ammonia-nitrogen (00610), nitrate-nitrite-nitrogen (00630), and total suspended solids (00530). Only those sampling stations identified as the terminal station of a tributary or located in a major sub bay were selected. After screening for location, there were only three sampling stations from which this data had been collected for the 30-year period. These were near the mouth of the Trinity River, in the Houston Ship Channel near its entry to the San Jacinto River/Buffalo Bayou segment, and in the lower reaches of Chocolate Bayou near Chocolate Bay. At these sites water from major tributaries enters the bay system. Concentrations of nutrients and contaminants at these sites are indicative of the total loadings to Galveston Bay. The methodology for determining the concentration of nitrate-nitrite was changed in the 1990�s. The results are not consistent over the time period; therefore we omitted that parameter. Data for the abundance of two fish species, Gulf menhaden (Brevoortia petronus) and spotted seatrout (Cynoscion nebulosus), was obtained from the TPWD. The data was collected monthly at random locations over 19 years with shrimp trawls and over 26 years with gill nets. Information on the length of time the gear fished permitted calculation of catch per unit effort (CPUE) expressed as number of fish per hour. TPWD has modified the methods of capture only slightly over this time period. The CPUE values are averaged annually over sites in the entire bay system for graphical representation. Counts of colonial nesting waterbirds were obtained from the U.S. Fish and Wildlife Service for the period from 1973 to 2000. The database included

surveys of the entire Texas coast, but only observations made in one of the five counties surrounding the bay were included. Of the birds that prey on small, possibly planktivorous fish, three species of tern were chosen for inclusion: Caspian tern (Sterna caspia), royal tern (Sterna maxima) and sandwich tern (Sterna sandvicensis). The estimated number of nesting pairs of each of these species at all colonies surveyed in the five counties around Galveston Bay were summed annually and graphed.
Figure 1. Chlorophyll-a concentrations in Galveston Bay, 1972-2001 Results Figure 1 shows the annual average concentration and a cubic trend line of chlorophyll-a concentrations (in ug/l) from 1972 to 2001 at sampling stations monitoring major inflows to Galveston Bay. Figure 2 shows the annual averages of phosphorus (in mg/l) and Figure 3 of ammonia (mg/l) at the same sampling stations over the same period with a cubic trend line superimposed. The trend lines are all negative and all show an initial peak in the mid 1970�s. The pattern of decline is most similar between chlorophyll-a and phosphorus. Chlorophyll shows a continuous declining trend to 2001, as does phosphorus. Ammonia exhibits a rapid fall in the late 1970�s and a very slow decline since 1980. However, when parameter values from the same water samples are analyzed by correlation, the coefficient between chlorophyll-a and ammonia is 0.10 (n.s.) and the correlation coefficient of chlorophyll-a and phosphorus is also 0.10 (n.s.).

Figure 2. Total Phosphorous concentrations in Galveston Bay, 1972-2001
Figure 3. Ammonia-nitrogen concentrations in Galveston Bay, 1972-2001
Another form of nutrient entering the bay at these sampling stations is particulate organic matter. Unfortunately there is no long-term collection of data on the organic carbon content of particulate matter flowing into the bay. There is long-term data on total suspended solids (TSS) from the three sample sites at which the chlorophyll-a data shown in Figure 1 has been collected. TSS could be a cause of light attenuation resulting in a decline in chlorophyll concentration. As demonstrated in Figure 4, there is no compensatory increase in the loading of suspended solids as chlorophyll-a has declined. TSS and chlorophyll-a measured from the same water sample have a correlation coefficient close to zero.

Figure 4. Total suspended solids concentrations in Galveston Bay,
1972-2001
Menhaden, an abundant species of planktivorous fish, was examined for correspondence to the declining trend of chlorophyll-a and nutrients. The TPWD data obtained by otter trawl begins in 1982. The cubic trend line of annual average catch per unit effort of menhaden collected by trawl shown in Figure 5 rises from 1982 to 1993 then declines. One of the top predators in the Galveston Bay food web is the spotted seatrout. The collection method best suited to assessing the abundance of adult spotted seatrout is the gill net. The annual average CPUE of gill net for spotted seatrout is relatively stable from 1975 to 1989 and then rises through the 1990�s as shown in Figure 6 by the cubic trend line. Caspian tern, royal tern and sandwich tern are dependent on small fish captured in open water and have been monitored since 1973 in the annual survey of abundance of colonial nesting waterbirds. The abundance of nesting pairs of these species is shown in Figure 7. Royal terns show an erratic abundance pattern for nesting pairs during the 1970�s and 1980�s followed by a long rise and a peak in 1995. The increase in abundance during the early 1990�s is inconsistent with a trend of decreasing chlorophyll-a. Sandwich terns have a similar trend of increasing abundance of nesting pairs during the 1990�s. Comparison of the trend lines of nesting terns and chlorophyll-a demonstrate no apparent relationship.

Figure 4. Annual average CPUE of Gulf menhaden collected by otter trawl in Galveston Bay, 1982-1993
Figure 5. Annual average CPUE of spotted seatrout collected by gill net in
Galveston Bay, 1975-1989

Figure 6. Number of nesting pairs of Caspian, royal and sandwich terns observed in
Galveston Bay, 1973-2000
Discussion We make the assumption that concentration of chlorophyll-a is a reasonable estimator of phytoplankton standing biomass. There is no evidence to suggest any alternative. There is a further assumption that the algal population in Galveston Bay is likely limited by nitrogen or phosphorus. There are many reports of algal standing crop being affected by increase or decrease of a limiting nutrient. The long-term trend of loadings of nutrients, algae and suspended particles is declining. The usual relationship between chlorophyll-a, nutrients and algal abundance predicts that Galveston Bay should have a declining algal biomass. However, there is no significant correlation between chlorophyll-a and ammonia, phosphorus or nitrogen in the dataset we employed. There is no indication of any compensatory inflow of particulate matter from the major tributaries. We cannot demonstrate a dependence of algal abundance on the usual limiting nutrients, nor can the increase in consumer organisms be associated with nutrient loadings from major tributaries. If as we assume there has been a decline in algal standing crop, then the biomass of consumers dependent on phytoplankton should decline. While we have not analyzed the biomass of consumer populations, we have examined the trend in abundance as measured by CPUE of fish species monitored by regular random sampling. The species of planktivorous fish, Gulf menhaden, exhibits a trend of increasing CPUE that is inconsistent with the trend in chlorophyll-a. There is no indication that herbivorous fish have been impacted by declining food resources.

If the impact on lower trophic levels is spread among species and therefore undetectable, one would still expect to detect an impact of lower energy inputs at top trophic levels. Spotted seatrout, one of the top predators in Galveston Bay, does not conform to this expectation and shows a strongly positive abundance trend over the last ten years. Waterbird abundance is thought to be a good indicator of the environmental health of an estuary because they are readily observed and sensitive to disturbance. However, of the three species analyzed, none exhibits a long-term decline in abundance. All three species are trophically dependent on small fish, which are in turn dependent on plankton abundance. The patterns of change in abundance of royal and sandwich terns show similarities in their increases, but are apparently independent of the declines of nutrients and chlorophyll-a recorded in the water quality data. We have found no evidence of a cascading trophic effect from the decline in nutrients, chlorophyll-a and TSS loadings to Galveston Bay. Perhaps the limiting nutrient for the phytoplankton in this bay has not been monitored or the relationship is multivariate. More puzzling is the apparent absence of any impact at higher trophic levels from this decline in nutrient loading. There is no indication that the decline in nutrients, and probably algae, has impacted the abundance of any monitored consumer in the food web connected to phytoplankton. Gulf menhaden show increased abundance during periods of nutrient and chlorophyll-a decrease. The increase in this key prey species is consistent with an increase in CPUE of spotted seatrout by gill net. Similarly abundance of terns in nesting colonies shows an annual abundance pattern that bears no correlation to the trend in chlorophyll-a. If higher trophic levels are showing increasing standing crop then additional energy must be entering the food web from some source. There are three major types of primary producers in the Galveston Bay system: microalgae (phytoplankton are examined here), salt marsh and seagrass. Salt marsh has declined in the Galveston Bay system over recent history. Recent estimates set the loss at 30,000 acres over the last 60 years (GBEP, 2002). Seagrass beds have been lost from most of the bay since the 1950�s. They are currently limited to some small beds in Trinity and West Bay and extensive beds in Christmas Bay (Pulich and White 1991). No information exists on any trend in abundance of benthic microalgae. Thus there is no evidence that loss of phytoplankton has been compensated by increase of other primary producers. The biomass increases in consumer species are more likely associated with an increase in energy from the detritivorous component of the food web. Sheridan at al. (1989) suggested that phytoplankton production in Galveston Bay may not be as important as the emergent marsh detritus pathway. Salt marsh is considered to be the largest contributor of detritus to the bay, but other sources are possible. There is evidence that erosion of sediment from salt marsh leads to resuspension of organic material and contributes to increased biomass in estuarine systems. This contribution of energy appears to be the most probable explanation of the disconnection between declining nutrient loadings and rising consumer abundance.

References Bastviken, D.T.E., N.F. Caraco and J. Cole. 1998. Experimental measurements
of zebra mussel (Dreissena polymorpha) impacts on phytoplankton community. Freshwater Biology, 39: 375-386.
Cabecadas, G., M. Nogueira and M.J. Borgueira. 1999. Nutrient dynamics and productivity in three European estuaries. Marine Pollution Bulletin. 38(12): 1092-1096. Callaway, D.W., I. Valiela, K. Foreman and L. A. Soucy. 1995. Effects of
nitrogen loading and salt marsh habitat on gross primary production and chlorophyll a in estuaries of Waquoit Bay. Biological Bulletin, 189:254-255
Caraco, N.F., J.J. Cole, P.A. Raymond, D.L. Strayer, M.L. Pace, S.E.G. Findlay and D.T. Fischer. 1997. Zebra mussel invasion in a large, turbid river: hytoplankton response to increased grazing. Ecology, 78:588-602.
[GBEP] Galveston Bay Estuary Program. 2002. The State of the Bay: A Characterization of the Galveston Bay Ecosystem, 2nd Edition. L.J. Lester and L. Gonzalez (Eds.). Galveston Bay Estuary Program. Webster, Texas. Forthcoming.
[GBNEP] Galveston Bay National Estuary Program. 1994. The State of the Bay: A Characterization of the Galveston Bay Ecosystem. F.S. Shipley and R.W. Kiesling (Eds.). Galveston Bay National Estuary Program Publication. Webster, Texas.
Howarth, R.W. 1988. Nutrient limitation of net primary production in marine ecosystems. Annual Review of Ecology, 19:89-110. Lyons, J., J. Ahern, J. McClelland and I. Valiela. 1995. Macrophyte abundances
in Waquoit Bay estuaries subject to different nutrient loads and the potential role of fringing salt marsh in groundwater nitrogen interception. Biological Bulletin, 189: 255-256.
Powell, E.N. 1993. Status and trends analysis of oyster reef habitat in Galveston Bay. pp. 207-209. In. Jensen, R., R. W. Kiesling, and F. S. Shipley, editors. Proceedings of the second State of the Bay symposium; 1993 Feb. 4-6; Galveston Bay National Estuary Program Publication GBNEP-23. Webster, Texas.
Powell, E.N., J. Song, and M. Ellis. 1994. The status of oyster reefs in Galveston Bay, Texas. Galveston Bay National Estuary Program Publication BNEP-37. Webster, Texas.
Pulich, W.M., Jr., and W.A. White. 1991. Decline of submerged vegetation in the Galveston Bay system: Chronology and relationship to physical processes. Journal of Coastal Research 7:1125-1138. Sheridan, P.F., R.D. Slack, S.M. Ray, L.W McKinney, E.F. Klima, and T.R.
Calnan. 1989. Biological components of Galveston Bay. Galveston Bay: Issues, resources, status and management. National Oceanic and Atmospheric Administration Estuary-of-the-Month Seminar Series No. 13. Washington, D. C. p 23-51.

Stanley, D.W. 1993. Long-term trends in Pamlico River estuary nutrients, chlorophyll, dissolved oxygen, and watershed nutrient production. Water Resources Research, 29: 2651-2662.
Tomasky, G. and I. Valiela. 1995. Nutrient limitation of phytoplankton growth in Waquoit Bay, Massachusetts. Biological Bulletin, 189:257-258. Ward, G.H. and N.E. Armstrong. 1992. Ambient water and sediment quality of Galveston Bay: present status and historical trends. Galveston Bay National Estuary Program Publication GBNEP-22. Webster, Texas. L. James Lester Director Environmental Institute of Houston University of Houston-Clear Lake 2700 Bay Area Blvd., Box 540 Houston, Texas 77058 Ph: (281) 283-3950 Fax: (281) 283-3044 Email: [email protected]

A PRELIMINARY TMDL STUDY ON DICKINSON BAYOU, TEXAS
Roy Drinnen and Jean Wright
The Texas Natural Resource Conservation Commission (TNRCC) hasdesignated Dickinson Bayou as having two (2) segments for the purposes ofwater quality management and designation of site-specific standards. Site-specific Uses and Criteria have also been assigned to both segments. Thesesegments, and all designated segments in the State of Texas, are inventoried inthe Clean Water Act, Section 305(b) Report. If a segment does not or is notexpected to meet the applicable water quality standards, the TNRCC places thatsegment on the federally required Clean Water Act, Section 303(d) List ofImpaired Water Bodies in the State of Texas. Dickinson Bayou is one of thewater bodies on this list for low dissolved oxygen and re-occurring highbacterial contamination.
Dickinson Bayou�s tidal segment is classified as �High Aquatic Life Use� andthe upstream segment is classified as �Intermediate Aquatic Life Use.�Occasionally, Dickinson Bayou has failed to meet the saltwater required averagedissolved oxygen (DO) concentration of 4.0 mg/l and the minimum DOrequirement of 3.0 mg/l. For the upstream freshwater segment, the mean DOconcentration must be greater than or equal to 4.0 mg/l to meet its �IntermediateAquatic Life Use� classification. Though not an annual event, large fish killscommonly associated with menhaden and fish kills involving multiple speciesand/or more desirable sport fish have been known to occur on Dickinson Bayou.Both Dickinson Bayou segments have also been designated as �ContactRecreation� waters. Elevated bacterial concentrations have prevented the bayoufrom meeting its contact recreation use indicating a potential public health riskas well as an excess nutrient loading concern.
In response to these concerns and in keeping with the goal of the Clean RiversProgram, which is to maintain or improve the quality of water resources withineach river basin in Texas, Galveston County Health District (GCHD) hasteamed up with the Houston-Galveston Area Council (HGAC), U.S. GeologicalSurvey (USGS), and TNRCC to conduct a pre-Total Maximum Daily Load(TMDL) analysis study on Dickinson Bayou. TMDL is the total amount of asubstance that a water body can assimilate and still meet the established surfacewater quality standards. This study looks at what is happening within the watercolumn of the bayou over a period of time at several locations throughout thetidal segment. In-situ monitors and intensive water sampling were used tocharacterize how the DO fluctuated throughout the tidal segment in relation tohow various chemical parameters changes over time. Intensive bacteriologicalsampling was also conducted at the same time to determine how bacteria loadingvaries along or within the bayou and to determine if bacteria has any

relationship to other testing parameters. TNRCC will use the gathered data toconduct modeling on the bayou to determine how to proceed with completingthe TMDL process required for the bayou. Dickinson Bayou is located insoutheast Texas in the San Jacinto-Brazos Coastal Basin. The bayou originatesnorth of the City of Alvin in Brazoria County and flows east through GalvestonCounty for approximately 24 miles where it terminates in Dickinson Bay, one ofthe secondary bays of the Galveston Bay system. Dickinson Bayou is dividedinto two segments by the TNRCC. The above tidal reach (Segment 1104) beginsupstream of Highway 35 in Alvin, Texas, and ends 1.2 miles downstream of FM51,7 which is west of Cemetery Road. The tidally influenced reach (Segment1103) begins 1.2 miles downstream of FM 517 and ends at the confluence withDickinson Bay. The channel and flow characteristics of the two segments aremarkedly different. The above tidal segment is a relatively shallow stream withmoving water. Its depth varies from shallow riffles to pools 1-3 feet deep. Thetidal reach is a very sluggish body of water dominated by a deep, v-shapedchannel varying from 10-15 feet in depth. A channel was dredged fromDickinson Bay upstream to the railroad trestle near Highway 3 (¼ miledownstream) approximately twenty-five to thirty-five (25-35) years ago toaccommodate fishing vessel and barge traffic on Dickinson Bayou. GCHD alsofound the average bayou depth from the trestle upstream to Cemetery Road to beapproximately twelve (12) feet deep.
Between 1995-97, the USGS found the two segments to have different streamside vegetation as well. Investigators characterized the upstream segment ashaving dense riparian vegetation with limited sunlight exposure, whereasvegetation in the tidal segment is less dense, allowing more exposure tosunlight. Watershed topography gently slopes toward the bayou from 50 feetabove sea level in the west to sea level at the confluence with Dickinson Bay inthe east.
Due to its impairments, Dickinson Bayou has been repeatedly studied by stateand federal agencies. Its size, proximity to Houston and accessibility also makesit a prime location for research. Intensive studies of Dickinson Bayou wereconducted by the Texas Department of Water Resources (a predecessor agencyof the TNRCC) in 1980 and 1982 and a waste-load evaluation was completed inJune of 1985. The USGS, in cooperation with the Houston-Galveston AreaCouncil (HGAC) and TNRCC, conducted a study titled Nutrient Loading andSelected Water Quality and Biological Characteristics of Dickinson BayouNear Houston, Texas, 1995-97 and completed the report in 1998. In addition tothe loading from agricultural and urbanized activities, Dickinson Bayou receivesor has received wastewater discharges from several permitted sources for manyyears. Dissolved oxygen has continuously been one of the limiting factors in theloading equations developed by the regulatory agencies who issue dischargepermits. In addition, bacterial concentrations have repeatedly been high over theyears.

As this area�s Clean Rivers Program river authority, HGAC facilitated apartnership between GCHD, USGS and TNRCC to address the concerns ofDickinson Bayou. This partnership brought together the resources andspecialties of the four (4) agencies to collect data for the purposes ofcharacterizing and understanding how Dickinson Bayou�s natural processeswork over time. First, HGAC purchased the majority of the in-situ monitorswhich were used to collect the continuous water quality data, plus they providedlogistical and technical support. Second, GCHD was responsible for acquiring,maintaining and deploying the buoys and in-situ monitors as well as collectingthe water quality field data and water samples. A majority, but not all, of thesamples were analyzed at GCHD�s Public Health Lab. Third, TNRCC providedtechnical support, one field person to help collect water samples, and laboratorysupport to perform the three (3) analyses not conducted by GCHD. TNRCC�sfield investigator delivered and maintained the chain-of-custody requirements ofthe Quality Assurance Project Plan (QAPP). Lastly, USGS supplied technicalsupport, operated a continuous monitoring station at the Highway 3 bridge,conducted monthly flow measurements on the bayou while water samples werebeing collected, and provided a separate crew to perform habitat and biologicalcharacterizations of the bayou and several tributaries.
After the preliminary land and water reconnaissance, plus several follow upmeetings by participating agencies, six (6) sample sites were established. TheDickinson Bayou sites were then numbered for sampling purposes. Theiridentification numbers are DB6, DB1, DB2, DB3, DB4, and DB5 going fromupstream to downstream. The letters A or B following the site number indicatesthe depth of the sonde placement. For example, DB2A is located near thesurface while DB2B is located one (1) foot off the bottom of the bayou.
The Yellow Springs Instrument (YSI) multi-parameter data logger, model YSI-600XLM was chosen for this project. The YSI-600XLM data sonde is a self-contained multi-probe meter designed to be left in the environment recordingmultiple parameters over a period of time. The sondes used in this study werecapable of executing and storing the multi-parameter recordings of dissolvedoxygen, pH, specific conductivity, salinity, temperature, and depth.
Since all the data sondes needed to be suspended in the center of the v-shapedchannel, buoys were chosen as the method for sonde deployment at five of thesix sampling sites. The U.S. Coast Guard requires research buoys to be yellowin color, identified with the agency name and contact information, and, in someinstances, lighted. GCHD selected cylinder buoys made of yellow plasticbecause they are easy to maintain, light weight, float high in the water andprovided a good attachment point for the sondes. The buoys were anchored to a225 pound (lb.), molded concrete weight connected via ¼ inch, galvanized chainand locking shackles. Sondes were placed in PVC covers and locked onto

galvanized cable attached to the buoy. Lastly, a snap shackle deployment systemwas developed for safe placement and retrieval of the buoy weights in the water.
Starting in July 2000, field investigators began deploying the sondes andcollecting profiled water quality data and water samples for laboratory analysis.One week per month the sondes were suspended in Dickinson Bayou to collectwater quality data continuously for 48-72 hours.Vertical field data profiles werecollected at every site in one foot (1') increments from top to bottom using aHydrolab 4a MiniSonde multi-probe hand held meter. Water samples from themultiple sample depths were collected using 2 liter, clear acrylic Van Dornbottles. More than two (2) gallons of water were needed to perform the numberof analytical tests required, so a 5 gallon mixing bucket was used to compositeevery sample. Ambient water quality for each sonde depth was gathered duringwater sampling events using the Hydrolab multi-probe. Water samples weredelivered to the GCHD or TNRCC�s laboratory and analyzed for multipleconstituents.
The preliminary results from the GCHD data collected for dissolved oxygen,fecal coliform, and basic water chemistry parameters tend to demonstratetemporal, spatial, and seasonal variations along the bayou.
Dissolved oxygen differences recorded during the study were effected byseasonal variations of temperature and a combination of saltwater encroachmentand rainfall events. The highest DO levels were observed in January while thelowest levels were noted in the warmer summer months from June throughAugust. Plus, the surface sites always carried higher DO levels than the bottomsites. DO values of >10 mg/L and <1 mg/L were observed during the winter andsummer months respectively at the surface sites while the bottom sites recordedhighs of >8 mg/L and lows of 0.00 mg/L during the same periods.
Investigators discovered saltwater encroachment upstream from DB5 to siteDB1, but not to DB6. Due to a lack of water mixing between the two salinitylayers, DO levels were generally higher in the fresher top layer and lower in thetrapped saline layer. Water column mixing and elevated DO levels wereobserved during periods of significant rainfall. However, stratification returnedsoon after the rainfall event and DO levels again reflected the dry event levels.
As expected, rainfall influenced the dispersion of fecal coliform bacteria in thebayou. This rainfall influence suggests a correlation between land usage anddispersion. The bacteria data demonstrates a spatial difference between the six(6) sampling sites during rainfall events suggesting possible isolated non-pointsources of bacteria in those areas. Sites DB6,1,2,and 5 exhibited the highestincreases in fecal coliform bacteria, Enterococci, and E.coli levels after arainfall event. Levels of >3,000, >1,000, and >1,000 MPN/100 ml respectively

were commonly observed. Likewise, values <100 MPN/100 ml for the indicatorbacteria, fecal coliform, was common during dry sampling months.
GCHD�s laboratory performed several different analyses for nutrient parametersduring each sampling event of the study. CBOD, ammonia, nitrate-nitrite, andortho-phosphate were the key parameters for the study because of the influencesthey have on water quality and designated standards set by the TNRCC. Datashows elevated levels of these parameters during rain events and depressedlevels during dry weather. The presence of these nutrients during stressful timesof the year can cause even greater pressure on water quality and contribute tothe bayou�s failure to meet the designated TNRCC standards.
Physical and chemical water quality data gathered and analyzed for theDickinson Bayou Pre-TMDL project suggests that Dickinson Bayou (Segment1103) routinely fails to meet it�s established water quality standards for contactrecreation and high aquatic life use. Low DO levels are the result of acombination of natural processes and anthropogenic influences. High bacterialevels were repeatedly found at sampling sites in more rural settings due to agreater use of septic systems and rangeland run-off. The Dickinson Bayouwatershed continues to undergo land use changes to urban, commercial, andrural development. These changes will continue to cause biological, chemical,and physical pressures on the bayou and it�s ability to absorb and process theincreased loading from point and non-point source pollution.
Roy DrinnenGalveston County Health DistrictPollution Control Division1205 Oak StreetLa Marque, Texas 77568Ph: (409) 938-2302Fax: (409) 938-2271Email: [email protected]
Jean WrightGalveston County Health DistrictPollution Control Division1205 Oak StreetLa Marque, Texas 77568Ph: (409) 938-2301Fax: (409) 938-2271Email: [email protected]

AMERICORPS-CAPE COD: GETTING THINGS DONE
Truman Henson, Jr., Massachusetts Office of Coastal Zone Management
Introduction
The County of Barnstable, Massachusetts, one of the oldest in the state, consists of the fifteen coastal towns on Cape Cod. There is a strong regional government structure that provides a wide variety of services on a mutually beneficial regional basis. Americorps-Cape Cod (ACC or, �the program�) is one of those county programs. The program is dedicated to offering a diverse group of twenty-four full-time environmentally focused adults the opportunity to enhance their personal development, foster civic values, build community leadership abilities, acquire related technical skills and help address environmental issues in Barnstable County communities. The program is divided into three focus areas: land conservation, water conservation and environmental education. ACC is committed to the preservation and protection of the natural resources on Cape Cod and increased environmental education for residents, students and visitors to the area.
Program Needs The Americorps-Cape Cod program concept was built from a growing community concern regarding the health of the peninsula�s once pristine fresh and saltwater resources, woodlands and wetlands. These areas are now threatened by substantial increases in population and usage that may potentially cause irreversible damage to the region�s fragile environment. The fifteen towns on Cape Cod cover approximately 400 square miles, including large areas of very fragile, finite and extremely valuable resources. The year-round population has soared from about 100,000 residents in 1975, to well over 200,000 residents currently. Additionally, it is estimated that in excess of fifteen million people visit �the Cape� annually. As these many residents and visitors continue to explore the natural wonders and utilize the recreational activities that such environments evoke, the environmental management challenges become overwhelming to what are typically very small municipal management staffs. With a commonly held need for assistance by the communities, Barnstable County partnered with a number of other government entities to bring the Americorps-Cape Cod program to fruition to meet these increasingly overwhelming needs.

Program Partners Many local, state, regional, and federal agencies have independent, and sometimes overlapping, management authority and responsibility on Cape Cod. The county therefore solicited both program development input and support from a number of their own departments, such as the Massachusetts Office of Coastal Zone Management, the Massachusetts Department of Environmental Management, the National Park Service (Cape Cod National Seashore), the Compact of Cape Cod Conservation Trusts, and municipal natural resource officers from each of the fifteen towns. Representatives from these and other organizations continue their involvement by participating as members of the Advisory Board described below.
Organizational structure
The ACC program is guided by Barnstable County staff, as well as an Advisory Board. The Barnstable County Resource Development Office (a department of the county) provides all administrative support. Full-time staff positions include a Program Coordinator and two Member Leaders. The Advisory Board is made up of approximately fifteen representatives from a variety of local, regional, state and federal entities, as well as several non-profit groups. The primary function of this group is to focus on project identification and solicitation, identification of alternative funding sources, community relations and outreach, and ensuring that all of the needs of the members are met. The author serves on this Advisory Board.
Member recruitment The program, now in its third year, utilizes 24 students in a residential setting for a period of one year. Solicitations of interest are distributed to many schools and colleges across the country, and are also available via the Internet.
Most of the members have completed an undergraduate degree, although only two years of college are required for eligibility. More specifically, the individuals selected must have a strong interest in participating in a residential setting in which the focus is on environmental education and training, physical labor, and educating the public on environmental topics.
In return for their 1,700 hours of volunteer service to the communities during the year, they receive housing, a stipend to cover living expenses, and health insurance coverage. Additionally, they receive a $4725.00 grant to be used to further their formal education upon completion of the program.

Housing The residential nature of the program is one of its strongest attributes. Members are housed in a residence in Wellfleet, on the Outer Cape, and in Bourne, on the Upper Cape. Team-building and other group activities are integrated throughout the daily program. These activities and this type of living provide each member with the opportunity to develop cooperation, team building, leadership, communication, negotiation, and conflict resolution skills. The attainment of these skills allows each member to view themselves as an integral member of a cohesive team.
Orientation & Training Upon joining the ACC team in September of each year, members undergo an intensive six-week training program. The topic areas covered include program policies, procedures, requirements, and an overview of the ecology and natural history of Cape Cod. More specific training encompasses such topics as the Endangered Species Act and Piping Plover management; shellfish husbandry and growing; water quality monitoring and lab analysis; practices and uses of tools for trail construction and maintenance; and environmental education curriculum implementation. They also receive training in local, regional, and state government organization and function, and meet program partners and service providers.
Project Solicitation The work conducted for the towns is performed at no cost to the towns. While it is generally divided into the fields of land conservation, water conservation and environmental education, the specific tasks performed have included dozens of different activities such as: educational workshops for children; coastal erosion control and beach grass planting; shellfish research and municipal aquaculture; public access identification and trail maintenance; and water quality monitoring. These widely varying projects are performed in both individual and group placements with municipal officials, land trusts, non-profit conservation groups and other land and resource managers. As mentioned earlier, Advisory Board members work with the ACC staff to solicit and identify both individual and group member placement, which ensures consistency of effort and promotes the program within the community. On one day each week, the groups work together on �flex projects� in which they identify a group project that might be completed over a period of time. Examples of these types of projects include Christmas tree recycling and household hazardous waste collection days.

Project Development When a project is identified, the ACC staff or a member of the Advisory Board helps the �service partner� to develop a project proposal and �service agreement�. This agreement includes a brief description of the work to be completed, the site location, specific tasks, skills and training needed by the workers, tools and equipment needs, number of personnel, and amount of time estimated for project completion. Additionally and importantly, the proponent is required to describe how the proposed project will help meet the environmental and community needs of the specific town involved or the county as a whole. From these forms collected from each service partner, ACC staff organize the training and work schedule for the appropriate member or group of members. While a few placements are made so that the member works in the same location for the entire program year, most are shorter in duration so that there is variation in the work experience both in terms of tasks and interpersonal interactions.
Funding One of the most important points related to the operation of the ACC program is that services of the members to the Barnstable County towns are provided at no cost. This is made possible as a result of a funding partnership that includes contributions by the County of Barnstable, the non-profit Massachusetts Service Alliance, and the federal Corporation for National Service.
Conclusion During the last program year, ACC members have:
• Provided more than 40,000 hours of service to the Cape Cod environment and its managers.
• Educated over 2400 children on environmental issues. • Created, organized and ran the county�s first Earth Celebration � an
event for community members showcasing environmental organizations and providing educational activities, games, prizes and food.
• Planted more than 52,000 beach grass stems for coastal erosion prevention.
• Aided in shellfish restoration, propagation and research projects throughout the county.
• Performed coastal access surveys in all fifteen towns and developed five projects to increase access awareness.
• Constructed 200 feet of boardwalk to allow for handicap access to natural areas.
• Restored and cleared over five miles of anadromous fish runs. • Worked with 64 non-profit organizations, federal, state, regional and
local agencies to accomplish the goals of the program.

The program was developed to fill a void felt and expressed by a number of Cape Cod communities. As designed and implemented, it has achieved that goal and promoted coordination and cooperation amongst a wide range of agency and non-profit interests, all while promoting better understanding and stewardship of our fragile environment in Barnstable County. As a result of the extraordinary collaboration of a variety of interests, the ACC has met this goal by leveraging tremendous commitments from environmental volunteers at a minimal cost. Truman Henson, Jr. Massachusetts Office of Coastal Zone Management Cape & Islands Regional Office P.O. Box 220 Barnstable, MA. 02633, USA Ph: (508) 362-1760 Fax: (508) 362-1698 Email: Truman . Henson @ state.ma.us

THE GULF COAST FRONTIER THE SALTGRASS CATTLEMEN ON THE COASTAL MARSHLANDS
Alecya Gallaway, The Environmental Institute of Houston UH-Clear Lake
Many of the stockmen who settled in the colonies along the eastern seaboard were originally from the British Isles. Some of these early immigrants came to the east coast colonies of North America with more than just their families; they came with cattle, hay, grass seeds and generations of cattle raising traditions they would continue to use. (Agriculture, 1948) The following methods were implemented immediately: Driving cattle overland to market along stock trails was well established and in Scotland in 1186, and the Gallowaygate was a popular trail used to bring cattle from the Scottish Highlands to market in England. Irish cattlemen in the sixteenth century stayed on the range with their cattle, and earmarking and branding were practices long used in Europe. Seasonal burning to induce a fresh growth of grass was also common in the British Isles as was the use of dogs trained to help control the herds. Driving cattle herds seasonally from high pastures to low pastures was a common practice in Scotland and Ireland. (Jordan, 1981) But it would be in South Carolina that the old traditions took root and began to change and grow into southern traditions. In South Carolina, the old country stock raising practices were easily adapted to the new land. The cattle they imported that were hardy enough to survive the overseas voyage from Europe thrived with little care on the nutritious coastal grass range. Seasonal burning supplied the cattle with fresh tender grass and driving the cattle into the marshland in the fall and inland from the marshes before summer kept them fat without hay and safe from the hordes of mosquitoes in the wetlands. South Carolina stockmen bought expert horsemen and herders from the Gambia region of Africa from slave dealers and brought them to their plantations. (Ball, 1999; Jordan, 1981) In these same slave-ships came cattle and hay, which was used as food for the cattle, and bedding for both man and beast. Bermuda Grass was just one of the grasses accidentally introduced to the coastal prairies where the slave ships were unloaded. (Agriculture, 1948) Cattle herds within the colonies became a mixture of the heartiest bloodlines of the breeds introduced into the area. Free ranging cattle were left on their own to multiply and calves were marked for ownership in the spring. Families were large and the open coastal grazing lands quickly shrunk. In South Carolina, rice farming began to take up much of the wetlands. The coastal cattle range decreased even more as it was divided between the heirs of a plantation owner. By the mid 1700s the younger generations, the sons and daughters of colonial stockmen began moving west in related groups with small herds and a few slaves to new territories and frontiers as they opened. With them they carried a mixture of cattle raising traditions adapted from methods used by their

own European ancestors and the ancestors of their slaves who were brought from Africa. They migrated to new frontiers settling in Georgia, Florida, Alabama, Mississippi and Louisiana; following the coastal wetlands they knew would support their herds, moving to the prairies and marshes abundant with winter grass for forage. In each new area they adapted their herding styles to the new terrain. In Georgia they were called �crackers� for the sound of their bullwhips as they drove their cattle from horseback. In Florida they drove their herds to the swamps in winter and the bottomland forests in summer. In Mississippi and Alabama they depended more on their dogs to help them herd the cattle. Families grew and the younger generations kept moving west, a migration that is documented by their stock brands, registered where required when they settled in a new area. (Fisher. 1982) In Louisiana new traditions were learned, such as the ranching traditions of the Spanish cattlemen and the Mexican vaqueros. It was here that the legends of the west began to take root. The southern stockmen and their African-American slaves learned new ways to handle cattle, methods that made raising the longhorn stock they found in this new territory much easier. They still used bullwhips, seasonal burning, driving the cattle to the salt marshes in winter, but here under Spanish ruled Louisiana many new traditions were added. Great herds of wild unbranded mustang horses, burros and Castilian cattle ranged prairies and riparian forests where they had been trailed to missions and ranches along the Texas � Louisiana border when France controlled Louisiana. The Spanish custom was to leave the bulls and stallions uncastrated and free to breed
as they ran wild and by the mid 1700s thousands of these animals roamed the lands of southeast Texas and southwest Louisiana. The herds of cattle the southern stockmen found were a strong breed, hardy and wild, a breed that evolved through generations of survival of the fittest.
It was there in Louisiana at the end of the 18th century, in the saltgrass country near the Texas border that stockmen became cattlemen. They learned to rope, corral and break the wild mustangs, to train them to work cattle using the methods and skills taught to them by the Mexican vaquero. They perfected the art of making horsehair lariats used to rope the cattle at branding time. They began wearing the Mexican boots with heels that held the foot firmly in the stirrup when silver spurs were used to speed the small horses to cattle trying to break from the herd. (Chipman, 1992; Jordan, 1981) Master and slave worked the cattle side by side on horseback, equal in their power over the beast beneath them and equal in stature atop the powerful animals. Eye contact was necessary as master and slave silently communicated across the backs of hundreds of
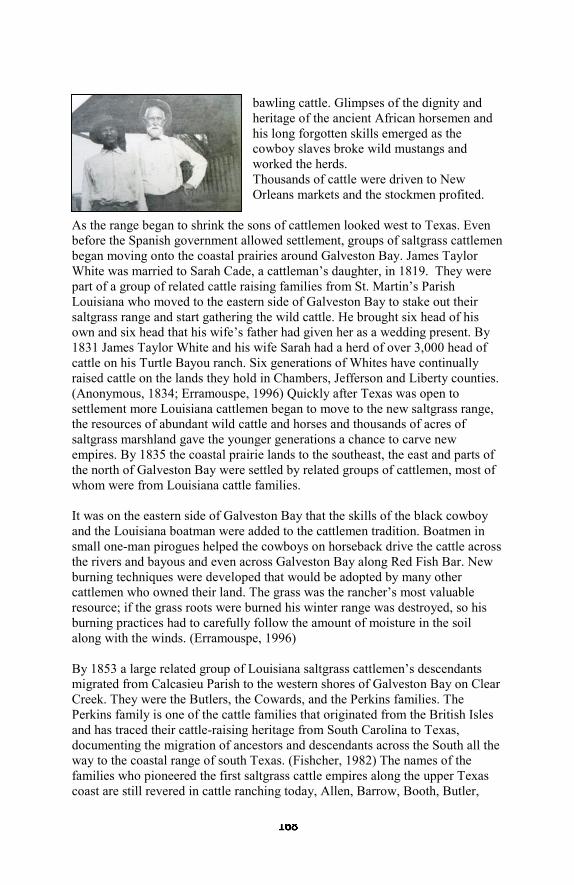
bawling cattle. Glimpses of the dignity and heritage of the ancient African horsemen and his long forgotten skills emerged as the cowboy slaves broke wild mustangs and worked the herds. Thousands of cattle were driven to New Orleans markets and the stockmen profited.
As the range began to shrink the sons of cattlemen looked west to Texas. Even before the Spanish government allowed settlement, groups of saltgrass cattlemen began moving onto the coastal prairies around Galveston Bay. James Taylor White was married to Sarah Cade, a cattleman�s daughter, in 1819. They were part of a group of related cattle raising families from St. Martin�s Parish Louisiana who moved to the eastern side of Galveston Bay to stake out their saltgrass range and start gathering the wild cattle. He brought six head of his own and six head that his wife�s father had given her as a wedding present. By 1831 James Taylor White and his wife Sarah had a herd of over 3,000 head of cattle on his Turtle Bayou ranch. Six generations of Whites have continually raised cattle on the lands they hold in Chambers, Jefferson and Liberty counties. (Anonymous, 1834; Erramouspe, 1996) Quickly after Texas was open to settlement more Louisiana cattlemen began to move to the new saltgrass range, the resources of abundant wild cattle and horses and thousands of acres of saltgrass marshland gave the younger generations a chance to carve new empires. By 1835 the coastal prairie lands to the southeast, the east and parts of the north of Galveston Bay were settled by related groups of cattlemen, most of whom were from Louisiana cattle families. It was on the eastern side of Galveston Bay that the skills of the black cowboy and the Louisiana boatman were added to the cattlemen tradition. Boatmen in small one-man pirogues helped the cowboys on horseback drive the cattle across the rivers and bayous and even across Galveston Bay along Red Fish Bar. New burning techniques were developed that would be adopted by many other cattlemen who owned their land. The grass was the rancher�s most valuable resource; if the grass roots were burned his winter range was destroyed, so his burning practices had to carefully follow the amount of moisture in the soil along with the winds. (Erramouspe, 1996) By 1853 a large related group of Louisiana saltgrass cattlemen�s descendants migrated from Calcasieu Parish to the western shores of Galveston Bay on Clear Creek. They were the Butlers, the Cowards, and the Perkins families. The Perkins family is one of the cattle families that originated from the British Isles and has traced their cattle-raising heritage from South Carolina to Texas, documenting the migration of ancestors and descendants across the South all the way to the coastal range of south Texas. (Fishcher, 1982) The names of the families who pioneered the first saltgrass cattle empires along the upper Texas coast are still revered in cattle ranching today, Allen, Barrow, Booth, Butler,

Cade, Coward, Jackson, McFaddin, Pierce, Scott, White and others. (Fishcher, 1982; Lawrence, 1952; Wingate, 1984)
The saltgrass marshes and prairies of the upper Texas coast were always a treacherous place with a complicated ecology that included dangerous alligators, huge rattlesnakes, deadly water moccasins, prairie wolves, rabid skunks, sink holes and quicksand. (Anderson, 1907; Anonymous, 1834) The marshes also were a place of beauty with a wealth of indigenous plant and animal life that depended on this unique environment with its well-balanced food web. (Anonymous, 1834; Hooten, 1847) At the time of the Civil War even though the salt grass was sparsely populated, the integrity of the marshes had been compromised by hundreds of thousands of cattle grazing upon its grasses, by tens of thousands of cattle dying along the waters edge of hypothermia when the temperature suddenly dropped and the fierce north winds drove them to seek warmth in the waters along the edge of the shore, and by the annual burning of the grasses to produce a tender new grow for cattle consumption. The families who pioneered these areas grew, land holdings were divided and the younger generations continued to follow the tradition of moving west to new, open cattle range as the generations before them had done. So when the cotton and sugarcane plantation owners from the South lost their slave work force and their plantations, and many of them started moving into Texas along the coast where they knew of families who made fortunes in cattle-raising, they were less than well received. This influx of new settlers not only put a burden on the cattle resources, it put an even greater burden on the land. The open range dwindled and cattlemen began fencing their lands. The fences caused even more changes that would alter the coastal prairies. These new boundaries concentrated the grazing. The cattle began depleting the areas of the best grazing forage leaving nothing to reseed, and the thousands of hooves impacted the surface soils. The fences became roosts and resting places for birds traveling along their coastal migration routes. Non-indigenous plants began growing along the fences as they had in Europe and northeastern America causing fencerows of plants that began competing with and shading out the

grasses. Only in the salt marshes where plants were able to withstand the inundation of saline tidewaters did the native plants retain their hold. Railroads crisscrossed the upper Texas coast and by the 1890s agriculture competed with the cattle range. The United States Department of Agriculture took grass surveys of the coastal range and found it depleted of native grasses. Rice faming became widespread as ranchers looked to other ways to use their wet soils. In the early years of the twentieth century, oil was discovered under the saltgrass prairies of southeast Texas. Soon the term cattleman became synonymous with the term oilman and the saltgrass prairies became completely altered. After World War I, the government began a concentrated effort to introduce new grasses to the coastal prairies. (Agriculture, 1948) On the upper Texas coast oil refineries were constructed on the marshlands that were once part of large saltgrass ranches. Subsidence began to affect the marshes and the water level began to keep the cattle from the winter range, cattle walks were constructed creating even more change. After World War II fewer men went back to the farms and ranches of their families and more families moved to the coastal prairies into housing developments quickly constructed for the workers of the oil refineries and chemical companies that were built on the coastal marshlands. Within the next twenty years the wind of environmental change would blow across the saltgrass in the form of the Land and Water Conservation Fund Act of 1965, soon followed by the Clean Water Act of 1977, and the Emergency Wetlands Resources Act of 1986. (Tiner, 1984) Today, we see the results of those first governmental acts passed to save our wetlands, coupled with the saltgrass marshes left undeveloped because of the saltgrass cattlemen whose tenacious ability to follow their ancestral traditions of a hard, unpredictable, and seasonally rhythmic way of life allowed them to hold on to their saltgrass lands. It is those saltgrass ranchland marshes that survived development and are today federal and state preserves, state parks, county and city parks, and private preserves held by organizations such as: Audubon, Galveston Bay Foundation, Scenic Galveston and Nature Conservancy. Many of these preserves have retained the grazing rights of the cattlemen, and some have become sanctuary only for the undomesticated animals who live there and the humans who want to enjoy them, and most of the mineral rights are owned by agencies, corporations, and organizations many who will see a need to allow those resources to be tapped. Texas is still in the learning process of how to save our environment and balance the needs of our heritage, our coastal wetlands, and our natural resources.

References: Agriculture, United States Department of, ed. 1948. Grass Yearbook of Agriculture 1948, Washington: U.S. Government Printing Office. Anderson, J.W. 1907. From the Plains to the Pulpit. Houston: State Printing Company. Anonymous. 1834, reprint 1952. A Visit to Texas being the Journal of a Traveller. New York, Austin: The Steck Company. Ball, Edward. 1999. Slaves In The Family. New York: Ballantine Books. Chipman, Donald E. 1992.Spanish Texas 1519 � 1821. Austin: University of Texas Press. Erramouspe, Roxanne. 1996. Whites Ranch: Carved from Land Founded in 1819. The Cattleman, 10-13, 20. Fischer, Velma D. 1982. History of the Perkins Family. Louisiana: Family Genealogy. Hooton, Charles. 1847. St. Louis� Isle or Texiana. England: Simmons and Ward Publishing Co. Jackson, Ralph Semmes. 1961. Home on Double Bayou. Austin: University of Texas Press Jordan, Terry G. 1981. Trails To Texas, Southern Roots of Western Cattle Ranching. Lincoln and London: University of Nebraska Press. Lawrence, Varuna Hartmann. 1952. Texas Coastal Pioneers of Chambers County. Dallas: Royal Publishing Company. Wingate, Gwendolyn. 1984. Cattle Barons conquered Texas, provided area�s first big industry�, Beaumont Enterprise Heritage Edition, 2-5-84 p. 1BB. Photos: Courtesy of Wallisville Heritage Park Alecya Gallaway Environmental Institute of Houston University of Houston � Clear Lake 2700 Bay Area Boulevard Box 540 Houston, Texas 77058 Ph: (281) 559-2068 Fax: (281-559-2068 Email: [email protected]

DEVELOPING A SOCIAL SCIENCE STRATEGY FOR MARINE PROTECTED AREAS
Sarah C. Lyons, NOAA Marine Protected Areas Center
Charles M. Wahle, NOAA Marine Protected Areas Center
Abstract: While much attention continues to be focused on the natural science of marine protected areas (MPAs), it is becoming increasingly clear that the human dimension plays a large, and often decisive, role in the effectiveness of MPAs as a conservation tool. Although there is a growing awareness that �we are really managing people and their resource use, not fish,� the social sciences nevertheless continue to be largely overlooked in the design and management of MPAs. Consequently, there is a pressing need for understanding the social, cultural, and economic contexts in which policy maker�s conservation decisions will be applied. NOAA�s Marine Protected Areas Center, Institute for MPA Science, is developing a social science strategy that will identify priority social science issues and needs on a national scale for all types of MPAs. The strategy is intended to enhance the use of social science in designing and managing MPAs by guiding the allocation of resources and efforts among agencies, funding entities and key stakeholders. The highly participatory process for developing the strategy will be described and the results of the 2002 MPA social science workshop, highlighting social science priorities, will be presented. Introduction The experiences of the past decade of MPA designations have clearly shown that the way in which the human dimension is incorporated into MPA planning can profoundly affect whether and where sites are ever established, and whether they ultimately achieve their conservation, social, and economic goals. Presently, however, MPA practitioners and planners currently lack sufficient information, resources, and institutional capacity in the social sciences to meet this formidable challenge. Because of this, the Marine Protected Areas Center is developing a comprehensive Social Science Strategy for MPAs. This document will identify and prioritize key social science issues and needs and recommend practical ways to meet them through research, assessment, capacity building, and leveraged funding. The strategy is intended to: (a) highlight priority research needs for funders and agencies; (b) identify potential areas of collaboration among scientists, MPA practitioners, and other stakeholders; and (c) provide a framework for incorporating social science in MPA planning and management.

Preliminary Priority Areas The development process for the NOAA Institute for MPA Science�s Social Science Strategy is highly participatory. This comprehensive strategy for MPAs will reflect the contributions of a broad group of social scientists, MPA practitioners, and stakeholders. The first step in this process was largely a brainstorming exercise involving experts and practitioners from the west coast. At the NOAA Institute for MPA Science�s Pacific Coast Science and Coordination Workshop held from July 31, 2001 to August 1, 2001 in Monterey California, one of the four breakout groups focused on the human dimension of Pacific coast MPAs. Composed of social scientists, policy makers, and stakeholders, the human dimension breakout group concentrated on determining and prioritizing information needs in the design and management of MPAs and MPA networks. The group�s specific and detailed recommendations will be released as an MPA Center document on the official web site, www.mpa.gov. Below is a list of some priority areas for future effort, including research and analysis identified by the group.
Site/Community Scale
• Conduct baseline socioeconomic assessment of stakeholders/users/communities
• Monitor these variables over time (long and short term) • Conduct economic valuations of resources and use • Conduct social impact assessments that consider temporal scale of
needs and impacts (long and short-term) • Evaluate socioeconomic impacts of not establishing a MPA
Regional Scale
• Learn from studies and models; partner with other programs (e.g. NPS,
other terrestrial programs) • Compile existing socioeconomic studies, raw data, guidelines,
handbooks, and methods; develop warehouse of information • Develop general criteria for success from human dimension perspective
that can be applied to individual sites (e.g. improved stakeholder perceptions, increased employment levels)
• Come to consensus of common understanding of terms • Clarify federal and state regulatory requirements for social science
analysis • Develop a network/working group/professional association of social
scientists working on MPA issues in Pacific Coast region • Use social science in developing and evaluating MPA processes,
including stakeholder involvement and the psychology of group and

individual decision-making (note: two small groups moved this onto the �Site� list)
• Conduct regional study of resource uses and communities affected by resource use
• Conduct regional cost and earning studies The results of the Pacific Coast MPA Science and Coordination Workshop will be used as a jumping off point for the development of the national social science strategy document, which will be national in scope and applicable to many MPAs worldwide. MPA Social Science Workshop As the next step of the social science strategy development process, NOAA�s Institute for MPA Science, in partnership with Duke University, the University of California at Santa Cruz, and the Canadian Department of Fisheries and Oceans will convene a major social science workshop during the second week of April 2002 in Monterey, California. This unprecedented gathering will identify and prioritize economic, social and cultural aspects of MPA issues � thereby forming the foundation of the national strategy. A group of academic social scientists, policy makers and stakeholders will spend two days identifying key social science issues and priorities that will be grouped under six basic themes:
• Economics of MPAs • Use patterns • Attitudes, perceptions and beliefs • Governance and institutional structure • Community organization • Cultural heritage
These six themes are further defined below. Economics of MPAs. This theme deals with economic conditions and trends associated with MPAs. Topics include, but are not limited to, market and non-market values, costs and benefits, and positive and negative impacts associated with marine protected areas. Use Patterns. This theme addresses the way stakeholders use the resources in marine protected areas. This includes extractive and non-extractive uses. Attitudes, Perceptions and Beliefs. This theme covers the underlying motivations that influence human preferences, choices, and actions. It examines the measures that shape human behavior and how these behaviors affect marine protected areas.

Governance and Institutional Structure. This theme covers the institutions (Federal, state, local, and NGOs) responsible for managing the resources in marine protected areas. Component topics include the capacity of these institutions, their funding sources, jurisdiction, management strategies, and implementation approaches, as well as the nature of their interactions with the public and with other institutions. Community Organization. This theme looks at the characteristics of communities associated with marine protected areas and the way these communities function, particularly as they relate to the use and conservation of marine resources. Topics addressed here may include demographics, ethnography, skills and capacity, human and social capital, awareness, vulnerability, participation, local knowledge, traditional management, and long-term visions. Cultural Heritage. Cultural heritage covers the historical aspects of marine protected areas. This includes, but is not limited to, nautical history (wrecks, replicas, etc.), maritime infrastructure (piers, lighthouses, locks, ports, forts, etc), and historical documents (books, pictures, music, recipes) relevant to marine protected areas. Next Steps Following the workshop, a draft strategy will be developed and widely reviewed by experts internal to NOAA and external to the agency. The final MPA Social Science Strategy, which will be published and posted on the MPA Center�s web site, www.mpa.gov, will then be used to guide a series of regional workshops to identify more specific regional priorities and action plans to fully integrate the social sciences in MPA planning and management on a relevant scale. Acknowledgements We would like to thank all of the participants of the Pacific Coast MPA Science and Coordination Workshop for their hard work, and the social science strategy workshop team: K. Barba, L. Bunce, B. Nicholson, M. Orbach, and C. Pomeroy, and M.J. Comfort at the Department of Fisheries and Oceans in Canada. Sarah Lyons NOAA Institute for MPA Science 110 Shaffer Rd. NOAA Fisheries Lab Santa Cruz, CA 95060 Ph (831) 420-3958 Fax (831) 420-3979 [email protected]

ECOLOGICAL RESTORATION IN THEORY AND PRACTICE: THE DISCOURSE OF SALMON POLICY IN THE LOWER CEDAR RIVER
OF WASHINGTON STATE
Lisa Asplen, School of Marine Affairs, University of Washington
This paper explores the concept of �ecological restoration� as it is used and understood in both theory and practice. It is my assertion that restoration discourse, defined here as the language, values, and perceived meanings associated with the concept, offers a powerful tool for understanding the broader practical implications of these policies. The plasticity of the term �restoration�, a characteristic that makes it attractive politically, can make it difficult from a policy analysis perspective to understand the goals and values actually being supported. To evaluate the consequences of a restoration-based strategy, I first explore the range of definitions offered by multiple disciplines for an appropriate understanding of the term �restoration.� Through case study examples of salmon habitat projects in the Lower Cedar River of Washington State, I explore the practical implications of discourse on the nature of ecological restoration, tracing the influence of normative assumptions and evaluating competing discursive threads to determine the true character of restoration activities.
Theory: The Discourse of Ecological Restoration A host of journal articles and book chapters are dedicated to the task of defining ecological restoration. As of yet, no universal definition has been agreed upon to the satisfaction of either scholarly or practical interests. The Society for Ecological Restoration (SER) defines ecological restoration as �the process of assisting the recovery and management of ecological integrity� (Swart et al 2001). This provides a starting point from which to examine the points of conflict and variation between competing definitions of restoration. Restoration goals and endpoints represent the most pervasive point of contention in the restoration literature. The SER definition relies upon the idea of �ecological integrity,� which is on its own a topic of intense debate in the ecology literature (Goldstein 1999). Some definitions of restoration focus specifically on the structure and function of natural systems (i.e. biological and physical processes) as the appropriate target for restoration efforts (e.g. NRC 1992). A related endpoint of restoration is that of self-sustainability, directing ecosystems towards a state at which human management is no longer necessary (e.g. Parker et al 1997). Other restoration definitions, however, grant a greater degree of control to human agency and ingenuity, characterizing restoration as turning back the clock to a specified point in history, with the most common endpoint being an ecosystem�s �original� or �pristine� condition (e.g. MacMahon 1998).

In addition to goals and endpoints, a wide variety of activities/methodologies have emerged under the auspices of ecological restoration. The intensity of a restoration activity, conceptualized as the degree of �artificiality� or technological sophistication involved in the project, is an important variable in restoration methodology, defining the range and depth of management responsibility built into the restoration effort. Passive or �natural� restoration seeks primarily to anthropogenic disturbances to ecological systems, allowing them to recover �naturally� through the resumption of arrested processes and functions. Active habitat restoration refers to the attempt to artificially engineer or reproduce impaired or lost aspects of the natural structure or function of an ecosystem (Kauffman et al 1996). Restoration, as currently applied, can refer to any number of activities along this passive-active continuum targeted towards different goals/endpoints, creating an evaluative nightmare for those of us interested in understanding the efficacy and even desirability of ecological restoration as a tool for environmental policy.
Practice: Salmon Habitat Restoration in the Lower Cedar River Basin The Cedar River is one of the five major rivers in King County, located in the southeast portion of Puget Sound. The headwaters originate in the Cascade Mountains, draining approximately 188 square miles into Lake Washington. The Landsburg Dam divides the river into two distinct sections, the Upper and Lower Cedar River Basins. The Upper Cedar River Basin (from the mountains to the dam) accounts for two-thirds of the total area, but has been protected from development by the City of Seattle for municipal water supply purposes. The lower portion (from the dam to Lake Washington), however, has been subject to a wide variety of land and water uses throughout its 66 square-mile basin (Watershed Management Committee 1998). The Cedar provides habitat for seven species of salmonids: chinook, sockeye, and coho salmon; steelhead and cutthroat trout; Dolly Varden charr, and mountain whitefish (Current and Future Conditions Report 1993). Record low runs of all anadromous salmonids were recorded in the early 1990s (WMC 1998). Direct habitat loss from riparian development, land reclamation, and removal of large woody debris (LWD) has been exacerbated by these indirect losses from the alteration of the natural flow and function of the system (mainly through municipal water withdrawals and shoreline/flood protection measures) (Perkins 1994). Recognizing the dramatic loss of salmon and habitat in the river basin, King County drafted the Lower Cedar River Basin and Nonpoint Pollution Action Plan (Action Plan), identifying four distinct classifications of salmon habitat restoration for projects: 1) tributary enhancements; 2) floodplain/valley-floor improvements; 3) mainstem habitat enhancement; and 4) preservation of high quality areas (Watershed Management Committee 1998, A-41). The first three categories reflect geographic differences in the location of projects, which

translate into differential habitat benefits based on species- and lifestage-specific preferences. The fourth category represents a completely different approach to salmon recovery, seeking to protect high quality habitats from future development and degradation through land acquisition and preservation. These projects can be �passive� restoration if habitat-forming processes are allowed to reestablish and recreate lost conditions (e.g. wetlands, meanders, side-channels). In order to explore the relationship between discourse and policy in the Cedar River, I turn to two very different projects that have been carried out under the umbrella of salmon restoration policy. Emerging from the categories detailed above, these projects illustrate the diversity of activities, and the subsequent diversity of outcomes, touted as restoration.
Case Study #1: Walsh Creek Tributary Enhancement
Walsh Creek, commonly referred to as the Walsh Lake Diversion Ditch, is a 4.2 mile tributary stream that drains into the Cedar on the right bank at river mile 19.8 (Priest 1995). The diversion ditch was dug in the 1920s to divert poor quality water from the water supply reservoirs above the Landsburg Dam. Since its �creation,� sockeye, coho, steelhead, and cutthroat have utilized Walsh�s entire 4.2 mile range, while recently listed (threatened under ESA) chinook have been observed in the lower reaches (WMC 1998). One of the more unique challenges to �restoration� of this tributary system comes in the definition of goals and endpoints. The �unnatural� and relatively recent origin of the system challenges conventional definitions of restoration based on �historic� or �pristine� conditions. This system has changed rapidly and dramatically over the past 80 years, making it difficult to pin down what a restored system could and should look like. The result has been a less focused �enhancement� strategy, aiming towards any quantitative and qualitative improvements to be had. In 1997, the King County Surface Water Management Division, in conjunction with a local volunteer organization (the Mid-Puget Sound Fisheries Enhancement Group), placed large woody debris (LWD) into Walsh and planted riparian trees to improve habitat conditions (Coulo 1998). The project was intended to produce generic (i.e. non-species specific) benefits for all salmonid species through quantitative and qualitative improvements in spawning, rearing, and feeding habitats. The pieces of LWD were marked with numbers to facilitate the tracking of wood movement and evaluation of habitat formation. However, unlike species-specific projects (see below), no monitoring has been conducted. Unlike a more proscribed restoration approach, the enhancement strategy seems to accept any improvement as a success, resulting in a diminished �management� ethos.

Case Study #2: Elliot Reach Habitat Creation
The Elliott Reach, located between river miles 4.2 and 6.2, was targeted by King County as a regionally significant resource area in terms of both flood control and habitat restoration. It has been the site of a variety of flood protection and habitat enhancement projects including the construction (and continual reconstruction) of the Elliot Levee, three salmon (i.e. sockeye) spawning channels and a spawning and rearing off-channel pond (and associated side channels) (KC Surface Water Management 1995). Unlike the Walsh example and other tributary enhancements proposed and carried out on the Cedar, the valley floor habitat projects under which the Elliot channels fall are decidedly quantitative in focus, grounded in the production of specified amounts of habitat (i.e. number of redds) and numbers of fish. Redd and fish counts have been carried out for all of the channels to gauge the level of sockeye productivity achieved. As with Walsh, it is difficult to fit these projects into the classic, historical reference driven conception of restoration. Although off channel habitats were probably pervasive before the hydrologic containment of the river, these constructed channels were designed with sockeye production in mind rather than the �restoration� or �recreation� of previously lost habitat. This habitat creation model, designed with the maximization of spawning habitat in mind, manifests itself as a product of human ability rather than an attempt to �give back� parts of the floodplain to the natural functioning of a river.
Next Steps
The diversity of means, aims, and ends, illustrated by only two projects, indicates fertile ground for further research. The next step in my research is a systematic exploration into the nature of projects that have been proposed, prioritized, and undertaken under the guise of restoration in the Lower Cedar River. This entails the categorization of projects according to goals, methods, and outcomes and an analysis of how and why competing conceptions of restoration have been adopted. This analysis of �on the ground� restoration can in turn provide insight into larger questions of the appropriateness and practicability of restoration as a tool for environmental policy. Implicit normative assumptions, intended and unintended policy proscriptions, and points of miscommunication (i.e. between scientists and policy-makers and between policy-makers and the public) are a few of the important findings that emerge in a discourse-oriented approach to examining restoration.
References
Coulo, Adam. 1998. Regional Fisheries Enhancement Program: Annual Report to the Legislature Fiscal Year 1997. WA Dept of Fish & Wildlife. Seattle, WA.

Current and Future Conditions Report (CFC). 1993. King County Department of Natural Resources. Seattle, WA.
Goldstein, Paul. 1999. Functional ecosystems and biodiversity buzzwords. Conservation Biology. 13 (2): 247-255.
Kauffman, J. Boone, Nick Otting, Danna Lytjen, and Robert L. Beschta. 1996. Ecological principles and approaches to riparian restoration in the western United States. In A Guide to the Restoration of Watersheds and Native Fish in the West. Eugene, OR: Pacific Rivers Council, Inc. 135-162.
King County Surface Water Management and City of Renton Surface Water Utility. 1995. Elliot Levee Repair and Habitat Enhancement Project. Renton, WA.
MacMahon, James A. 1998. Empirical and theoretical ecology as a basis for restoration: an ecological success story. In Pace and Groffman (eds) Successes, Limitations, and Frontiers in Ecosystem Science. New York: Springer. 220-246.
National Research Council. 1992. Restoration of Aquatic Ecosystems: Science, Technology, and Public Policy. Washington, D.C.: National Academy Press. 552 pp.
Parker, V. Thomas and Steward T.A. Pickett. 1997. Restoration as an ecosystem process: implications of the modern ecological paradigm. In Urbanska, Webb, and Edwards (eds) Restoration Ecology and Sustainable Development. Cambridge, UK: University Press. 353-380.
Perkins, S.J. 1994. The shrinking Cedar River: Channel changes following flow regulation and bank armoring. Water Resources Association (June): 649-659.
Priest, W. 1995. Sockeye Spawner Salmon Survey for Selected Habitats of the Cedar River Basin. King County Water and Land Resources Division. King County, Washington.
Swart et al. 2001. Valuation of nature in conservation and restoration. Restoration Ecology. 9(2): 230-238.
Watershed Management Committee (WMC). 1998. Lower Cedar River Basin and Nonpoint Pollution Action Plan. King County Department of Natural Resources. Seattle, WA.
Lisa A. Asplen Master�s Student, School of Marine Affairs University of Washington 3707 Brooklyn Ave. NE Seattle, WA 98105-6715 Ph (206) 685-1581 Fax (206) 543-1417 Email: [email protected]

SEPARATING SCIENCE AND COMMUNITY PRIORITIES IN MULTI-STAKEHOLDER ENVIRONMENTAL DECISION MAKING PROCESS:
THE HOUSTON ENVIRONMENTAL FORESIGHT COMMITTEE
Michele D. Brown, Ph. D. Student
Introduction
Urban-rural interfaces are becoming increasingly contested spaces as urbanization continues to deplete rural communities and farming/ranching practices in the Unites States�by 1990, only 1 in 4 Americans (22.9%) lived in rural areas compared to almost half (50%) in 1950 (Orr 1999). The expansion of urban centers and the needs of urban populations for economic and social well-being result in environmental impacts as well as inequitable distribution of the costs and benefits of development among the residents and other publics of the region. The widespread inter-linkages of natural resources means that environmental impacts need to be studied on a regional basis, while the interdependence of multiple stakeholders in the domain makes it difficult for individuals or organizations to effectively plan and manage impacts without working collaboratively with other stakeholders in the domain (c.f. Gray 1989, 1996). Early involvement of key stakeholders (those who are impacted by development decisions, or those who have the ability to impact development decisions in the domain) is considered essential (Gray and Hay 1986, Trist 1983), as is the need to develop a common knowledge base and to take into consideration the political nature of participation, particularly when public sector officials are involved (c.f. Mitchell et al. 1997; Susskind and Cruikshank 1987). The strategic planning process of the multi-stakeholder group itself is important to understand, with respect to whether the purpose of the process is instrumental or to build relationships, visions and joint trust and understanding (c.f. Bush and Folger 1994, Jamal 1997, Jamal 1999, Westley 1995). In complex environmental domains, multi-stakeholder collaboration processes based on consensus have come recommended and criticized by a number of scholars. How effectively such processes work in urban-rural interfaces involving a large number of environmental concerns (and potential if not existing conflict) and a large, diverse group of stakeholders that include a range of ethnic and disadvantaged resident groups is a relatively new but important area of research. This paper is an exploratory study of an innovative citizen-based environmental risk ranking process that involved a diverse group of over 200 stakeholders in the 8 county air quality non-attainment region of Houston, Texas.
Background
The Houston Environmental Foresight Committee was conceived and
convened by the Houston Advanced Research Center (HARC) Center for Global Studies in 1993. The vision for this process was a citizen-based, multi-stakeholder, environmental risk ranking process. Over 200 scientists and

community stakeholders were involved. A complex set of stakeholder groups was formed to perform various functions in this process. The three primary groups of stakeholders were: The Houston Environmental Foresight Committee, The Science Panel, and The Board of Selectors.
The Houston Environmental Foresight Committee, a multi-stakeholder citizen group, was given the task of ranking the environmental risks through a consensus process. The Board of Selectors approved the Foresight Committee members in early 1994 after consultation with a wide range of community organizations and elected officials. There were 32 members, 12 alternate members and 11 former members on the Foresight Committee. It was a diverse group, which included ministers, physicians, ethnic groups, environmental groups, community activists, lawyers, industry representatives, economic development coordinators, bankers, and river authority representatives. The Science Panel was a group of 6 highly respected scientists and academics. The purpose of the Science Panel was to compare environmental risks in the Houston region using available research and their best professional judgment. The Science Panel established three sub-panels to perform this task. The Ecosystems Sub-panel researched environmental risks to major ecosystems in the Houston region. The Human Health Sub-panel examined environmental risks from the point of view of risks to the health of people in the Houston region. Economic well being and quality of life for the Houston region were the research objectives of the Socio-economic Sub-panel. The Board of Selectors was composed of 17 policy makers and governmental agency representatives, whose job was to recommend the stakeholders for the Foresight Committee and the Science Panel.
The first phase of the Houston Environmental Foresight Program was based on an evolving approach known as comparative risk analysis. Over the past decade, the U.S. Environmental Protection Agency (EPA) has led the development of comparative risk, an analytical process and set of methods, used to systematically measure, compare, and rank environmental problems. Numerous state and local agencies have participated in this process, as well as academic organizations, think tanks, and others (HARC 1995, 1996). Houston Environmental Foresight was one of the first to be organized by the non-governmental sector. Early indications from Foresight and a similar program in Cleveland are that the non-governmental citizen-based approach is a viable alternative to the agency-based approach (HARC 1995, 1996, Wilson et al. 1999).
Methodology
An exploratory case study research methodology was chosen for this research. Data collection consisted of review and analysis of records and publications from the Foresight Committee proceedings and 9 in-depth interviews. Three HARC employees, the Science Sub-panel chairs, and 3 members of the Houston Environmental Foresight Committee were interviewed. The main purpose of the study was to examine the process related issues specific to participation, decision making and the role of Science. The semi structured

interviews focused on questions about stakeholders, participation, information and database, decision-making and outcomes.
Records and documents were reviewed and the interviews were conducted. The interviews were coded using Nudist 4 software. Analysis of the records, documents and interviews is still being conducted and results are forthcoming.
Discussion
This is an ongoing multi-stakeholder process involving three phases
spanning over 9 years. Phase 1 started in 1993 and ended February 1996. It was a comparative risk analysis process. This community and science-based program identified, examined, and ranked major environmental issues that face the 8-county air quality non-attainment region of Houston, Texas. It sought to blend community values and expert opinions to set environmental priorities. It was one of many comparative risk rankings around the country in the early 1990�s. A document called �Seeking Environmental Improvement: A Report of the Houston Environmental Foresight Committee� was published in 1996. Another outcome of this process was the first comprehensive environmental analysis in the Houston region published under �Houston Environment 1995�. This report was compiled by many of the region's top scientists and experts assembled as members of the Science Panel and Sub-panels.
When the risk ranking was complete and Phase 1 was ending many of the Foresight Committee and Science Panel members felt the work was not finished. A new committee called the Houston Environmental Foresight Steering Committee was created and funding was obtained for Phase 2. Phase 2 began in 1998 and ended in 2000. Citizens, industries, scientists, and policy makers came together and began the task of increasing public awareness about the rankings and developing policy recommendations. There were 17 steering committee members divided into 3 work groups (Habitat, Parks and Water; Toxins and Contaminants; Outdoor and Indoor Air). These work groups produced a document called �Recommendations for Environmental Improvement� in September 2000. Since this was a citizen-based group, there was no governmental agency facilitating this process and therefore, no avenue for policy making. One informant stated, �There was no clout�. Still feeling the work was not finished Phase 3 was planned and funding was obtained. Phase 3 began in March 2001, undertaking the task of promoting the recommendations from Phase 2 to policy makers. Some useful insights have begun to emerge from preliminary analysis of the interviews, documents, and records. While analysis has not been completed, a few preliminary insights are being offered in this paper. In Phase 1 the scientists and politicians were separated from the citizen-based Foresight Committee. This model came from a similar process in Cleveland. The EPA maintained a hands-off approach to the Houston Environmental Foresight Committee process. The Foresight Committee met with the Science Panel and identified issues. The Science Panel provided these issues to the Science Sub-

panels. Each Sub-panel developed independent criteria to prioritize the issues. The Sub-panels had to gather the existing scientific data and use their best professional judgment to prioritize their findings. They delivered their reports to the Science Panel who delivered the data and information to the Foresight Committee. Every stage of the issues identification, criteria development, and risk ranking process were complex and often contentious, requiring a great deal of communication between the Science panel and Foresight Committee.
The Science Sub-panel chairs were present at the Foresight Committee�s risk ranking session to answer any questions. The reasons for separating the science, as expressed by one of the project managers was, �We wanted the science panels work to speak to the science and not be an interpretation of the values of the Foresight Committee. We wanted the Foresight Committee to be the primary speaking voice of the project but we did not want that speaking voice to color too much what happened in the science panels.� This project manager considered separating the science and community stakeholders appropriate. Interestingly, a Science Panel member did not view it the same way and thought that instead of separating them, the scientists should have been included in the main Foresight Committee.
One interesting theme is how each Science Sub-panel faced interesting challenges due to the amount and quality of scientific information existing or available to them. Hence, each Science Sub-panel carried out their task differently. The Ecosystems committee had lots of scientific information available because of studies conducted for the Galveston Bay Estuary Program and other local watershed studies. However, the Human Health Sub-panel had difficulty finding scientific research on the local level. A few studies conducted by industry on the Houston Ship Channel were available but most of the available research for human health was conducted on a state or national level. In addition, no money was allocated for new scientific study or data gathering so they had to use their best professional judgment. The Socio-economic Sub-panel also had trouble finding local or regional studies and so, they devised their own study. They conducted economic modeling using existing data. This led the scientists to realize the holes in the scientific data for the Houston region and they made recommendations for future study.
Nine years has been spent on developing three high quality publications, educating the public on environmental risks and building relationships between scientists, industry and citizens in the Houston, Texas region. Further analysis of the data gathered in this study will address the research questions raised in this paper. It is clear however, that this was and is an innovative process of environmental risk ranking that has attempted to involve the citizens of the region, and is deserving of further study, particularly with respect to identifying factors that contribute to the effectiveness and success of such a process.
Acknowledgements
A grant from the Bush School of Government Program on Conflict and
Dispute Resolution (PCDR) program funded this research.

References
Berger, Peter and Luckmann, Thomas. 1967. The Social Construction of Reality. London, England: Penguin Books. (Reprint 1991. Original copyright was 1966).
Bush, Robert A. Barush and Folger, Joseph P. 1994. The Promise of Mediation: Responding to Conflict Through Empowerment and Recognition. San Francisco: Jossey-Bass Inc. Cothern, C. Richard. 1996. Handbook for Environmental Risk Decision Making: Values, Perceptions and Ethics. Boca Raton, Florida: Lewis Publishers Gray, Barbara. 1989. Collaborating: Finding common ground for multiparty problems. San Francisco: Jossey-Bass. Gray, Barbara. 1996. Cross-sectoral partners: collaborative alliances among business, government and communities. In Creating Collaborative Advantage. London: Sage Publications. (Chapter 4, p. 57-79). Gray, B. and Hay, T.M. 1986. Political Limits to Interorganizational Consensus and Change. Journal of Applied Behavioral Science, 22, 2:95-112. HARC. 1996. Seeking Environmental Improvement: Report of the Houston Environmental Foresight Committee. HARC. 1995. Houston Environment 1995. Jamal, T. 1997. Multi-party consensus processes in environmentally sensitive destinations: paradoxes of ownership and common ground. Ph.D., Faculty of Management, The University of Calgary, Calgary, Canada. Jamal, T. 1999. The Social Responsibilities of Environmental Groups in contested Destinations. Tourism Recreation research. 24, 2:7-18. Mitchell, R. K., Agle, B. R. and Wood, D. J. 1997. Toward a Theory of Stakeholder Identification and Salience: Defining the Principle of Who and What Really Counts. Academy of Management Review, 22, 4: 853-886. Orr, David W. 1999. Our Urban Future? The Ecologist, 29, 1, Jan/Feb. Susskind, Lawrence. and Ozawa, Connie. 1985. Mediating Public Disputes: Obstacles and Possibilities. Journal of Social Issues, 41, 2: 145-159. Trist, E.L. 1983. Referent Organizations and the Development of Interorganizational Domains. Human Relations, 36:247-268. Westley, Frances. 1995. �Governing Design: The Management of Social Systems and Ecosystems Design.� In Barriers and Bridges to the Renewal of Ecosystems and Institutions. L. H. Holling and S. S. Light (eds.). New York: Columbia University Press. (Chapter 9). Wilson, J. D., Kohlhase, J. E., & Strawn, S. 1999. Quality of Life And Comparative Risk in Houston. Urban Ecosystems. 3, 113-119 Michele D. Brown, Ph D Student Texas A & M University Department of Recreation, Parks and Tourism Sciences TAMU 2261 Francis Hall College Station, TX 77843-2261 Ph (979) 845-4723 Email [email protected]

RECONCILING FISHERIES MANAGEMENT AND WETLAND RESTORATION IN COASTAL LOUISIANA
Rex H. Caffey
Louisiana State University Agricultural Center and Louisiana Sea Grant Mark Schexnayder,
Louisiana State University Agricultural Center and Louisiana Sea Grant Several restoration techniques have emerged in response to Louisiana�s
dramatic coastal land loss crisis, which at 25-35 square miles per year, comprises about 80% of coastal wetlands loss nationally (Barras et al. 1994). Methods include barrier island restoration; shoreline stabilization using rocks, dredge spoil, or vegetation; and hydrological improvements to drainage and flow. Yet, the most widely advocated remedies hinge on strategic re-introduction (diversions) of waters from the Mississippi River (Day et al. 2000). The concept of using the river for the purpose of coastal restoration is not new, and various structures have been proposed and implemented over the past 50 years (Bowman et al. 1995). Small scale, siphon-type diversions have been in operation on the Mississippi River below New Orleans for almost 30 years. However, some of the commercial fishing sectors that once acknowledged the fisheries enhancement potential of crevasses have begun to question the fisheries benefits of large-scale, gated-structures. Larger freshwater diversions can cause basin-scale fisheries redistribution. Fishermen who have transitioned into the central and upper reaches of the estuary may lack the financial flexibility to forego short-term income for the prospect of long-term fisheries enhancement (Thomas 1999). Reduction, Displacement, and Enhancement
The initial influx of fresh water from a diversion results in an inevitable shift in
the salinity of receiving waters and can also shift the associated frequency and distribution of fisheries. The degree of this displacement depends on species-specific variables, structure location, flow-rate, and environmental conditions. Temporary reductions in harvest may occur as some fisheries migrate to new zones of optimal productivity. Adjusting to these changes has been costly for some commercial fishermen, but the ultimate merit of a diversion on fisheries cannot be measured by short-run impacts alone.
Beyond the reduction and displacement effects related to initial salinity changes, the lagged potential of diversions is an overall enhancement of estuarine productivity. Depending on the rate of flow, accretion of mineral sediments can help to counteract the effects of marsh erosion and subsidence nearest the diversion outfall. Nearest the structure, freshwater-borne nutrients can stimulate primary and secondary productivity. Additional vegetation provides more cover for larval fish and decomposition of vegetation augments the detrital food web. The positive impact of these effects on fisheries productivity is described in historical accounts

and supported by scientific research (Gunter 1957, Guillory 1999, Thomas 1999a). Yet the pattern of reduction-displacement-enhancement does not affect all fisheries equally. A review of one large-scale diversion project provides more insight on the implications of this pattern for various commercial and recreational fisheries.
The Case of Caernarvon The Caernarvon freshwater diversion structure provides a case study for
evaluating the fisheries implications of large-scale freshwater diversions. The Caernarvon diversion was first authorized under the Flood Control Act of 1965 and constructed between 1988 to 1991 at a cost of $26 million. The structure is located south of New Orleans on the east bank of the Mississippi River near the boundary of St. Bernard and Plaquemines parishes. The diversion has the capacity to redirect 8,000 cubic feet per second (cfs) of Mississippi River water into the marshes and bays of the Breton Estuary. The original project objectives included nourishment of emergent marsh vegetation, reduction of marsh loss, and enhancement of fisheries and wildlife productivity through re-establishment of historical salinity patterns (USACE 1998a).
The Louisiana Department of Natural Resources (LDNR) manages the structure with oversight from a Caernarvon Interagency Advisory Committee (CIAC) comprised of various state and federal resource management agencies, local governments, private landowners, and representatives from commercial fishing sectors. A subcommittee of the CIAC was convened in 1999 to discuss monitoring data on marsh enhancement, salinity, and fisheries. A summary of their findings is provided below.
Marsh Enhancement Nine sample sites monitored near the Caernarvon diversion outfall from 1991
to 1998 depicted a land gain of 406 acres, an 18% increase compared to pre-diversion operation (Villarubia 1999). Though some of this was caused by mineral accretion and organic fertilization, the primary contribution has simply been river water. Reduced salinities have allowed for significant increases in submerged vegetation, emergent vegetation, and marsh area. In the first four years of operation, the vegetative composition of the study area nearest the structure experienced a six fold increase in the area of fresh marsh, with 12% of the saline marsh having transitioned to brackish (Figure 1).
Initial concerns regarding the threat of nutrient pollution from river water have abated, and no problems with eutrophication have emerged. Recent analysis of nitrogen and phosphorus inputs at Caernarvon indicate rapid and near complete assimilation of these nutrients, suggesting that more water may be introduced into the Breton Estuary without detrimental effects to water quality (Lane and Day 1999).

Salinity As expected, salinity has been the water quality variable most influenced by the
Caernarvon diversion. In the easternmost portion of the Breton estuary, tides, winds, and frontal passages confound this effect. Depending on the rate and duration of flow, the diversion can have a significant impact on salinities in the central basin, and considerable reductions in salinity have occurred in the interior marshes to the immediate east and southeast of the structure. Compared to pre- diversion levels, mean salinity reductions of 33% to 85% have been recorded at finfish sampling stations between Bay Gardene and Lake Lery (Villarubia 1999).
Salinity data was collected in conjunction with fisheries independent sampling by the LDWF. Samples collected from 1988 to 1991 during the pre-construction biological monitoring program were compared to a post-construction period, 1992-1994. Combined with commercial harvest records, these samples help depict how commercial crustaceans, finfish, and oysters have adjusted to the post-construction salinity regime.
Figure 1. Intermediate to Brackish Marsh Boundary of the Breton Estuary before and after the Caernarvon Freshwater Diversion.
Figure 2. Commercial crustaceans rely heavily on low salinity marsh for food and shelter. Intermediate marsh (<5 ppt) is considered vital habitat for juveniles.
Crustaceans
Three species of crustaceans are of major commercial and recreational
importance in the coastal waters of Louisiana, brown shrimp (Farfantepenaeus aztecus), white shrimp (Litopenaeus setiferus), and blue crab (Callinectes sapidus). Each of these species follows a circular migration which encompasses a broad range of estuarine salinities (Day et al. 1989). Because commercial harvesting targets the late juvenile and adult stages, productivity is often incorrectly equated with higher salinities (Figure 2). Though higher salinities tend to favor harvestability, they are not directly linked to absolute productivity. Sampling by the Louisiana Department of Wildlife and Fisheries (LDWF) has confirmed significant nursery use by juvenile
Caernarvon Diversion
Pre-Project (1987)
Post-Project (1996)
Caernarvon Diversion
Pre-Project (1987)
Post-Project (1996)
Coastal Estuary
Gulf of Mexico
Highest frequency of juvenile abundance in LDWF sampling
from 1991-1996 (Thomas 1999b)
0.2 - 5 pptsalinity
Coastal Estuary
Gulf of Mexico
Highest frequency of juvenile abundance in LDWF sampling
from 1991-1996 (Thomas 1999b)
0.2 - 5 pptsalinity

brown shrimp occurs at salinities of 0.3 to 5 parts per thousand (ppt). Juvenile white shrimp and blue crab heavily use habitats with salinities as low as 0.2 ppt (Thomas 1999b).
Sampling of brown shrimp, white shrimp, and blue crab was conducted by LDWF using trawls and seines at 21 locations throughout the Breton Estuary. Spatially, there were some changes in shrimp catch between pre- and post-construction periods. Overall catch per unit effort (CPUE) for brown shrimp has been lower during post-construction sampling. CPUE was either equal, or slightly higher (depending on gear type), during post-construction for white shrimp. Sampling data for blue crab was inconclusive with respect to the effect of the diversion and salinity.
Data on commercial landings of shrimp and crabs was obtained from seafood dealers in the Breton basin. Some of these landings, however, were likely derived from harvests outside the area and should thus be considered carefully. Overall, commercial landings of brown shrimp have shown no detectable post-construction effect and cycled upward or downward in accordance with statewide landings. It is difficult to correlate diversion impacts with white shrimp landings since they were not correlated with state landings either pre- or post-diversion operation (USACE 1998b). Local buyers have not corroborated reports by commercial fishermen of decreased blue crab harvests, and crab landings at one major port, Delacroix, have were notably higher during the post-construction period (Cosse 1999).
Clearly, salinity reductions caused by Caernarvon to the interior estuary have resulted in a seaward shift of the optimal harvest zones for brown shrimp. Some displacement has also occurred in white shrimp and blue crab landings, though no significant reductions in the commercial catch of these species have been recorded. Meanwhile, the low salinity marsh created by Caernarvon is expanding the nursery habitat required for juvenile development of brown shrimp, white shrimp, and blue crab.
Finfish
Post-construction catch rates increased significantly at LDWF sampling
stations for seven of eight fin fish species monitored (Table 1). Some of this increase may have been caused by a rebound of stocks following a severe freeze in December 1989. Though spotted seatrout is the species likely most affected by the freeze of 1989, post-construction commercial landings in St. Bernard Parish depicted a greater than average decrease in comparison to the statewide average. Some of this difference has been attributed to newly imposed gear restrictions and a partial switching of commercial effort to the mullet fishery (Mugil cephalus). From a recreational standpoint, charter boat operators targeting spotted seatrout have reported some displacement of the fishery since the freshwater diversion began, but the overall recreational catch has not been affected detrimentally (Roberts 1998). For the remaining commercial species, commercial landings data from finfish dealers in the Delacroix/Ysclosky area showed no pre/post statistical difference in comparison to the control site, Terrebonne Parish (USACE 1998b).

In the wake of the diversion, two fisheries have been revived. A dip net fishery for shad (Dorosoma cepedianum) has developed in the diversion tail waters. Shad is typically a very low value species, primarily sold in Louisiana as commercial fish bait. Conversely, largemouth bass (Micropterus salmoides) is the nation�s premier recreational fish species of economic importance, and the fresh and intermediate marsh expansion at Caernarvon has spawned a tremendous rebound of the largemouth bass fishery that once existed in the region.
Table 1. Influence of the Caernarvon Diversion on Finfish from Pre-Construction (1988-1991) to post construction (1992-1994) .
Species LDWF
Sampling Commercial Landings
Spotted Seatrout (Cynoscion nebulosus) Red Drum (Sciaenops ocellatus) Black Drum(Pogonias cromis) Sand Seatrout (Cynoscion arenarius) Sheepshead (Archosargus probatocephalus) Atlantic croaker (Micropogonias undulatus) Spot (Leiostomus xanthurus) Gulf menhaden (Brevoortia patronus)
Decrease Increase Increase Increase Increase Increase Increase Increase
Decrease No Change No Change No Change No Change No Change No Change No Change
The Oyster Issue
The influence of freshwater diversions on production of the eastern oyster (Crassostrea virginica) is arguably one of the most controversial issues associated with coastal restoration in Louisiana. The roots of this conflict derive from the fixed bottom character of the fishery and the history of oyster lease tenure in Louisiana. The eastern oyster is a sessile, filter-feeding mollusk that colonizes hard substrates in beds or �reefs� of the middle-estuary, usually in plankton-rich waters of 5-15 ppt salinity. Though much of this habitat has been lost due to coastal erosion and other habitat alterations, Louisiana remains a top U.S. oyster producer, with more than 350,000 acres generating around $35 million a year in economic activity (Louisiana Oyster Task Force 2001). The oyster industry is also one of the state�s oldest commercial sectors, dating back to the early 1800s when oysters were harvested from public reefs for local consumption. By the late 1800s, a system of private oyster mariculture had developed whereby seed oysters were transplanted onto privately maintained beds (Deseran and Riden 2000). Since 1902, the state has operated a lease program in which coastal water bottoms can be rented for private oyster production at an annual cost of $2 per acre.
Records from LDWF show that approximately 8,200 private oyster leases were held in coastal Louisiana when the Caernarvon diversion became operational in 1991. By then, as in other areas of the state, the interior marshes of the Breton Estuary had become dominated by private leases, and most of the public �outside� reefs were under state control. The public reefs of the Breton Estuary are an important source of juvenile �seed� oysters throughout southeast Louisiana, and

enhancement of seed production on these outside reefs was a primary objective of the Caernarvon project. Pre and post-diversion monitoring was conducted by the LDWF at 41 stations in the Breton estuary to determine the effect of the diversion on growth and mortality of mature oysters, recruitment of seed oysters, and the density and availability of oysters on outside reefs.
Commercial oyster landings were monitored using boarding surveys on the public grounds, dockside interviews, and roving surveys of commercial fishermen. The opening of Caernarvon was delayed until late 1991 because of an excessively high river stage and rainfall that led to overbank flooding and extensive oyster mortality throughout the estuary. Flow rates remained under 2,000 cfs throughout 1992, but then increased to more than 7,000 cfs on several occasions between December 1993 and February 1994. Monitoring data during this later period showed high levels of mortality, 100% in some cases, for oysters on sampling trays very near the structure.
Abrupt oyster mortality at interior stations was likely due to extended periods of salinity below 5 ppt, the minimum threshold for oyster survival. Conversely, the outward migration of the optimal production zone has revived beds that had become dormant because of excessive salinity, and has bolstered seed production on public reefs (Figure 3).
Figure 3. Oyster Boarding Survey Grid. Note increased production on public reefs.
Figure 4. Seed and Sack Oysters on the Public Grounds East of the Mississippi River before and after Caernarvon.
Dockside interviews and fishermen surveys indicated that overall, production of oysters in the Breton estuary increased dramatically in the first three years of diversion operation (Caernarvon Post Construction Report, 1998). Elevated harvest levels continue to be sustained, and the local industry is restructuring into one more reliant on public oyster grounds (Figure 4).
The seaward shift of oyster production resulting from Caernarvon was an expected outcome, and was predicted in the project�s Environmental Impact Statement of 1984. This expectation was based on a historical reports of oyster
5000
4000
3000
2000
1000
74 76 78 80 82 84 86 88 90 92 94 96
Year75 77 79 81 83 85 87 89 91 93 95 97 99
98 00
Bar
rels
X 1
000
Pre-diversionPost-diversion
5000
4000
3000
2000
1000
74 76 78 80 82 84 86 88 90 92 94 96
Year75 77 79 81 83 85 87 89 91 93 95 97 99
98 00
Bar
rels
X 1
000
Pre-diversionPost-diversionPre-diversionPost-diversion
Decrease (total sacks, pre to post)Increase (total sacks, pre to post)
Public SeedGrounds Boundary
Caernarvon Diversion
Decrease (total sacks, pre to post)Increase (total sacks, pre to post)
Public SeedGrounds Boundary
Caernarvon Diversion

productivity associated with breaches in levees (crevasses) dating back to 1906 (Gunter 1952). In 1927, Percy Viosca, Jr., fisheries director for the agency that would eventually become the LDWF, described the effect of a crevasse on oyster production ��it is true that on the coast some of the oyster beds close in are destroyed by excessive amounts of freshwater, but likewise many older reefs are rehabilitated�the result in the case of oysters is largely a shifting of certain fishing grounds but the total oyster crop is decidedly increased.�
A voluntary lease transfer program offered by the LDWF in 1990 saw only limited participation and private oyster leaseholders have filed suit against the state, arguing the diversion�s effect on their leases equates to a �takings� issue, an effective loss of private property. Resolution of the oyster issue at Caernarvon now hinges on a judicial interpretation of property rights and economic impact. Earlier litigation in federal court was decided on behalf of the Corps, but recent local rulings have sided with the oyster industry. Currently, there is more than $560 million in oyster judgments against Caernarvon (Dunn 2002). Although these judgments will likely be challenged upon appeal, the magnitude of this issue has prompted recent calls for legislative action, including a proposed moratorium on new oyster leases (Committee on the Future of Coastal Louisiana 2002).
Another Diversion
Experiences with Caernarvon are influencing the operation of a larger capacity
diversion recently constructed at the head of the Barataria Estuary. Before the Davis Pond Freshwater Diversion became operational, commercial oystermen were afforded advanced opportunity to participate in a $7.5 million �oyster lease relocation program,� which provides for the retention, exchange, relocation, or purchase of private leases (Louisiana Sea Grant 2000). Participation in the new oyster lease relocation program has been 100% to date. However, seasonal fisheries accommodations (eg. brown shrimp and white shrimp) are already dominating the flow regime of the new structure (Marshall 2001).
Sustainability Conflict
The challenge of minimizing fisheries impacts while maximizing the restoration
potential of large-scale diversions is an example of the classic sustainability conflict between short-run and long-run objectives. In evaluating this conflict from a historical perspective, it is clear that levees constructed on the Mississippi River have disrupted the natural deltaic cycle that characterized coastal Louisiana prior to the 20th century. The estuarine productivity supported by that cycle has also been disrupted, a fact illustrated by Louisiana�s accelerated loss of coastal wetlands. Data from Caernarvon indicate that large-scale diversions can result in displacement of certain commercial fisheries. However, the ultimate effect on most fisheries appears to be one of enhancement. Oyster production at Caernarvon has followed a displacement-enhancement pattern that is consistent with historical accounts of the effect of crevasses on estuarine productivity.

Future Considerations
Predicting the effect of diversions on fishery species is difficult because of many complicating factors. Clearly, freshwater diversions can have negative impacts on some fisheries in the short term, just as they can enhance the productivity of other fisheries. Louisiana faces difficult questions as it attempts to reconcile short-run fisheries impacts with the long-term coastal restoration objective of diversions. Many of these questions reflect the state�s traditional orientation toward the immediate value of our coastal resources: Do temporal losses to the commercial oyster sector constitute �takings� based on tacit property rights? Should the public compensate fishermen if they are genuinely impacted? If compensation is in order, how should it be calculated?
Beyond these short-term issues, even larger questions loom: To what extent should short-run fisheries implications influence the flow regimes of large-scale river diversions? What are the long-term environmental and economic costs associated with such accommodations? Though many uncertainties abound regarding large-scale diversions, future use and management will hinge on the reconciliation of short-term fisheries concerns and the long-term goal of coastal wetland restoration.
Acknowledgements
This publication was developed by the Louisiana State University Agricultural Center and the Louisiana Sea Grant College Program with research funding provided by the Coastal Wetland Planning, Preservation, and Restoration Act. Special thanks is extended to Bruce Baird (USACE) and Glenn Thomas (LDWF) for technical review of the manuscript.
References Baras, J.A., Bourgeois, P.E., and L.R. Handley, 1994. Land Loss in Coastal Louisiana, 1956-1990. National Biological Survey, National Wetlands Research Center Open File Report 94-01. Lafayette, Louisiana. Bowman, P.E., Perret, W.S. and J.E. Rousell, 1995. Freshwater Introduction and Implications for Fisheries Production in Louisiana, Louisiana Department of Wildlife and Fisheries, non-published manuscript. Caffey, R. H. and M. Schexnayder, 2001. Fisheries Implications of Freshwater Diversions, in �An Interpretive Topic Series on Louisiana Coastal Wetland Restoration�, Coastal Wetland Planning, Preservation, and Restoration Act Outreach Committee (eds.) 8/01, 7pp Committee on the Future of Coastal Louisiana. 2002. Saving Coastal Louisiana: Recommendations for Implementing an Expanded Coastal Restoration Program. Baton Rouge, LA: Governor�s Office of Coastal Activities.

Cosse, C. 1999. Caernarvon Subcommitte on Marsh Enhancement and Fisheries Monitoring, US Army Corps of Engineers, District Assembly Room, October 21, 1999. Day, J.W., Hall, C.A.S., Kemp, W.M., and A.Yanez-Arancibia (1989) Estuarine Ecology. ISBN 0-471-06263-4 Day, J. W., G.P. Shaffer, L.D. Britsch, D.J. Reed, S.R. Hawes, and D. Cahoon, 2000. Pattern and Process of land Loss in the Mississippi Delta: A Spatial and Temporal Analysis of Wetland Habitat Change, Estuaries, Vol. 23, No. 4, p. 425-438. Deseran, F.A., and C. Riden, 2000. Louisiana Oystermen: Surviving a Troubled Industry. Louisiana Sea Grant College Program, May 2000. Dunn, M., 2002. Freshwater diversion project ruined oyster beds, judge rules: Oyster farmers net millions in case. The Advocate, Baton Rouge, La, 2/24/02. http://www.theadvocate.com/news/story.asp?StoryID=28068. Guillory, Vincent, 1999. Relationship of Blue Crab Commercial Landings and Recruitment to River Discharge and Salinity, Proceedings of the Annual Conference of the Southeastern Association of Fish and Wildlife Agencies 53:1-7. Gunter, G. 1952. Historical Changes in the Mississippi River and the Adjacent Marine Environment, Publications of the Institute of Marine Science, University of Texas. Vol 2(2). Gunter, G., 1957. Wildlife and Flood Control in the Mississippi Valley, Transactions of the Twenty-second North American Wildlife Conference, March 4-6, 1957, Published by the Wildlife Management Institute, Wire Building, Washington 5, D.C. Lane, R.R. and J. W. Day (1999) Water Quality Analysis of a Freshwater Diversion at Caernarvon, Louisiana, Estuaries, Vol. 22, No. 2A, p. 327-336. Louisiana Oyster Task Force (2001) http://www.louisianaoysters.org Louisiana Sea Grant Legal Program (2000) An Oyster Fisherman�s Guide to Louisiana�s Oyster Lease Relocation Program. LRS 56:432.1 et. seq., LAC 43:I, Chapter 8,850. Marshall, B. 2001. Turning Back the Clock: The opening of the long awaited Davis Pond Freshwater Diversion Project is expected to be a boon to fish and wildlife, New Orleans Times Picayune, Section D, Pages D1 and D6, 4/18/01. Roberts, N. (1998) Carenarvon�s Impact on Fisheries: A Sportsman�s Perspective, pp. 47-50 in �Freshwater Diversion: A Public Forum�, J. Horst, moderator, Louisiana Sea Grant Marine Advisory Service, Louisiana Cooperative Extension Service, October 1998. Thomas, R. G. 1999(a). Fish habitat and coastal restoration in Louisiana. Pages 240-251 in L. R. Benaka, editor. Fish habitat: Essential fish habitat and Rehabilitation. American Fisheries Society, Symposium 22, Bethesda, Md Thomas, R. G 1999(b). Caernarvon Subcommitte on Marsh Enhancement and Fisheries Monitoring, US Army Corps of Engineers, District Assembly Room, October 21, 1999. USACE 1998(a). Caernarvon Freshwater Diversion Project Fact Sheet, http://www.mvn.usace.army.mil/prj/caernarvon.htm

USACE, 1998(b). Caernarvon Freshwater Diversion Structure Monitoring Program Post Construction Report (1998), US Army Corps of Engineers, New Orleans District and Louisiana Department of Wildlife and Fisheries. Viosca, P., Jr. (1928) Flood Control in the Mississippi Valley in it�s Relation to Louisiana Fisheries , 1927, Convention of the American Fisheries Society, Tehnical Paper No. 4, Department of Conservation, New Orleans Court Building. Villarubia, C. (1999). Caernarvon Subcommitte on Marsh Enhancement and Fisheries Monitoring, US Army Corps of Engineers, District Assembly Room, October 21, 1999. Rex H. Caffey Extension Specialist (Wetland & Coastal Resources) LSU Agricultural Center and Louisiana Sea Grant College Program Room 179, Department of Agricultural Economics and Agribusiness LSU, Baton Rouge, LA 70803-5604 Ph (225) 578-2266 Fax: (225) 578-2716 E-mail: [email protected] Mark Schexnayder Coastal Advisor LSU Agricultural Center and Louisiana Sea Grant College Program Jefferson Parish Cooperative Extension Service 6640 Riverside Dr., Ste. 200 Metairie, LA 70003 Phone (504) 838-1170 Fax: (504) 838-1175 E-mail: [email protected]

THE THREAT TO GULF OF MEXICO COASTAL WATERS FROM NONINDIGENOUS SPECIES IN THE BALLAST WATER OF SHIPS
By Marilyn Barrett-O’Leary
Introduction New aquatic species are introduced into coastal waters of the United States every day, deliberately and accidentally. Nonindigenous fishes, amphibians, and plants are intentionally imported in the aquarium and water garden trades; alternate or additional species are stocked for sportsmen by state agencies and private pond and lake managers. Agricultural and environmental managers introduce nonindigenous species to control invasive ones; conservationists introduce new species to fill a niche left by extinction. The aquaculture trade and individual ethnic groups introduce nonindigenous species to increase or improve food supplies. Every introduced species might be harboring others — as a disease or parasite, or as hitchhiking larvae or seed. They can be introduced on and in vessels, containers, people, or cargo. The reliability and thoroughness of inspection of imports depend upon the commodity and agency jurisdictions. The success of a species in a new ecosystem is a gamble. A species may be introduced several times before conditions are right for survival. Invasive species, however, have an edge on the odds because they are usually very adaptable, reproduce rapidly and easily, and receive and process nourishment efficiently. Only human alterations to the environment such as canals, roads, levees, and mining water and minerals are considered to be greater causes of the loss of biological diversity (Carlton 2001), and those actions may provide the living conditions that allow an introduced species to succeed and perhaps alter an ecosystem. The time lag between introduction and discovery is not consistent — sometimes days or weeks, but often years. Monitoring and inspection may shorten this lag period, but will seldom reverse it. However, to guarantee no introduction and spread, the whole structure of world commerce and modern life, as we know it, would have to change. That is not going to happen. Instead, people around the world must develop ways to manage aquatic and terrestrial invasive species in order to minimize impact. Otherwise ecosystems could be irreversibly altered or biodiversity severely reduced.
What is the Magnitude of the Threat to US Coastal Waters? The magnitude of the threat depends upon the invading species and the system that is being threatened. We have no irrefutable record of dimension because no consistent process of cataloging and monitoring bioinvasions has been used

throughout our nation’s history or during the natural history of the earth. The origin and history of many species is unknown, or only partially known, because some species cannot be positively identified without genetic information (which was not available historically), and the number of taxonomists and aquatic researchers in the world is declining. Almost every list includes a disclaimer that some species are cryptogenic — of unknown origin. Hundreds of introduced species are living in U.S. coastal waters; over 175 introduced marine invertebrates, fish, algae, and plants live in San Francisco Bay alone, 50 in Puget Sound, and about 43 in Chesapeake Bay (Carlton 2001). The Gulf Regional Panel on Aquatic Nuisance Species estimates that more than 450 introduced aquatic species have occurred in the US Gulf of Mexico region (GMP ISFT 2000 [Appendix B]). However this estimation does not separate marine and fresh water species and the information was gathered from diverse sources. The Gulf of Mexico region is one of the least studied in the country, possibly because of its size and the fact that it washes the shores of three countries — the U.S., Mexico, and Cuba. The rate of known introductions into the U.S. is increasing exponentially. While there were about 50 new introductions between 1910 and 1930, there were about 150 between 1970 and 1999 (Carlton 2001 [Fig. 4]). Ballast water from ships is believed to be one of the major vectors contributing to this increase. Seven of the nation’s top ten ports by tonnage are located in the Gulf of Mexico region (US Army Corps of Engineers 2000), and two of those — South Louisiana and Houston — are ranked among the top 10 in the world (American Association of Port Authorities 1998). Thus the magnitude of the threat appears to be comparatively large in Gulf of Mexico coastal waters.
What is the Extent of the Threat from Ballast Water?
There are several ways to think about the extent of threat posed by ballast water — by volume of ballast water that can bring invasive species, by volume of commerce and type of shipping that can bring or receive invasive species, and by effects on economies. Ballast Volume
In volume, approximately two million gallons of ballast water containing nonindigenous plants and animals are released every hour somewhere in the world (Carlton, Reid, and Leeuwen 1995). A great number of nonindigenous plants and animals can live and grow in ballast tanks and cargo holds over long periods (Smith, Wonham, McCann, Reid, and Carlton 1996), and about 7,000 species are moved to new ecosystems every day (Carlton 2001). Ballast water represents quite a dynamic potential threat.

Shipping and Commerce Shipping, extremely important to the U.S. economy, has been identified as a significant vector for transporting species to new areas of the world. During the past two decades, world trade by sea has increased continuously and in the U.S., over 95 percent of imports and exports are transported by sea (Kramek 1999). Almost 45 percent of U.S. shipping tonnage pass through Gulf of Mexico ports (Gulfwatch 1999). Two of the major inland shipping highways, the Mississippi Waterway and the Tennessee-Tombigbee Waterway, carry commodities to and from Gulf coastal waters. Although ballast volumes and systems differ among types of vessels, ballast is universally used by ships for stability. Presently, vessels voluntarily exchange ballast water in the open ocean. This management technique changes the salinity in the ballast tank from fresh- to saltwater, theoretically reducing the probability that organisms picked up in one port during ballasting will survive after deballasting in another port. However, ballast tanks are never completely empty. At any one time, a ballast tank might contain both fresh water and saltwater species from several areas of the world, and species in a dormant state may be present. Nationally only about 20 percent of vessels entering US coastal waters have reported performing open ocean ballast exchange. At present, exchange is a voluntary act, and it is technically required only of vessels when they first enter U.S. Gulf of Mexico waters from the Atlantic or Pacific. Existing data demonstrate a threat to Gulf of Mexico waters from lack of open ocean exchange. During the nine months between July 1, 1999, and March 31, 2000, only 16 percent of the vessels reporting entry into coastal waters did an open ocean exchange, and 37 percent of those reporting vessels discharged ballast in U.S. waters. The volume discharged was about 4,287,014 gallons (National Ballast Water Information Clearinghouse 2000). In addition, the natural salinity level in some of the region’s ports, such as Tampa, is much higher than in others, improving the survivability of invasive salt water species acquired during open ocean ballast exchange. Bulk carriers (bulkers), extremely common in Gulf of Mexico coastal ports, discharge the largest volume of ballast water in port while taking on cargo, and their voyages are more likely to link ports on different sides of the world. Although tankers and general cargo vessels typically discharge less ballast water than bulkers, they carry large volumes of ballast and also do a lot of business in the Gulf of Mexico coastal waters (Barrett-O’Leary 1998-99). Thus, substantial shipping commerce in the Gulf of Mexico region can carry invasive species into coastal waters, and their presence can result in disruptions of one of the most broadest segments of the region’s economy, shipping.

Economic Effects Seventy percent of all ton-miles of US waterborne commerce and 60% of all waterborne shipped petroleum and petroleum products occur in Gulf waters. Shipping has increased more than twice the national average in recent years. The nominal value in 1992 was $81.3 million (Cato, J. and C. Adams 1999). Industrial operations can also be disrupted. Invasive species are potential foulants for industries using coastal surface water, including power generators, chemical plants, agricultural irrigation systems, and flood control systems. The intakes and sea chests on many inland towboats are treated for an invasive species, particularly zebra mussels, during regular maintenance cycles. Treatment is expensive, but without it, production efficiency can be disrupted or reduced. The recreational boating and angling industries, and the larger associated tourism industry, can be adversely affected by invasive species. The owners of the approximately two million registered recreational boats in the five Gulf states (National Marine Manufacturers Association 2001) contribute directly and indirectly to local economies. For example, in 1999 each angler contributed about $92 per day directly to local economies for lodging and travel alone (Haab, Whitehead and McConnell 2000). In coastal waters, through multipliers, this industry contributed about $12.5 billion to local economies across the southeastern states in 1999 (Gentner, Price, and Steinback 2001 [southeastern states were defined as the states from North Carolina to Louisiana, not including Texas]. Invasive plants have disrupted some angling and duck hunting areas of Gulf States, generating pressure on state legislators and wildlife agencies. Gulf of Mexico coastal waters include some of the most productive estuaries in the country. These are the nurseries for marine animals, some that spend adult years in the Atlantic Ocean. Officially, the commercial fishing industry in the region accounts for 25% of the nation’s seafood landings and about 21% of the dockside value of fishery landings, a value in 1993 of about $628 million. (Cato, J. and Charles Adams 1999). However, these figures do not include value for fishes caught in the Atlantic fisheries that may spend their juvenile stages in Gulf coastal waters. Aquaculturists use inland and coastal waters to raise popular food fish species such as crawfish, shrimp, and tilapia, as well as fingerlings of native species for bait, and recreational and conservation stocks. The aquaculture industry transports product in water, creating the possibility of transmission of invasive parasites, diseases, and other pathogens. This vector can affect the natural resource, seafood processing and harvesting industries in the region as well. For example, three shrimp viruses, known to be found around the world including the Gulf shrimp populations, have occasionally infected specific Gulf region populations. This threat can be costly. In 1997, the Gulf region had almost 400 shrimp harvesting and processing

businesses, plus businesses harvesting and processing saltwater finfish, shellfish, and crustaceans (GMP ISFT 2000 [Chapter 5]).
Conclusion Invasive species pose a definitive but difficult-to-quantify threat to Gulf coastal waters. Large volumes of ballast water are carried here in the ballast tanks of many vessels involved in world trade, contributing greatly to this threat. Because ballast tanks are never completely emptied, an unknown and periodically changing mixture of water quality characteristics may support an unknown combination of living organisms. If the right invader disrupts commercial or recreational fishing, aquaculture, shipping, or related businesses, it can threaten the ecology and economy of the Gulf of Mexico coast. There can be many right invaders, and many right times. The threat requires management to control it.
References Cited
American Association of Port Authorities. 2002. “World port ranking 1998.” Port Industry Statistics. http://www.aapa-ports.org/industryinfo/statistics.htm. Barrett-O’Leary, M.. 1998-99. Assessing the potential for introduction of nonindigenous species through US Gulf of Mexico Ports. Louisiana Sea Grant College Program. Louisiana State University, Baton Rouge, Louisiana Cato, J. and C. Adams. 1999. “Economic significant of the Gulf of Mexico related to population, income, employment, minerals, fisheries, and shipping,” The Gulf of Mexico Large Marine Ecosystem. H. Kumpf, K. Steidinger, K. Sherman, Eds. Blackwell Science Inc. Ch. 2. Carlton, J.T. 2001. Introduced species in US coastal waters: environmental impacts and management priorities. Pew Oceans Commission, Arlington, Virginia. http://www.pewoceans.org. Carlton, J. T., D. Reid, and H. van Leeuwen. 1995. Shipping Study I. The role of shipping in the introduction of nonindigenous aquatic organisms to the coastal waters of the United States (other than the Great Lakes) and an analysis of control options. The National Sea Grant College Program/Connecticut Sea Grant Project R/ES-6. Prepared for the US Coast Guard, the US Dept. of Transportation. Report No. CD-D-11-95. Gentner, B., M. Price, and S. Steinback. August 2001. Marine angler expenditures in the southeast region, 1999. U.S. Dept. of Commerce. NOAA Technical Memorandum NMFS-F/SPO.

GMP ISFT (Gulf of Mexico Program Invasive Species Focus Team). 2000. An initial survey of aquatic invasive species issues in the Gulf of Mexico region. Version 4. EPA 855-R-00-003. September 2000. Gulfwatch., Fall 1999. “Ballast water exchange as a solution to the introduction of exotic species.” US Dept. of Agriculture Natural Conservation Service and US EPA Gulf of Mexico Program. Vol.10, No.3, p.10. Haab, T., J. Whitehead, and T. McConnell. 2000. “The economic value of marine recreational fishing in the southeast United States,” 1997 Southeast Economic Data Analysis, National Marine Fisheries Service. www.st.nmfs.gov/st1/recreational/. Kramek, R. E. 1999. America’s shipbuilding industry reality and opportunity. Address at Shipbuilding Designs ’99, Dec. 7, 1999. President of American Bureau of Shipping Americas Division. http://www.eagle.org/news/speeches/REK99Dec.html. National Ballast Water Information Clearinghouse, National Marine Invasions Center, 2000. National Ballast Survey (NABS) Quarterly Report #3 and First Annual Report. Smithsonian Environmental Research Institute. http://invasions.si.edu. National Marine Manufacturers Association. 2001. State Recreational Boat Registrations. Published online using figures from the US Coast Guard. http://www.nmma.org/facts/boatingstats/2001/files/boatregistrations.asp Smith, L. D., M. Wonham, L. McCann, D. Reid, and J. Carlton. 1996. Shipping Study II. Biological invasions by nonindigenous species in United States waters: quantifying the role of ballast water and sediments. Parts I and II. Smithsonian Environmental Research Center. Prepared for the US Coast Guard and the US Dept. of Transportation. Report No. CG-D-02-97. US Army Corps of Engineers, Institute for Water Resources. 2000. US port ranking by cargo volume 2000. Navigation Data Center. http://www.iwr.usace.army.mil/ndc/wcsc. Marilyn Barrett-O’Leary NIS Coordinator - Louisiana Sea Grant College Program 103 Sea Grant Building Louisiana State University Baton Rouge, LA 70803-7507 USA Ph (225) 578-6349 Fax (225) 578-6331 E-mail [email protected]

TAXI!!! INDUSTRY PERSPECTIVES AND APPROACHES TO BALLAST WATER TREATMENT
Kathy J. Metcalf, Director, Maritime Affairs
Introduction
For thousands of years, the vast majority of the world�s trade has been transported aboard seagoing vessels. During this period, ballast has been seen as a necessary evil to ensure vessel stability in heavy weather conditions or in load conditions, which approach the structural design parameters of the vessel. This initial �evil�, as defined by mariners, is one which requires an operation e.g. ballasting for safety reasons, which takes precious time in the normal operating cycle of a vessel and results essentially in carriage of a �cargo� that does not produce revenue. Early in maritime history, the ballast of choice was stone, due to its ready and inexpensive availability. Within the last two hundred years, coastal water has become the ballast of choice due not only to its ready availability but also because stones discharged by vessels in ports do not promote ship or port interests in maintaining adequate channel depths for navigation.
Throughout maritime history, it has been recognized that the ideal voyage is one on which the ship carries revenue producing cargo on all legs of the voyage and ballasting is unnecessary. Unfortunately, trading patterns and ship types do not always operate in the ideal world and as a result, most ships require various degrees of ballasting during their normal operations. For example, container ships and passenger vessels typically have revenue-producing cargo or passengers aboard during all legs of their voyages but still require ballasting of relatively small volumes of water on a frequent basis to maintain ship�s trim and prevent list. Conversely, tankers and bulk carriers do not always have cargo aboard and require ballasting of large volumes of water on an infrequent basis e.g. at the discharge port for the transit to the next load port. This diversity of ship types coupled with the diversity of marine ecosystems is now the landscape with which we must deal in addressing and solving the problem of aquatic nuisance species (ANS) transfers in ships� ballast water.
What Problem?
Society, in general, and the scientific and maritime communities, in
particular, have become far more refined relative to impacts from diverse uses on the marine environment than ever before. The benefit of such advancement in knowledge has naturally led to the identification of negative impacts on the marine environment by human intervention and activities, which prior to this period of enlightenment, were seen as minimally intrusive if not completely harmless. Such was the case with the transfer of ANS via ballast water.

However, we can no longer plead ignorant bliss. The time is past to argue for delay pending results from yet another study. The facts are in, the problem is confirmed, and we all have a critical part to play to address the problem in a manner which affords protection to our marine resources and yet does not impair global maritime trade. It is our belief that this is an achievable end which is not really an end at all, but rather an evolutionary process where improvements in technologies and scientific knowledge will continuously challenge us to �get better� at minimizing the impacts of ANS.
Industry Perspectives on Current Initiatives Accepting the premise that marine vessels are the largest vector for
unintentional transfers of ANS, recognizing that the marine industry is global in nature and acknowledging the vast diversity of coastal ecosystems, leads to the conclusion that the solution must be global in nature and yet provide the necessary flexibility to address the unique circumstances of receiving ecosystems on a regional, national and, perhaps in some cases, a sub-national basis.
The industry strongly supports the decade long initiative at the International Maritime Organization (IMO) which will lead to the finalization of a ballast water management treaty in 2003. This treaty, we believe, will result in a basic regulatory framework for the management of ballast water worldwide, which is endorsed by nations and accepted by the industry. The treaty is also expected to contain provisions which will permit establishment of regional ballast water management areas which will enable �localized� tailoring of the requirements to meet a region�s specific needs.
Parallel to the IMO process, is a similar process led by the US Coast Guard in developing a national ballast water management program which the industry also supports providing it is consistent with the international requirements. The same support cannot be provided to state and/or local initiatives which may not be consistent with the national and international requirements and thereby impede the free flow of maritime commerce. While it is understandable that a number of states and a few local ports have implemented their own programs (which to date, are generally similar to the existing US Coast Guard voluntary program) due to the lack of mandatory international and national requirements, such consistency in the future cannot be guaranteed and could well result in a series of conflicting requirements for vessels calling in multiple ports.
Other important initiatives, too numerous to cite but strongly supported by industry, are also underway to identify research and development needs in the areas of invasion biology and technological solutions for ballast water management, including treatment methods. Significant public and private resources are being expended to further enhance our knowledge of ANS invasions and practical methods by which these invasions can be minimized through ballast water management.

Ballast Water Management Technologies
The current �technology� benchmark for �effective� ballast water management is ballast water exchange which entails the replacement of coastal water loaded in the ballast tanks with deep ocean water. The alleged effectiveness of this technology is based on the diversity of the coastal and deep sea environments and the assumption that coastal organisms are unlikely to survive in deep ocean water. While this may be valid for some organisms, it is not a foregone conclusion with the diverse taxa, which are found in ballast water. Practical vessel operational problems further complicate the use of ballast water exchange since it cannot be done in some circumstances due to weather and/or ship design characteristics and is not effective in addressing organisms embedded in the tank sediment.
Acknowledging that ballast water exchange is all we have at this point while recognizing its inadequacies forces us to focus on what, if anything, is �out there� that can provide more effective and predicable results in a manner that can be adapted to the sometimes harsh shipboard environment. The first step in answering this question is to determine what technology works on what types of organisms in what dosages. This can be answered by subjecting a series of surrogate organisms to a particular technology and quantifying its impact on these organisms. The next step in the process requires a comprehensive evaluation of a shore tested technology by individuals with expertise in the fields of marine engineering, vessel operations and naval architecture. This "ground truthing" step is critical to determine whether a technology tested on a shore-based test bed may be reasonably expected to perform in a similar manner when installed aboard a ship, taking into consideration ballast water flow requirements of the vessel, availability of space for installation and operational parameters which may impact the effectiveness of the technology. The final step in this process is to actually install test systems aboard vessels to determine how well they actually work in the normal operating environment on vessels. This final stage is focused on how well the system actually can be integrated into normal operating parameters of the vessel, its systems, and obviously, how well the system actually reduces or eliminates ANS in the ballast water. Specific technologies currently undergoing testing at some stage of this process include physical separation including filtration and centrifugal/voraxial separators, thermal, ultraviolet and/or biocide applications. Based on preliminary data, it would appear that some combination of these technologies will provide the best mitigation of ANS impacts in the most operationally efficient manner.
So What Are We Waiting For?
With so much at stake, including the protection of marine resources and
maintenance of uninterrupted international trade, why has it taken a decade to address this issue, and on what must we focus to move the process forward?

First, we must recognize that our first steps at control of ANS must be measured, yet effective. Simply put, we must be willing to accept that something is better than nothing and that this �something� will evolve over time with technology development and scientific knowledge to produce better efficiencies with each iteration.
Second, we need a mandatory national ballast water management program that requires all vessels calling in US ports from outside the EEZ to conduct some type of ballast water management. To be successful in its protection of the marine environment and sensitive to the need for unimpeded maritime trade, this national program demands the creation of a ballast water management performance standard that will serve as the benchmark with which developing technologies must comply and ultimately be compared one to the other as we move forward in determining the best availability technology for ballast water management. Along with this standard, there must also be promulgated regulations relating to the testing of new technologies both ashore and onboard vessels with sufficient incentive provided to vessel owners to invest the significant financial resources which will be necessary for carrying out a thorough and scientifically valid test program. Ultimately, with the development of new technologies, it is conceivable that all ballast could be managed regardless of whether the vessel is inbound from outside the EEZ or engaged in coastal trade.
Finally, all stakeholders must continue to work together as has been the case over the last decade in identifying an environmentally responsible and operationally realistic solution to this problem. There can be no �sides� taken in this debate since it really is not a debate at all. In over a decade of working on this issue, I have not met a single person that wants to promote the degradation of the marine environment and its marine resources, nor one who wants to disrupt the free flow of international trade. The conflicts arise in the context of trade offs between two parties who at times are not inclined to budge an inch. Fortunately, this scenario has been the exception rather than the norm and we must continue to promote this concerted effort to find a solution to the challenge presented by ANS transfers via ships� ballast water. The marine environment deserves no less.
Kathy J. Metcalf Director, Maritime Affairs Chamber of Shipping of America 1730 M Street, NW Suite 407 Washington, DC 20036 Telephone: 202.775.4399 Fax: 202.659.3795 Email: [email protected]