categorization and quantification of fungal spores by ... · categorization and quantification of...
TRANSCRIPT
Open Access Journal of Mycology & Mycological Sciences
Crowd Sourced Taxonomic Identification Guide for Categorization and Quantification of Fungal Spores by Optical Microscopy
J Mycol Mycological Sci
Crowd Sourced Taxonomic Identification Guide for
Categorization and Quantification of Fungal Spores by Optical
Microscopy
Jones CL1,2*
1Biological Health Services, Australia
2National Institute of Integrative Medicine, Australia
*Corresponding author: Cameron L Jones, Biological Health Services, Level 1, 459
Toorak Rd, Toorak, Victoria, Australia, Tel: +61414998900; Email: [email protected]
Abstract
This contribution demonstrates an example of using a social network to create a visual search database to support human
inspection of microscope imagery data of fungal spores. Current monitoring of airborne spore counts follows the
standard test method for inertial impaction sampling (D7391-17e1) including spore identification, counting and
subsequent statistical treatment. One bottleneck with the traditional aerobiology approach is the skill and time required
to learn to identify unknown spores. Digital microscopy combined with the rapid proliferation of image sharing platforms
offers a unique opportunity to harness this shared visual content for expanding education about key fungal spore type
morphologies of interest to the environmental mycology community. A Pinterest board was developed that correlated
with the D7391-17e1 Standard as a form of public curation. Interacting with the board exploits the machine-learning
embedded into the Pinterest platform and allows content to be aggregated from any URL and then suggests similar
images based on existing content. In this way, the board can expand over time and image copyright is maintained despite
becoming a shared resource. The paper concludes with a review of the statistical treatment of spore counts in order to
maximise the value of the identifications.
Keywords: Spore Trap; Mould; Spore Identification; Indoor Air Quality; Pinterest; Crowdsourcing; Citizen Science;
Non-Viable Methodology; Social networks
Introduction
Detecting and measuring indoor and outdoor airborne mould spores is of increasing importance due to their connection with sick building syndrome, occupational hygiene [1], and chronic respiratory conditions and as an
adaptive response to climate change [2-4]. In many cases, indoor air quality assessments use spore traps (Air-O-Cell®, VersaTrap®, Allergenco-D, Via-Cell®) to compare the (i) indoor/outdoor ratio and (ii) inter-room variability pattern especially in known or suspect water-damaged buildings [5-6]. Spore traps are a class of viable
Review Article
Volume 2 Issue 1
Received Date: September 16, 2019
Published Date: October 02, 2019
Open Access Journal of Mycology & Mycological Sciences
Jones CL. Crowd Sourced Taxonomic Identification Guide for Categorization and Quantification of Fungal Spores by Optical Microscopy. J Mycol Mycological Sci 2019, 2(1): 000106.
Copyright© Jones CL.
2
and non-viable bioaerosol test where a pump is used to collect air onto a sticky microscope slide. After staining, the slide trace is analysed to classify the spore types and their concentration. Spore traps can be used for both fungal and plant spores, although this paper will only address mould spores. The general method is however equally transferrable to pollen.
There is an ASTM Standard, D7391-17e1 that defines
which spore classifications are to be identified and counted and the method of quantification [7]. References for fungal spore identification using morphology are given, but access to such texts is not always easy, due to the fact that many books are out of print or difficult to acquire [8]. Therefore, the bottleneck to increased use of spore traps rests with the difficulty in sourcing accurate visual taxonomic guides to aid with training in identification. Since this is basically a database problem, the two largest social networks that focus on visual information, Pinterest and Instagram were reviewed.
The aim of this paper is to demonstrate how social
networks like Pinterest can be exploited to produce a functional information rich taxonomic fungal spore database that evolves over time. The purpose is to support human visual inspection of image data–not to replace it and is an example of using new technology to improve spore monitoring that is encouraged by the Australian Airborne Pollen and Spore Interim Standard [9]. In practice, this takes advantage of embedded platform machine learning that suggests relevant, related and retrievable content and is a key component of the recommender system that is Pinterest [10]. The intent of spore classification is to quantify the level or concentration in the air. The second part of this paper therefore summarizes the calculations required.
Crowd Sourced Data from Social Media
Online content shared to social media increasingly includes user-generated scientific data. The proliferation of content producing platforms along with access to cheaper digital light microscopes opens up new opportunities for citizen science. This is premised on the assumption that ordinary people in the course of their daily lives collectively create meaningful user-generated content [11]. A crowd sourcing system uses humans to help solve problems based on their skills, experience and intelligence [12]. Social media services therefore present as a type of digital crowd intelligence because new participants contributing into the system introduce more data. Data quality is however ‘noisy’ and may be non-uniform or contain redundancy and inaccuracy. More
recently, visually oriented scientific disciplines like dermatology, plastic surgery and radiology have begun considering the what-if role that social networks like Pinterest can contribute to education [13]. These authors concluded that developing their own boards presented as an opportunity to expand radiology awareness and develop out medical resources. Similar visual communication research in the context of health promotion was also recently explored on Pinterest for skin cancer [14]; while educators are increasingly using social media as a way to facilitate engagement and improve learning [15].
Pinterest statistics as reported in March 2019 [16],
showed there were 250 million active monthly users and 175 billion image ‘pins’ on Pinterest. In comparison, Instagram has a user base of over 1 billion with 95 million pieces of new content uploaded daily [17]. Content on Pinterest can be added from Instagram or from any web source with an URL and attribution of copyright is maintained.
It was found that Pinterest could be used to build a
simple crowd-sourced database of fungal spores classified into each of the 13 different taxonomic groups as defined in the Standard and was built from a non-exhaustive search for relevant, retrievable content already existing on Pinterest, Instagram and the Web [7].
Pinterest also uses a search and recommendation
system where visual search uses deep metric learning (feature extraction) to browse related content that defines a Pinterest taxonomy delivering personalized recommendations based on interest [18,19]. By searching for keywords embedded in the Standard for each of the different spore categories, the following tasks can be achieved following the explicit human intelligence model [12]: Data filtering: Only include light microscopy images.
Ignore petri plates, SEM or artistic uses of biological data.
Data classification and tagging: This involves categorizing the data and assigning tags into groups following Sections 12.3.2 and 15.2 of the Standard to include the minimum spore categories: (1) Alternaria, (2) ascospores (undifferentiated), (3) Aspergillus/Penicillium-like, (4) basidiospores (undifferentiated), (5) Chaetomium, (6) Cladosporium, (7) Curvularia, (8) Dreschslera/Bipolaris-like, (9) smuts/Myxomycetes/Periconia, (10) Stachybotrys/Memnoniella, (11) Ulocladium, (12)
Open Access Journal of Mycology & Mycological Sciences
Jones CL. Crowd Sourced Taxonomic Identification Guide for Categorization and Quantification of Fungal Spores by Optical Microscopy. J Mycol Mycological Sci 2019, 2(1): 000106.
Copyright© Jones CL.
3
hyphal fragments, and (13) at least one category of Miscellaneous/Unidentifiable spores.
Data clustering & segmentation: Manual grouping of redundant data required since different magnification factors and crowd posting patterns may impact on how image data sets are populated.
Data selection: This step involves pattern matching between the users’ unique query (e.g. what is that spore under my microscope?) with the representative data from the Pinterest Board.
Personalized recommendations: Each image is defined as a pin which is a visual bookmark of an interest group including a description and links to an external URL. Boards can be created that summarize what the pin represents.
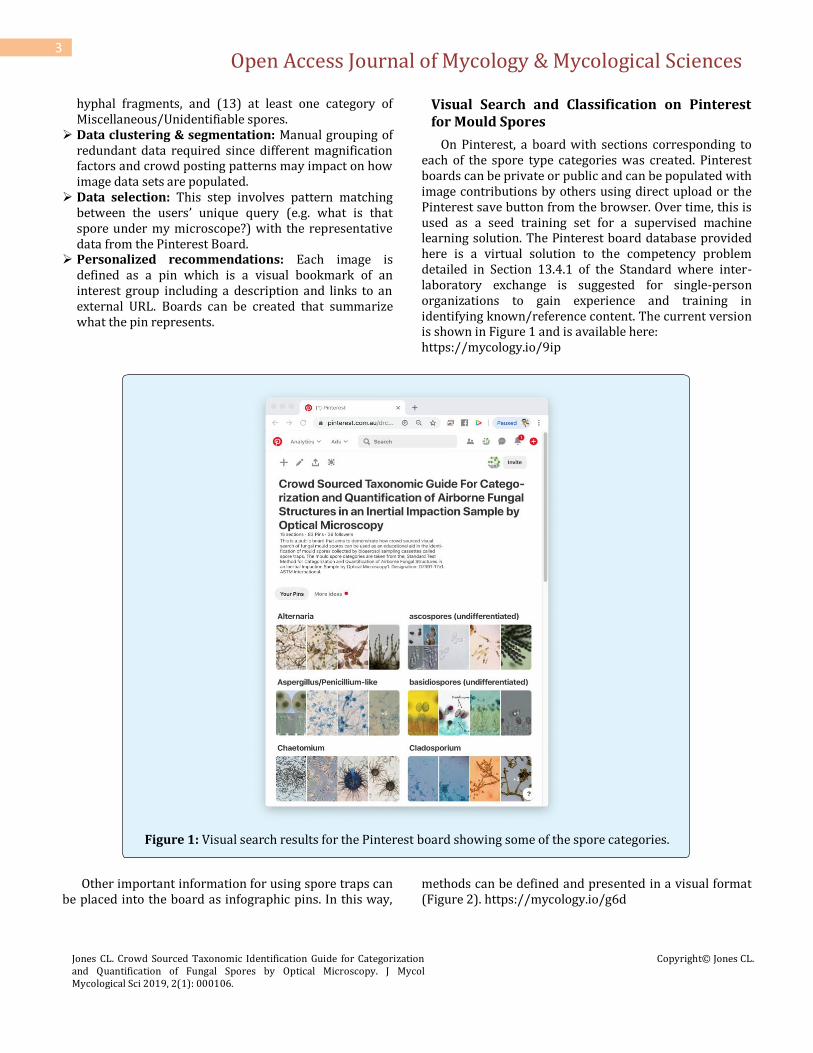
Visual Search and Classification on Pinterest for Mould Spores
On Pinterest, a board with sections corresponding to each of the spore type categories was created. Pinterest boards can be private or public and can be populated with image contributions by others using direct upload or the Pinterest save button from the browser. Over time, this is used as a seed training set for a supervised machine learning solution. The Pinterest board database provided here is a virtual solution to the competency problem detailed in Section 13.4.1 of the Standard where inter-laboratory exchange is suggested for single-person organizations to gain experience and training in identifying known/reference content. The current version is shown in Figure 1 and is available here: https://mycology.io/9ip
Figure 1: Visual search results for the Pinterest board showing some of the spore categories.
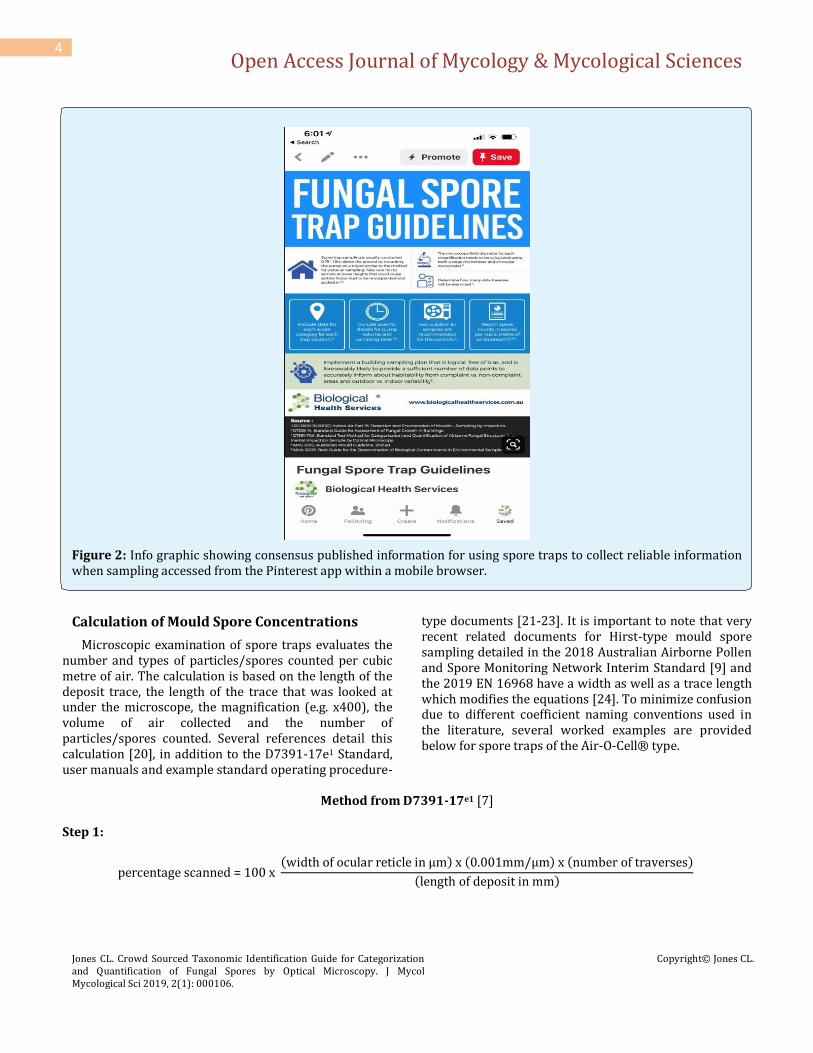
Other important information for using spore traps can
be placed into the board as infographic pins. In this way, methods can be defined and presented in a visual format (Figure 2). https://mycology.io/g6d
Open Access Journal of Mycology & Mycological Sciences
Jones CL. Crowd Sourced Taxonomic Identification Guide for Categorization and Quantification of Fungal Spores by Optical Microscopy. J Mycol Mycological Sci 2019, 2(1): 000106.
Copyright© Jones CL.
4
Figure 2: Info graphic showing consensus published information for using spore traps to collect reliable information when sampling accessed from the Pinterest app within a mobile browser.
Calculation of Mould Spore Concentrations
Microscopic examination of spore traps evaluates the number and types of particles/spores counted per cubic metre of air. The calculation is based on the length of the deposit trace, the length of the trace that was looked at under the microscope, the magnification (e.g. x400), the volume of air collected and the number of particles/spores counted. Several references detail this calculation [20], in addition to the D7391-17e1 Standard, user manuals and example standard operating procedure-
type documents [21-23]. It is important to note that very recent related documents for Hirst-type mould spore sampling detailed in the 2018 Australian Airborne Pollen and Spore Monitoring Network Interim Standard [9] and the 2019 EN 16968 have a width as well as a trace length which modifies the equations [24]. To minimize confusion due to different coefficient naming conventions used in the literature, several worked examples are provided below for spore traps of the Air-O-Cell® type.
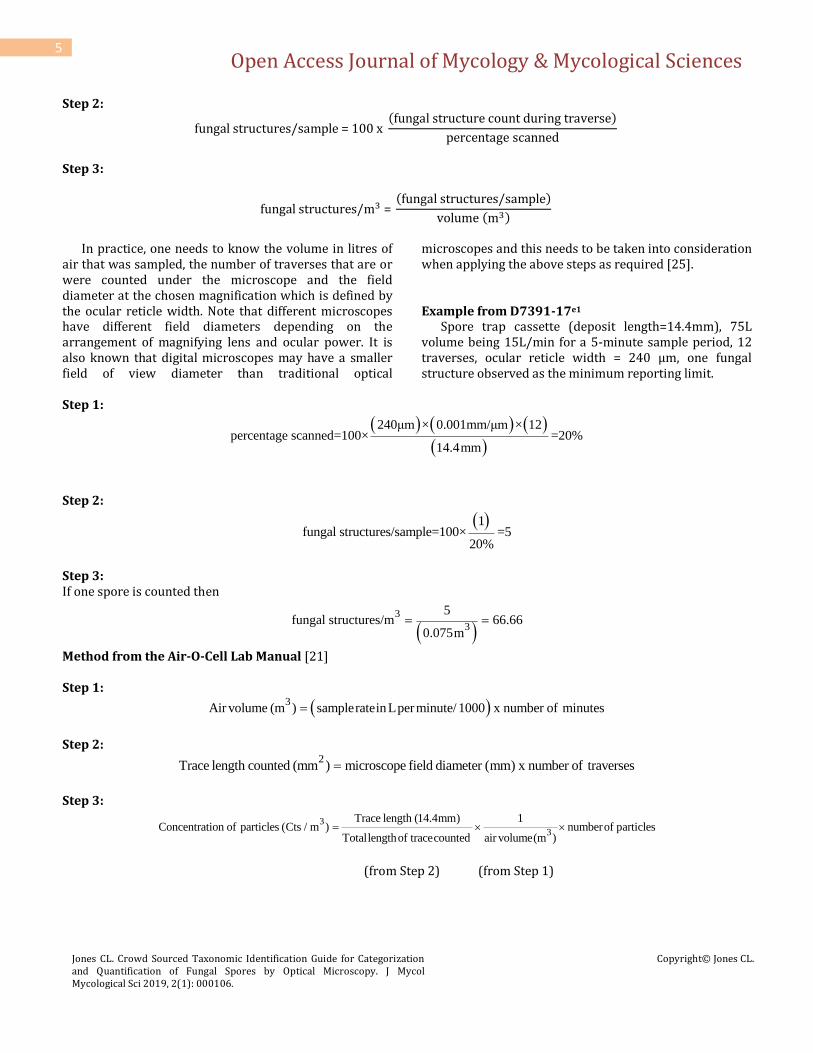
Method from D7391-17e1 [7]
Step 1:
percentage scanned = 100 x (width of ocular reticle in μm) x (0.001mm/μm) x (number of traverses)
(length of deposit in mm)
Open Access Journal of Mycology & Mycological Sciences
Jones CL. Crowd Sourced Taxonomic Identification Guide for Categorization and Quantification of Fungal Spores by Optical Microscopy. J Mycol Mycological Sci 2019, 2(1): 000106.
Copyright© Jones CL.
5
Step 2:
fungal structures/sample = 100 x (fungal structure count during traverse)
percentage scanned
Step 3:
fungal structures/m3 = (fungal structures/sample)
volume (m3)
In practice, one needs to know the volume in litres of
air that was sampled, the number of traverses that are or were counted under the microscope and the field diameter at the chosen magnification which is defined by the ocular reticle width. Note that different microscopes have different field diameters depending on the arrangement of magnifying lens and ocular power. It is also known that digital microscopes may have a smaller field of view diameter than traditional optical
microscopes and this needs to be taken into consideration when applying the above steps as required [25]. Example from D7391-17e1
Spore trap cassette (deposit length=14.4mm), 75L volume being 15L/min for a 5-minute sample period, 12 traverses, ocular reticle width = 240 μm, one fungal structure observed as the minimum reporting limit.
Step 1:
240μm × 0.001mm/μm × 12percentage scanned=100× =20%
14.4mm
Step 2:
1fungal structures/sample=100× =5
20%
Step 3: If one spore is counted then
3
3
5fungal structures/m 66.66
0.075m
Method from the Air-O-Cell Lab Manual [21] Step 1:
3Air volume (m ) samplerateinLperminute/ 1000 x number of minutes
Step 2:
2Trace length counted (mm ) microscope field diameter (mm) x number of traverses
Step 3:
3
3
Trace length (14.4mm) 1Concentration of particles (Cts / m ) numberof particles
Totallengthof tracecounted air volume(m )
(from Step 2) (from Step 1)
Open Access Journal of Mycology & Mycological Sciences
Jones CL. Crowd Sourced Taxonomic Identification Guide for Categorization and Quantification of Fungal Spores by Optical Microscopy. J Mycol Mycological Sci 2019, 2(1): 000106.
Copyright© Jones CL.
6
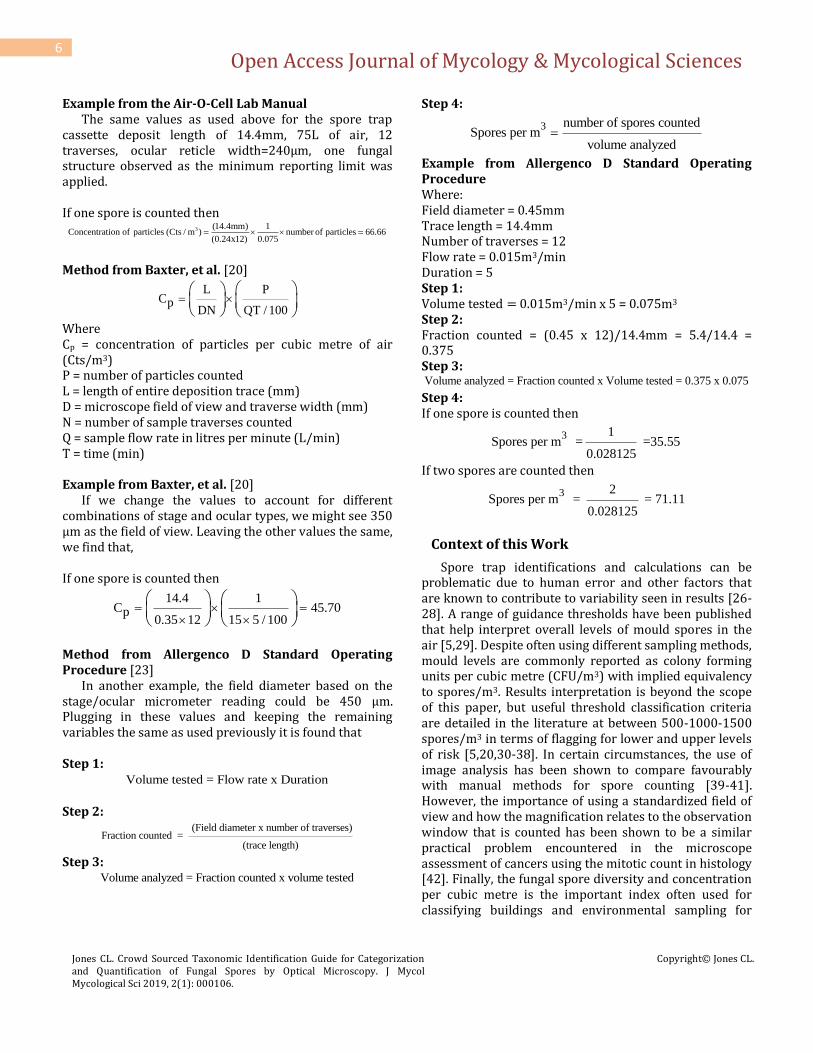
Example from the Air-O-Cell Lab Manual The same values as used above for the spore trap
cassette deposit length of 14.4mm, 75L of air, 12 traverses, ocular reticle width=240μm, one fungal structure observed as the minimum reporting limit was applied. If one spore is counted then
3 (14.4mm) 1Concentration of particles (Cts / m ) number of particles 66.66
(0.24x12) 0.075
Method from Baxter, et al. [20]
L PCp
DN QT / 100
Where Cp = concentration of particles per cubic metre of air (Cts/m3) P = number of particles counted L = length of entire deposition trace (mm) D = microscope field of view and traverse width (mm) N = number of sample traverses counted Q = sample flow rate in litres per minute (L/min) T = time (min) Example from Baxter, et al. [20]
If we change the values to account for different combinations of stage and ocular types, we might see 350 μm as the field of view. Leaving the other values the same, we find that, If one spore is counted then
14.4 1C 45.70p
0.35 12 15 5 / 100
Method from Allergenco D Standard Operating Procedure [23]
In another example, the field diameter based on the stage/ocular micrometer reading could be 450 μm. Plugging in these values and keeping the remaining variables the same as used previously it is found that Step 1:
Volume tested = Flow rate x Duration
Step 2: (Field diameter x number of traverses)
Fraction counted = (trace length)
Step 3: Volume analyzed = Fraction counted x volume tested
Step 4:
3 number of spores countedSpores per m
volume analyzed
Example from Allergenco D Standard Operating Procedure Where: Field diameter = 0.45mm Trace length = 14.4mm Number of traverses = 12 Flow rate = 0.015m3/min Duration = 5 Step 1: Volume tested = 0.015m3/min x 5 = 0.075m3
Step 2: Fraction counted = (0.45 x 12)/14.4mm = 5.4/14.4 = 0.375 Step 3: Volume analyzed = Fraction counted x Volume tested = 0.375 x 0.075
Step 4: If one spore is counted then
3 1Spores per m = =35.55
0.028125
If two spores are counted then
3 2Spores per m = = 71.11
0.028125
Context of this Work
Spore trap identifications and calculations can be problematic due to human error and other factors that are known to contribute to variability seen in results [26-28]. A range of guidance thresholds have been published that help interpret overall levels of mould spores in the air [5,29]. Despite often using different sampling methods, mould levels are commonly reported as colony forming units per cubic metre (CFU/m3) with implied equivalency to spores/m3. Results interpretation is beyond the scope of this paper, but useful threshold classification criteria are detailed in the literature at between 500-1000-1500 spores/m3 in terms of flagging for lower and upper levels of risk [5,20,30-38]. In certain circumstances, the use of image analysis has been shown to compare favourably with manual methods for spore counting [39-41]. However, the importance of using a standardized field of view and how the magnification relates to the observation window that is counted has been shown to be a similar practical problem encountered in the microscope assessment of cancers using the mitotic count in histology [42]. Finally, the fungal spore diversity and concentration per cubic metre is the important index often used for classifying buildings and environmental sampling for
Open Access Journal of Mycology & Mycological Sciences
Jones CL. Crowd Sourced Taxonomic Identification Guide for Categorization and Quantification of Fungal Spores by Optical Microscopy. J Mycol Mycological Sci 2019, 2(1): 000106.
Copyright© Jones CL.
7
allergen risk from bio aerosols, or in terms of indoor mould counts following for example, mould remediation works [43,44]. Improved and free methods for aggregating and retrieving visual information that help with fungal spore identification and statistical calculations are therefore of value to fungal aerobiology.
Conclusion
Pinterest is a strong visual search tool to exploit since it takes advantage of an embedded recommender system, meaning that related pins with similar content will be suggested to the user. This then introduces new and related content based on similarity and driven by artificial intelligence. Incorporating social media platforms into education has been shown to act as a facilitator for improving learning proficiency, especially by empowering social collaboration. A Pinterest board was successfully developed and populated with seed images following the D7391-17e1 Standard with the aim of making this test method easier to perform and statistically interpret.
Acknowledgments
Image copyright to Figures 1 and 2 rests with the author and icons used in the infographic were open source. Images retrievable on Pinterest follow either the Creative Commons license or the original author retains copyright to content that is fully credited, and no links have been changed from their original source.
References
1. Jones CL (2018) Mould in building disputes. J Bacteriol Mycol Open Access 6(4): 264-272.
2. Tham R, Erbas B, Dharmage SC, Tang MLK, Aldakheel F, et al. (2019) Outdoor fungal spores and acute respiratory effects in vulnerable individuals. Environ Res 178: 108675.
3. Talip C (2018) Effects of global-warming and climate-changes on atmospheric fungi spores distribution. Commun Fac Sci Univ Ank Series 27(2): 263-272.
4. Patella V, Florio G, Magliacane D, Giuliano A, Russo LF, et al. (2019) Public prevention plans to manage climate change and respiratory allergic diseases. Innovative models used in Campania region (Italy): The twinning aria implementation and the allergy safe tree Decalogue. Transl Med UniSa 19(14): 95-102.
5. Kemp P, Neumeister Kemp H (2010) Australian Mould Guideline. 2nd (Edn.), The Enviro Trust, Osborne Park, WA, Australia pp: 1-31.
6. Prezant B, Weekes DM, Miller JD (2010) Section 3: Evaluation and Interpretation of Data Collected Prior to Developing a Remediation Strategy. Chapter 10: Sampling Design Strategy. In: Heinsohn PA, Reopen T, et al. (Eds.), Recognition, Evaluation, and Control of Indoor Mold. American Industrial Hygiene Association, Fairfax, VA, USA pp: 127-176.
7. Standard Test Method for Categorization and Quantification of Airborne Fungal Structures in an Inertial Impaction Sample by Optical Microscopy. Designation: D7391-17e1. ASTM International.
8. (2003) Pan American Aerobiology Certification Board. Certification Program for Spore Analysts. Guidance Documents.
9. Beggs PJ, Davies JM, Milic A, Haberle SG, Johnston FH, et al. (2018) Australian Airborne Pollen and Spore Monitoring Network Interim Standard and Protocols. Version 2: 1-77.
10. Liu DC, Rogers S, Shiau R, Kislyuk D, Ma KC, et al. (2017) Related pins at Pinterest: The evolution of a real-world recommender system. arXiv.org: 1702.07969.
11. Lukyanenko R, Wiggins A, Rosser HK (2019) Citizen science: An information quality research frontier. Inf Syst Front pp: 1-23.
12. Guo B, Chen H, Liu Y, Chen C, Han Q, et al. (2019) From crowdsourcing to crowdmining: Using implicit human intelligence for better understanding of crowdsourced data. arXiv.org: 1908.02412.
13. Kauffman L, Weisberg EM, Fishman EK (2019) What can Pinterest do for radiology. J Digit Imaging.
14. Park SE, Tang L, Bijie B, Zhi D (2019) All pins are not created equal: communicating skin cancer visually on Pinterest. Trans Behav Med 1(9): 336-346.
15. Roopchund R, Ramesh V, Jaunky V (2019) Use of Social Media for Improving Student Engagement at Université des Mascareignes (UDM) Chapter 2. In: Satapathy SC, Bhateja V, Somanah R, Yang XS, Senkerik R, et al. (Eds.), Information Systems Design and Intelligent Applications, Proceedings of Fifth
Open Access Journal of Mycology & Mycological Sciences
Jones CL. Crowd Sourced Taxonomic Identification Guide for Categorization and Quantification of Fungal Spores by Optical Microscopy. J Mycol Mycological Sci 2019, 2(1): 000106.
Copyright© Jones CL.
8
International Conference, Springer Nature Singapore, India 2: 11-20.
16. Pinterest stats (2019) United States Securities and Exchange Commission. Registration Statement Under the Securities Act of 1933.
17. The most impressive Instagram statistics for 2019.
18. Zhai A, Yu H, Tzeng E, Park DH, Rosenberg C (2019) Learning a unified embedding for visual search at Pinterest. arXiv.org: 1908.01707.
19. Concalves RS, Horridge M, Li R, Liu R, Liu Y, et al. (2019) Use of OWL and semantic web technologies at Pinterest. arXiv.org: 1907.02106.
20. Baxter DM, Perkins JL, McGhee CR, Seltzer JM (2005) A regional comparison of mold spore concentrations outdoors and inside “clean” and “mold contaminated” southern California buildings. J Occup Environ Hyg 2(1): 8-18.
21. Air-O-Cell Bioaerol Sampling Cassette Laboratory & User Manual. LA03040 Rev.2.
22. Via-Cell Bioaerosol Sampling Cassette Laboratory & User Manual. LA03023 Rev.3 or 4.
23. Tucker JR (2004) Analytical method for qualitative microbial analysis of AllergencoDTM bioaerosol sampling impactors.
24. BS EN 16868: 2019 Ambient air-sampling and analysis of airborne pollen grains and fungal spores for networks related to allergy-Volumetric Hirst method.
25. DeRose JA, Doppler M (2018) Guidelines for understanding magnification in the modern digital era. Microscopy Today 26(4): 20-33.
26. AIHA (2005) Field Guide for the Determination of Biological Contaminants in Environmental Samples. 2nd (Edn.), American Industrial Hygiene Association, Fairfax, VA, USA pp: 1-284.
27. AIHA (2019) FAQs about spore trap air sampling for mold for direct examination-mold analysis document. American Industrial Hygiene Association, Fairfax, VA, USA pp: 1-8.
28. Robertson LD, Brandys R (2011) A multi-laboratory comparative study of spore trap analyses. Mycologia 103(1): 226-231.
29. Rao CY, Burge HA, Chang JCS (1996) Review of quantitative standards and guidelines for fungi in indoor air. J Air Waste Manage 46(9): 899-908.
30. Gent JF, Ren P, Belanger K, Triche E, Bracken MB, et al. (2002) Levels of household mold associated with respiratory symptoms in the first year of life in a cohort at risk for asthma. Environ Health Persp 110(12): 781-786.
31. Gots RE, Layton NJ, Pirages SW (2003) Indoor health: Background levels of fungi. AIHA Journal 64(4): 427-438.
32. Reboux G, Bellanger AP, Roussel S, Grenouillet F, Sornin S, et al. (2009) Indoor mold concentration in Eastern France. Indoor Air 19(6): 446-453.
33. WHO (2009) WHO Guidelines for Indoor Air Quality: Dampness and Mould. Geneva: World Health Organization, Copenhagen, Denmark pp: 1-248.
34. Pinheiro AC, Viegas C, Viegas S, Verissimo C, Brandao J, et al. (2012) Indoor air quality in Portuguese archives: A snapshot on exposure levels. J Toxicol Env Health A 75(22-23): 1359-1370.
35. Baxter D (2013) Air-O-Cell Method Guide & Particle Atlas. Environmental Analysis Associates Indoor Air Quality Laboratory, Bay City, MI, USA pp: 1-22.
36. Chen BY, Chao HJ, Wu CF, Kim H, Honda Y, et al. (2014) High ambient Cladosporium spores were associated with reduced lung function in schoolchildren in a longitudinal study. Sci Total Environ 481: 370-376.
37. Mayowa MO, Rowland AG, Babatunde HT, Mumuni A (2015) Indoor air quality and perceived health effects experienced by occupants of an office complex in a typical tertiary institution in Nigeria. SJPH 3(4): 552-558.
38. Tahiinen K, Lappalainen S, Karvala K, Remes J, Salonen H (2018) Association between four-level categorisation of indoor exposure and perceived indoor air quality. Int J Environ Res Public Health 15(4): 679.

Open Access Journal of Mycology & Mycological Sciences
Jones CL. Crowd Sourced Taxonomic Identification Guide for Categorization and Quantification of Fungal Spores by Optical Microscopy. J Mycol Mycological Sci 2019, 2(1): 000106.
Copyright© Jones CL.
9
39. Wagner J, Macher J (2012) Automated spore measurements using microscopy, image analysis, and peak recognition of near-monodisperse aerosols. Aerosol Sci Tech 46(8): 862-873.
40. Korsnes R, Westrum K, Floistad E, Klingen I (2016) Computer-assisted image processing to detect spores from the fungus Pandora neoaphidis. MethodsX 3:231-241.
41. Perner P (2018) Identifying fungi spores, yeast, bacteria by opto-electronic imaging and image processing and identification for protecting human health. Curr Trends Biomedical Eng Biosci 11(2): 1-11.
42. Meuten DJ, Moore FM, George JW (2016) Mitotic count and the field of view area: time to standardize. Vet Pathol 53(1): 7-9.
43. Almaguer M, Aira MJ, Rodriguez RFJ, Fernandez GM, Rojas FTI (2015) Thirty-four identifiable airborne fungal spores in Havana, Cuba. Amm Agr Env Med 22(2): 215-220.
44. Kleinheinz GT, Langolf BM, Englebert E (2006) Characterization of airborne fungal levels after mould remediation. Microbiol Res 161(4): 367-376.
QR Codes
Pinterest spore database
Spore trap guidelines