category report number of reviews501 network monitoring ... · opennms platform opsview monitor...
TRANSCRIPT

Category Report
NetworkMonitoring
NUMBER OF REVIEWS
501NUMBER OF VENDORSEVALUATED
10REPORT GENERATED
September2018
CA Network Monitoring Solutions Cisco Prime Infrastructure ConnectWise Automate
Corvil Analytics
IBM Tivoli Monitoring ManageEngine OpManager Microsoft Systems Center Operations Manager
Nagios XI
Network Operations Management SolarWinds Network Performance Monitor

Network Monitoring Category Report
Table ofContentsData Quadrant..................................................................................................................5
Category Overview ...................................................................................................... 6
Vendor Capability Summary .................................................................................7
Vendor Capabilities......................................................................................................8
Product Feature Summary ...................................................................................14
Product Features ......................................................................................................... 15
Emotional Footprint Summary ........................................................................ 21
Emotional Footprint................................................................................................. 22
How to Use the ReportInfo-Tech’s Category Reports provide a comprehensive evaluation of popular products in theNetwork Monitoring market. This buyer’s guide is designed to help prospective purchasers makebetter decisions by leveraging the experiences of real users.
The data in this report is collected from real end users, meticulously verified for veracity,exhaustively analyzed, and visualized in easy to understand charts and graphs. Each product iscompared and contrasted with all other vendors in their category to create a holistic, unbiased viewof the product landscape.
Use this report to determine which product is right for your organization. For highly detailed reportson individual products, see Info-Tech’s Product Scorecard.
2

Category Report
SoftwareDirectoryNETWORK MONITORINGSOFTWARE
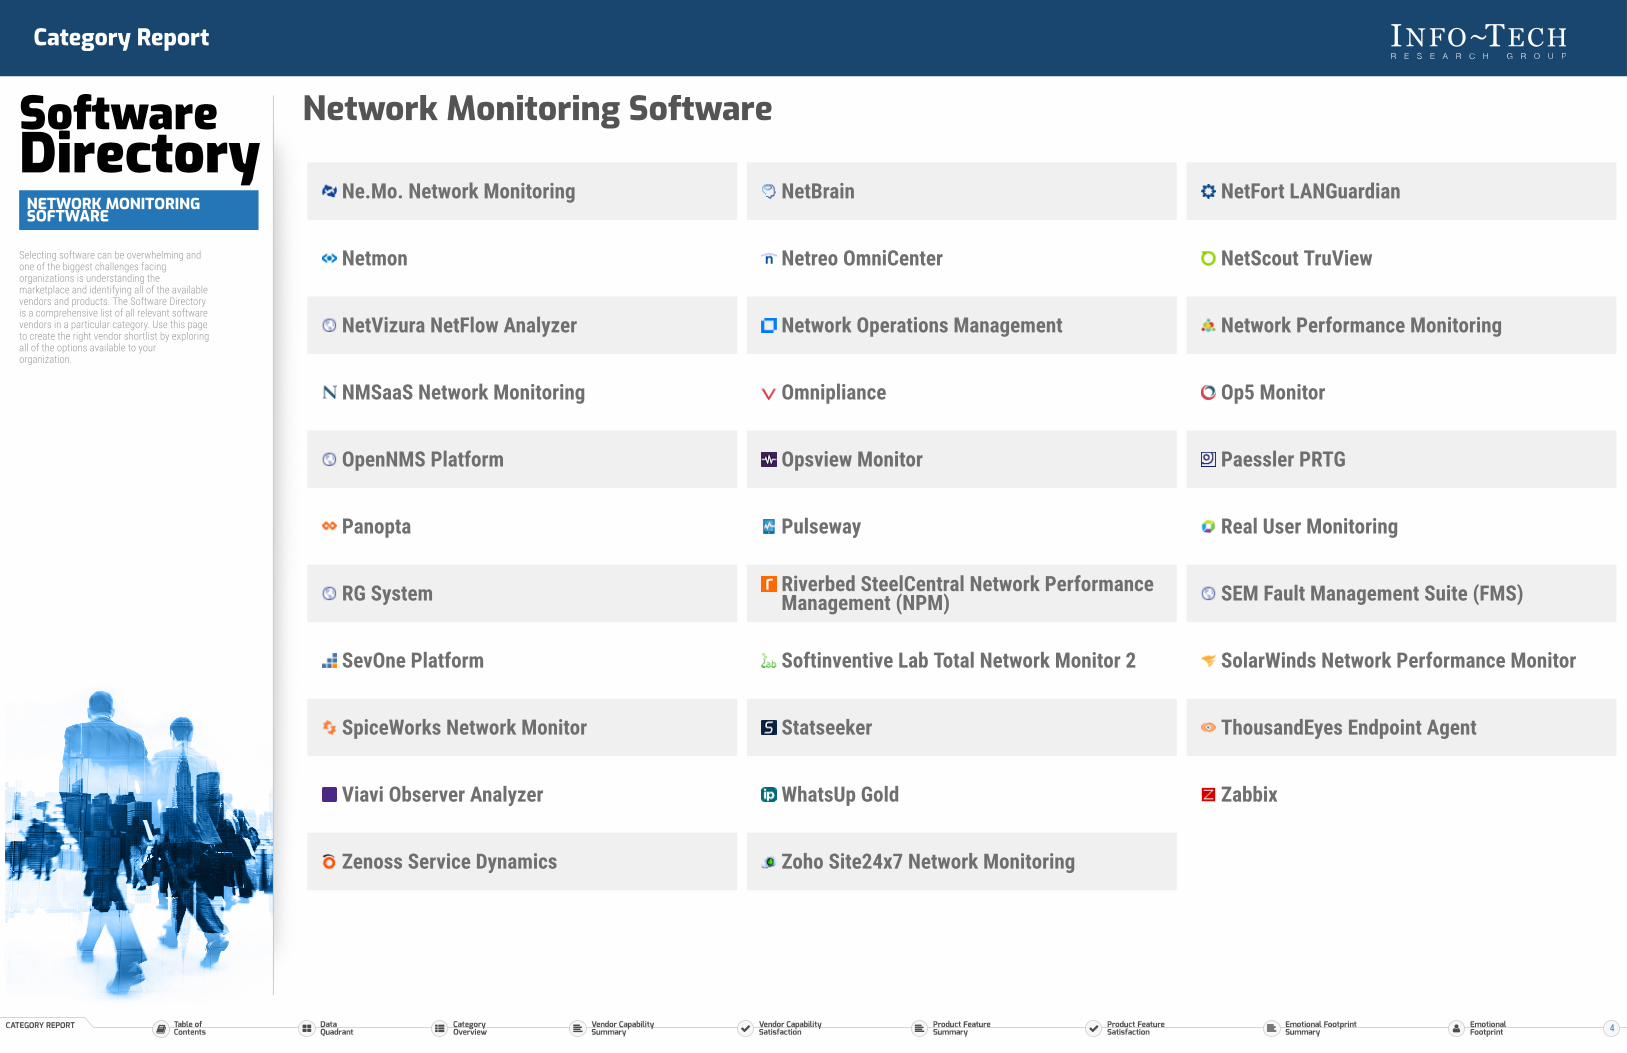
Selecting software can be overwhelming andone of the biggest challenges facingorganizations is understanding themarketplace and identifying all of the availablevendors and products. The Software Directoryis a comprehensive list of all relevant softwarevendors in a particular category. Use this pageto create the right vendor shortlist by exploringall of the options available to yourorganization.
Network Monitoring Software
5View Netflow ActiveXperts Network Monitor Adrem NetCrunch
AKiPS Anturis Apcon Network Monitoring
Automic Streamcore BMC TrueSight Pulse CA Network Monitoring Solutions
Cisco Prime Infrastructure Colasoft nChronos ConnectWise Automate
Corvil Analytics Datadog Domotz
Entuity Network Management EventSentry Exinda Network Orchestrator
ExtraHop Platform Flowmon GFI LanGuard
HelpSystems InterMapper IBM Tivoli Monitoring IPHost Network Monitor
IPSentry IpSwitch WhatsUp Gold Kaseya Traverse
LiveNX LogicMonitor Platform LogRhythm Network Monitoring
ManageEngine OpManager Megamon Microsoft Systems Center OperationsManager
Mindarray Minder Monitis Nagios XI
3
Category Report
SoftwareDirectoryNETWORK MONITORINGSOFTWARE
Selecting software can be overwhelming andone of the biggest challenges facingorganizations is understanding themarketplace and identifying all of the availablevendors and products. The Software Directoryis a comprehensive list of all relevant softwarevendors in a particular category. Use this pageto create the right vendor shortlist by exploringall of the options available to yourorganization.
Network Monitoring Software
Ne.Mo. Network Monitoring NetBrain NetFort LANGuardian
Netmon Netreo OmniCenter NetScout TruView
NetVizura NetFlow Analyzer Network Operations Management Network Performance Monitoring
NMSaaS Network Monitoring Omnipliance Op5 Monitor
OpenNMS Platform Opsview Monitor Paessler PRTG
Panopta Pulseway Real User Monitoring
RG System Riverbed SteelCentral Network PerformanceManagement (NPM) SEM Fault Management Suite (FMS)
SevOne Platform Softinventive Lab Total Network Monitor 2 SolarWinds Network Performance Monitor
SpiceWorks Network Monitor Statseeker ThousandEyes Endpoint Agent
Viavi Observer Analyzer WhatsUp Gold Zabbix
Zenoss Service Dynamics Zoho Site24x7 Network Monitoring
4

Network Monitoring Category Report
SOFTWARE REVIEWS
Data QuadrantAssess vendor and product performance at a glance and use the Software ReviewsData Quadrant to identify which products and vendors are leadings the pack andwhich are trailing.
PRO
DUCT
FEA
TURE
S AN
D SA
TISF
ACTI
ON
6.6
9.0
VENDOR EXPERIENCE AND CAPABILITIES6.2 9.2
PRODUCT INNOVATOR
FOLLOWER
LEADER
SERVICE STAR
Corvil Analytics
IBM Tivoli
SolarWinds NPM
Cisco Prime Microsoft Systems Center OpManager
Nagios XINOM
CA Network Monitoring
ConnectWise Automate
NetworkMonitoringThe Software Reviews Data Quadrant evaluates and ranks products based on feedbackfrom IT and business professionals. The placement of a software in the Data Quadrantindicates its relative ranking as well as its categorization.
The Complete SoftwareExperienceWhen distilled down, the software experience is shaped by both the experience with thesoftware and the relationship with the vendor. Evaluating enterprise software along thesetwo dimensions provides a comprehensive understanding of the product and helpsidentify vendors that can deliver on both.
ProductFeatures andSatisfactionThe satisfaction is captured inthe overall satisfaction score,which is driven by the likelihoodof users to recommend thesoftware, combined with usersatisfaction across top productfeatures.
VendorExperience andCapabilitiesThe vendor relationship is calculated ina weighted average of the satisfactionscores tied to vendor capabilities (e.g.software implementation, training,customer support, product roadmap) aswell as emotional response ratingstoward the vendor (e.g. trustworthy,respectful, fair).
Note: The axes ranges are dynamically adjusted based onminimum and maximum values in the dataset.
5
ManageEngine OpManager

Network Monitoring Category Report
Category Overview This page provides a high level summary of product performance within the Network Monitoring category. Products are ranked by a composite satisfaction score (CompositeScore) that averages four different areas of evaluation: Net Emotional Footprint, Vendor Capabilities, Product Features, and Likeliness to Recommend. The Net EmotionalFootprint Score measures user emotional response ratings of the vendor (e.g. trustworthy, respectful, fair).
Use this data to get a sense of the field, and to see how the products you’re considering stack up.
RANK VENDOR COMPOSITE SCORE NET EMOTIONALFOOTPRINT
NET EMOTIONALFOOTPRINT DISTRIBUTION
VENDORCAPABILITIES
PRODUCTFEATURES
LIKELINESS TORECOMMEND
NUMBER OFREVIEWS
Corvil Analytics 9.1/10 +96-- NEGATIVE 96% POSITIVE
84% 85% 96% 20
ManageEngine OpManager 8.4/10 +901% NEGATIVE 91% POSITIVE
79% 78% 84% 36
Cisco Prime Infrastructure 8.1/10 +786% NEGATIVE 84% POSITIVE
77% 79% 85% 34
SolarWinds Network Performance 8.1/10 +784% NEGATIVE 82% POSITIVE
77% 80% 83% 29
IBM Tivoli Monitoring 8.0/10 +795% NEGATIVE 84% POSITIVE
74% 76% 82% 46
6 Operations Manager 7.7/10 +775% NEGATIVE 82% POSITIVE
76% 75% 82% 76
7 Network Operations Management 7.5/10 +755% NEGATIVE 80% POSITIVE
74% 75% 80% 32
8 Nagios XI 7.4/10 +756% NEGATIVE 81% POSITIVE
72% 75% 78% 64
9 CA Network Monitoring Solutions 7.0/10 +716% NEGATIVE 77% POSITIVE
74% 74% 72% 52
10 ConnectWise Automate 6.4/10 +6111% NEGATIVE 72% POSITIVE
68% 46% 85% 56
AVERAGE SCORES 7.8/10 +785% NEGATIVE 83% POSITIVE
75% 74% 83% 45
6

Network Monitoring Category Report
Vendor Capability Summary This page summarizes user satisfaction with a variety of vendor capabilities regarding their product offering(s). Look for strong and consistent performance across theboard when assembling your shortlist, and follow-up on areas of concern during the evaluation and negotiation processes.
VENDOROVERALLCAPABILITYSATISFACTION
BUSINESS VALUECREATED
BREADTH OFFEATURES
QUALITY OFFEATURES
PRODUCTSTRATEGY ANDRATE OFIMPROVEMENT
USABILITY ANDINTUITIVENESS
VENDORSUPPORT
EASE OF DATAINTEGRATION
EASE OF ITADMINISTRATION
EASE OFCUSTOMIZATION
AVAILABILITYAND QUALITY OFTRAINING
EASE OFIMPLEMENTATION
Corvil Analytics 84% 90% 85% 81% 89% 74% 91% 82% 81% 80% 94% 78%
ManageEngine OpManager 79% 74% 77% 79% 80% 81% 81% 79% 82% 76% 81% 81%
Cisco Prime Infrastructure 77% 80% 77% 80% 74% 74% 77% 80% 79% 72% 75% 79%
SolarWinds Network PerformanceMonitor 77% 80% 76% 79% 82% 78% 74% 76% 83% 71% 70% 74%
Microsoft Systems CenterOperations Manager 76% 76% 76% 78% 72% 76% 74% 77% 80% 75% 71% 78%
Network Operations Management 74% 73% 74% 75% 73% 73% 80% 72% 73% 73% 73% 73%
IBM Tivoli Monitoring 74% 74% 72% 74% 71% 78% 73% 77% 78% 69% 69% 75%
CA Network Monitoring Solutions 74% 76% 70% 72% 71% 73% 74% 77% 71% 74% 72% 79%
Nagios XI 72% 70% 76% 74% 71% 70% 73% 72% 73% 75% 68% 73%
ConnectWise Automate 68% 78% 83% 63% 66% 60% 59% 76% 73% 72% 65% 58%
CATEGORY AVERAGE 75% 77% 77% 76% 75% 74% 76% 77% 77% 74% 74% 75%
VENDORS WITH INSUFFICIENT DATA
7
Network Monitoring Category Report
Vendor Capability Satisfaction This section provides detailed information on user satisfaction for each vendor capability regarding their product offering(s). Use these pages to digdeeper into areas of particular interest or concern.
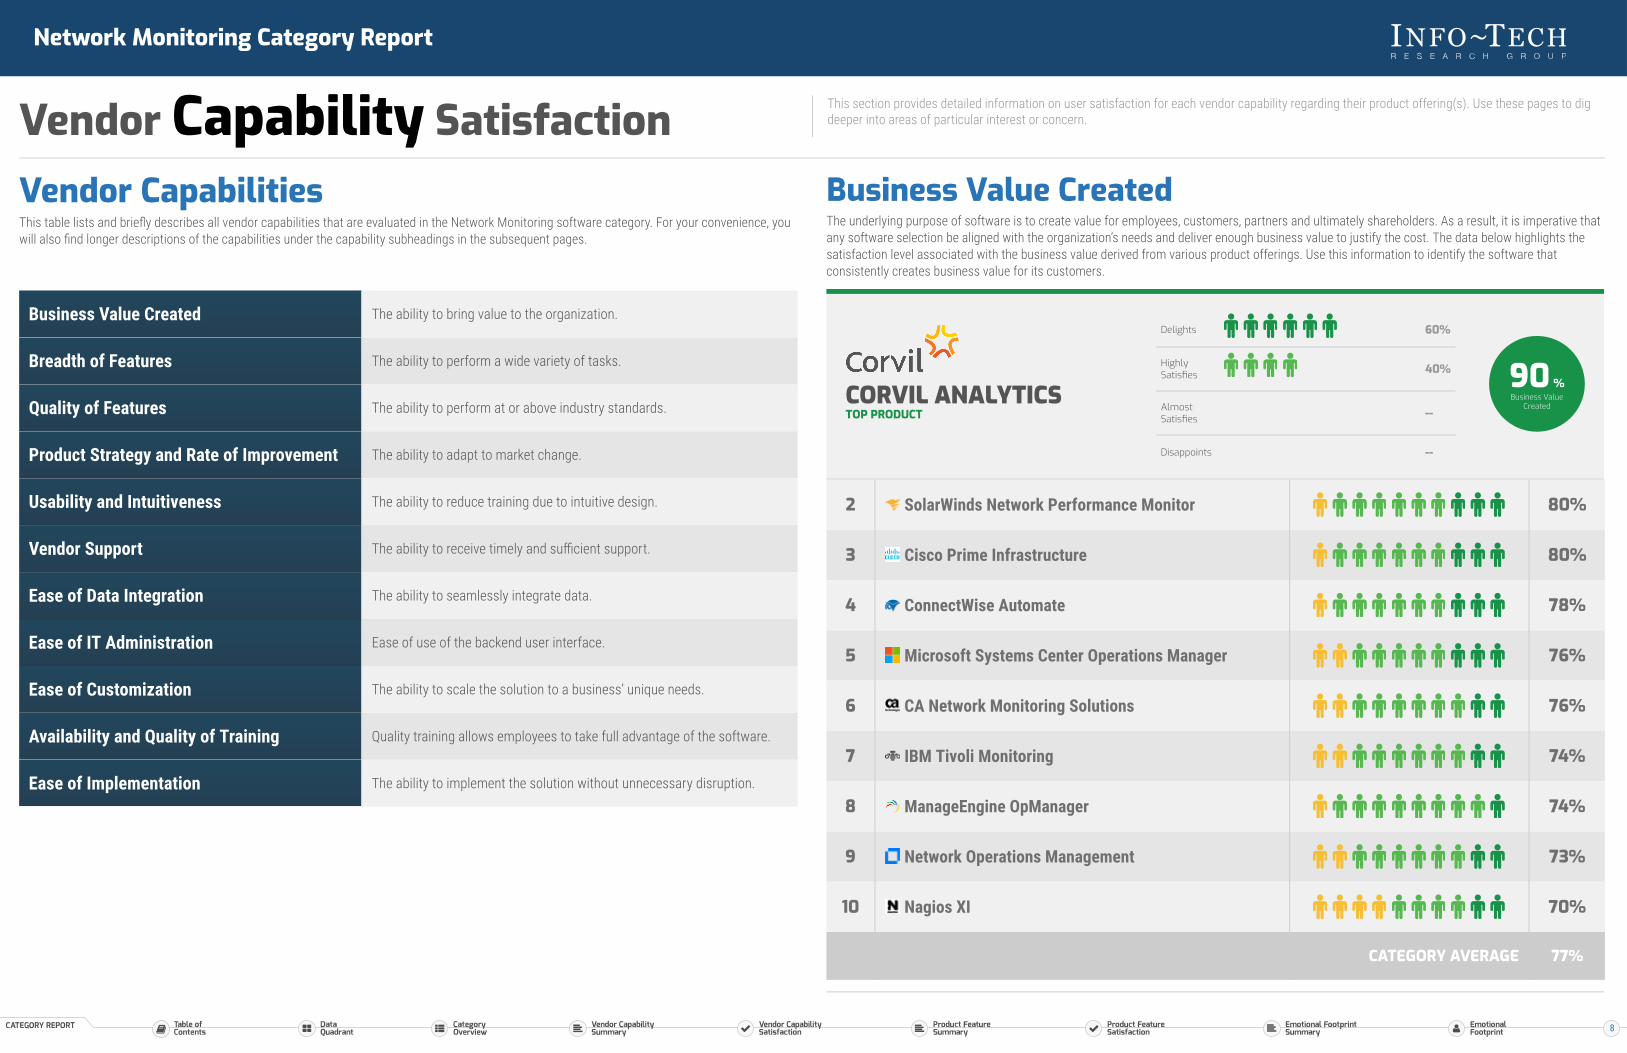
Vendor CapabilitiesThis table lists and briefly describes all vendor capabilities that are evaluated in the Network Monitoring software category. For your convenience, youwill also find longer descriptions of the capabilities under the capability subheadings in the subsequent pages.
Business Value Created The ability to bring value to the organization.
Breadth of Features The ability to perform a wide variety of tasks.
Quality of Features The ability to perform at or above industry standards.
Product Strategy and Rate of Improvement The ability to adapt to market change.
Usability and Intuitiveness The ability to reduce training due to intuitive design.
Vendor Support The ability to receive timely and sufficient support.
Ease of Data Integration The ability to seamlessly integrate data.
Ease of IT Administration Ease of use of the backend user interface.
Ease of Customization The ability to scale the solution to a business’ unique needs.
Availability and Quality of Training Quality training allows employees to take full advantage of the software.
Ease of Implementation The ability to implement the solution without unnecessary disruption.
Business Value CreatedThe underlying purpose of software is to create value for employees, customers, partners and ultimately shareholders. As a result, it is imperative thatany software selection be aligned with the organization’s needs and deliver enough business value to justify the cost. The data below highlights thesatisfaction level associated with the business value derived from various product offerings. Use this information to identify the software thatconsistently creates business value for its customers.
CORVIL ANALYTICSTOP PRODUCT
Delights 60%
HighlySatisfies 40%
AlmostSatisfies --
Disappoints --
90 %Business Value
Created
2 SolarWinds Network Performance Monitor 80%
3 Cisco Prime Infrastructure 80%
4 ConnectWise Automate 78%
5 Microsoft Systems Center Operations Manager 76%
6 CA Network Monitoring Solutions 76%
7 IBM Tivoli Monitoring 74%
8 ManageEngine OpManager 74%
9 Network Operations Management 73%
10 Nagios XI 70%
CATEGORY AVERAGE 77%
8

Network Monitoring Category Report
Vendor Capability Satisfaction This section provides detailed information on user satisfaction for each vendor capability regarding their product offering(s). Use these pages to digdeeper into areas of particular interest or concern.
Breadth of FeaturesUsers prefer to work with feature rich software that enables them to perform diverse series of tasks as opposed to one they find restrictive. The databelow highlights the satisfaction level associated with the breadth of features from various product offerings. Use this information to identify whichsoftware offers valuable comprehensive functionality that extends beyond the basic level.
CORVIL ANALYTICSTOP PRODUCT
Delights 50%
HighlySatisfies 40%
AlmostSatisfies 10%
Disappoints --
85 %Breadth ofFeatures
2 ConnectWise Automate 83%
3 Cisco Prime Infrastructure 77%
4 ManageEngine OpManager 77%
5 Microsoft Systems Center Operations Manager 76%
6 SolarWinds Network Performance Monitor 76%
7 Nagios XI 76%
8 Network Operations Management 74%
9 IBM Tivoli Monitoring 72%
10 CA Network Monitoring Solutions 70%
CATEGORY AVERAGE 77%
Quality of FeaturesFeature quality is just as important as quantity. Software needs to do what you’re purchasing it to do, easily, intuitively, reliably, and effectively. Use thedata in this section to gauge whether or not a product follows through on the marketing hype by delivering high quality features.
CORVIL ANALYTICSTOP PRODUCT
Delights 35%
HighlySatisfies 55%
AlmostSatisfies 10%
Disappoints --
81 %Quality of Features
2 Cisco Prime Infrastructure 80%
3 SolarWinds Network Performance Monitor 79%
4 ManageEngine OpManager 79%
5 Microsoft Systems Center Operations Manager 78%
6 Network Operations Management 75%
7 IBM Tivoli Monitoring 74%
8 Nagios XI 74%
9 CA Network Monitoring Solutions 72%
10 ConnectWise Automate 63%
CATEGORY AVERAGE 76%
9

Network Monitoring Category Report
Vendor Capability Satisfaction This section provides detailed information on user satisfaction for each vendor capability regarding their product offering(s). Use these pages to digdeeper into areas of particular interest or concern.
Product Strategy and Rate of ImprovementPurchasing software can be a significant commitment, so it’s important to know if your vendor is serious about the need for constant improvementand deliberate strategic direction. Vendors who don’t stay on top of emerging needs and trends won’t enable you to meet your business goals. Use thedata in this section to separate innovators from imposters.
CORVIL ANALYTICSTOP PRODUCT
Delights 63%
HighlySatisfies 32%
AlmostSatisfies 5%
Disappoints --
89 %Product Strategy
and Rate ofImprovement
2 SolarWinds Network Performance Monitor 82%
3 ManageEngine OpManager 80%
4 Cisco Prime Infrastructure 74%
5 Network Operations Management 73%
6 Microsoft Systems Center Operations Manager 72%
7 Nagios XI 71%
8 IBM Tivoli Monitoring 71%
9 CA Network Monitoring Solutions 71%
10 ConnectWise Automate 66%
CATEGORY AVERAGE 75%
Usability and IntuitivenessEnd user learning curves cost the organization money. Pay attention to your end users’ technical ability to determine how important UX is in yourpurchase.
MANAGEENGINEOPMANAGERTOP PRODUCT
Delights 33%
HighlySatisfies 56%
AlmostSatisfies 11%
Disappoints --
81 %Usability andIntuitiveness
2 IBM Tivoli Monitoring 78%
3 SolarWinds Network Performance Monitor 78%
4 Microsoft Systems Center Operations Manager 76%
5 Corvil Analytics 74%
6 Cisco Prime Infrastructure 74%
7 Network Operations Management 73%
8 CA Network Monitoring Solutions 73%
9 Nagios XI 70%
10 ConnectWise Automate 60%
CATEGORY AVERAGE 74%
10
Network Monitoring Category Report
Vendor Capability Satisfaction This section provides detailed information on user satisfaction for each vendor capability regarding their product offering(s). Use these pages to digdeeper into areas of particular interest or concern.
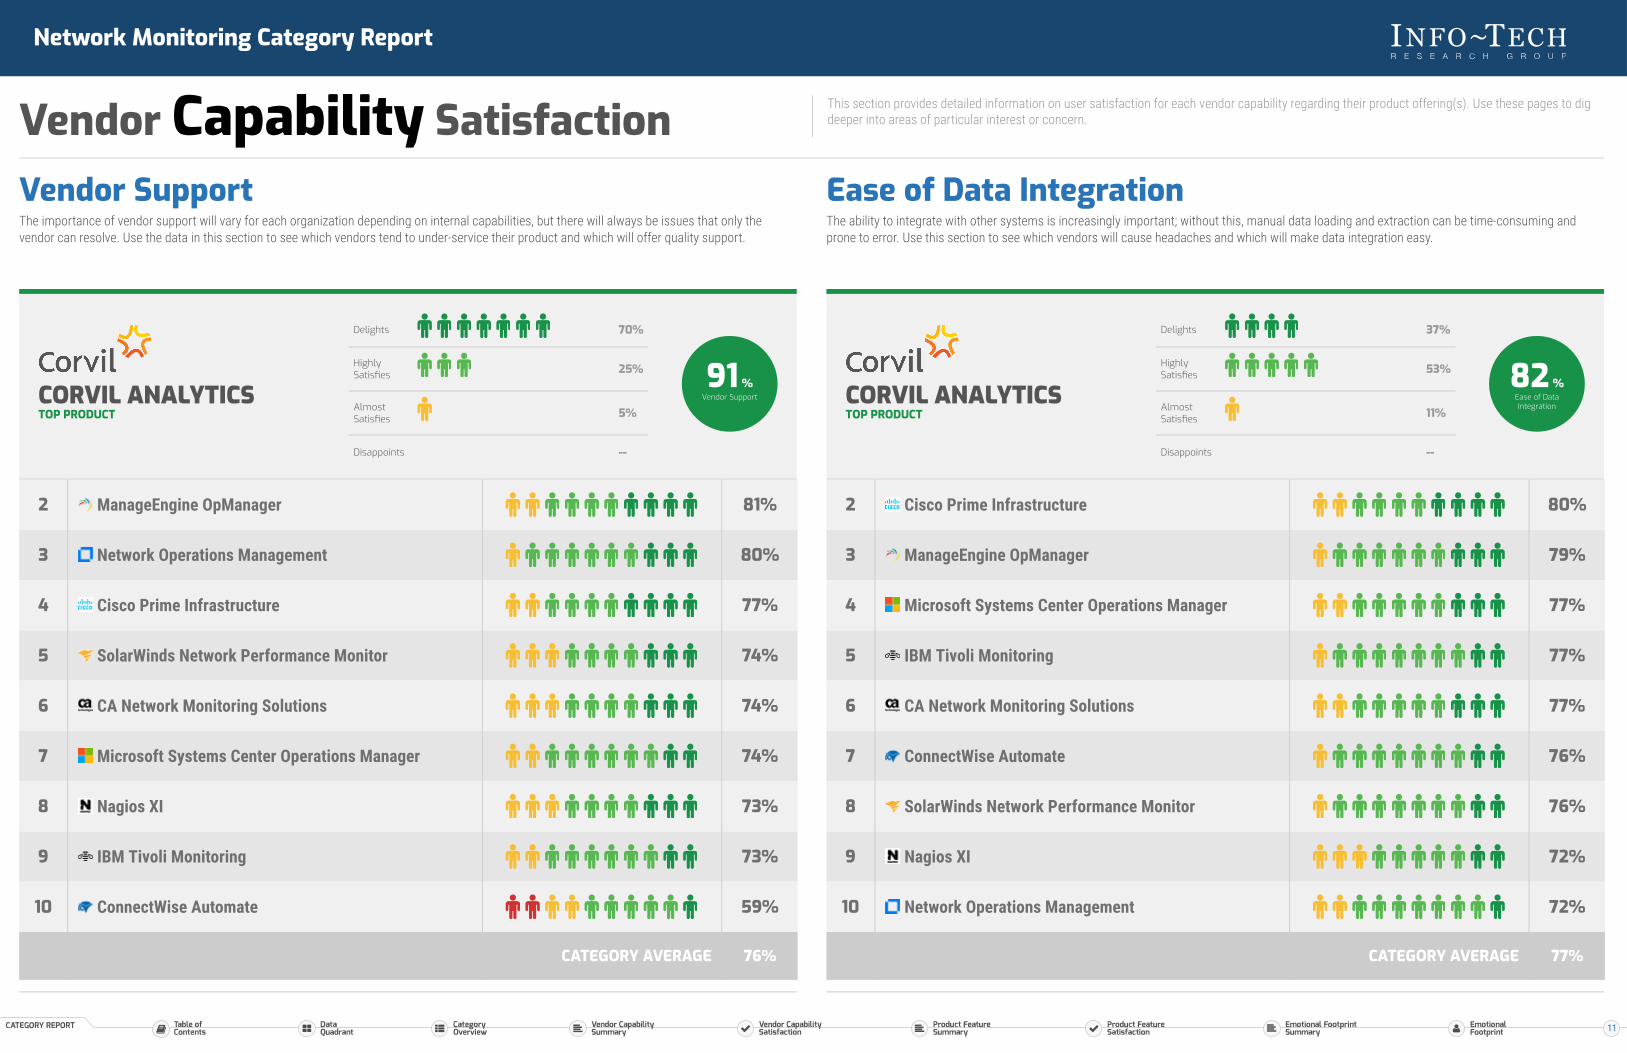
Vendor SupportThe importance of vendor support will vary for each organization depending on internal capabilities, but there will always be issues that only thevendor can resolve. Use the data in this section to see which vendors tend to under-service their product and which will offer quality support.
CORVIL ANALYTICSTOP PRODUCT
Delights 70%
HighlySatisfies 25%
AlmostSatisfies 5%
Disappoints --
91 %Vendor Support
2 ManageEngine OpManager 81%
3 Network Operations Management 80%
4 Cisco Prime Infrastructure 77%
5 SolarWinds Network Performance Monitor 74%
6 CA Network Monitoring Solutions 74%
7 Microsoft Systems Center Operations Manager 74%
8 Nagios XI 73%
9 IBM Tivoli Monitoring 73%
10 ConnectWise Automate 59%
CATEGORY AVERAGE 76%
Ease of Data IntegrationThe ability to integrate with other systems is increasingly important; without this, manual data loading and extraction can be time-consuming andprone to error. Use this section to see which vendors will cause headaches and which will make data integration easy.
CORVIL ANALYTICSTOP PRODUCT
Delights 37%
HighlySatisfies 53%
AlmostSatisfies 11%
Disappoints --
82 %Ease of DataIntegration
2 Cisco Prime Infrastructure 80%
3 ManageEngine OpManager 79%
4 Microsoft Systems Center Operations Manager 77%
5 IBM Tivoli Monitoring 77%
6 CA Network Monitoring Solutions 77%
7 ConnectWise Automate 76%
8 SolarWinds Network Performance Monitor 76%
9 Nagios XI 72%
10 Network Operations Management 72%
CATEGORY AVERAGE 77%
11

Network Monitoring Category Report
Vendor Capability Satisfaction This section provides detailed information on user satisfaction for each vendor capability regarding their product offering(s). Use these pages to digdeeper into areas of particular interest or concern.
Ease of IT AdministrationAdministrative interfaces don’t get the same attention as those built for end users, but they shouldn’t be clunky or unintuitive. Use the data in thissection to determine which vendors make administration easy, so that your IT personnel can resolve issues and perform configurations efficiently andeffectively.
SOLARWINDS NETWORKPERFORMANCE MONITORTOP PRODUCT
Delights 46%
HighlySatisfies 46%
AlmostSatisfies 4%
Disappoints 4%
83 %Ease of IT
Administration
2 ManageEngine OpManager 82%
3 Corvil Analytics 81%
4 Microsoft Systems Center Operations Manager 80%
5 Cisco Prime Infrastructure 79%
6 IBM Tivoli Monitoring 78%
7 Nagios XI 73%
8 ConnectWise Automate 73%
9 Network Operations Management 73%
10 CA Network Monitoring Solutions 71%
CATEGORY AVERAGE 77%
Ease of CustomizationOut-of-the-box functionality often isn’t enough, especially for niche or industry-specific software, and the reason you’re buying rather than building is tosave time and money in the first place. Don’t get bogged down in a difficult customization; use the data in this section to make sure you can easilyachieve the functionality you need for your particular situation.
CORVIL ANALYTICSTOP PRODUCT
Delights 40%
HighlySatisfies 50%
AlmostSatisfies 5%
Disappoints 5%
80 %Ease of
Customization
2 ManageEngine OpManager 76%
3 Microsoft Systems Center Operations Manager 75%
4 Nagios XI 75%
5 CA Network Monitoring Solutions 74%
6 Network Operations Management 73%
7 Cisco Prime Infrastructure 72%
8 ConnectWise Automate 72%
9 SolarWinds Network Performance Monitor 71%
10 IBM Tivoli Monitoring 69%
CATEGORY AVERAGE 74%
12

Network Monitoring Category Report
Vendor Capability Satisfaction This section provides detailed information on user satisfaction for each vendor capability regarding their product offering(s). Use these pages to digdeeper into areas of particular interest or concern.
Availability and Quality of TrainingEffective and readily available training enables users to get the most out of the software you’ve chosen. Use this section to make sure your vendor’straining programs and materials measure up.
CORVIL ANALYTICSTOP PRODUCT
Delights 80%
HighlySatisfies 15%
AlmostSatisfies 5%
Disappoints --
94 %Availability and
Quality of Training
2 ManageEngine OpManager 81%
3 Cisco Prime Infrastructure 75%
4 Network Operations Management 73%
5 CA Network Monitoring Solutions 72%
6 Microsoft Systems Center Operations Manager 71%
7 SolarWinds Network Performance Monitor 70%
8 IBM Tivoli Monitoring 69%
9 Nagios XI 68%
10 ConnectWise Automate 65%
CATEGORY AVERAGE 74%
Ease of ImplementationChoosing the right software is only the first step. Successfully implementing the new solution is necessary in order to realize its full value and promoteend user adoption. Use the data in this section to determine which software is easy to implement, and which may jeopardize your goals by causingtrouble in this stage.
MANAGEENGINEOPMANAGER TOP PRODUCT
Delights 39%
HighlySatisfies 44%
AlmostSatisfies 17%
Disappoints --
81 %Ease of
Implementation
2 CA Network Monitoring Solutions 79%
3 Cisco Prime Infrastructure 79%
4 Microsoft Systems Center Operations Manager 78%
5 Corvil Analytics 78%
6 IBM Tivoli Monitoring 75%
7 SolarWinds Network Performance Monitor 74%
8 Nagios XI 73%
9 Network Operations Management 73%
10 ConnectWise Automate 58%
CATEGORY AVERAGE 75%
13
Network Monitoring Category Report
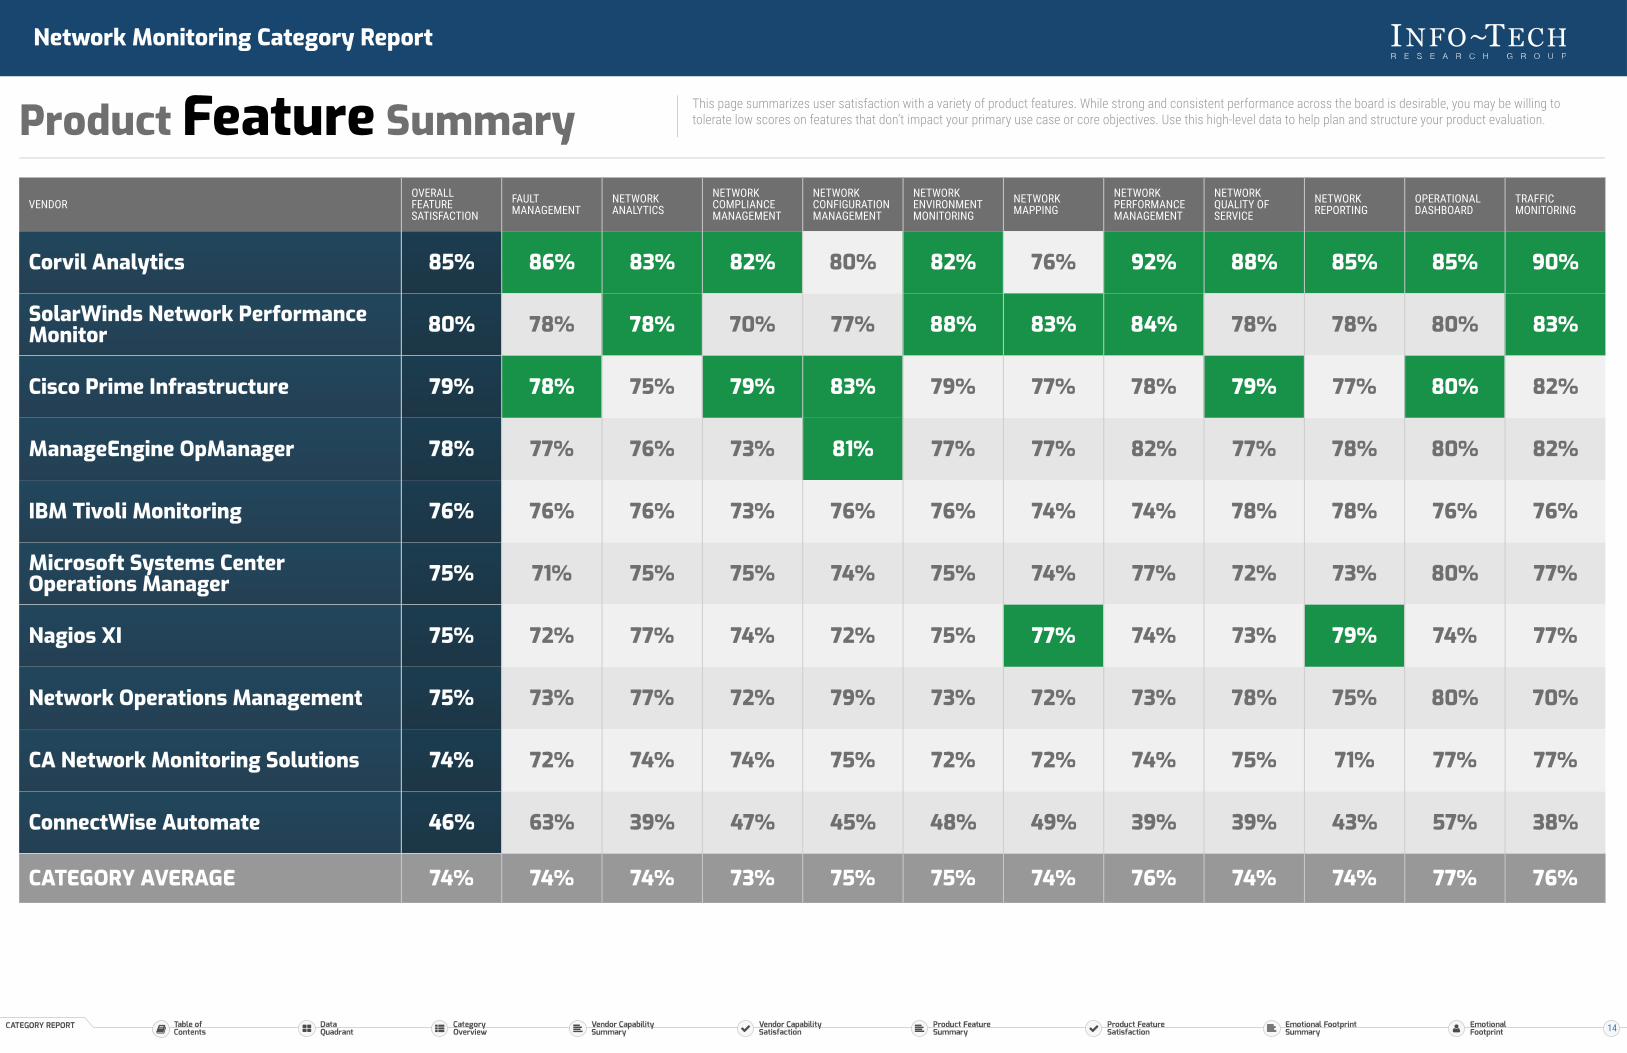
Product Feature Summary This page summarizes user satisfaction with a variety of product features. While strong and consistent performance across the board is desirable, you may be willing totolerate low scores on features that don’t impact your primary use case or core objectives. Use this high-level data to help plan and structure your product evaluation.
VENDOROVERALLFEATURESATISFACTION
FAULTMANAGEMENT
NETWORKANALYTICS
NETWORKCOMPLIANCEMANAGEMENT
NETWORKCONFIGURATIONMANAGEMENT
NETWORKENVIRONMENTMONITORING
NETWORKMAPPING
NETWORKPERFORMANCEMANAGEMENT
NETWORKQUALITY OFSERVICE
NETWORKREPORTING
OPERATIONALDASHBOARD
TRAFFICMONITORING
Corvil Analytics 85% 86% 83% 82% 80% 82% 76% 92% 88% 85% 85% 90%
SolarWinds Network PerformanceMonitor 80% 78% 78% 70% 77% 88% 83% 84% 78% 78% 80% 83%
Cisco Prime Infrastructure 79% 78% 75% 79% 83% 79% 77% 78% 79% 77% 80% 82%
ManageEngine OpManager 78% 77% 76% 73% 81% 77% 77% 82% 77% 78% 80% 82%
IBM Tivoli Monitoring 76% 76% 76% 73% 76% 76% 74% 74% 78% 78% 76% 76%
Microsoft Systems CenterOperations Manager 75% 71% 75% 75% 74% 75% 74% 77% 72% 73% 80% 77%
Nagios XI 75% 72% 77% 74% 72% 75% 77% 74% 73% 79% 74% 77%
Network Operations Management 75% 73% 77% 72% 79% 73% 72% 73% 78% 75% 80% 70%
CA Network Monitoring Solutions 74% 72% 74% 74% 75% 72% 72% 74% 75% 71% 77% 77%
ConnectWise Automate 46% 63% 39% 47% 45% 48% 49% 39% 39% 43% 57% 38%
CATEGORY AVERAGE 74% 74% 74% 73% 75% 75% 74% 76% 74% 74% 77% 76%
14

Network Monitoring Category Report
Product Feature Satisfaction This section provides detailed information on user satisfaction for each product feature.Use these pages to dig deeper into areas of particular interest or concern.
Product FeaturesThis table lists and describes all the features that are evaluated in the Network Monitoring software category. For your convenience, thesedescriptions are repeated under the feature subheadings in the subsequent pages.
Fault Management Includes logs, threat detection, root-cause analysis, and technical support andtroubleshooting.
Network Analytics Drive towards intelligent network operations by combining the power of automation andmonitoring data
Network ComplianceManagement
Includes compliance controls, compliance rules engine, and compliance monitoring andremediation
Network ConfigurationManagement
Includes change management, configuration logging, configuration backup, andconfiguration policy checking.
Network EnvironmentMonitoring
Includes hardware sensors, water sensors, temperature monitoring, and motion sensors,and other non-SNMP devices.
Network Mapping Includes auto network discovery, network visualization and visibility, and networktopology.
Network PerformanceManagement Includes network performance analysis, bandwidth monitoring, and capacity planning.
Network Quality of Service Includes quality of service (QoS) monitoring, and performance checks.
Network Reporting Includes dashboard visualizations and detailed summary reporting for data analysis.
Operational Dashboard Includes alerts and notifications, KPIs, visual analytics, and interactive features.
Traffic Monitoring Includes traffic flow analysis, network traffic capturing and recording, and network trafficsensors.
Fault ManagementIncludes logs, threat detection, root-cause analysis, and technical support and troubleshooting.
CORVIL ANALYTICSTOP PRODUCT
Delights 53%
HighlySatisfies 37%
AlmostSatisfies 11%
Disappoints --
86%Fault Management
2 Cisco Prime Infrastructure 78%
3 SolarWinds Network Performance Monitor 78%
4 ManageEngine OpManager 77%
5 IBM Tivoli Monitoring 76%
6 Network Operations Management 73%
7 Nagios XI 72%
8 CA Network Monitoring Solutions 72%
9 Microsoft Systems Center Operations Manager 71%
10 ConnectWise Automate 63%
CATEGORY AVERAGE 74%
15

Network Monitoring Category Report
Product Feature Satisfaction This section provides detailed information on user satisfaction for each product feature.Use these pages to dig deeper into areas of particular interest or concern.
Network AnalyticsDrive towards intelligent network operations by combining the power of automation and monitoring data
CORVIL ANALYTICSTOP PRODUCT
Delights 45%
HighlySatisfies 40%
AlmostSatisfies 15%
Disappoints --
83%Network Analytics
2 SolarWinds Network Performance Monitor 78%
3 Network Operations Management 77%
4 Nagios XI 77%
5 IBM Tivoli Monitoring 76%
6 ManageEngine OpManager 76%
7 Microsoft Systems Center Operations Manager 75%
8 Cisco Prime Infrastructure 75%
9 CA Network Monitoring Solutions 74%
10 ConnectWise Automate 39%
CATEGORY AVERAGE 74%
Network Compliance ManagementIncludes compliance controls, compliance rules engine, and compliance monitoring and remediation
CORVIL ANALYTICSTOP PRODUCT
Delights 47%
HighlySatisfies 33%
AlmostSatisfies 20%
Disappoints --
82%Network
ComplianceManagement
2 Cisco Prime Infrastructure 79%
3 Microsoft Systems Center Operations Manager 75%
4 Nagios XI 74%
5 CA Network Monitoring Solutions 74%
6 IBM Tivoli Monitoring 73%
7 ManageEngine OpManager 73%
8 Network Operations Management 72%
9 SolarWinds Network Performance Monitor 70%
10 ConnectWise Automate 47%
CATEGORY AVERAGE 73%
16

Network Monitoring Category Report
Product Feature Satisfaction This section provides detailed information on user satisfaction for each product feature.Use these pages to dig deeper into areas of particular interest or concern.
Network Configuration ManagementIncludes change management, configuration logging, configuration backup, and configuration policy checking.
CISCO PRIMEINFRASTRUCTURETOP PRODUCT
Delights 38%
HighlySatisfies 56%
AlmostSatisfies 6%
Disappoints --
83%Network
ConfigurationManagement
2 ManageEngine OpManager 81%
3 Corvil Analytics 80%
4 Network Operations Management 79%
5 SolarWinds Network Performance Monitor 77%
6 IBM Tivoli Monitoring 76%
7 CA Network Monitoring Solutions 75%
8 Microsoft Systems Center Operations Manager 74%
9 Nagios XI 72%
10 ConnectWise Automate 45%
CATEGORY AVERAGE 75%
Network Environment MonitoringIncludes hardware sensors, water sensors, temperature monitoring, and motion sensors, and other non-SNMP devices.
SOLARWINDSNETWORKPERFORMANCEMONITORTOP PRODUCT
Delights 54%
HighlySatisfies 43%
AlmostSatisfies 4%
Disappoints --
88%Network
EnvironmentMonitoring
2 Corvil Analytics 82%
3 Cisco Prime Infrastructure 79%
4 ManageEngine OpManager 77%
5 IBM Tivoli Monitoring 76%
6 Nagios XI 75%
7 Microsoft Systems Center Operations Manager 75%
8 Network Operations Management 73%
9 CA Network Monitoring Solutions 72%
10 ConnectWise Automate 48%
CATEGORY AVERAGE 75%
17

Network Monitoring Category Report
Product Feature Satisfaction This section provides detailed information on user satisfaction for each product feature.Use these pages to dig deeper into areas of particular interest or concern.
Network MappingIncludes auto network discovery, network visualization and visibility, and network topology.
SOLARWINDSNETWORKPERFORMANCEMONITORTOP PRODUCT
Delights 46%
HighlySatisfies 39%
AlmostSatisfies 14%
Disappoints --
83%Network Mapping
2 Nagios XI 77%
3 Cisco Prime Infrastructure 77%
4 ManageEngine OpManager 77%
5 Corvil Analytics 76%
6 IBM Tivoli Monitoring 74%
7 Microsoft Systems Center Operations Manager 74%
8 CA Network Monitoring Solutions 72%
9 Network Operations Management 72%
10 ConnectWise Automate 49%
CATEGORY AVERAGE 74%
Network Performance ManagementIncludes network performance analysis, bandwidth monitoring, and capacity planning.
CORVIL ANALYTICSTOP PRODUCT
Delights 74%
HighlySatisfies 21%
AlmostSatisfies 5%
Disappoints --
92%Network
PerformanceManagement
2 SolarWinds Network Performance Monitor 84%
3 ManageEngine OpManager 82%
4 Cisco Prime Infrastructure 78%
5 Microsoft Systems Center Operations Manager 77%
6 IBM Tivoli Monitoring 74%
7 Nagios XI 74%
8 CA Network Monitoring Solutions 74%
9 Network Operations Management 73%
10 ConnectWise Automate 39%
CATEGORY AVERAGE 76%
18

Network Monitoring Category Report
Product Feature Satisfaction This section provides detailed information on user satisfaction for each product feature.Use these pages to dig deeper into areas of particular interest or concern.
Network Quality of ServiceIncludes quality of service (QoS) monitoring, and performance checks.
CORVIL ANALYTICSTOP PRODUCT
Delights 61%
HighlySatisfies 28%
AlmostSatisfies 11%
Disappoints --
88%Network Quality of
Service
2 Cisco Prime Infrastructure 79%
3 Network Operations Management 78%
4 SolarWinds Network Performance Monitor 78%
5 IBM Tivoli Monitoring 78%
6 ManageEngine OpManager 77%
7 CA Network Monitoring Solutions 75%
8 Nagios XI 73%
9 Microsoft Systems Center Operations Manager 72%
10 ConnectWise Automate 39%
CATEGORY AVERAGE 74%
Network ReportingIncludes dashboard visualizations and detailed summary reporting for data analysis.
CORVIL ANALYTICSTOP PRODUCT
Delights 45%
HighlySatisfies 50%
AlmostSatisfies 5%
Disappoints --
85%Network Reporting
2 Nagios XI 79%
3 SolarWinds Network Performance Monitor 78%
4 IBM Tivoli Monitoring 78%
5 ManageEngine OpManager 78%
6 Cisco Prime Infrastructure 77%
7 Network Operations Management 75%
8 Microsoft Systems Center Operations Manager 73%
9 CA Network Monitoring Solutions 71%
10 ConnectWise Automate 43%
CATEGORY AVERAGE 74%
19

Network Monitoring Category Report
Product Feature Satisfaction This section provides detailed information on user satisfaction for each product feature.Use these pages to dig deeper into areas of particular interest or concern.
Operational DashboardIncludes alerts and notifications, KPIs, visual analytics, and interactive features.
CORVIL ANALYTICSTOP PRODUCT
Delights 50%
HighlySatisfies 40%
AlmostSatisfies 10%
Disappoints --
85%OperationalDashboard
2 Cisco Prime Infrastructure 80%
3 ManageEngine OpManager 80%
4 Network Operations Management 80%
5 Microsoft Systems Center Operations Manager 80%
6 SolarWinds Network Performance Monitor 80%
7 CA Network Monitoring Solutions 77%
8 IBM Tivoli Monitoring 76%
9 Nagios XI 74%
10 ConnectWise Automate 57%
CATEGORY AVERAGE 77%
Traffic MonitoringIncludes traffic flow analysis, network traffic capturing and recording, and network traffic sensors.
CORVIL ANALYTICSTOP PRODUCT
Delights 65%
HighlySatisfies 30%
AlmostSatisfies 5%
Disappoints --
90%Traffic Monitoring
2 SolarWinds Network Performance Monitor 83%
3 Cisco Prime Infrastructure 82%
4 ManageEngine OpManager 82%
5 Microsoft Systems Center Operations Manager 77%
6 CA Network Monitoring Solutions 77%
7 Nagios XI 77%
8 IBM Tivoli Monitoring 76%
9 Network Operations Management 70%
10 ConnectWise Automate 38%
CATEGORY AVERAGE 76%
20

Network Monitoring Category Report
Emotional FootprintSummary
The Net Emotional Footprint measures high-level user sentiment towards particular product offerings. It aggregates emotional response ratings for various dimensions of the vendor-client relationshipand product effectiveness, creating a powerful indicator of overall user feeling toward the vendor and product. While purchasing decisions shouldn’t be based on emotion, it’s valuable to know what kindof emotional response the vendor you’re considering elicits from their users.
-4 -3 -2 -1NEGATIVE
+1NEUTRAL
+2 +3 +4POSITIVE
EMOTIONAL SPECTRUM SCALE %POSITIVE
%NEGATIVE
EMOTIONALFOOTPRINT- =
-100 to +19 +20 to +39 +40 to +59 +60 to +79 +80 to +100
FAIR 100% ENABLESPRODUCTIVITY 100% RELIABLE 100% GREEDY 6%
RELIABLE 97% CARING 97% EFFICIENT 97% FRUSTRATING 8% DESPISED 3%CHARGES FORPRODUCTENHANCEMENTS
3%
RESPECTFUL 93% TRUSTWORTHY 91% CONTINUALLYIMPROVING 91% OVER PROMISED 11%
CHARGES FORPRODUCTENHANCEMENTS
9% DESPISED 9%
RELIABLE 94%CLIENTFRIENDLYPOLICIES
90% ENABLESPRODUCTIVITY 88%
CHARGES FORPRODUCTENHANCEMENTS
16% WASTES TIME 13% DECEPTIVE 10%
TRUSTWORTHY 96% UNIQUEFEATURES 93% EFFECTIVE 93% OVER PROMISED 17% VENDOR'S
INTEREST FIRST 12% GREEDY 12%
RESPECTFUL 92% ENABLESPRODUCTIVITY 89% RELIABLE 89% DECEPTIVE 10% OVER PROMISED 9% SELFISH 8%
TRUSTWORTHY 91% RESPECTFUL 91% INTEGRITY 88% OVER PROMISED 10% BUREAUCRATIC 9% STAGNANT 9%
TRANSPARENT 87% ENABLESPRODUCTIVITY 86% UNIQUE
FEATURES 86% OVER PROMISED 15% GREEDY 10% SELFISH 9%
EFFECTIVE 87% RELIABLE 85% RESPECTFUL 84% GREEDY 16% VENDOR'SINTEREST FIRST 12% OVER PROMISED 12%
RESPECTFUL 98%CLIENTFRIENDLYPOLICIES
87% INTEGRITY 87% OVER PROMISED 32% WASTES TIME 27% FRUSTRATING 23%
VENDOR NET EMOTIONALFOOTPRINT
NET EMOTIONALFOOTPRINT DISTRIBUTION
STRONGESTPOSITIVE EMOTIONS
STRONGESTNEGATIVE EMOTIONS
Corvil Analytics +96-- NEGATIVE 96% POSITIVE
ManageEngine OpManager +901% NEGATIVE 91% POSITIVE
IBM Tivoli Monitoring +795% NEGATIVE 84% POSITIVE
Cisco Prime Infrastructure +786% NEGATIVE 84% POSITIVE
SolarWinds Network Performance +784% NEGATIVE 82% POSITIVE
Operations Manager +775% NEGATIVE 82% POSITIVE
Network Operations Management +755% NEGATIVE 80% POSITIVE
Nagios XI +756% NEGATIVE 81% POSITIVE
CA Network Monitoring Solutions +716% NEGATIVE 77% POSITIVE
ConnectWise Automate +6111% NEGATIVE 72% POSITIVE
21

Network Monitoring Category Report
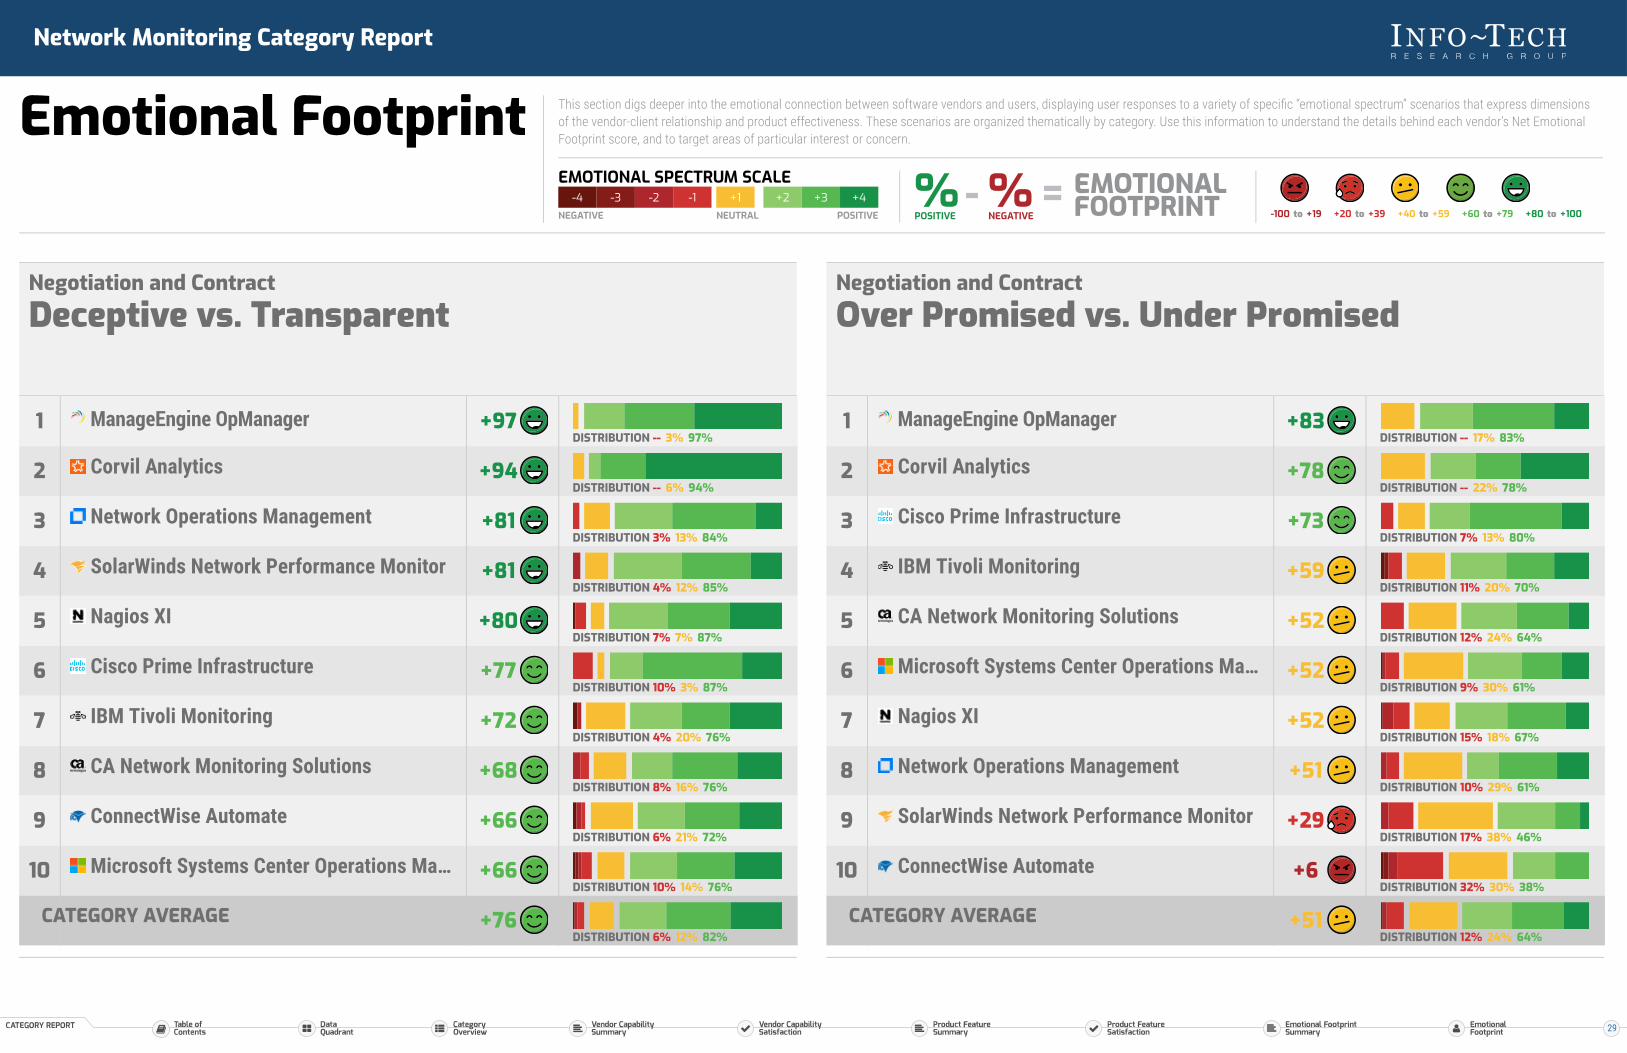
Emotional Footprint This section digs deeper into the emotional connection between software vendors and users, displaying user responses to a variety of specific “emotional spectrum” scenarios that express dimensionsof the vendor-client relationship and product effectiveness. These scenarios are organized thematically by category. Use this information to understand the details behind each vendor’s Net EmotionalFootprint score, and to target areas of particular interest or concern.
-4 -3 -2 -1NEGATIVE
+1NEUTRAL
+2 +3 +4POSITIVE
EMOTIONAL SPECTRUM SCALE %POSITIVE
%NEGATIVE
EMOTIONALFOOTPRINT- =
-100 to +19 +20 to +39 +40 to +59 +60 to +79 +80 to +100
CATEGORY
ServiceExperienceGood service matters. The last thing you need isto be disrespected by your software vendor, or toget bogged down by their ineptitude or neglect.This section displays data related to quality andeffectiveness of service, so you can knowwhether you’ll be treated well before and afteryou’ve made the purchase.
Service ExperienceDisrespectful vs. Respectful
DISTRIBUTION -- -- 100%
DISTRIBUTION -- 2% 98%
DISTRIBUTION -- 3% 97%
DISTRIBUTION -- 7% 93%
DISTRIBUTION 2% 4% 93%
DISTRIBUTION -- 9% 91%
DISTRIBUTION 1% 7% 92%
DISTRIBUTION 3% 10% 87%
DISTRIBUTION 6% 9% 84%
DISTRIBUTION 6% 10% 84%
DISTRIBUTION 2% 6% 91%
1 Corvil Analytics +100
2 ConnectWise Automate +98
3 ManageEngine OpManager +97
4 SolarWinds Network Performance Monitor +93
5 IBM Tivoli Monitoring +91
6 Network Operations Management +91
7 Microsoft Systems Center Operations Ma… +91
8 Cisco Prime Infrastructure +84
9 Nagios XI +78
10 CA Network Monitoring Solutions +78
CATEGORY AVERAGE +89
22

Network Monitoring Category Report
Emotional Footprint This section digs deeper into the emotional connection between software vendors and users, displaying user responses to a variety of specific “emotional spectrum” scenarios that express dimensionsof the vendor-client relationship and product effectiveness. These scenarios are organized thematically by category. Use this information to understand the details behind each vendor’s Net EmotionalFootprint score, and to target areas of particular interest or concern.
-4 -3 -2 -1NEGATIVE
+1NEUTRAL
+2 +3 +4POSITIVE
EMOTIONAL SPECTRUM SCALE %POSITIVE
%NEGATIVE
EMOTIONALFOOTPRINT- =
-100 to +19 +20 to +39 +40 to +59 +60 to +79 +80 to +100
Service ExperienceBureaucratic vs. Efficient
DISTRIBUTION -- -- 100%
DISTRIBUTION -- 3% 97%
DISTRIBUTION 4% 7% 89%
DISTRIBUTION 6% 6% 87%
DISTRIBUTION 4% 12% 84%
DISTRIBUTION 4% 14% 82%
DISTRIBUTION 6% 13% 81%
DISTRIBUTION 9% 9% 81%
DISTRIBUTION 8% 14% 78%
DISTRIBUTION 20% 14% 66%
DISTRIBUTION 7% 10% 83%
1 Corvil Analytics +100
2 ManageEngine OpManager +97
3 IBM Tivoli Monitoring +85
4 Cisco Prime Infrastructure +81
5 Microsoft Systems Center Operations Ma… +80
6 SolarWinds Network Performance Monitor +78
7 Nagios XI +75
8 Network Operations Management +72
9 CA Network Monitoring Solutions +70
10 ConnectWise Automate +46
CATEGORY AVERAGE +76
Service ExperienceNeglectful vs. Caring
DISTRIBUTION -- -- 100%
DISTRIBUTION -- 3% 97%
DISTRIBUTION 6% 6% 88%
DISTRIBUTION 6% 11% 83%
DISTRIBUTION 7% 11% 83%
DISTRIBUTION 6% 13% 81%
DISTRIBUTION 8% 11% 82%
DISTRIBUTION 6% 15% 79%
DISTRIBUTION 7% 14% 79%
DISTRIBUTION 16% 14% 70%
DISTRIBUTION 7% 11% 82%
1 Corvil Analytics +100
2 ManageEngine OpManager +97
3 Network Operations Management +82
4 Nagios XI +77
5 IBM Tivoli Monitoring +76
6 Cisco Prime Infrastructure +75
7 Microsoft Systems Center Operations Ma… +74
8 CA Network Monitoring Solutions +73
9 SolarWinds Network Performance Monitor +72
10 ConnectWise Automate +54
CATEGORY AVERAGE +75
23

Network Monitoring Category Report
Emotional Footprint This section digs deeper into the emotional connection between software vendors and users, displaying user responses to a variety of specific “emotional spectrum” scenarios that express dimensionsof the vendor-client relationship and product effectiveness. These scenarios are organized thematically by category. Use this information to understand the details behind each vendor’s Net EmotionalFootprint score, and to target areas of particular interest or concern.
-4 -3 -2 -1NEGATIVE
+1NEUTRAL
+2 +3 +4POSITIVE
EMOTIONAL SPECTRUM SCALE %POSITIVE
%NEGATIVE
EMOTIONALFOOTPRINT- =
-100 to +19 +20 to +39 +40 to +59 +60 to +79 +80 to +100
Service ExperienceFrustrating vs. Effective
DISTRIBUTION -- -- 100%
DISTRIBUTION 7% -- 93%
DISTRIBUTION 4% 10% 87%
DISTRIBUTION 2% 15% 83%
DISTRIBUTION 8% 3% 89%
DISTRIBUTION 5% 11% 84%
DISTRIBUTION 4% 14% 82%
DISTRIBUTION 6% 13% 81%
DISTRIBUTION 10% 6% 84%
DISTRIBUTION 23% 21% 55%
DISTRIBUTION 7% 11% 82%
1 Corvil Analytics +100
2 SolarWinds Network Performance Monitor +86
3 CA Network Monitoring Solutions +83
4 IBM Tivoli Monitoring +81
5 ManageEngine OpManager +81
6 Nagios XI +79
7 Microsoft Systems Center Operations Ma… +78
8 Network Operations Management +75
9 Cisco Prime Infrastructure +74
10 ConnectWise Automate +32
CATEGORY AVERAGE +74
Service ExperienceWastes Time vs. Saves Time
DISTRIBUTION -- 5% 95%
DISTRIBUTION -- 11% 89%
DISTRIBUTION 4% 7% 89%
DISTRIBUTION -- 18% 82%
DISTRIBUTION 2% 15% 83%
DISTRIBUTION 3% 19% 78%
DISTRIBUTION 6% 14% 80%
DISTRIBUTION 7% 13% 80%
DISTRIBUTION 13% 10% 77%
DISTRIBUTION 27% 16% 57%
DISTRIBUTION 7% 13% 80%
1 Corvil Analytics +95
2 ManageEngine OpManager +89
3 IBM Tivoli Monitoring +85
4 SolarWinds Network Performance Monitor +82
5 CA Network Monitoring Solutions +81
6 Network Operations Management +75
7 Nagios XI +74
8 Microsoft Systems Center Operations Ma… +73
9 Cisco Prime Infrastructure +64
10 ConnectWise Automate +30
CATEGORY AVERAGE +72
24

Network Monitoring Category Report
Emotional Footprint This section digs deeper into the emotional connection between software vendors and users, displaying user responses to a variety of specific “emotional spectrum” scenarios that express dimensionsof the vendor-client relationship and product effectiveness. These scenarios are organized thematically by category. Use this information to understand the details behind each vendor’s Net EmotionalFootprint score, and to target areas of particular interest or concern.
-4 -3 -2 -1NEGATIVE
+1NEUTRAL
+2 +3 +4POSITIVE
EMOTIONAL SPECTRUM SCALE %POSITIVE
%NEGATIVE
EMOTIONALFOOTPRINT- =
-100 to +19 +20 to +39 +40 to +59 +60 to +79 +80 to +100
CATEGORY
ConflictResolutionDisagreements are inevitable, but knowing yourvendor will handle them reasonably, fairly, andamiably can give you peace of mind. Use thedata in this section to understand which vendorswill behave professionally when conflict arises.
Conflict ResolutionLack Of Integrity vs. Integrity
DISTRIBUTION -- 5% 95%
DISTRIBUTION -- 9% 91%
DISTRIBUTION -- 12% 88%
DISTRIBUTION 3% 9% 88%
DISTRIBUTION 2% 11% 87%
DISTRIBUTION 3% 10% 87%
DISTRIBUTION 7% 11% 83%
DISTRIBUTION 5% 13% 81%
DISTRIBUTION 4% 18% 78%
DISTRIBUTION 6% 17% 77%
DISTRIBUTION 4% 12% 84%
1 Corvil Analytics +95
2 ManageEngine OpManager +91
3 SolarWinds Network Performance Monitor +88
4 Network Operations Management +85
5 ConnectWise Automate +85
6 Cisco Prime Infrastructure +84
7 IBM Tivoli Monitoring +76
8 Microsoft Systems Center Operations Ma… +76
9 CA Network Monitoring Solutions +74
10 Nagios XI +71
CATEGORY AVERAGE +80
25

Network Monitoring Category Report
Emotional Footprint This section digs deeper into the emotional connection between software vendors and users, displaying user responses to a variety of specific “emotional spectrum” scenarios that express dimensionsof the vendor-client relationship and product effectiveness. These scenarios are organized thematically by category. Use this information to understand the details behind each vendor’s Net EmotionalFootprint score, and to target areas of particular interest or concern.
-4 -3 -2 -1NEGATIVE
+1NEUTRAL
+2 +3 +4POSITIVE
EMOTIONAL SPECTRUM SCALE %POSITIVE
%NEGATIVE
EMOTIONALFOOTPRINT- =
-100 to +19 +20 to +39 +40 to +59 +60 to +79 +80 to +100
Conflict ResolutionVendor Friendly Policies vs. Client FriendlyPolicies
DISTRIBUTION -- 5% 95%
DISTRIBUTION -- 9% 91%
DISTRIBUTION 6% 3% 90%
DISTRIBUTION 7% 5% 87%
DISTRIBUTION 6% 9% 84%
DISTRIBUTION 8% 13% 80%
DISTRIBUTION 8% 12% 80%
DISTRIBUTION 7% 15% 78%
DISTRIBUTION 8% 16% 76%
DISTRIBUTION 7% 19% 75%
DISTRIBUTION 6% 12% 82%
1 Corvil Analytics +95
2 ManageEngine OpManager +91
3 Cisco Prime Infrastructure +84
4 ConnectWise Automate +80
5 Network Operations Management +78
6 Nagios XI +72
7 SolarWinds Network Performance Monitor +72
8 IBM Tivoli Monitoring +71
9 CA Network Monitoring Solutions +68
10 Microsoft Systems Center Operations Ma… +68
CATEGORY AVERAGE +76
Conflict ResolutionSelfish vs. Altruistic
DISTRIBUTION -- 5% 95%
DISTRIBUTION -- 9% 91%
DISTRIBUTION 7% 13% 80%
DISTRIBUTION 7% 18% 75%
DISTRIBUTION 3% 26% 71%
DISTRIBUTION 8% 16% 76%
DISTRIBUTION 6% 22% 72%
DISTRIBUTION 9% 17% 73%
DISTRIBUTION 8% 21% 71%
DISTRIBUTION 4% 32% 64%
DISTRIBUTION 6% 18% 76%
1 Corvil Analytics +95
2 ManageEngine OpManager +91
3 IBM Tivoli Monitoring +73
4 ConnectWise Automate +68
5 Cisco Prime Infrastructure +68
6 CA Network Monitoring Solutions +68
7 Network Operations Management +66
8 Nagios XI +64
9 Microsoft Systems Center Operations Ma… +63
10 SolarWinds Network Performance Monitor +60
CATEGORY AVERAGE +70
26

Network Monitoring Category Report
Emotional Footprint This section digs deeper into the emotional connection between software vendors and users, displaying user responses to a variety of specific “emotional spectrum” scenarios that express dimensionsof the vendor-client relationship and product effectiveness. These scenarios are organized thematically by category. Use this information to understand the details behind each vendor’s Net EmotionalFootprint score, and to target areas of particular interest or concern.
-4 -3 -2 -1NEGATIVE
+1NEUTRAL
+2 +3 +4POSITIVE
EMOTIONAL SPECTRUM SCALE %POSITIVE
%NEGATIVE
EMOTIONALFOOTPRINT- =
-100 to +19 +20 to +39 +40 to +59 +60 to +79 +80 to +100
Conflict ResolutionBig Fat Liars vs. Trustworthy
DISTRIBUTION -- 4% 96%
DISTRIBUTION -- 5% 95%
DISTRIBUTION -- 6% 94%
DISTRIBUTION -- 9% 91%
DISTRIBUTION 2% 7% 91%
DISTRIBUTION 3% 10% 87%
DISTRIBUTION 4% 9% 87%
DISTRIBUTION 3% 14% 83%
DISTRIBUTION 4% 18% 78%
DISTRIBUTION 5% 16% 78%
DISTRIBUTION 3% 11% 86%
1 SolarWinds Network Performance Monitor +96
2 Corvil Analytics +95
3 ManageEngine OpManager +94
4 Network Operations Management +91
5 IBM Tivoli Monitoring +89
6 Cisco Prime Infrastructure +84
7 Microsoft Systems Center Operations Ma… +83
8 Nagios XI +80
9 CA Network Monitoring Solutions +74
10 ConnectWise Automate +73
CATEGORY AVERAGE +84
Conflict ResolutionUnfair vs. Fair
DISTRIBUTION -- -- 100%
DISTRIBUTION -- 9% 91%
DISTRIBUTION -- 16% 84%
DISTRIBUTION 3% 10% 87%
DISTRIBUTION 4% 9% 87%
DISTRIBUTION -- 17% 83%
DISTRIBUTION 3% 13% 84%
DISTRIBUTION 7% 9% 85%
DISTRIBUTION 2% 20% 78%
DISTRIBUTION 5% 16% 78%
DISTRIBUTION 3% 12% 85%
1 Corvil Analytics +100
2 ManageEngine OpManager +91
3 Network Operations Management +84
4 Cisco Prime Infrastructure +84
5 Microsoft Systems Center Operations Ma… +83
6 SolarWinds Network Performance Monitor +83
7 Nagios XI +81
8 IBM Tivoli Monitoring +78
9 CA Network Monitoring Solutions +76
10 ConnectWise Automate +73
CATEGORY AVERAGE +82
27

Network Monitoring Category Report
Emotional Footprint This section digs deeper into the emotional connection between software vendors and users, displaying user responses to a variety of specific “emotional spectrum” scenarios that express dimensionsof the vendor-client relationship and product effectiveness. These scenarios are organized thematically by category. Use this information to understand the details behind each vendor’s Net EmotionalFootprint score, and to target areas of particular interest or concern.
-4 -3 -2 -1NEGATIVE
+1NEUTRAL
+2 +3 +4POSITIVE
EMOTIONAL SPECTRUM SCALE %POSITIVE
%NEGATIVE
EMOTIONALFOOTPRINT- =
-100 to +19 +20 to +39 +40 to +59 +60 to +79 +80 to +100
CATEGORY
Negotiation andContractNegotiation doesn’t have to be adversarial. Bothparties are always looking to get the best deal,but finding a vendor who will work with yourather than against makes it more likely you’llboth be happy with the results. Use the data inthis section to determine which vendors willnegotiate pleasantly and in good faith.
Negotiation and ContractGreedy vs. Generous
DISTRIBUTION -- 3% 97%
DISTRIBUTION -- 13% 87%
DISTRIBUTION 6% 6% 89%
DISTRIBUTION 10% 8% 82%
DISTRIBUTION 7% 17% 76%
DISTRIBUTION 6% 19% 74%
DISTRIBUTION 7% 18% 75%
DISTRIBUTION 12% 15% 73%
DISTRIBUTION 16% 14% 70%
DISTRIBUTION 21% 28% 51%
DISTRIBUTION 9% 15% 76%
1 ManageEngine OpManager +97
2 Cisco Prime Infrastructure +87
3 Corvil Analytics +83
4 Nagios XI +72
5 IBM Tivoli Monitoring +69
6 Network Operations Management +68
7 Microsoft Systems Center Operations Ma… +68
8 SolarWinds Network Performance Monitor +61
9 CA Network Monitoring Solutions +54
10 ConnectWise Automate +30
CATEGORY AVERAGE +67
28
Network Monitoring Category Report
Emotional Footprint This section digs deeper into the emotional connection between software vendors and users, displaying user responses to a variety of specific “emotional spectrum” scenarios that express dimensionsof the vendor-client relationship and product effectiveness. These scenarios are organized thematically by category. Use this information to understand the details behind each vendor’s Net EmotionalFootprint score, and to target areas of particular interest or concern.
-4 -3 -2 -1NEGATIVE
+1NEUTRAL
+2 +3 +4POSITIVE
EMOTIONAL SPECTRUM SCALE %POSITIVE
%NEGATIVE
EMOTIONALFOOTPRINT- =
-100 to +19 +20 to +39 +40 to +59 +60 to +79 +80 to +100
Negotiation and ContractDeceptive vs. Transparent
DISTRIBUTION -- 3% 97%
DISTRIBUTION -- 6% 94%
DISTRIBUTION 3% 13% 84%
DISTRIBUTION 4% 12% 85%
DISTRIBUTION 7% 7% 87%
DISTRIBUTION 10% 3% 87%
DISTRIBUTION 4% 20% 76%
DISTRIBUTION 8% 16% 76%
DISTRIBUTION 6% 21% 72%
DISTRIBUTION 10% 14% 76%
DISTRIBUTION 6% 12% 82%
1 ManageEngine OpManager +97
2 Corvil Analytics +94
3 Network Operations Management +81
4 SolarWinds Network Performance Monitor +81
5 Nagios XI +80
6 Cisco Prime Infrastructure +77
7 IBM Tivoli Monitoring +72
8 CA Network Monitoring Solutions +68
9 ConnectWise Automate +66
10 Microsoft Systems Center Operations Ma… +66
CATEGORY AVERAGE +76
Negotiation and ContractOver Promised vs. Under Promised
DISTRIBUTION -- 17% 83%
DISTRIBUTION -- 22% 78%
DISTRIBUTION 7% 13% 80%
DISTRIBUTION 11% 20% 70%
DISTRIBUTION 12% 24% 64%
DISTRIBUTION 9% 30% 61%
DISTRIBUTION 15% 18% 67%
DISTRIBUTION 10% 29% 61%
DISTRIBUTION 17% 38% 46%
DISTRIBUTION 32% 30% 38%
DISTRIBUTION 12% 24% 64%
1 ManageEngine OpManager +83
2 Corvil Analytics +78
3 Cisco Prime Infrastructure +73
4 IBM Tivoli Monitoring +59
5 CA Network Monitoring Solutions +52
6 Microsoft Systems Center Operations Ma… +52
7 Nagios XI +52
8 Network Operations Management +51
9 SolarWinds Network Performance Monitor +29
10 ConnectWise Automate +6
CATEGORY AVERAGE +51
29

Network Monitoring Category Report
Emotional Footprint This section digs deeper into the emotional connection between software vendors and users, displaying user responses to a variety of specific “emotional spectrum” scenarios that express dimensionsof the vendor-client relationship and product effectiveness. These scenarios are organized thematically by category. Use this information to understand the details behind each vendor’s Net EmotionalFootprint score, and to target areas of particular interest or concern.
-4 -3 -2 -1NEGATIVE
+1NEUTRAL
+2 +3 +4POSITIVE
EMOTIONAL SPECTRUM SCALE %POSITIVE
%NEGATIVE
EMOTIONALFOOTPRINT- =
-100 to +19 +20 to +39 +40 to +59 +60 to +79 +80 to +100
Negotiation and ContractVendor's Interest First vs. Client's InterestFirst
DISTRIBUTION -- 6% 94%
DISTRIBUTION -- 14% 86%
DISTRIBUTION 4% 11% 84%
DISTRIBUTION 5% 16% 78%
DISTRIBUTION 10% 7% 83%
DISTRIBUTION 8% 11% 80%
DISTRIBUTION 6% 16% 78%
DISTRIBUTION 12% 8% 80%
DISTRIBUTION 12% 20% 68%
DISTRIBUTION 19% 21% 60%
DISTRIBUTION 8% 14% 78%
1 Corvil Analytics +94
2 ManageEngine OpManager +86
3 IBM Tivoli Monitoring +80
4 Microsoft Systems Center Operations Ma… +73
5 Cisco Prime Infrastructure +73
6 Nagios XI +72
7 Network Operations Management +72
8 SolarWinds Network Performance Monitor +68
9 CA Network Monitoring Solutions +56
10 ConnectWise Automate +41
CATEGORY AVERAGE +69
Negotiation and ContractHardball Tactics vs. Friendly Negotiation
DISTRIBUTION -- 9% 91%
DISTRIBUTION -- 11% 89%
DISTRIBUTION 7% 10% 83%
DISTRIBUTION 8% 10% 82%
DISTRIBUTION 3% 19% 77%
DISTRIBUTION 4% 20% 76%
DISTRIBUTION 5% 21% 74%
DISTRIBUTION 8% 16% 76%
DISTRIBUTION 6% 26% 68%
DISTRIBUTION 8% 22% 69%
DISTRIBUTION 6% 17% 77%
1 ManageEngine OpManager +91
2 Corvil Analytics +89
3 Cisco Prime Infrastructure +76
4 Nagios XI +74
5 Network Operations Management +74
6 IBM Tivoli Monitoring +72
7 Microsoft Systems Center Operations Ma… +69
8 SolarWinds Network Performance Monitor +68
9 ConnectWise Automate +62
10 CA Network Monitoring Solutions +61
CATEGORY AVERAGE +72
30

Network Monitoring Category Report
Emotional Footprint This section digs deeper into the emotional connection between software vendors and users, displaying user responses to a variety of specific “emotional spectrum” scenarios that express dimensionsof the vendor-client relationship and product effectiveness. These scenarios are organized thematically by category. Use this information to understand the details behind each vendor’s Net EmotionalFootprint score, and to target areas of particular interest or concern.
-4 -3 -2 -1NEGATIVE
+1NEUTRAL
+2 +3 +4POSITIVE
EMOTIONAL SPECTRUM SCALE %POSITIVE
%NEGATIVE
EMOTIONALFOOTPRINT- =
-100 to +19 +20 to +39 +40 to +59 +60 to +79 +80 to +100
CATEGORY
Strategy andInnovationYour vendor’s attitude toward innovation isimportant; if they aren’t at least keeping pacewith market directions and trends, they certainlywon’t be enabling you to get ahead. Use the datain this section to gauge whether your vendorappreciates the need to innovate and the extentto which they’ll support you to do the same.
Strategy and InnovationRoadblock To Innovation vs. Helps Innovate
DISTRIBUTION -- -- 100%
DISTRIBUTION -- 10% 90%
DISTRIBUTION 2% 7% 91%
DISTRIBUTION -- 11% 89%
DISTRIBUTION -- 13% 88%
DISTRIBUTION 4% 7% 89%
DISTRIBUTION 3% 11% 86%
DISTRIBUTION 3% 13% 84%
DISTRIBUTION 9% 9% 82%
DISTRIBUTION 8% 17% 75%
DISTRIBUTION 4% 10% 86%
1 Corvil Analytics +100
2 SolarWinds Network Performance Monitor +90
3 IBM Tivoli Monitoring +89
4 ManageEngine OpManager +89
5 Cisco Prime Infrastructure +88
6 Microsoft Systems Center Operations Ma… +85
7 Nagios XI +83
8 Network Operations Management +81
9 ConnectWise Automate +73
10 CA Network Monitoring Solutions +67
CATEGORY AVERAGE +83
31

Network Monitoring Category Report
Emotional Footprint This section digs deeper into the emotional connection between software vendors and users, displaying user responses to a variety of specific “emotional spectrum” scenarios that express dimensionsof the vendor-client relationship and product effectiveness. These scenarios are organized thematically by category. Use this information to understand the details behind each vendor’s Net EmotionalFootprint score, and to target areas of particular interest or concern.
-4 -3 -2 -1NEGATIVE
+1NEUTRAL
+2 +3 +4POSITIVE
EMOTIONAL SPECTRUM SCALE %POSITIVE
%NEGATIVE
EMOTIONALFOOTPRINT- =
-100 to +19 +20 to +39 +40 to +59 +60 to +79 +80 to +100
Strategy and InnovationStagnant vs. Continually Improving
DISTRIBUTION -- -- 100%
DISTRIBUTION 2% 7% 91%
DISTRIBUTION 3% 8% 89%
DISTRIBUTION -- 14% 86%
DISTRIBUTION 3% 9% 88%
DISTRIBUTION 3% 9% 88%
DISTRIBUTION 6% 14% 79%
DISTRIBUTION 7% 16% 77%
DISTRIBUTION 6% 21% 73%
DISTRIBUTION 9% 22% 69%
DISTRIBUTION 4% 13% 83%
1 Corvil Analytics +100
2 IBM Tivoli Monitoring +89
3 ManageEngine OpManager +86
4 SolarWinds Network Performance Monitor +86
5 Cisco Prime Infrastructure +85
6 Microsoft Systems Center Operations Ma… +85
7 Nagios XI +73
8 ConnectWise Automate +70
9 CA Network Monitoring Solutions +67
10 Network Operations Management +60
CATEGORY AVERAGE +79
Strategy and InnovationCharges For Product Enhancements vs.Includes Product Enhancements
DISTRIBUTION -- -- 100%
DISTRIBUTION 3% 8% 89%
DISTRIBUTION 4% 12% 84%
DISTRIBUTION 6% 11% 83%
DISTRIBUTION 9% 7% 85%
DISTRIBUTION 9% 9% 81%
DISTRIBUTION 6% 18% 76%
DISTRIBUTION 7% 17% 76%
DISTRIBUTION 16% 6% 77%
DISTRIBUTION 14% 16% 70%
DISTRIBUTION 8% 11% 81%
1 Corvil Analytics +100
2 ManageEngine OpManager +86
3 Microsoft Systems Center Operations Ma… +80
4 Nagios XI +77
5 IBM Tivoli Monitoring +76
6 Network Operations Management +72
7 CA Network Monitoring Solutions +70
8 SolarWinds Network Performance Monitor +69
9 Cisco Prime Infrastructure +61
10 ConnectWise Automate +56
CATEGORY AVERAGE +74
32

Network Monitoring Category Report
Emotional Footprint This section digs deeper into the emotional connection between software vendors and users, displaying user responses to a variety of specific “emotional spectrum” scenarios that express dimensionsof the vendor-client relationship and product effectiveness. These scenarios are organized thematically by category. Use this information to understand the details behind each vendor’s Net EmotionalFootprint score, and to target areas of particular interest or concern.
-4 -3 -2 -1NEGATIVE
+1NEUTRAL
+2 +3 +4POSITIVE
EMOTIONAL SPECTRUM SCALE %POSITIVE
%NEGATIVE
EMOTIONALFOOTPRINT- =
-100 to +19 +20 to +39 +40 to +59 +60 to +79 +80 to +100
Strategy and InnovationLeverages Incumbent Status vs. AppreciatesIncumbent Status
DISTRIBUTION -- 5% 95%
DISTRIBUTION 3% 11% 86%
DISTRIBUTION 4% 11% 84%
DISTRIBUTION 4% 16% 80%
DISTRIBUTION 6% 13% 81%
DISTRIBUTION 8% 14% 78%
DISTRIBUTION 3% 24% 72%
DISTRIBUTION 6% 21% 73%
DISTRIBUTION 3% 28% 69%
DISTRIBUTION 13% 21% 66%
DISTRIBUTION 6% 17% 78%
1 Corvil Analytics +95
2 ManageEngine OpManager +83
3 IBM Tivoli Monitoring +80
4 Microsoft Systems Center Operations Ma… +76
5 Cisco Prime Infrastructure +75
6 Nagios XI +70
7 SolarWinds Network Performance Monitor +69
8 CA Network Monitoring Solutions +67
9 Network Operations Management +66
10 ConnectWise Automate +53
CATEGORY AVERAGE +72
Strategy and InnovationDespised vs. Inspiring
DISTRIBUTION -- -- 100%
DISTRIBUTION 3% 11% 86%
DISTRIBUTION -- 19% 81%
DISTRIBUTION 5% 13% 83%
DISTRIBUTION 9% 7% 85%
DISTRIBUTION 6% 13% 81%
DISTRIBUTION 7% 14% 79%
DISTRIBUTION 6% 16% 78%
DISTRIBUTION 8% 14% 78%
DISTRIBUTION 7% 23% 70%
DISTRIBUTION 6% 14% 80%
1 Corvil Analytics +100
2 ManageEngine OpManager +83
3 Network Operations Management +81
4 Nagios XI +78
5 IBM Tivoli Monitoring +76
6 CA Network Monitoring Solutions +75
7 SolarWinds Network Performance Monitor +72
8 Cisco Prime Infrastructure +72
9 Microsoft Systems Center Operations Ma… +70
10 ConnectWise Automate +63
CATEGORY AVERAGE +75
33

Network Monitoring Category Report
Emotional Footprint This section digs deeper into the emotional connection between software vendors and users, displaying user responses to a variety of specific “emotional spectrum” scenarios that express dimensionsof the vendor-client relationship and product effectiveness. These scenarios are organized thematically by category. Use this information to understand the details behind each vendor’s Net EmotionalFootprint score, and to target areas of particular interest or concern.
-4 -3 -2 -1NEGATIVE
+1NEUTRAL
+2 +3 +4POSITIVE
EMOTIONAL SPECTRUM SCALE %POSITIVE
%NEGATIVE
EMOTIONALFOOTPRINT- =
-100 to +19 +20 to +39 +40 to +59 +60 to +79 +80 to +100
CATEGORY
Product ImpactSoftware needs to reliably enable yourperformance and productivity. Use the data inthis section to see which vendors will propel youforward and which will be deadweight you’ll needto carry.
Product ImpactUnreliable vs. Reliable
DISTRIBUTION -- -- 100%
DISTRIBUTION -- 3% 97%
DISTRIBUTION 3% 3% 94%
DISTRIBUTION 3% 7% 90%
DISTRIBUTION 3% 8% 89%
DISTRIBUTION 2% 13% 85%
DISTRIBUTION 3% 13% 84%
DISTRIBUTION 7% 11% 83%
DISTRIBUTION 6% 14% 79%
DISTRIBUTION 11% 13% 77%
DISTRIBUTION 4% 10% 86%
1 Corvil Analytics +100
2 ManageEngine OpManager +97
3 Cisco Prime Infrastructure +91
4 SolarWinds Network Performance Monitor +87
5 Microsoft Systems Center Operations Ma… +86
6 CA Network Monitoring Solutions +83
7 Network Operations Management +81
8 IBM Tivoli Monitoring +76
9 Nagios XI +73
10 ConnectWise Automate +66
CATEGORY AVERAGE +82
34

Network Monitoring Category Report
Emotional Footprint This section digs deeper into the emotional connection between software vendors and users, displaying user responses to a variety of specific “emotional spectrum” scenarios that express dimensionsof the vendor-client relationship and product effectiveness. These scenarios are organized thematically by category. Use this information to understand the details behind each vendor’s Net EmotionalFootprint score, and to target areas of particular interest or concern.
-4 -3 -2 -1NEGATIVE
+1NEUTRAL
+2 +3 +4POSITIVE
EMOTIONAL SPECTRUM SCALE %POSITIVE
%NEGATIVE
EMOTIONALFOOTPRINT- =
-100 to +19 +20 to +39 +40 to +59 +60 to +79 +80 to +100
Product ImpactRestricts Productivity vs. Enables Productivity
DISTRIBUTION -- -- 100%
DISTRIBUTION -- 6% 94%
DISTRIBUTION 3% 7% 90%
DISTRIBUTION 3% 8% 89%
DISTRIBUTION 3% 9% 88%
DISTRIBUTION -- 16% 84%
DISTRIBUTION 3% 11% 86%
DISTRIBUTION 4% 13% 83%
DISTRIBUTION 7% 9% 85%
DISTRIBUTION 7% 13% 80%
DISTRIBUTION 3% 10% 87%
1 Corvil Analytics +100
2 ManageEngine OpManager +94
3 SolarWinds Network Performance Monitor +87
4 Microsoft Systems Center Operations Ma… +86
5 Cisco Prime Infrastructure +85
6 Network Operations Management +84
7 Nagios XI +83
8 CA Network Monitoring Solutions +79
9 IBM Tivoli Monitoring +78
10 ConnectWise Automate +73
CATEGORY AVERAGE +83
Product ImpactPerformance Restricting vs. PerformanceEnhancing
DISTRIBUTION -- 5% 95%
DISTRIBUTION 3% 6% 92%
DISTRIBUTION 4% 9% 87%
DISTRIBUTION 4% 9% 87%
DISTRIBUTION 3% 13% 84%
DISTRIBUTION 7% 7% 86%
DISTRIBUTION 2% 19% 79%
DISTRIBUTION 3% 19% 78%
DISTRIBUTION 6% 16% 78%
DISTRIBUTION 13% 11% 77%
DISTRIBUTION 5% 12% 84%
1 Corvil Analytics +95
2 ManageEngine OpManager +89
3 IBM Tivoli Monitoring +83
4 Microsoft Systems Center Operations Ma… +83
5 Nagios XI +81
6 SolarWinds Network Performance Monitor +79
7 CA Network Monitoring Solutions +77
8 Cisco Prime Infrastructure +75
9 Network Operations Management +72
10 ConnectWise Automate +64
CATEGORY AVERAGE +79
35

Network Monitoring Category Report
Emotional Footprint This section digs deeper into the emotional connection between software vendors and users, displaying user responses to a variety of specific “emotional spectrum” scenarios that express dimensionsof the vendor-client relationship and product effectiveness. These scenarios are organized thematically by category. Use this information to understand the details behind each vendor’s Net EmotionalFootprint score, and to target areas of particular interest or concern.
-4 -3 -2 -1NEGATIVE
+1NEUTRAL
+2 +3 +4POSITIVE
EMOTIONAL SPECTRUM SCALE %POSITIVE
%NEGATIVE
EMOTIONALFOOTPRINT- =
-100 to +19 +20 to +39 +40 to +59 +60 to +79 +80 to +100
Product ImpactCommodity Features vs. Unique Features
DISTRIBUTION -- -- 100%
DISTRIBUTION -- 7% 93%
DISTRIBUTION 7% 4% 89%
DISTRIBUTION 5% 10% 86%
DISTRIBUTION 3% 14% 83%
DISTRIBUTION 5% 13% 82%
DISTRIBUTION 5% 13% 82%
DISTRIBUTION 6% 13% 81%
DISTRIBUTION 10% 13% 77%
DISTRIBUTION 8% 17% 75%
DISTRIBUTION 5% 11% 84%
1 Corvil Analytics +100
2 SolarWinds Network Performance Monitor +93
3 IBM Tivoli Monitoring +82
4 Nagios XI +81
5 ManageEngine OpManager +80
6 ConnectWise Automate +77
7 Microsoft Systems Center Operations Ma… +77
8 Network Operations Management +75
9 Cisco Prime Infrastructure +67
10 CA Network Monitoring Solutions +67
CATEGORY AVERAGE +78
Product ImpactSecurity Frustrates vs. Security Protects
DISTRIBUTION -- -- 100%
DISTRIBUTION 2% 9% 89%
DISTRIBUTION 4% 8% 88%
DISTRIBUTION -- 17% 83%
DISTRIBUTION 3% 10% 86%
DISTRIBUTION 3% 13% 84%
DISTRIBUTION 3% 16% 81%
DISTRIBUTION 6% 13% 81%
DISTRIBUTION 6% 14% 80%
DISTRIBUTION 4% 21% 75%
DISTRIBUTION 3% 13% 84%
1 Corvil Analytics +100
2 IBM Tivoli Monitoring +87
3 Microsoft Systems Center Operations Ma… +84
4 ManageEngine OpManager +83
5 SolarWinds Network Performance Monitor +83
6 Cisco Prime Infrastructure +81
7 Nagios XI +78
8 Network Operations Management +75
9 CA Network Monitoring Solutions +74
10 ConnectWise Automate +71
CATEGORY AVERAGE +80
36