cathkin high school national 4 biology unit 1: cell ... · pdf filenational 4 biology unit 1:...
TRANSCRIPT

Cathkin High School
National 4 Biology
Unit 1: Cell Biology
Homework Booklet

S3 Biology
Cell Division Homework Exercise 1
1. State the two uses for the new cells produced from cell division. (2)
2. What effect does cell division have on the number of cells in the body? (1)
3. Name the structure within a cell which controls cell division. (1)
4. Below is a diagram of a human cell. Name the structure labelled X. (1)
5. Complete the following sentences by deleting the incorrect word from each pair to create
a correct sentence.
The number of chromosomes in the new cells produced by cell division will be
the same as/half that of the parent cell.
During cell division each parent cell produces two/four new cells.
The cells produced by cell division will be different/identical to each other. (3)
6. Cell division can be described as a controlled cycle. What might occur if cell division is
uncontrolled? (1)
7. An onion cell contains 16 chromosomes. It divides to form two new cells, which then divide
again. How many chromosomes will these new cells have? (1)
10
X

S3 Biology
DNA, Genes and Chromosomes Homework Exercise 1
1. Complete the passage below using the words provided:
chromosomes genes DNA nucleus
(4)
2. Below is a diagram of a cell and the structures found within it.
Label structures 1-4. (4)
3. What are genes composed of? (1)
4. What is the function of a gene? (1)
5. Complete the following sentence:
DNA is passed on from ________________ to _________________. (1)
6. Every individuals DNA can be described as ‘unique’. Explain what this means. (1)
12
_____________ are found in the _____________ of a cell. They are
threadlike structures made up of a chemical called _____________. Each
chromosome is made up of sections of DNA called _____________. Genes
control different characteristics in living things.
1
2 3 4

S3 Biology
Therapeutic uses of cells Homework Exercise 1
1. Name the region of the cell where chromosomes are found. (1)
2. Name the molecules which chromosomes are made of. (1)
3. What kind of information is located on chromosomes? (1)
4. The information found on chromosomes will determine the ________________
of an organism. (1)
5. Describe what a ‘gene’ is and describe its function. (2)
6. Below is a diagram of a typical bacterial cell. Copy the diagram and label a plasmid. (1)
7. A bacteria can be reprogrammed by having its genetic information altered through
a process called ________________________________. (1)
8. Name 2 substances which can be produced by bacteria which have been genetically
altered. (2)
9. Choose one of the substances from your answer to Question 8 and describe its
importance. (1)
11

S3 Biology
Properties of Enzymes & Uses in Industry Homework Exercise 1
1. What is the function of an enzyme? (1)
2. Describe two features of enzymes. (1)
3. All living cells require enzymes. What would happen to chemical reactions in a cell
if enzymes were not present? (1)
4. What is a substrate? (1)
5. Enzymes can be described as being specific. Explain the meaning of the
term ‘specific’. (1)
6. Enzymes can be involved in both build-up and break down reactions. Give an example
of an enzyme involved in each type of reaction. (2)
7. Enzymes are used frequently in biotechnological industries. Name two examples of
these uses and describe their purpose. (2)
8. State the factors that can affect the activity of an enzyme, (1)
9. What term is used to describe an enzyme which no longer works because its shape
has been changed as a result of one of the factors mentioned above factor? (1)
10. Draw a graph to show the activity of an enzyme as you increase the temperature
from 0 – 60oC. (2)
11. Draw a graph to show the activity of the enzyme pepsin as the ph increases from
1-4. (2)
15

S3 Biology
Properties of Micro-organisms & Uses in Industry Homework Exercise 1
Q1. Identify the micro-organism used in the manufacture of each of the following products
by copying the information below and drawing lines to correctly match the micro-organisms
to the product they are used to make.
Q2. An investigation into the effect of two different types of yeast on the raising of bread
dough was carried out.
The dough was made by weighing out flour, salt, sugar and yeast and mixing with a measured
volume of water.
The results from five students groups are shown.
Group Increase in height of dough
containing yeast A (mm) Increase in height of dough
containing yeast B (mm)
1 36 24
2 14 35
3 30 45
4 26 31
5 19 40
Average 35
(a) Calculate the average increase in the height of the dough containing yeast A.
(b) Which variable was changed in this investigation?
(c) Why was the average of 5 sets of results taken?
(d) A control for this investigation was set up. Describe this control.
(e) What gas, produced by the yeast, causes the dough to rise?
(f) Why is sugar added to the bread dough?
(g) The average increase in the height of the dough containing yeast B was 35mm.
Calculate the average % increase in the height of the dough containing yeast B
compared to that containing yeast A.
Micro-organism Product
Bacteria Wine
Bread
Yeast Yoghurt
Cheese
10
(3)
(1)
(1)
(1)
(1) (1)
(1)
(1)
(1)

S3 Biology
Properties of Micro-organisms & Uses in Industry Homework Exercise 2
Q1. The grid below refers to micro-organisms and the production of food and drink.
Use the grid to answer the following questions.
Each box may be used once, twice or not at all.
(a) Which two terms are used to describe yeast?
(b) Which two products are formed when yeast breaks down glucose?
(c) Which substance, produced by yeast, is responsible for the raising of dough?
(d) Which type of micro-organism is used in the production of yoghurt?
Q2. A student carried out an investigation to compare the activity of four types of yeast.
The height of the dough was measured after 1 hour. The results are shown in the table
below.
(a) On graph paper, present these results as a bar graph.
(b) Express as a simple whole number ratio the height of dough after 1 hour using
Bakers dried yeast compared to Wine makers yeast.
(c) Which type of yeast caused the greatest increase in the height of dough?
(d) Calculate the percentage increase in height for dough which contained Brewers yeast.
A. bacterium B. single-celled C. carbon dioxide D. alcohol
E. oxygen F. sugar G. fungus H. multi-celled
Type of yeast
Height of
dough at start
(cm)
Height of
dough after 1
hour (cm)
Bakers dried 1.0 2.8
Bakers fresh 1.0 5.2
Brewers 1.0 4.2
Wine makers 1.0 5.6
9
(1)
(1)
(1)
(1)
dough
(2)
(1)
(1)
(1)

S3 Biology
Properties of Micro-organisms & Uses in Industry Homework Exercise 3
Q1. State two products yeast can be used to make.
Q2. The list below names foods and drinks produced using microbes. Copy and complete the
table by writing the letters from the list into the correct column to match the drinks and
foods to the microbes used in their production.
List
Raised bread dough
Cheese
Yoghurt
Beer
Wine
Q3. Yeast is grown in a fermenter.
The yeast doubles its mass every four hours.
If the fermenter started with 100g of yeast, what mass of yeast will be present after 24
hours?
Q4. The vessel below is used in the manufacture of antibiotics.
The vessel produces 5g of antibiotic per litre ever day.
How many grams of antibiotic is produced in one week in this vessel?
Produced using yeast
Produced using bacteria
10
(2)
(2)
(1)
Volume:
70,000 litres
(1)

Q5. The apparatus below was used to compare fermentation of different sugars by yeast.
In the experiment, a gas was given off which changed the colour of an indicator from pink to
colourless. The results are shown in the table below.
(a) On graph paper, construct a bar graph to present these results.
(b) Which sugar was fermented quickest by yeast?
(c) Name the gas produced by the yeast.
Sugar Time taken for indicator to
become colourless (minutes) Glucose 8
Sucrose 12
Fructose 18
Maltose 42
Glucose Sucrose Fructose Maltose
Sugar and yeast solution with indicator
(2)
(1)
(1)

S3 Biology
Photosynthesis – Limiting Factors Homework Exercise 1
1. a. What name is given to the green material found in plant leaves?
b. What is the function of this material?
2. The diagram below represents a summary of photosynthesis in a green leaf.
Complete the diagram by matching the most suitable word(s) to the numbered boxes.
3. A green leaf with white edges was tested for the presence of starch.
a. Which area of the leaf would turn blue-black when tested for starch?
b. What does this experiment prove?
17
sun
From the air Stored as…
From the soil
5.
4.
3. 2.
1.
6.
Word list: glucose
carbon dioxide
oxygen
starch
light energy
water
(1)
(1)
(3)
(1)
(1)
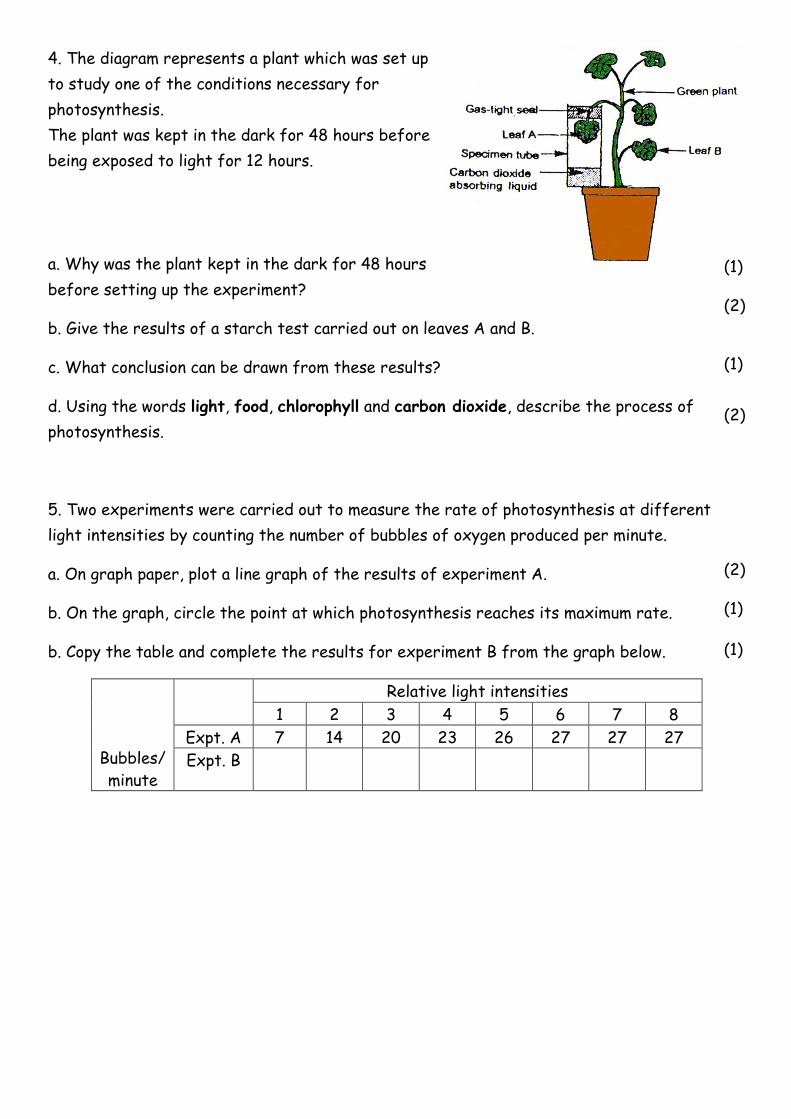
4. The diagram represents a plant which was set up
to study one of the conditions necessary for
photosynthesis.
The plant was kept in the dark for 48 hours before
being exposed to light for 12 hours.
a. Why was the plant kept in the dark for 48 hours
before setting up the experiment?
b. Give the results of a starch test carried out on leaves A and B.
c. What conclusion can be drawn from these results?
d. Using the words light, food, chlorophyll and carbon dioxide, describe the process of
photosynthesis.
5. Two experiments were carried out to measure the rate of photosynthesis at different
light intensities by counting the number of bubbles of oxygen produced per minute.
a. On graph paper, plot a line graph of the results of experiment A.
b. On the graph, circle the point at which photosynthesis reaches its maximum rate.
b. Copy the table and complete the results for experiment B from the graph below.
Bubbles/
minute
Relative light intensities
1 2 3 4 5 6 7 8
Expt. A 7 14 20 23 26 27 27 27
Expt. B
(1)
(2)
(1)
(2)
(2)
(1)
(1)

Rate of photosynthesis at different
light intensities
0
5
10
15
20
25
30
35
1 2 3 4 5 6 7 8
Relative light intensity
Nu
mb
er
of
bu
bb
les o
f g
as
/ m
inu
te
Relative light intensity
Number of
bubbles of
oxygen/
minute

S3 Biology
Respiration Homework Exercise 1
1. The investigation below was used to compare respiration rates of immobilised and
non-immobilised yeast cells.
A blue dye was added which changes colour as the yeast cells respire. The colour changes
of the dye are shown below.
blue lilac mauve pink colourless
The colour in each beaker was noted every three minutes and the results are shown below.
(a) (i) In which beaker did the yeast cells respire faster. Give a reason for your answer. (1)
(ii) Suggest a time when the dye in beaker B might have been pink. (1)
Time (minutes)
Beaker A Beaker B
0 blue blue
3 blue lilac
6 lilac mauve
9 lilac mauve
12 mauve colourless
15 mauve colourless
18 pink colourless
21 colourless colourless
11
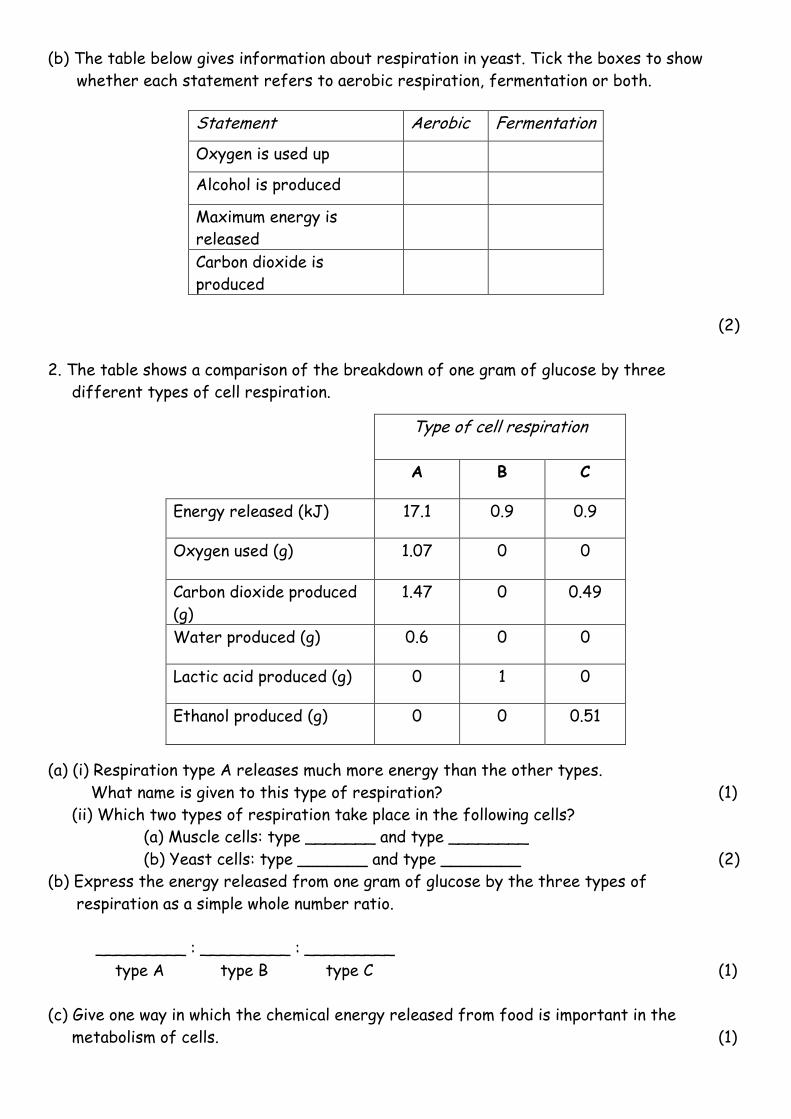
(b) The table below gives information about respiration in yeast. Tick the boxes to show
whether each statement refers to aerobic respiration, fermentation or both.
(2)
2. The table shows a comparison of the breakdown of one gram of glucose by three
different types of cell respiration.
(a) (i) Respiration type A releases much more energy than the other types.
What name is given to this type of respiration? (1)
(ii) Which two types of respiration take place in the following cells?
(a) Muscle cells: type _______ and type ________
(b) Yeast cells: type _______ and type ________ (2)
(b) Express the energy released from one gram of glucose by the three types of
respiration as a simple whole number ratio.
_________ : _________ : _________
type A type B type C (1)
(c) Give one way in which the chemical energy released from food is important in the
metabolism of cells. (1)
Statement Aerobic Fermentation
Oxygen is used up
Alcohol is produced
Maximum energy is
released
Carbon dioxide is
produced
Type of cell respiration
A B C
Energy released (kJ) 17.1 0.9 0.9
Oxygen used (g) 1.07 0 0
Carbon dioxide produced
(g)
1.47 0 0.49
Water produced (g) 0.6 0 0
Lactic acid produced (g) 0 1 0
Ethanol produced (g) 0 0 0.51

3. Name the chemical substances which control respiration. (1)
4. What is the meaning of the term “respiration”. (1)

S3 Biology
Respiration Homework Exercise 2
1. The grid below contains features of aerobic respiration and anaerobic respiration
(fermentation) in yeast.
Use the letters from the grid to answer the following questions. Each letter may
be used once, more than once or not at all.
(a) (i) Which feature is only true of aerobic respiration? (1)
(ii) Which two features are true of both aerobic and fermentation.
(b) The diagram below shows an experiment to demonstrate respiration in yeast.
(i) Name the gas collected. (1)
(ii) Which of the following diagrams represents a control to show that the gas is
produced by the yeast and not by something else? (1)
carbon dioxide produced
oxygen used
alcohol produced
heat produced
11
A B
C D

2. The diagram represents aerobic respiration in a cell.
(a) Name the substances W, X and Y. (2)
(b) What is the source of the substance which is used in respiration and which leads
to the formation of carbon dioxide? (1)
(c) The energy released during respiration can be used for chemical reactions.
Give two other ways in which a cell may use this energy. (1)
(d) Carbon dioxide is a waste product of respiration. What is the other waste product? (1)
3. Write the word equation for fermentation in plants and yeast. (1)
4. Write the word equation for fermentation in humans. (1)