catholic parliamentary liaison office (cplo) … · community protest seminar in september 2016 ......
TRANSCRIPT

www.salga.org.za
CATHOLIC PARLIAMENTARY LIAISON
OFFICE(CPLO)
COMMUNITY PROTEST ROUNDTABLE:
27 June 2017

www.salga.org.za
SALGA MANDATES

www.salga.org.za
Prior Research and Engagements and Key Findings
• 2010 Study: Negligible relationship between service delivery levels and protest activity. Indicative of a social and institutional complex of issues and a possible translocation of protest action.
• 2015 Study: (Inception workshop 15 June 2015, Study Concluded Sept 2015):– Citizens as consumers of services with elite-led service delivery – low
community ownership of services. – Definition of “The Planning Problem” Municipal plans often based on
inadequate demographic data incl movements, therefore know little about the people to whom they deliver services.
– Provincial mandates not executed in consultation with local government.– Public participation norms and structures – Poor intergovernmental coordination – Elements of irrationality to protests – Politicking, – Protesting on settled issues – Generalised community disenchantment. – Cities are not necessarily the spaces in which discontent originates, they
are rather the staging ground for discontent originating elsewhere.

www.salga.org.za
Roundtable in March 2016 co-hosted with the HSRC• Councillor accountability• Communication between councils and communities• The role of youth in protest and citizen education on state service origin• Criminalisation of protest through irregular applications of the Regulations of
Gatherings Act.
Community Protest Seminar in September 2016• Administrative hurdles in application of RGA increases community frustration
and leads to violence (COGTA engagement prescriptions, levying of administration fees on RGA applications, permission VS notification, non-responsiveness of individuals, demanding communities).
• Accurate accounting of protests lacking (reliance on media reports)• State institutions and provincial sphere are unresponsive to grassroots so local
government carries most of the problems alone.
Prior Research and Engagements and Key Findings (2)

Constitutional & Legal Framework
51996Constitution
1997
1998
2000
2003
2004
2008
Organised LG Act
Demarcation and Structures Acts
Municipal Systems Act
MFMA
Municipal Property Rates Act
Fiscal Powers and Functions Act
SPLUMA 2015
Overview of major local government legislation
• Guided by Constitution and White Paper
• Complete redraft of local government legislation
• Comprehensive framework rapidly prepared
MSCOA
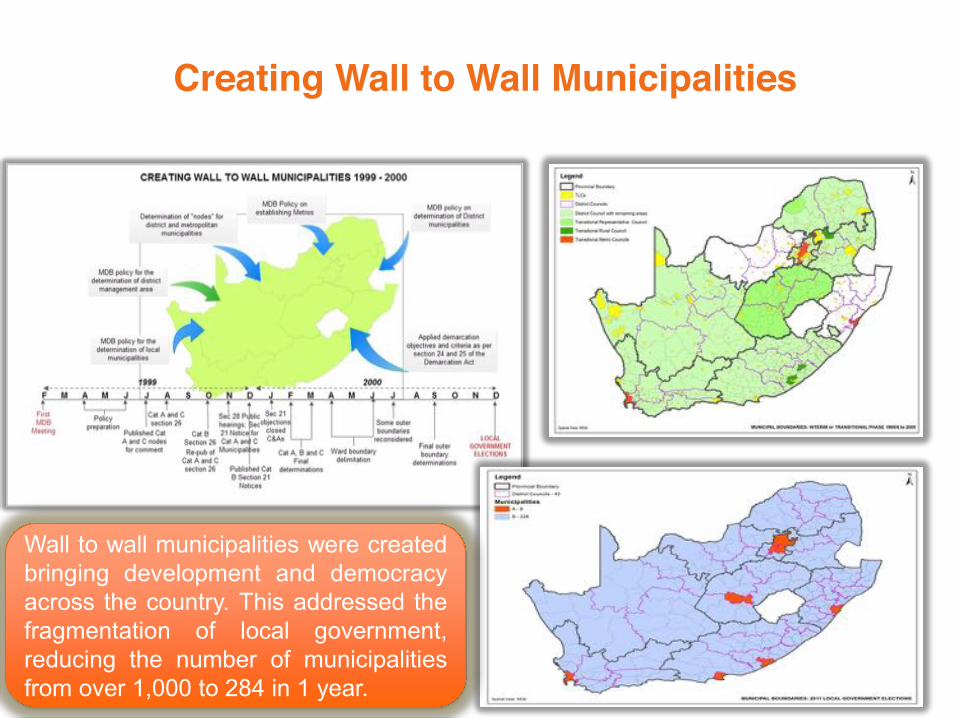
Creating Wall to Wall Municipalities
Wall to wall municipalities were createdbringing development and democracyacross the country. This addressed thefragmentation of local government,reducing the number of municipalitiesfrom over 1,000 to 284 in 1 year.

www.salga.org.za
Spatial Distribution of Welfare levels
The welfare of most communities at the beginning of the democratic and developmental LG is concentrated in provinces that inherited former homeland areas

www.salga.org.za
Spatial Distribution of Poverty Using Quality of Home Dwelling
Poverty using housing as a proxy indicator is high in places that inherited homelands as well as those that are recipients of large migration. Informal settlements and poor access to services that complement housing often characterise such localities

www.salga.org.za
Spatial Distribution of Poverty, Using Income Levels
Large parts of Northern Cape, Western Cape & Gauteng on average, have higher income levels than most parts of the country. This has enabled better capacitated municipalities with better capability to deliver on the required mandated

www.salga.org.za
Spatial Distribution of Dependency Levels
Dependency levels since the beginning of democratic and developmental LG have been high in provinces and municipalities that inherited former homeland areas

www.salga.org.za
Local government delivering equitable and sustainable services
• Local Government has made a huge contribution to ensuring delivery of basic services to the poorest of the poor & to improved dignity & quality of life.
• Eastern Cape increased water from 54% access in 1996 to 56% in 2002 and now stands at 79% access• Eastern Cape increased electricity from 32% access in 1996 to 50% in 2001 and now stands at 83% • Limpopo increased electricity from 38% access in 1996 to 63% in 2001 and now stands at 92%• Concerns however remain in certain services in certain geographic areas• Increases in access to services happened against declining revenue. Eg From 2005 to 2014,
people paying for water declined from 61.9% to 43,7%• Dramatic increase in access in former homelands

www.salga.org.za
Spatial Distribution of Protests
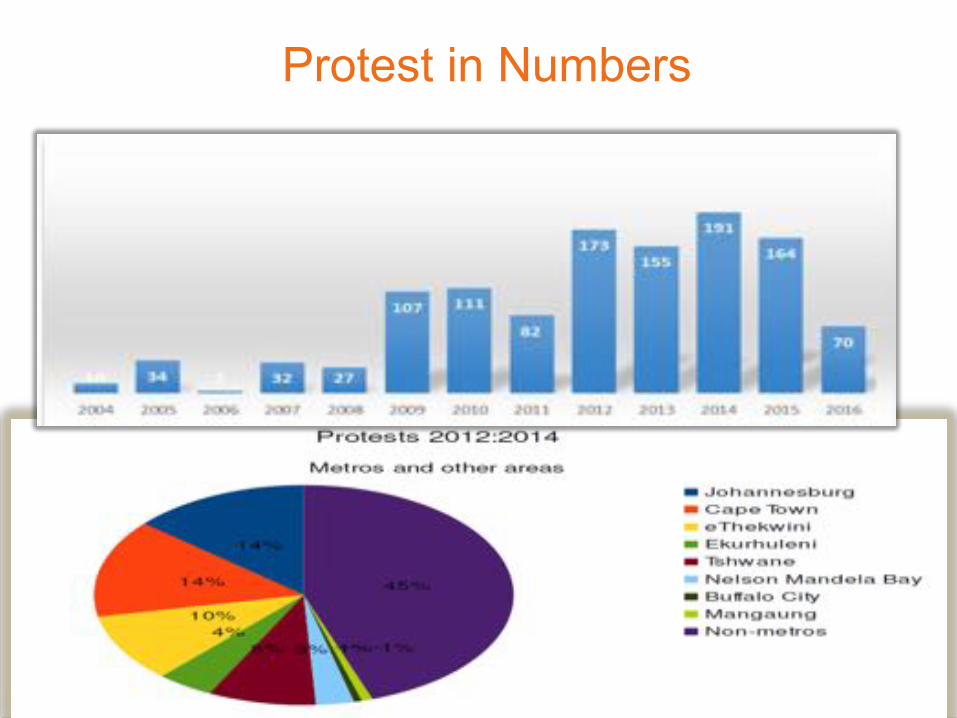
Protest in Numbers

Protest in Numbers
4,493 out of 36,786 (12%) public gatherings cited dissatisfaction with service delivery:
Is popular reference to service delivery protest appropriate?
“……Community Protest……”

Protest in Numbers Is violence perhaps the bigger problem?
What causes the violence?
What is the correlation with:- Violent crime- Domestic
violence - Xenophobia
Are we a violent society…? Why…?

www.salga.org.za
Strategy of Protesters
• Prolonged and fruitless engagement with state officials and Disruption
• The smoke that calls• Burn to be heard• Voting helps but violence works• Spontaneously protest at the drop of a
penny

How Municipalities Describe Community Protest

How local government describes protestors
Most protestors are seen to be youngand unemployed. A percentage ofmunicipalities see some protestors ascriminals who are vandalising propertyand looting during protests.

19
Municipal perceptions: dealing with Community Protest

20
Reducing Community Protest

21
Actions from Other Spheres of Government

22
Required resources to address protest

23
INTERVIEW FINDINGS

24
Protest
• “At the drop of a penny these guys will mobilise and have their action. It is spontaneous and does not follow legal channels.” – Municipal Manager’s Office
• “Communities do not follow any procedure they just meet wherever they meet and from there they will react.” – Executive Mayor
• “The protests are spontaneous. In [informal settlement name omitted], protest started at 3 in the morning. There is a certain amount of violence that goes with it… it is related to housing issues.” – City Manger’s office.

25
Describing Protest
• “[There have been] 40 protests this year alone in our area [name of area omitted]. The protests had nothing to do with local government. They are linked to provincial housing & Eskom prepaid meters.” – Regional Manager
• “They [the province] comes up with housing [projects] but overlook local government in planning but after the implementation the problems come to local government. The planning cycles of government differ.” – IDP Manager
• “It is seldom that they [communities] complain about service delivery.” - Mayor
• “The biggest problem is the lack of information and knowledge of the Community. They don’t know who is responsible for what service delivery, like housing, clinics, ambulance and transport of school children etc. The Municipality is not responsible for these services but the responsibility of National and Provincial Government. The buck is just then passed to the Municipality.” - Mayor

26
Drivers of Protest• There are always underlying
issues to service delivery protests – “there is a new shopping centre coming up on provincial land and that land was earmarked for housing. People began to protest when they saw that.”
• “When they were evicted and served with notice, the water was cut and then the protest erupted. Council intervened and supplied water.”
• “Protests mostly happen when we conduct operations when we cut illegal connections in ward.”
• “Ward committee members politick and undermine the sitting councillor so they can get on the council and get a salary”
• “The reasons for protestingapparently some of them arepolitically inspired and then it is madeout to be service deliveryprogrammes.”
• “Protests turn violent because policehave a forceful hand.”
• “The police was perceived as anapartheid police force. Now relativesof inhabitants are in the police. It is adifficult thing for the police as wellbecause they live among theboycotters and stone throwers. Stonethrowing is an expression ofdiscontent to show you are notwelcome here. Reactions by rubberbullets is provocative. Policing issometimes left to people who are notqualified [to deal with crowds].”

27
Drivers of Protest• “We have a problem regarding a
shortage of water. The district isthe water services authority. Theward councillor does not bring thatinformation to the district [onbroken borehole pumps]. Thepeople do not get the feedback onthe progress. People then saythey will take steps. The district isnot aware that the community hada problem. Councillors do not passthe information on to the districtmunicipality.” – Director in theOffice of the Executive Mayor
• “If the roads department could consult the people, it will be an informed process. Currently they just do things on their own.” –Director in the Office of the Executive Mayor
• “The reasons for protesting apparently some of them are politically inspired and then it is made out to be service delivery programmes. The dangerous thing at this stage is that they are using school kids… and school kids are put in front as cannonfeed [sic].” –Exec Mayor
• “The Youth are engaged in protest, particularly unemployed youth. There is a great idling due to joblessness and the youth who want to study but cannot due to darkness [power failures].”- Regional Director
• “[Due to unemployment] … when there is a protest, it is sustained for one week or two weeks. People wake up in the morning and see how they can take their protest forward.”

28
The Impact of Protest on Municipalities
• “When people damage council property we take money that would be spent on other service delivery items so it has an impact… we had a programme in [settlement name omitted] – certain individuals did not get their desired outcome so they damaged council property.” – Western Cape

29
Impact of Protests on Municipalities
• “We have had to put on hold our capex projects because communities want houses rather than parks and it is influencing the timing of capex projects. This has implications on how we spend our budgets.” – General Manager
• “Township demarcations are changing in the run up to the elections - why the changes and what are the demographic impacts on administration [or the] functioning of municipalities”. –Planning manager.
• “The new houses that are being built need to be connected to the grid but what is the point if houses are being provided to people who are not able to pay. ESKOM still demands payment from the council.” – City Region Director

30
Remedial Actions Taken by Municipalities
• We have warning systems and once a report comes in, we alert our park rangers who alert the police.
• Communication would diffuse tension. Often communities are advised of a new project at the tail end… [we should] commence engagement prior to activity which is what we have done in communities where we are establishing parks.
• Jozi@work: 35 million rand is budgeted to ensure job creation element is prioritised in greening activities. Greening is labour intensive and requires low levels of training. This is a quick win for the City and helps mitigate some of the conditions that give rise to protest.
• “War rooms established by the premier enable us to share information to avoid coordination and communication failures. These are only starting now so judgment may be too soon as to whether they work or not.” –City Region Director

31
Summary of findings
• Much protest is apparently related to the disconnection of illegally accessed services.
• A significant portion of community protest has nothing to do with service delivery but has origins in provincial functions like housing.
• Competition for land is generating social discontent particularly in land scarce urban areas.
• The youth are being involved in protest in many provinces which destabilises their education, which feeds protest action and increases violence.

32
Summary of Findings• Destruction of public property is costing municipalities
thousands of Rands per each incident in direct and indirect costs.
• Communication and public participation are the two drivers of protest identified by municipal managers, elected representatives and planners in all districts.
• Coordination between spheres of government is identified as a source of protest action due to the delays and communication breakdowns in service delivery.
• Initiatives to proactively address protest are being launched in many districts and metros to supplement existing structurally-based communications.

33
Summary of Findings• Drivers of protest differ from area to area within the same
municipal region.• Relational resources and local power relationships determine
how successful a municipality will be in dealing with community protest.
• The positions of powerlessness local councillors may often find themselves in have implications for democratic accountability and community-council relationships.
• Due to high rates of community protest, South Africa is well positioned to develop good practice models in dealing with and addressing community protest despite the complex and often murky justifications for protest action.

34
Municipal Remedies
• Early response systems• Proactively identify issues that give rise to community protest
action and use CDWs and Councillors to communicate with communities what is being done.
• Engage with communities before projects are planned.• Improve public consultation and communication processes.• Actively plan for migration in the IDP • Pursue densification strategies.
35
Municipal Remedies
• Synchronisation of government planning cycles using a bottom up approach.
• Promote the IDP as the central planning document of all spheres of government.

36
Recommendations
• A policy framework needs to be developed for protest action that provides a method encouraging of proactive redress from all spheres of government.
• Local government participation structures must be the primary structures through which these redress activities occur. This would build capacity in public participation structures at the local level, contribute to improvements in coordination between spheres of government and make other spheres of government accessible to grassroots.
• Additional resources should be channelled into local government to enable it to perform its service delivery mandates in accordance with the subsidiarity principle.