cats count in canada: a crisis of cat overpopulation cat overpopulation?” pertaining to animal...
TRANSCRIPT

Cats Count in Canada: A crisis of Cat overpopulation

Cats In Canada: a comprehensive report from the Canadian Federation of Humane Societies on the cat overpopulation crisis in Canada.

“We can define cat overpopulation as the existence of cats that are at risk of euthanasia
because they are both unwanted and not owned. This definition includes the most
obvious manifestation of overpopulation: the dynamic population of cats in animal shelters. It is here that, for lack of an adoptive owner and adequate shelter resources, healthy, adoptable pets are euthanized, but overpopulation can be
tangibly observed in other venues as well.”
Philip Kass, 2005

1. Convening an expert national taskforce 2. Data and thinking from more than 475
shelters, rescues, TNR, spay/neuter organizations, municipalities and veterinarians
3. A market survey to better understand current pet ownership, population and the capacity of Canadians to home cats
4. Literature review and case studies
Cats in Canada is a ground breaking, multi-stakeholder research project on cats in Canadian communities from the CFHS including:

Cats Defined

MARKET SURVEY RESULTS

MARKET SURVEY
Variable Description Nanos 2012 Ipsos 2008
A Number of Households Canada (Statscan)
14,569,633 13,576,855
B % of households with a cat 37.7% 35.5%
C Number of households with cats [A x B]
5,492,752 4,819,784
D Average number of cats per household
1.85 1.76
E Number of owned cats with households [C x D]
10,161,591 8,482,819
Conducted by Nanos Research to determine the prevalence of cat ownership and the number of cats in each cat owning household.

Pet Ownership Profile

“How many of the cats in your household were from the following sources”

Two in three Canadians (65.7%) said they would NOT consider adopting a cat as a pet
While one in three (34.3%) said they would consider it!

Cat owning households report an 80% spay/neuter rate
That indicates more than 2 million unaltered owned cats!

MULTI-STAKEHOLDER SURVEY

HSa SPCA TNR Mun.b Vet.c Rescue S/Nd Other Total
NL 0 6 1 14 5 0 1 0 27
PEI 1 1 0 0 9 0 1 1 13
NS 2 8 2 1 26 3 1 1 44
NB 0 7 3 1 11 1 0 1 24
QC 4 3 2 3 60 5 1 2 80
ON 13 1 1 13 32 9 4 2 75
MB 3 1 2 17 11 3 1 1 39
SK 3 4 0 0 32 2 0 0 41
AB 6 2 0 5 46 4 0 0 63
BC 0 37 4 4 12 11 0 0 68
NT, YK, NU
0 0 0 3 1 0 0 0 4
Total 32 70 15 61 245 38 9 8 478
Respondent Profile

Nanos Stakeholder Survey – Homeless Cats – Sheltered
N 164
Total Intake of Cats 150,350
Adopted Out 65,249 (43%)
Reclaimed by Owner 7,140 (less than ½%)
Euthanized 59,939 (39%)
Net new number of cats without a home 18,022
Overpopulation in Numbers

Overpopulation in Numbers Variable Description Total A Number of respondents with cat intake data 164 B Number of cats euthanized 59,939 C Number of cats waiting for adoption 18,022 D Total number of homeless-sheltered cats (B+C) 77,961 E Average annual number of homeless-sheltered cats
per responding shelter (D/A) 475
F Estimate number of municipal animal services 1135 G Estimate number of Humane Societies and SPCAs 210 H Total estimated number of shelters (G+H) 1345 G Projected number of homeless-sheltered cats (ExH) 638,875

In your opinion, is there a cat overpopulation problem in your municipality?
78% said YES!
51% of Shelters, Rescues and TNR believe the problem is severe;
Whereas only 20% of Vets agree

Available Solutions
Figure 6: “What practices, if any, does your community have in place that address cat overpopulation?”

Effectiveness of Solutions
Figure 9: “Would you say that the following methods used by your community have been successful, somewhat successful, neither successful nor unsuccessful, somewhat unsuccessful, or unsuccessful at addressing cat overpopulation?” pertaining to animal control collapsed into four categories.

Figure 9: “Would you say that the following methods used by your community have been successful, somewhat successful, neither successful nor unsuccessful, somewhat unsuccessful, or unsuccessful at addressing cat overpopulation?” pertaining to animal control collapsed into four categories.
ACO Effectiveness of Solutions

Sheltering Cats

Stakeholder Average Holding Capacity
% of Capacity 2011
% of Capacity 2012
Humane Society 187 animals 90% 91% SPCA 124 animals 95% 92% TNR 42 animals 93% 80% Municipalities 103 animals 72% 66% Rescues 68 animals 91% 85% Spay/Neuter Groups 30 animals 100% 100% Other 166 95% 97% Aggregate Average 114 animals 89% 86%
A Matter of Capacity…..!
Shelters across the country are at or near capacity to care for the cats that are brought to their doors. In no other statistic is the crisis of
overpopulation revealed more – as a country, Canada has all but run out of space for new cats produced without adequate concern for
housing, sterilization or health of animals roaming at-large.

Intake Animal N Average Total
Cats 164 917 150,350
Dogs 131 537 70,302
Of those who responded, humane societies and SPCAs received the highest number of cats; a total of 63,532 cats were received by humane societies and 60,214 were received by SPCAs, while municipalities received 17,830 and rescue groups received 5,461. Almost half of all responding veterinarians take in cats or dogs in need (49%). Of the veterinarians who take in animals, on average, they took in 18 cats and 2 dogs in 2011. The majority of animals accepted by veterinarians are mature cats.

Surrendered by owner
Surrendered strays/ by non-owner
Cats Dogs Cats Dogs N 145 113 150 121 Mean 226 148 585 302 Total 32,755 16,731 87,770 36,548
Whose Being Surrendered ……….
Cats are twice as likely to be surrendered as dogs!
Cats and dogs surrendered to shelters are twice as likely to be stray than owner surrendered!
Of the surrendered, 41.5% of cats are kittens and 20% of dogs are puppies.
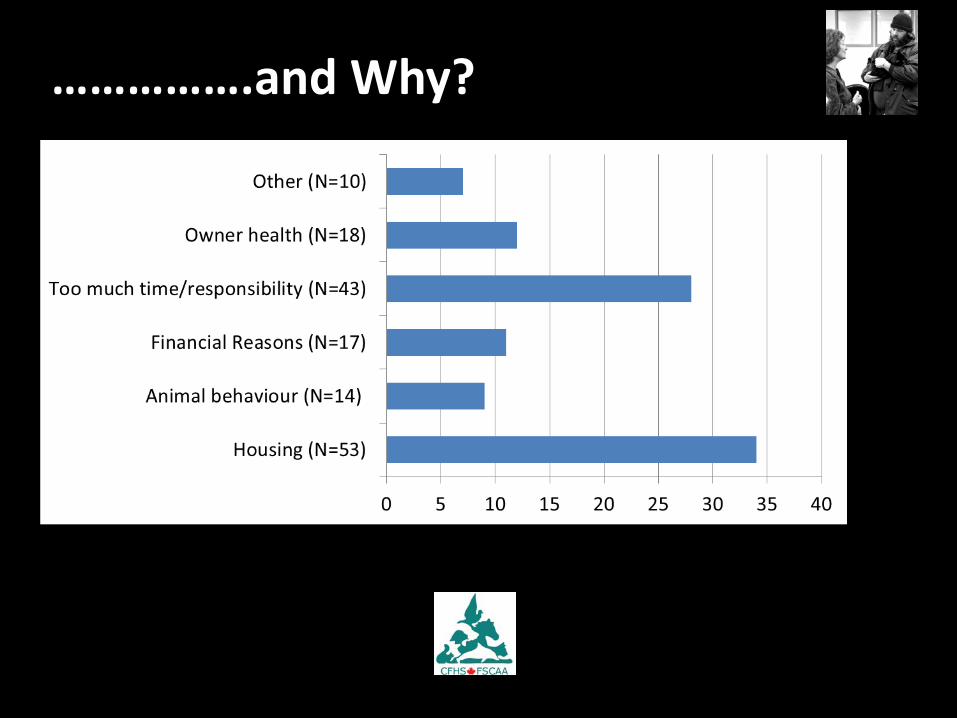
…………….and Why?

Status on Surrender - Identification Cats are more likely to arrive at an organization without any form of identification (ID) than dogs (Table 15) - 63% cats and 46% of dogs do not have ID. Cats are significantly less likely to have ID and they are less likely to be returned to their owner. In contrast, since dogs are more likely to arrive at an organization with some form of ID, there is a greater chance that they will be re-united with their family.
Status on Surrender - Sterilization Most cats and dogs arrive at shelters and rescues unaltered. However, less than half of the respondents that receive animals record the animal’s sterilization status at intake. Therefore, it is important to examine these results with caution as they may not be representative.

Live Release Animal Total
Received in 2011
Average intake
Reclaimed % Reclaimed Average reclaimed
Cat 150,350 917 7,139 <1 % 5
Dog 70,302 537 20,856 30 % 161
Number of Adoptions Number of Adoptions, % youth
Cats Dogs Kittens Puppies Mean 403 220 46% 28% Sum N
65,249 162
27,058 123
152
111

Spay/Neuter on Live Release

Table 4: “Does your organization have cats spayed or neutered?” by organization

Accessible Spay/Neuter

Accessible Spay/Neuter

Euthanasia: the starkest outcome of the cat population crisis

Response to question “Does your organization euthanize cats?” by organization
Stakeholders across the spectrum are working hard to reduce the need for euthanasia which requires a reduction in population and an increase in viable homes.

Received Number euthanized
Number euthanized, % received
Number euthanized, % juvenile
Cats Dogs Cats Dogs Cats Dogs Kittens Puppies Mean 917 537 512 97 40% 14% 20% 4% Sum N
150,350 164
70,302 131
59,939 117
10,082 104
Euthanasia

Reason for Euthanasia CATS Kittens DOGS Puppies
Illness/ change in status 87.7% 81.7% 78.9% 75.0%
Animal behaviour 67.2% 47.0% 90.8% 18.8%
Lack of space 28.7% 24.3% 9.2% 5.2%
Affordability of medical treatment 22.1% 16.5% 15.6% 12.5%
Euthanasia

With only 20% of respondents providing data the following results must be treated with caution and most likely provide a narrow window into the potential data on this population. However, since the data has
been collected CFHS agrees that it should be included in the report and used to highlight the importance of capturing more representative
data in the future.
Feral and Homeless-at-large

Table 35: “Does your organization care for a feral cat colony?” By organization

Veterinarian Response
Veterinarians, humane societies, SPCA’s rescues and TNR groups have a critical relationship in maintaining the health and welfare of homeless companion animals. To better reflect the availability of resources for homeless cats—and dogs as a comparative measure—the survey asked veterinarians to identify which type of services were offered to which groups.

• Almost half (43%) provide services to cat shelters, 40% dog shelters, 39% to dog rescues, 38% to cat rescues, 23% to TNR groups, and 19% to other groups.
• Vets were more likely to offer spay/neuter surgeries to groups such as rescues than any other services and were most likely to offer the surgeries at a discount.
• Vets, on average, offer a discount of 30 to 41% for treatment.
• The highest discount offered os spay/neuter at 42%. • Vets were more likely to offer cats for adoption than dogs - (92.8%) said they
offered cats for adoption, while nearly as many (89.9%) said they offered kittens. Fewer veterinarians said the same in regards to dogs (46.4% of responses) or puppies (37.7%).
• 63.8% of veterinarians who shared their views said that they did not assign permanent ID before adoption.
• Vet were somewhat more likely to say that their clinic did not euthanize cats and dogs for non-medical reasons (55.6%) than to say that they did (44.4%).
• Animal behaviour most likely reason for euthanizing on non-medical grounds.

Recommendations

Recommendations Stakeholder Recommendations
• Accessible Spay/Neuter • Public Education – responsible pet
ownership • Legislation and adequate enforcement
Report Recommendations • CFHS provides 27 recommendations in each key
research area based on the results and literature

THANK YOU!!! For a copy of the report visit www.cfhs.ca