causal link between foreign direct investment, export … · causal link between foreign direct...
TRANSCRIPT
Causal Link between Foreign Direct Investment, Export and Economic Growth in India 133
* Research Scholar, Indian Institute of Technology, Hyderabad, India, E-mail: [email protected]** Research Scholar, Indian Institute of Technology, Kharagpur, India, E-mail: [email protected]
Asian-African Journal of Economics and Econometrics, Vol. 13, No. 2, 2013: 133-143
CAUSAL LINK BETWEEN FOREIGN DIRECTINVESTMENT, EXPORT AND ECONOMIC GROWTH IN
INDIA: A COMPARISON OF TYDL AND GRANGERCAUSALITY TEST
Debi Prasad Bal* and Seba Mohanty**
ABSTRACT
This paper studies the causal link between FDI, export and economic growth in India. Here wecompare the results of both Granger causality and TYDL no Granger causality test over the periodof 1978-79 to 2011-12. The Granger causality test shows that there is unidirectional causalitybetween economic growths to export; economic growth to FDI and export to FDI; but from TYDLmethod there is only unidirectional causality between economic growths to export in India which issupported by variance decomposition technique. Hence our result supports that TYDL is a bettermethod to show the causal link among these three variables. From the policy perspective ourresult supports that India should focus on high level of economic growth instead of to followeither export-led growth of FDI-led growth.
JEL Classification: G 20; F 10; F 43; C 51
Keywords: FDI; Export; Economic Growth; TYDL; Granger causality
1. INTRODUCTION
Foreign Direct Investment and export of the country has played a crucial role for the sustainablegrowth and development in India. The Foreign Direct Investment (FDI) also has its ownimportance for the countries development. India needs FDI for the shortage of capital, technology,managerial skills and market access. FDI brings in capital and advanced technology that canenhance the technological capabilities of the host country firms. With this objective our studyfocuses the casual relationship among FDI, Export and Economic growth in the case of India.Hence, this study investigates whether the level of FDI, Export and economic growth of Indiaare linked and if so then in which direction they are linked.
The relationship between export, FDI and growth is well known. The contribution of FDIand Export towards economic growth increases rapidly after 1991.The percentage of FDI interms of GDP was 0.03% in 1991 and it increases to 2.11% in 2006 and also further to 3.55% in2008. After global recession the percentage of FDI in terms of GDP has been decreased to 1.52%in 2010 and in 2011 it is increased to 1.72%. Similarly in case of exports as a percentage of GDP
134 Debi Prasad Bal and Seba Mohanty
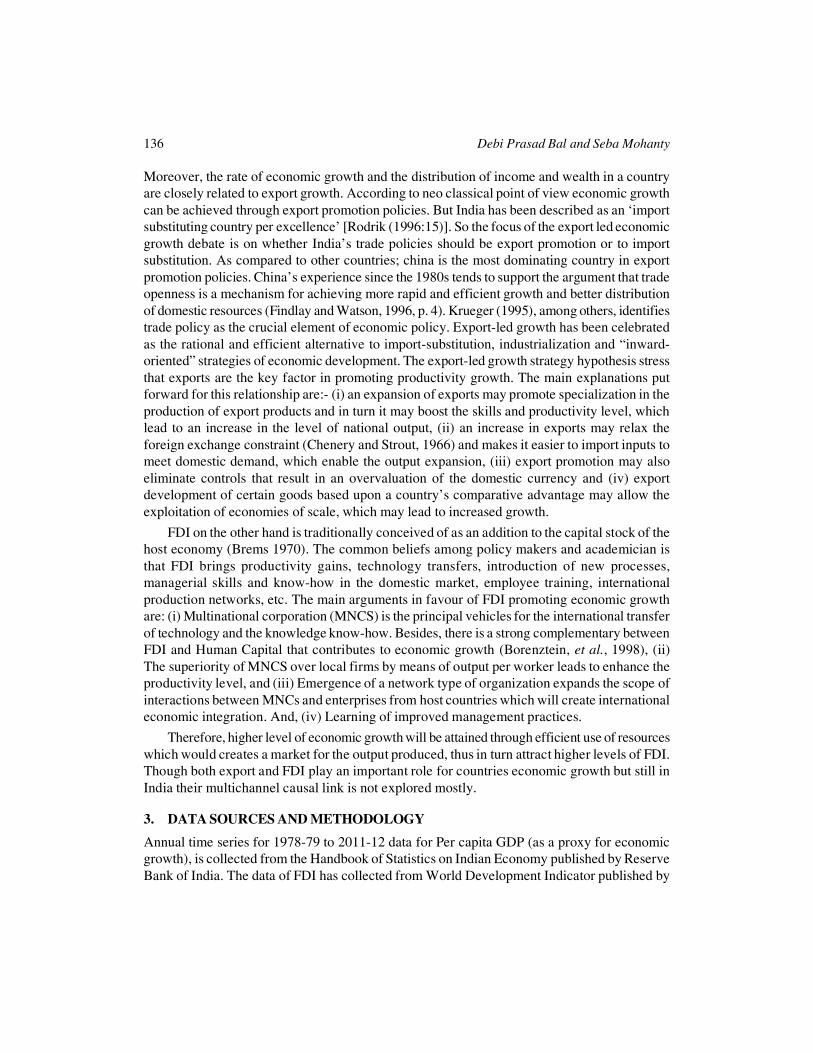
increases tremendously from 1995 i.e. from 10.66% to 23.60% in 2008. At the time of recessionthe percentage of export in terms of GDP decreases and further it increase to 23.88 % in 2011.This rapid percentage increase of FDI and export in terms of GDP is exhibited in figure 1.
Figure 1
We presented the trends of FDI and export as a percentage of GDP in the above figure 1.The globalization policy of 1991-92 had increased trend of both FDI and export of India; butthis trend increase with slow rate is due to 1997 Asian financial crisis and it pretends up to theyear 2000. The Asian financial crisis is recovered in 1999 and the increasing trend of both FDIand export again pick up from 2001 to 2007 which is due to reduction in the policy restrictions.Due to the global economic crisis the FDI and export of the country again move towardsdecline trend from 2007 to 2010.
In empirical literature there is ample number of studies that discussed the causality betweenFDI, export and economic growth. However few prominent studies that has been paying attentionto the linkage between FDI, export and economic growth. Amongst earlier studies Hasiao andHsiao (2006) examines the Granger causality between GDP, exports and FDI among eightrapidly East and Southeast Asian economies from 1986 to 2004. They compared with timeseries data causality and panel data causality test and finally they indicate that; the panel datacausality has superior results over the time series causality analysis. Dritsaki et al. (2004)investigate the relationship between Trade, Foreign Direct Investment (FDI) and economicgrowth in Greece over the period 1960-2002. By using cointegration analysis they suggest thatthere is a long-run equilibrium relationship between these variables. Finally, the Grangercausality test infer that there is a bilateral causal relationship between exports and economicgrowth; while there is a unidirectional causal relationship between foreign direct investmentsand economic growth with direction from foreign direct investments to GDP and also aunidirectional causal relationship between foreign direct investments and exports. Naveed andShabbir (2006) study the impact of FDI and trade openness on per capita GDP from 1971 to 2000for 23 developed countries and also they analyzed the Granger causality between them. Theycame to conclude that trade openness is positively affect the per capita GDP growth while FDI is
Causal Link between Foreign Direct Investment, Export and Economic Growth in India 135
appeared as insignificant. Finally, there exists unidirectional causality between trade openness toper capita GDP growth. Nwosa (2011) examines the nature of causality and the relationshipbetween foreign direct investment (FDI), export, and economic growth in Nigeria over the periodof 1981-2010. They conclude that there is no causality between FDI and GDP as well as exportand GDP; but they finds there is a positive relationship between FDI, export and economic growth.Tekin (2011) investigates the causality between real GDP, real export and inward FDI in leastdeveloped countries. He found multiplicity of causality relations among the variables but onlytwo LDCs namely the Central African and Liberia have no causality in any direction.
Regarding the studies in India, Dash and Sharma (2011) examines the relationship betweenFDI, trade and economic growth in India. The results suggest that there is uni-directionalcausality between FDI and economic growth. Gharana (2012) inspect the causal relationshipof GDP, trade and FDI over the period from 1971 to 2008 in India. The result support theexport led and FDI led growth in post liberalization period. Goswami and Saikia (2012) examinethe relationship between FDI and export in North East region of India. They found there is bi-directional causality between FDI and exports. Ray (2012) analyze the effect of FDI on economicgrowth in India by using cointegration as well as Granger Causality approach form the period1990-91 to 2010-11. He concludes that there exists unidirectional causality between economicgrowths to foreign direct investment. Durairaj (2010) examines the causal nexus among Export,Economic Growth and Foreign Direct Investment (FDI) in India over the period 1992 to 2008.The result suggests there is bidirectional relationship between Export and Economic Growthand a unidirectional causal relationship from Export to FDI. Dash and Parida (2012) explorethe linkages between inward FDI, services trade (export and import) and economic output ofIndia both at the aggregate and at the sectoral levels (manufacturing and services). The empiricalfindings shows; there is presence of bi-directional causal relationship between FDI and economicoutput as well as between services exports and economic output in aggregate level and insector wise, they find unidirectional causality from FDI and services exports to bothmanufacturing and services output. Chakraborty and Nunnenkamp (2008) studied the industry-specific FDI and output data in post reform India. They apply a panel cointegration techniqueand concluded that there is long-run and short-run dynamics of the FDI growth relationship. Inthe final step; they conducted aggregate Granger causality and suggested that there is feedbackeffects between FDI and output in both short-run and the long-run.
The present study differs from previous study in three ways. First, this study uses a newdataset covering the period of 1978-79 to 2011-12. Second, contrary to the previous studiesthat employed either standard Granger Causality test or Granger Causality test based on theError Correction Model (ECM), it employs Granger no causality approach developed by Toda-Yamamoto-Dolado-Lutkephol (TYDL). Third, we compare both Granger causality and TYDLcausality test which is very first kind of study in the case of India.
2. THEORETICAL FRAMEWORK
Economists have described Exports has ‘an engine of growth’, but the hypothesis of export-ledgrowth has remained empirically ambiguous particularly for developing countries. Export growthis important because of its effect on internal trade and economic stability of an economy.
136 Debi Prasad Bal and Seba Mohanty
Moreover, the rate of economic growth and the distribution of income and wealth in a countryare closely related to export growth. According to neo classical point of view economic growthcan be achieved through export promotion policies. But India has been described as an ‘importsubstituting country per excellence’ [Rodrik (1996:15)]. So the focus of the export led economicgrowth debate is on whether India’s trade policies should be export promotion or to importsubstitution. As compared to other countries; china is the most dominating country in exportpromotion policies. China’s experience since the 1980s tends to support the argument that tradeopenness is a mechanism for achieving more rapid and efficient growth and better distributionof domestic resources (Findlay and Watson, 1996, p. 4). Krueger (1995), among others, identifiestrade policy as the crucial element of economic policy. Export-led growth has been celebratedas the rational and efficient alternative to import-substitution, industrialization and “inward-oriented” strategies of economic development. The export-led growth strategy hypothesis stressthat exports are the key factor in promoting productivity growth. The main explanations putforward for this relationship are:- (i) an expansion of exports may promote specialization in theproduction of export products and in turn it may boost the skills and productivity level, whichlead to an increase in the level of national output, (ii) an increase in exports may relax theforeign exchange constraint (Chenery and Strout, 1966) and makes it easier to import inputs tomeet domestic demand, which enable the output expansion, (iii) export promotion may alsoeliminate controls that result in an overvaluation of the domestic currency and (iv) exportdevelopment of certain goods based upon a country’s comparative advantage may allow theexploitation of economies of scale, which may lead to increased growth.
FDI on the other hand is traditionally conceived of as an addition to the capital stock of thehost economy (Brems 1970). The common beliefs among policy makers and academician isthat FDI brings productivity gains, technology transfers, introduction of new processes,managerial skills and know-how in the domestic market, employee training, internationalproduction networks, etc. The main arguments in favour of FDI promoting economic growthare: (i) Multinational corporation (MNCS) is the principal vehicles for the international transferof technology and the knowledge know-how. Besides, there is a strong complementary betweenFDI and Human Capital that contributes to economic growth (Borenztein, et al., 1998), (ii)The superiority of MNCS over local firms by means of output per worker leads to enhance theproductivity level, and (iii) Emergence of a network type of organization expands the scope ofinteractions between MNCs and enterprises from host countries which will create internationaleconomic integration. And, (iv) Learning of improved management practices.
Therefore, higher level of economic growth will be attained through efficient use of resourceswhich would creates a market for the output produced, thus in turn attract higher levels of FDI.Though both export and FDI play an important role for countries economic growth but still inIndia their multichannel causal link is not explored mostly.
3. DATA SOURCES AND METHODOLOGY
Annual time series for 1978-79 to 2011-12 data for Per capita GDP (as a proxy for economicgrowth), is collected from the Handbook of Statistics on Indian Economy published by ReserveBank of India. The data of FDI has collected from World Development Indicator published by
Causal Link between Foreign Direct Investment, Export and Economic Growth in India 137
World Bank and the Export has collected from International Financial Statistics published byinternational Monetary Fund. We employed both Granger Causality and Toda and Yamamoto(1995), Dolado and Lutkephol (1996) and Rambaldi and Doran (1996), causality test for ourstudy to show the causal relationship between FDI and Export with economic growth of India.Before estimating TYDL test, it is essential to know the stationary condition of the variables.Hence, the Dicky-Fuller and Augmented Dicky-Fuller test is explained below.
We use the Granger causality test in our study. This is a well-known test for bivariatecausality, which involves estimating a linear reduced-form vector autoregression (VAR). Tocheck the Granger Causality for estimate the following equation:
Yt = �
0 + �
1Y
t-1 + ……………+ �
pY
t-p + �
1 X
t-1 +……………..+ �
q X
t-q + �
t(1)
Xt = �
0 + �
1 X
t-1 + …………...+ �
p X
t-p + �
1 Y
t-1 + ……………+ �
q Y
t-q + µ
t(2)
We can use TYDL technique even the variables are stationary and cointegarted (Toda andYamamoto; 1995: 227). The only condition of this method is that the order of integrationshould not exceed the “true” lag length of the model. TYDL Granger Causality test is a simpleprocedure which is estimation of an “augmented”, or “over fitted” VAR. it uses a modifiedWALD (MWALD) test to test for restrictions on the parameters of the VAR(p) model.
Four steps are involved for constructing this procedure. The first step is to determine themaximal order of integration of the series (denoted as d
max). The determination of true lag length
(k) of the VAR system by using AIC, SC, HQ, FPE criteria is the second step. The third step isestimating the unrestricted VARL (k + d
max) by using Seemingly Unrelated regression technique
(SURE). The last step is to conduct standard WALD tests to the first k VAR coefficient matrix.To draw the inferences on Granger Causality while the coefficients matrix of last d
max
lagged vectors in the model are ignored. As shown by Toda and Yamamoto (1995), Dolado andLutkephol (1996) and rambaldi and Doran (1996) it is enough to add extra and redundant lagsfor satisfy the standard asymptotic properties of the WALD statistics which follows �2
distribution. Therefore the TYDL enables the proposed MWALD statistics to test linear ornonlinear restrictions on this k coefficients matrix using the standard asymptotic theory(Fugarolas et al. 2007).
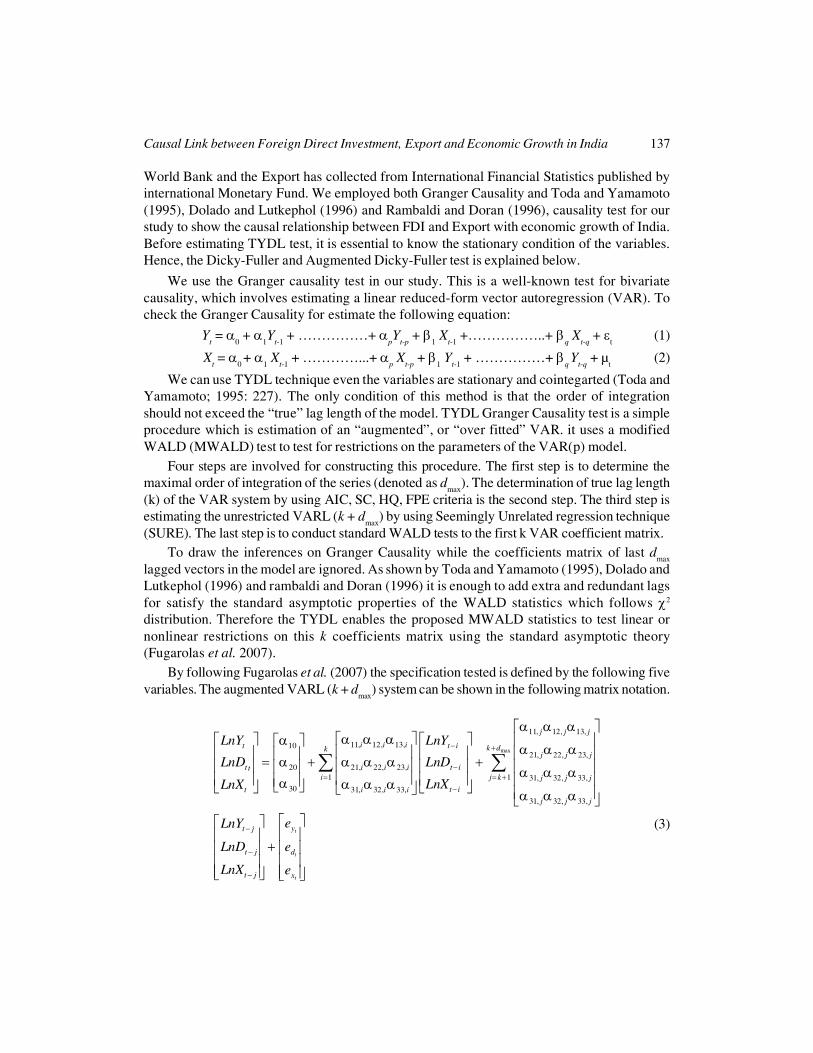
By following Fugarolas et al. (2007) the specification tested is defined by the following fivevariables. The augmented VARL (k + d
max) system can be shown in the following matrix notation.
11, 12, 13,
11, 12, 13,1021, 22, 23,
20 21, 22, 23,1 31, 32, 33,
30 31, 32, 33,31, 32, 33,
j j j
i i it t ikj j j
t i i i t iti j j j
t it i i i
j j j
LnY LnY
LnD LnD
LnXLnX
�
��
�
� � ��� �� � �� � � � � �� � � � �� �� � � � �� �� � � � � � �� �� � � � �� � � � �� �� � � � �� �� � � �� � � �� � � � �� � ��
�max
1
t
t
t
k d
j k
yt j
t j d
t j x
eLnY
LnD e
LnX e
�
� �
�
�
�
�������
� �� �� �� �
� � �� �� �� �
� � � �� � � �
�
(3)
138 Debi Prasad Bal and Seba Mohanty
Where,
Ln Yt = Logarithm of per capita GDP as a proxy for Economic Growth
Ln Dt = Logarithm of Foreign Direct Investment,
Ln Xt = Logarithm of Export,
The Granger Non causality hypotheses can be tested using MWALD on the following setof restrictions:
(i) H0 : �
12,i = �
YD,i = 0 for all i � k � FDI does not Granger cause Economic Growth.
(ii) H0 : �
13,i = �
YX,i = 0 for all i � k � Export does not Granger cause on Economic Growth.
(iii) H0 = �
23,i = �
DX,i = 0 for all i � k � Export does not Granger cause FDI.
4. ESTIMATION AND RESULTS
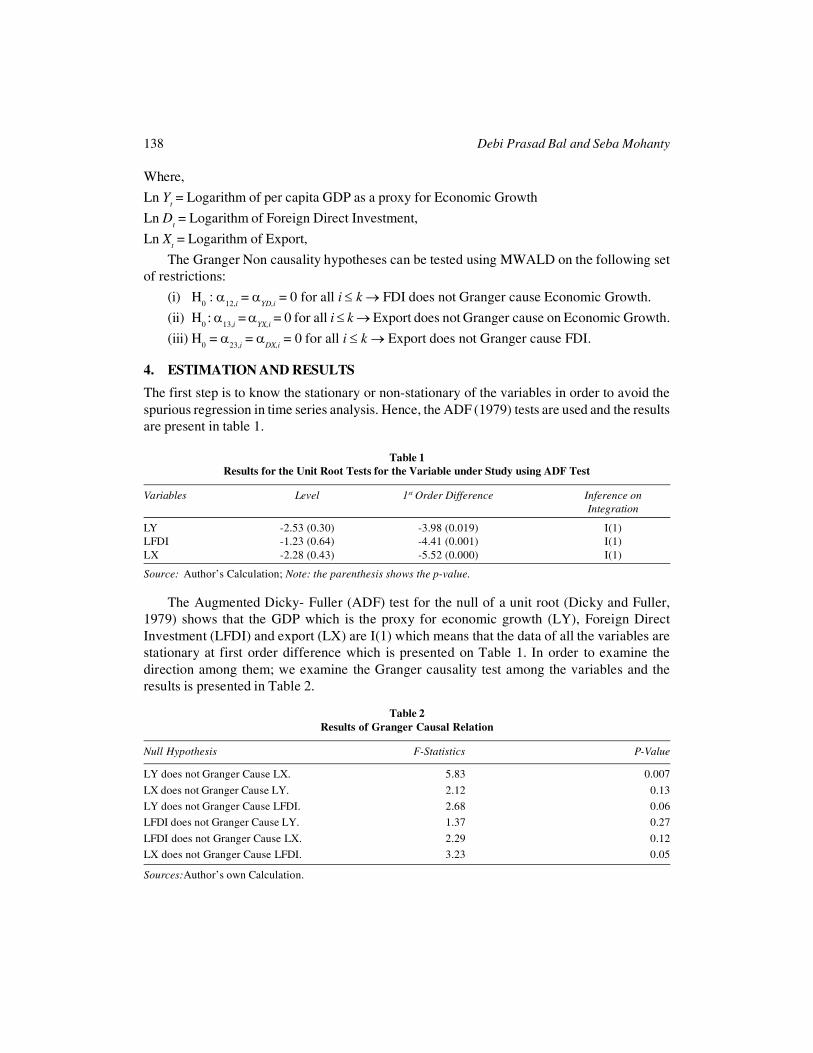
The first step is to know the stationary or non-stationary of the variables in order to avoid thespurious regression in time series analysis. Hence, the ADF (1979) tests are used and the resultsare present in table 1.
Table 1Results for the Unit Root Tests for the Variable under Study using ADF Test
Variables Level 1st Order Difference Inference onIntegration
LY -2.53 (0.30) -3.98 (0.019) I(1)LFDI -1.23 (0.64) -4.41 (0.001) I(1)LX -2.28 (0.43) -5.52 (0.000) I(1)
Source: Author’s Calculation; Note: the parenthesis shows the p-value.
The Augmented Dicky- Fuller (ADF) test for the null of a unit root (Dicky and Fuller,1979) shows that the GDP which is the proxy for economic growth (LY), Foreign DirectInvestment (LFDI) and export (LX) are I(1) which means that the data of all the variables arestationary at first order difference which is presented on Table 1. In order to examine thedirection among them; we examine the Granger causality test among the variables and theresults is presented in Table 2.
Table 2Results of Granger Causal Relation
Null Hypothesis F-Statistics P-Value
LY does not Granger Cause LX. 5.83 0.007
LX does not Granger Cause LY. 2.12 0.13LY does not Granger Cause LFDI. 2.68 0.06LFDI does not Granger Cause LY. 1.37 0.27
LFDI does not Granger Cause LX. 2.29 0.12LX does not Granger Cause LFDI. 3.23 0.05
Sources:Author’s own Calculation.
Causal Link between Foreign Direct Investment, Export and Economic Growth in India 139
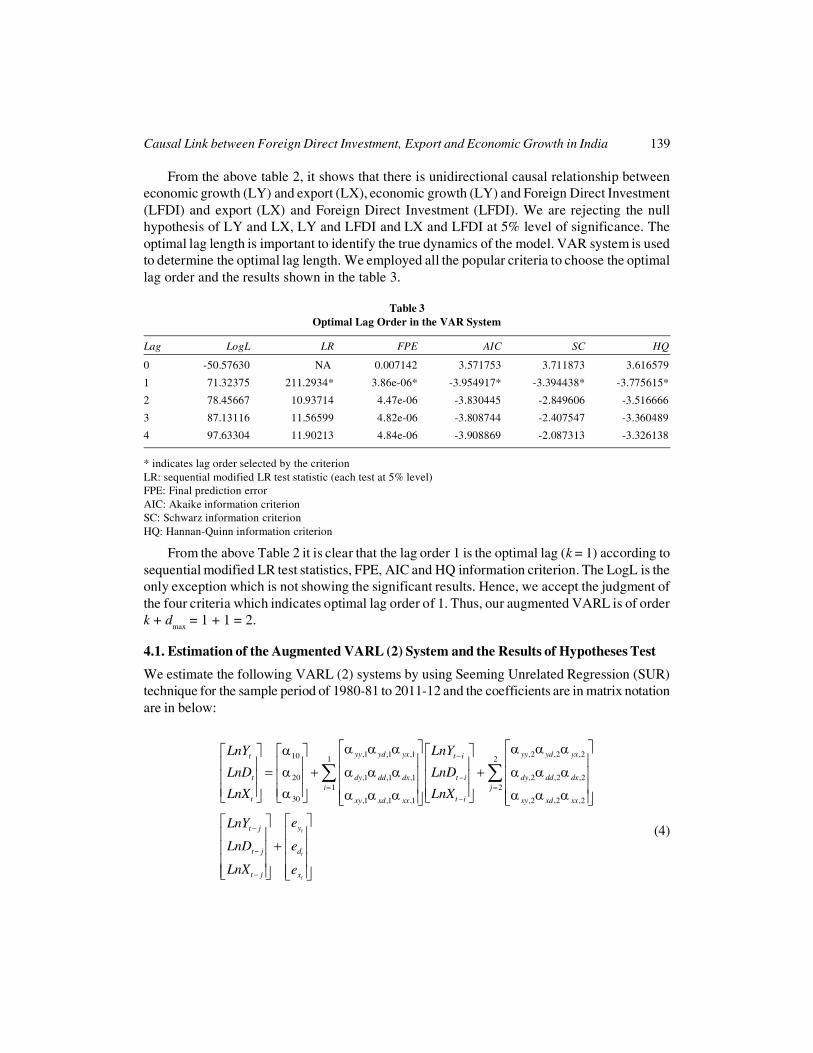
From the above table 2, it shows that there is unidirectional causal relationship betweeneconomic growth (LY) and export (LX), economic growth (LY) and Foreign Direct Investment(LFDI) and export (LX) and Foreign Direct Investment (LFDI). We are rejecting the nullhypothesis of LY and LX, LY and LFDI and LX and LFDI at 5% level of significance. Theoptimal lag length is important to identify the true dynamics of the model. VAR system is usedto determine the optimal lag length. We employed all the popular criteria to choose the optimallag order and the results shown in the table 3.
Table 3Optimal Lag Order in the VAR System
Lag LogL LR FPE AIC SC HQ
0 -50.57630 NA 0.007142 3.571753 3.711873 3.616579
1 71.32375 211.2934* 3.86e-06* -3.954917* -3.394438* -3.775615*
2 78.45667 10.93714 4.47e-06 -3.830445 -2.849606 -3.516666
3 87.13116 11.56599 4.82e-06 -3.808744 -2.407547 -3.360489
4 97.63304 11.90213 4.84e-06 -3.908869 -2.087313 -3.326138
* indicates lag order selected by the criterionLR: sequential modified LR test statistic (each test at 5% level)FPE: Final prediction errorAIC: Akaike information criterionSC: Schwarz information criterionHQ: Hannan-Quinn information criterion
From the above Table 2 it is clear that the lag order 1 is the optimal lag (k = 1) according tosequential modified LR test statistics, FPE, AIC and HQ information criterion. The LogL is theonly exception which is not showing the significant results. Hence, we accept the judgment ofthe four criteria which indicates optimal lag order of 1. Thus, our augmented VARL is of orderk + d
max = 1 + 1 = 2.
4.1. Estimation of the Augmented VARL (2) System and the Results of Hypotheses Test
We estimate the following VARL (2) systems by using Seeming Unrelated Regression (SUR)technique for the sample period of 1980-81 to 2011-12 and the coefficients are in matrix notationare in below:
,1 ,1 ,1 ,2 ,2 ,210 1 2
20 ,1 ,1 ,1 ,2 ,2 ,21 2
30 ,1 ,1 ,1 ,2 ,2 ,2
yy yd yx yy yd yxt t i
t dy dd dx t i dy dd dxi j
t t ixy xd xx xy xd xx
t
LnY LnY
LnD LnD
LnX LnX
LnY
�
�� �
�
� � � �� � � � � ��� � � � � �� � � �� � � � � �� � � � � � � � � �� � � �� � � � � �� � � �� � � � � �� � � � � � �� � � � � �� � � �� � � �
� �
t
t
t
yj
t j d
t j x
e
LnD e
LnX e
�
�
�
� �� �� �� �
� � �� �� �� �
� � � �� � � �
(4)
140 Debi Prasad Bal and Seba Mohanty
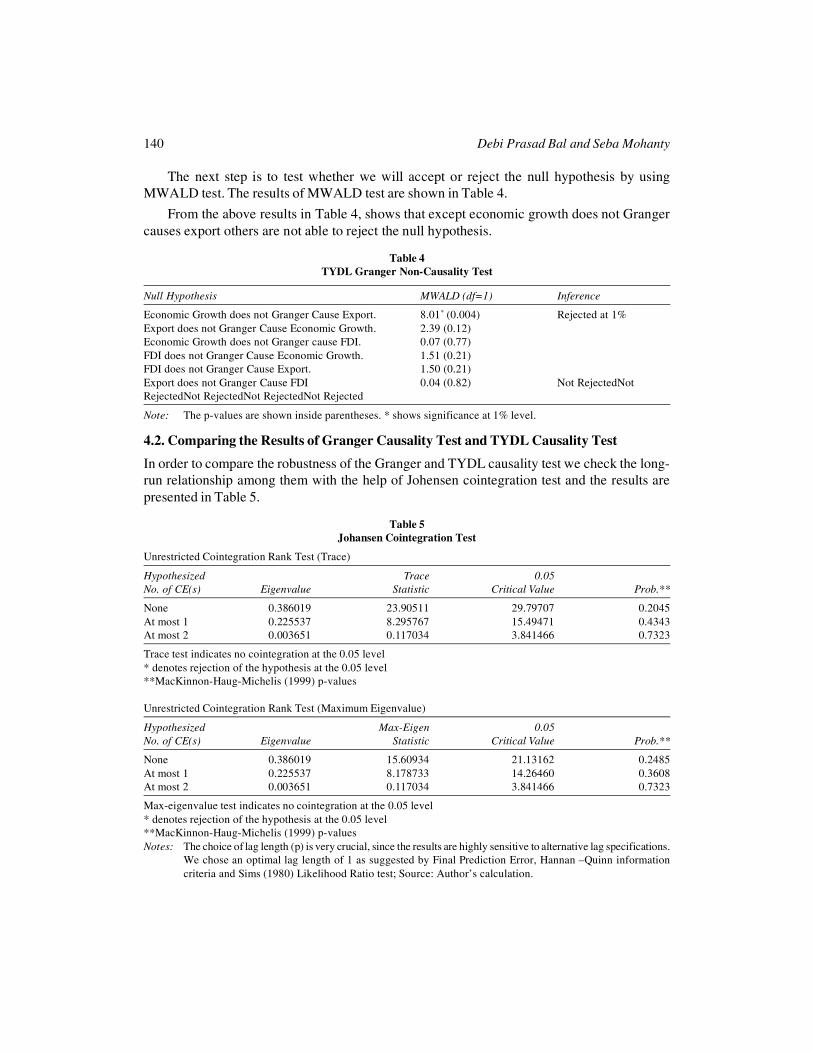
The next step is to test whether we will accept or reject the null hypothesis by usingMWALD test. The results of MWALD test are shown in Table 4.
From the above results in Table 4, shows that except economic growth does not Grangercauses export others are not able to reject the null hypothesis.
Table 4TYDL Granger Non-Causality Test
Null Hypothesis MWALD (df=1) Inference
Economic Growth does not Granger Cause Export. 8.01* (0.004) Rejected at 1%Export does not Granger Cause Economic Growth. 2.39 (0.12)Economic Growth does not Granger cause FDI. 0.07 (0.77)FDI does not Granger Cause Economic Growth. 1.51 (0.21)FDI does not Granger Cause Export. 1.50 (0.21)Export does not Granger Cause FDI 0.04 (0.82) Not RejectedNotRejectedNot RejectedNot RejectedNot Rejected
Note: The p-values are shown inside parentheses. * shows significance at 1% level.
4.2. Comparing the Results of Granger Causality Test and TYDL Causality Test
In order to compare the robustness of the Granger and TYDL causality test we check the long-run relationship among them with the help of Johensen cointegration test and the results arepresented in Table 5.
Table 5Johansen Cointegration Test
Unrestricted Cointegration Rank Test (Trace)
Hypothesized Trace 0.05No. of CE(s) Eigenvalue Statistic Critical Value Prob.**
None 0.386019 23.90511 29.79707 0.2045At most 1 0.225537 8.295767 15.49471 0.4343At most 2 0.003651 0.117034 3.841466 0.7323
Trace test indicates no cointegration at the 0.05 level* denotes rejection of the hypothesis at the 0.05 level**MacKinnon-Haug-Michelis (1999) p-values
Unrestricted Cointegration Rank Test (Maximum Eigenvalue)
Hypothesized Max-Eigen 0.05No. of CE(s) Eigenvalue Statistic Critical Value Prob.**
None 0.386019 15.60934 21.13162 0.2485At most 1 0.225537 8.178733 14.26460 0.3608At most 2 0.003651 0.117034 3.841466 0.7323
Max-eigenvalue test indicates no cointegration at the 0.05 level* denotes rejection of the hypothesis at the 0.05 level**MacKinnon-Haug-Michelis (1999) p-valuesNotes: The choice of lag length (p) is very crucial, since the results are highly sensitive to alternative lag specifications.
We chose an optimal lag length of 1 as suggested by Final Prediction Error, Hannan –Quinn informationcriteria and Sims (1980) Likelihood Ratio test; Source: Author’s calculation.
Causal Link between Foreign Direct Investment, Export and Economic Growth in India 141
Table 5 presents the results of cointegration. The results reveal that the trace statistics andmaximum eigenvalue confirm the absence of cointegrating vector between Economic Growth,FDI and Export. Since there is no indication of co-integrating vector in Johansen approach,which clearly shows there is no long-run relationship among economic growth, FDI and export.
Although there is no long run Granger causality because of no cointegrating vector, butthere may exist short run causality in a reduced VAR framework. Forecast error variancedecomposition is important for examining the shocks in variable movements. We are interestedin discussing the impact of shocks such as FDI and Exports on Economic Growth.
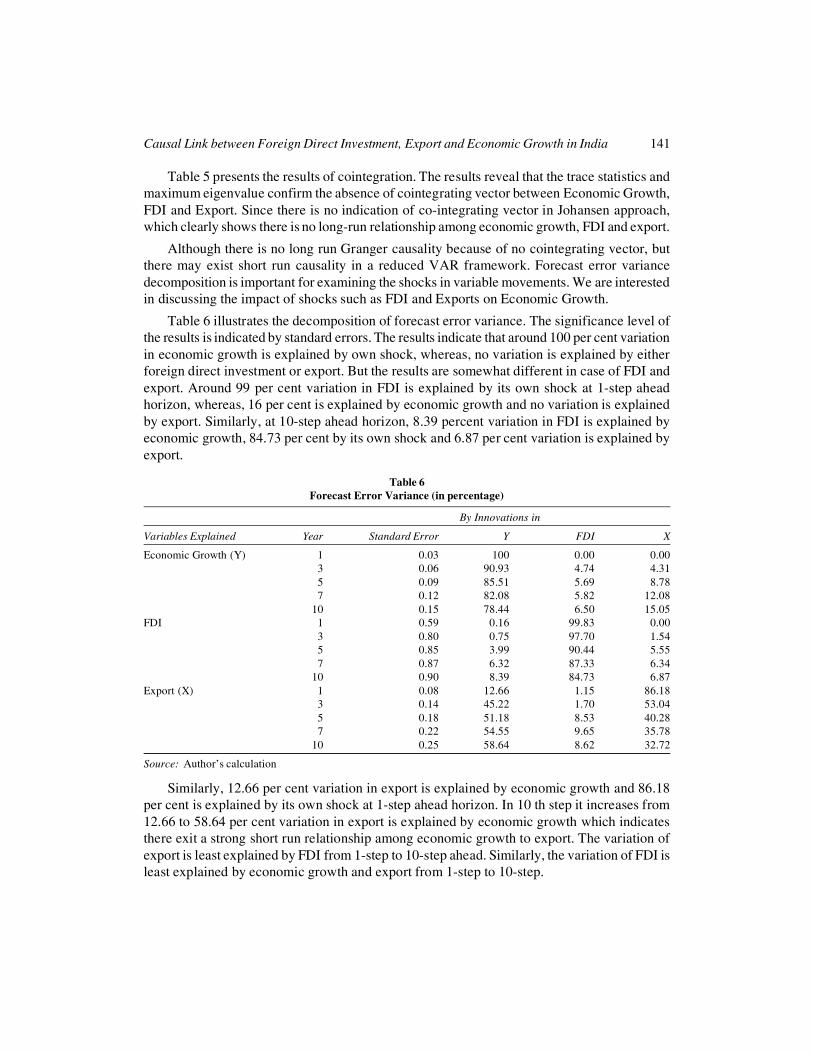
Table 6 illustrates the decomposition of forecast error variance. The significance level ofthe results is indicated by standard errors. The results indicate that around 100 per cent variationin economic growth is explained by own shock, whereas, no variation is explained by eitherforeign direct investment or export. But the results are somewhat different in case of FDI andexport. Around 99 per cent variation in FDI is explained by its own shock at 1-step aheadhorizon, whereas, 16 per cent is explained by economic growth and no variation is explainedby export. Similarly, at 10-step ahead horizon, 8.39 percent variation in FDI is explained byeconomic growth, 84.73 per cent by its own shock and 6.87 per cent variation is explained byexport.
Table 6Forecast Error Variance (in percentage)
By Innovations in
Variables Explained Year Standard Error Y FDI X
Economic Growth (Y) 1 0.03 100 0.00 0.003 0.06 90.93 4.74 4.315 0.09 85.51 5.69 8.787 0.12 82.08 5.82 12.08
10 0.15 78.44 6.50 15.05FDI 1 0.59 0.16 99.83 0.00
3 0.80 0.75 97.70 1.545 0.85 3.99 90.44 5.557 0.87 6.32 87.33 6.34
10 0.90 8.39 84.73 6.87Export (X) 1 0.08 12.66 1.15 86.18
3 0.14 45.22 1.70 53.045 0.18 51.18 8.53 40.287 0.22 54.55 9.65 35.78
10 0.25 58.64 8.62 32.72
Source: Author’s calculation
Similarly, 12.66 per cent variation in export is explained by economic growth and 86.18per cent is explained by its own shock at 1-step ahead horizon. In 10 th step it increases from12.66 to 58.64 per cent variation in export is explained by economic growth which indicatesthere exit a strong short run relationship among economic growth to export. The variation ofexport is least explained by FDI from 1-step to 10-step ahead. Similarly, the variation of FDI isleast explained by economic growth and export from 1-step to 10-step.
142 Debi Prasad Bal and Seba Mohanty
Thus, from the above error variance table 6 it shows there is strong relationship betweeneconomic growths to export and there is negligible relationship among other variables. Thepresent study also finds the same kind of results from TYDL Causality test, i.e., there isunidirectional relation exit between economic growths to export and there is no relation amongother variables. But at the same time we can’t able to reject the null hypothesis of theunidirectional relationship between economic growth to FDI and export to FDI. Therefore ourresult strongly supports TYDL Causality test and this method is better method over GrangerCausality test.
5. CONCLUSION
This paper examines the causal relation between FDI, export and economic growth in Indiaover the period of 1978-79 to 2010-11. We show the relationship among them by using bothGranger causality and TYDL causality test and then we compare both the causality test byusing the cointegration and variance decomposition technique. The Johensen cointegrationtest suggest that there is no long run relation among them but the variance decompositionresults clearly reveal that there exist unidirectional causality between economic growth andexport in India. Although the Granger causality test shows there is causal relation betweeneconomic growth to export but also it shows there exist unidirectional causality betweeneconomic growth to FDI and export to FDI too. Further, we examine with the same dataperiod and implemented the TYDL Granger non causality test and concluded that there onlyexist unidirectional causal relation among economic growth and export in India. In the finalstep; we compare both Granger causality test and TYDL no Granger causality test with theresults from variance decomposition method. Hence, from the results of variance decompositionmethod we conclude that, only export is more explained by economic growth and others areleast variation among them. Hence, our results from TYDL Granger no causality testcorroborate with the results from variance decomposition methods. Therefore, our resultsconcluded that TYDL method is better technique to shows the casual relationship amongthem.
The aforementioned findings have important implications for the formulation of long termgrowth path in India. As India is a developing economy so India needs more to invest in bothprimary, secondary as well as service sectors. As these sectors grow which will be path to growin export of the country. Therefore from policy point of view our study supports that Indiashould give more priority to developed overall economic growth which will simultaneouslyimprove the export of the country. Although the TYDL causality test does not support there isno relationship between FDI as well as export and economic growth but variance decompositionmethod explained there is least variation among them.
References
Ahmad, N., Hayat, M.F., Luman, M. and Ullah, S. (2012), The Causal Links between Foreign Direct InvestmentAnd Economic Growth in Pakistan, European Journal of Business and Economics, Vol. 6.
Borensztein, E., De Gregorio, J. and Lee, J. W. (1998), How Does Foreign Direct Investment Affect EconomicGrowth? Journal of International Economics, Vol. 45 (1), pp. 115-135.
Causal Link between Foreign Direct Investment, Export and Economic Growth in India 143
Brems, H. (1970), Growth Model of International Direct Investment, American Economic Review, Vol. 60 (3),pp. 320-331.
Chakraborty, C. and Nunnenkamp, P. (2008), Economic Reforms, FDI and Economic Growth in India: A SectorLevel Analysis, World Development, Vol. 36 (7), pp. 1192–1212.
Chenery, H. and Strout, A., (1966), Foreign Assistance and Economic Development, American Economic Review,Vol. 56, pp. 679-733.
Dash, R. K. and Parida, P. C. (2013), FDI, Services trade and Economic Growth in India: Empirical Evidenceon Causal Links, Empir Econ, Vol. 43, pp. 217-238.
Dash, R. K. and Sharma, C. (2011), FDI, Trade, and Growth Dynamics: New Evidence from the post-ReformIndia, The International Trade Journal, pp. 233-266.
Dicky, D. A. and Fuller, W. A. (1979), Distribution of the Estimation for Autoregressive Time Series with a UnitRoot, Journal of the America Statistical Association, Vol. 74, pp. 427-431.
Dolado, J. J. and Lutekepohl, H. (1966), Making Wald Test Work for Cointegrated VAR Systems, EconometricsReviews, Vol. 15, pp. 369-86.
Dritsaki, M. C. Dritsaki and Adamopoulos, A. (2004), A Causal Relationship between Trade, Foreign DirectInvestment and Economic Growth in Greece, American Journal of Applied Science, Vol. 1 (3).
Durairaj, K. (2011), Foreign Direct Investment, Export, and Economic Growth in India: An Application ofARDL model, Asian-African Journal of Economics and Econometrics, Vol. 10 (2). Pp. 245-259.
Findlay, C. and Watson, A. (1996), Economic Growth and Trade Dependency in China, DP‘“ 96/5, ChineseEconomics Research Centre, University of Adelaide.
Fugarolas, G., Manalich, I. and Matesanz, D. (2007), Are Exports causing Growth? Evidence on InternationalTrade Expansion in Cuba, 1960-2004, MPRA paper No. 6323.
Gharana, K. K. G. (2012), Econometrics Investigation of Relationships Among Export, FDI and Growth inIndia: An Application of Toda-Yamamoto – Dolado – Lutkephol Granger Causality Test, The Journal ofDeveloping Area, Vol. 46 (2).
Goswami, C. and Saikia, K. K. (2012), FDI and its Relation with Exports in India, Status and Prospect in NorthEast Region, Procedia – Social and Behavioral Science, Vol. 37, pp. 123-132.
Hsiao, F. S. T. and Hsiao, M. W. (2006), FDI, Exports and GDP in East and Southeast Asia – Panel Data versusTime-series Causality Analysis, Journal of Asian Economics, Vol. 17, pp. 1082-1106.
Krueger, A. O. (1995), Trade Policies and Developing Nations, Washington: Brookings Institution.
Naveed, A. and Shabbir, G. (2006), Trade Openness, FDI and Economic Growth: A Panel Study, PakistanEconomic and Social Review, Vol. 44 (1), pp. 137-154.
Nwosa, P. I. (2011), Causal Relationships between Financial Development, Foreign Direct Investment and EconomicGrowth the case of Nigeria, International Journal of Business Administration, Vol. 2 (4), pp. 93-102.
Rambaldi, A. N. and Doran, H. E. (1996), Testing for Granger Non-Causality in Cointegrated Systems Madeeasy, Working Paper in Econometrics and Applied Statistics No. 88, University of New England.
Ray, S. (2012), Impact of Foreign Direct Investment on Economic Growth in India: A co integration Analysis,Advances in Information Technology and Management, Vol. 2 (1).
Rodrik, D. (1996), Understanding Economic Policy Reform, Journal of Economic Literature, Vol. XXXIV, pp.9-41.
Tekin, R. B. (2012), Economic Growth, Exports and Foreign Direct Investment in Least Developed Countries:A Panel Granger Causality Analysis, Economic Modeling, Vol. 29, pp. 868-878.
Toda, H. Y. and Yamamoto, T. (1995), Statistical Inference in Vector Autoregressions with Possibly IntegratedProcesses, Journal of Econometrics, Vol. 66, pp. 225-250.


�����������������������������������������������������������������������������������������������������������������������������������������������������������������������������������������������������������������