causality assessment in case series
TRANSCRIPT

Causality assessmentin case series
Richard HillUppsala, May, 2011
1

Outline
• Causality• Single case assessment• Case series assessment:
– strength– specificity– timing– dose– diversity
2

Case series
• For this presentation, defined as a group of patients with similar exposure (drug) and similar outcome (suspected ADR)
• How is case series review different from single case review?
3

Causality
• Deterministic causality– one cause, one effect
• Probabilistic causality– multiple causes (risk factors)– each increases the likelihood of the outcome
• Most ADRs have multiple possible causes• Causality assessment is difficult!• Example: fall while taking antipsychotic
4

Drugs and falls
• The risk of having a fall or recurrent falls increases with the number of risk factors below:– previous fall – polypharmacy (4 or more drugs)– alcohol >1 unit/day– poor mobility/gait– psychotropic drug use– orthostatic hypotension– balance disorders– visual impairment– hearing impairment– cognitive impairment
• (http://www.bhps.org.uk/falls/documents/Medicn&RiskOfFalls.pdf)
5

Aims of causality assessment
• Aim to answer the following questions:– did the drug cause this ADR?– does the drug increase the risk of this ADR?
• And therefore:– how to decrease the occurence of this ADR?
6
Single case causality
• Criteria genrally used:– known event (possibly for related drug)– plausible timing– de/re-challenge– exclusion of other causes– typical ADR
7

Single case causality
• Problems with these criteria:– known event: not good for signal detection– plausible timing: after drug was taken?– de/re-challenge: may not have occured– exclusion of other causes: may be multifactorial– ’typical’ ADR: only a small list of these
8

Case series causality
• Additional criteria available:– strength of association– specificity of event– temporal relationship– dose response– consistency of reporting
• Direct application of Bradford Hill criteria• Perrio et al. DrugSafety 2007;30(4):333-246
9

Strength of association
• Strength = quantitative measure of the association between a drug an an ADR
• Useful in analysing large ADR databases• Disproportionality analysis:
– how does the reporting of this ADR for this drug compare to the reporting of this ADR in general (or this ADR for similar drugs)?
10

Disproportionality
• VigiBase (WHO database managed by UMC)– 6,194,555 reports [15 Feb 2011]– 206,208 reports of nausea– 3.3% of VigiBase reports mention nausea
11

Disproportionality
total nausea
fluvoxamine 7861 1235 (16%)
VigiBase 6,194,555 206,208 (3.3%)
12
– increased reporting of nausea with fluvoxamine• is it due to the drug?• is it due to the disease under treatment?• other explanation?

Disproportionality measures
• A number of different measures of disproportionality:– PRR (European Medicines Agency)– ROR (Netherlands)– EBGM (US FDA)– IC (UMC)
• All work on the same data• Give broadly similar results
13

Disproportionality measures
• Disproportionality usually compares one drug to whole database (or all other drugs)
• However, can also compare between individual drugs (eg, within a class), helping to control for confounders
• Note in the following example:– absolute report numbers don’t matter– however, there is a catch!
14
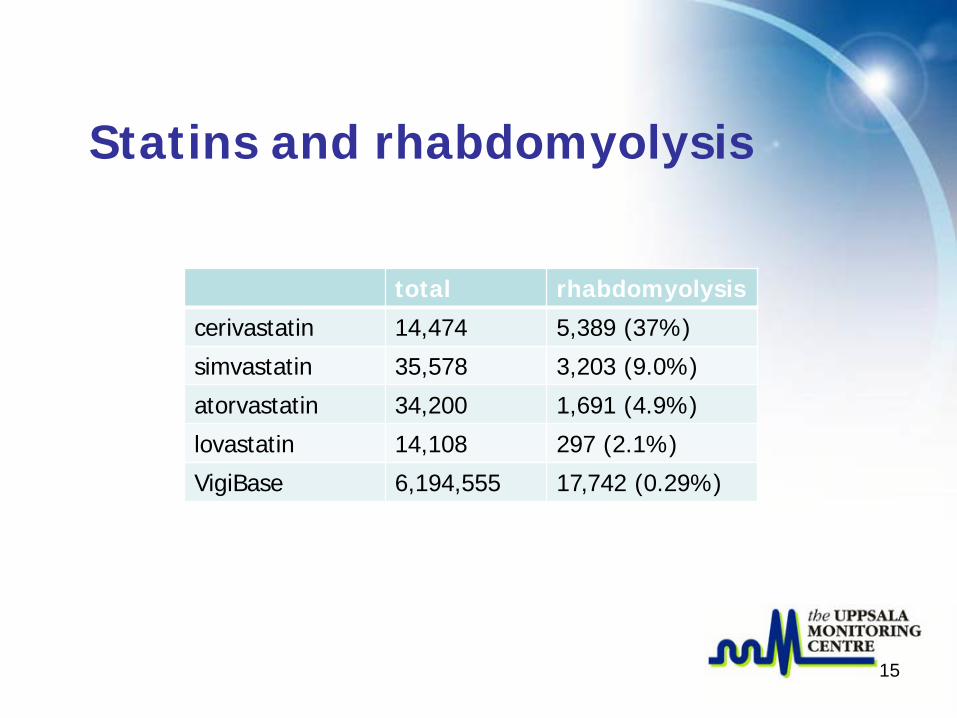
Statins and rhabdomyolysis
total rhabdomyolysis
cerivastatin 14,474 5,389 (37%)
simvastatin 35,578 3,203 (9.0%)
atorvastatin 34,200 1,691 (4.9%)
lovastatin 14,108 297 (2.1%)
VigiBase 6,194,555 17,742 (0.29%)
15

Ranolazine – ARF
• Ranolazine (treatment of chronic angina) – acute renal failure
• 12 reports in VigiBase, found through routine statistical screening
16

Ranolazine – ARFrenal failure acute all reactions
ranolazine 12 567
all drugs 35,971 6,194,555
17
• ranolazine:– 12/567 (2.1%) reports mention acute renal failure
• whole database:– 35,971/6,194,555 (0.58%) reports mention ARF
• ARF reported 3.6 times more often for ranolazine than for database as a whole

Specificity of event
• Specificity of event, ranolazine + ARF:– rhabdomyolysis (3 reports)– pneumonia / sepsis (2 reports)– multiple drug overdose– obstructive uropathy– myocardial infarction– urinary tract infection– no cause specified (3 reports)
18

Specifity of event
• Many ADRs have multiple etiologies– consider: organ failure, confusion, oedema
• Generally, drugs cause adverse reactions through specific mechanisms
• Totality of information available from a case series may be a better guide to mechanism than a single report
19

Temporal relationship
• Causality assessment generally considers plausibility of time to onset of ADR
• What is ’plausible’?• Some are well-described:
– anaphylaxis (minutes to hours)– alopecia (several weeks)– solid organ tumours (years)
20

Time to onset
• Data from VigiBase – single suspect drug, all dates available:– agranulocytosis 5484 reports– angioedema 20,930– hepatitis 8961– serum sickness 1908– SJS 6531– TEN 2067
• Khodabakhshi, G. MSc thesis.
21

Time to onset
22

TTO - agranulocytosis
23

TTO - angioedema
24

Dose response
• Difficult to examine dose relationship on a single report:– usually only drug/no drug– presence of other risk factors
• Risk factors for rhabdomyolysis with statins• Ronaldson KJ et al. DrugSafety 2006;29(11):1061-1067
– dosage in reports compared to dosage on prescriptions
25

26

Consistency
• ADRs often have multiple risk factors• Rhabdomyolysis with statins:
– age– dose– renal/hepatic/thyroid dysfunction– hyperkalemia– interacting drugs
• 58% simvastatin reports had 3+ risk factors!
• Case series is useful in establishing if reaction also occurs in the absence of other risk factors
27

Consistency
• Clustered reporting presents a problem for signal detection:– form of selection bias– may be one clinic, one study, or local publicity
• Signal detection at UMC routinely adds additional selection criteria:– must have reports from 2 or more countries– ie, geographical consistency
28

Conclusion
• Assessing causality on individual cases is complicated by missing information or knowledge; confounding; selection biases; ...
• A case series may supply additional information, which may require a different approach to causality assessment
29

Thank you!